Embed Size (px)
Citation preview
OCTOBER 2021
Opportunities and pathways to decarbonize China’s transportation sector during the fourteenth Five-Year Plan period and beyond
LINGZHI JIN, ZHENYING SHAO, XIAOLI MAO, JOSHUA MILLER, HUI HE AND AARON ISENSTADT
ACKNOWLEDGMENTS
The authors thank all internal and external reviewers, including Zhihui Huang, Hang Yin, Junfang Wang, Dong Ma, and Mingliang Fu of the Vehicle Emission Control Center, Ministry of Ecology and Environment of the People’s Republic of China; Jacob Teter and Jeremy Moorhouse of the International Energy Agency; Michael Walsh, Sebastian Ibold, Yun Xia, and Yingchen Xu of the Deutsche Gesellschaft fur Internationale Zusammenarbeit (GIZ). Their support does not imply endorsement of the content of this report. We are also grateful to Ray Minjares and Felipe Rodríguez of the ICCT for their guidance and constructive comments. All errors are the authors’ own.
This project is part of the NDC Transport Initiative for Asia (NDC-TIA). NDC-TIA is part of the International Climate Initiative (IKI). The Federal Ministry for the Environment, Nature Conservation and Nuclear Safety (BMU) supports the initiative on the basis of a decision adopted by the German Bundestag.
For more visit: https://www.ndctransportinitiativeforasia.org/.
International Council on Clean Transportation 1500 K Street NW, Suite 650 Washington, DC 20005
[email protected] | www.theicct.org | @TheICCT
© 2021 International Council on Clean Transportation
i ICCT REPORT | OPPORTUNITIES TO DECARBONIZE CHINA’S TRANSPORTATION SECTOR
TABLE OF CONTENTS
Abbreviations ........................................................................................................................... iv
Executive summary .................................................................................................................. v
Introduction ................................................................................................................................1
Scenarios and decarbonization pathways ........................................................................... 3
Methods ...................................................................................................................................... 8
Road and rail ..............................................................................................................................................8
Marine............................................................................................................................................................9
Non-road mobile equipment ............................................................................................................. 10
Refrigerants ................................................................................................................................................11
Discussion of results ...............................................................................................................12
Future transportation activity growth ...........................................................................................12
Emission reduction potential from the Low Ambition scenario ..........................................12
Emission reduction potential from the High Ambition scenario .........................................13
China’s contribution to mitigating global climate change .................................................... 15
Breakdown of transport sector mitigation potential within the 14th Five-Year Plan .. 16
Co-benefits for air quality .................................................................................................................. 18
Findings and recommendations ........................................................................................ 20
References ...............................................................................................................................22
Appendix A: Detailed policy assumptions for each strategy ........................................25
Appendix B: Supplemental figures .....................................................................................38
ii ICCT REPORT | OPPORTUNITIES TO DECARBONIZE CHINA’S TRANSPORTATION SECTOR
LIST OF FIGURESFigure ES 1. Well-to-wheel climate pollutant (CO2e) emissions (GWP20) under Adopted Policies, Low Ambition, and High Ambition scenarios, and recommended reduction targets, 2020–2050 ..................................................................................................................v
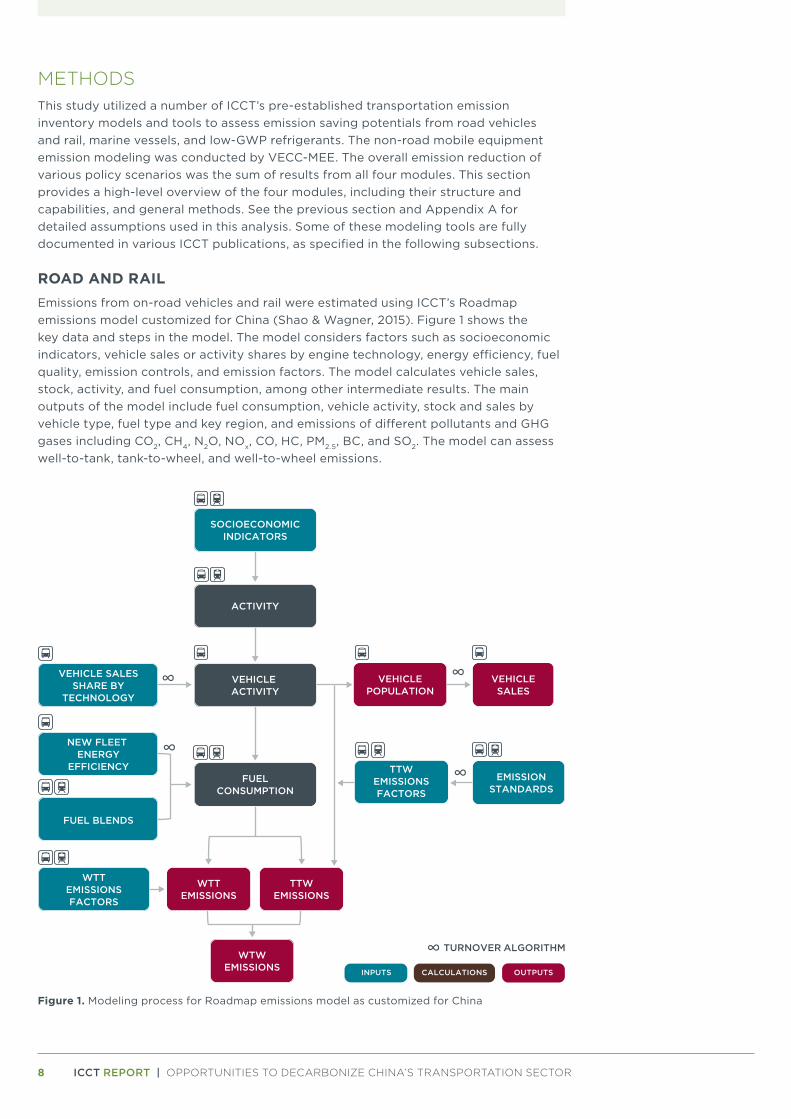
Figure 1. Modeling process for Roadmap emissions model as customized for China ......8
Figure 2. Modeling process, marine emissions ..................................................................................9
Figure 3. Modeling process, non-road emissions ............................................................................ 11
Figure 4. China transport sector growth compared to 2020 level ......................................... 12
Figure 5. Well-to-wheel climate pollutant (CO2e) emissions (GWP20) under the Adopted Policies scenario and mitigation potential of policies under the Low Ambition scenario, 2020-2050. ............................................................................................................. 13
Figure 6. Well-to-wheel CO2e emissions reductions (GWP20), under the Adopted Policies scenario and mitigation potential of policies under the High Ambition scenario, 2020-2050 .............................................................................................................. 14
Figure 7. Well-to-wheel CO2 emissions under the Adopted Policies scenario and mitigation potential of policies under the High Ambition scenario, 2020-2050 ............... 15
Figure 8. Mitigation potential for transport sectors by strategy area in the High Ambition scenario compared to the Adopted Policies scenario in 2025 (GWP20). .........17
Figure 9. BC emissions (thousand tonnes) for on-road (vehicles and rail), marine and non-road sectors, 2020-2050 ......................................................................................... 18
Figure 10. WTW climate pollutant (CO2e) emissions (GWP20) under Adopted Policies, Low Ambition, and High Ambition scenarios and recommended reduction targets, 2020-2050 ................................................................................................................20
iii ICCT REPORT | OPPORTUNITIES TO DECARBONIZE CHINA’S TRANSPORTATION SECTOR
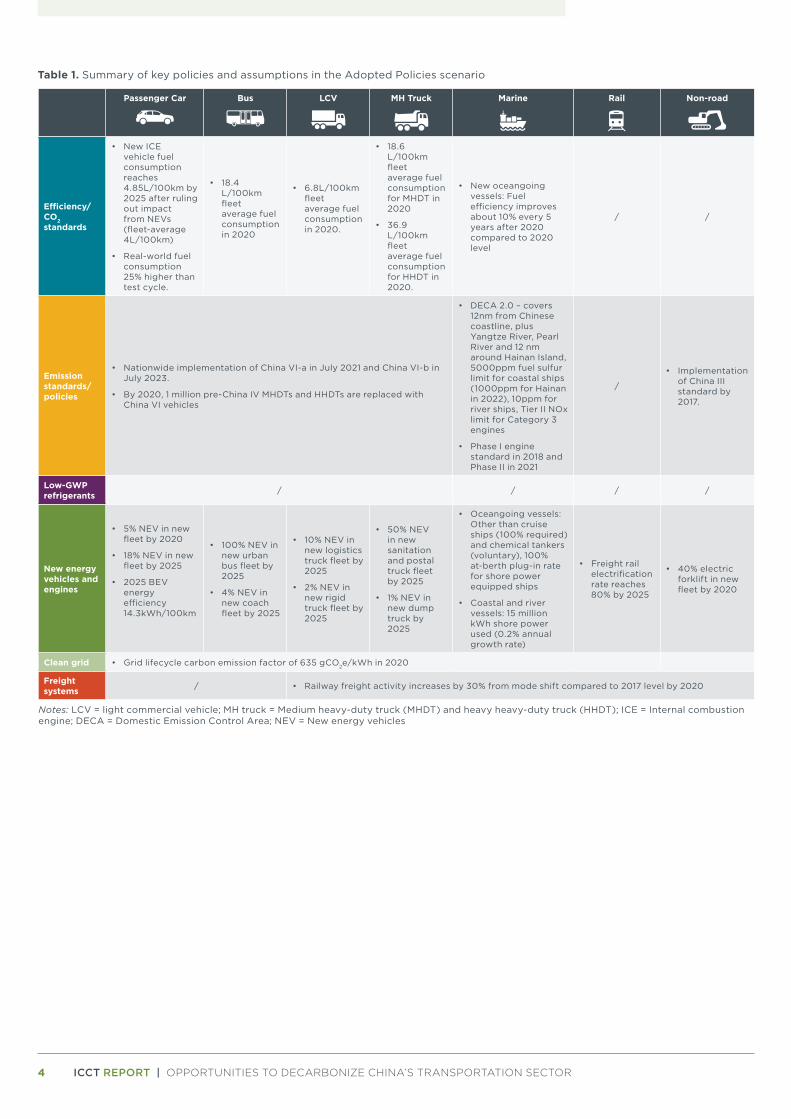
LIST OF TABLESTable 1. Summary of key policies and assumptions in the Adopted Policies scenario .... 4
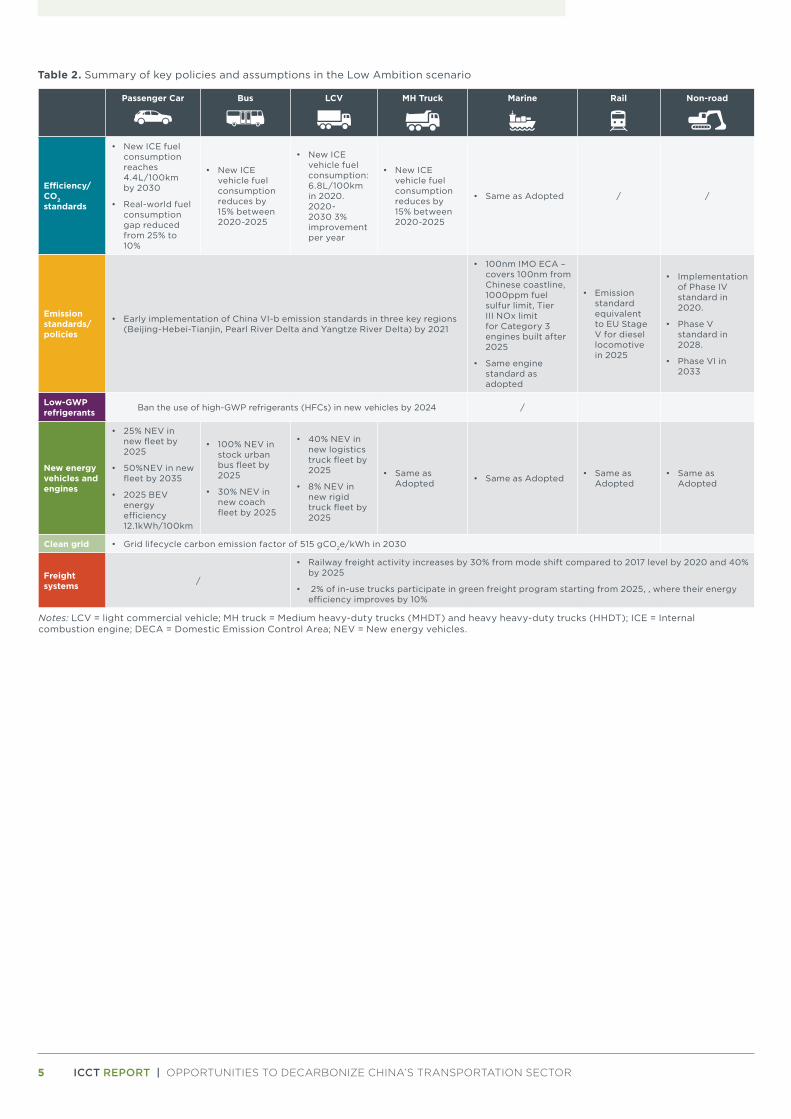
Table 2. Summary of key policies and assumptions in the Low Ambition scenario .......... 5
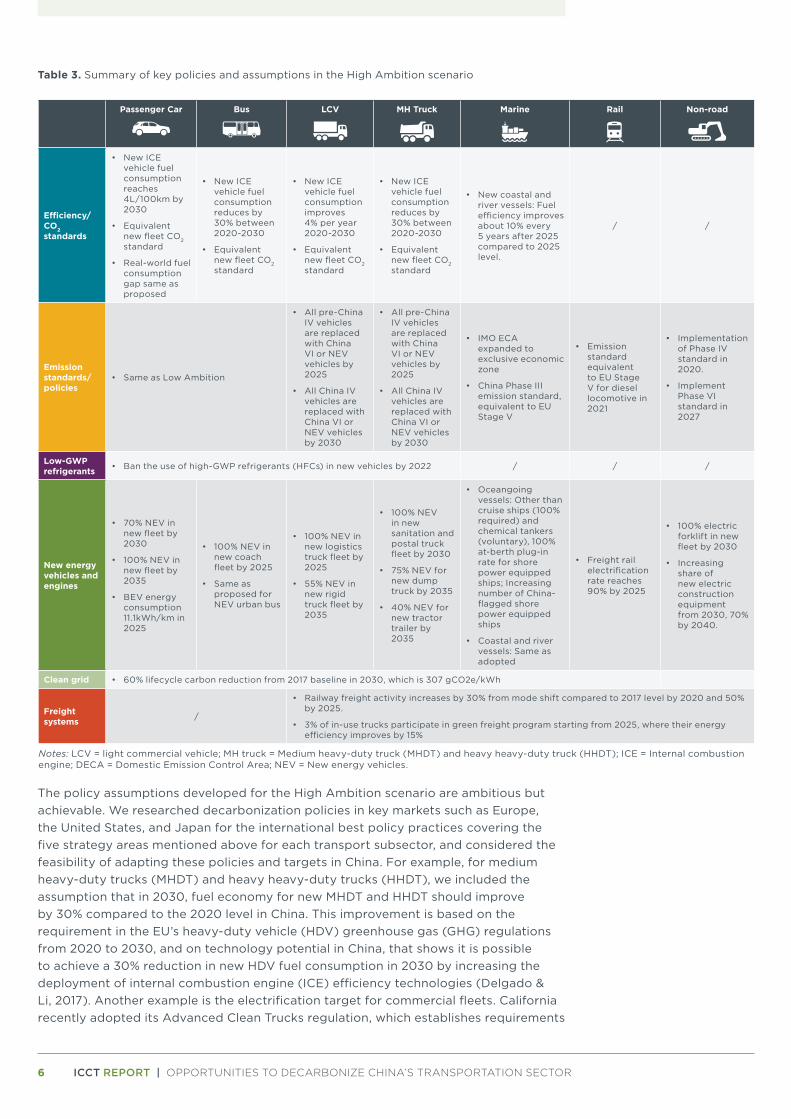
Table 3. Summary of key policies and assumptions in the High Ambition scenario ......... 6
Table 4. Share of vehicles by category for modeling new energy vehicle and engine policies ................................................................................................................................................................ 9
Table 5. China’s transport sector emissions as a share of the global carbon budget, 2021-2050. .....................................................................................................................................16
Table 6. Annual NOx emissions reduction by sector under the High Ambition scenario compared with 2020 baseline levels ..................................................................................19
Table 7. Annual PM emissions reduction by sector under the High Ambition scenario compared with 2020 baseline levels ..................................................................................19
iv ICCT REPORT | OPPORTUNITIES TO DECARBONIZE CHINA’S TRANSPORTATION SECTOR
ABBREVIATIONSBC black carbon
BEV battery electric vehicle
CNG compressed natural gas
CO2e carbon dioxide equivalent
DECA domestic emission control area
DPF diesel particulate filter
ECA emission control area
EEDI Energy Efficiency Design Index
EU European Union
FCV fuel cell vehicles
GHG greenhouse gas
GWP global warming potential
HDV heavy-duty vehicle
HHDT heavy heavy-duty truck
ICE internal combustion engine
IMO International Maritime Organization
LCV light commercial vehicles
LDV light-duty vehicle
MHDT medium heavy-duty trucks
NEV new energy vehicles
OGV oceangoing vessels
PC passenger cars
PHEV plug-in hybrid electric vehicle
PM particulate matter
VECC Vehicle Emission Control Center of the Ministry of Ecology and Environment
WTW well-to-wheel
v ICCT REPORT | OPPORTUNITIES TO DECARBONIZE CHINA’S TRANSPORTATION SECTOR
EXECUTIVE SUMMARYChina has pledged to reach a peak in the nation’s economy-wide CO2 emissions by 2030 and that the country will reach carbon neutrality by 2060. This study uses cutting-edge emission-modeling tools to assess the potential for reducing climate pollutants (including CO2) from advanced policy packages compared with policies currently in effect for China’s transportation sector. The study provides China with a technical foundation for consideration of carbon reduction goals during the 14th Five-Year-Plan (FYP) period (2021-2025) and over the long term.
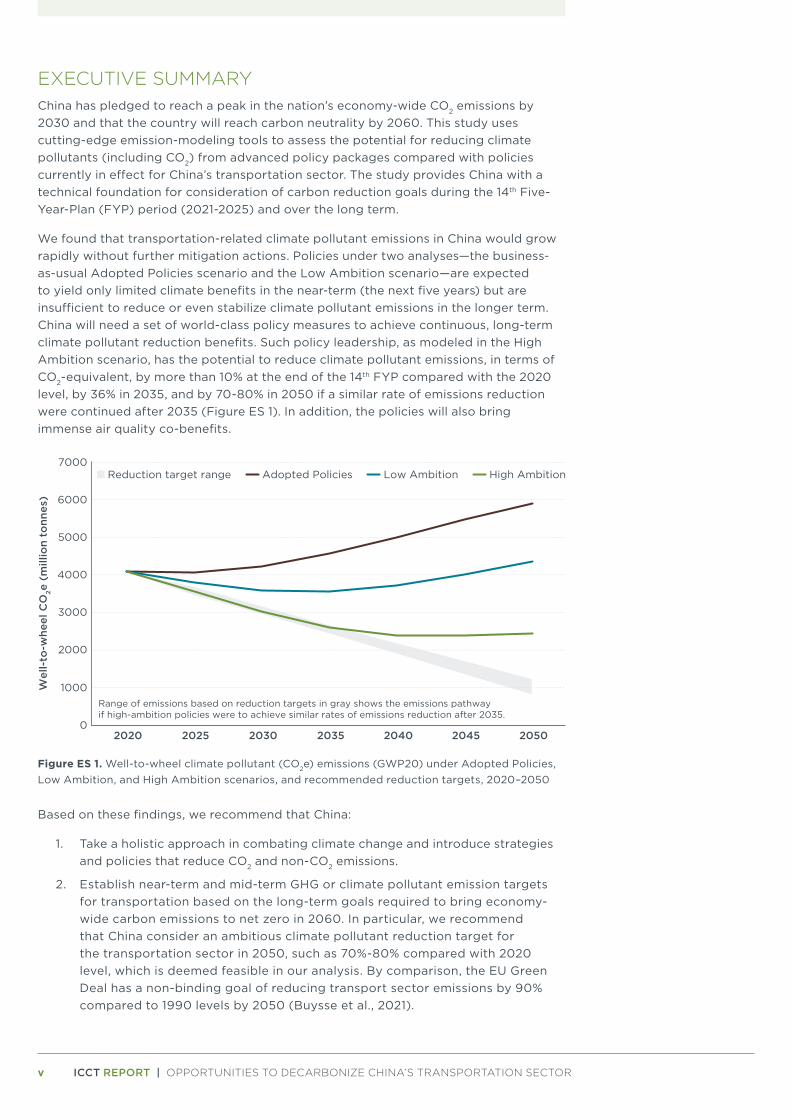
We found that transportation-related climate pollutant emissions in China would grow rapidly without further mitigation actions. Policies under two analyses—the business-as-usual Adopted Policies scenario and the Low Ambition scenario—are expected to yield only limited climate benefits in the near-term (the next five years) but are insufficient to reduce or even stabilize climate pollutant emissions in the longer term. China will need a set of world-class policy measures to achieve continuous, long-term climate pollutant reduction benefits. Such policy leadership, as modeled in the High Ambition scenario, has the potential to reduce climate pollutant emissions, in terms of CO2-equivalent, by more than 10% at the end of the 14th FYP compared with the 2020 level, by 36% in 2035, and by 70-80% in 2050 if a similar rate of emissions reduction were continued after 2035 (Figure ES 1). In addition, the policies will also bring immense air quality co-benefits.
0
1000
2000
3000
4000
5000
6000
7000
2020 2025 2030 2035 2040 2045 2050
Wel
l-to
-whe
el C
O2e
(m
illio
n to
nnes
)
Reduction target range Adopted Policies Low Ambition High Ambition
Range of emissions based on reduction targets in gray shows the emissions pathwayif high-ambition policies were to achieve similar rates of emissions reduction after 2035.
Figure ES 1. Well-to-wheel climate pollutant (CO2e) emissions (GWP20) under Adopted Policies, Low Ambition, and High Ambition scenarios, and recommended reduction targets, 2020–2050
Based on these findings, we recommend that China:
1. Take a holistic approach in combating climate change and introduce strategies and policies that reduce CO2 and non-CO2 emissions.
2. Establish near-term and mid-term GHG or climate pollutant emission targets for transportation based on the long-term goals required to bring economy-wide carbon emissions to net zero in 2060. In particular, we recommend that China consider an ambitious climate pollutant reduction target for the transportation sector in 2050, such as 70%-80% compared with 2020 level, which is deemed feasible in our analysis. By comparison, the EU Green Deal has a non-binding goal of reducing transport sector emissions by 90% compared to 1990 levels by 2050 (Buysse et al., 2021).
vi ICCT REPORT | OPPORTUNITIES TO DECARBONIZE CHINA’S TRANSPORTATION SECTOR
3. Formulate comprehensive policies to achieve these transport sector emission reductions, including but not limited to direct GHG emission standards for on-road, marine, and non-road mobile sources; zero-emission vehicle requirements for various transportation segments and fleets (e.g. public transport, government fleets, taxis and rentals, logistics vehicles, port drayage trucks etc.); establishment of ultra-low and zero-emission zones; bans on, or emission standards for, motor vehicle refrigerants with high global warming potentials; optimized transport system structures; and promotion of low-carbon multi-modal transportation.
1 ICCT REPORT | OPPORTUNITIES TO DECARBONIZE CHINA’S TRANSPORTATION SECTOR
INTRODUCTIONIn September 2020, Chinese president Xi Jinping pledged that China’s carbon dioxide (CO2) emissions would peak by 2030 and that the country would achieve carbon neutrality by 2060. The transportation sector, including passenger and freight vehicles, ships, trains, aircraft, and mobile equipment, accounts for a significant share of China’s economy-wide carbon footprint. Therefore, a technological and policy pathway to decarbonize the transportation sector remains a critical element in an overall strategy for meeting the nation’s mid- and long-term carbon reduction commitment. This study investigates policy opportunities and potentials for decarbonizing China’s transportation sector during the 14th FYP and in the following decades. The scope of our study includes:
» The major climate pollutants, including CO2, methane (CH4), nitrous oxide (N2O), and black carbon (BC) emitted from well-to-wheel (WTW) during the fuel and energy use cycle. WTW emissions are those emerging directly from the tailpipes of various transportation modes and from upstream process in producing and handling fuel. They also include hydrofluorocarbons (HFCs) leaked from motor vehicle air conditioning systems. The pollutants covered in this study are slightly different from the greenhouse gases (GHGs) defined and commonly used in the work of the Intergovernmental Panel on Climate Change (IPCC) and in the Kyoto Protocol, which focus primarily on gaseous global warming pollutants. This study does not include emissions incurred during the manufacturing stage of various transportation modes since these could vary greatly; they are an area of potential additional research. Different production pathways of hydrogen (other than electrolysis) and their GHG intensity are not considered in this study given the limited uptake likely in the 14th FYP period and the limited research in China’s context; however, different hydrogen production pathways and their GHG intensities (Baldino et al., 2020; Bieker, 2021; Hydrogen Council, 2021) should be taken into account in future policies that aim to promote fuel cell electric vehicles in order to achieve their full benefits. This study used global warming potential values over a 20-year time horizon (GWP20) to calculate CO2-equivalent emissions (CO2e) (Myhre et al., 2013) in order to better capture reduction potentials of short-lived climate pollutants in addition to CO2, but we also include key figures using GWP100 in Appendix B.
» Major transportation modes and segments, including passenger cars, buses, freight trucks, inland waterway, coastal and marine shipping vessels, freight rail, mobile equipment. This study does not include an emission assessment of passenger rail, given that more than 70% of China’s passenger high-speed rail was already electrified in 2020 (Ministry of Transport of the People’s Republic of China, 2021)—the rate is much higher if only actively used passenger rail is considered, based on communications with the VECC. Though commercial aviation should play a role in China’s decarbonization plan and is estimated to account for less than 5% of CO2 emissions in 2019 (Civil Aviation Administration of the People’s Republic of China, 2020; Graver et al., 2020; State Council of the People’s Republic of China, 2021), it is not included in this study and is an area for additional research.
» Five major strategies appropriate to the Chinese context: fuel or energy efficiency regulations (that indirectly reduce CO2 emissions) or future, direct GHG emission standards, exhaust emission standards, requirements for using low-GWP refrigerants, electrification (new energy vehicles and engines along with a cleaner grid) and a more efficient freight system with mode shifts. This study does not include measures to increase the use of low-carbon mobility systems such as electric passenger high-speed rail, urban metro (subway) systems, or slow mobility (non-motorized transportation), since these depend heavily on behavioral shifts of the public. The study also does not include targets for biofuels since China does not use large amounts of biofuels and probably will not greatly expand its use given the limited supply.
2 ICCT REPORT | OPPORTUNITIES TO DECARBONIZE CHINA’S TRANSPORTATION SECTOR
» Policies that might be implemented before 2035 based on the current technology and policy landscape: This does not mean that policy efforts will stop after 2035. This implies that our estimates for long-term emission reduction benefits are conservative.
The next section describes policy scenarios and decarbonization pathways for the transportation sector in China. Section 3 outlines our modeling methods. Following that, we provide a comprehensive discussion of the modeling results. We close with conclusions and policy recommendations drawn from the analysis.
3 ICCT REPORT | OPPORTUNITIES TO DECARBONIZE CHINA’S TRANSPORTATION SECTOR
SCENARIOS AND DECARBONIZATION PATHWAYSWe analyzed three scenarios: The Adopted Policies scenario represents policy measures and associated clean technologies in the previously defined scope adopted as of September 2020, also known as the business-as-usual (BAU) scenario. We also consider two policy scenarios of future decarbonization:
» The Low Ambition scenario represents policies known to be in the enactment pipeline as of September 2020, are under development or research, or could be adopted by 2035 based on past policies, and their required clean technologies.
» The High Ambition scenario represents a set of world-class policy measures and requirements benchmarking the global best policy practices in respective areas that could be adopted in China by 2035, and their required clean technologies.
Tables 1, 2, and 3 summarize the key policies and assumptions, by various transportation modes and segments and emission reduction strategies, for the three scenarios. Note that even though the majority of these targets are expected to be achieved by policies in their respective areas, some might be affected by a combination of policies. For example, high penetration of electric vehicles can be achieved by direct regulatory requirements of electric vehicle sales, stringent CO2/efficiency standards, and exhaust emission standards. Detailed assumptions are provided in Appendix A. We assessed the mitigation potential from CO2 and non-CO2 climate pollutants of these measures over the next 30 years. In this paper, we highlight the results for three key target years most relevant to China’s policymaking today: 2025 (end of the 14th FYP), 2035 (year of realizing Beautiful China1 goals) and 2050 (ICCT recommended long-term).
1 In May 2018, Chinese president Xi Jinping in the 19th National Conference speech raised a number of macro-environmental development directional targets to “build a beautiful China by 2035”, such as China achieving world-class environmental quality. Source: http://www.gov.cn/zhuanti/2017-10/18/content_5232657.htm. Accessed January 12, 2021.
4 ICCT REPORT | OPPORTUNITIES TO DECARBONIZE CHINA’S TRANSPORTATION SECTOR
Table 1. Summary of key policies and assumptions in the Adopted Policies scenario
Passenger Car Bus LCV MH Truck Marine Rail Non-road
Efficiency/CO2 standards
• New ICE vehicle fuel consumption reaches 4.85L/100km by 2025 after ruling out impact from NEVs (fleet-average 4L/100km)
• Real-world fuel consumption 25% higher than test cycle.
• 18.4 L/100km fleet average fuel consumption in 2020
• 6.8L/100km fleet average fuel consumption in 2020.
• 18.6 L/100km fleet average fuel consumption for MHDT in 2020
• 36.9 L/100km fleet average fuel consumption for HHDT in 2020.
• New oceangoing vessels: Fuel efficiency improves about 10% every 5 years after 2020 compared to 2020 level
/ /
Emission standards/policies
• Nationwide implementation of China VI-a in July 2021 and China VI-b in July 2023.
• By 2020, 1 million pre-China IV MHDTs and HHDTs are replaced with China VI vehicles
• DECA 2.0 – covers 12nm from Chinese coastline, plus Yangtze River, Pearl River and 12 nm around Hainan Island, 5000ppm fuel sulfur limit for coastal ships (1000ppm for Hainan in 2022), 10ppm for river ships, Tier II NOx limit for Category 3 engines
• Phase I engine standard in 2018 and Phase II in 2021
/
• Implementation of China III standard by 2017.
Low-GWP refrigerants / / / /
New energy vehicles and engines
• 5% NEV in new fleet by 2020
• 18% NEV in new fleet by 2025
• 2025 BEV energy efficiency 14.3kWh/100km
• 100% NEV in new urban bus fleet by 2025
• 4% NEV in new coach fleet by 2025
• 10% NEV in new logistics truck fleet by 2025
• 2% NEV in new rigid truck fleet by 2025
• 50% NEV in new sanitation and postal truck fleet by 2025
• 1% NEV in new dump truck by 2025
• Oceangoing vessels: Other than cruise ships (100% required) and chemical tankers (voluntary), 100% at-berth plug-in rate for shore power equipped ships
• Coastal and river vessels: 15 million kWh shore power used (0.2% annual growth rate)
• Freight rail electrification rate reaches 80% by 2025
• 40% electric forklift in new fleet by 2020
Clean grid • Grid lifecycle carbon emission factor of 635 gCO2e/kWh in 2020
Freight systems / • Railway freight activity increases by 30% from mode shift compared to 2017 level by 2020
Notes: LCV = light commercial vehicle; MH truck = Medium heavy-duty truck (MHDT) and heavy heavy-duty truck (HHDT); ICE = Internal combustion engine; DECA = Domestic Emission Control Area; NEV = New energy vehicles
5 ICCT REPORT | OPPORTUNITIES TO DECARBONIZE CHINA’S TRANSPORTATION SECTOR
Table 2. Summary of key policies and assumptions in the Low Ambition scenario
Passenger Car Bus LCV MH Truck Marine Rail Non-road
Efficiency/CO2 standards
• New ICE fuel consumption reaches 4.4L/100km by 2030
• Real-world fuel consumption gap reduced from 25% to 10%
• New ICE vehicle fuel consumption reduces by 15% between 2020-2025
• New ICE vehicle fuel consumption: 6.8L/100km in 2020. 2020-2030 3% improvement per year
• New ICE vehicle fuel consumption reduces by 15% between 2020-2025
• Same as Adopted / /
Emission standards/policies
• Early implementation of China VI-b emission standards in three key regions (Beijing-Hebei-Tianjin, Pearl River Delta and Yangtze River Delta) by 2021
• 100nm IMO ECA – covers 100nm from Chinese coastline, 1000ppm fuel sulfur limit, Tier III NOx limit for Category 3 engines built after 2025
• Same engine standard as adopted
• Emission standard equivalent to EU Stage V for diesel locomotive in 2025
• Implementation of Phase IV standard in 2020.
• Phase V standard in 2028.
• Phase VI in 2033
Low-GWP refrigerants Ban the use of high-GWP refrigerants (HFCs) in new vehicles by 2024 /
New energy vehicles and engines
• 25% NEV in new fleet by 2025
• 50%NEV in new fleet by 2035
• 2025 BEV energy efficiency 12.1kWh/100km
• 100% NEV in stock urban bus fleet by 2025
• 30% NEV in new coach fleet by 2025
• 40% NEV in new logistics truck fleet by 2025
• 8% NEV in new rigid truck fleet by 2025
• Same as Adopted • Same as Adopted • Same as
Adopted• Same as
Adopted
Clean grid • Grid lifecycle carbon emission factor of 515 gCO2e/kWh in 2030
Freight systems /
• Railway freight activity increases by 30% from mode shift compared to 2017 level by 2020 and 40% by 2025
• 2% of in-use trucks participate in green freight program starting from 2025, , where their energy efficiency improves by 10%
Notes: LCV = light commercial vehicle; MH truck = Medium heavy-duty trucks (MHDT) and heavy heavy-duty trucks (HHDT); ICE = Internal combustion engine; DECA = Domestic Emission Control Area; NEV = New energy vehicles.
6 ICCT REPORT | OPPORTUNITIES TO DECARBONIZE CHINA’S TRANSPORTATION SECTOR
Table 3. Summary of key policies and assumptions in the High Ambition scenario
Passenger Car Bus LCV MH Truck Marine Rail Non-road
Efficiency/CO2 standards
• New ICE vehicle fuel consumption reaches 4L/100km by 2030
• Equivalent new fleet CO2 standard
• Real-world fuel consumption gap same as proposed
• New ICE vehicle fuel consumption reduces by 30% between 2020-2030
• Equivalent new fleet CO2 standard
• New ICE vehicle fuel consumption improves 4% per year 2020-2030
• Equivalent new fleet CO2 standard
• New ICE vehicle fuel consumption reduces by 30% between 2020-2030
• Equivalent new fleet CO2 standard
• New coastal and river vessels: Fuel efficiency improves about 10% every 5 years after 2025 compared to 2025 level.
/ /
Emission standards/policies
• Same as Low Ambition
• All pre-China IV vehicles are replaced with China VI or NEV vehicles by 2025
• All China IV vehicles are replaced with China VI or NEV vehicles by 2030
• All pre-China IV vehicles are replaced with China VI or NEV vehicles by 2025
• All China IV vehicles are replaced with China VI or NEV vehicles by 2030
• IMO ECA expanded to exclusive economic zone
• China Phase III emission standard, equivalent to EU Stage V
• Emission standard equivalent to EU Stage V for diesel locomotive in 2021
• Implementation of Phase IV standard in 2020.
• Implement Phase VI standard in 2027
Low-GWP refrigerants • Ban the use of high-GWP refrigerants (HFCs) in new vehicles by 2022 / / /
New energy vehicles and engines
• 70% NEV in new fleet by 2030
• 100% NEV in new fleet by 2035
• BEV energy consumption 11.1kWh/km in 2025
• 100% NEV in new coach fleet by 2025
• Same as proposed for NEV urban bus
• 100% NEV in new logistics truck fleet by 2025
• 55% NEV in new rigid truck fleet by 2035
• 100% NEV in new sanitation and postal truck fleet by 2030
• 75% NEV for new dump truck by 2035
• 40% NEV for new tractor trailer by 2035
• Oceangoing vessels: Other than cruise ships (100% required) and chemical tankers (voluntary), 100% at-berth plug-in rate for shore power equipped ships; Increasing number of China-flagged shore power equipped ships
• Coastal and river vessels: Same as adopted
• Freight rail electrification rate reaches 90% by 2025
• 100% electric forklift in new fleet by 2030
• Increasing share of new electric construction equipment from 2030, 70% by 2040.
Clean grid • 60% lifecycle carbon reduction from 2017 baseline in 2030, which is 307 gCO2e/kWh
Freight systems /
• Railway freight activity increases by 30% from mode shift compared to 2017 level by 2020 and 50% by 2025.
• 3% of in-use trucks participate in green freight program starting from 2025, where their energy efficiency improves by 15%
Notes: LCV = light commercial vehicle; MH truck = Medium heavy-duty truck (MHDT) and heavy heavy-duty truck (HHDT); ICE = Internal combustion engine; DECA = Domestic Emission Control Area; NEV = New energy vehicles.
The policy assumptions developed for the High Ambition scenario are ambitious but achievable. We researched decarbonization policies in key markets such as Europe, the United States, and Japan for the international best policy practices covering the five strategy areas mentioned above for each transport subsector, and considered the feasibility of adapting these policies and targets in China. For example, for medium heavy-duty trucks (MHDT) and heavy heavy-duty trucks (HHDT), we included the assumption that in 2030, fuel economy for new MHDT and HHDT should improve by 30% compared to the 2020 level in China. This improvement is based on the requirement in the EU’s heavy-duty vehicle (HDV) greenhouse gas (GHG) regulations from 2020 to 2030, and on technology potential in China, that shows it is possible to achieve a 30% reduction in new HDV fuel consumption in 2030 by increasing the deployment of internal combustion engine (ICE) efficiency technologies (Delgado & Li, 2017). Another example is the electrification target for commercial fleets. California recently adopted its Advanced Clean Trucks regulation, which establishes requirements
7 ICCT REPORT | OPPORTUNITIES TO DECARBONIZE CHINA’S TRANSPORTATION SECTOR
for escalating the share of zero-emission sales for new commercial trucks by 2035; the 2035 zero-emission targets range from 40% to 75% depending on the vehicle category. The targets we propose for China are the same as in California; given that China’s share of electric commercial fleets is already higher than the current level in California, it is arguably technically feasible for China to achieve this goal by 2035.
Equally important, our policy assumptions for the High Ambition scenarios are enforceable to ensure effective implementation. For example, we evaluated continued tightening of vehicle fuel efficiency standards and, in parallel, direct GHG or CO2 emission standards. This is because the regulatory agency of China’s vehicle fuel efficiency standards does not have full legal authority to enforce the standard and penalize noncompliant manufacturers (Cui, 2018). This lack of authority in compliance and enforcement can reduce the potential emissions mitigation benefits of these standards. Previous ICCT analysis (Yang & Yang, 2018) shows that real-world fuel consumption of light-duty vehicles in China is almost 40% higher than in laboratory testing, while fuel efficiency standards tightened by less than 30% in the past five years from a fleet-average of 6.9L/100km in Phase 3 to 5L/100km in Phase 4. This means that the 30% reduction target in the fuel efficiency standard has not fully translated into equivalent real-world fuel savings and benefits. Therefore, such regulation must be complemented by strong and robust vehicle GHG or CO2 emission standards to be introduced by the environment ministry, which has legal authority over vehicle emissions and GHG management, as empowered by China’s Air Pollution Control Law. Under the legislation, violators of vehicle emission requirements are subject to substantial financial fines and civil penalties.
8 ICCT REPORT | OPPORTUNITIES TO DECARBONIZE CHINA’S TRANSPORTATION SECTOR
METHODSThis study utilized a number of ICCT’s pre-established transportation emission inventory models and tools to assess emission saving potentials from road vehicles and rail, marine vessels, and low-GWP refrigerants. The non-road mobile equipment emission modeling was conducted by VECC-MEE. The overall emission reduction of various policy scenarios was the sum of results from all four modules. This section provides a high-level overview of the four modules, including their structure and capabilities, and general methods. See the previous section and Appendix A for detailed assumptions used in this analysis. Some of these modeling tools are fully documented in various ICCT publications, as specified in the following subsections.
ROAD AND RAILEmissions from on-road vehicles and rail were estimated using ICCT’s Roadmap emissions model customized for China (Shao & Wagner, 2015). Figure 1 shows the key data and steps in the model. The model considers factors such as socioeconomic indicators, vehicle sales or activity shares by engine technology, energy efficiency, fuel quality, emission controls, and emission factors. The model calculates vehicle sales, stock, activity, and fuel consumption, among other intermediate results. The main outputs of the model include fuel consumption, vehicle activity, stock and sales by vehicle type, fuel type and key region, and emissions of different pollutants and GHG gases including CO2, CH4, N2O, NOx, CO, HC, PM2.5, BC, and SO2. The model can assess well-to-tank, tank-to-wheel, and well-to-wheel emissions.
TURNOVER ALGORITHM
SOCIOECONOMICINDICATORS
ACTIVITY
VEHICLE ACTIVITY
FUELCONSUMPTION
WTTEMISSIONS
WTWEMISSIONS
TTWEMISSIONS
VEHICLESALES
EMISSIONSTANDARDS
NEW FLEET ENERGY
EFFICIENCY
WTTEMISSIONSFACTORS
FUEL BLENDS
VEHICLE SALESSHARE BY
TECHNOLOGY
TTWEMISSIONSFACTORS
VEHICLEPOPULATION
INPUTS CALCULATIONS OUTPUTS
Figure 1. Modeling process for Roadmap emissions model as customized for China
9 ICCT REPORT | OPPORTUNITIES TO DECARBONIZE CHINA’S TRANSPORTATION SECTOR
Major policy and technology levers in the model are vehicle fuel efficiency standards or potential future GHG emission standards, low carbon fuels, electric drive vehicles, grid decarbonization, freight mode shift, activity reduction, emission standards, low sulfur fuels, scrappage programs, inspection and maintenance programs (I/M) and compliance and enforcement programs. We modeled rail, passenger cars (PCs), light commercial vehicles (LCVs, or light trucks), MHDTs, HHDT, and buses separately. Light duty vehicles (LDVs) consist of PCs and LCVs, and HDVs consist of MHDTs, HHDTs and buses in this analysis. The model can accept different inputs for certain policies, for example, different emission standards and implementation timelines for different parts of the country, including Beijing, Tianjin-Hebei, Shanghai, Jiangsu-Zhejiang, Guangzhou, Shenzhen, the rest of the Pearl River Delta, the rest of Guangdong, and the rest of China.
When modeling electric vehicle policies, given that the targets are set based on vehicle category (see Table 4) and are different from other policies and from vehicle types in our model, we assumed a specific split of vehicle types by category, based mainly on 2019 production.
Table 4. Share of vehicles by category for modeling new energy vehicle and engine policies
Vehicle type Category Share of vehicle type
LCV
Logistics/delivery vehicle < 4.5 tonnes 30%
Rigid truck < 4.5 tonnes 50%
Others 20%
BusUrban 50%
Coach 50%
MHDTSanitation and postal 50%
Dump truck and other MHDT 50%
HHDT Tractor and other HHDT 100%
Note: No differentiation is made here between tractors and other HHDTs, and between dump trucks and other MHDTs, because their uptakes in all scenarios are assumed to be the same.
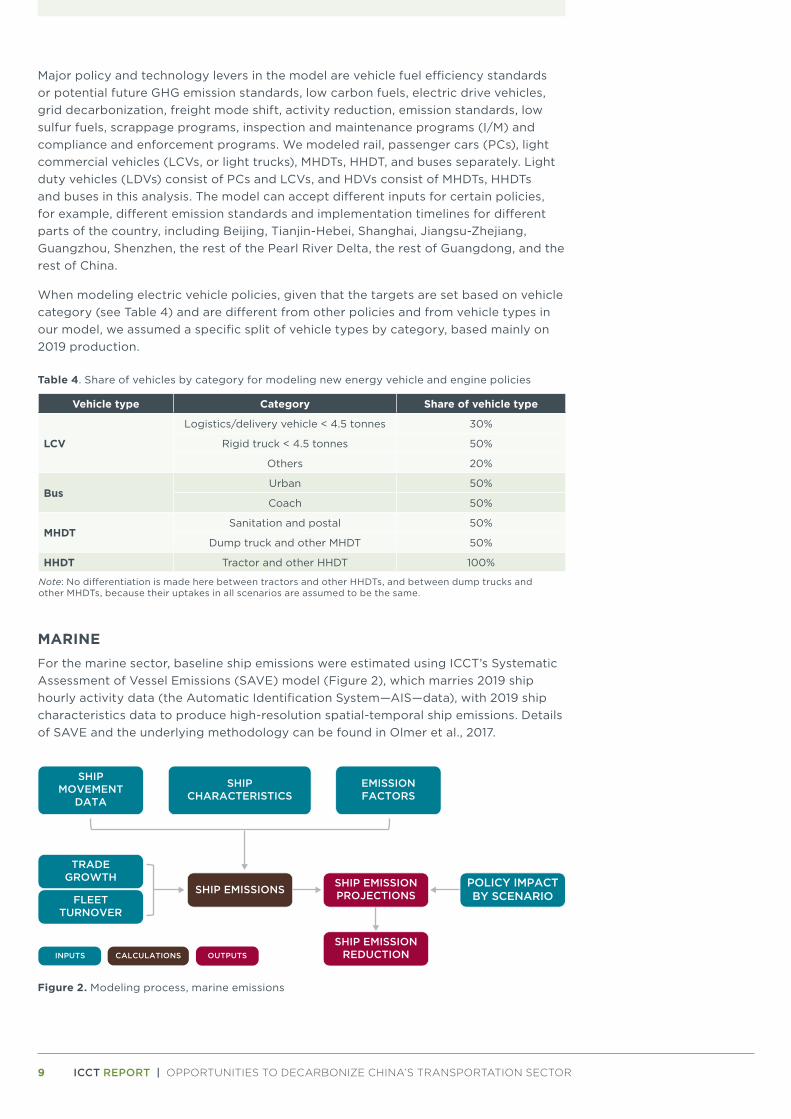
MARINEFor the marine sector, baseline ship emissions were estimated using ICCT’s Systematic Assessment of Vessel Emissions (SAVE) model (Figure 2), which marries 2019 ship hourly activity data (the Automatic Identification System—AIS—data), with 2019 ship characteristics data to produce high-resolution spatial-temporal ship emissions. Details of SAVE and the underlying methodology can be found in Olmer et al., 2017.
SHIPMOVEMENT
DATA
TRADEGROWTH
FLEETTURNOVER
SHIPCHARACTERISTICS
EMISSIONFACTORS
SHIP EMISSIONS SHIP EMISSIONPROJECTIONS
POLICY IMPACTBY SCENARIO
SHIP EMISSIONREDUCTIONINPUTS CALCULATIONS OUTPUTS
Figure 2. Modeling process, marine emissions
10 ICCT REPORT | OPPORTUNITIES TO DECARBONIZE CHINA’S TRANSPORTATION SECTOR
The geographical boundary of marine emissions in this analysis extends 200 nautical miles from China’s baseline (its coastline, as conforming to internationally agreed definitions in UNCLOS, 1994) into the Pacific Ocean and includes inland waterways. As a result, marine emissions include emissions from China-flagged (those flagged to the People’s Republic of China) and foreign-flagged ships. Among the policies we modeled, some apply to all ships regardless of their flags (e.g., emission control area policy), while others apply only to China-flagged ships (e.g., marine engine standards).
To project marine emissions into the future, we used a set of generic fuel consumption growth factors defined in Mao et al., 2019. It is constructed combining a trade scaling factor for each ship class reflecting impacts of trade growth and an efficiency adjustment factor reflecting ships’ efficiency improvement through natural fleet turnover.
Based on a previous ICCT study (Mao & Rutherford, 2018), emissions from China’s domestic merchant fleet are projected to grow by about 22% from 2015 to 2030, accounting for activity growth and potential efficiency gains. That would translate to about a 1.3% growth in emissions annually. However, that study did not take into account a potential reduction in fuel carbon intensity in the marine sector. Given China’s carbon reduction pledge and the assumption that low-carbon fuels would penetrate the marine sector more slowly than other transport sectors, we simply assume a 1.3% annual reduction in fuel carbon intensity, which cancels out the emission projection in absolute numbers. This implies a 40% reduction in carbon intensity by 2060 cumulatively, which is in line with International Maritime Organization (IMO)’s carbon intensity reduction goal for the international fleet by 2050.
Under each scenario, each policy was evaluated separately to derive a policy-specific adjustment factor for fuel consumption and associated emissions. To evaluate their combined impact on emissions, these factors are multiplied. Note that only tank-to-wheel emissions are included for the marine sector in this analysis (although tank-to-wheel emissions are likely to account for the majority of the well-to-wheel emissions).
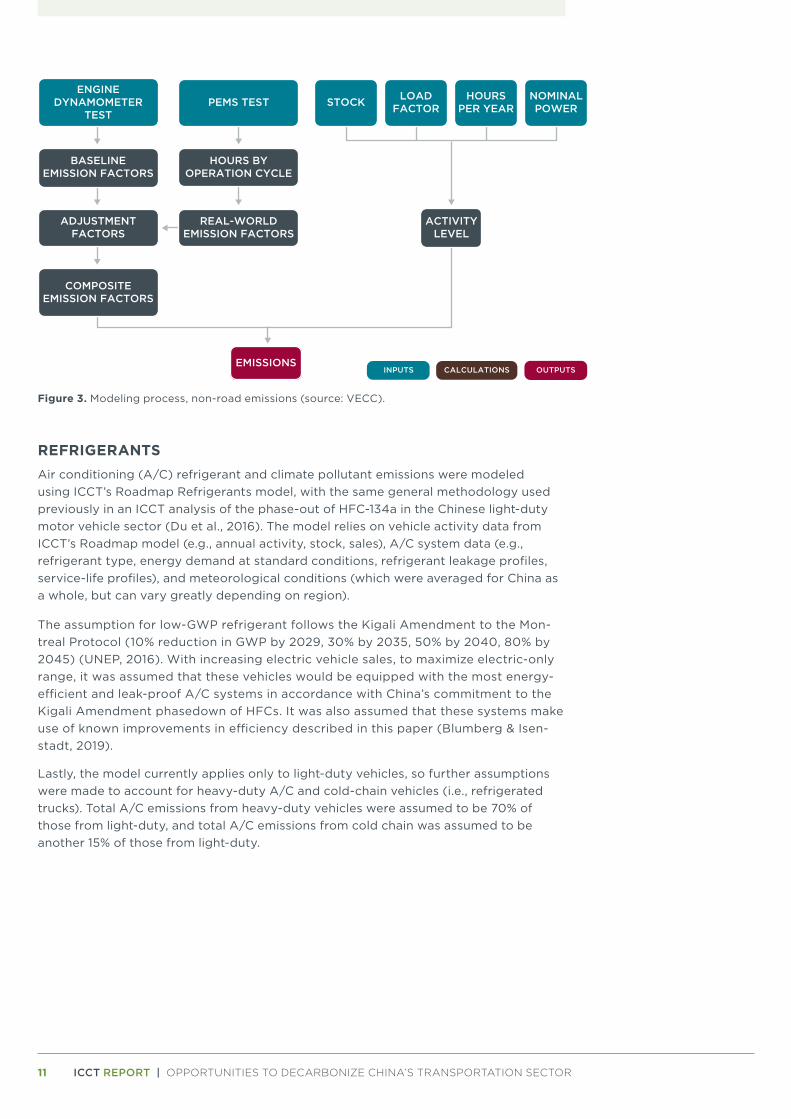
NON-ROAD MOBILE EQUIPMENTNon-road mobile equipment emissions were assessed by VECC-MEE, using their in-house non-road model, which builds upon the results of engine dynamometer tests. Figure 3 shows the flow chart for the modeling process. Baseline emission factors were generated based on engine dynamometer tests. These emission factors were then adjusted using portable emissions measurement system (PEMS) real-world testing under various operation cycles. Load factors were taken mainly from real-world measurements. Hours of annual use were estimated based on monitoring data from major domestic companies and existing domestic and international data. Note that only tank-to-wheel emissions are included for non-road mobile equipment in this analysis.
11 ICCT REPORT | OPPORTUNITIES TO DECARBONIZE CHINA’S TRANSPORTATION SECTOR
ENGINE
DYNAMOMETERTEST
BASELINEEMISSION FACTORS
ADJUSTMENTFACTORS
COMPOSITEEMISSION FACTORS
PEMS TEST
HOURS BYOPERATION CYCLE
REAL-WORLDEMISSION FACTORS
STOCK LOADFACTOR
HOURSPER YEAR
NOMINALPOWER
ACTIVITYLEVEL
EMISSIONSINPUTS CALCULATIONS OUTPUTS
Figure 3. Modeling process, non-road emissions (source: VECC).
REFRIGERANTSAir conditioning (A/C) refrigerant and climate pollutant emissions were modeled using ICCT’s Roadmap Refrigerants model, with the same general methodology used previously in an ICCT analysis of the phase-out of HFC-134a in the Chinese light-duty motor vehicle sector (Du et al., 2016). The model relies on vehicle activity data from ICCT’s Roadmap model (e.g., annual activity, stock, sales), A/C system data (e.g., refrigerant type, energy demand at standard conditions, refrigerant leakage profiles, service-life profiles), and meteorological conditions (which were averaged for China as a whole, but can vary greatly depending on region).
The assumption for low-GWP refrigerant follows the Kigali Amendment to the Mon-treal Protocol (10% reduction in GWP by 2029, 30% by 2035, 50% by 2040, 80% by 2045) (UNEP, 2016). With increasing electric vehicle sales, to maximize electric-only range, it was assumed that these vehicles would be equipped with the most energy-efficient and leak-proof A/C systems in accordance with China’s commitment to the Kigali Amendment phasedown of HFCs. It was also assumed that these systems make use of known improvements in efficiency described in this paper (Blumberg & Isen-stadt, 2019).
Lastly, the model currently applies only to light-duty vehicles, so further assumptions were made to account for heavy-duty A/C and cold-chain vehicles (i.e., refrigerated trucks). Total A/C emissions from heavy-duty vehicles were assumed to be 70% of those from light-duty, and total A/C emissions from cold chain was assumed to be another 15% of those from light-duty.
12 ICCT REPORT | OPPORTUNITIES TO DECARBONIZE CHINA’S TRANSPORTATION SECTOR
DISCUSSION OF RESULTS
FUTURE TRANSPORTATION ACTIVITY GROWTHWe first projected the future growth of transportation activities in the subsectors analyzed. China has been the world’s largest vehicle sales market for 10 years. Its considerable economic development potential and accelerating pace of urbanization will further boost demand for passenger and freight transportation.
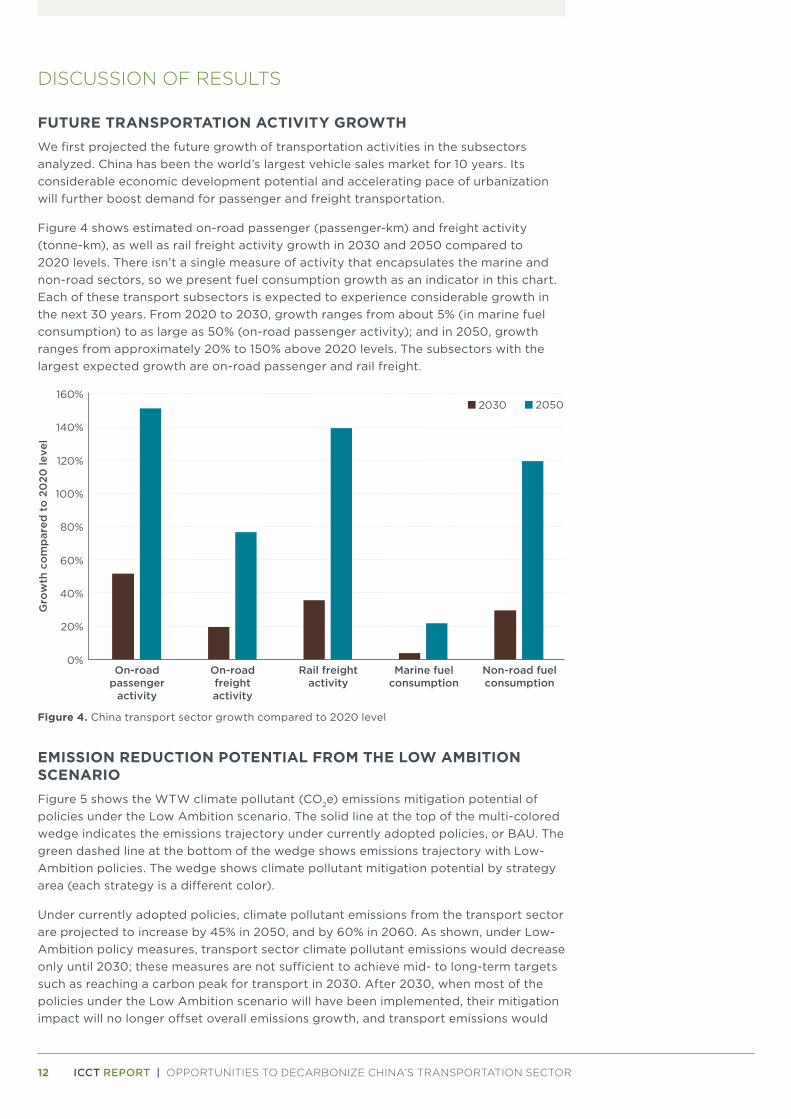
Figure 4 shows estimated on-road passenger (passenger-km) and freight activity (tonne-km), as well as rail freight activity growth in 2030 and 2050 compared to 2020 levels. There isn’t a single measure of activity that encapsulates the marine and non-road sectors, so we present fuel consumption growth as an indicator in this chart. Each of these transport subsectors is expected to experience considerable growth in the next 30 years. From 2020 to 2030, growth ranges from about 5% (in marine fuel consumption) to as large as 50% (on-road passenger activity); and in 2050, growth ranges from approximately 20% to 150% above 2020 levels. The subsectors with the largest expected growth are on-road passenger and rail freight.
0%
20%
40%
60%
80%
100%
120%
140%
160%
On-roadpassenger
activity
On-roadfreightactivity
Rail freightactivity
Marine fuelconsumption
Non-road fuelconsumption
Gro
wth
co
mp
ared
to
20
20 le
vel
2030 2050
Figure 4. China transport sector growth compared to 2020 level
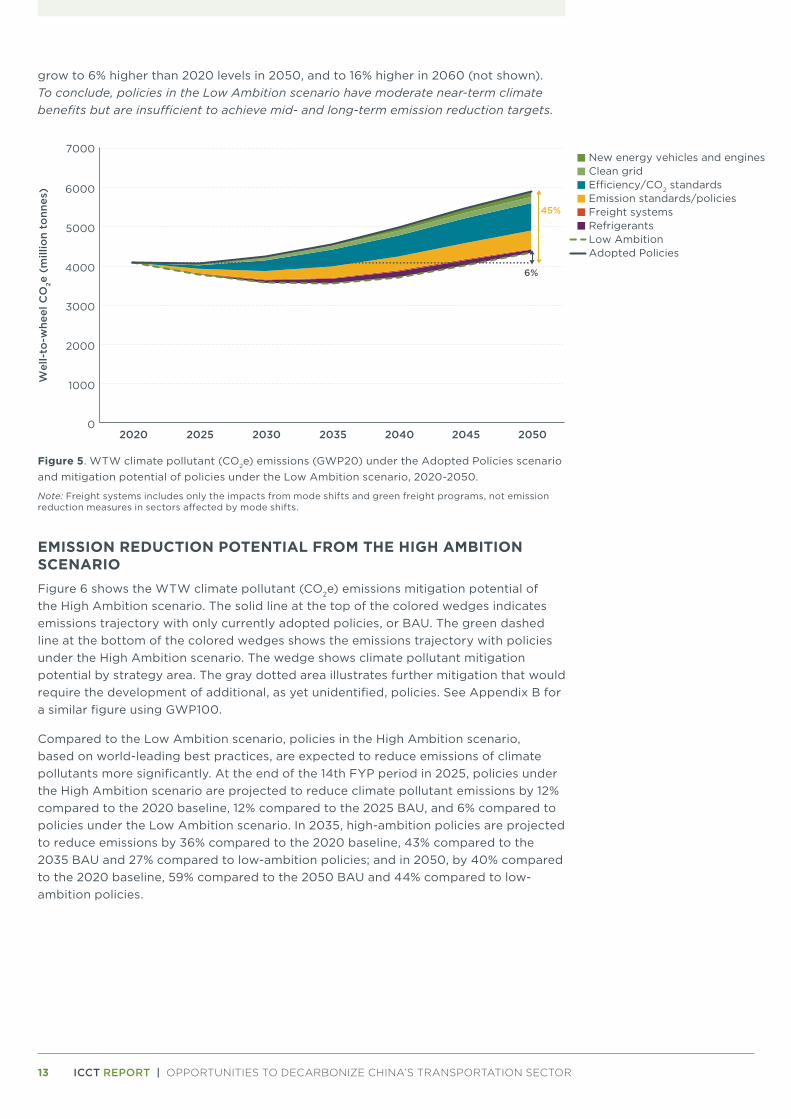
EMISSION REDUCTION POTENTIAL FROM THE LOW AMBITION SCENARIOFigure 5 shows the WTW climate pollutant (CO2e) emissions mitigation potential of policies under the Low Ambition scenario. The solid line at the top of the multi-colored wedge indicates the emissions trajectory under currently adopted policies, or BAU. The green dashed line at the bottom of the wedge shows emissions trajectory with Low-Ambition policies. The wedge shows climate pollutant mitigation potential by strategy area (each strategy is a different color).
Under currently adopted policies, climate pollutant emissions from the transport sector are projected to increase by 45% in 2050, and by 60% in 2060. As shown, under Low-Ambition policy measures, transport sector climate pollutant emissions would decrease only until 2030; these measures are not sufficient to achieve mid- to long-term targets such as reaching a carbon peak for transport in 2030. After 2030, when most of the policies under the Low Ambition scenario will have been implemented, their mitigation impact will no longer offset overall emissions growth, and transport emissions would
13 ICCT REPORT | OPPORTUNITIES TO DECARBONIZE CHINA’S TRANSPORTATION SECTOR
grow to 6% higher than 2020 levels in 2050, and to 16% higher in 2060 (not shown). To conclude, policies in the Low Ambition scenario have moderate near-term climate benefits but are insufficient to achieve mid- and long-term emission reduction targets.
0
1000
2000
3000
4000
5000
6000
7000
2020 2025 2030 2035 2040 2045 2050
New energy vehicles and enginesClean gridE�ciency/CO2 standardsEmission standards/policiesFreight systemsRefrigerantsLow AmbitionAdopted Policies
6%
45%
Wel
l-to
-whe
el C
O2e
(m
illio
n to
nnes
)
Figure 5. WTW climate pollutant (CO2e) emissions (GWP20) under the Adopted Policies scenario and mitigation potential of policies under the Low Ambition scenario, 2020-2050.
Note: Freight systems includes only the impacts from mode shifts and green freight programs, not emission reduction measures in sectors affected by mode shifts.
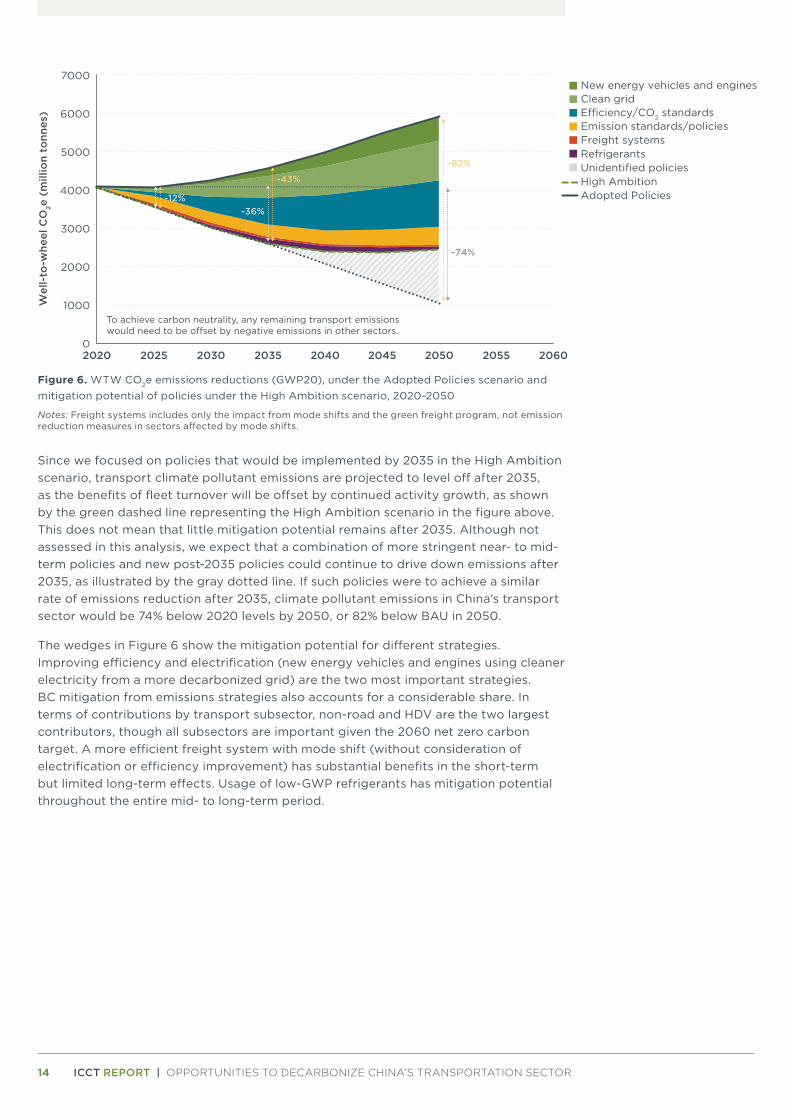
EMISSION REDUCTION POTENTIAL FROM THE HIGH AMBITION SCENARIOFigure 6 shows the WTW climate pollutant (CO2e) emissions mitigation potential of the High Ambition scenario. The solid line at the top of the colored wedges indicates emissions trajectory with only currently adopted policies, or BAU. The green dashed line at the bottom of the colored wedges shows the emissions trajectory with policies under the High Ambition scenario. The wedge shows climate pollutant mitigation potential by strategy area. The gray dotted area illustrates further mitigation that would require the development of additional, as yet unidentified, policies. See Appendix B for a similar figure using GWP100.
Compared to the Low Ambition scenario, policies in the High Ambition scenario, based on world-leading best practices, are expected to reduce emissions of climate pollutants more significantly. At the end of the 14th FYP period in 2025, policies under the High Ambition scenario are projected to reduce climate pollutant emissions by 12% compared to the 2020 baseline, 12% compared to the 2025 BAU, and 6% compared to policies under the Low Ambition scenario. In 2035, high-ambition policies are projected to reduce emissions by 36% compared to the 2020 baseline, 43% compared to the 2035 BAU and 27% compared to low-ambition policies; and in 2050, by 40% compared to the 2020 baseline, 59% compared to the 2050 BAU and 44% compared to low-ambition policies.
14 ICCT REPORT | OPPORTUNITIES TO DECARBONIZE CHINA’S TRANSPORTATION SECTOR
0
1000
2000
3000
4000
5000
6000
7000
2020 2025 2030 2035 2040 2045 2050 2055 2060
Wel
l-to
-whe
el C
O2e
(m
illio
n to
nnes
)
-74%
-82%
-36%
-43%
-12%
New energy vehicles and enginesClean gridE�ciency/CO2 standardsEmission standards/policiesFreight systemsRefrigerants
High AmbitionAdopted Policies
Unidentified policies
To achieve carbon neutrality, any remaining transport emissions would need to be o�set by negative emissions in other sectors.
Figure 6. WTW CO2e emissions reductions (GWP20), under the Adopted Policies scenario and mitigation potential of policies under the High Ambition scenario, 2020-2050
Notes: Freight systems includes only the impact from mode shifts and the green freight program, not emission reduction measures in sectors affected by mode shifts.
Since we focused on policies that would be implemented by 2035 in the High Ambition scenario, transport climate pollutant emissions are projected to level off after 2035, as the benefits of fleet turnover will be offset by continued activity growth, as shown by the green dashed line representing the High Ambition scenario in the figure above. This does not mean that little mitigation potential remains after 2035. Although not assessed in this analysis, we expect that a combination of more stringent near- to mid-term policies and new post-2035 policies could continue to drive down emissions after 2035, as illustrated by the gray dotted line. If such policies were to achieve a similar rate of emissions reduction after 2035, climate pollutant emissions in China’s transport sector would be 74% below 2020 levels by 2050, or 82% below BAU in 2050.
The wedges in Figure 6 show the mitigation potential for different strategies. Improving efficiency and electrification (new energy vehicles and engines using cleaner electricity from a more decarbonized grid) are the two most important strategies. BC mitigation from emissions strategies also accounts for a considerable share. In terms of contributions by transport subsector, non-road and HDV are the two largest contributors, though all subsectors are important given the 2060 net zero carbon target. A more efficient freight system with mode shift (without consideration of electrification or efficiency improvement) has substantial benefits in the short-term but limited long-term effects. Usage of low-GWP refrigerants has mitigation potential throughout the entire mid- to long-term period.
15 ICCT REPORT | OPPORTUNITIES TO DECARBONIZE CHINA’S TRANSPORTATION SECTOR
To achieve carbon neutrality, any remaining transport emissions would need to be o�set by negative emissions in other sectors.
0
500
1000
1500
2000
2500
3000
3500
4000
4500
5000
2020 2025 2030 2035 2040 2045 2050 2055 2060
Unidentified policies-69%
-18%
-37%
-45%
Wel
l-to
-whe
el C
O2
(mill
ion
tonn
es)
New energy vehicles and enginesClean gridE�ciency/CO2 standardsFreight systems
High AmbitionAdopted Policies
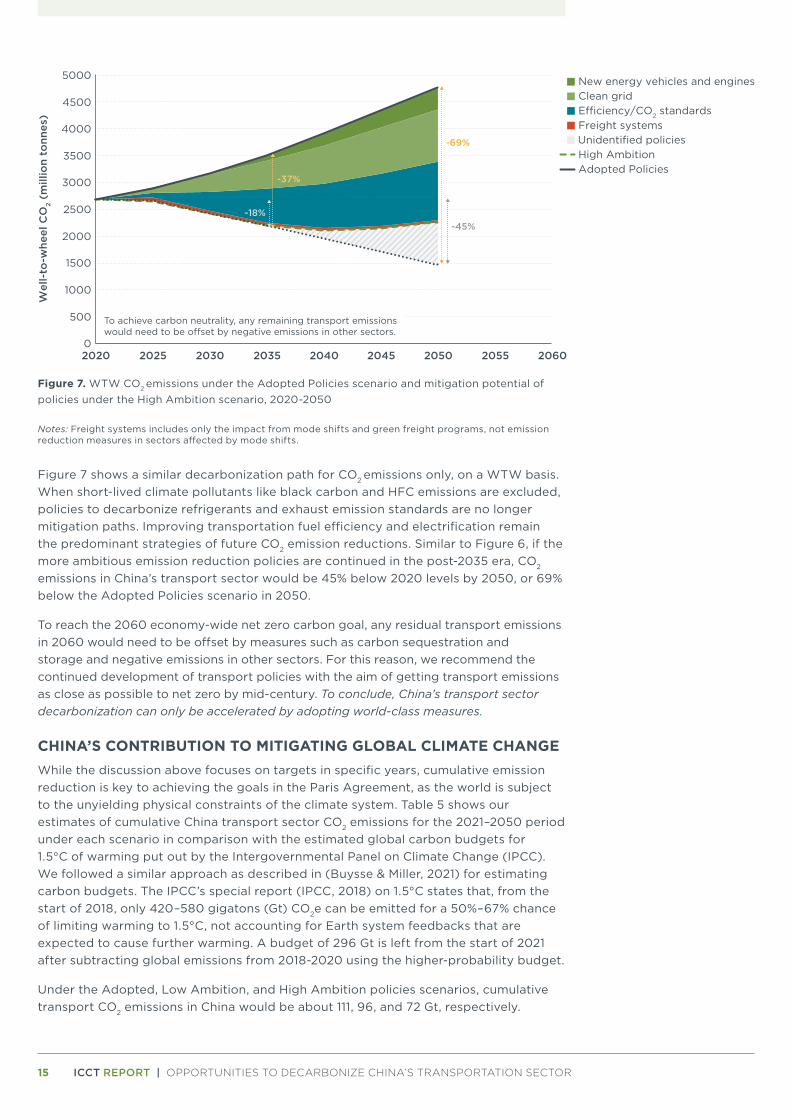
Figure 7. WTW CO2 emissions under the Adopted Policies scenario and mitigation potential of policies under the High Ambition scenario, 2020-2050
Notes: Freight systems includes only the impact from mode shifts and green freight programs, not emission reduction measures in sectors affected by mode shifts.
Figure 7 shows a similar decarbonization path for CO2 emissions only, on a WTW basis. When short-lived climate pollutants like black carbon and HFC emissions are excluded, policies to decarbonize refrigerants and exhaust emission standards are no longer mitigation paths. Improving transportation fuel efficiency and electrification remain the predominant strategies of future CO2 emission reductions. Similar to Figure 6, if the more ambitious emission reduction policies are continued in the post-2035 era, CO2
emissions in China’s transport sector would be 45% below 2020 levels by 2050, or 69% below the Adopted Policies scenario in 2050.
To reach the 2060 economy-wide net zero carbon goal, any residual transport emissions in 2060 would need to be offset by measures such as carbon sequestration and storage and negative emissions in other sectors. For this reason, we recommend the continued development of transport policies with the aim of getting transport emissions as close as possible to net zero by mid-century. To conclude, China’s transport sector decarbonization can only be accelerated by adopting world-class measures.
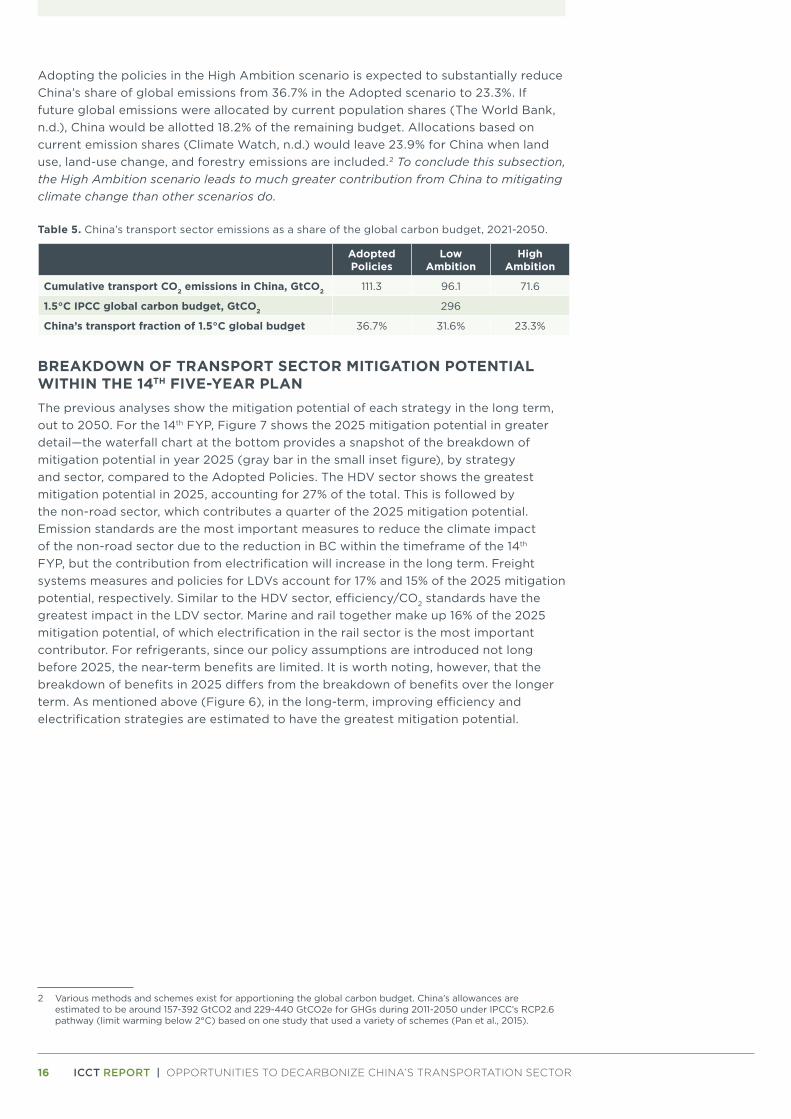
CHINA’S CONTRIBUTION TO MITIGATING GLOBAL CLIMATE CHANGEWhile the discussion above focuses on targets in specific years, cumulative emission reduction is key to achieving the goals in the Paris Agreement, as the world is subject to the unyielding physical constraints of the climate system. Table 5 shows our estimates of cumulative China transport sector CO2 emissions for the 2021–2050 period under each scenario in comparison with the estimated global carbon budgets for 1.5°C of warming put out by the Intergovernmental Panel on Climate Change (IPCC). We followed a similar approach as described in (Buysse & Miller, 2021) for estimating carbon budgets. The IPCC’s special report (IPCC, 2018) on 1.5°C states that, from the start of 2018, only 420–580 gigatons (Gt) CO2e can be emitted for a 50%–67% chance of limiting warming to 1.5°C, not accounting for Earth system feedbacks that are expected to cause further warming. A budget of 296 Gt is left from the start of 2021 after subtracting global emissions from 2018-2020 using the higher-probability budget.
Under the Adopted, Low Ambition, and High Ambition policies scenarios, cumulative transport CO2 emissions in China would be about 111, 96, and 72 Gt, respectively.
16 ICCT REPORT | OPPORTUNITIES TO DECARBONIZE CHINA’S TRANSPORTATION SECTOR
Adopting the policies in the High Ambition scenario is expected to substantially reduce China’s share of global emissions from 36.7% in the Adopted scenario to 23.3%. If future global emissions were allocated by current population shares (The World Bank, n.d.), China would be allotted 18.2% of the remaining budget. Allocations based on current emission shares (Climate Watch, n.d.) would leave 23.9% for China when land use, land-use change, and forestry emissions are included.2 To conclude this subsection, the High Ambition scenario leads to much greater contribution from China to mitigating climate change than other scenarios do.
Table 5. China’s transport sector emissions as a share of the global carbon budget, 2021-2050.
Adopted Policies
Low Ambition
High Ambition
Cumulative transport CO2 emissions in China, GtCO2 111.3 96.1 71.6
1.5°C IPCC global carbon budget, GtCO2 296
China’s transport fraction of 1.5°C global budget 36.7% 31.6% 23.3%
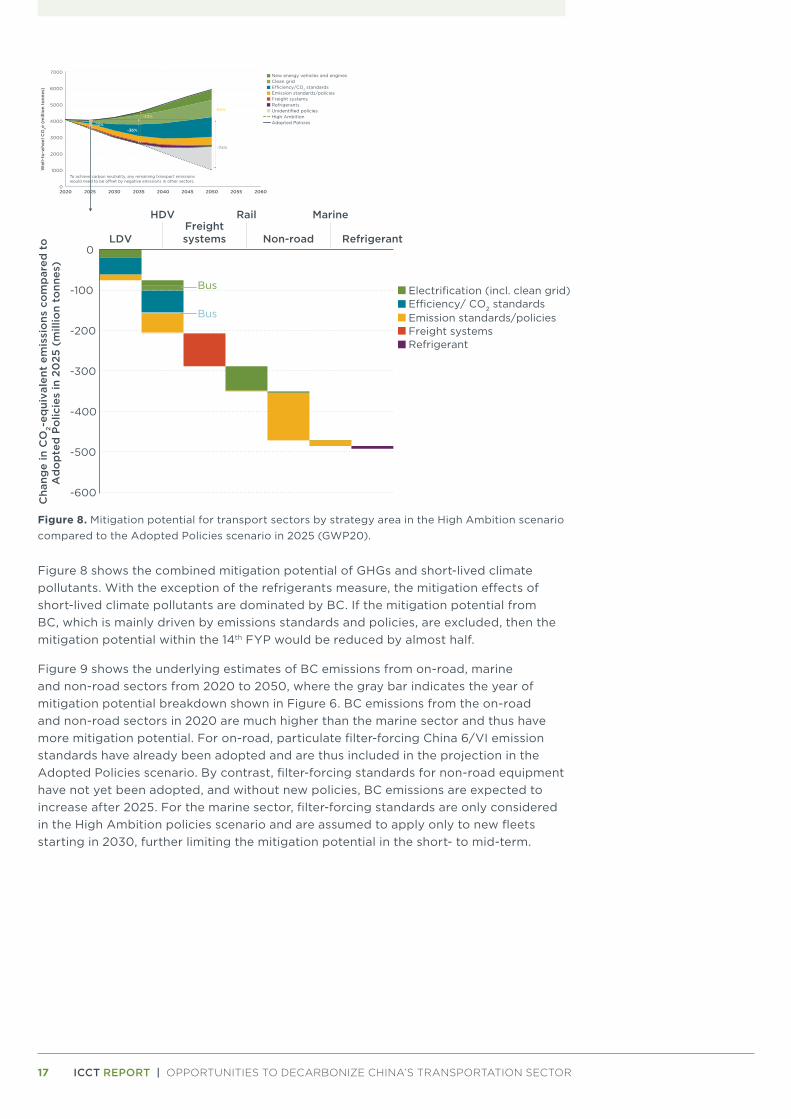
BREAKDOWN OF TRANSPORT SECTOR MITIGATION POTENTIAL WITHIN THE 14TH FIVE-YEAR PLANThe previous analyses show the mitigation potential of each strategy in the long term, out to 2050. For the 14th FYP, Figure 7 shows the 2025 mitigation potential in greater detail—the waterfall chart at the bottom provides a snapshot of the breakdown of mitigation potential in year 2025 (gray bar in the small inset figure), by strategy and sector, compared to the Adopted Policies. The HDV sector shows the greatest mitigation potential in 2025, accounting for 27% of the total. This is followed by the non-road sector, which contributes a quarter of the 2025 mitigation potential. Emission standards are the most important measures to reduce the climate impact of the non-road sector due to the reduction in BC within the timeframe of the 14th FYP, but the contribution from electrification will increase in the long term. Freight systems measures and policies for LDVs account for 17% and 15% of the 2025 mitigation potential, respectively. Similar to the HDV sector, efficiency/CO2 standards have the greatest impact in the LDV sector. Marine and rail together make up 16% of the 2025 mitigation potential, of which electrification in the rail sector is the most important contributor. For refrigerants, since our policy assumptions are introduced not long before 2025, the near-term benefits are limited. It is worth noting, however, that the breakdown of benefits in 2025 differs from the breakdown of benefits over the longer term. As mentioned above (Figure 6), in the long-term, improving efficiency and electrification strategies are estimated to have the greatest mitigation potential.
2 Various methods and schemes exist for apportioning the global carbon budget. China’s allowances are estimated to be around 157-392 GtCO2 and 229-440 GtCO2e for GHGs during 2011-2050 under IPCC’s RCP2.6 pathway (limit warming below 2°C) based on one study that used a variety of schemes (Pan et al., 2015).
17 ICCT REPORT | OPPORTUNITIES TO DECARBONIZE CHINA’S TRANSPORTATION SECTOR
-600
-500
-400
-300
-200
-100
0LDV
HDVFreightsystems
Rail
Non-road
Marine
Refrigerant
Cha
nge
in C
O2-
equi
vale
nt e
mis
sio
ns c
om
par
ed t
oA
do
pte
d P
olic
ies
in 2
025
(m
illio
n to
nnes
)
Electrification (incl. clean grid)E�ciency/ CO2 standardsEmission standards/policiesFreight systemsRefrigerant
Bus
Bus
0
1000
2000
3000
4000
5000
6000
7000
2020 2025 2030 2035 2040 2045 2050 2055 2060
Wel
l-to
-whe
el C
O2e
(m
illio
n to
nnes
)
-74%
-82%
-36%
-43%
-12%
New energy vehicles and enginesClean gridE�ciency/CO2 standardsEmission standards/policiesFreight systemsRefrigerants
High AmbitionAdopted Policies
Unidentified policies
To achieve carbon neutrality, any remaining transport emissions would need to be o�set by negative emissions in other sectors.
Figure 8. Mitigation potential for transport sectors by strategy area in the High Ambition scenario compared to the Adopted Policies scenario in 2025 (GWP20).
Figure 8 shows the combined mitigation potential of GHGs and short-lived climate pollutants. With the exception of the refrigerants measure, the mitigation effects of short-lived climate pollutants are dominated by BC. If the mitigation potential from BC, which is mainly driven by emissions standards and policies, are excluded, then the mitigation potential within the 14th FYP would be reduced by almost half.
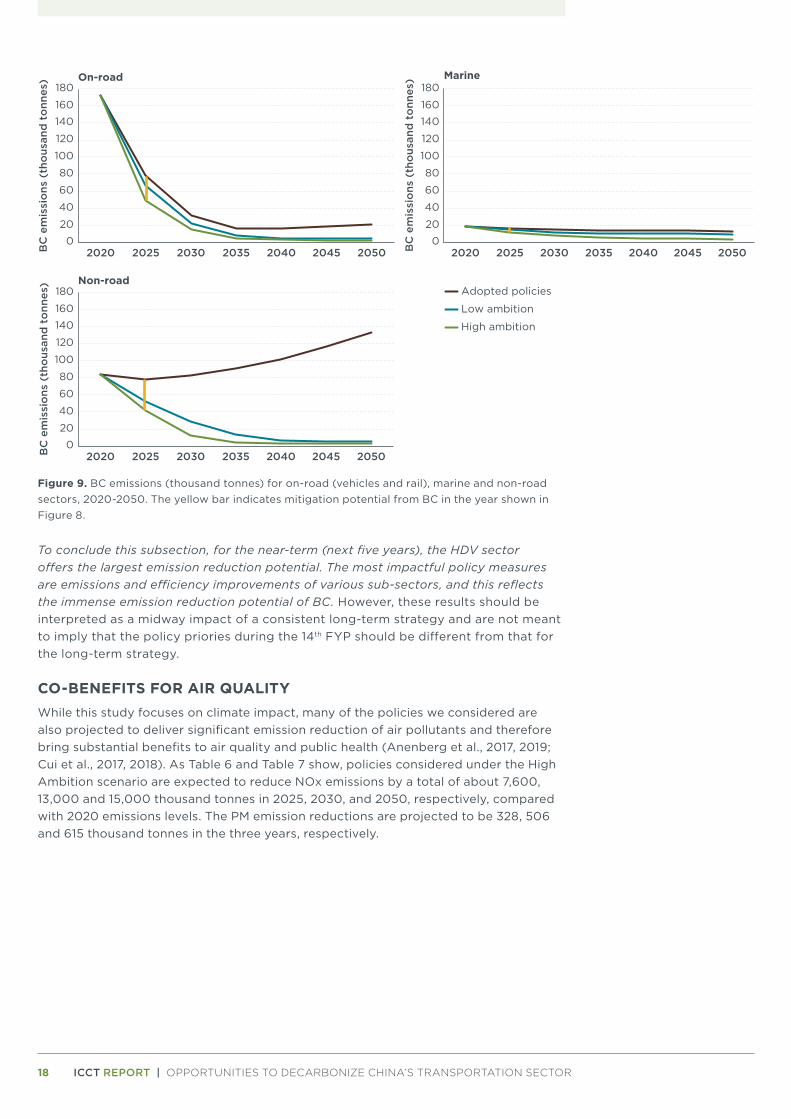
Figure 9 shows the underlying estimates of BC emissions from on-road, marine and non-road sectors from 2020 to 2050, where the gray bar indicates the year of mitigation potential breakdown shown in Figure 6. BC emissions from the on-road and non-road sectors in 2020 are much higher than the marine sector and thus have more mitigation potential. For on-road, particulate filter-forcing China 6/VI emission standards have already been adopted and are thus included in the projection in the Adopted Policies scenario. By contrast, filter-forcing standards for non-road equipment have not yet been adopted, and without new policies, BC emissions are expected to increase after 2025. For the marine sector, filter-forcing standards are only considered in the High Ambition policies scenario and are assumed to apply only to new fleets starting in 2030, further limiting the mitigation potential in the short- to mid-term.
18 ICCT REPORT | OPPORTUNITIES TO DECARBONIZE CHINA’S TRANSPORTATION SECTOR
0
20
40
60
80
100
120
140
160
180
2020 2025 2030 2035 2040 2045 2050BC
em
issi
ons
(th
ous
and
to
nnes
) Marine
0
20
40
60
80
100
120
140
160
180
2020 2025 2030 2035 2040 2045 2050BC
em
issi
ons
(th
ous
and
to
nnes
) Non-road
0
20
40
60
80
100
120
140
160
180
2020 2025 2030 2035 2040 2045 2050BC
em
issi
ons
(th
ous
and
to
nnes
) On-road
Adopted policies
Low ambition
High ambition
Figure 9. BC emissions (thousand tonnes) for on-road (vehicles and rail), marine and non-road sectors, 2020-2050. The yellow bar indicates mitigation potential from BC in the year shown in Figure 8.
To conclude this subsection, for the near-term (next five years), the HDV sector offers the largest emission reduction potential. The most impactful policy measures are emissions and efficiency improvements of various sub-sectors, and this reflects the immense emission reduction potential of BC. However, these results should be interpreted as a midway impact of a consistent long-term strategy and are not meant to imply that the policy priories during the 14th FYP should be different from that for the long-term strategy.
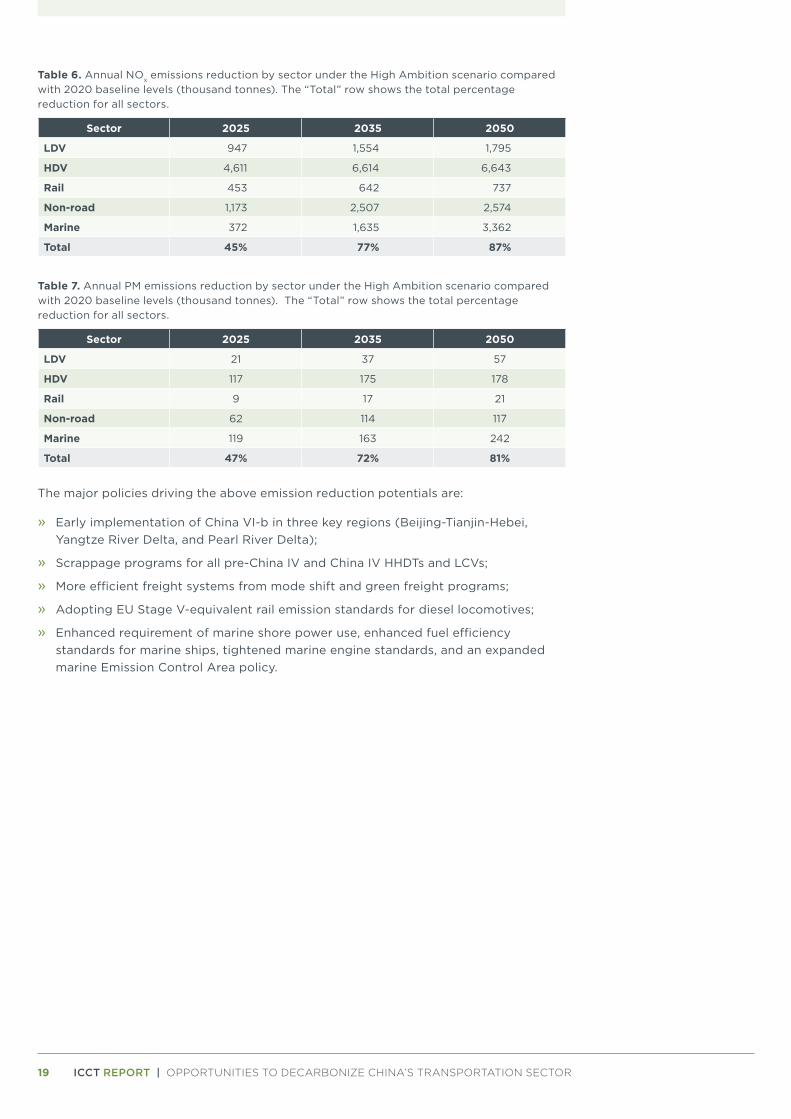
CO-BENEFITS FOR AIR QUALITYWhile this study focuses on climate impact, many of the policies we considered are also projected to deliver significant emission reduction of air pollutants and therefore bring substantial benefits to air quality and public health (Anenberg et al., 2017, 2019; Cui et al., 2017, 2018). As Table 6 and Table 7 show, policies considered under the High Ambition scenario are expected to reduce NOx emissions by a total of about 7,600, 13,000 and 15,000 thousand tonnes in 2025, 2030, and 2050, respectively, compared with 2020 emissions levels. The PM emission reductions are projected to be 328, 506 and 615 thousand tonnes in the three years, respectively.
19 ICCT REPORT | OPPORTUNITIES TO DECARBONIZE CHINA’S TRANSPORTATION SECTOR
Table 6. Annual NOx emissions reduction by sector under the High Ambition scenario compared with 2020 baseline levels (thousand tonnes). The “Total” row shows the total percentage reduction for all sectors.
Sector 2025 2035 2050
LDV 947 1,554 1,795
HDV 4,611 6,614 6,643
Rail 453 642 737
Non-road 1,173 2,507 2,574
Marine 372 1,635 3,362
Total 45% 77% 87%
Table 7. Annual PM emissions reduction by sector under the High Ambition scenario compared with 2020 baseline levels (thousand tonnes). The “Total” row shows the total percentage reduction for all sectors.
Sector 2025 2035 2050
LDV 21 37 57
HDV 117 175 178
Rail 9 17 21
Non-road 62 114 117
Marine 119 163 242
Total 47% 72% 81%
The major policies driving the above emission reduction potentials are:
» Early implementation of China VI-b in three key regions (Beijing-Tianjin-Hebei, Yangtze River Delta, and Pearl River Delta);
» Scrappage programs for all pre-China IV and China IV HHDTs and LCVs;
» More efficient freight systems from mode shift and green freight programs;
» Adopting EU Stage V-equivalent rail emission standards for diesel locomotives;
» Enhanced requirement of marine shore power use, enhanced fuel efficiency standards for marine ships, tightened marine engine standards, and an expanded marine Emission Control Area policy.
20 ICCT REPORT | OPPORTUNITIES TO DECARBONIZE CHINA’S TRANSPORTATION SECTOR
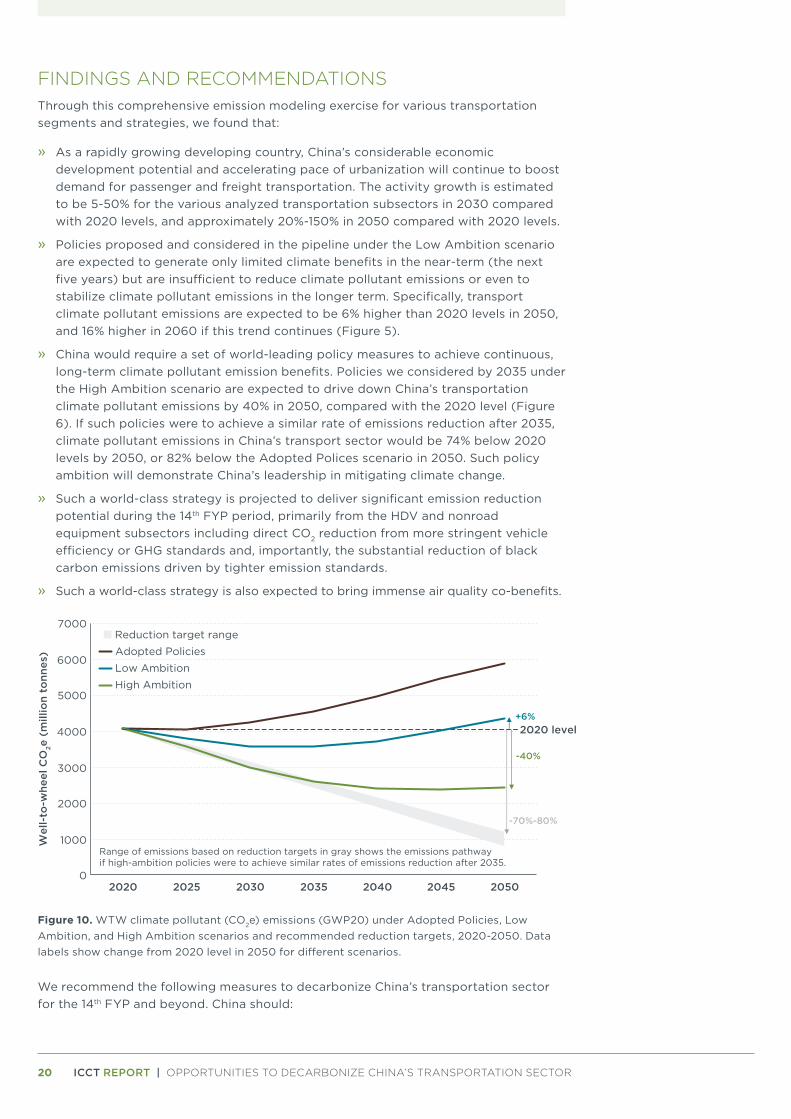
FINDINGS AND RECOMMENDATIONS Through this comprehensive emission modeling exercise for various transportation segments and strategies, we found that:
» As a rapidly growing developing country, China’s considerable economic development potential and accelerating pace of urbanization will continue to boost demand for passenger and freight transportation. The activity growth is estimated to be 5-50% for the various analyzed transportation subsectors in 2030 compared with 2020 levels, and approximately 20%-150% in 2050 compared with 2020 levels.
» Policies proposed and considered in the pipeline under the Low Ambition scenario are expected to generate only limited climate benefits in the near-term (the next five years) but are insufficient to reduce climate pollutant emissions or even to stabilize climate pollutant emissions in the longer term. Specifically, transport climate pollutant emissions are expected to be 6% higher than 2020 levels in 2050, and 16% higher in 2060 if this trend continues (Figure 5).
» China would require a set of world-leading policy measures to achieve continuous, long-term climate pollutant emission benefits. Policies we considered by 2035 under the High Ambition scenario are expected to drive down China’s transportation climate pollutant emissions by 40% in 2050, compared with the 2020 level (Figure 6). If such policies were to achieve a similar rate of emissions reduction after 2035, climate pollutant emissions in China’s transport sector would be 74% below 2020 levels by 2050, or 82% below the Adopted Polices scenario in 2050. Such policy ambition will demonstrate China’s leadership in mitigating climate change.
» Such a world-class strategy is projected to deliver significant emission reduction potential during the 14th FYP period, primarily from the HDV and nonroad equipment subsectors including direct CO2 reduction from more stringent vehicle efficiency or GHG standards and, importantly, the substantial reduction of black carbon emissions driven by tighter emission standards.
» Such a world-class strategy is also expected to bring immense air quality co-benefits.
0
1000
2000
3000
4000
5000
6000
7000
2020 2025 2030 2035 2040 2045 2050
Wel
l-to
-whe
el C
O2e
(m
illio
n to
nnes
)
Reduction target range
Adopted Policies
Low Ambition
High Ambition
Range of emissions based on reduction targets in gray shows the emissions pathway if high-ambition policies were to achieve similar rates of emissions reduction after 2035.
-40%
2020 level+6%
-70%-80%
Figure 10. WTW climate pollutant (CO2e) emissions (GWP20) under Adopted Policies, Low Ambition, and High Ambition scenarios and recommended reduction targets, 2020-2050. Data labels show change from 2020 level in 2050 for different scenarios.
We recommend the following measures to decarbonize China’s transportation sector for the 14th FYP and beyond. China should:
21 ICCT REPORT | OPPORTUNITIES TO DECARBONIZE CHINA’S TRANSPORTATION SECTOR
» Take a holistic approach in combating climate change and introduce strategies and policies that reduce both CO2 and non-CO2 pollutants, the latter including methane, nitrous oxide, fluorinated gases, and black carbon. This approach will also bring significant co-benefits in terms of local air quality and public health.
» Establish its near-term and mid-term GHG or climate pollutant emission targets for transportation based on long-term goals required to bring the economy-wide carbon emissions to net zero in 2060. We especially recommend that China consider an ambitious climate pollutant reduction target for the transportation sector in 2050, such as the 70%-80% (compared to 2020 level) reduction that is supported by our analysis. In comparison, the EU Green Deal has a non-binding target to reduce transport sector emissions by 90% compared to 1990 levels by 2050. Then, for the mid-term, China could develop direct CO2 or GHG emission regulations for various transportation subsectors to meet that long-term goal, similar to EU’s planned revisions to CO2 emission standards for passenger cars, vans and heavy-duty vehicles to support achieving the revised (strengthened) 2030 economy-wide GHG reduction target of at least 50% below 1990 levels.
» Formulate comprehensive policy toolkits to achieve these transport sector emission reductions, including but not limited to the following:
» Establish GHG standards for on-road, marine and non-road sectors, and include enforcement provisions or penalties, aligning with international best practices in this realm.
» Establish zero-emission vehicle requirements for various transportation segments (e.g., LDV, HDV) and fleets (e.g., public transport, government fleets, taxies and rentals, logistic vehicles, port drayage trucks etc.), and promote zero-emission vehicle production through emission and GHG standards as well as fiscal and other supportive policies. Further accelerate the adoption of zero-emission vehicles and engines by setting low- and zero-emission zones in cities, ports, and logistics parks.
» Introduce next-phase on-road, marine, and non-road emissions standards as soon as possible and ensure compliance with adopted standards to reduce BC emissions to a near-zero level.
» In vehicle emission or GHG emission standards, include limits on high-GWP refrigerants, or set a phaseout timeline for the production of high-GWP refrigerants, and aim to use low-GWP (e.g., GWP<100) refrigerants in all new vehicles by 2022.
» Optimize transport system structures, and research and set carbon intensity targets for passenger and freight transport (e.g., a specified reduction in CO2 per tonne-km), and adopt relevant policies.
22 ICCT REPORT | OPPORTUNITIES TO DECARBONIZE CHINA’S TRANSPORTATION SECTOR
REFERENCESAnenberg, S. C., Miller, J., Henze, D., & Minjares, R. (2019). A global snapshot of the air pollution-
related health impacts of transportation sector emissions in 2010 and 2015. International Council on Clean Transportation. https://theicct.org/publications/health-impacts-transport-emissions-2010-2015
Anenberg, S. C., Miller, J., Minjares, R., Du, L., Henze, D. K., Lacey, F., Malley, C. S., Emberson, L., Franco, V., Klimont, Z., & Heyes, C. (2017). Impacts and mitigation of excess diesel-related NOx emissions in 11 major vehicle markets. Nature, 545(7655), 467–471. https://doi.org/10.1038/nature22086
Baldino, C., O’Malley, J., Searle, S., Zhou, Y., & Christensen, A. (2020). Hydrogen for heating? Decarbonization options for households in the United Kingdom in 2050. International Council on Clean Transportation. https://theicct.org/publications/hydrogen-heating-UK-dec2020
Beijing Municipal Bureau of Ecology and Environment. (2019, December 13). Notice of Beijing Municipal Bureau of Ecology and Environment on Matters Concerning the Implementation of China VI Motor Vehicle Emission Standards. http://sthjj.beijing.gov.cn/bjhrb/index/xxgk69/zfxxgk43/fdzdgknr2/shbjgfxwj/1748263/index.html
Bieker, G. (2021). A global comparison of the life-cycle greenhouse gas emissions of combustion engine and electric passenger cars. International Council on Clean Transportation. https://theicct.org/publications/global-LCA-passenger-cars-jul2021
Blumberg, K., & Isenstadt, A. (2019). Mobile air conditioning: The life-cycle costs and greenhouse-gas benefits of switching to alternative refrigerants and improving system efficiencies. International Council on Clean Transportation. https://theicct.org/publications/mobile-air-conditioning-cbe-20190308
Buysse, C., & Miller, J. (2021, April 9). Transport could burn up the EU’s entire carbon budget. ICCT Staff Blog. https://theicct.org/blog/staff/eu-carbon-budget-apr2021
Buysse, C., Miller, J., Díaz, S., Sen, A., & Braun, C. (2021). The role of the European Union’s vehicle CO2 standards in achieving the European Green Deal. International Council on Clean Transportation. https://theicct.org/publications/eu-vehicle-standards-green-deal-mar21
California Air Resources Board. (2018, March). Cargo handling equipment regulation to transition to zero-emissions. https://ww2.arb.ca.gov/resources/documents/cargo-handling-equipment-regulation-transition-zero-emissions
CARB. (2020). Advanced Clean Trucks | California Air Resources Board. https://ww2.arb.ca.gov/our-work/programs/advanced-clean-trucks
China Society of Automotive Engineers. (2020). Energy-saving and new energy vehicle technology roadmap 2.0. China Society of Automotive Engineers. http://www.sae-china.org/news/society/202010/3957.html
China State Council. (2018, June 27). Three-year Action Plan on Winning the Battle for Blue Sky—国务院关于印发打赢蓝天保卫战三年行动计划的通知(国发〔2018〕22号. http://www.gov.cn/zhengce/content/2018-07/03/content_5303158.htm
City of London. (2020). London’s “Low Emission Zone” for Non-road mobile machinery. https://www.london.gov.uk/what-we-do/environment/pollution-and-air-quality/nrmm
Civil Aviation Administration of the People’s Republic of China. (2020). Civil aviation industry statistics, 2019. https://www.mot.gov.cn/tongjishuju/minhang/202006/P020200702602086869690.pdf
Climate Watch. (n.d.). Historical GHG Emissions. Retrieved April 7, 2021, from https://www.climatewatchdata.org/data-explorer/historical-emissions?historical-emissions-data-sources=cait&historical-emissions-gases=all-ghg&historical-emissions-regions=All%20Selected&historical-emissions-sectors=total-including-lucf%2Ctotal-excluding-lucf&page=1
Comer, B., Olmer, N., Mao, X., Roy, B., & Rutherford, D. (2017). Black carbon emissions and fuel use in global shipping, 2015. International Council on Clean Transportation. https://theicct.org/publications/black-carbon-emissions-global-shipping-2015
Cui, H. (2018). China’s New Energy Vehicle mandate policy (final rule). International Council on Clean Transportation. https://theicct.org/publications/china-nev-mandate-final-policy-update-20180111
Cui, H., Minjares, R., Posada, F., Blumberg, K., Jin, L., He, H., Shao, Z., & Peng, L. (2017). Cost-benefit assessment of proposed China 6 emission standard for new light-duty vehicles. International Council on Clean Transportation. https://theicct.org/publications/cost-benefit-assessment-proposed-china-6-emission-standard-new-light-duty-vehicles
Cui, H., Posada, F., Lv, Z., Shao, Z., Yang, L., & Liu, H. (2018). Cost-benefit assessment of the China VI emission standard for new heavy-duty vehicles. International Council on Clean Transportation. https://theicct.org/publications/china-vi-cost-benefit-assessment
Delgado, O. (2016). Stage 3 China fuel consumption standard for commercial heavy-duty vehicles. International Council on Clean Transportation. https://theicct.org/publications/stage-3-china-fuel-consumption-standard-commercial-heavy-duty-vehicles
23 ICCT REPORT | OPPORTUNITIES TO DECARBONIZE CHINA’S TRANSPORTATION SECTOR
Delgado, O., & Li, H. (2017). Market analysis and fuel efficiency technology potential of heavy-duty vehicles in China. International Council on Clean Transportation. https://theicct.org/publications/HDV-china-mkt-analysis-and-fuel-efficiency-tech-potential
Du, L., Meszler, D., & Minjares, R. (2016). HFC-134a phase-out in the Chinese light-duty motor vehicle sector. International Council on Clean Transportation. https://theicct.org/publications/hfc-134a-phase-out-chinese-light-duty-motor-vehicle-sector
Energy Foundation. (2019, March). Experts agree International Emission Control Area is the future. https://www.efchina.org/News-en/Program-Updates-en/programupdate-20190313-en?set_language=en
Graver, B., Rutherford, D., & Zheng, S. (2020). CO2 emissions from commercial aviation: 2013, 2018, and 2019. International Council on Clean Transportation. https://theicct.org/publications/co2-emissions-commercial-aviation-2020
Hainan Provincial People’s Government. (2019, July 18). Clean Vehicle Roadmap, Hainan. https://www.hainan.gov.cn/hainan/xnyzcwj/201907/cb9368c30a0f42e7a4cae7dad6651a09.shtml
Hon, G., & Wang, H. (2011). The Energy Efficiency Design Index (EEDI) for New Ships. International Council on Clean Transportation. https://theicct.org/publications/energy-efficiency-design-index-eedi-new-ships
Hydrogen Council. (2021). Hydrogen decarbonization pathways. Hydrogen Council. https://hydrogencouncil.com/wp-content/uploads/2021/01/Hydrogen-Council-Report_Decarbonization-Pathways_Part-1-Lifecycle-Assessment.pdf
Instagrid. (n.d.). Emission free construction is possible: 3 European cities leading the way. https://instagrid.co/emission-free-construction-is-possible-3-european-cities-leading-the-way
IPCC. (2018). Global Warming of 1.5°C. An IPCC Special Report on the impacts of global warming of 1.5°C above pre-industrial levels and related global greenhouse gas emission pathways, in the context of strengthening the global response to the threat of climate change, sustainable development, and efforts to eradicate poverty. https://www.ipcc.ch/sr15/
Mao, X. (2017). Marine engine emission standards for China’s domestic vessels. International Council on Clean Transportation. https://theicct.org/publications/marine-engine-emission-standards-chinas-domestic-vessels
Mao, X. (2019). Action plan for establishing China’s national emission control area. International Council on Clean Transportation. https://theicct.org/publications/action-plan-establishing-chinas-national-emission-control-area
Mao, X., Chen, C., Comer, B., & Rutherford, D. (2019). Costs and benefits of a Pearl River Delta Emission Control Area. International Council on Clean Transportation. https://theicct.org/publications/pearl-river-delta-eca-201907
Mao, X., & Rutherford, D. (2018). NOx emissions from merchant vessels in coastal China: 2015 and 2030. International Council on Clean Transportation. https://theicct.org/publications/nox-emissions-merchant-vessels-coastal-china-2015-and-2030
Ministry of Ecology and Environment of the People’s Republic of China. (2016a, January 15). Announcement on the implementation of the third phase of the national emission standards for diesel engine exhaust pollutants for non-road mobile machinery. https://www.mee.gov.cn/gkml/hbb/bgg/201601/t20160118_326597.htm
Ministry of Ecology and Environment of the People’s Republic of China. (2016b, August). Limits and measurement methods for exhaust pollutants from marine engines (CHINAⅠ, Ⅱ). https://www.mee.gov.cn/ywgz/fgbz/bz/bzwb/dqhjbh/dqydywrwpfbz/201608/t20160830_363272.shtml
Ministry of Ecology and Environment of the People’s Republic of China. (2018). Emissions control technical requirements of non-road mobile machinery and diesel engine (draft for comments). https://www.mee.gov.cn/gkml/hbb/bgth/201802/W020180224617239875247.pdf
Ministry of Ecology and Environment of the People’s Republic of China. (2019). Clean Diesel Action Plan. https://www.mee.gov.cn/xxgk2018/xxgk/xxgk03/201901/W020190104656772362578.pdf
Ministry of Ecology and Environment of the People’s Republic of China. (2020). Emissions control technical requirements of non-road mobile machinery and diesel engine. http://www.mee.gov.cn/ywgz/fgbz/bz/bzwb/dqhjbh/dqydywrwpfbz/202012/t20201231_815684.shtml
Ministry of Industry and Information Technology of the People’s Republic of China. (2019, December 31). Fuel consumption evaluation methods and targets for passenger cars. http://std.samr.gov.cn/gb/search/gbDetailed?id=9B70DDA94012A80CE05397BE0A0A84AC
Ministry of Industry and Information Technology of the People’s Republic of China. (2020, March 18). Promoting electrification of public transportation. http://www.gov.cn/xinwen/2020-03/18/content_5492601.htm
Ministry of Transport of People’s Republic of China. (2018). Implementation Scheme of the Domestic Emission Control Areas for Atmospheric Pollution from Vessels. https://www.msa.gov.cn/public/documents/document/mtex/mzm1/~edisp/20181219111335546.pdf
24 ICCT REPORT | OPPORTUNITIES TO DECARBONIZE CHINA’S TRANSPORTATION SECTOR
Ministry of Transport of People’s Republic of China. (2020, July 23). Green Mobility Action Plan. http://www.gov.cn/zhengce/zhengceku/2020-07/26/content_5530095.htm
National Railway Administration of the People’s Republic of China (2016). Rail statistics report, 2015. http://www.nra.gov.cn/xwzx/zlzx/hytj/201603/t20160303_21466.shtml
Ministry of Transport of the People’s Republic of China. (2021). Rail statistics report, 2020. https://www.mot.gov.cn/tongjishuju/tielu/202104/t20210419_3573713.html
Myhre, G., Shindell, D., Breon, F.-M., Collins, W., Fuglestvedt, J., Huang, J., Koch, D., Lamarque, J.-F., Lee, D., Mendoza, B., Nakajima, T., Robock, A., Stephens, G., Takemura, T., & Zhang, H. (2013). Anthropogenic and Natural Radiative Forcing. In: Climate Change 2013: The Physical Science Basis. Contribution of Working Group I to the Fifth Assessment Report of the Intergovernmental Panel on Climate Change. Cambridge University Press
National Development and Reform Commission of the People’s Republic of China. (2016). The Thirteenth Five-Year Plan for Electric Power Development (2016-2020). http://www.gov.cn/xinwen/2016-12/22/5151549/files/696e98c57ecd49c289968ae2d77ed583.pdf
National Development and Reform Commission of the People’s Republic of China. (2017). The Thirteenth Five-Year Plan for rail. https://www.ndrc.gov.cn/xxgk/zcfb/ghwb/201711/W020190905497942227465.pdf
Olmer, N., Comer, B., Roy, B., Mao, X., & Rutherford, D. (2017). Greenhouse gas emissions from global shipping, 2013–2015: Detailed methodology. https://theicct.org/publications/GHG-emissions-global-shipping-2013-2015
Pan, X., Teng, F., Tian, Y., & Wang, G. (2015). Countries’ emission allowances towards the low-carbon world: A consistent study. Applied Energy, 155, 218–228. https://doi.org/10.1016/j.apenergy.2015.06.011
Rodríguez, F., & Posada, F. (2019). Future heavy-duty emission standards: An opportunity for international harmonization. International Council on Clean Transportation. https://theicct.org/publications/future-hdv-standards-harmonization
Shanghai Municipal Bureau of Econoly and Environment. (2020, March 26). Notice of Shanghai Municipal Bureau of Ecology and Environment on Printing and Distributing the Shanghai 2020 Work Plan for Air Pollution Prevention and Control. https://sthj.sh.gov.cn/hbzhywpt6030/hbzhywpt1041/20200723/ca309cc7e3ad4c76aa9eab3e39b2a68a.html
Shao, Z., & Wagner, V. (2015). Costs and benefits of motor vehicle emission control programs in China. International Council on Clean Transportation. https://theicct.org/publications/costs-and-benefits-motor-vehicle-emission-control-programs-china
Standardization Administration of the People’s Republic of China. (2016, January 20). Updated Light Commerical Vehicle Fuel Consumption Limits standard will go into effect in 2018. http://www.gov.cn/xinwen/2016-01/20/content_5034692.htm
State Council of the People’s Republic of China. (2021). Shaoyong Liu, member of the National Committee of the Chinese People’s Political Consultative Conference: It is recommended to formulate a plan for China’s civil aviation industry to achieve carbon peaks in 2030 and carbon neutrality by 2060; fully support the operation of domestically produced civil aircraft. http://www.sasac.gov.cn/n4470048/n16518962/n17286213/n17286228/c17431737/content.html
The World Bank. (n.d.). Population, total | Data. Retrieved February 9, 2021, from https://data.worldbank.org/indicator/SP.POP.TOTL?end=2019&start=2019&view=bar
UNCLOS. (1994). United Nations Convention on the Law of the Sea (p. 208). https://www.un.org/Depts/los/index.htm
UNEP. (2016). The Kigali Amendment to the Montreal Protocol: HFC phase-down. United Nations Environment Programme. https://wedocs.unep.org/handle/20.500.11822/26589
Xinhua News Agency. (2020, July 22). MIIT listened to opinions on the action plan to promote electrification of public transportation. https://www.sohu.com/a/408989325_162758
Yang, Z., & Yang, L. (2018). Evaluation of real-world fuel consumption of light-duty vehicles in China. International Council on Clean Transportation. https://theicct.org/publications/real_world_fuel_consumption_ldv_China
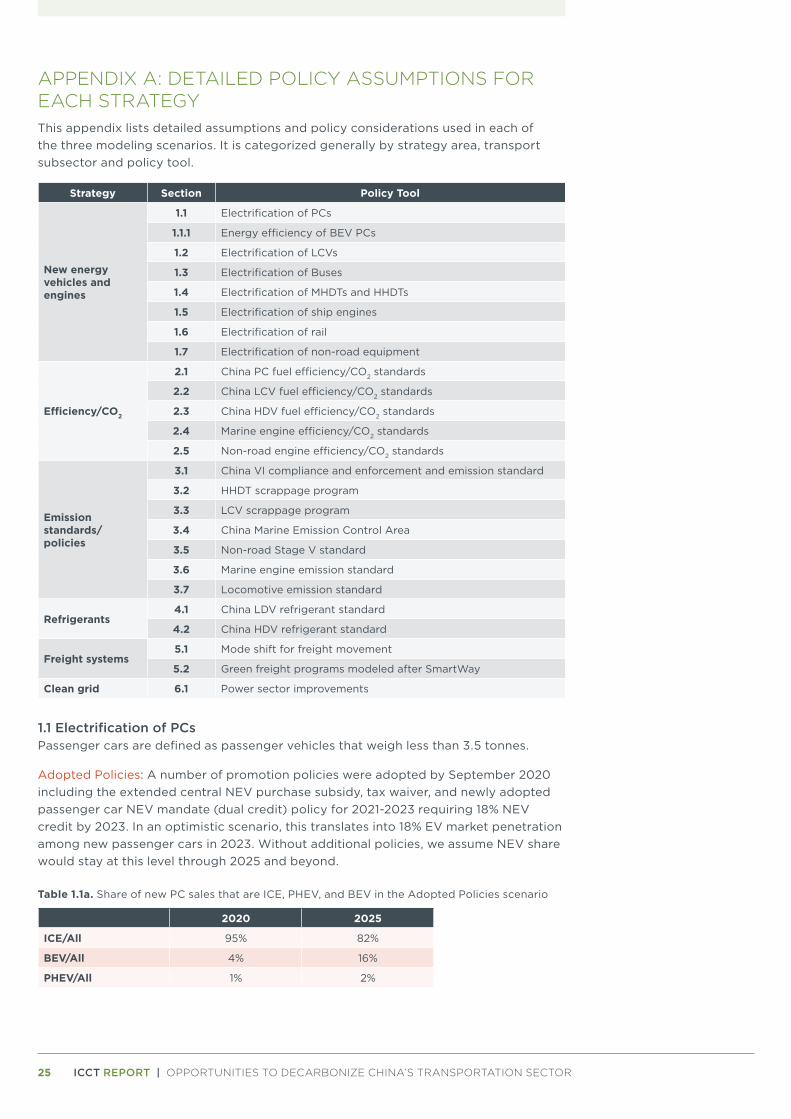
25 ICCT REPORT | OPPORTUNITIES TO DECARBONIZE CHINA’S TRANSPORTATION SECTOR
APPENDIX A: DETAILED POLICY ASSUMPTIONS FOR EACH STRATEGY This appendix lists detailed assumptions and policy considerations used in each of the three modeling scenarios. It is categorized generally by strategy area, transport subsector and policy tool.
Strategy Section Policy Tool
New energy vehicles and engines
1.1 Electrification of PCs
1.1.1 Energy efficiency of BEV PCs
1.2 Electrification of LCVs
1.3 Electrification of Buses
1.4 Electrification of MHDTs and HHDTs
1.5 Electrification of ship engines
1.6 Electrification of rail
1.7 Electrification of non-road equipment
Efficiency/CO2
2.1 China PC fuel efficiency/CO2 standards
2.2 China LCV fuel efficiency/CO2 standards
2.3 China HDV fuel efficiency/CO2 standards
2.4 Marine engine efficiency/CO2 standards
2.5 Non-road engine efficiency/CO2 standards
Emission standards/policies
3.1 China VI compliance and enforcement and emission standard
3.2 HHDT scrappage program
3.3 LCV scrappage program
3.4 China Marine Emission Control Area
3.5 Non-road Stage V standard
3.6 Marine engine emission standard
3.7 Locomotive emission standard
Refrigerants4.1 China LDV refrigerant standard
4.2 China HDV refrigerant standard
Freight systems5.1 Mode shift for freight movement
5.2 Green freight programs modeled after SmartWay
Clean grid 6.1 Power sector improvements
1.1 Electrification of PCsPassenger cars are defined as passenger vehicles that weigh less than 3.5 tonnes.
Adopted Policies: A number of promotion policies were adopted by September 2020 including the extended central NEV purchase subsidy, tax waiver, and newly adopted passenger car NEV mandate (dual credit) policy for 2021-2023 requiring 18% NEV credit by 2023. In an optimistic scenario, this translates into 18% EV market penetration among new passenger cars in 2023. Without additional policies, we assume NEV share would stay at this level through 2025 and beyond.
Table 1.1a. Share of new PC sales that are ICE, PHEV, and BEV in the Adopted Policies scenario
2020 2025
ICE/All 95% 82%
BEV/All 4% 16%
PHEV/All 1% 2%
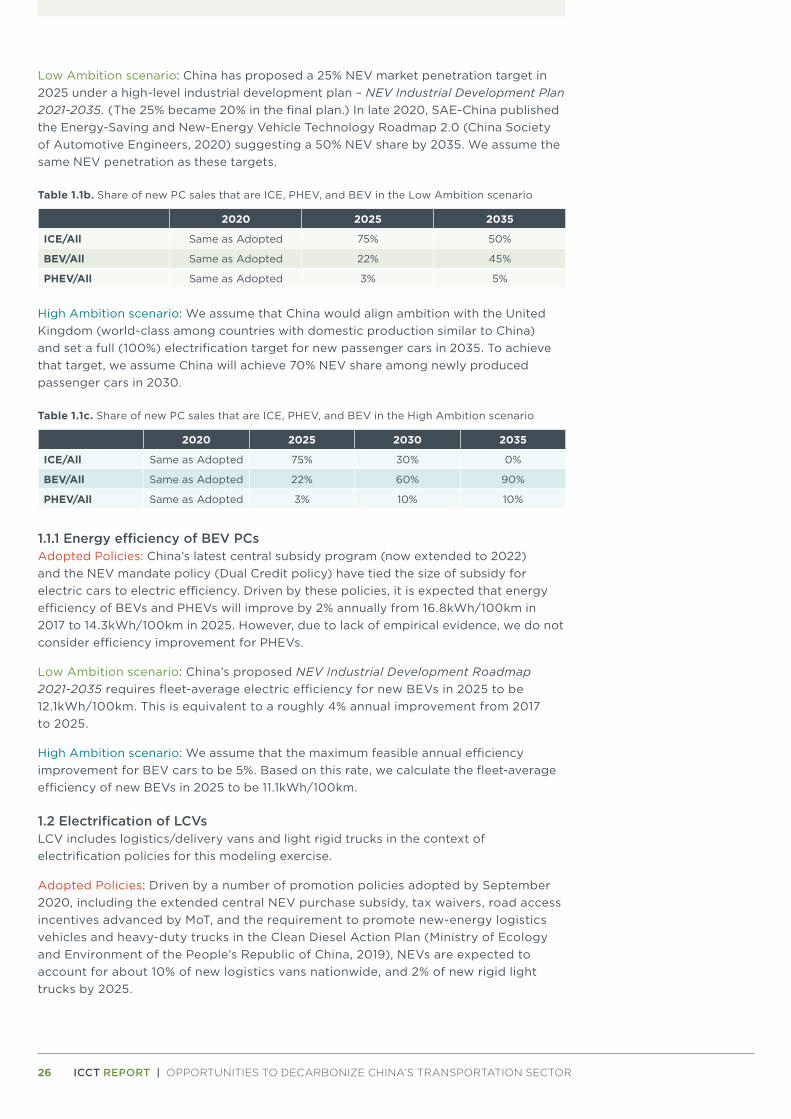
26 ICCT REPORT | OPPORTUNITIES TO DECARBONIZE CHINA’S TRANSPORTATION SECTOR
Low Ambition scenario: China has proposed a 25% NEV market penetration target in 2025 under a high-level industrial development plan – NEV Industrial Development Plan 2021-2035. (The 25% became 20% in the final plan.) In late 2020, SAE-China published the Energy-Saving and New-Energy Vehicle Technology Roadmap 2.0 (China Society of Automotive Engineers, 2020) suggesting a 50% NEV share by 2035. We assume the same NEV penetration as these targets.
Table 1.1b. Share of new PC sales that are ICE, PHEV, and BEV in the Low Ambition scenario
2020 2025 2035
ICE/All Same as Adopted 75% 50%
BEV/All Same as Adopted 22% 45%
PHEV/All Same as Adopted 3% 5%
High Ambition scenario: We assume that China would align ambition with the United Kingdom (world-class among countries with domestic production similar to China) and set a full (100%) electrification target for new passenger cars in 2035. To achieve that target, we assume China will achieve 70% NEV share among newly produced passenger cars in 2030.
Table 1.1c. Share of new PC sales that are ICE, PHEV, and BEV in the High Ambition scenario
2020 2025 2030 2035
ICE/All Same as Adopted 75% 30% 0%
BEV/All Same as Adopted 22% 60% 90%
PHEV/All Same as Adopted 3% 10% 10%
1.1.1 Energy efficiency of BEV PCsAdopted Policies: China’s latest central subsidy program (now extended to 2022) and the NEV mandate policy (Dual Credit policy) have tied the size of subsidy for electric cars to electric efficiency. Driven by these policies, it is expected that energy efficiency of BEVs and PHEVs will improve by 2% annually from 16.8kWh/100km in 2017 to 14.3kWh/100km in 2025. However, due to lack of empirical evidence, we do not consider efficiency improvement for PHEVs.
Low Ambition scenario: China’s proposed NEV Industrial Development Roadmap 2021-2035 requires fleet-average electric efficiency for new BEVs in 2025 to be 12.1kWh/100km. This is equivalent to a roughly 4% annual improvement from 2017 to 2025.
High Ambition scenario: We assume that the maximum feasible annual efficiency improvement for BEV cars to be 5%. Based on this rate, we calculate the fleet-average efficiency of new BEVs in 2025 to be 11.1kWh/100km.
1.2 Electrification of LCVsLCV includes logistics/delivery vans and light rigid trucks in the context of electrification policies for this modeling exercise.
Adopted Policies: Driven by a number of promotion policies adopted by September 2020, including the extended central NEV purchase subsidy, tax waivers, road access incentives advanced by MoT, and the requirement to promote new-energy logistics vehicles and heavy-duty trucks in the Clean Diesel Action Plan (Ministry of Ecology and Environment of the People’s Republic of China, 2019), NEVs are expected to account for about 10% of new logistics vans nationwide, and 2% of new rigid light trucks by 2025.
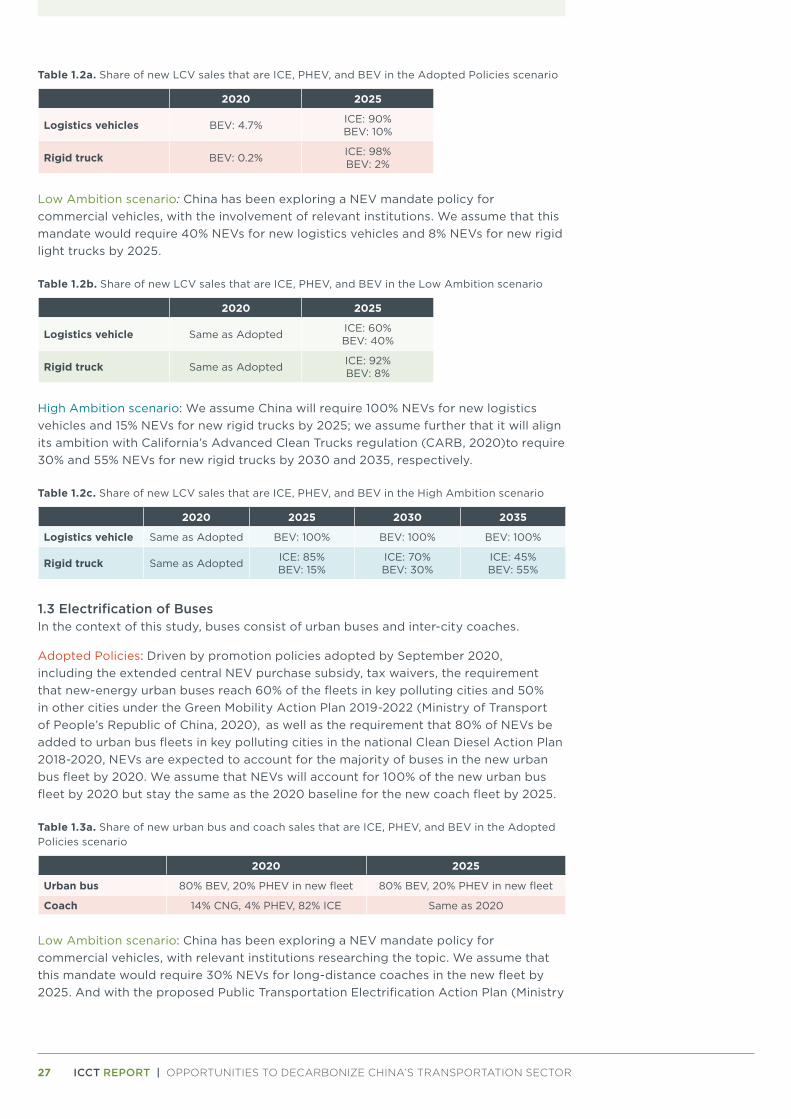
27 ICCT REPORT | OPPORTUNITIES TO DECARBONIZE CHINA’S TRANSPORTATION SECTOR
Table 1.2a. Share of new LCV sales that are ICE, PHEV, and BEV in the Adopted Policies scenario
2020 2025
Logistics vehicles BEV: 4.7% ICE: 90%BEV: 10%
Rigid truck BEV: 0.2% ICE: 98%BEV: 2%
Low Ambition scenario: China has been exploring a NEV mandate policy for commercial vehicles, with the involvement of relevant institutions. We assume that this mandate would require 40% NEVs for new logistics vehicles and 8% NEVs for new rigid light trucks by 2025.
Table 1.2b. Share of new LCV sales that are ICE, PHEV, and BEV in the Low Ambition scenario
2020 2025
Logistics vehicle Same as Adopted ICE: 60%BEV: 40%
Rigid truck Same as Adopted ICE: 92%BEV: 8%
High Ambition scenario: We assume China will require 100% NEVs for new logistics vehicles and 15% NEVs for new rigid trucks by 2025; we assume further that it will align its ambition with California’s Advanced Clean Trucks regulation (CARB, 2020)to require 30% and 55% NEVs for new rigid trucks by 2030 and 2035, respectively.
Table 1.2c. Share of new LCV sales that are ICE, PHEV, and BEV in the High Ambition scenario
2020 2025 2030 2035
Logistics vehicle Same as Adopted BEV: 100% BEV: 100% BEV: 100%
Rigid truck Same as Adopted ICE: 85%BEV: 15%
ICE: 70%BEV: 30%
ICE: 45%BEV: 55%
1.3 Electrification of BusesIn the context of this study, buses consist of urban buses and inter-city coaches.
Adopted Policies: Driven by promotion policies adopted by September 2020, including the extended central NEV purchase subsidy, tax waivers, the requirement that new-energy urban buses reach 60% of the fleets in key polluting cities and 50% in other cities under the Green Mobility Action Plan 2019-2022 (Ministry of Transport of People’s Republic of China, 2020), as well as the requirement that 80% of NEVs be added to urban bus fleets in key polluting cities in the national Clean Diesel Action Plan 2018-2020, NEVs are expected to account for the majority of buses in the new urban bus fleet by 2020. We assume that NEVs will account for 100% of the new urban bus fleet by 2020 but stay the same as the 2020 baseline for the new coach fleet by 2025.
Table 1.3a. Share of new urban bus and coach sales that are ICE, PHEV, and BEV in the Adopted Policies scenario
2020 2025
Urban bus 80% BEV, 20% PHEV in new fleet 80% BEV, 20% PHEV in new fleet
Coach 14% CNG, 4% PHEV, 82% ICE Same as 2020
Low Ambition scenario: China has been exploring a NEV mandate policy for commercial vehicles, with relevant institutions researching the topic. We assume that this mandate would require 30% NEVs for long-distance coaches in the new fleet by 2025. And with the proposed Public Transportation Electrification Action Plan (Ministry
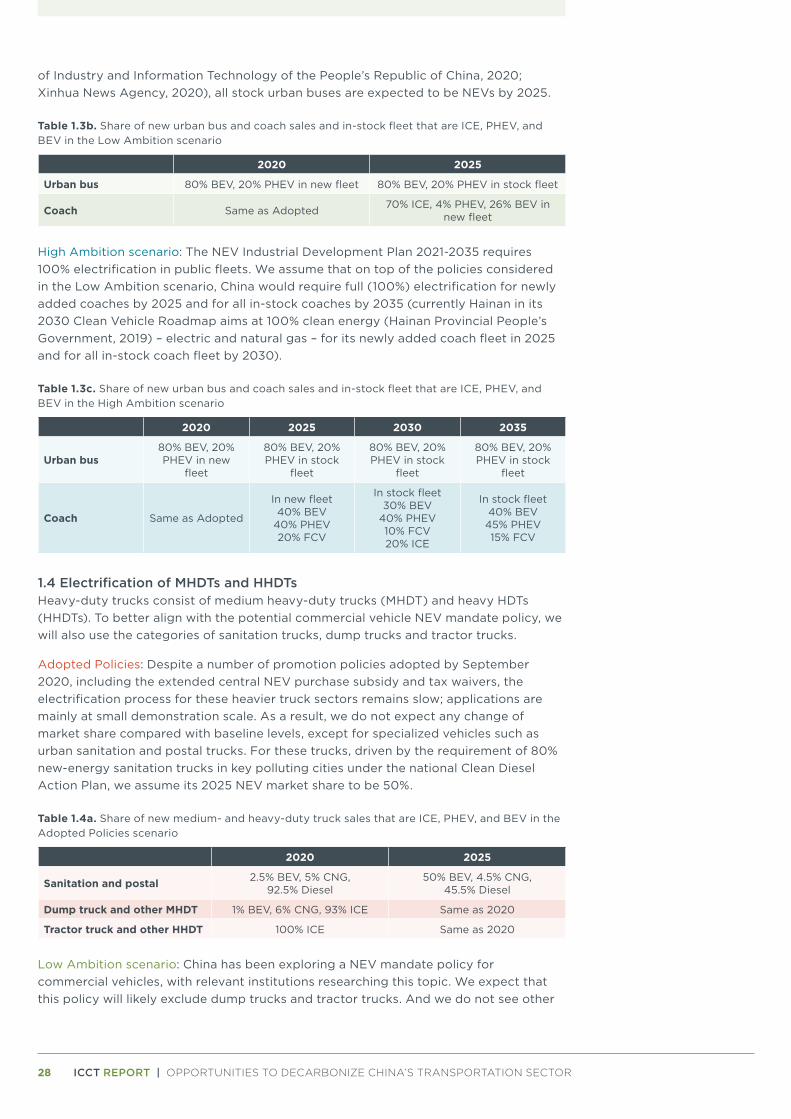
28 ICCT REPORT | OPPORTUNITIES TO DECARBONIZE CHINA’S TRANSPORTATION SECTOR
of Industry and Information Technology of the People’s Republic of China, 2020; Xinhua News Agency, 2020), all stock urban buses are expected to be NEVs by 2025.
Table 1.3b. Share of new urban bus and coach sales and in-stock fleet that are ICE, PHEV, and BEV in the Low Ambition scenario
2020 2025
Urban bus 80% BEV, 20% PHEV in new fleet 80% BEV, 20% PHEV in stock fleet
Coach Same as Adopted 70% ICE, 4% PHEV, 26% BEV in new fleet
High Ambition scenario: The NEV Industrial Development Plan 2021-2035 requires 100% electrification in public fleets. We assume that on top of the policies considered in the Low Ambition scenario, China would require full (100%) electrification for newly added coaches by 2025 and for all in-stock coaches by 2035 (currently Hainan in its 2030 Clean Vehicle Roadmap aims at 100% clean energy (Hainan Provincial People’s Government, 2019) – electric and natural gas – for its newly added coach fleet in 2025 and for all in-stock coach fleet by 2030).
Table 1.3c. Share of new urban bus and coach sales and in-stock fleet that are ICE, PHEV, and BEV in the High Ambition scenario
2020 2025 2030 2035
Urban bus80% BEV, 20% PHEV in new
fleet
80% BEV, 20% PHEV in stock
fleet
80% BEV, 20% PHEV in stock
fleet
80% BEV, 20% PHEV in stock
fleet
Coach Same as Adopted
In new fleet40% BEV
40% PHEV20% FCV
In stock fleet30% BEV
40% PHEV10% FCV20% ICE
In stock fleet40% BEV
45% PHEV15% FCV
1.4 Electrification of MHDTs and HHDTsHeavy-duty trucks consist of medium heavy-duty trucks (MHDT) and heavy HDTs (HHDTs). To better align with the potential commercial vehicle NEV mandate policy, we will also use the categories of sanitation trucks, dump trucks and tractor trucks.
Adopted Policies: Despite a number of promotion policies adopted by September 2020, including the extended central NEV purchase subsidy and tax waivers, the electrification process for these heavier truck sectors remains slow; applications are mainly at small demonstration scale. As a result, we do not expect any change of market share compared with baseline levels, except for specialized vehicles such as urban sanitation and postal trucks. For these trucks, driven by the requirement of 80% new-energy sanitation trucks in key polluting cities under the national Clean Diesel Action Plan, we assume its 2025 NEV market share to be 50%.
Table 1.4a. Share of new medium- and heavy-duty truck sales that are ICE, PHEV, and BEV in the Adopted Policies scenario
2020 2025
Sanitation and postal 2.5% BEV, 5% CNG, 92.5% Diesel
50% BEV, 4.5% CNG, 45.5% Diesel
Dump truck and other MHDT 1% BEV, 6% CNG, 93% ICE Same as 2020
Tractor truck and other HHDT 100% ICE Same as 2020
Low Ambition scenario: China has been exploring a NEV mandate policy for commercial vehicles, with relevant institutions researching this topic. We expect that this policy will likely exclude dump trucks and tractor trucks. And we do not see other
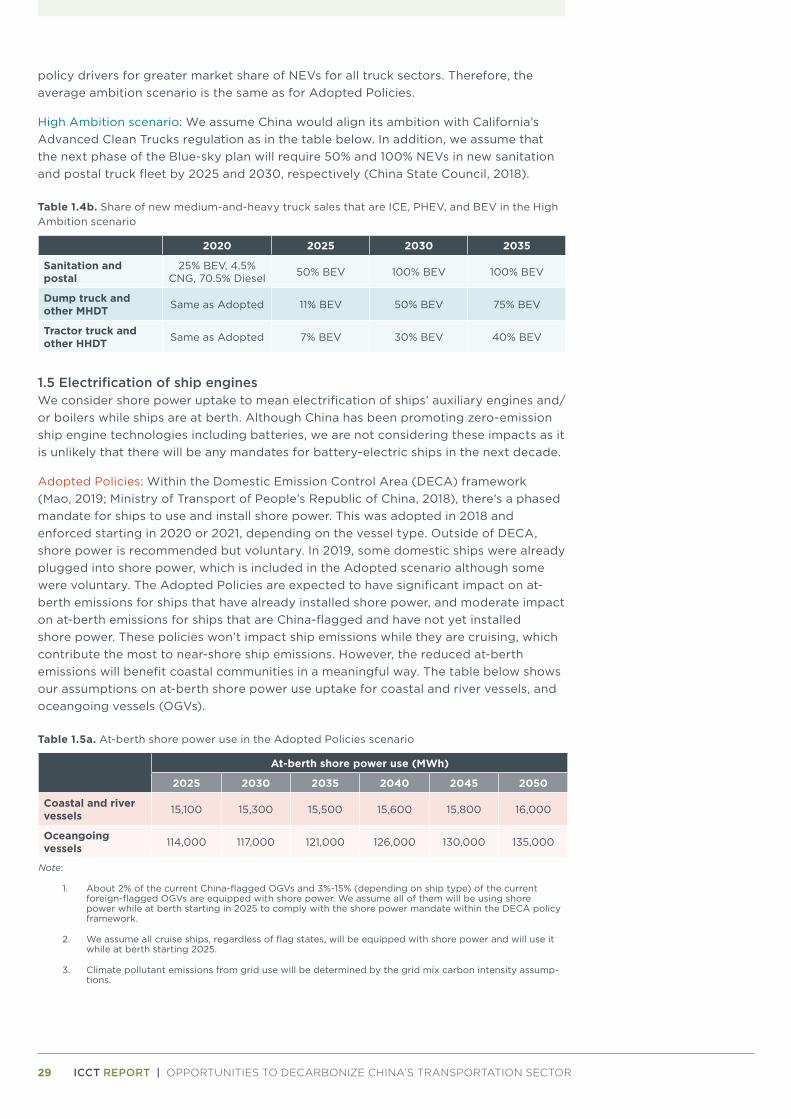
29 ICCT REPORT | OPPORTUNITIES TO DECARBONIZE CHINA’S TRANSPORTATION SECTOR
policy drivers for greater market share of NEVs for all truck sectors. Therefore, the average ambition scenario is the same as for Adopted Policies.
High Ambition scenario: We assume China would align its ambition with California’s Advanced Clean Trucks regulation as in the table below. In addition, we assume that the next phase of the Blue-sky plan will require 50% and 100% NEVs in new sanitation and postal truck fleet by 2025 and 2030, respectively (China State Council, 2018).
Table 1.4b. Share of new medium-and-heavy truck sales that are ICE, PHEV, and BEV in the High Ambition scenario
2020 2025 2030 2035
Sanitation and postal
25% BEV, 4.5% CNG, 70.5% Diesel 50% BEV 100% BEV 100% BEV
Dump truck and other MHDT Same as Adopted 11% BEV 50% BEV 75% BEV
Tractor truck and other HHDT Same as Adopted 7% BEV 30% BEV 40% BEV
1.5 Electrification of ship enginesWe consider shore power uptake to mean electrification of ships’ auxiliary engines and/or boilers while ships are at berth. Although China has been promoting zero-emission ship engine technologies including batteries, we are not considering these impacts as it is unlikely that there will be any mandates for battery-electric ships in the next decade.
Adopted Policies: Within the Domestic Emission Control Area (DECA) framework (Mao, 2019; Ministry of Transport of People’s Republic of China, 2018), there’s a phased mandate for ships to use and install shore power. This was adopted in 2018 and enforced starting in 2020 or 2021, depending on the vessel type. Outside of DECA, shore power is recommended but voluntary. In 2019, some domestic ships were already plugged into shore power, which is included in the Adopted scenario although some were voluntary. The Adopted Policies are expected to have significant impact on at-berth emissions for ships that have already installed shore power, and moderate impact on at-berth emissions for ships that are China-flagged and have not yet installed shore power. These policies won’t impact ship emissions while they are cruising, which contribute the most to near-shore ship emissions. However, the reduced at-berth emissions will benefit coastal communities in a meaningful way. The table below shows our assumptions on at-berth shore power use uptake for coastal and river vessels, and oceangoing vessels (OGVs).
Table 1.5a. At-berth shore power use in the Adopted Policies scenario
At-berth shore power use (MWh)
2025 2030 2035 2040 2045 2050
Coastal and river vessels 15,100 15,300 15,500 15,600 15,800 16,000
Oceangoing vessels 114,000 117,000 121,000 126,000 130,000 135,000
Note:
1. About 2% of the current China-flagged OGVs and 3%-15% (depending on ship type) of the current foreign-flagged OGVs are equipped with shore power. We assume all of them will be using shore power while at berth starting in 2025 to comply with the shore power mandate within the DECA policy framework.
2. We assume all cruise ships, regardless of flag states, will be equipped with shore power and will use it while at berth starting 2025.
3. Climate pollutant emissions from grid use will be determined by the grid mix carbon intensity assump-tions.
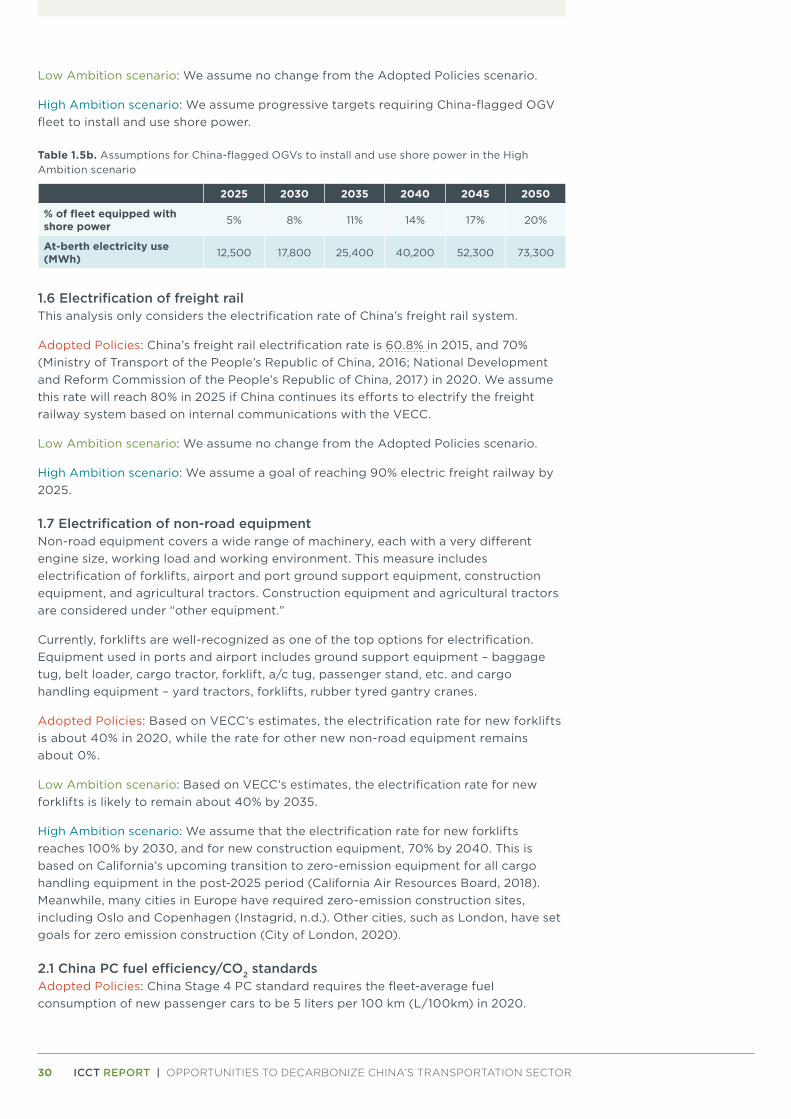
30 ICCT REPORT | OPPORTUNITIES TO DECARBONIZE CHINA’S TRANSPORTATION SECTOR
Low Ambition scenario: We assume no change from the Adopted Policies scenario.
High Ambition scenario: We assume progressive targets requiring China-flagged OGV fleet to install and use shore power.
Table 1.5b. Assumptions for China-flagged OGVs to install and use shore power in the High Ambition scenario
2025 2030 2035 2040 2045 2050
% of fleet equipped with shore power 5% 8% 11% 14% 17% 20%
At-berth electricity use (MWh) 12,500 17,800 25,400 40,200 52,300 73,300
1.6 Electrification of freight railThis analysis only considers the electrification rate of China’s freight rail system.
Adopted Policies: China’s freight rail electrification rate is 60.8% in 2015, and 70% (Ministry of Transport of the People’s Republic of China, 2016; National Development and Reform Commission of the People’s Republic of China, 2017) in 2020. We assume this rate will reach 80% in 2025 if China continues its efforts to electrify the freight railway system based on internal communications with the VECC.
Low Ambition scenario: We assume no change from the Adopted Policies scenario.
High Ambition scenario: We assume a goal of reaching 90% electric freight railway by 2025.
1.7 Electrification of non-road equipmentNon-road equipment covers a wide range of machinery, each with a very different engine size, working load and working environment. This measure includes electrification of forklifts, airport and port ground support equipment, construction equipment, and agricultural tractors. Construction equipment and agricultural tractors are considered under “other equipment.”
Currently, forklifts are well-recognized as one of the top options for electrification. Equipment used in ports and airport includes ground support equipment – baggage tug, belt loader, cargo tractor, forklift, a/c tug, passenger stand, etc. and cargo handling equipment – yard tractors, forklifts, rubber tyred gantry cranes.
Adopted Policies: Based on VECC’s estimates, the electrification rate for new forklifts is about 40% in 2020, while the rate for other new non-road equipment remains about 0%.
Low Ambition scenario: Based on VECC’s estimates, the electrification rate for new forklifts is likely to remain about 40% by 2035.
High Ambition scenario: We assume that the electrification rate for new forklifts reaches 100% by 2030, and for new construction equipment, 70% by 2040. This is based on California’s upcoming transition to zero-emission equipment for all cargo handling equipment in the post-2025 period (California Air Resources Board, 2018). Meanwhile, many cities in Europe have required zero-emission construction sites, including Oslo and Copenhagen (Instagrid, n.d.). Other cities, such as London, have set goals for zero emission construction (City of London, 2020).
2.1 China PC fuel efficiency/CO2 standardsAdopted Policies: China Stage 4 PC standard requires the fleet-average fuel consumption of new passenger cars to be 5 liters per 100 km (L/100km) in 2020.
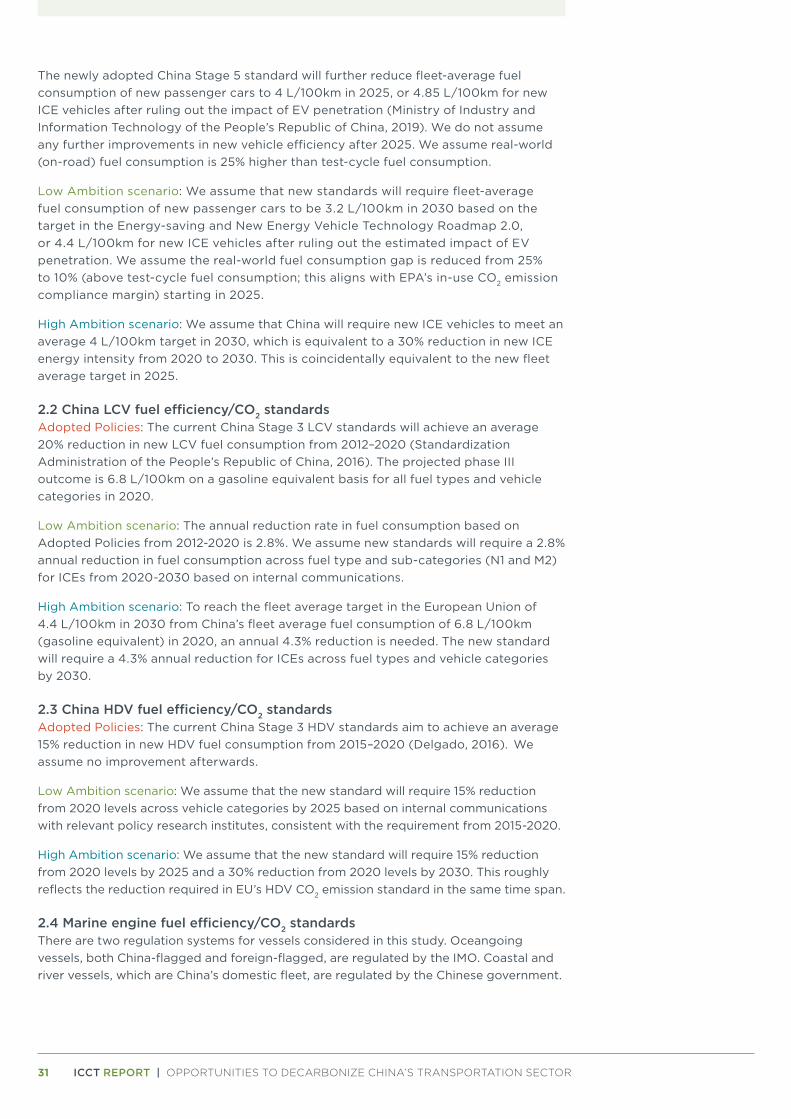
31 ICCT REPORT | OPPORTUNITIES TO DECARBONIZE CHINA’S TRANSPORTATION SECTOR
The newly adopted China Stage 5 standard will further reduce fleet-average fuel consumption of new passenger cars to 4 L/100km in 2025, or 4.85 L/100km for new ICE vehicles after ruling out the impact of EV penetration (Ministry of Industry and Information Technology of the People’s Republic of China, 2019). We do not assume any further improvements in new vehicle efficiency after 2025. We assume real-world (on-road) fuel consumption is 25% higher than test-cycle fuel consumption.
Low Ambition scenario: We assume that new standards will require fleet-average fuel consumption of new passenger cars to be 3.2 L/100km in 2030 based on the target in the Energy-saving and New Energy Vehicle Technology Roadmap 2.0, or 4.4 L/100km for new ICE vehicles after ruling out the estimated impact of EV penetration. We assume the real-world fuel consumption gap is reduced from 25% to 10% (above test-cycle fuel consumption; this aligns with EPA’s in-use CO2 emission compliance margin) starting in 2025.
High Ambition scenario: We assume that China will require new ICE vehicles to meet an average 4 L/100km target in 2030, which is equivalent to a 30% reduction in new ICE energy intensity from 2020 to 2030. This is coincidentally equivalent to the new fleet average target in 2025.
2.2 China LCV fuel efficiency/CO2 standardsAdopted Policies: The current China Stage 3 LCV standards will achieve an average 20% reduction in new LCV fuel consumption from 2012–2020 (Standardization Administration of the People’s Republic of China, 2016). The projected phase III outcome is 6.8 L/100km on a gasoline equivalent basis for all fuel types and vehicle categories in 2020.
Low Ambition scenario: The annual reduction rate in fuel consumption based on Adopted Policies from 2012-2020 is 2.8%. We assume new standards will require a 2.8% annual reduction in fuel consumption across fuel type and sub-categories (N1 and M2) for ICEs from 2020-2030 based on internal communications.
High Ambition scenario: To reach the fleet average target in the European Union of 4.4 L/100km in 2030 from China’s fleet average fuel consumption of 6.8 L/100km (gasoline equivalent) in 2020, an annual 4.3% reduction is needed. The new standard will require a 4.3% annual reduction for ICEs across fuel types and vehicle categories by 2030.
2.3 China HDV fuel efficiency/CO2 standardsAdopted Policies: The current China Stage 3 HDV standards aim to achieve an average 15% reduction in new HDV fuel consumption from 2015–2020 (Delgado, 2016). We assume no improvement afterwards.
Low Ambition scenario: We assume that the new standard will require 15% reduction from 2020 levels across vehicle categories by 2025 based on internal communications with relevant policy research institutes, consistent with the requirement from 2015-2020.
High Ambition scenario: We assume that the new standard will require 15% reduction from 2020 levels by 2025 and a 30% reduction from 2020 levels by 2030. This roughly reflects the reduction required in EU’s HDV CO2 emission standard in the same time span.
2.4 Marine engine fuel efficiency/CO2 standardsThere are two regulation systems for vessels considered in this study. Oceangoing vessels, both China-flagged and foreign-flagged, are regulated by the IMO. Coastal and river vessels, which are China’s domestic fleet, are regulated by the Chinese government.
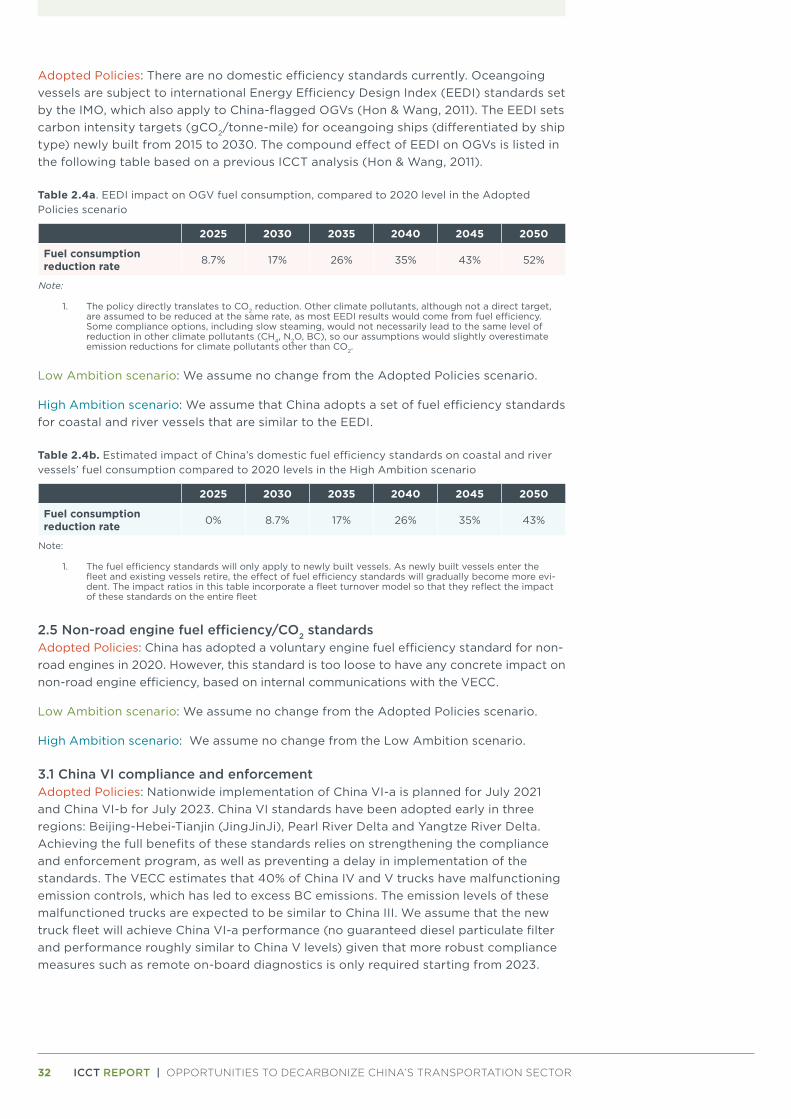
32 ICCT REPORT | OPPORTUNITIES TO DECARBONIZE CHINA’S TRANSPORTATION SECTOR
Adopted Policies: There are no domestic efficiency standards currently. Oceangoing vessels are subject to international Energy Efficiency Design Index (EEDI) standards set by the IMO, which also apply to China-flagged OGVs (Hon & Wang, 2011). The EEDI sets carbon intensity targets (gCO2/tonne-mile) for oceangoing ships (differentiated by ship type) newly built from 2015 to 2030. The compound effect of EEDI on OGVs is listed in the following table based on a previous ICCT analysis (Hon & Wang, 2011).
Table 2.4a. EEDI impact on OGV fuel consumption, compared to 2020 level in the Adopted Policies scenario
2025 2030 2035 2040 2045 2050
Fuel consumption reduction rate 8.7% 17% 26% 35% 43% 52%
Note:
1. The policy directly translates to CO2 reduction. Other climate pollutants, although not a direct target, are assumed to be reduced at the same rate, as most EEDI results would come from fuel efficiency. Some compliance options, including slow steaming, would not necessarily lead to the same level of reduction in other climate pollutants (CH4, N2O, BC), so our assumptions would slightly overestimate emission reductions for climate pollutants other than CO2.
Low Ambition scenario: We assume no change from the Adopted Policies scenario.
High Ambition scenario: We assume that China adopts a set of fuel efficiency standards for coastal and river vessels that are similar to the EEDI.
Table 2.4b. Estimated impact of China’s domestic fuel efficiency standards on coastal and river vessels’ fuel consumption compared to 2020 levels in the High Ambition scenario
2025 2030 2035 2040 2045 2050
Fuel consumption reduction rate 0% 8.7% 17% 26% 35% 43%
Note:
1. The fuel efficiency standards will only apply to newly built vessels. As newly built vessels enter the fleet and existing vessels retire, the effect of fuel efficiency standards will gradually become more evi-dent. The impact ratios in this table incorporate a fleet turnover model so that they reflect the impact of these standards on the entire fleet
2.5 Non-road engine fuel efficiency/CO2 standardsAdopted Policies: China has adopted a voluntary engine fuel efficiency standard for non-road engines in 2020. However, this standard is too loose to have any concrete impact on non-road engine efficiency, based on internal communications with the VECC.
Low Ambition scenario: We assume no change from the Adopted Policies scenario.
High Ambition scenario: We assume no change from the Low Ambition scenario.
3.1 China VI compliance and enforcement Adopted Policies: Nationwide implementation of China VI-a is planned for July 2021 and China VI-b for July 2023. China VI standards have been adopted early in three regions: Beijing-Hebei-Tianjin (JingJinJi), Pearl River Delta and Yangtze River Delta. Achieving the full benefits of these standards relies on strengthening the compliance and enforcement program, as well as preventing a delay in implementation of the standards. The VECC estimates that 40% of China IV and V trucks have malfunctioning emission controls, which has led to excess BC emissions. The emission levels of these malfunctioned trucks are expected to be similar to China III. We assume that the new truck fleet will achieve China VI-a performance (no guaranteed diesel particulate filter and performance roughly similar to China V levels) given that more robust compliance measures such as remote on-board diagnostics is only required starting from 2023.
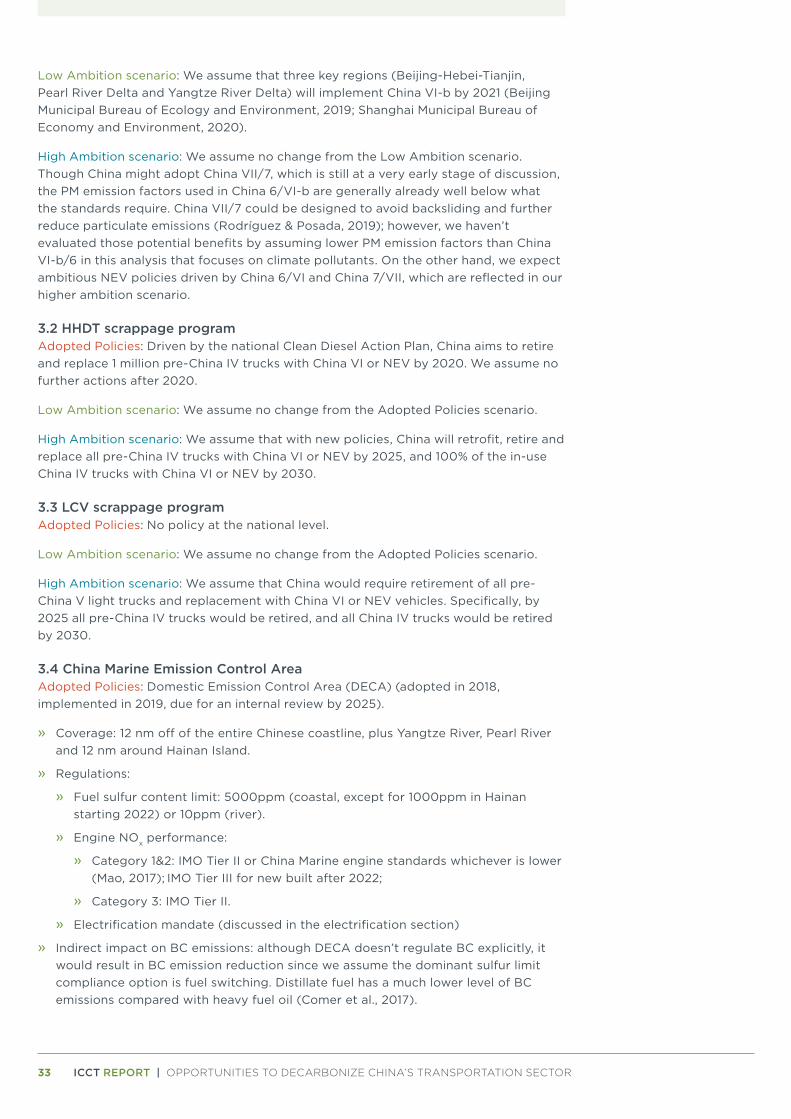
33 ICCT REPORT | OPPORTUNITIES TO DECARBONIZE CHINA’S TRANSPORTATION SECTOR
Low Ambition scenario: We assume that three key regions (Beijing-Hebei-Tianjin, Pearl River Delta and Yangtze River Delta) will implement China VI-b by 2021 (Beijing Municipal Bureau of Ecology and Environment, 2019; Shanghai Municipal Bureau of Economy and Environment, 2020).
High Ambition scenario: We assume no change from the Low Ambition scenario. Though China might adopt China VII/7, which is still at a very early stage of discussion, the PM emission factors used in China 6/VI-b are generally already well below what the standards require. China VII/7 could be designed to avoid backsliding and further reduce particulate emissions (Rodríguez & Posada, 2019); however, we haven’t evaluated those potential benefits by assuming lower PM emission factors than China VI-b/6 in this analysis that focuses on climate pollutants. On the other hand, we expect ambitious NEV policies driven by China 6/VI and China 7/VII, which are reflected in our higher ambition scenario.
3.2 HHDT scrappage programAdopted Policies: Driven by the national Clean Diesel Action Plan, China aims to retire and replace 1 million pre-China IV trucks with China VI or NEV by 2020. We assume no further actions after 2020.
Low Ambition scenario: We assume no change from the Adopted Policies scenario.
High Ambition scenario: We assume that with new policies, China will retrofit, retire and replace all pre-China IV trucks with China VI or NEV by 2025, and 100% of the in-use China IV trucks with China VI or NEV by 2030.
3.3 LCV scrappage programAdopted Policies: No policy at the national level.
Low Ambition scenario: We assume no change from the Adopted Policies scenario.
High Ambition scenario: We assume that China would require retirement of all pre-China V light trucks and replacement with China VI or NEV vehicles. Specifically, by 2025 all pre-China IV trucks would be retired, and all China IV trucks would be retired by 2030.
3.4 China Marine Emission Control AreaAdopted Policies: Domestic Emission Control Area (DECA) (adopted in 2018, implemented in 2019, due for an internal review by 2025).
» Coverage: 12 nm off of the entire Chinese coastline, plus Yangtze River, Pearl River and 12 nm around Hainan Island.
» Regulations:
» Fuel sulfur content limit: 5000ppm (coastal, except for 1000ppm in Hainan starting 2022) or 10ppm (river).
» Engine NOx performance:
» Category 1&2: IMO Tier II or China Marine engine standards whichever is lower (Mao, 2017); IMO Tier III for new built after 2022;
» Category 3: IMO Tier II.
» Electrification mandate (discussed in the electrification section)
» Indirect impact on BC emissions: although DECA doesn’t regulate BC explicitly, it would result in BC emission reduction since we assume the dominant sulfur limit compliance option is fuel switching. Distillate fuel has a much lower level of BC emissions compared with heavy fuel oil (Comer et al., 2017).
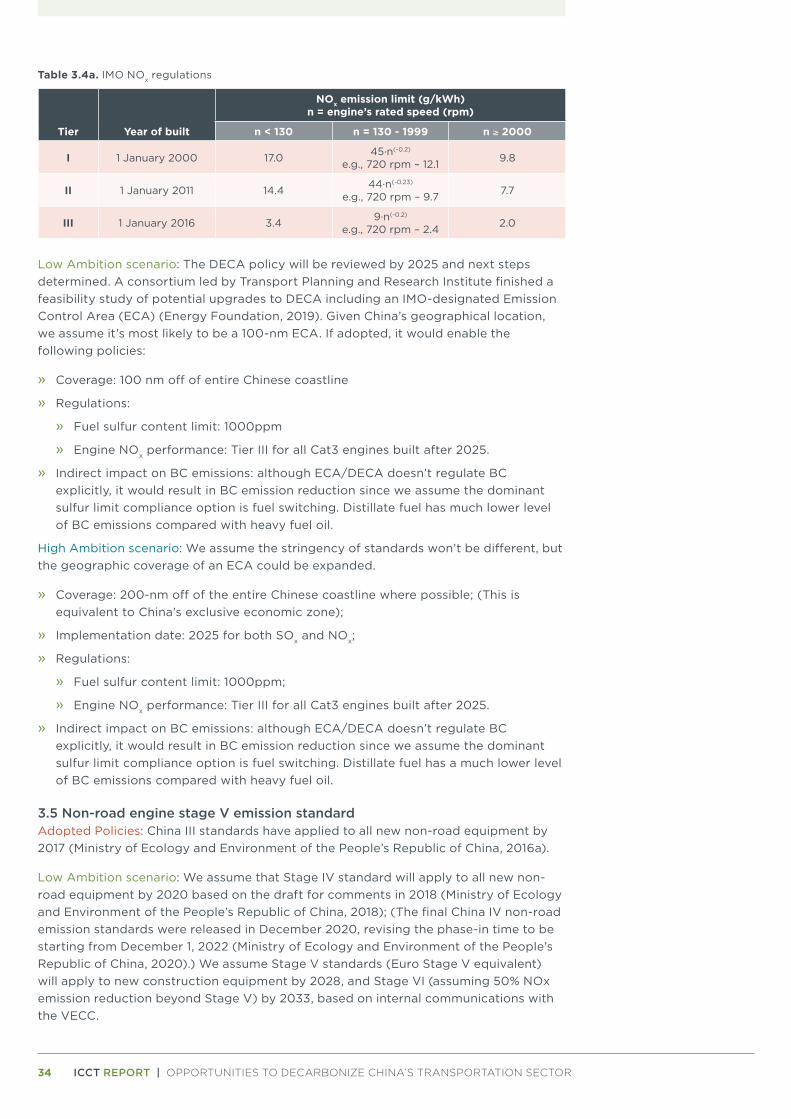
34 ICCT REPORT | OPPORTUNITIES TO DECARBONIZE CHINA’S TRANSPORTATION SECTOR
Table 3.4a. IMO NOx regulations
Tier Year of built
NOx emission limit (g/kWh)n = engine’s rated speed (rpm)
n < 130 n = 130 - 1999 n ≥ 2000
I 1 January 2000 17.0 45·n(-0.2)
e.g., 720 rpm – 12.1 9.8
II 1 January 2011 14.4 44·n(-0.23)
e.g., 720 rpm – 9.7 7.7
III 1 January 2016 3.4 9·n(-0.2)
e.g., 720 rpm – 2.4 2.0
Low Ambition scenario: The DECA policy will be reviewed by 2025 and next steps determined. A consortium led by Transport Planning and Research Institute finished a feasibility study of potential upgrades to DECA including an IMO-designated Emission Control Area (ECA) (Energy Foundation, 2019). Given China’s geographical location, we assume it’s most likely to be a 100-nm ECA. If adopted, it would enable the following policies:
» Coverage: 100 nm off of entire Chinese coastline
» Regulations:
» Fuel sulfur content limit: 1000ppm
» Engine NOx performance: Tier III for all Cat3 engines built after 2025.
» Indirect impact on BC emissions: although ECA/DECA doesn’t regulate BC explicitly, it would result in BC emission reduction since we assume the dominant sulfur limit compliance option is fuel switching. Distillate fuel has much lower level of BC emissions compared with heavy fuel oil.
High Ambition scenario: We assume the stringency of standards won’t be different, but the geographic coverage of an ECA could be expanded.
» Coverage: 200-nm off of the entire Chinese coastline where possible; (This is equivalent to China’s exclusive economic zone);
» Implementation date: 2025 for both SOx and NOx;
» Regulations:
» Fuel sulfur content limit: 1000ppm;
» Engine NOx performance: Tier III for all Cat3 engines built after 2025.
» Indirect impact on BC emissions: although ECA/DECA doesn’t regulate BC explicitly, it would result in BC emission reduction since we assume the dominant sulfur limit compliance option is fuel switching. Distillate fuel has a much lower level of BC emissions compared with heavy fuel oil.
3.5 Non-road engine stage V emission standardAdopted Policies: China III standards have applied to all new non-road equipment by 2017 (Ministry of Ecology and Environment of the People’s Republic of China, 2016a).
Low Ambition scenario: We assume that Stage IV standard will apply to all new non-road equipment by 2020 based on the draft for comments in 2018 (Ministry of Ecology and Environment of the People’s Republic of China, 2018); (The final China IV non-road emission standards were released in December 2020, revising the phase-in time to be starting from December 1, 2022 (Ministry of Ecology and Environment of the People’s Republic of China, 2020).) We assume Stage V standards (Euro Stage V equivalent) will apply to new construction equipment by 2028, and Stage VI (assuming 50% NOx emission reduction beyond Stage V) by 2033, based on internal communications with the VECC.
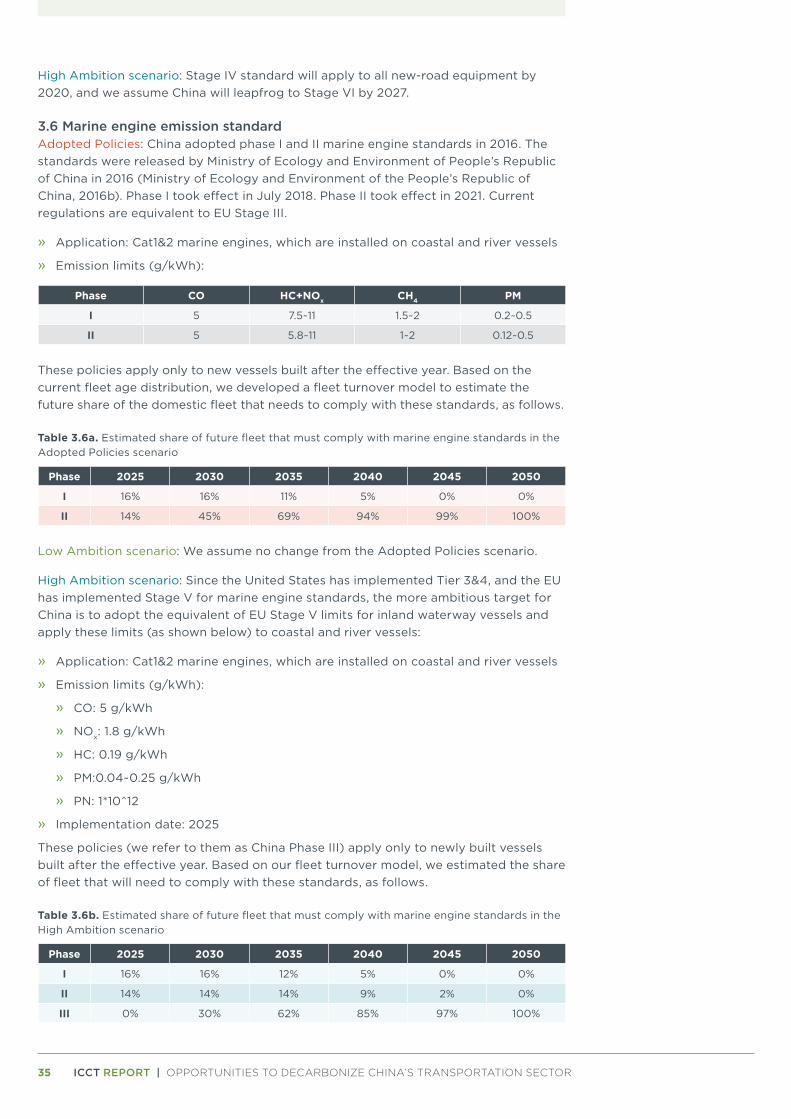
35 ICCT REPORT | OPPORTUNITIES TO DECARBONIZE CHINA’S TRANSPORTATION SECTOR
High Ambition scenario: Stage IV standard will apply to all new-road equipment by 2020, and we assume China will leapfrog to Stage VI by 2027.
3.6 Marine engine emission standardAdopted Policies: China adopted phase I and II marine engine standards in 2016. The standards were released by Ministry of Ecology and Environment of People’s Republic of China in 2016 (Ministry of Ecology and Environment of the People’s Republic of China, 2016b). Phase I took effect in July 2018. Phase II took effect in 2021. Current regulations are equivalent to EU Stage III.
» Application: Cat1&2 marine engines, which are installed on coastal and river vessels
» Emission limits (g/kWh):
Phase CO HC+NOx CH4 PM
I 5 7.5~11 1.5~2 0.2~0.5
II 5 5.8~11 1~2 0.12~0.5
These policies apply only to new vessels built after the effective year. Based on the current fleet age distribution, we developed a fleet turnover model to estimate the future share of the domestic fleet that needs to comply with these standards, as follows.
Table 3.6a. Estimated share of future fleet that must comply with marine engine standards in the Adopted Policies scenario
Phase 2025 2030 2035 2040 2045 2050
I 16% 16% 11% 5% 0% 0%
II 14% 45% 69% 94% 99% 100%
Low Ambition scenario: We assume no change from the Adopted Policies scenario.
High Ambition scenario: Since the United States has implemented Tier 3&4, and the EU has implemented Stage V for marine engine standards, the more ambitious target for China is to adopt the equivalent of EU Stage V limits for inland waterway vessels and apply these limits (as shown below) to coastal and river vessels:
» Application: Cat1&2 marine engines, which are installed on coastal and river vessels
» Emission limits (g/kWh):
» CO: 5 g/kWh
» NOx: 1.8 g/kWh
» HC: 0.19 g/kWh
» PM:0.04~0.25 g/kWh
» PN: 1*10^12
» Implementation date: 2025
These policies (we refer to them as China Phase III) apply only to newly built vessels built after the effective year. Based on our fleet turnover model, we estimated the share of fleet that will need to comply with these standards, as follows.
Table 3.6b. Estimated share of future fleet that must comply with marine engine standards in the High Ambition scenario
Phase 2025 2030 2035 2040 2045 2050
I 16% 16% 12% 5% 0% 0%
II 14% 14% 14% 9% 2% 0%
III 0% 30% 62% 85% 97% 100%
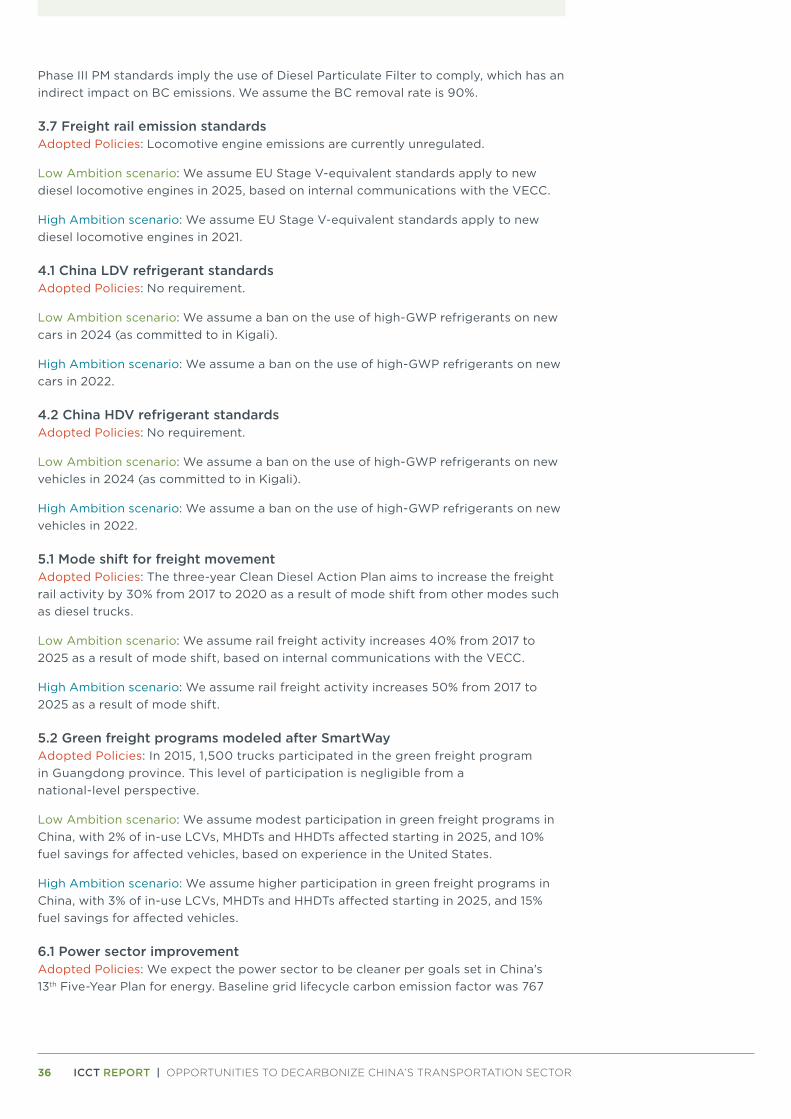
36 ICCT REPORT | OPPORTUNITIES TO DECARBONIZE CHINA’S TRANSPORTATION SECTOR
Phase III PM standards imply the use of Diesel Particulate Filter to comply, which has an indirect impact on BC emissions. We assume the BC removal rate is 90%.
3.7 Freight rail emission standardsAdopted Policies: Locomotive engine emissions are currently unregulated.
Low Ambition scenario: We assume EU Stage V-equivalent standards apply to new diesel locomotive engines in 2025, based on internal communications with the VECC.
High Ambition scenario: We assume EU Stage V-equivalent standards apply to new diesel locomotive engines in 2021.
4.1 China LDV refrigerant standardsAdopted Policies: No requirement.
Low Ambition scenario: We assume a ban on the use of high-GWP refrigerants on new cars in 2024 (as committed to in Kigali).
High Ambition scenario: We assume a ban on the use of high-GWP refrigerants on new cars in 2022.
4.2 China HDV refrigerant standardsAdopted Policies: No requirement.
Low Ambition scenario: We assume a ban on the use of high-GWP refrigerants on new vehicles in 2024 (as committed to in Kigali).
High Ambition scenario: We assume a ban on the use of high-GWP refrigerants on new vehicles in 2022.
5.1 Mode shift for freight movementAdopted Policies: The three-year Clean Diesel Action Plan aims to increase the freight rail activity by 30% from 2017 to 2020 as a result of mode shift from other modes such as diesel trucks.
Low Ambition scenario: We assume rail freight activity increases 40% from 2017 to 2025 as a result of mode shift, based on internal communications with the VECC.
High Ambition scenario: We assume rail freight activity increases 50% from 2017 to 2025 as a result of mode shift.
5.2 Green freight programs modeled after SmartWayAdopted Policies: In 2015, 1,500 trucks participated in the green freight program in Guangdong province. This level of participation is negligible from a national-level perspective.
Low Ambition scenario: We assume modest participation in green freight programs in China, with 2% of in-use LCVs, MHDTs and HHDTs affected starting in 2025, and 10% fuel savings for affected vehicles, based on experience in the United States.
High Ambition scenario: We assume higher participation in green freight programs in China, with 3% of in-use LCVs, MHDTs and HHDTs affected starting in 2025, and 15% fuel savings for affected vehicles.
6.1 Power sector improvementAdopted Policies: We expect the power sector to be cleaner per goals set in China’s 13th Five-Year Plan for energy. Baseline grid lifecycle carbon emission factor was 767
37 ICCT REPORT | OPPORTUNITIES TO DECARBONIZE CHINA’S TRANSPORTATION SECTOR
gCO2-e/kWh in 2017. This value is estimated to be 635 gCO2-e/kWh in 2020 (National Development and Reform Commission of the People’s Republic of China, 2016).
Low Ambition scenario: We assume a grid lifecycle carbon emission factor of 515 gCO2e/kWh in 2030, based on Tsinghua University’s estimates assuming High Ambition from the industry.
High Ambition scenario: To align with International Energy Agency’s World Energy Outlook 2019 Sustainable Development Scenario, we assume an approximately 60% lifecycle carbon reduction from the 2017 baseline in 2030, to 307 gCO2e/kWh.
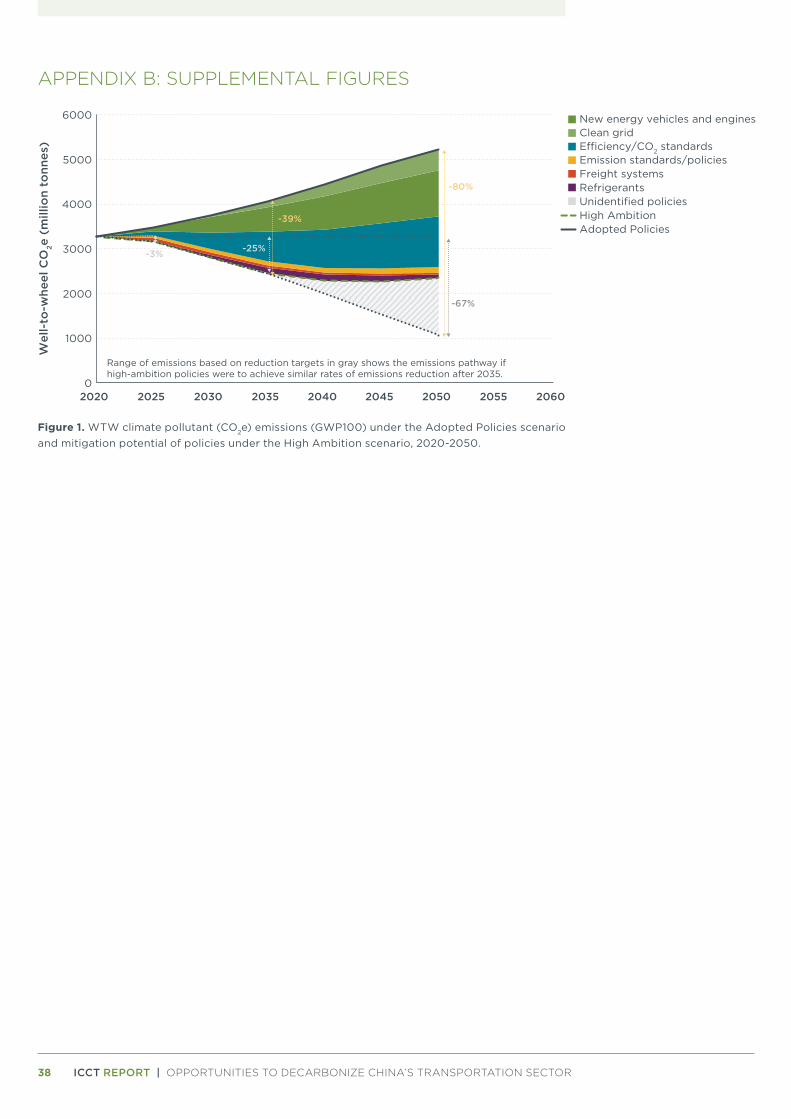
38 ICCT REPORT | OPPORTUNITIES TO DECARBONIZE CHINA’S TRANSPORTATION SECTOR
APPENDIX B: SUPPLEMENTAL FIGURES
0
1000
2000
3000
4000
5000
6000
2020 2025 2030 2035 2040 2045 2050 2055 2060
Wel
l-to
-whe
el C
O2e
(m
illio
n to
nnes
)
-67%
-80%
-25%
-39%
-3%
Range of emissions based on reduction targets in gray shows the emissions pathway if high-ambition policies were to achieve similar rates of emissions reduction after 2035.
New energy vehicles and enginesClean gridE�ciency/CO2 standardsEmission standards/policiesFreight systemsRefrigerants
High AmbitionAdopted Policies
Unidentified policies
Figure 1. WTW climate pollutant (CO2e) emissions (GWP100) under the Adopted Policies scenario and mitigation potential of policies under the High Ambition scenario, 2020-2050.
B E I J I N G | B E R L I N | S A N F R A N C I S C O | S Ã O PA U LO | WA S H I N G TO N
www.theicct.org
twitter @theicct