Embed Size (px)
Citation preview
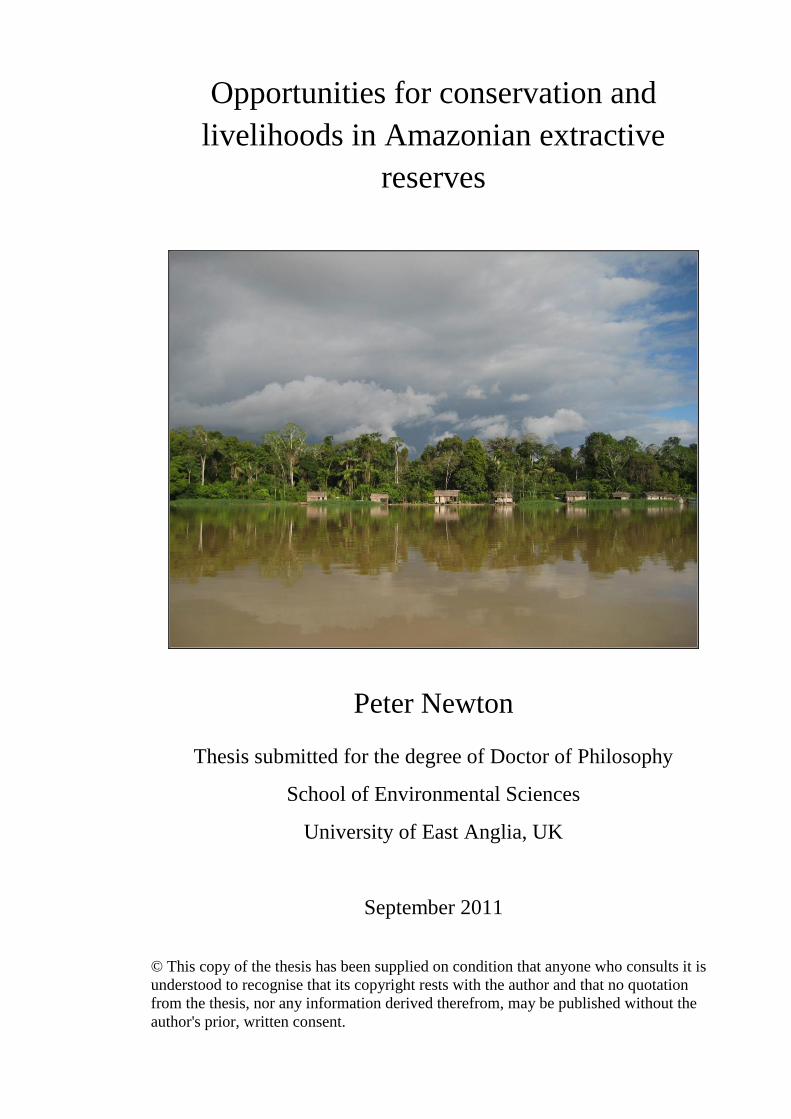
Opportunities for conservation and
livelihoods in Amazonian extractive
reserves
Peter Newton
Thesis submitted for the degree of Doctor of Philosophy
School of Environmental Sciences
University of East Anglia, UK
September 2011
© This copy of the thesis has been supplied on condition that anyone who consults it is
understood to recognise that its copyright rests with the author and that no quotation
from the thesis, nor any information derived therefrom, may be published without the
author's prior, written consent.
i
Contents
Abstract ii
Acknowledgements iii
Chapter 1: Introduction 1
Chapter 2: Determinants of livelihood strategy variation in two extractive 22
reserves in Amazonian flooded and unflooded forest
Chapter 3: Variation across a range of scales in the density and spatial 51
distribution of a neotropical non-timber forest resource
Chapter 4: Determinants of yield in a non-timber forest product: 81
Copaifera oleoresin in Amazonian extractive reserves
Chapter 5: Spatial, temporal and economic constraints on the commercial 107
extraction of a non-timber forest product in Amazonian
extractive reserves
Chapter 6: Consequences of actor level livelihood heterogeneity for 130
additionality in an undifferentiated payment-based payments for
environmental services programme in a tropical forest region
Chapter 7: Concluding remarks 154
Appendix: Key findings and management implications 164
ii
Abstract
Innovative management strategies are required to ensure the persistence of biodiversity
and environmental services in intact tropical forest regions whilst developing the
livelihoods of forest dwellers, particularly in light of increasing forest degradation and
deforestation threats. Commercial extraction of non-timber forest products and
payments for environmental services programmes aim to achieve these dual goals, often
within extractive reserves, which provide the administrative and land-tenure framework
for programme implementation. This thesis aimed to assess the potential of these two
mechanisms to maintain forest integrity whilst contributing to rural economies, using a
combination of ecological and social research methods – including line-transect
censuses, an experimental harvest, weekly household surveys, GIS mapping, and
community interviews. Substantial variation was observed in the livelihood strategies of
traditional communities along the Juruá River of western Brazilian Amazonia.
Agriculture, forest extractivism, and fishing were important to all households for
subsistence, but there was significant variation in household engagement with income-
generating activities. Much of this variation was attributed to local accessibility to
permanently-unflooded land suitable for perennial agriculture. Heterogeneity was also
observed in the spatial distribution, size structure, and harvest yields of trees in the
genus Copaifera, which are valued for their medicinal oleoresin. Variation between
species and forest types affected accessibility of this resource, determining the potential
for commercial harvesting. Results also demonstrated that programmes that aim to
protect environmental services by financially compensating rural people to avoid
undesirable land-use practices may benefit from careful programme design in relation to
participants‟ opportunity costs. Undifferentiated payments made by the Bolsa Floresta
programme failed to account for the greater costs incurred by households that were
more dependent on agrarian than extractive activities. The thesis concludes that the
spatial configuration of forest types in the neighbourhood of Amazonian communities
affects livelihood strategies and accessibility of forest resources, and is therefore a key
determinant of the likely impact of conservation and development policy. The
mechanisms examined both have their limitations, but in aggregate could form an
effective management strategy for primary tropical forest extractive reserves.
iii
Acknowledgements
This research was funded by a Natural Environment Research Council (NERC)
studentship (Ref. 3410625) and was part of a DEFRA Darwin Initiative project (Ref.
16-001).
This thesis has benefited from the knowledge and energy of many friends, colleagues
and collaborators. Many of the strengths of this thesis are a result of their valued input.
My supervisors, Carlos Peres and Andrew Watkinson, offered invaluable advice and
guidance throughout this study. Carlos‟ passion for Amazonia is infectious, and I am
grateful for all that he has taught me about this incredible region.
I was fortunate to be part of a first-rate research group in the Juruá: Joe, Óleo, Débora
and Leejiah were variously sources of great company, advice and logistical support, as
were Team Rola Bosta during their all-too-short time on the river.
I am indebted to the hundreds of residents of the Médio Juruá Extractive Reserve and
Uacari Sustainable Development Reserve for their unwavering hospitality, kindness and
assistance. In particular, the residents of Bauana and Morro Alto made me feel at home
away from home. Tenho saudades. I was fortunate to work closely in the forest with
four outstanding men: I thank Pensamento, De Açucar, Fino and Cleudimar for sharing
their experience and knowledge. Thanks also to Almir and Chico, our tirelessly-working
motoristos, and to the incredible team of monitores da mata and monitores das casas for
years of diligent data-collection. Lucineide did a fantastic job entering data from
thousands of weekly surveys.
I benefited enormously from collaborations with the Secretaria de Estado do Meio
Ambiente e Desenvolvimento Sustentável (SDS; especially Edelson, Johanna and
Romulo); the Instituto Brasileiro do Meio Ambiente e dos Recursos Naturais
Renováveis (IBAMA; especially João, Paula and Rosi); the Programa de
Monitoramento da Biodiversidade e do Uso de Recursos Naturais em Unidades de
Conservação Estaduais do Amazonas (ProBUC; especially Henrique and Sinomar); the
Conselho Nacional das Populações Extrativistas (CNS; especially Almira, César and
Natia); and the Instituto de Desenvolvimento Agropecuário e Florestal Sustentável do
Estado do Amazonas (IDAM; especially Cláudia).

iv
Many friends in Carauari provided welcome distraction from data-collection on our
occasional trips back to town. In particular, our wonderful neighbours Osama and
Luquínha were always ready with an open door, a peixe assado and a cold Skol.
Obrigado.
Sincere thanks are due to (most of) the staff of the nine hospitals I called in on during
this research – especially Dra Simone in Manaus – for getting me back on my feet each
time.
I‟m grateful to Campbell Plowden for sharing his advice and experience, and to the
anonymous reviewers of chapters 2, 4 and 6. Sylvain Desmoulière provided the data
from the Projeto RADAMBRASIL survey. Jennifer Johnson kindly lent her proof-
reading and editing expertise to Chapter 6. Davi Teles helped translate the Appendix.
Jenny Gill, Ian Lake and Brett Day offered excellent advice on individual chapters. Liz
Nichols was a wonderful collaborator on Chapter 6 and has been a source of great
support and friendship throughout.
Carlos‟ Amazonian research group have been inspiring people to work alongside: many
thanks to Joe, Luke, Alex, Sue, George, Maíra, Davi, Jos, and Toby. Many other friends
and colleagues at UEA were also generous with their help: thanks to Kabelo, Hugh,
Ricardo, Scott, Miranda, Chris, Sian, Cat, Christiana, Kelly, Vero, and all of the
Strangles crew.
Cheers to Graham, Kit, Roly and Will for welcome distraction from the doctorate – and
great company – on some amazing athletic endeavours.
My family have been wonderfully supportive and shown unquestioning patience during
this study. Thanks especially to Rob, whose taxes independently paid for the entire
experience.
Finally, immeasurable gratitude to Nichar – for unfailingly making me smile.

v
“The forest is one big thing; it has people, animals, and plants. There is no point saving
the animals if the forest is burned down; there is no point saving the forest if the people
and animals who live in it are killed or driven away. The groups trying to save the race
of animals cannot win if the people trying to save the forest lose; the people trying to
save the Indians cannot win if either of the others lose; the Indians cannot win without
the support of these groups; but the groups cannot win without the help of the Indians,
who know the forest and the animals and can tell what is happening to them. No one of
us is strong enough to win alone; together, we can be strong enough to win.”
Paikan, Kayapó leader
(from Hecht and Cockburn 1989)
1
Chapter 1
Introduction
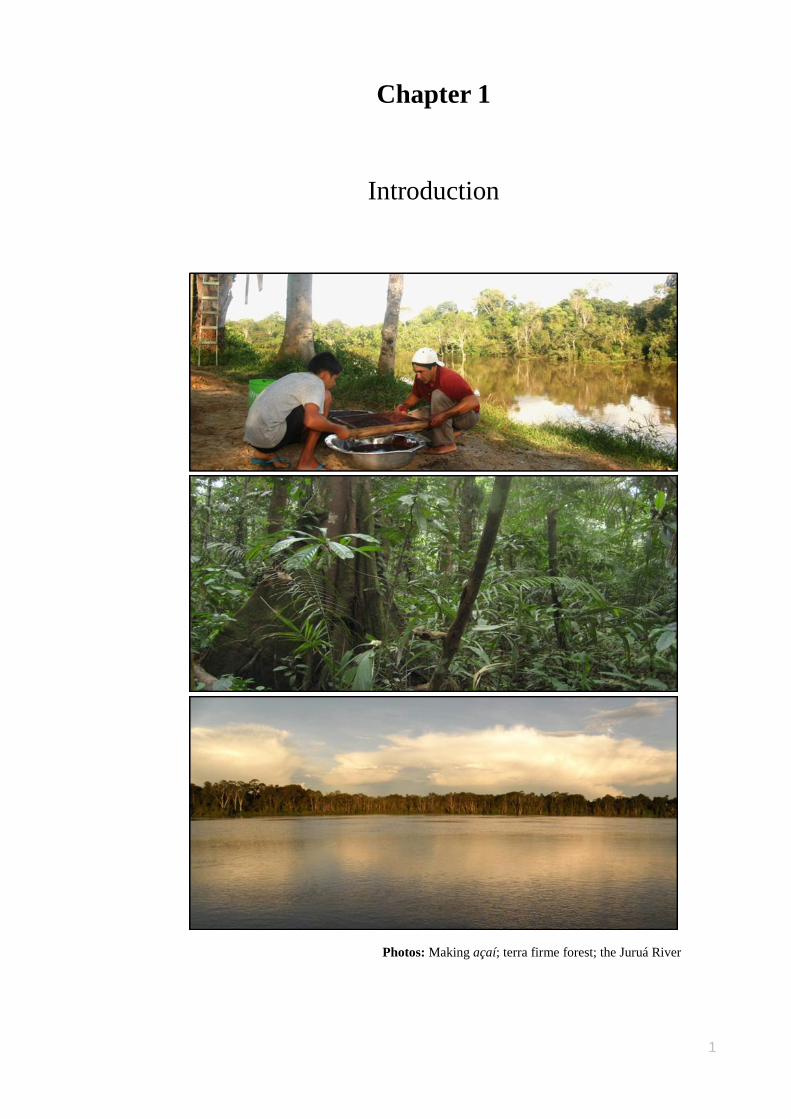
Photos: Making açaí; terra firme forest; the Juruá River
Chapter 1: Introduction
2
1.1 Tropical forests and Amazonia
Tropical forests contain a greater proportion of biodiversity than any other terrestrial
biome, provide critical environmental services including carbon sequestration and
hydrological regulation, and directly support the livelihoods of millions of rural people
who rely on forest resources for food, shelter, medicine or income-generation (Chhatre
and Agrawal 2009). Intact tropical forests are thus economically valuable at a global,
national and local scale, even without consideration of non-monetary existence values.
Amazonia is the world's largest tropical forest, covering 5.3 million km2 (2003, 85% of
the original area), of which 62% lie within Brazil (Soares-Filho et al. 2006; Malhi et al.
2008).
The integrity of Amazonian forests is threatened by a combination of anthropogenic
influences including population growth, industrial logging and mining, agricultural
development (especially cattle and soya), road construction (which opens access to
areas of previously unaffected forest) and human-ignited fires (Laurence et al. 2001).
These influences are greatest in eastern and southern Amazonia, particularly within the
notorious 'arc of deforestation'. Deforestation rates have been highest in the states of
Maranhão, Mato Grosso, Pará, Rôndonia and Tocantins, with up to 77% of the forest
cover of individual states already lost (INPE 2011).
In contrast, forest cover in Acre and Amazonas – Brazil‟s western Amazonian states –
remains relatively intact. A paucity of roads and reliance on fluvial transport along
meandering river systems has until now largely precluded encroachment by damaging
cattle and agricultural industries. However, even remote parts of Amazonia are
vulnerable to the threat of future deforestation. Large-scale infrastructural development
can quickly alter accessibility and bring incentives for land-use change (Perz et al.
2008). For example, the Avança Brasil programme pledged US $40 billion of
governmental investment to the construction of roads, pipelines, hydroelectric systems,
power lines, river channelization and port facilities since 2000 (Fearnside 2002). The
projected impacts of human-induced climate change are further evidence that the future
of these forests is far from secure (Malhi et al. 2009).
Even in regions where absolute rates of deforestation are low or are observed to have
been reduced, the impacts of forest fragmentation, edge-effects and selective logging
can be more difficult to quantify. The extent of forest degraded by these human
activities may be twice that calculated on the basis of deforestation alone (Asner et al.
Chapter 1: Introduction
3
2005). Other anthropogenic activities can be extremely damaging to forest integrity but
are invisible to satellite imagery. Sub-canopy threats to ecosystem integrity affect both
animal and plant populations and can result from hunting pressure, over-fishing or the
unchecked exploitation of timber and non-timber forest products (Peres et al. 2006).
1.1.1 Amazonia’s protected area network
As part of a national policy to ensure that forested regions remain intact, Brazil‟s federal
and state government agencies have greatly expanded the country‟s protected area
network in the last two decades (Rylands and Brandon 2005). Although protected areas
may be insufficient to ensure effective conservation of all ecosystem functions –
Amazonian watersheds, for example, have headwaters which often extend beyond
reserve boundaries – they do inhibit both deforestation and fire and are a critical
component of regional conservation strategies (Nepstad et al. 2006; Soares-Filho et al.
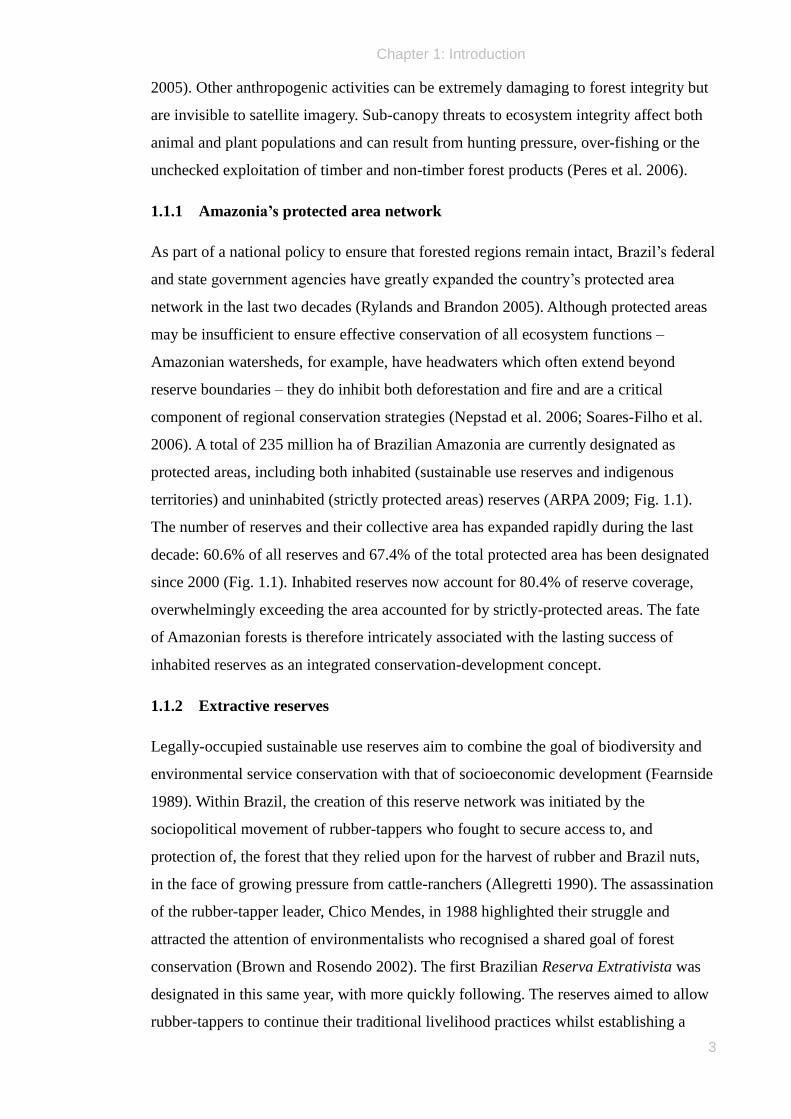
2006). A total of 235 million ha of Brazilian Amazonia are currently designated as
protected areas, including both inhabited (sustainable use reserves and indigenous
territories) and uninhabited (strictly protected areas) reserves (ARPA 2009; Fig. 1.1).
The number of reserves and their collective area has expanded rapidly during the last
decade: 60.6% of all reserves and 67.4% of the total protected area has been designated
since 2000 (Fig. 1.1). Inhabited reserves now account for 80.4% of reserve coverage,
overwhelmingly exceeding the area accounted for by strictly-protected areas. The fate
of Amazonian forests is therefore intricately associated with the lasting success of
inhabited reserves as an integrated conservation-development concept.
1.1.2 Extractive reserves
Legally-occupied sustainable use reserves aim to combine the goal of biodiversity and
environmental service conservation with that of socioeconomic development (Fearnside
1989). Within Brazil, the creation of this reserve network was initiated by the
sociopolitical movement of rubber-tappers who fought to secure access to, and
protection of, the forest that they relied upon for the harvest of rubber and Brazil nuts,
in the face of growing pressure from cattle-ranchers (Allegretti 1990). The assassination
of the rubber-tapper leader, Chico Mendes, in 1988 highlighted their struggle and
attracted the attention of environmentalists who recognised a shared goal of forest
conservation (Brown and Rosendo 2002). The first Brazilian Reserva Extrativista was
designated in this same year, with more quickly following. The reserves aimed to allow
rubber-tappers to continue their traditional livelihood practices whilst establishing a
Chapter 1: Introduction
4
Figure 1.1. The expansion of the protected area network in Brazilian Amazonia between
1974 and 2010. The cumulative creation of sustainable use reserves, indigenous
territories and strictly protected areas is indicated by (a) the total area designated and
(b) the number of reserves. Source: ARPA (2009).
Chapter 1: Introduction
5
degree of economic self-sufficiency through a diversification of harvested products
(Fearnside 1989). Sustainable use reserves currently account for 16.1% of Brazilian
Amazonia, compared to 9.2% by strictly-protected areas and 21.7% by indigenous
territories (ARPA 2009).
Brazilian sustainable use reserves include protected areas denominated as Reserva
Extrativista (ResEx), Reserva Desenvolvimento Sustentável (RDS) and Floresta
Nacional (FLONA), amongst others. Some reserves are administered by federal
agencies (e.g. ResEx reserves are managed by the Instituto Brasileiro do Meio Ambiente
e dos Recursos Naturais Renováveis (IBAMA)) whilst others are state-administered
(e.g. RDS reserves are managed by the Secretaria de Estado do Meio Ambiente e
Desenvolvimento Sustentável (SDS)). As a consequence of these administrative
differences, subtle variation exists in the political framework, regulations, and
management strategies associated with each reserve category, but all 199 such protected
areas share the same underlying philosophy of combining conservation and
development (Silva 2005).
In aggregate, sustainable use reserves are more commonly and globally referred to as
„extractive reserves‟. Although the term Reserva Extrativista translates to the same word
and has significance as a particular designation of reserve within Brazil, „extractive
reserve‟ is used throughout this thesis to refer collectively to all legally-occupied
protected areas except indigenous territories.
Legally-occupied protected areas are an effective barrier to deforestation, since local
people represent a strong political means of deterring the frontier of forest loss
(Schwartzman et al. 2000; Nepstad et al. 2006). However, extractive reserves were
originally designed as social spaces, rather than biodiversity conservation units per se,
and conservation success is not assured (Browder 1992). Extractivist populations may
damage forest integrity through the ecologically-unsustainable harvesting of forest
resources. A further risk is that protected areas may attract human settlements due to the
investment and revenue opportunities from government and international donors; higher
population growth rates within, or on the periphery of, extractive reserves can pose a
threat to conservation aims (Wittemyer et al. 2008). There is therefore a need to better
understand the capability of extractive reserves and other protected areas to conserve
biodiversity throughout Amazonia (Moegenburg and Levey 2002).
Chapter 1: Introduction
6
1.2 Traditional Amazonian livelihoods
Brazilian Amazonia‟s rural human population includes indigenous people, farming
colonists who settled in the 1970s and 1980s, and immigrant Brazilians who travelled to
the Amazonian interior during the rubber booms of the late-19th
and mid-20th
centuries
(Dean 1987). Such immigrants are considered „traditional Amazonians‟ and far
outnumber the indigenous population, being variously referred to as ribeirinhos (river-
dwellers), seringueiros (rubber-tappers) and caboclos (of mixed Brazilian Indian and
European ancestry). During the height of the rubber trade, many traditional Amazonians
lived as poorly-rewarded workers in a notoriously inequitable debt peonage system
whereby harvested rubber would be traded for supplies with the landlord (patrão) of an
area of forest (seringal) at prices that ensured a persistent debt of the worker to the
employer (Hecht and Cockburn 1989). Competition from Asian plantation rubber
eventually caused the collapse of the Brazilian rubber export market and the consequent
disintegration of the debt-peonage system (Dean 1987). Traditional Amazonians
remained in the region, adopting an agro-extractivist livelihood strategy that includes a
combination of subsistence swidden agriculture, fishing, hunting, and extraction of
forest products, with cash revenue generated from the sale of one or more of these
resources.
Over the last decade, many areas have seen a decreasing emphasis on traditional
extraction of rubber and Brazil nuts by these communities, with greater engagement
with agriculture and cattle-ranching (Ruiz-Perez et al. 2005; Salisbury and Schmink
2007; Vadjunec and Rocheleau 2009). Even small-scale agriculture usually involves the
clearance of swidden fields, often with detrimental long-term effects to primary forest
cover. The economic prospects of traditional Amazonian communities may be enhanced
in the short term (Hecht 1993), but ephemeral gains in livelihood quality associated
with land conversion elsewhere in Amazonia have often rapidly been followed by
collapses in both natural capital and living standards (Rodrigues et al. 2009). Increasing
reliance on swidden agriculture does not necessarily lead to sustained improvement of
livelihoods, and an alternative economic approach may be more effective from both a
development and conservation perspective.
The spatial overlap of vast areas of tropical forest of immense biological value with
millions of people living in poverty means that development of an optimal management
strategy for this region is a complex process. Priorities and objectives vary widely on a

Chapter 1: Introduction
7
gradient from stakeholders principally interested in environmental protection to those
more concerned about poverty alleviation, with many attempting to balance the two via
integrated conservation and development initiatives. An array of land-use mechanisms
has been heralded as holding promise for reconciling the needs of conservation and
livelihoods, including selective timber extraction, small-scale sustainable agriculture,
and eco-tourism. Two further mechanisms have received particularly close attention,
both in Amazonia and in tropical forests globally. The first of these, discussed in the
academic literature for two decades, is the commercial harvesting of non-timber forest
products (NTFPs). The second, having gained more recent prominence, is the
implementation of market-based payments for environmental services (PES)
programmes. The philosophy and background of these two mechanisms is discussed
below.
1.3 Commercial harvesting of non-timber forest products
Non-timber forest products are harvested by millions of rural forest-dwellers worldwide
as part of a subsistence livelihood strategy to provide food, shelter and medicine
(Koziell and Saunders 1996). NTFPs have been defined as “all biological materials
other than timber, which are extracted from forests for human use” (de Beer and
Mcdermott 1989). Attention is usually focussed upon plant-based resources such as
fruit, oils, resins, leaves, and barks although, since NTFPs are defined by what they are
not, the term has also been considered by many authors to include animal resources
such as hunted game and fish (Belcher 2003).
In addition to local consumption by the extractor, many NTFPs are also sold to generate
cash revenue for extractors – either on an individual basis in local markets or through
extractor co-operatives as part of a more formal trading agreement. Many tropical
NTFPs including rattan (Sastry 2001), palm hearts (Galetti and Fernandez 1998) and
Brazil nuts (Mori 1992), have a long history of commercialisation but emerging markets
for forest resources have heightened the interest of both academics and development
practitioners in the potential economic value of other NTFPs (Belcher et al. 2005).
Seminal preliminary assessments suggested that the harvest of NTFPs may be an
economically-competitive alternative to the extraction of timber within tropical forest
areas (Myers 1988; Peters et al. 1989). Although valuation studies of this kind have
been widely critiqued as over-simplifications (e.g. Salafsky et al. 1993), they have
played a crucial role in raising consciousness of the potential contribution of
Chapter 1: Introduction
8
commercial extractivism to tropical forest economies. Proponents of commercial NTFP
extraction have drawn attention to the benign ecological impact relative to agricultural
alternatives, and to the contribution that extractive revenues can make to rural
economies (Nepstad 1992).
Other authors have more cautiously warned that the NTFP paradigm may not be a
panacea, emphasising the nuances of extractive systems with uncertain markets.
Unequal distribution of harvesting pressure and the highly-perishable nature of many
NTFPs create a strong likelihood of local over-exploitation of resources in the vicinity
of rural communities and of urban markets, respectively (Belcher and Schreckenberg
2007). Increasing demand for some resources may additionally promote the
development of biodiversity-poor monocultures which ultimately replace extraction
from wild populations. For example, the Brazilian rubber industry was outcompeted by
Asian plantation rubber (Dean 1987), and the Amazonian palm fruit açai (Euterpe
oleracea) has been intensively managed to increase supply in many areas (Weinstein
and Moegenburg 2004). Even where ecological pressures can be minimised, markets for
NTFPs are often poorly developed. Consumer demand is subject to changing trends and
fashions, and the income earned is often insufficient to lift people out of poverty
(Padoch 1992).
Given the large diversity of taxa, habitats, harvest methods, and markets involved, it is
perhaps unsurprising that appraisals of extractive systems often reach conflicting
conclusions regarding the ecological or economic sustainability of NTFP harvesting. In
many cases, some of the problems identified above are not insurmountable, and
emerging markets and improved sociopolitical organisation have increasingly allowed
the development of commercially-viable extractive initiatives (Marshall et al. 2006).
Larger-scale extraction of a greater diversity of products has boosted the cash economy
of rural Amazonians. Within Brazilian Amazonia, recent increases in government
subsidies and NGO investment to support extractive initiatives have coincided with
expanding markets for tropical forest products (Sills and Saha 2010). Various NTFPs
including cosmetic (e.g. andiroba oil (Carapa guianensis)), edible (e.g. Brazil nuts
(Bertholletia excelsa), and medicinal (e.g. copaíba oleoresin (Copaifera spp.)) products
are sold in domestic and international markets (Shanley and Medina 2005).
Chapter 1: Introduction
9
1.3.1 Copaifera spp. oleoresin
Oils and resins are particularly well suited to commercialisation due to their relatively
high value per unit weight, which reduces their transport costs. Their non-perishable
nature also means that they can be extracted in remote rural locations and transported
greater distances to their eventual national or international market, and have a shelf-life
of months or years in contrast to days or weeks of many other NTFPs such as fruits
(Shanley et al. 2002).
Medicinal Copaifera oleoresin (known locally as óleo de copaíba) is a ubiquitously
known and economically-valuable NTFP extracted from the basal trunk of trees of this
genus across Brazilian Amazonia (Plowden 2004). The oleoresin is a secondary
metabolite which probably plays a role in the defence strategy of the tree against
pathogens or herbivores (Plowden 2004). It is widely harvested, traded and used by
rural Amazonians and is valued for its demonstrated anti-inflammatory and analgesic
properties (Veiga Junior and Pinto 2002). Rapidly-expanding domestic and international
markets for Copaifera oleoresin have emerged in the last decade and the product can be
bought globally in both urban markets and online.
Copaifera trees were historically harvested using an axe to open a cavity in the side of
the tree from which the oleoresin was extracted, or by simply draining the oleoresin
whilst felling the tree for timber (Plowden 2004). Even the former practice was likely to
lethally damage the tree, however, and this harvest method is now prohibited in most
protected areas. Contemporary harvesting uses a borer to drill a small hole (19 mm in
diameter) into the tree trunk from which oleoresin may be drained through plastic
tubing (Leite et al. 2001). If the hole is then sealed, the oleoresin stores may be
replenished and the tree may be re-drilled after a period of months or years (Newton et
al. 2011).
As a consequence of its non-perishable nature, expanding markets, and potential for
ecological sustainability, Copaifera oleoresin represents a good candidate resource for
commercial extractivism. Academics, government agencies, and NGOs across
Amazonia are interested in the physical and chemical properties and harvest potential of
this oleoresin, and the ecology of source populations (Santos et al. 2001). There is little
history of Copaifera oleoresin harvesting within our study site, but local agencies are
actively promoting this extractive activity. For these reasons, we selected this NTFP as a
case-study resource for this thesis.
Chapter 1: Introduction
10
1.4 Payments for environmental services
The development of payments for environmental services (PES) programmes is a
second, more recently emerging, mechanism by which to address conservation concerns
whilst bringing development benefits to rural people. PES programmes seek to translate
the value of natural capital into market values (Engel et al. 2008). This is achieved by
transferring funds from those that benefit from environmental services (ES) – who may
be downstream users, national governments or, in the case of many carbon services, the
global community – to those whose land-use practices are responsible for maintaining
those ES (Wunder 2005). Programmes vary enormously in their spatial extent, payment
structure, and values, but are united by the „business-like‟ transactions that define their
approach to achieving conservation goals (Wunder et al. 2008). The PES paradigm is
not foremost intended to be a poverty-alleviation mechanism but the inherent
geographic congruence of welfare needs and threatened ES creates great potential for
identifying development goals as a secondary aspiration (Wunder 2008). PES
programmes have been implemented across a range of biomes but with particular
emphasis on tropical forest areas following Costa Rica‟s pioneering PES programme
(Pagiola 2008).
1.4.1 The PES programme Bolsa Floresta
A large-scale PES programme, the Bolsa Floresta, has been implemented across
extractive reserves in the Brazilian state of Amazonas since 2007 (Viana 2008).
Enrolled participants are reserve residents who agree not to clear any primary forest, in
return for cash payments and developmental support. In terms of scale, the Bolsa
Floresta is one of the largest PES programmes introduced in a tropical forest region,
with over 7,000 families enrolled and an ambitious planned expansion. We use this
programme as a case-study in our examination of how PES may act as a complementary
or alternative conservation mechanism in tropical forest areas.
1.5 Thesis background
1.5.1 Objectives
This thesis examines issues of sustainable resource use and socioeconomic development
within the context of Amazonian extractive reserves. Specifically, this study quantifies
patterns of livelihood strategies of rural Amazonians and explores the potential for
NTFP commercialisation and PES programmes to play a role in tropical forest
Chapter 1: Introduction
11
conservation and the development of rural livelihoods. The thesis uses two case-studies
– Copaifera oleoresin as an NTFP and the Bolsa Floresta PES programme – as
examples of contemporary conservation and development mechanisms. By exploring
the current contribution of agrarian and extractive activities to rural livelihoods, it is
possible to assess the likely contribution of both NTFP extraction and PES payments to
household incomes.
1.5.2 Interdisciplinary science
Conservation academia has increasingly recognised the benefit to be gained from
interdisciplinary research that draws upon both the natural and social sciences
(Campbell 2005; Kainer et al. 2006). Ecological and social problems in the tropics are
frequently linked not only by their geographic congruence but also by their underlying
drivers, and so the division of conservation and socioeconomic development is neither
necessarily desirable nor productive. The central subjects of this thesis – extractive
reserves, commercial NTFP harvesting, and PES programmes – have all been discussed
within the context of achieving both conservation and development goals. A holistic
understanding of the issues addressed by this study therefore demands an
interdisciplinary approach, and I thus draw upon both ecological and social science
research methods.
1.5.3 Study site
1.5.3.1 Amazonas
This study examines resource use within intact tropical forest areas, with a focus on the
Brazilian state of Amazonas. Occupying 1.57 million km2, Amazonas is the largest
Brazilian state and retains 96.2% of its original forest cover (INPE 2011). Almost half
of the state (76,907,408 ha; 49.0%) is designated as protected areas, with the proportion
of inhabited reserves (41.8%) vastly exceeding that of strictly protected areas (7.2%)
(ARPA 2009; Fig. 1.2). Amazonas has consequently been a centre of attention for
conservation and research programmes aiming to understand and protect livelihoods,
environmental services, and biodiversity within extensive intact primary forest areas
and extractive reserves.
Amazonas has a total population of 3.5 million people, but 51.5% of these live in the
state capital, Manaus, and a further 27.6% live in municipal towns (IBGE 2011). Rural
population density is thus just 0.5 per km2 and the rural population of ~728,000 people
Chapter 1: Introduction
12
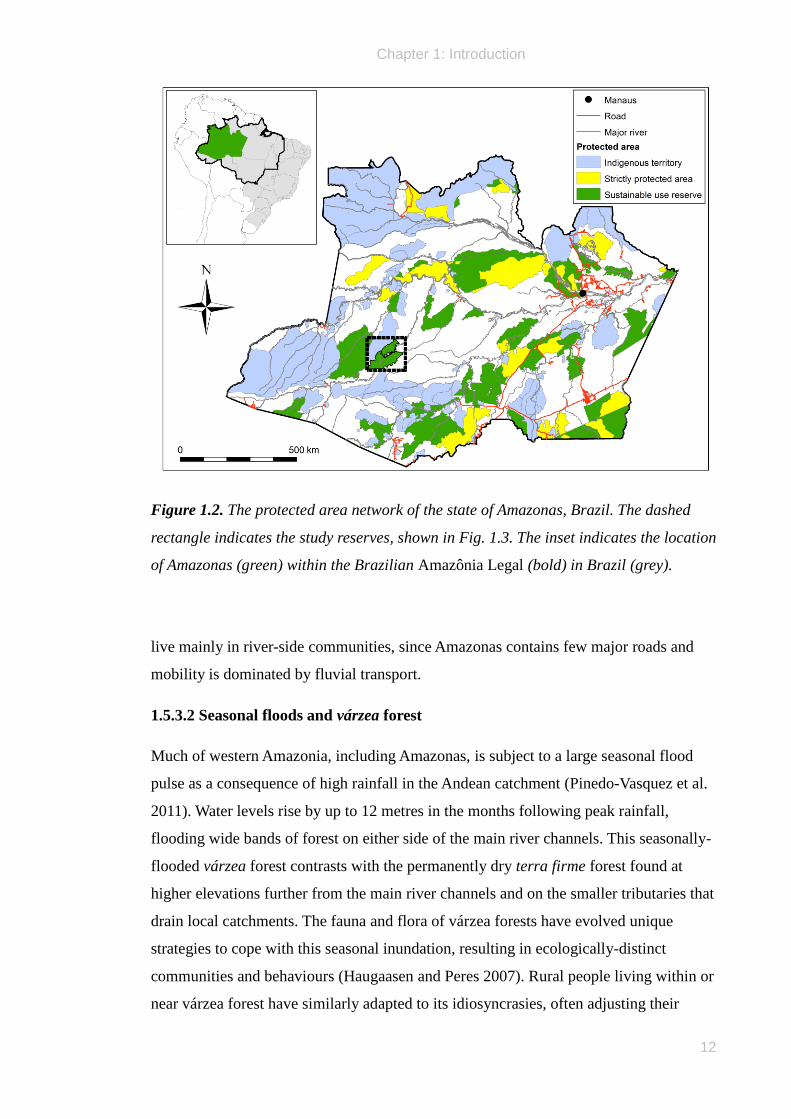
Figure 1.2. The protected area network of the state of Amazonas, Brazil. The dashed
rectangle indicates the study reserves, shown in Fig. 1.3. The inset indicates the location
of Amazonas (green) within the Brazilian Amazônia Legal (bold) in Brazil (grey).
live mainly in river-side communities, since Amazonas contains few major roads and
mobility is dominated by fluvial transport.
1.5.3.2 Seasonal floods and várzea forest
Much of western Amazonia, including Amazonas, is subject to a large seasonal flood
pulse as a consequence of high rainfall in the Andean catchment (Pinedo-Vasquez et al.
2011). Water levels rise by up to 12 metres in the months following peak rainfall,
flooding wide bands of forest on either side of the main river channels. This seasonally-
flooded várzea forest contrasts with the permanently dry terra firme forest found at
higher elevations further from the main river channels and on the smaller tributaries that
drain local catchments. The fauna and flora of várzea forests have evolved unique
strategies to cope with this seasonal inundation, resulting in ecologically-distinct
communities and behaviours (Haugaasen and Peres 2007). Rural people living within or
near várzea forest have similarly adapted to its idiosyncrasies, often adjusting their
Chapter 1: Introduction
13
livelihood strategies seasonally to take advantage of opportunities to access alternative
resources presented by rising and falling floodwaters (Pinedo-Vasquez et al. 2011).
1.5.3.3 Médio Juruá study site
Most of the data in this thesis were collected within and around two contiguous
extractive reserves bisected by the Juruá River, a large white-water tributary of the
Amazon (Solimões) River in the state of Amazonas, Brazil. The federally-managed
Médio Juruá Extractive Reserve (hereafter, ResEx Médio Juruá) occupies 253,227
hectares, whilst the larger, state-managed Uacari Sustainable Development Reserve
(hereafter, RDS Uacari) is 632,949 hectares in area (Fig. 1.3).
A 10 – 20 km wide band of várzea forest spanning the main river channel is subjected to
a prolonged flood-pulse every year between January and June, whilst terra firme forests
on higher elevation are never inundated. The elevation is 65 – 170 m above sea level
and the terrain is flat or undulating. The area has a wet, tropical climate; daily rainfall
recorded at the Bauana Ecological Field Station (S 5°26' 19.032" W 67°17' 11.688")
indicated that 3,659 mm and 4,649 mm of rain fell annually in 2008 and 2009,
respectively. All forest within the study site was intact, primary forest which had
experienced virtually no logging activity except for some historical selective removal of
the largest adult trees of commercial timber species (including Copaifera spp.) from
várzea forest between 1970 and 1995 (Scelza 2008). Timber extraction ended with the
creation of the reserves.
The ResEx Médio Juruá and RDS Uacari were decreed in 1997 and 2005, respectively,
and are currently inhabited by some 4,000 legal residents distributed across
approximately 60 settlements of between 1 and 89 households (mean ± SD = 10.3 ±
13.2, median = 7, N = 50). Most communities are located along the main river channel,
while others are settled on the banks of tributaries and oxbow lakes on either side of the
Juruá River. Reserve residents variously engage in agricultural, extractive, and fishing
activities for both subsistence and cash income (SDS 2010).
These reserves are two of the most „traditionally-functioning‟ reserves in Amazonas
(H.S.A. Carlos (SDS), personal communication). Although administered by different
government agencies, the two reserves are geographically contiguous, and their shared
ecological, socioeconomic, and income opportunities unify them to a much greater
Chapter 1: Introduction
14
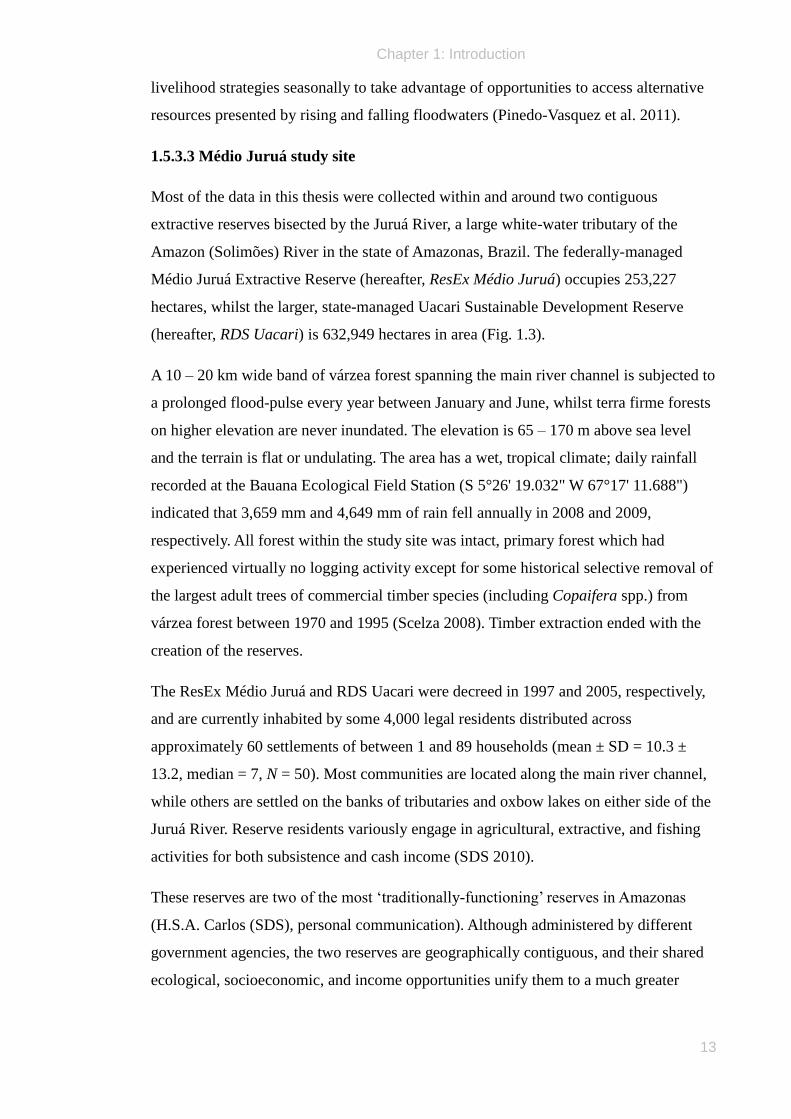
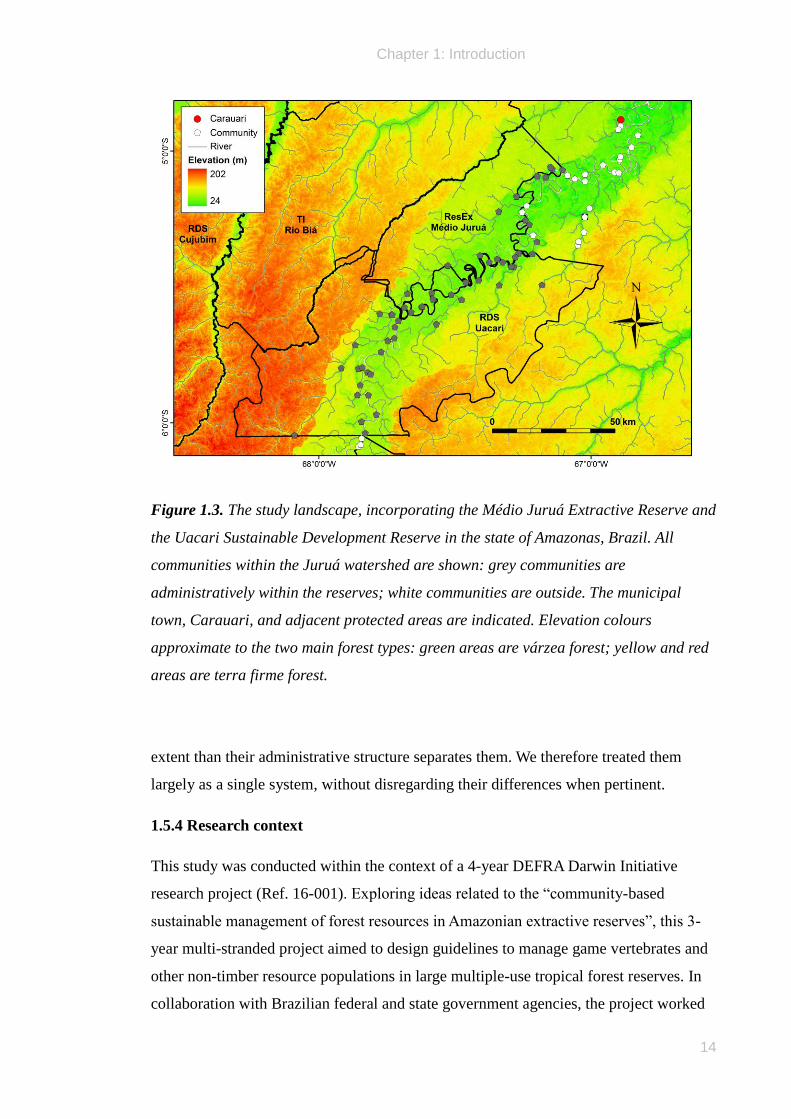
Figure 1.3. The study landscape, incorporating the Médio Juruá Extractive Reserve and
the Uacari Sustainable Development Reserve in the state of Amazonas, Brazil. All
communities within the Juruá watershed are shown: grey communities are
administratively within the reserves; white communities are outside. The municipal
town, Carauari, and adjacent protected areas are indicated. Elevation colours
approximate to the two main forest types: green areas are várzea forest; yellow and red
areas are terra firme forest.
extent than their administrative structure separates them. We therefore treated them
largely as a single system, without disregarding their differences when pertinent.
1.5.4 Research context
This study was conducted within the context of a 4-year DEFRA Darwin Initiative
research project (Ref. 16-001). Exploring ideas related to the “community-based
sustainable management of forest resources in Amazonian extractive reserves”, this 3-
year multi-stranded project aimed to design guidelines to manage game vertebrates and
other non-timber resource populations in large multiple-use tropical forest reserves. In
collaboration with Brazilian federal and state government agencies, the project worked
Chapter 1: Introduction
15
to develop effective community-based wildlife management programmes that were
grounded in the socioeconomic reality of Amazonian extractive reserves. Data
collection protocols and logistical operations employed by this project were a key
contribution to this thesis.
1.6 Thesis structure
The five principal chapters (chapters 2 - 6) are written in the form of peer-reviewed
papers. At the time of submission, one chapter was published (chapter 4: Newton et al.
2011), and two chapters were in press (chapter 2: Newton et al. in press a; chapter 6:
Newton et al. in press b). Chapter 2 describes the heterogeneity in livelihood strategies
adopted by rural Amazonians living in extractive reserves, relating these patterns to
demographic, geographic, and socioeconomic determinants. In illustrating the principal
patterns and drivers of contemporary resource use by reserve residents, this chapter will
define the context for the remainder of the thesis. In chapters 3 to 5 I use the case-study
of Copaifera oleoresin to explore the multiple disciplines that contribute to a holistic
understanding of commercial NTFP harvesting. Seeking first to define the spatial
distribution of this resource at a basin-wide, landscape, and local scale, I aim to
demonstrate in chapter 3 how a cross-scale approach can be useful in understanding
variation in resource density and spatial distribution. Chapter 4 describes the results of a
quantitative experimental harvest of four species of Copaifera and assesses how
morphological and environmental drivers may influence harvest yields of an NTFP. In
an interdisciplinary synthesis, Chapter 5 combines results from the spatial and harvest
studies with novel socioeconomic and market data. Using spatial accessibility models, I
generate estimates of the potential volumetric and monetary values of oleoresin that
could be harvested from the study area. Chapter 6 examines the concept of PES as an
alternative, market-based mechanism by which some of the problems of tropical forest
loss may be addressed. I assess whether the payment structure of the Bolsa Floresta
programme may be limiting its ability to achieve its conservation goals. Finally, Chapter
7 draws together some of the implications and conclusions of the thesis, and suggests
directions for future work.
1.7 References
Allegretti, M.H., 1990. Extractive reserves: an alternative for reconciling development
and environmental conservation in Amazonia. In: Anderson, A.B. (Ed.). Alternatives to
Chapter 1: Introduction
16
deforestation: steps toward sustainable use of the Amazonian rain forest, pp. 252-264.
Columbia University Press, New York.
ARPA, 2009. Programa Àreas Protegidas da Amazônia: Amazônia Brasileira. Instituto
Socioambiental, Manaus.
Asner, G.P., Knapp, D.E., Broadbent, E.N., Oliveira, P.J.C., Keller, M., Silva, J.N.,
2005. Selective logging in the Brazilian Amazon. Science 310, 480-482.
Belcher, B., Ruiz-Perez, M., Achdiawan, R., 2005. Global patterns and trends in the use
and management of commercial NTFPs: implications for livelihoods and conservation.
World Development 33, 1435-1452.
Belcher, B., Schreckenberg, K., 2007. Commercialisation of non-timber forest products:
a reality check. Development Policy Review 25, 355-377.
Belcher, B.M., 2003. What isn't an NTFP? International Forestry Review 5, 161-162.
Browder, J.O., 1992. The limits of extractivism - tropical forest strategies beyond
extractive reserves. Bioscience 42, 174-183.
Brown, K., Rosendo, S., 2000. Environmentalists, rubber tappers and empowerment:
the politics and economics of extractive reserves. Development and Change 31, 201-
227.
Campbell, L.M., 2005. Overcoming obstacles to interdisciplinary research.
Conservation Biology 19, 574-577.
Chhatre, A., Agrawal, A., 2009. Trade-offs and synergies between carbon storage and
livelihood benefits from forest commons. Proceedings of the National Academy of
Sciences of the United States of America 106, 17667-17670.
de Beer, J.H., Mcdermott, M., 1989. The economic value of non-timber forest products
in South East Asia. The Netherlands Committee for IUCN, Amsterdam.
Dean, W., 1987. Brazil and the struggle for rubber. Cambridge University Press,
Cambridge.
Engel, S., Pagiola, S., Wunder, S., 2008. Designing payments for environmental
services in theory and practice: an overview of the issues. Ecological Economics 65,
663-674.
Chapter 1: Introduction
17
Fearnside, P.M., 1989. Extractive reserves in Brazilian Amazonia. Bioscience 39, 387-
393.
Fearnside, P.M., 2002. Avança Brasil: environmental and social consequences of
Brazil's planned infrastructure in Amazonia. Environmental Management 30, 735-747.
Galetti, M., Fernandez, J.C., 1998. Palm heart harvesting in the Brazilian Atlantic
forest: changes in industry structure and the illegal trade. Journal of Applied Ecology
35, 294-301.
Haugaasen, T., Peres, C.A., 2007. Vertebrate responses to fruit production in Amazonian
flooded and unflooded forests. Biodiversity and Conservation 16, 4165-4190.
Hecht, S.B., 1993. The logic of livestock and deforestation in Amazonia. Bioscience 43,
687-695.
Hecht, S.B., Cockburn, A., 1989. The fate of the forest: developers, destroyers and
defenders of the Amazon. Verso, London and New York.
IBGE, 2011. Instituto Brasileiro de Geografia e Estatística. Sistema IBGE de
recuperação automatica (SIDRA). URL www.sidra.ibge.gov.br.
INPE 2011 Instituto Nacional de Pesquisa Espacais: Projeto PRODES: monitoramento
da floresta amazônica brasileira por satélite. URL www.obt.inpe.br/prodes/index.html.
Kainer, K.A., Schmink, M., Covert, H., Stepp, J.R., Bruna, E.M., Dain, J.L., Espinosa,
S., Humphries, S., 2006. A graduate education framework for tropical conservation and
development. Conservation Biology 20, 3-13.
Koziell, I., Saunders, J., 1996. Living off biodiversity: exploring livelihoods and
biodiversity issues in natural resources management. International Institute for
Environment and Development (IIED), London.
Laurance, W.F., Cochrane, M.A., Bergen, S., Fearnside, P.M., Delamônica, P., Barber,
C., D'Angelo, S., Fernandes, T., 2001. The future of the Brazilian Amazon. Science 291,
438-439.
Leite, A., Alechandre, A., Rigamonte-Azevedo, C., Campos, C.A., Oliveira, A., 2001.
Recomendações para o manejo sustentável do óleo de copaíba. Universidade Federal do
Acre and Secretaria Executiva de Floresta e Extrativismo (SEFE), Rio Branco.
Chapter 1: Introduction
18
Malhi, Y., Aragao, L., Galbraith, D., Huntingford, C., Fisher, R., Zelazowski, P., Sitch,
S., McSweeney, C., Meir, P., 2009. Exploring the likelihood and mechanism of a
climate-change-induced dieback of the Amazon rainforest. Proceedings of the National
Academy of Sciences of the United States of America 106, 20610-20615.
Malhi, Y., Roberts, J.T., Betts, R.A., Killeen, T.J., Li, W.H., Nobre, C.A., 2008. Climate
change, deforestation, and the fate of the Amazon. Science 319, 169-172.
Marshall, E., Schreckenberg, K., Newton, A.C., 2006. Commercialization of non-timber
forest products - factors influencing success. UNEP World Conservation Monitoring
Centre, Cambridge.
Moegenburg, S.M., Levey, D.J., 2002. Prospects for conserving biodiversity in
Amazonian extractive reserves. Ecology Letters 5, 320-324.
Mori, S.A., 1992. The Brazil nut industry - past, present, and future. In: Sustainable
harvest and marketing of rain forest products. eds M. Plotkin, L. Famolare, pp. 241-251.
Island Press, Washington.
Myers, N., 1988. Tropical forests - much more than stocks of wood. Journal of Tropical
Ecology 4, 209-221.
Nepstad, D., 1992. The challenge of non-timber forest product extraction. Advances in
Economic Botany 9, 143-146.
Nepstad, D., Schwartzman, S., Bamberger, B., Santilli, M., Ray, D., Schlesinger, P.,
Lefebvre, P., Alencar, A., Prinz, E., Fiske, G., Rolla, A., 2006. Inhibition of Amazon
deforestation and fire by parks and indigenous lands. Conservation Biology 20, 65-73.
Newton, P., Endo, W., Peres, C.A., In press a. Determinants of livelihood strategy
variation in two extractive reserves in Amazonian flooded and unflooded forest.
Environmental Conservation.
Newton, P., Nichols, E., Endo, W., Peres, C.A., In press b. Consequences of actor level
livelihood heterogeneity for additionality in an undifferentiated payment-based
payments for environmental services programme in a tropical forest region. Global
Environmental Change.
Chapter 1: Introduction
19
Newton, P., Watkinson, A.R., Peres, C.A., 2011. Determinants of yield in a non-timber
forest product: Copaifera oleoresin in Amazonian extractive reserves. Forest Ecology
and Management 261, 255-264.
Padoch, C., 1992. Marketing of non-timber forest products in western Amazonia:
general observations and research priorities. Advances in Economic Botany 9, 43-50.
Pagiola, S., 2008. Payments for environmental services in Costa Rica. Ecological
Economics 65, 712-724.
Peres, C.A., Barlow, J., Laurance, W.F., 2006. Detecting anthropogenic disturbance in
tropical forests. Trends in Ecology & Evolution 21, 227-229.
Perz, S., Brilhante, S., Brown, F., Caldas, M., Ikeda, S., Mendoza, E., Overdevest, C.,
Reis, V., Fernando Reyes, J., Rojas, D., Schmink, M., Souza, S., Walker, R., 2008. Road
building, land use and climate change: prospects for environmental governance in the
Amazon. Philosophical Transactions of the Royal Society B – Biological Sciences 363,
1889-1895.
Peters, C.M., Gentry, A.H., Mendelsohn, R.O., 1989. Valuation of an Amazonian
rainforest. Nature 339, 655-656.
Pinedo-Vasquez, M., Ruffino, M.L., Padoch, C., Brondízio, E.S., 2011. The Amazon
várzea – the decade past and the decade ahead. Springer, New York.
Plowden, C., 2004. The ethnobotany of copaíba (Copaifera) oleoresin in the Amazon.
Economic Botany 58, 729-733.
Rodrigues, A.S.L., Ewers, R.M., Parry, L., Souza Jr., C., Verissimo, A., Balmford, A.,
2009. Boom-and-bust development patterns across the Amazon deforestation frontier.
Science 324, 1435-1437.
Ruiz-Perez, M., Almeida, M., Dewi, S., Costa, E.M.L., Pantoja, M.C., Puntodewo, A.,
Postigo, A.D., de Andrade, A.G., 2005. Conservation and development in Amazonian
extractive reserves: the case of Alto Jurua. Ambio 34, 218-223.
Rylands, A.B., Brandon, K., 2005. Brazilian protected areas. Conservation Biology 19,
612-618.

Chapter 1: Introduction
20
Salafsky, N., Dugelby, B.L., Terborgh, J.W., 1993. Can extractive reserves save the rain-
forest – an ecological and socioeconomic comparison of nontimber forest product
extraction systems in Peten, Guatemala, and West Kalimantan, Indonesia. Conservation
Biology 7, 39-52.
Salisbury, D.S., Schmink, M., 2007. Cows versus rubber: changing livelihoods among
Amazonian extractivists. Geoforum 38, 1233-1249.
Santos, J.C., Leite, A.C.P., Wadt, L.H.O., Borges, K.H., Andrade, F.G., Menezes, R.S.,
Muniz, P.S.B., 2001. Demandas tecnológicas para o sistema produtivo de oleo de
copaíba (Copaifera spp.) no Estado do Acre. Embrapa Acre, Rio Branco.
Sastry, C.B., 2001. Rattan in the twenty-first century - an overview. Unasylva 205 52.
Scelza, G.C., 2008. Desobriga: o movimento de contra-opressão ao sistema dos
seringais no Médio Juruá – AM (1970-2008). MSc dissertation. Instituto de Filosofia e
Ciências Sociais. Universidade Federal do Rio de Janeiro, Rio de Janeiro.
Schwartzman, S., Moreira, A., Nepstad, D., 2000. Rethinking tropical forest
conservation: Perils in parks. Conservation Biology 14, 1351-1357.
SDS, 2010. Plano de gestão da Reserva de Desenvolvimento Sustentavel de Uacari. In:
Série Técnica Planos de Gestão. Secretaria de Estado do Meio Ambiente e
Desenvolvimento Sustentàvel, Carauari.
Shanley, P., Luz, L., Swingland, I.R., 2002. The faint promise of a distant market: a
survey of Belem's trade in non-timber forest products. Biodiversity and Conservation
11, 615-636.
Shanley, P., Medina, G., 2005. Frutíferas e plantas úteis na vida Amazônica. CIFOR &
Imazon, Belém.
Sills, E., Saha, S., 2010. Subsidies for rubber: conserving rainforests while sustaining
livelihoods in the Amazon? Journal of Sustainable Forestry 29, 152-173.
Silva, M., 2005. The Brazilian protected areas program. Conservation Biology 19, 608-
611.
Chapter 1: Introduction
21
Soares-Filho, B.S., Nepstad, D.C., Curran, L.M., Cerqueira, G.C., Garcia, R.A., Ramos,
C.A., Voll, E., McDonald, A., Lefebvre, P., Schlesinger, P., 2006. Modelling
conservation in the Amazon basin. Nature 440, 520-523.
Vadjunec, J.M., Rocheleau, D., 2009. Beyond forest cover: land use and biodiversity in
rubber trail forests of the Chico Mendes extractive reserve. Ecology and Society 14, 29.
Veiga Junior, V.F., Pinto, A.C., 2002. O gênero Copaifera L. Quimica Nova 25, 273-
286.
Viana, V., 2008. Bolsa Floresta (Forest Conservation Allowance): an innovative
mechanism to promote health in traditional communities in the Amazon. Estudos
Avançados 22, 64.
Weinstein, S., Moegenburg, S., 2004. Açaí palm management in the Amazon estuary:
course for conservation or passage to plantations? Conservation and Society 2, 315-346.
Wittemyer, G., Elsen, P., Bean, W.T., Burton, A.C.O., Brashares, J.S., 2008. Accelerated
human population growth at protected area edges. Science 321, 123-126.
Wunder, S., 2005. Payments for environmental services: some nuts and bolts. Center for
International Forestry Research, Bogor.
Wunder, S., 2008. Payments for environmental services and the poor: concepts and
preliminary evidence. Environment and Development Economics 13, 279-297.
Wunder, S., Engel, S., Pagiola, S., 2008. Taking stock: a comparative analysis of
payments for environmental services programs in developed and developing countries.
Ecological Economics 65, 834-852.
22
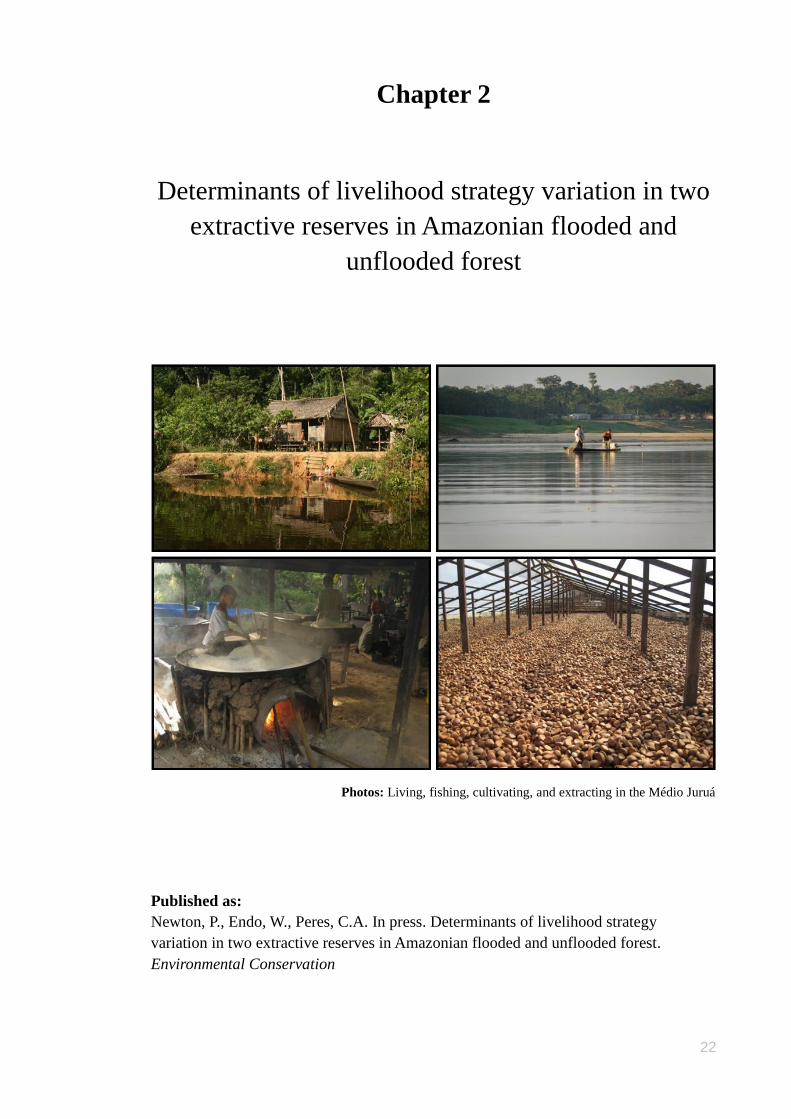
Chapter 2
Determinants of livelihood strategy variation in two
extractive reserves in Amazonian flooded and
unflooded forest
Photos: Living, fishing, cultivating, and extracting in the Médio Juruá
Published as:
Newton, P., Endo, W., Peres, C.A. In press. Determinants of livelihood strategy
variation in two extractive reserves in Amazonian flooded and unflooded forest.
Environmental Conservation
Chapter 2: Livelihood strategies
23
2.1 Abstract
Managers of extractive reserves need to understand the livelihood strategies adopted by
rural Amazonians in order to implement projects that benefit the livelihoods of local
residents whilst maintaining forest integrity. Whilst resident populations are often
descended from immigrant rubber-tappers, dynamic economic and social conditions
have led to a recent diversification of land use practices. Our two-year study in two
large contiguous extractive reserves encompassing both unflooded (terra firme) and
seasonally flooded (várzea) forest, shows the degree to which local livelihood strategies
of different settlements are heterogeneous. Extractive offtake of forest products and fish
catches and agricultural activities, together with income from sales, of 82 households in
10 communities were quantified in detail by means of weekly surveys. The survey data
were combined with interviews to examine the demographic and wealth profile, and
engagement in alternative activities, in 181 households across 27 communities. All
households and communities were engaged in all three subsistence activity types, but
there was large variation in engagement with income-generating activities. Households
within a community showed considerable congruence in their income-generating
activity profiles, but there was significant variation between communities. Yields from
agriculture and fishing were more temporally stable than extraction of highly-seasonal
forest products. Generalised linear mixed models showed that forest type was
consistently important in explaining yields of both agrarian and extractive products.
Communities with greater access to terra firme forest were inherently more agricultural,
and strongly committed to manioc production. Communities with greater access to
flooded forest, however, showed a greater dependence on fishing. We argue that
conservation should be more attuned to the diversity and dynamism of livelihood
strategies in protected areas; in particular, reserve managers and policy makers should
account for the effect of local variation in physical geography when designing
sustainable development projects.
2.2 Introduction
Developing rural livelihoods within protected areas is an important means of achieving
conservation objectives in Amazonia (Campos and Nepstad 2006). As part of this
strategy, sustainable-development and multiple-use reserves (hereafter, collectively
referred to as extractive reserves) currently account for over 14% of Brazilian
Amazonia, and are being created at a faster rate than traditional, strictly-protected areas
Chapter 2: Livelihood strategies
24
(ARPA 2009). Extractive reserves have been defined as forest areas inhabited by
extractive populations granted long-term usufruct rights to forest resources which they
collectively manage (Schwartzman 1989). As legally-occupied protected areas,
extractive reserves aim to ensure the conservation of biodiversity and environmental
services whilst providing opportunities for sustainable resource use (Allegretti 1990).
The fate of Amazonian forests is therefore intricately associated with the lasting success
of extractive reserves as an integrated conservation-development concept. In turn, the
likelihood of such reserves achieving a balance between conservation aims and
socioeconomic development is significantly influenced by the aggregate resource-use
behavioural patterns of their residents (Takasaki et al. 2001).
Most non-tribal rural Amazonians were originally drawn to the region by the rubber-
booms of the late 19th
and mid-20th
centuries, when their principal income-generating
activities were the extraction and sale of natural rubber (latex of Hevea spp.), Brazil
nuts (seeds of Bertholletia excelsa) and the palatable latex of sorva (Couma spp.) (Dean
1987). However, extractive populations living in intact tropical forest regions have also
traditionally exploited a diverse array of the available natural resources for both
subsistence and commerce. The extraction of such forest products, which include a wide
variety of plant and animal resources, is hugely important in subsidising the household
economies of millions of rural forest dwellers worldwide (Koziell and Saunders 1996).
Rural Amazonians have been forced to substantially shift their livelihood strategies as a
consequence of dynamic social, economic and political pressures and opportunities.
Foremost, the collapse of Brazilian rubber exports saw a diversification of economic
portfolios amongst former rubber-tappers (Dean 1987). Subsequently, the creation of
extractive reserves, the associated formation of residents‟ associations, increasing levels
of support from management agencies and non-government organisations (NGOs), and
changing markets for non-timber forest products (NTFPs) have all broadly shaped the
evolution of livelihood strategies in Amazonian forest reserves (Hall 2004).
In aggregate, there has been a trend away from traditional extractive exploitation
(hereafter, extractivism) and towards cattle-ranching and agricultural development in
several Amazonian extractive reserves (Ruiz-Perez et al. 2005; Salisbury and Schmink
2007; Vadjunec and Rocheleau 2009). Even in largely forested areas of rural Amazonia,
small-scale agriculture usually involves successive rotation between cleared forest plots,
thereby resulting in shifting land-use, often involving detrimental long-term impacts on
Chapter 2: Livelihood strategies
25
forest cover. The economic prospects of reserve residents may be enhanced in the short
term (Hecht 1993), but ephemeral gains in livelihood quality associated with land
conversion are often rapidly followed by collapses in both natural capital and living
standards (Rodrigues et al. 2009).
Describing pronounced aggregate shifts in livelihood strategies can fail, however, to
identify more subtle differences in the contemporary activity budgets adopted by
Amazonian agro-extractivist populations. Divergences in livelihood strategy may also
occur at the household or community level (Coomes and Burt 2001). Understanding the
behavioural patterns of rural Amazonians, and the drivers of these patterns, is a critical
step towards managing legally occupied protected areas to meet the long-term interests
of both forest conservation and local livelihoods. Various demographic, economic,
geographic and historical factors are known to influence resource use decision-making
in semi-sedentary horticultural societies in the humid tropics. For example, the
availability of land suitable for cultivating perennial food-crops in roçados (swidden
fields) has shaped the settlement patterns of rural Amazonians (Parry et al. 2010a;
Takasaki et al. 2001). Engagement in commercial NTFP extractivism can be determined
both by access to local markets (Ruiz-Perez et al. 2004) or by migrant and educational
background (Stoian 2005). Access to education, healthcare, welfare subsidies and other
forms of livelihood support may drive migration patterns of individuals, families or
entire communities (Parry et al. 2010a). Deforestation rates often increase with
smallholder wealth (Pacheco 2009).
Studying heterogeneity and dynamism in livelihood patterns is important (Salisbury and
Schmink 2007) because agencies working with extractive reserves would benefit from a
detailed understanding of how various factors drive or predict the economic activity
patterns with which reserve residents engage (Nepstad et al. 2002). This understanding
will indicate: i) whether reserves are likely to continue to serve as effective barriers to
deforestation (Nepstad et al. 2006); ii) whether they may counter the broad Amazonian
trend of rural depopulation (Parry et al. 2010b); and iii) whether or not management
programmes and directives should be applied uniformly across different extractive
reserves, ignoring within-reserve heterogeneity (Coomes and Barham 1997).Targeted
implementation of management policy, commercial extractivism initiatives and
payments for environmental services (PES) programmes will benefit from awareness of
the context in which they are being developed. Research and promotion of extractive
Chapter 2: Livelihood strategies
26
activities should thus be undertaken with consideration of the livelihoods affected by
them.
Here we quantitatively assess the variation in livelihood strategies and modes of
production by residents of two extractive reserves in western Brazilian Amazonia with
respect to their engagement with both subsistence and income-generating activities. We
examine the spatial and temporal heterogeneity in livelihood strategies at the levels of
both households and entire communities, and seek to understand the factors driving this
variation. If household or community characteristics can explain spatial or temporal
variation in livelihood strategies, these characteristics may be used to target the
implementation of development programmes and subsidies.
2.3 Methods
2.3.1 Study site
The study was conducted within and around two contiguous extractive reserves bisected
by the Juruá River, a large white-water tributary of the Amazon (Solimões) River in the
state of Amazonas, Brazil. The federally-managed Médio Juruá Extractive Reserve
(hereafter, ResEx Médio Juruá) occupies 253,227 hectares, whilst the larger, state-
managed Uacari Sustainable Development Reserve (hereafter, RDS Uacari) is 632,949
hectares in area (Fig. 2.1). The elevation is 75–175 m above sea level and the terrain is
flat or undulating. A wide band of seasonally flooded (várzea) forests along the main
river channel are inundated between January and June, whilst terra firme forests at
higher elevation are never flooded. The area has a wet, tropical climate; rainfall
recorded at the Bauana Ecological Field Station (S 5°26' 19.032" W 67°17' 11.688")
during the study period indicated that 3,659 mm and 4,649 mm of rain fell annually in
2008 and 2009, respectively.
The ResEx Médio Juruá and the RDS Uacari, which were decreed in 1997 and 2005,
respectively, are currently inhabited by some 4,000 legal residents, living in ~74
communities of 1 – 89 households each. Many communities are located on the main
river channel, whilst others are found on the banks of tributaries and oxbow lakes on
either side of the Juruá River. Residents of these extractive reserves are variously
engaged in agricultural and extractive activities for both subsistence and cash income
(SDS 2010).
Chapter 2: Livelihood strategies
27
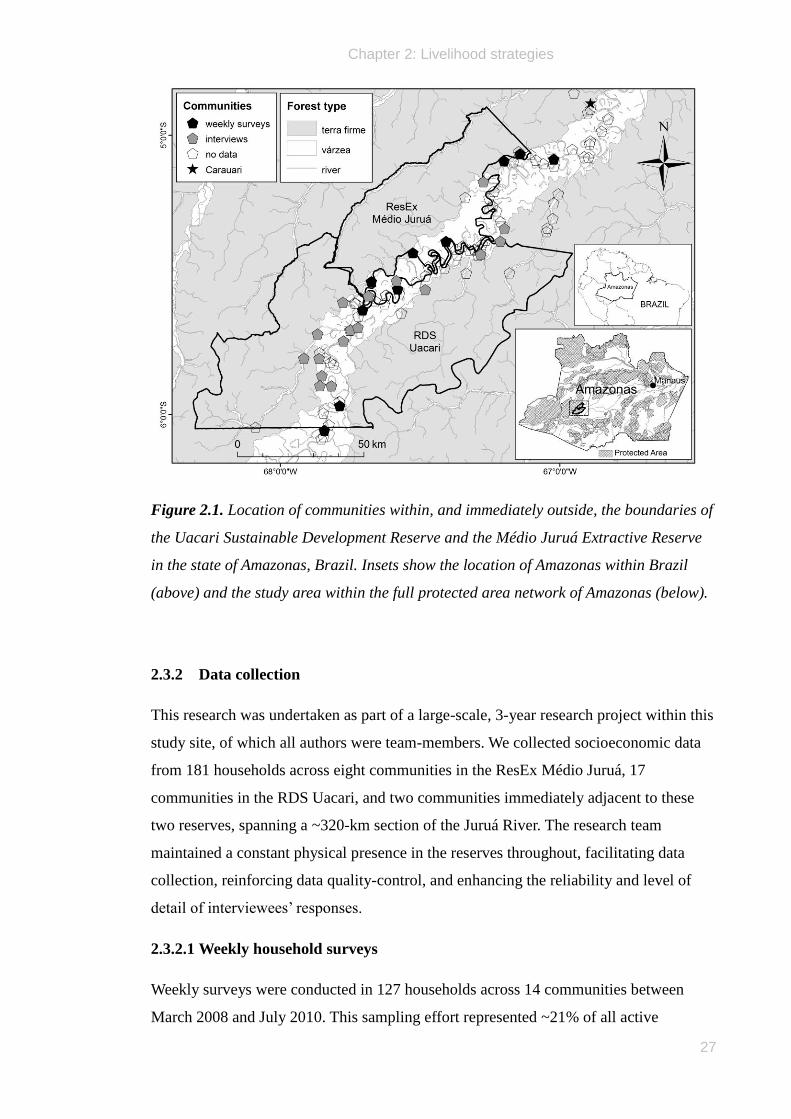
Figure 2.1. Location of communities within, and immediately outside, the boundaries of
the Uacari Sustainable Development Reserve and the Médio Juruá Extractive Reserve
in the state of Amazonas, Brazil. Insets show the location of Amazonas within Brazil
(above) and the study area within the full protected area network of Amazonas (below).
2.3.2 Data collection
This research was undertaken as part of a large-scale, 3-year research project within this
study site, of which all authors were team-members. We collected socioeconomic data
from 181 households across eight communities in the ResEx Médio Juruá, 17
communities in the RDS Uacari, and two communities immediately adjacent to these
two reserves, spanning a ~320-km section of the Juruá River. The research team
maintained a constant physical presence in the reserves throughout, facilitating data
collection, reinforcing data quality-control, and enhancing the reliability and level of
detail of interviewees‟ responses.
2.3.2.1 Weekly household surveys
Weekly surveys were conducted in 127 households across 14 communities between
March 2008 and July 2010. This sampling effort represented ~21% of all active
Chapter 2: Livelihood strategies
28
households in these two reserves. One resident from each community, who had been
previously trained, visited up to 10 randomly-selected households per community on a
weekly basis and recorded all extractive and agricultural activities of each household.
Each week, this trained resident questioned a senior household member about three
categories of activity important for subsistence and cash-income: 1) cultivation of
agricultural products; 2) extraction of wild plant forest resources; and 3) fishing. For
each activity, the weekly household quantities of all resources collected or produced
were recorded, together with their ultimate use (consumed locally or sold), values and
markets for traded goods. In the interest of comparability, these questionnaires were
based on those used in a biological monitoring programme including several protected
areas within the state of Amazonas (Ferraz et al. 2008). The time interval of data
collection varied between communities, and some weekly data were missing due to
absences of monitoring personnel. We therefore analysed data from all households for
which data were available for at least 40 weeks spread over at least a single period of
365 consecutive days, resulting in a subset of 82 households from 10 communities
(mean ± SD number of weekly samples per household = 66.6 ± 10.3). Another 45
households sampled failed to capture a full year-round seasonality cycle, and were
therefore excluded from the analyses. Data on game harvest were also collected by these
surveys but, in these reserves, hunting accounted for a minor source of animal protein
relative to fishing, and cash-income from hunting (which is in any case illegal) was
negligible. Since the study‟s aim was to compare the subsistence and income value of
legal activities, all hunting data were thus excluded from our analyses.
2.3.2.2 One-off household and community interviews
Two modes of one-off interviews were conducted within 181 households belonging to
27 communities between June and December 2009. These interviews generated
predictor variables that were used to model livelihood strategies, and offered an
opportunity to gather data to further explain the patterns observed. Firstly, household
interviews were undertaken with one or more senior members of each household to
document the household‟s demographic profile, material assets and wealth. Interviewed
households were also asked to indicate their highest-earning main activity type as the
principal income-generating activity. Secondly, community interviews were conducted
with a senior member of each community (usually the locally elected leader) to
document the community‟s overall demographic profile, physical geographic setting,
infrastructure and material assets. Both forms of interview were structured, although
Chapter 2: Livelihood strategies
29
additional information was recorded on an ad-hoc basis if offered. We distinguish
weekly surveys (82 households in 10 communities) from one-off interviews (181
households in 27 communities) throughout the study. All communities and households
surveyed weekly were also interviewed.
2.3.3 Data analysis
2.3.3.1 Data-cleaning
Weekly survey data occasionally lacked certain details (e.g. prices in R$; R$1 =
US$0.60, March 2011) for some resources, so whenever necessary we used product-
specific prices, averaged from all other households, to fill these gaps because product
prices were temporally and spatially stable, and to allocate zero to all missing values
would have unnecessarily biased the data.
Since fish catches were presumed to greatly exceed agricultural and forest extraction
events in frequency, surveyed households were only asked details about the previous
two days in terms of fishing yields, and the total weekly income derived from fishing.
Where necessary, we multiplied the recorded data based on these two days by 3.5 to
estimate weekly offtake.
Resources were grouped according to taxonomy and end-use functionality. Agricultural
products were generally divided by species. Extractive resources were divided by
species where the taxonomy dictated the use and/or price (e.g. seeds of andiroba trees
[Carapa guianensis (Meliaceae)] were specifically used for oil extraction), but were
grouped by the extracted plant-part when collectors were less taxonomically
discriminatory (e.g. many tree species were collected for firewood, or for their bark).
Catches of most fish were reported at the level of species but these were grouped by
family using the classification system described by Santos et al. (2006).
Since each resource was recorded using different traditional units of quantity, we
hereafter define the number of yield „events‟ as the frequency with which each resource
was recorded as being produced or extracted, irrespectively of the amount produced or
harvested. All reported correlations use the Pearson coefficient, denoted by the symbol
„r‟ throughout.
Chapter 2: Livelihood strategies
30
2.3.3.2 Models
We used multi-level generalised linear mixed models to relate variation in household
production and extraction of key resources derived from alternative activity categories
to demographic and geographic variables at the household and community level. Multi-
model inference based on the AIC information criterion was used to rank the importance
of variables and produce model-averaged parameter estimates (Burnham and Anderson
2002). We built models using the package „lme4‟ in R (R Development Core Team
2010), and used the package „glmulti‟ to facilitate multi-model inference based on every
possible first-order combination of predictor variables (Calcagno 2010). This package
also calculated selection probabilities for each variable, from which we could infer their
relative importance. We incorporated a null predictor into the model, with which to
identify those predictors with a genuine effect on household production (Boughey et al.
2011).
Mean weekly production rates were calculated separately for each household for the
most frequently-produced or harvested agricultural, extractive and fishing resources.
Key household and community-level variables were identified and incorporated as
predictors, with households nested within a community, which was included as a
random variable.
Household-level variables were: „family size‟ (total number of people in the household
membership); „residence period‟ (the number of years the family had been in residence
in its current community); „welfare income‟ (the mean weekly payment received by the
household in the form of government and nongovernment support grants); and „labour
income‟ (the mean weekly household income derived from casual labour and state
employment).
Community-level variables were: „community size‟ (the number of households within
any given community); „community age‟ (the number of years the community had
occupied that location); „forest type‟ (measured as the proportion of all land (78.5 km2)
within a 5-km radius from the community centre comprised of várzea forest rather than
terra firme forest or a permanent water-body); and „distance to town‟ (the low-water
fluvial distance (km) from the community to the municipal urban centre, Carauari; Fig.
2.1). The landscape metric describing the forest type was generated in ArcGIS 9.3 using
a 5-km buffer zone around each community, overlain onto a shapefile of vegetation
types obtained from the Projeto RADAMBRASIL (1977) survey. This may be the best
Chapter 2: Livelihood strategies
31
available proxy for distinguishing forest types within the RDS Uacari, compared to
Shuttle Radar Topography Mission (SRTM) digital elevation data or alternative
vegetation classifications (SDS 2010). Since forest type was measured as the proportion
of várzea forest, it follows that a negative model coefficient for this variable indicates
that an increased availability of terra firme forest (negatively correlated with várzea
forest) has a positive influence on the modelled variable. The network analyst extension
of ArcGIS was used to generate the „distance to town‟ variable, based on the WWF
hydrosheds river network data (Lehner et al. 2006). The buffer distance was set at 5-km
for both „forest type‟ and „population density‟ (see below). Although linear distances
can only be a proxy for tropical forest accessibility, which is heavily influenced by
navigable watercourses and existing forest trails, survey data and local information
suggested that a 5-km radius was an approximate mean boundary threshold of resource
extraction.
2.4 Results
2.4.1 Weekly surveys of livelihood activities
The large number of cultivated and harvested products reported over the entire study
were grouped based on congruence of their local names and their end-use functionality,
including 21 agricultural products, 20 timber and non-timber forest extractive resources
and 17 clades (families) of fish.
Many households also gained income from other sources, including employment by the
state (as health agents, school boat drivers, research assistants and in schools; 52
households); employment by neighbours (usually as chainsaw operators or other manual
work; 21 households); and from state benefits including Bolsa Família (a family
welfare allowance from the federal government; 132 households), Bolsa Floresta (a
payment for environmental services from a non-governmental organisation (NGO); 70
households), and state pensions for elderly or disabled people (25 households).
2.4.1.1 Frequency of resource yield
A total of 17,121 yield events were recorded across the 82 focal households. The
frequency of events for the three most frequently-recorded resources in each activity
category considered individually was strongly correlated with the quantity produced or
extracted (r > 0.5, p < 0.001). The number of yield events was therefore a good proxy
Chapter 2: Livelihood strategies
32
indicator for comparing the extent of production and extraction of different resources
whose quantities were unavoidably measured using different currencies.
Each activity type was dominated by the frequent production or extraction of a small
number of key resource commodities. Agricultural activity was focused primarily on the
production of farinha (dry manioc flour) from the tubers of Manihot esculenta, a staple
carbohydrate that accounted for 63% of all agricultural yield events (Table 2.1).
A total of only eight products, including manioc flour and a number of fruits,
collectively accounted for 95% of all events with a further 12 infrequently-recorded
products jointly summing to 5%. Similarly, forest extractivism was dominated by the
collection of firewood (40% of all events), although açaí (fruit of the slender palm
Euterpe spp.) and rubber (latex of Hevea spp.) were also frequently extracted (21% and
10% of events, respectively). Eleven resources accounted for 95% of events and a
further nine accounted for the remaining 5% (Table 2.1). Seventeen families of fish
were recorded in the catches of the study households, the most frequent family of which
(Characidae: e.g. Pygocentrus spp., Colossoma spp., Brycon spp.) included piranhas,
tambaquis and pacus, accounting for 44% of all catches. Catfishes (Pimelodidae) and
cichlids (Cichlidae) were the second and third highest ranking amongst the eight fish
families that accounted for 95% of all fishing events (Table 2.1).
2.4.1.2 Local consumption vs. sales
For each of the three activity types, consumption accounted for most yield events,
indicating that commercial trade was of secondary importance to subsistence in the
livelihood strategies of these rural Amazonians (Table 2.1). However, the relative extent
of consumption and sale varied both between activity categories and resource types.
Only 12% of all 8,805 recorded fish catches were sold, compared to the 20% of 3,969
extracted forest resources. However, the proportion of agricultural products that were
sold was much higher (42%), indicating that a greater proportion of cash income is
derived from plant cultivars rather than from harvesting of wild resources. This trend
was mirrored by the mean quantity of resources sold, with fish, forest products and
agricultural resources respectively accounting for 8%, 37% and 55% of all resource
units (17,121) recorded (Table 2.1).
All agricultural products, extractive resources and fish species were consumed locally
by a minimum of one household at least once. However, many resources were
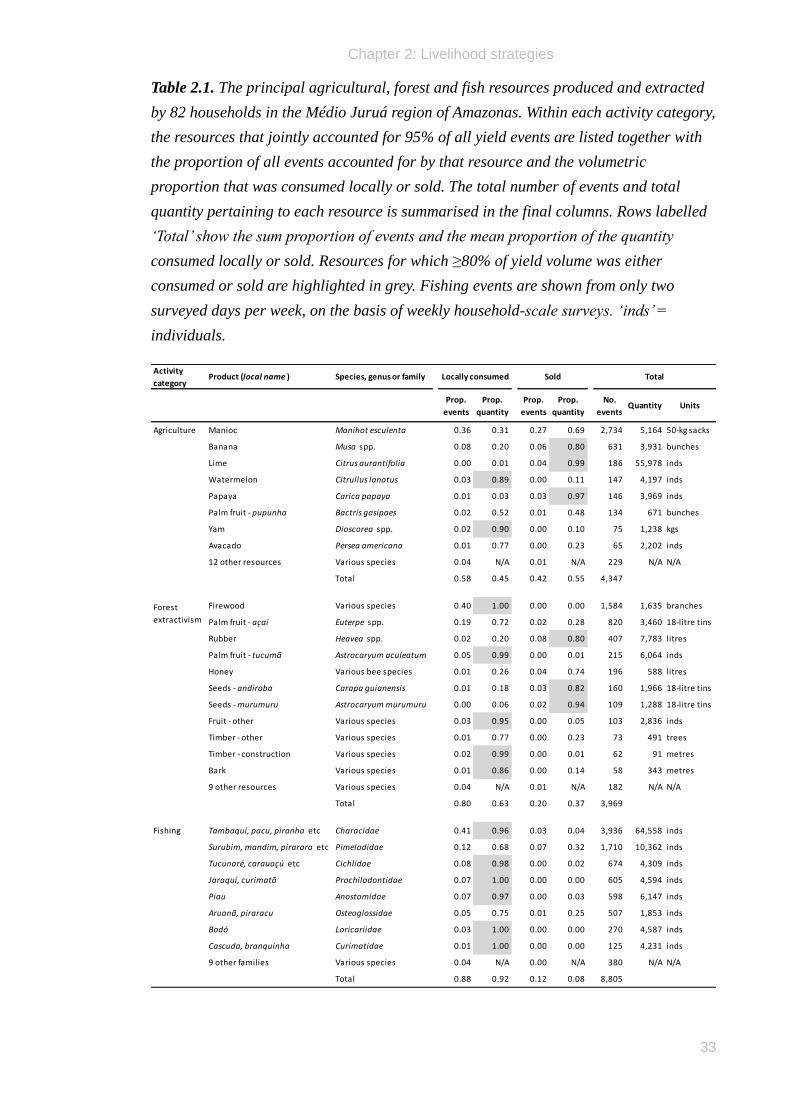
Chapter 2: Livelihood strategies
33
Table 2.1. The principal agricultural, forest and fish resources produced and extracted
by 82 households in the Médio Juruá region of Amazonas. Within each activity category,
the resources that jointly accounted for 95% of all yield events are listed together with
the proportion of all events accounted for by that resource and the volumetric
proportion that was consumed locally or sold. The total number of events and total
quantity pertaining to each resource is summarised in the final columns. Rows labelled
„Total‟ show the sum proportion of events and the mean proportion of the quantity
consumed locally or sold. Resources for which ≥80% of yield volume was either
consumed or sold are highlighted in grey. Fishing events are shown from only two
surveyed days per week, on the basis of weekly household-scale surveys. „inds‟ =
individuals.
Activity
categoryProduct (local name ) Species, genus or family
Prop.
events
Prop.
quantity
Prop.
events
Prop.
quantity
No.
eventsQuantity Units
Agriculture Manioc Manihot esculenta 0.36 0.31 0.27 0.69 2,734 5,164 50-kg sacks
Banana Musa spp. 0.08 0.20 0.06 0.80 631 3,931 bunches
Lime Citrus aurantifolia 0.00 0.01 0.04 0.99 186 55,978 inds
Watermelon Citrullus lanatus 0.03 0.89 0.00 0.11 147 4,197 inds
Papaya Carica papaya 0.01 0.03 0.03 0.97 146 3,969 inds
Palm fruit - pupunha Bactris gasipaes 0.02 0.52 0.01 0.48 134 671 bunches
Yam Dioscorea spp. 0.02 0.90 0.00 0.10 75 1,238 kgs
Avacado Persea americana 0.01 0.77 0.00 0.23 65 2,202 inds
12 other resources Various species 0.04 N/A 0.01 N/A 229 N/A N/A
Total 0.58 0.45 0.42 0.55 4,347
Firewood Various species 0.40 1.00 0.00 0.00 1,584 1,635 branches
Palm fruit - açaí Euterpe spp. 0.19 0.72 0.02 0.28 820 3,460 18-litre tins
Rubber Heavea spp. 0.02 0.20 0.08 0.80 407 7,783 litres
Palm fruit - tucumã Astrocaryum aculeatum 0.05 0.99 0.00 0.01 215 6,064 inds
Honey Various bee species 0.01 0.26 0.04 0.74 196 588 litres
Seeds - andiroba Carapa guianensis 0.01 0.18 0.03 0.82 160 1,966 18-litre tins
Seeds - murumuru Astrocaryum murumuru 0.00 0.06 0.02 0.94 109 1,288 18-litre tins
Fruit - other Various species 0.03 0.95 0.00 0.05 103 2,836 inds
Timber - other Various species 0.01 0.77 0.00 0.23 73 491 trees
Timber - construction Various species 0.02 0.99 0.00 0.01 62 91 metres
Bark Various species 0.01 0.86 0.00 0.14 58 343 metres
9 other resources Various species 0.04 N/A 0.01 N/A 182 N/A N/A
Total 0.80 0.63 0.20 0.37 3,969
Fishing Tambaquí, pacu, piranha etc Characidae 0.41 0.96 0.03 0.04 3,936 64,558 inds
Surubim, mandim, pirarara etc Pimelodidae 0.12 0.68 0.07 0.32 1,710 10,362 inds
Tucunaré, carauaçú etc Cichlidae 0.08 0.98 0.00 0.02 674 4,309 inds
Jaraquí, curimatã Prochilodontidae 0.07 1.00 0.00 0.00 605 4,594 inds
Piau Anostomidae 0.07 0.97 0.00 0.03 598 6,147 inds
Aruanã, piraracu Osteoglossidae 0.05 0.75 0.01 0.25 507 1,853 inds
Bodó Loricariidae 0.03 1.00 0.00 0.00 270 4,587 inds
Cascuda, branquinha Curimatidae 0.01 1.00 0.00 0.00 125 4,231 inds
9 other families Various species 0.04 N/A 0.00 N/A 380 N/A N/A
Total 0.88 0.92 0.12 0.08 8,805
SoldLocally consumed Total
Forest
extractivism
Chapter 2: Livelihood strategies
34
consumed locally but never sold, and the ratio of local consumption to sales was highly
variable. Resources predominantly (≥80%) produced or exploited for commercial
purposes included cultivated fruits (bananas, limes and papayas), rubber (Hevea spp.
latex) and oilseeds (Carapa guianensis and Astrocaryum murumuru), rather than fish.
Conversely, a number of resources were primarily consumed locally, including two
agricultural (watermelons and yams), five forest extractive (firewood, construction
timber, the bark of various tree species, and fruits from tucumã palms (Astrocaryum
tucuma) and other tree species), and six of the eight top-ranking fish families (Table
2.1).
2.4.2 Spatial variance in livelihood strategies
Quantifying livelihood strategies based on self-reporting by households and
communities, local consumption was more prevalent than trade. Of 180 respondent
households across 27 communities, all reported engaging in agricultural, forest
extractivism and fishing activities for subsistence. However, only a fraction of these
households and communities reported sales of these major resource types: 144
households in 27 communities sold agricultural products; 141 households in 24
communities sold timber and non-timber resources; and 98 households in 22
communities sold fish.
The ten focal communities within which we obtained detailed weekly survey data
shared similar activity profiles in terms of the production and harvesting of resources
for subsistence, but varied widely in the extent to which they generated income from
these activities. There was little variation across communities in the relative partitioning
of engagement between agricultural, extractive and fishing activities for consumption,
as indicated both by the overall frequency of events in each category (Fig. 2.2) and by
the monetary value accrued from each activity type (Fig. 2.2). In contrast, there was a
large degree of heterogeneity in the frequency of activities for income-generation (Fig.
2.2) and the proportion of community-level income derived from each activity type
(Fig. 2.2).
Engagement with alternative income-generating activities showed a high degree of
congruence between households belonging to the same community. All of the 82
weekly-surveyed households gained over half of their total annual income from a single
activity type (mean ± SD proportion of total income from this activity = 0.85 ± 0.14)
and so self-assessed ranking of activity importance proved to be a good proxy for
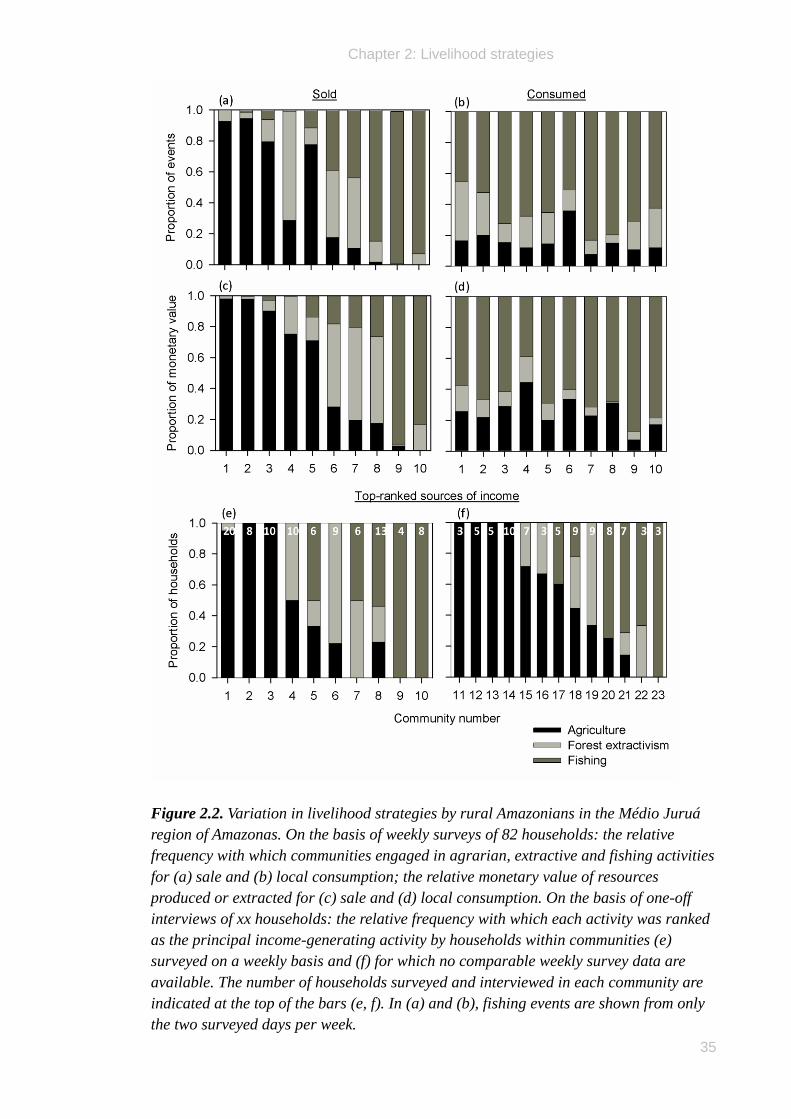
Chapter 2: Livelihood strategies
35
Figure 2.2. Variation in livelihood strategies by rural Amazonians in the Médio Juruá
region of Amazonas. On the basis of weekly surveys of 82 households: the relative
frequency with which communities engaged in agrarian, extractive and fishing activities
for (a) sale and (b) local consumption; the relative monetary value of resources
produced or extracted for (c) sale and (d) local consumption. On the basis of one-off
interviews of xx households: the relative frequency with which each activity was ranked
as the principal income-generating activity by households within communities (e)
surveyed on a weekly basis and (f) for which no comparable weekly survey data are
available. The number of households surveyed and interviewed in each community are
indicated at the top of the bars (e, f). In (a) and (b), fishing events are shown from only
the two surveyed days per week.
Chapter 2: Livelihood strategies
36
community activity profiles (strong congruence between Fig. 2.2c and e). In 65 of 82
cases, the highest-ranked activity from weekly survey data matched that of the
household‟s own assessment. The rankings reported by communities that were not
surveyed on a weekly basis (Fig. 2.2) can therefore be interpreted as a fair
approximation of community livelihood strategies on a wider spatial scale.
Households within a community were much more likely to converge in their principal
income-generating activity than would be expected by chance (Fig. 2.2), indicating that
household activity profiles be reflected at the community-wide level. Only three
communities contained at least one household engaged primarily in each of the three
activities. In nine out of 27 communities, all households ranked the same activity as
being their most important income-generator and households in the other 15
communities reported just two of the three activities as their principal income source.
2.4.3 Temporal variation in resource use
The heaviest rainfall in the Juruá region was in November – April but water levels
lagged this by ~14 weeks (Fig. 2.3). The várzea forest was therefore usually accessible
on foot for the second half of each year, but was inundated by up to ~11 m of water
between January and June.
Weekly surveys of resource use indicated significant variation in the relative
consistency of monthly offtakes of the main resources in each of the three activity
categories. The principal agrarian and fish resources were less variable over time than
extractive plant products, with greater monthly variation in the proportion of the total
annual harvest derived from the three most frequently-extracted plant resources than
from the other two activity types (e.g. variance in monthly offtake of manioc = 0.001,
rubber = 0.013, açaí = 0.012; Fig. 2.3). Firewood, the most frequently extracted class of
plant products, was collected throughout the year, but açaí fruits were only available
during the mid-wet to early-dry season (January – June), and rubber was tapped only
between July and December. The proportion of the total harvest of the three most
important fish families peaked during the dry season (May - August), though these were
caught throughout the year.
2.4.4 Determinants of production and extraction of key resources
We have shown that livelihood strategies of reserve residents were dedicated to
relatively few key resources, despite the overall high diversity of resources produced or
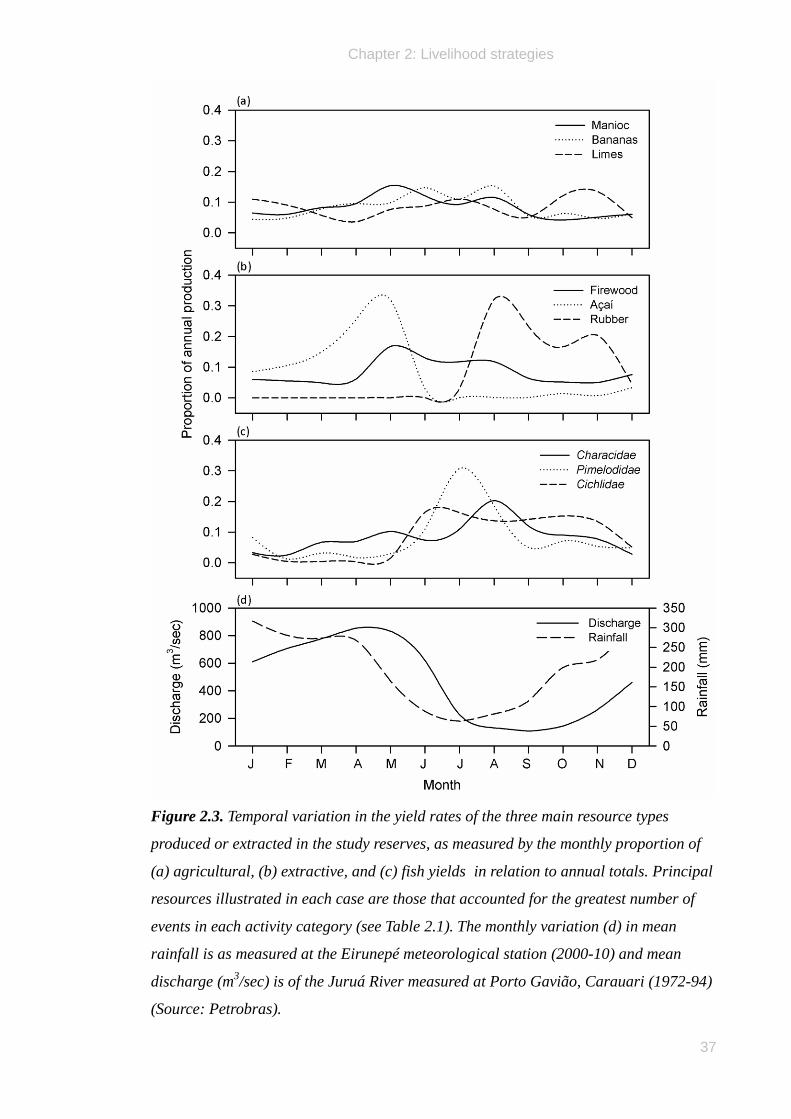
Chapter 2: Livelihood strategies
37
Figure 2.3. Temporal variation in the yield rates of the three main resource types
produced or extracted in the study reserves, as measured by the monthly proportion of
(a) agricultural, (b) extractive, and (c) fish yields in relation to annual totals. Principal
resources illustrated in each case are those that accounted for the greatest number of
events in each activity category (see Table 2.1). The monthly variation (d) in mean
rainfall is as measured at the Eirunepé meteorological station (2000-10) and mean
discharge (m3/sec) is of the Juruá River measured at Porto Gavião, Carauari (1972-94)
(Source: Petrobras).
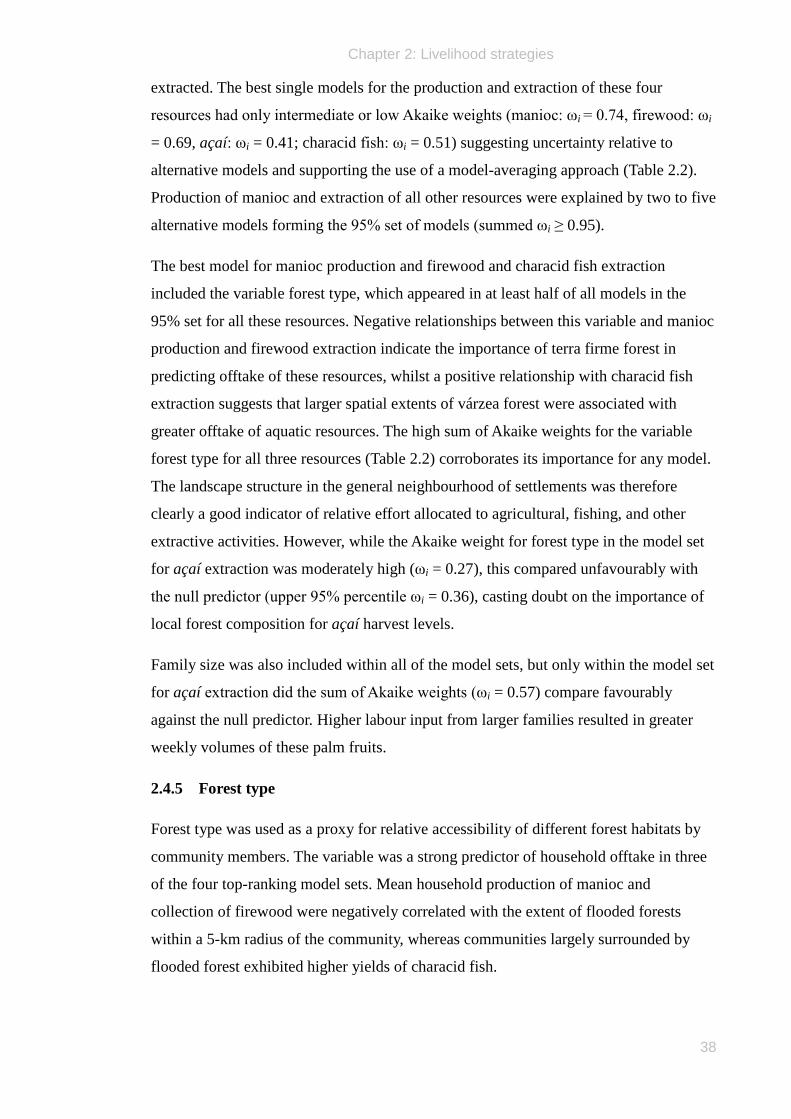
Chapter 2: Livelihood strategies
38
extracted. The best single models for the production and extraction of these four
resources had only intermediate or low Akaike weights (manioc: ωi = 0.74, firewood: ωi
= 0.69, açaí: ωi = 0.41; characid fish: ωi = 0.51) suggesting uncertainty relative to
alternative models and supporting the use of a model-averaging approach (Table 2.2).
Production of manioc and extraction of all other resources were explained by two to five
alternative models forming the 95% set of models (summed ωi ≥ 0.95).
The best model for manioc production and firewood and characid fish extraction
included the variable forest type, which appeared in at least half of all models in the
95% set for all these resources. Negative relationships between this variable and manioc
production and firewood extraction indicate the importance of terra firme forest in
predicting offtake of these resources, whilst a positive relationship with characid fish
extraction suggests that larger spatial extents of várzea forest were associated with
greater offtake of aquatic resources. The high sum of Akaike weights for the variable
forest type for all three resources (Table 2.2) corroborates its importance for any model.
The landscape structure in the general neighbourhood of settlements was therefore
clearly a good indicator of relative effort allocated to agricultural, fishing, and other
extractive activities. However, while the Akaike weight for forest type in the model set
for açaí extraction was moderately high (ωi = 0.27), this compared unfavourably with
the null predictor (upper 95% percentile ωi = 0.36), casting doubt on the importance of
local forest composition for açaí harvest levels.
Family size was also included within all of the model sets, but only within the model set
for açaí extraction did the sum of Akaike weights (ωi = 0.57) compare favourably
against the null predictor. Higher labour input from larger families resulted in greater
weekly volumes of these palm fruits.
2.4.5 Forest type
Forest type was used as a proxy for relative accessibility of different forest habitats by
community members. The variable was a strong predictor of household offtake in three
of the four top-ranking model sets. Mean household production of manioc and
collection of firewood were negatively correlated with the extent of flooded forests
within a 5-km radius of the community, whereas communities largely surrounded by
flooded forest exhibited higher yields of characid fish.
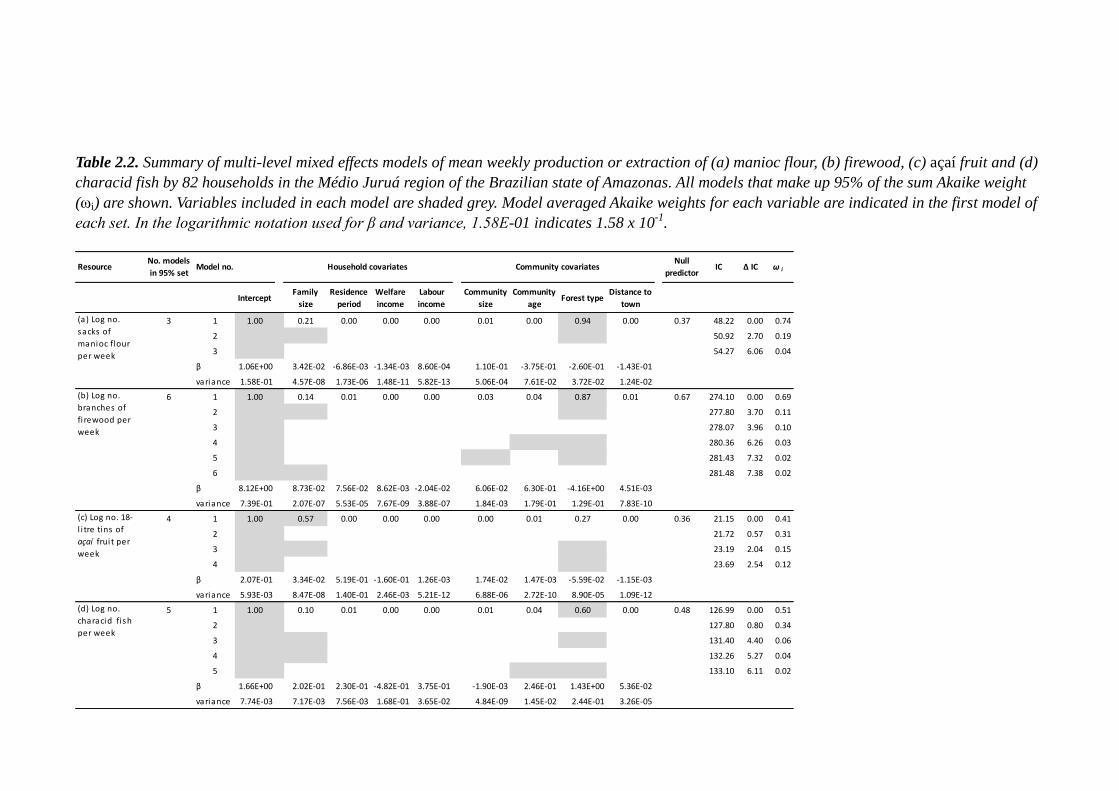
Table 2.2. Summary of multi-level mixed effects models of mean weekly production or extraction of (a) manioc flour, (b) firewood, (c) açaí fruit and (d)
characid fish by 82 households in the Médio Juruá region of the Brazilian state of Amazonas. All models that make up 95% of the sum Akaike weight
(ωi) are shown. Variables included in each model are shaded grey. Model averaged Akaike weights for each variable are indicated in the first model of
each set. In the logarithmic notation used for β and variance, 1.58E-01 indicates 1.58 x 10⁻¹
.
InterceptFamily
size
Residence
period
Welfare
income
Labour
income
Community
size
Community
ageForest type
Distance to
town
3 1 1.00 0.21 0.00 0.00 0.00 0.01 0.00 0.94 0.00 0.37 48.22 0.00 0.74
2 50.92 2.70 0.19
3 54.27 6.06 0.04
β 1.06E+00 3.42E-02 -6.86E-03 -1.34E-03 8.60E-04 1.10E-01 -3.75E-01 -2.60E-01 -1.43E-01
variance 1.58E-01 4.57E-08 1.73E-06 1.48E-11 5.82E-13 5.06E-04 7.61E-02 3.72E-02 1.24E-02
6 1 1.00 0.14 0.01 0.00 0.00 0.03 0.04 0.87 0.01 0.67 274.10 0.00 0.69
2 277.80 3.70 0.11
3 278.07 3.96 0.10
4 280.36 6.26 0.03
5 281.43 7.32 0.02
6 281.48 7.38 0.02
β 8.12E+00 8.73E-02 7.56E-02 8.62E-03 -2.04E-02 6.06E-02 6.30E-01 -4.16E+00 4.51E-03
variance 7.39E-01 2.07E-07 5.53E-05 7.67E-09 3.88E-07 1.84E-03 1.79E-01 1.29E-01 7.83E-10
4 1 1.00 0.57 0.00 0.00 0.00 0.00 0.01 0.27 0.00 0.36 21.15 0.00 0.41
2 21.72 0.57 0.31
3 23.19 2.04 0.15
4 23.69 2.54 0.12
β 2.07E-01 3.34E-02 5.19E-01 -1.60E-01 1.26E-03 1.74E-02 1.47E-03 -5.59E-02 -1.15E-03
variance 5.93E-03 8.47E-08 1.40E-01 2.46E-03 5.21E-12 6.88E-06 2.72E-10 8.90E-05 1.09E-12
5 1 1.00 0.10 0.01 0.00 0.00 0.01 0.04 0.60 0.00 0.48 126.99 0.00 0.51
2 127.80 0.80 0.34
3 131.40 4.40 0.06
4 132.26 5.27 0.04
5 133.10 6.11 0.02
β 1.66E+00 2.02E-01 2.30E-01 -4.82E-01 3.75E-01 -1.90E-03 2.46E-01 1.43E+00 5.36E-02
variance 7.74E-03 7.17E-03 7.56E-03 1.68E-01 3.65E-02 4.84E-09 1.45E-02 2.44E-01 3.26E-05
Model no.
(a) Log no.
sacks of
manioc flour
per week
(b) Log no.
branches of
fi rewood per
week
(c) Log no. 18-
l i tre tins of
açaí frui t per
week
(d) Log no.
characid fi sh
per week
ResourceNo. models
in 95% setHousehold covariates Community covariates
Null
predictorIC Δ IC ω i
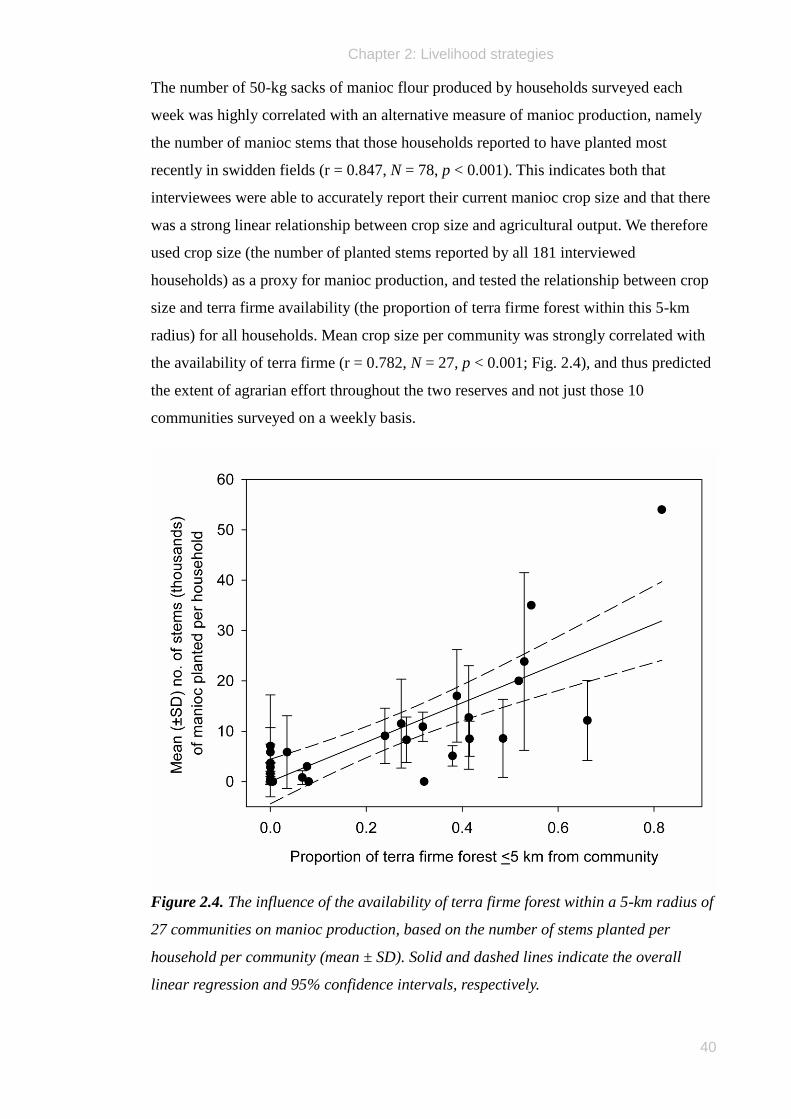
Chapter 2: Livelihood strategies
40
The number of 50-kg sacks of manioc flour produced by households surveyed each
week was highly correlated with an alternative measure of manioc production, namely
the number of manioc stems that those households reported to have planted most
recently in swidden fields (r = 0.847, N = 78, p < 0.001). This indicates both that
interviewees were able to accurately report their current manioc crop size and that there
was a strong linear relationship between crop size and agricultural output. We therefore
used crop size (the number of planted stems reported by all 181 interviewed
households) as a proxy for manioc production, and tested the relationship between crop
size and terra firme availability (the proportion of terra firme forest within this 5-km
radius) for all households. Mean crop size per community was strongly correlated with
the availability of terra firme (r = 0.782, N = 27, p < 0.001; Fig. 2.4), and thus predicted
the extent of agrarian effort throughout the two reserves and not just those 10
communities surveyed on a weekly basis.
Figure 2.4. The influence of the availability of terra firme forest within a 5-km radius of
27 communities on manioc production, based on the number of stems planted per
household per community (mean ± SD). Solid and dashed lines indicate the overall
linear regression and 95% confidence intervals, respectively.
Chapter 2: Livelihood strategies
41
This dependence on terra firme land for agricultural production is further emphasised by
the significant difference in forest landscape structure between nine communities
reporting no sales of processed manioc and 17 communities that derived at least some
income from manioc sales (proportion of várzea forest for non-trading communities =
0.86 ± 0.10; proportion of várzea forest for trading communities = 0.57 ± 0.21; t-test: t
= 4.639, p < 0.001). Communities whose operational forest cover contained a high
proportion of seasonally flooded forest tended to produce sufficient manioc for
subsistence only.
2.5 Discussion
2.5.1 Overview
Common to all households were the imperatives of manioc cultivation as the staple
carbohydrate, fishing as a principal source of protein and the harvest of timber and non-
timber forest products for food, fuel, and the construction of houses and canoes.
However, there was considerable variation between livelihood strategies of individual
households within this study system, particularly with respect to the main income-
generating activities with which they engaged. We now discuss how understanding the
biophysical and demographic factors that influence this variation can be important to
reserve managers and agencies wishing to implement development and subsidy
programmes designed to modulate the behaviour of rural Amazonians.
2.5.2 Extractive reserves or agricultural enclaves within a forest landscape?
The extractive reserve concept originally sought to ensure land-tenure rights for
traditional communities, though this subsequently broadened to additionally juxtapose
biodiversity conservation objectives. Whilst manioc cultivation has traditionally been a
means of producing farinha for subsistence in rural areas, it was implicit within the
extractive reserve philosophy that Amazonians living within these reserves would
engage primarily in extractive activities that exploited NTFPs such as rubber, Brazil
nuts, copaíba oleoresin, and andiroba oil for income-generation (Fearnside 1989). Yet
our results suggest that a large proportion of income in some households is derived from
agricultural products, often with minimal engagement in commercial extractivism. This
finding accords with the temporal shift away from forest extractivism and towards
agricultural and ranching activities documented in other Amazonian agro-extractive
systems (Ruiz-Perez et al. 2005; Salisbury and Schmink 2007; Vadjunec and Rocheleau
Chapter 2: Livelihood strategies
42
2009). Whilst this study focuses on only two of 199 extractive reserves currently
decreed in Brazilian Amazonia, the Médio Juruá reserves are widely renowned as
containing some of the most “traditional” communities of forest extractivists.
2.5.3 Subsistence and cash economies
Our figures suggest that the relative frequency of, and inferred monetary value derived
from, the three main activity categories was much more similar for subsistence than for
commercial trade. We therefore infer that most reserve residents have access to the full
complement of resources required to maintain their livelihoods from a subsistence
perspective, but that local resource availability largely determines which products are
sufficiently abundant to enable surplus offtake to be sold.
2.5.4 Temporal variation
Most communities with immediate access to unflooded terrain planted small swidden
fields of manioc in August, subsequently harvesting and processing the tubers to
produce farinha throughout the year. Manioc cultivation thus provided these
communities with a consistent source of year-round food and income.
In contrast, many of the most commercially-important NTFPs in this system were
highly seasonal in their availability. Fruits and seeds, such as açaí fruits (Euterpe spp.)
and the oilseeds of Carapa guianensis, are only a viable source of income during their
fruiting season, and overall abundance may be subject to large supra-annual variation in
fruit crop sizes (Bhat et al. 2003). Hevea spp. trees may produce rubber all year round
but commercially-exploited congeners are restricted to floodplain forest, which is only
accessible on foot between August and December. Some terra firme NTFPs such as
lianas and understory palms are available all year, but these are generally harvested for
local consumption (e.g. construction) rather than sale.
2.5.5 Convergence between households within a community
Our models suggest that shared geographic constraints within the community catchment
area represent key factors in the close congruence between household livelihood
strategies within a given community. If the viability and profitability of alternative
activities is determined by common community-level variables such as forest type,
distance to markets, fluvial location, or communal ownership of large boats, then we
would expect to see nested choices of activity engagement amongst neighbours.
Chapter 2: Livelihood strategies
43
Additionally, the distinct social structure of these rural populations is such that
communities often consist of one or more extended families bounded by kinship ties.
Households within a particular community are thus more genetically related, as well as
physically and socially connected. Family traditions, including their cultural or religious
preferences and taboos, may therefore also contribute to intra-community congruence in
lifestyles.
Regardless of the underlying drivers of the consistent tendency for households within
communities to adopt similar livelihood strategies, this has implications for researchers
and managers wishing to rapidly gauge the distribution of activity engagement across
protected areas. Moreover, the ~80% similarity between detailed weekly survey data at
the level of households and one-off self-assessments of principal income-generating
activities at the level of communities suggests that targeted interviews yield good proxy
responses to at least some questions about resource-use decision-making.
2.5.6 Agriculture
Engagement in agriculture was largely explained by the predominant forest type in the
vicinity of each community. The number of manioc stems (which scales linearly with
swidden field size) currently planted by a household was also a good predictor of
agricultural productivity, confirming that the explanatory variable we identified through
our models applied over a larger number of communities. Perennial crops like manioc
require permanently unflooded land, since tubers typically require 12 months to attain a
suitable harvest size. Households with limited access to terra firme land often cultivated
manioc gardens within várzea habitat (on seasonally-exposed beaches and floodplains),
but harvested them after only six months and before the flood pulse, thereby enabling
production of just enough farinha to meet their own subsistence needs. This reliance on
swidden fields created in areas of terra firme forest for manioc agriculture has
implications for PES programmes such as Bolsa Floresta, which seek to maintain
environmental services by restricting further forest clearance (Viana 2008).
2.5.7 Forest extractivism
The most frequently harvested class of forest product – firewood – was unsurprisingly
collected throughout the year but this seldom amounted to a destructive means of timber
harvesting since dead wood is usually collected off the ground, often from cleared
swidden fields. The propensity for households in settlements with a relatively high
Chapter 2: Livelihood strategies
44
proportion of neighbouring terra firme forest to collect more firewood was largely a
result of higher demand; firewood was primarily collected to fuel the large ovens
required for the farinha-making process, whereas butane gas was the most common fuel
for domestic cooking. Changes in agrarian activities may thus directly affect the harvest
of this resource.
Commercial dependence on forest extractivism was not homogenous across the reserve
communities. Whilst we did not model the extraction of any of the most significant
economically-exploited NTFPs (e.g. andiroba and murumuru seeds, and latex from
rubber trees), the widespread occurrence of these resources in flooded forest and their
absence from terra firme forest indicates greater engagement in commercial trade of
NTFPs by communities with greater access to the former forest type.
These commercially-valuable NTFPs, similarly to manioc but in contrast to most fish,
were relatively high-value per unit weight commodities and, critically, were non-
perishable and could thus endure the inevitable delay between harvest and sale. These
commodities also enjoyed relatively secure purchase quotas and markets, with annually-
determined buying prices guaranteed by local residents‟ associations and cooperatives.
Indeed, a prioritised goal of government agencies and NGOs involved in rural
livelihood development in rural Amazonia has been the promotion of extractive
industries as a means of augmenting household incomes (Belcher et al. 2005). In our
study reserves, a community-run cooperative extracts andiroba oil from Carapa
guianensis seeds, selling the oil wholesale to a large cosmetic company (Natura 2007).
Smaller-scale projects have included establishing meliponiculture of native stingless bee
hives in some communities, and training and equipping reserve residents to extract
Copaifera oleoresin (Newton et al. 2011). Implementation of these projects has tended
to assume a „one-size-fits-all‟ approach, whereas our data clearly show that resource
accessibility and current livelihood practises are not uniform, and may strongly
influence the uptake and success of each of these initiatives. The development of
extractive industries therefore demands consideration of the historical, socioeconomic,
and especially the geographic context within which they are being introduced.
Further, the plethora of government subsidies associated with many NTFPs makes an
accurate analysis of their true value to household economies very difficult, since many
of the more economically-significant NTFPs benefit from both direct and indirect
subsidies. A combination of direct government and NGO subsidies, for example,
Chapter 2: Livelihood strategies
45
maintains the buying price of rubber at a level at which it remains profitable for reserve
residents to continue to extract it. Less directly, the offtake volume of andiroba seeds
required by the cooperative is allocated to all participating communities on an equitable
quota system. The seeds are then collected from each community by the cooperative‟s
own boat, effectively removing the usual diminishing returns of transport costs incurred
by producers living farther from markets.
Yet studying extractive systems embroiled in subsidies and welfare payments is
worthwhile, since this increasingly represents the way in which extractive reserves are
operating. Such an approach may prove to be a sustainable way to overcome the
problems of fluctuating markets, diminishing profits with increasing travel distances,
and local overexploitation of natural resources that are frequently associated with
extractive systems (Belcher and Schreckenberg 2007).
Finally, not all forms of forest extractivism are equally benign or desirable.
Manufacturing canoes, for example, involves the removal of an entire tree and thus may
not be as sustainable on the same scale as the collection of oilseeds or oleoresins.
Although more assessments of the ecological impacts of NTFP harvesting have become
available (e.g. Peres et al. 2003; Ticktin 2004; Vadjunec and Rocheleau 2009), resource-
or site-specificity is often high and reserve managers need to consider the likely
implications of actively encouraging or subsidising forest extractivism.
2.5.8 Fishing
Fishing yields depended on access to rivers, lakes, and seasonally inundated forest. The
latter is particularly important at times of year when the main rivers and lakes are less
productive and so forest type was again a key predictor of fishing yields. Although
commercial fishing was prohibited within many of the reserves‟ oxbow lakes, this was
the principal income-generating activity for some communities. This specialisation
required cold-storage facilities for maintaining fish catches, and long-term arrangement
with commercial fishing boats that would periodically bulk-buy captured stock. For the
majority of communities, travel time to urban markets precluded frequent sale of
perishable fish catches.
2.5.9 Drivers of variation
None of the demographic variables examined here were significant predictors of
household resource offtake. However, communities enjoying greater access to terra
Chapter 2: Livelihood strategies
46
firme forest tended to be larger, with implications for longer-term planning of reserve
settlements. Communities are often transient and frequently relocate, particularly with
respect to meandering river channels in highly dynamic fluvial systems like the Juruá
(Abizaid 2005).
Forest landscape composition captured the physical geography of the area around
settlements. Measured as relative proportions of terra firme and várzea forest, this
variable was consistently the strongest predictor of mean weekly household offtake of
key agrarian and extractive resources. Although the size of communities‟ catchment
areas, from within which most of their resources are harvested, is likely to be a function
of numerous factors including transport infrastructure, resource demand, and local
spatial configuration of fluvial and forest systems, the partition of neighbouring forest
into terra firme and várzea forest is clearly an important influence on the relative
utilisation of different resource types. Therefore, whilst other factors may affect
aggregate resource-use decisions on a wider spatial scale, we suggest that local variation
in livelihood strategy may largely be determined by the distribution of forest types in
reserves and landscapes elsewhere.
2.5.10 Conclusions
Understanding spatial and temporal patterns of resource use and availability within
multiple-use tropical forest reserves is critical in helping managers to effect change
within dynamic demographic and economic scenarios. Our data add to the body of
evidence suggesting that, in terms of local patterns of subsistence and income,
agriculture may be equally, if not more, important than extractivism of fish and forest
products in many Amazonian reserves (e.g. Salisbury and Schmink 2007). However, we
additionally demonstrate that the significant temporal and spatial variation in the
livelihood strategies employed by rural Amazonians living in communities within these
reserves may be largely driven by local geography and consequent resource
accessibility. This finding complements those from similar agro-extractivist systems,
where livelihood strategy is dictated by land tenure (e.g. Takasaki et al. 2001). Given
the wide heterogeneity in economic profiles even within the same geographic area, we
suggest that careful consideration should be paid to the non-uniform impacts that the
implementation of development programmes (such as the promotion of new extractive
activities), the enforcement of reserve regulations from reserve management plans, and
Chapter 2: Livelihood strategies
47
the introduction of PES and welfare subsidies may have within multiple-use protected
areas.
2.6 References
Abizaid, C., 2005. An anthropogenic meander cutoff along the Ucayali River, Peruvian
Amazon. American Geographical Review 95, 122-135.
Allegretti, M.H., 1990. Extractive reserves: an alternative for reconciling development
and environmental conservation in Amazonia. In: Anderson, A.B. (Ed.). Alternatives to
deforestation: steps toward sustainable use of the Amazonian rain forest, pp. 252-264.
Columbia University Press, New York.
ARPA, 2009. Programa Àreas Protegidas da Amazônia: Amazônia Brasileira. Instituto
Socioambiental, Manaus.
Belcher, B., Ruiz-Perez, M., Achdiawan, R., 2005. Global patterns and trends in the use
and management of commercial NTFPs: implications for livelihoods and conservation.
World Development 33, 1435-1452.
Belcher, B., Schreckenberg, K., 2007. Commercialisation of non-timber forest products:
a reality check. Development Policy Review 25, 355-377.
Boughey, K.L., Lake, I.R., Haysom, K.A., Dolman, P.M., 2011. Effects of landscape-
scale broadleaved woodland configuration and extent on roost location for six bat
species across the UK. Biological Conservation. doi: 10.1016/j.biocon.2011.06.008.
Burnham, K.P., Anderson, D.R., 2002. Model selection and multimodel inference: a
practical information-theoretic approach. Springer, New York.
Calcagno, V., 2010. glmulti: GLM model selection and multimodel inference made
easy. R package version 0.6-3. URL http://CRAN.R-project.org/package=glmulti.
Campos, M.T., Nepstad, D.C., 2006. Smallholders, the Amazon's new conservationists.
Conservation Biology 20, 1553-1556.
Coomes, O.T., Barham, B.L., 1997. Rain forest extraction and conservation in
Amazonia. The Geographical Journal 163, 180-188.
Coomes, O.T., Burt, G.J., 2001. Peasant charcoal production in the Peruvian Amazon:
rainforest use and economic resilience. Forest Ecology and Management 140, 39-50.
Chapter 2: Livelihood strategies
48
Dean, W., 1987. Brazil and the struggle for rubber. Cambridge University Press,
Cambridge.
Fearnside, P.M., 1989. Extractive reserves in Brazilian Amazonia. Bioscience 39, 387-
393.
Ferraz, G., Marinelli, C.E., Lovejoy, T.E., 2008. Biological monitoring in the Amazon:
recent progress and future needs. Biotropica 40, 7-10.
Hall, A., 2004. Extractive reserves: building natural assets in the Brazilian Amazon.
Working paper series. Political Economy Research Institute, University of
Massachusetts, Amherst.
Hecht, S.B., 1993. The logic of livestock and deforestation in Amazonia. Bioscience 43,
687-695.
Koziell, I., Saunders, J., 1996. Living off biodiversity: exploring livelihoods and
biodiversity issues in natural resources management. International Institute for
Environment and Development (IIED), London.
Lehner, B., Verdin, K., Jarvis, A., 2006. HydroSHEDS Technical Documentation. World
Wildlife Fund US, Washington, DC. URL http://hydrosheds.cr.usgs.gov.
Natura, 2007. Plano de desenvolvimento sustentável junto as comunidades do Médio
Juruá. CARE Brasil and Natura, São Paulo.
Nepstad, D., McGrath, D., Alencar, A., Barros, A.C., Carvalho, G., Santilli, M., Diaz,
M.D.V., 2002. Frontier governance in Amazonia. Science 295, 629-631.
Nepstad, D., Schwartzman, S., Bamberger, B., Santilli, M., Ray, D., Schlesinger, P.,
Lefebvre, P., Alencar, A., Prinz, E., Fiske, G., Rolla, A., 2006. Inhibition of Amazon
deforestation and fire by parks and indigenous lands. Conservation Biology 20, 65-73.
Newton, P., Watkinson, A.R., Peres, C.A., 2011. Determinants of yield in a non-timber
forest product: Copaifera oleoresin in Amazonian extractive reserves. Forest Ecology
and Management 261, 255-264.
Pacheco, P., 2009. Smallholder livelihoods, wealth and deforestation in the eastern
Amazon. Human Ecology 37, 27-41.
Chapter 2: Livelihood strategies
49
Parry, L., Day, B., Amaral, S., Peres, C.A., 2010a. Drivers of rural exodus from
Amazonian headwaters. Population and Environment 32, 137-176.
Parry, L., Peres, C.A., Day, B., Amaral, S., 2010b. Rural-urban migration brings
conservation threats and opportunities to Amazonian watersheds. Conservation Letters
3, 251-259.
Peres, C.A., Baider, C., Zuidema, P.A., Wadt, L.H.O., Kainer, K.A., Gomes-Silva,
D.A.P., Salomao, R.P., Simoes, L.L., Franciosi, E.R.N., Valverde, F.C., Gribel, R.,
Shepard, G.H., Kanashiro, M., Coventry, P., Yu, D.W., Watkinson, A.R., Freckleton,
R.P., 2003. Demographic threats to the sustainability of Brazil nut exploitation. Science
302, 2112-2114.
R Development Core Team, 2010. R: A language and environment for statistical
computing. R Foundation for Statistical Computing, Vienna, Austria. ISBN 3-900051-
07-0. URL http://www.R-project.org/.
RADAMBRASIL, 1977. Projeto RADAMBRASIL. Levantamento de recursos naturais:
folha SB. 19 Juruá. Ministério das Minas e Energia, Rio de Janeiro.
Rodrigues, A.S.L., Ewers, R.M., Parry, L., Souza Jr., C., Verissimo, A., Balmford, A.,
2009. Boom-and-bust development patterns across the Amazon deforestation frontier.
Science 324, 1435-1437.
Ruiz-Perez, M., Almeida, M., Dewi, S., Costa, E.M.L., Pantoja, M.C., Puntodewo, A.,
Postigo, A.D., de Andrade, A.G., 2005. Conservation and development in Amazonian
extractive reserves: the case of Alto Jurua. Ambio 34, 218-223.
Ruiz-Pérez, M., Belcher, B., Achdiawan, R., Alexiades, M., Aubertin, C., Caballero, J.,
Campbell, B., Clement, C., Cunningham, A., Fantini, A., de Foresta, H., García
Fernández, C., Gautam, K.H., Hersch Martínez, P., de Jong, W., Kusters, K., Kutty,
M.G., López, C., Fu, M., Martínez Alfaro, M.A., Nair, T.K.R., Ndoye, O., Ocampo, R.,
Rai, N., Ricker, M., Schreckenberg, K., Shackleton, S., Shanley, P., Sunderland, T.,
Youn, Y., 2004. Markets drive the specialisation strategies of forest peoples. Ecology
and Society 9, 4.
Salisbury, D.S., Schmink, M., 2007. Cows versus rubber: changing livelihoods among
Amazonian extractivists. Geoforum 38, 1233-1249.
Chapter 2: Livelihood strategies
50
Santos, G.M., Ferreira, E.J.G., Zuanon, J.A.S., 2006. Peixes comerciais de Manaus.
Ibama/AM, ProVárzea, Manaus.
Schwartzman, S., 1989. Extractive reserves: the rubber tappers' strategy for sustainable
use of the Amazon rain forest. In: Browder, J.O. (Ed.), Fragile lands of Latin America:
the research for sustainable uses. Westview Press, Boulder, Colorado.
SDS, 2010. Plano de gestão da Reserva de Desenvolvimento Sustentavel de Uacari.
Série Técnica Planos de Gestão. Secretaria de Estado do Meio Ambiente e
Desenvolvimento Sustentàvel, Carauari.
Stoian, D., 2005. Making the best of two worlds: rural and peri-urban livelihood options
sustained by nontimber forest products from the Bolivian Amazon. World Development
33, 1473-1490.
Takasaki, Y., Barham, B.L., Coomes, O.T., 2001. Amazonian peasants, rain forest use,
and income generation: the role of wealth and geographical factors. Society and Natural
Resources 14, 291-308.
Ticktin, T., 2004. The ecological implications of harvesting non-timber forest products.
Journal of Applied Ecology 41, 11-21.
Vadjunec, J.M., Rocheleau, D., 2009. Beyond forest cover: land use and biodiversity in
rubber trail forests of the Chico Mendes extractive reserve. Ecology and Society 14, 29.
Viana, V., 2008. Bolsa Floresta (Forest Conservation Allowance): an innovative
mechanism to promote health in traditional communities in the Amazon. Estudos
Avançados 22, 64.
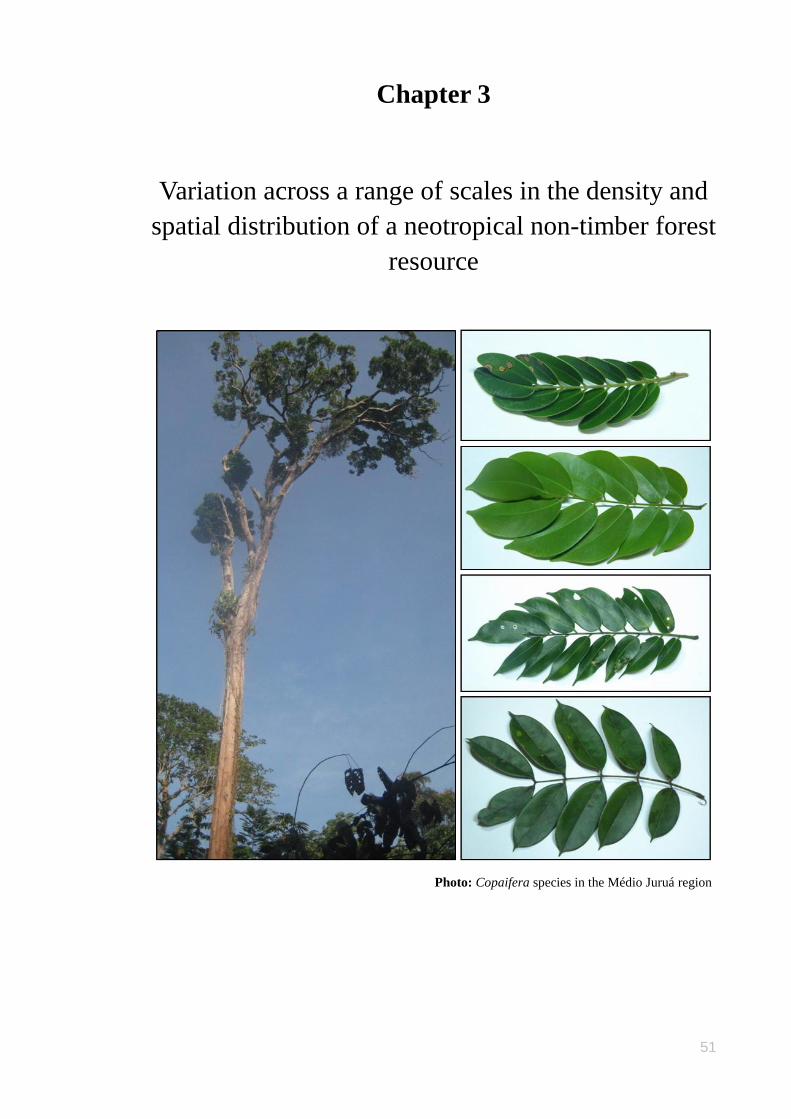
51
Chapter 3
Variation across a range of scales in the density and
spatial distribution of a neotropical non-timber forest
resource
Photo: Copaifera species in the Médio Juruá region
Chapter 3: Copaifera spatial distribution
52
3.1 Abstract
Successful management of tropical forest resources depends upon an understanding of
their patterns of density and spatial distribution, since these affect the potential for
harvesting. The variation in these patterns across different spatial scales has rarely been
explored. We assessed the extent to which different spatial scales are useful in
understanding resource distribution, using the example of an economically-significant
tropical tree genus, Copaifera, which is valued in Brazilian Amazonia for its medicinal
oleoresin. We mapped the spatial distribution of Copaifera trees at three nested spatial
scales: basin-wide (across Brazilian Amazonia), landscape (across two contiguous
extractive reserves) and local (within a 100-ha plot). Using data from our own study and
an Amazon-wide forest inventory (Projeto RADAMBRASIL), we quantified the
population distribution, density and size structure at the genus and species level at all
three scales, relating these to two environmental variables – forest type and elevation.
Spatial statistics were used to further characterise the resource at the landscape and local
levels. The distribution, density and adult population structure differed between species
and forest types at all three spatial scales. Overall tree densities ranged from 0.37 ha–1
(basin-wide scale) to 1.13 ha–1
(local scale) but varied between forest types, with várzea
containing a Copaifera tree density just 43% of that in terra firme forest at the landscape
scale. Spatial distribution analyses showed significant clumping of some species,
especially C. multijuga which averaged 61 m between neighbouring trees. We compare
our cross-scale density estimates and discuss the relative merits of studying the
distribution of tropical non-timber forest products (NTFP) at more than one spatial
scale. Our results have implications for the management and extraction of this important
Amazonian forest resource.
3.2 Introduction
Historically, there has been considerable interest in the spatial distribution of plants
across a range of scales (Erickson 1945; Forman 1964) together with the environmental
and demographic factors determining these patterns (Hutchings 1997). The sustainable
management of plant resources also depends critically upon an understanding of the
spatial distribution and population structure of the harvested species (Boll et al. 2005).
This is particularly true of economically important tropical forest resources, which are
vulnerable to over-exploitation if appropriate harvest levels are not determined by
detailed knowledge of their patterns of distribution and recruitment (Reynolds and Peres
Chapter 3: Copaifera spatial distribution
53
2005). As demand for such resources grows, an understanding of how the spatial
distribution of a resource varies may allow managers and extractors to estimate the
potential harvest of a resource over space and time.
The scope for understanding patterns of resource distribution is largely determined by
the scale at which such patterns are examined, with different spatial scales offering
alternative resolutions (Krebs 2009). Spatial heterogeneity in tropical tree distribution
has been demonstrated at multiple scales from vast areas covering an entire region (e.g.
Tuomisto et al. 2003), to intermediate scales covering landscapes (e.g. Phillips et al.
2003) to small, localized scales (e.g. Hubbell et al. 2001). When economically-
important resources are considered, regional scale studies can offer an overview of both
the potential for sustainable extraction and the impacts of exploitation (e.g. Peres et al.
2003), whilst landscape scale studies can usefully inform individual resource managers
and extractors (e.g. Wadt et al. 2005). Local level studies are invaluable as a basis for
detailed analyses of population structure and dynamics (e.g. Klimas et al. 2007) as well
as for developing sustainable harvest models incorporating density dependence (e.g.
Freckleton et al. 2003).
The distribution of plant species may be influenced by environmental conditions
including light, edaphic factors, topography, climate, latitude, and hydrological
conditions. However, environmental variables exert varying degrees of influence at
different spatial scales (Willis and Whittaker 2002). Species‟ ranges may be determined
by climatic parameters or geographic boundaries (e.g. Wittmann et al. 2006), whilst
landscape-level distribution may be influenced by edaphic or hydrological constraints
(e.g. Haugaasen and Peres 2006). In contrast, local distribution patterns may be dictated
by small-scale gradients in topography and natural disturbance such as tree-fall gaps
(e.g. Valencia et al. 2004), through spatial patterns of recruitment and mortality
(Hutchings 1997). The extent to which there is divergence in the environmental
variables that best explain patterns of resource heterogeneity at different spatial scales is
of interest to researchers and agencies wishing to predict and manage resource
populations.
The oleoresin harvested from trees of the genus Copaifera is a commercially-important
non-timber forest product (NTFP) found throughout the neotropics (Plowden 2004).
Extractors drill a hole into the trunk from which oleoresin is drained; if the hole is then
plugged, oleoresin deposits may be replenished over time (Newton et al. 2011). The
Chapter 3: Copaifera spatial distribution
54
oleoresin is valued for its therapeutic properties, which include those of an anti-
inflammatory and analgesic (Veiga Junior and Pinto 2002). Widely harvested and used
across Brazilian Amazonia, sales of Copaifera oleoresin generated R$4.1 million (≈
USD 2.6 million) in revenue in Brazil in 2009 (IBGE 2011). As a slow-growing
hardwood tree, Copaifera also historically provided valuable termite-resistant timber in
many regions, although extraction for this purpose is now prohibited within most
protected areas. The spatial distribution of the genus is not well documented but is
thought to be heterogeneous on both a basin-wide (Martins-da-Silva et al. 2008) and
landscape scale (Plowden 2003; Rigamonte-Azevedo et al. 2006).
We investigated patterns of Copaifera species distribution, richness and abundance at
three nested spatial scales: i) basin-wide (across the ~5 million km2 Brazilian
Amazonia); ii) landscape (across a ~900,000 ha area within two contiguous extractive
reserves); and iii) local (within a single 100-ha terra firme forest plot). The study aimed
to: 1) describe the spatial distribution of Copaifera at these three scales; and 2) explore
how this distribution varied with respect to two key environmental variables: a) forest
type; and b) elevation. We ask whether there is congruence between patterns of resource
distribution at different spatial scales, and discuss the relative merits of a cross-scale
approach in understanding and managing this and other key tropical forest resources.
3.3 Methods
3.3.1 Basin-wide scale
Data were compiled from 2,343 one-hectare (20 m x 500 m) tree plots inventoried in
Brazilian Amazonia between 1968 and 1975 as part of the national Radar na Amazônia
survey programme (Projeto RADAMBRASIL 1982; Fig. 3.1). Within each plot, all trees
larger than 100 cm circumference at breast height (CBH), or ≥31.8 cm diameter at
breast height (DBH), were measured and identified to genus or species by a plant
taxonomist. Copaifera is a good model genus for large-scale surveys involving multiple
parataxonomists since it is widely used and its distinctive trunk is easily recognizable,
thereby reducing the likelihood of both false negatives (failing to record a tree) and false
positives (mistakenly identifying a tree of a different genus as a Copaifera). For each
plot, the number of Copaifera trees of each species, the latitude and longitude of the
plot location, and a binary measure of forest type (unflooded or seasonally flooded) was
recorded.
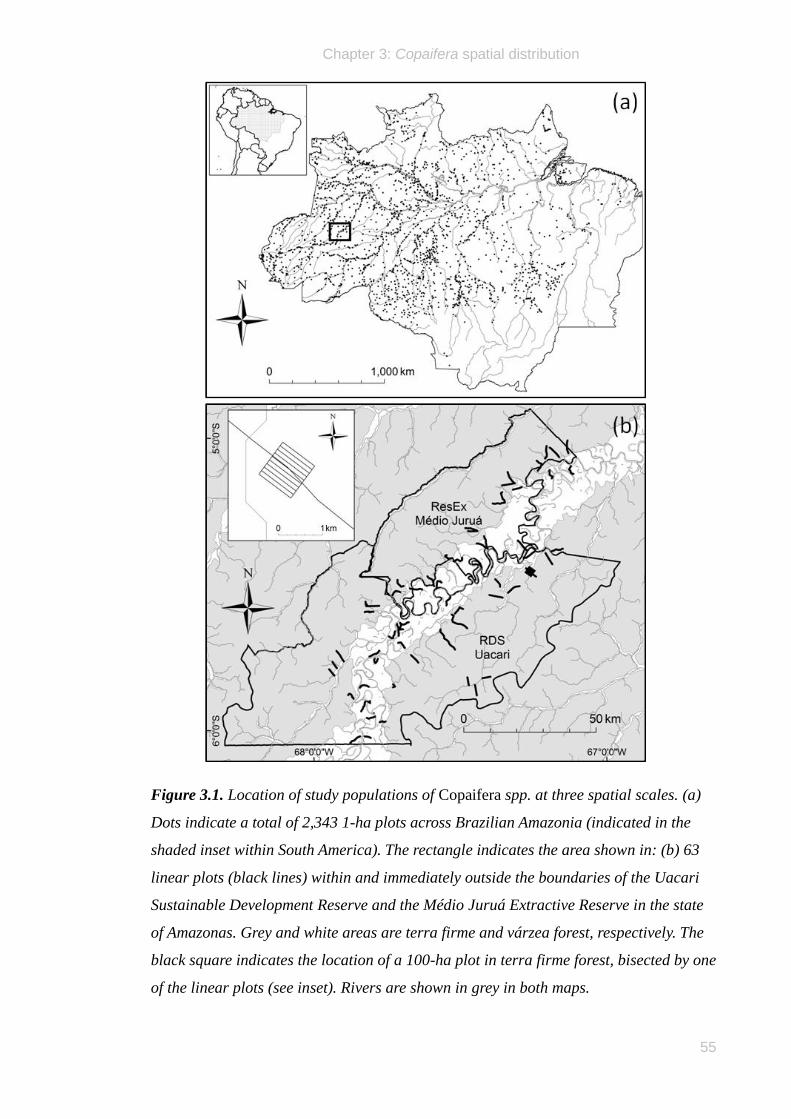
Chapter 3: Copaifera spatial distribution
55
Figure 3.1. Location of study populations of Copaifera spp. at three spatial scales. (a)
Dots indicate a total of 2,343 1-ha plots across Brazilian Amazonia (indicated in the
shaded inset within South America). The rectangle indicates the area shown in: (b) 63
linear plots (black lines) within and immediately outside the boundaries of the Uacari
Sustainable Development Reserve and the Médio Juruá Extractive Reserve in the state
of Amazonas. Grey and white areas are terra firme and várzea forest, respectively. The
black square indicates the location of a 100-ha plot in terra firme forest, bisected by one
of the linear plots (see inset). Rivers are shown in grey in both maps.
Chapter 3: Copaifera spatial distribution
56
We additionally reviewed the literature for studies that provided data on Copaifera
densities across lowland Amazonia. These were summarized and tabulated for
comparison with the results of this study.
3.3.2 Landscape scale
3.3.2.1 Study Site
The study was conducted within and around two contiguous extractive reserves bisected
by the Juruá River, a large white-water tributary of the Amazon (Solimões) River in the
state of Amazonas, Brazil. The federally-managed Médio Juruá Extractive Reserve
(hereafter, ResEx Médio Juruá) occupies 253,227 hectares, whilst the larger, state-
managed Uacari Sustainable Development Reserve (hereafter, RDS Uacari) is 632,949
hectares (Fig. 3.1). A 10 – 20 km wide band of seasonally inundated (várzea) forest
spanning the main river channel is subjected to a prolonged flood-pulse every year
between January and June, whilst terra firme forests on higher elevation have never
flooded, at least since the Pleistocene. The elevation is 65 – 170 m above sea level and
the terrain is flat or undulating. The area has a wet, tropical climate; daily rainfall
records at the Bauana Ecological Field Station (S 5°26' 19.032" W 67°17' 11.688")
indicated that 3,659 mm and 4,649 mm of rain fell annually in 2008 and 2009,
respectively. All forest within the study site was intact, primary forest that had
experienced very little logging activity except for some historical selective removal of
key timber species (including Copaifera spp.) from várzea forest between 1970 and
1995 (Scelza 2008).
3.3.2.2 Study species
The recent taxonomic review by Martins-da-Silva et al. (2008) recognised nine species
of Copaifera across Brazilian Amazonia. Copaifera species encountered within the
study site were identified using the key provided by this monograph before being
compared against voucher specimens previously identified by R. Martins-da-Silva in the
herbarium of the Botany Department of the Instituto Nacional de Pesquisas da
Amazônia (INPA), Manaus. Numbered voucher specimens of each species identified
during this study have been deposited at the INPA herbarium.
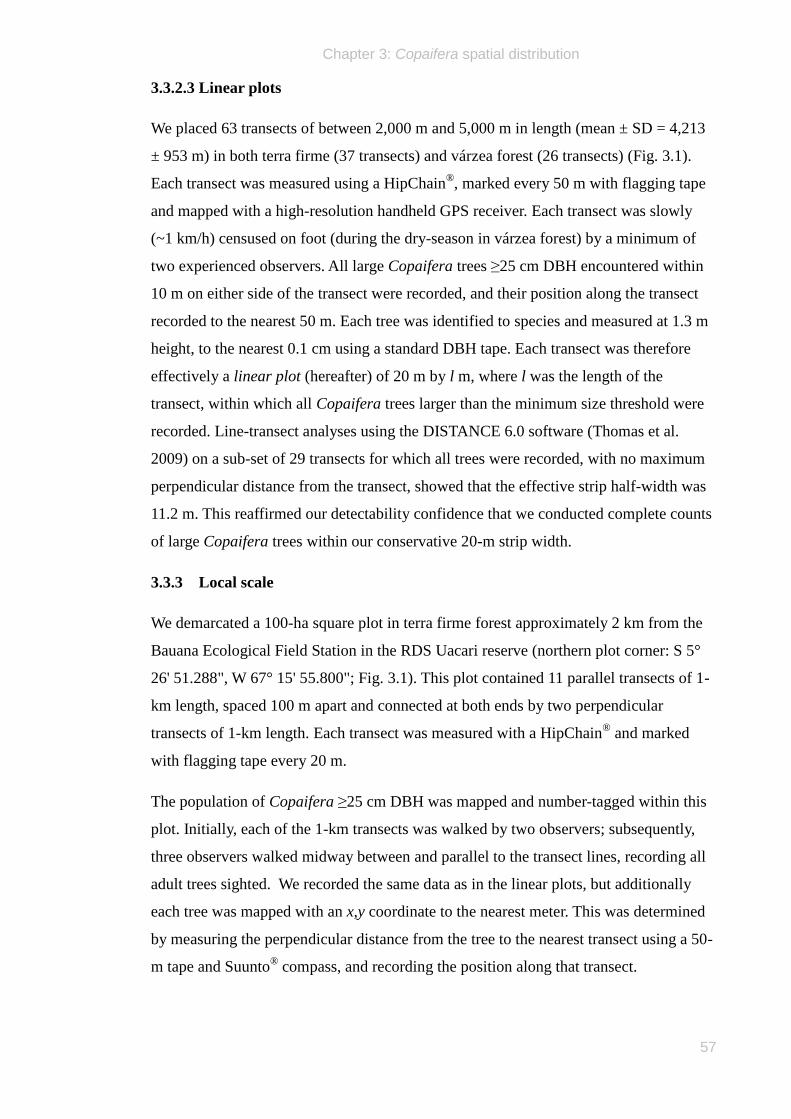
Chapter 3: Copaifera spatial distribution
57
3.3.2.3 Linear plots
We placed 63 transects of between 2,000 m and 5,000 m in length (mean ± SD = 4,213
± 953 m) in both terra firme (37 transects) and várzea forest (26 transects) (Fig. 3.1).
Each transect was measured using a HipChain®, marked every 50 m with flagging tape
and mapped with a high-resolution handheld GPS receiver. Each transect was slowly
(~1 km/h) censused on foot (during the dry-season in várzea forest) by a minimum of
two experienced observers. All large Copaifera trees ≥25 cm DBH encountered within
10 m on either side of the transect were recorded, and their position along the transect
recorded to the nearest 50 m. Each tree was identified to species and measured at 1.3 m
height, to the nearest 0.1 cm using a standard DBH tape. Each transect was therefore
effectively a linear plot (hereafter) of 20 m by l m, where l was the length of the
transect, within which all Copaifera trees larger than the minimum size threshold were
recorded. Line-transect analyses using the DISTANCE 6.0 software (Thomas et al.
2009) on a sub-set of 29 transects for which all trees were recorded, with no maximum
perpendicular distance from the transect, showed that the effective strip half-width was
11.2 m. This reaffirmed our detectability confidence that we conducted complete counts
of large Copaifera trees within our conservative 20-m strip width.
3.3.3 Local scale
We demarcated a 100-ha square plot in terra firme forest approximately 2 km from the
Bauana Ecological Field Station in the RDS Uacari reserve (northern plot corner: S 5°
26' 51.288", W 67° 15' 55.800"; Fig. 3.1). This plot contained 11 parallel transects of 1-
km length, spaced 100 m apart and connected at both ends by two perpendicular
transects of 1-km length. Each transect was measured with a HipChain® and marked
with flagging tape every 20 m.
The population of Copaifera ≥25 cm DBH was mapped and number-tagged within this
plot. Initially, each of the 1-km transects was walked by two observers; subsequently,
three observers walked midway between and parallel to the transect lines, recording all
adult trees sighted. We recorded the same data as in the linear plots, but additionally
each tree was mapped with an x,y coordinate to the nearest meter. This was determined
by measuring the perpendicular distance from the tree to the nearest transect using a 50-
m tape and Suunto® compass, and recording the position along that transect.
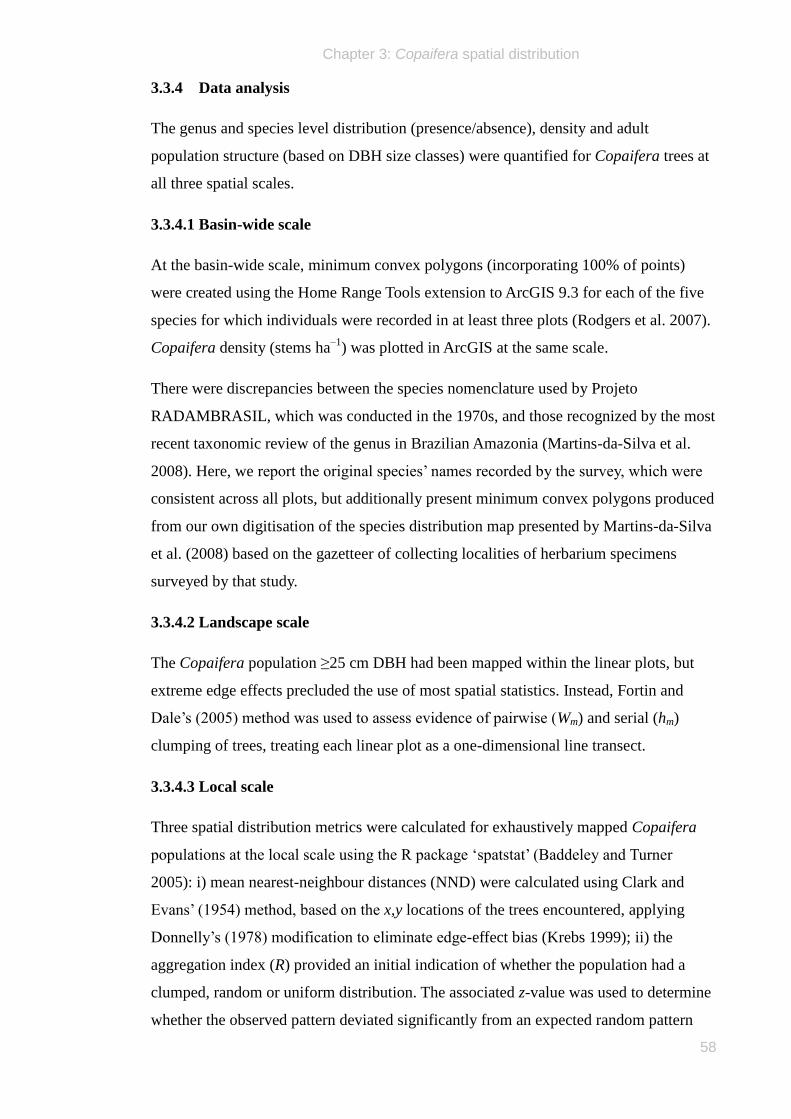
Chapter 3: Copaifera spatial distribution
58
3.3.4 Data analysis
The genus and species level distribution (presence/absence), density and adult
population structure (based on DBH size classes) were quantified for Copaifera trees at
all three spatial scales.
3.3.4.1 Basin-wide scale
At the basin-wide scale, minimum convex polygons (incorporating 100% of points)
were created using the Home Range Tools extension to ArcGIS 9.3 for each of the five
species for which individuals were recorded in at least three plots (Rodgers et al. 2007).
Copaifera density (stems ha–1
) was plotted in ArcGIS at the same scale.
There were discrepancies between the species nomenclature used by Projeto
RADAMBRASIL, which was conducted in the 1970s, and those recognized by the most
recent taxonomic review of the genus in Brazilian Amazonia (Martins-da-Silva et al.
2008). Here, we report the original species‟ names recorded by the survey, which were
consistent across all plots, but additionally present minimum convex polygons produced
from our own digitisation of the species distribution map presented by Martins-da-Silva
et al. (2008) based on the gazetteer of collecting localities of herbarium specimens
surveyed by that study.
3.3.4.2 Landscape scale
The Copaifera population ≥25 cm DBH had been mapped within the linear plots, but
extreme edge effects precluded the use of most spatial statistics. Instead, Fortin and
Dale‟s (2005) method was used to assess evidence of pairwise (Wm) and serial (hm)
clumping of trees, treating each linear plot as a one-dimensional line transect.
3.3.4.3 Local scale
Three spatial distribution metrics were calculated for exhaustively mapped Copaifera
populations at the local scale using the R package „spatstat‟ (Baddeley and Turner
2005): i) mean nearest-neighbour distances (NND) were calculated using Clark and
Evans‟ (1954) method, based on the x,y locations of the trees encountered, applying
Donnelly‟s (1978) modification to eliminate edge-effect bias (Krebs 1999); ii) the
aggregation index (R) provided an initial indication of whether the population had a
clumped, random or uniform distribution. The associated z-value was used to determine
whether the observed pattern deviated significantly from an expected random pattern
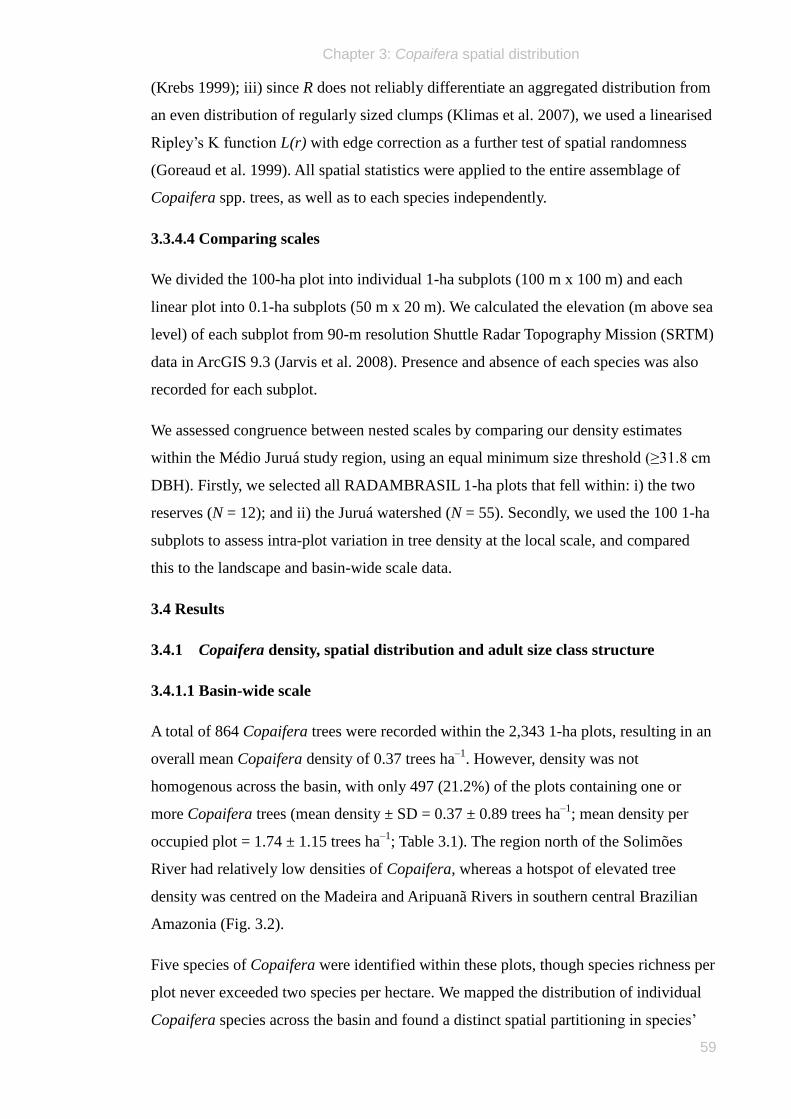
Chapter 3: Copaifera spatial distribution
59
(Krebs 1999); iii) since R does not reliably differentiate an aggregated distribution from
an even distribution of regularly sized clumps (Klimas et al. 2007), we used a linearised
Ripley‟s K function L(r) with edge correction as a further test of spatial randomness
(Goreaud et al. 1999). All spatial statistics were applied to the entire assemblage of
Copaifera spp. trees, as well as to each species independently.
3.3.4.4 Comparing scales
We divided the 100-ha plot into individual 1-ha subplots (100 m x 100 m) and each
linear plot into 0.1-ha subplots (50 m x 20 m). We calculated the elevation (m above sea
level) of each subplot from 90-m resolution Shuttle Radar Topography Mission (SRTM)
data in ArcGIS 9.3 (Jarvis et al. 2008). Presence and absence of each species was also
recorded for each subplot.
We assessed congruence between nested scales by comparing our density estimates
within the Médio Juruá study region, using an equal minimum size threshold (≥31.8 cm
DBH). Firstly, we selected all RADAMBRASIL 1-ha plots that fell within: i) the two
reserves (N = 12); and ii) the Juruá watershed (N = 55). Secondly, we used the 100 1-ha
subplots to assess intra-plot variation in tree density at the local scale, and compared
this to the landscape and basin-wide scale data.
3.4 Results
3.4.1 Copaifera density, spatial distribution and adult size class structure
3.4.1.1 Basin-wide scale
A total of 864 Copaifera trees were recorded within the 2,343 1-ha plots, resulting in an
overall mean Copaifera density of 0.37 trees ha–1
. However, density was not
homogenous across the basin, with only 497 (21.2%) of the plots containing one or
more Copaifera trees (mean density ± SD = 0.37 ± 0.89 trees ha–1
; mean density per
occupied plot = 1.74 ± 1.15 trees ha–1
; Table 3.1). The region north of the Solimões
River had relatively low densities of Copaifera, whereas a hotspot of elevated tree
density was centred on the Madeira and Aripuanã Rivers in southern central Brazilian
Amazonia (Fig. 3.2).
Five species of Copaifera were identified within these plots, though species richness per
plot never exceeded two species per hectare. We mapped the distribution of individual
Copaifera species across the basin and found a distinct spatial partitioning in species‟
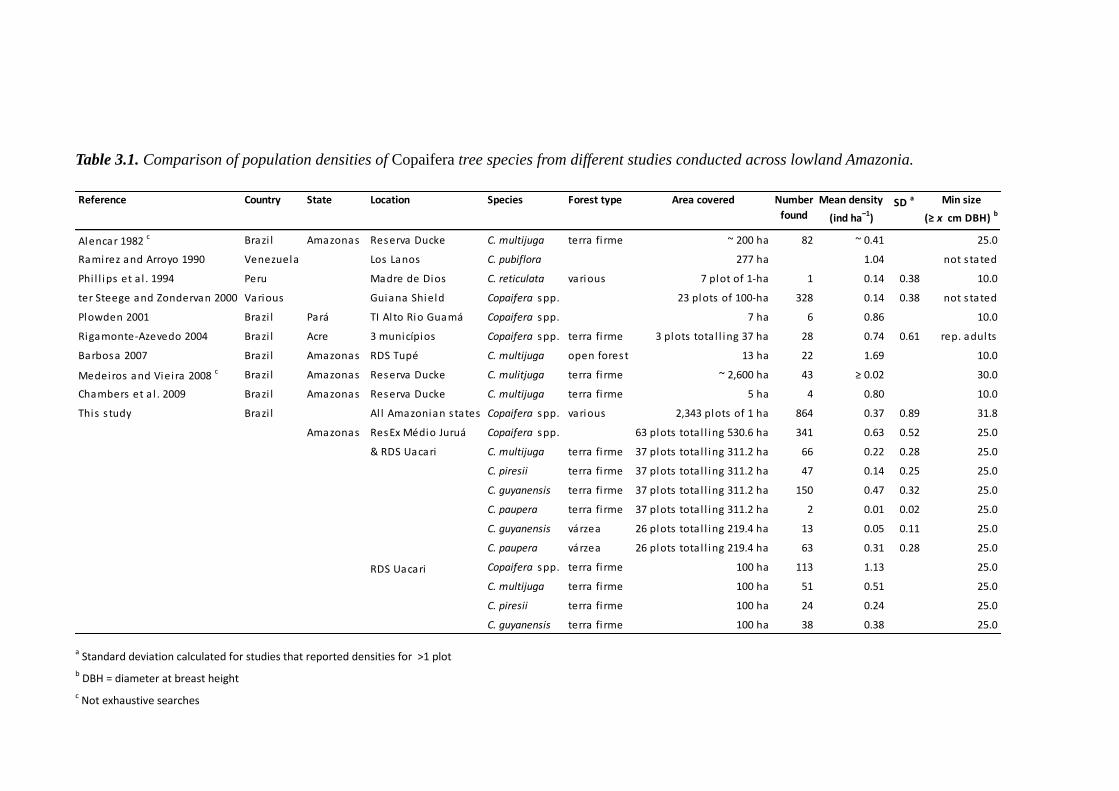
Table 3.1. Comparison of population densities of Copaifera tree species from different studies conducted across lowland Amazonia.
Reference Country State Location Species Forest type Area covered Number
found
Mean density
(ind ha–1)
SD a Min size
(≥ x cm DBH) b
Alencar 1982 c Brazi l Amazonas Reserva Ducke C. multijuga terra fi rme ~ 200 ha 82 ~ 0.41 25.0
Ramirez and Arroyo 1990 Venezuela Los Lanos C. pubiflora 277 ha 1.04 not s tated
Phi l l ips et a l . 1994 Peru Madre de Dios C. reticulata various 7 plot of 1-ha 1 0.14 0.38 10.0
ter Steege and Zondervan 2000 Various Guiana Shield Copaifera spp. 23 plots of 100-ha 328 0.14 0.38 not s tated
Plowden 2001 Brazi l Pará TI Al to Rio Guamá Copaifera spp. 7 ha 6 0.86 10.0
Rigamonte-Azevedo 2004 Brazi l Acre 3 municípios Copaifera spp. terra fi rme 3 plots tota l l ing 37 ha 28 0.74 0.61 rep. adults
Barbosa 2007 Brazi l Amazonas RDS Tupé C. multijuga open forest 13 ha 22 1.69 10.0
Medeiros and Vieira 2008 c Brazi l Amazonas Reserva Ducke C. mulitjuga terra fi rme ~ 2,600 ha 43 ≥ 0.02 30.0
Chambers et a l . 2009 Brazi l Amazonas Reserva Ducke C. multijuga terra fi rme 5 ha 4 0.80 10.0
This s tudy Brazi l Al l Amazonian s tates Copaifera spp. various 2,343 plots of 1 ha 864 0.37 0.89 31.8
Amazonas ResEx Médio Juruá Copaifera spp. 63 plots tota l l ing 530.6 ha 341 0.63 0.52 25.0
& RDS Uacari C. multijuga terra fi rme 37 plots tota l l ing 311.2 ha 66 0.22 0.28 25.0
C. piresii terra fi rme 37 plots tota l l ing 311.2 ha 47 0.14 0.25 25.0
C. guyanensis terra fi rme 37 plots tota l l ing 311.2 ha 150 0.47 0.32 25.0
C. paupera terra fi rme 37 plots tota l l ing 311.2 ha 2 0.01 0.02 25.0
C. guyanensis várzea 26 plots tota l l ing 219.4 ha 13 0.05 0.11 25.0
C. paupera várzea 26 plots tota l l ing 219.4 ha 63 0.31 0.28 25.0
RDS Uacari Copaifera spp. terra fi rme 100 ha 113 1.13 25.0
C. multijuga terra fi rme 100 ha 51 0.51 25.0
C. piresii terra fi rme 100 ha 24 0.24 25.0
C. guyanensis terra fi rme 100 ha 38 0.38 25.0
a Standard deviation calculated for studies that reported densities for >1 plot
b DBH = diameter at breast height
c Not exhaustive searches
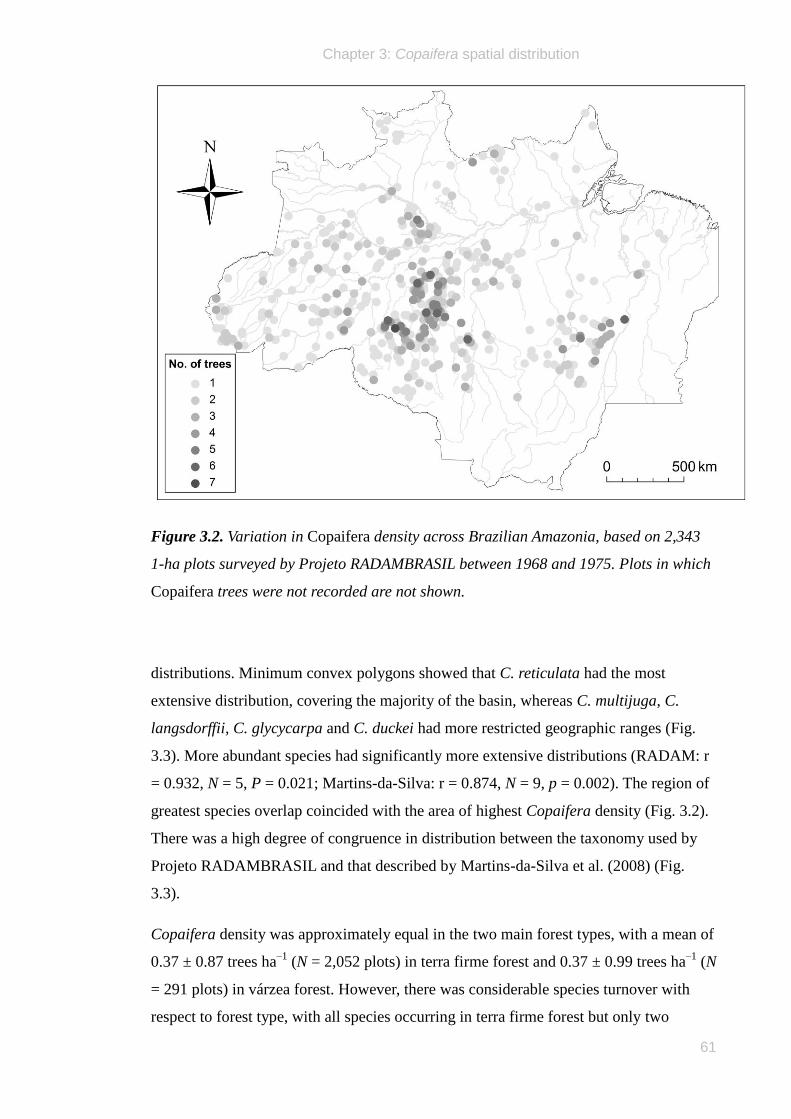
Chapter 3: Copaifera spatial distribution
61
Figure 3.2. Variation in Copaifera density across Brazilian Amazonia, based on 2,343
1-ha plots surveyed by Projeto RADAMBRASIL between 1968 and 1975. Plots in which
Copaifera trees were not recorded are not shown.
distributions. Minimum convex polygons showed that C. reticulata had the most
extensive distribution, covering the majority of the basin, whereas C. multijuga, C.
langsdorffii, C. glycycarpa and C. duckei had more restricted geographic ranges (Fig.
3.3). More abundant species had significantly more extensive distributions (RADAM: r
= 0.932, N = 5, P = 0.021; Martins-da-Silva: r = 0.874, N = 9, p = 0.002). The region of
greatest species overlap coincided with the area of highest Copaifera density (Fig. 3.2).
There was a high degree of congruence in distribution between the taxonomy used by
Projeto RADAMBRASIL and that described by Martins-da-Silva et al. (2008) (Fig.
3.3).
Copaifera density was approximately equal in the two main forest types, with a mean of
0.37 ± 0.87 trees ha–1
(N = 2,052 plots) in terra firme forest and 0.37 ± 0.99 trees ha–1
(N
= 291 plots) in várzea forest. However, there was considerable species turnover with
respect to forest type, with all species occurring in terra firme forest but only two
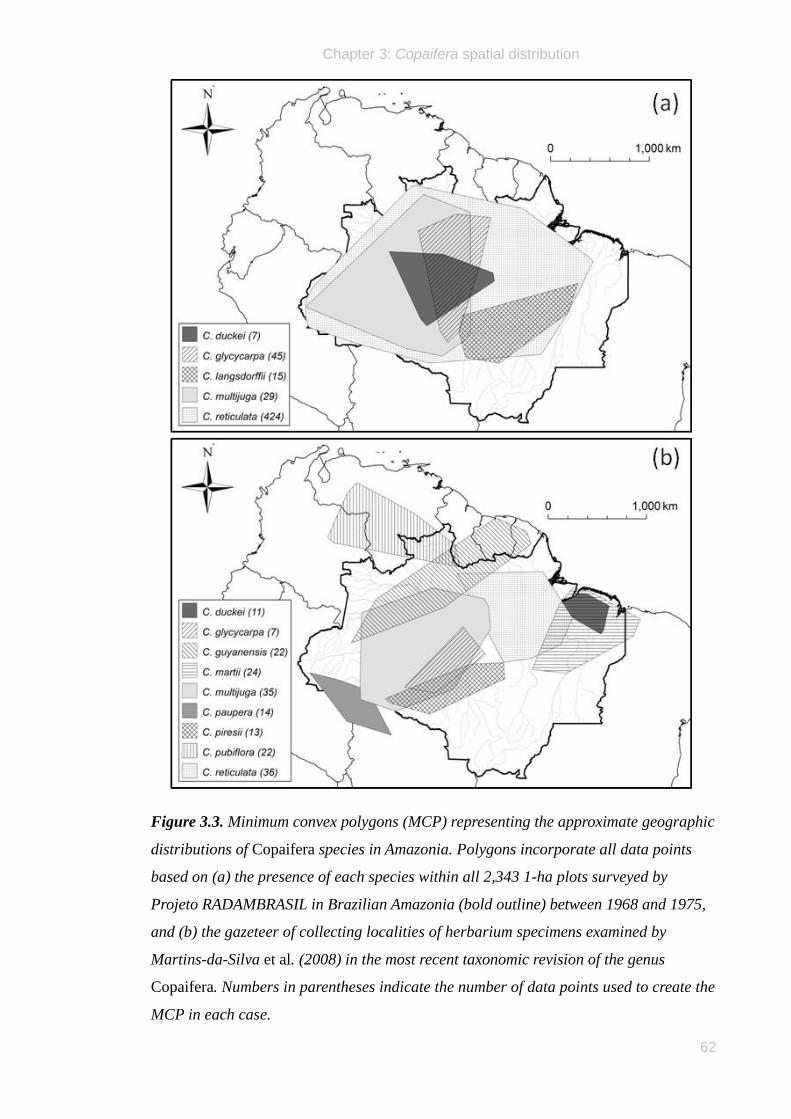
Chapter 3: Copaifera spatial distribution
62
Figure 3.3. Minimum convex polygons (MCP) representing the approximate geographic
distributions of Copaifera species in Amazonia. Polygons incorporate all data points
based on (a) the presence of each species within all 2,343 1-ha plots surveyed by
Projeto RADAMBRASIL in Brazilian Amazonia (bold outline) between 1968 and 1975,
and (b) the gazeteer of collecting localities of herbarium specimens examined by
Martins-da-Silva et al. (2008) in the most recent taxonomic revision of the genus
Copaifera. Numbers in parentheses indicate the number of data points used to create the
MCP in each case.
Chapter 3: Copaifera spatial distribution
63
species, C. reticulata and C. glycycarpa, regularly encountered in várzea forest (11.3%
and 15.7% of conspecifics, respectively).
There were significant differences between the mean size (DBH) of some of the seven
species (ANOVA (ln DBH): F Brown-Forsythe = 4.329, df = 6, p = 0.001; Table 3.2). In
aggregate, Copaifera trees within várzea forest (median DBH = 50.93 cm, N = 107)
were larger than their congeners in terra firme forest (median DBH = 46.15 cm, N =
757) (Mann-Whitney U = 34910, z = –2.318, p = 0.020; Fig. 3.4).
3.4.1.2 Landscape scale
A total of 341 Copaifera trees ≥25 cm DBH were encountered in a total of 530.6 ha of
forest censused, resulting in an overall density of 0.64 trees ha–1
. However, density was
not homogenous across the landscape (mean density ± SD = 0.63 ± 0.52 trees ha–1
, N =
63 linear plots; Table 3.1), and four of the 63 linear plots did not contain a single
Copaifera tree.
Four species of Copaifera were identified within the Médio Juruá study area: a total of
163 C. guyanensis, 66 C. multijuga, 65 C. paupera and 47 C. piresii were recorded.
Species distributions were not uniform between forest types: C. multijuga and C. piresii
were found only in terra firme, whilst all but two C. paupera trees were found in várzea.
C. guyanensis was encountered in both forest types, though predominantly (92.0%) in
terra firme. Species distributions (defined as presence or absence from each linear plot)
and species richness (the number of species per plot) were not uniform across the study
area (Table 3.3).
Copaifera density differed significantly between forest types, being more than twice as
high in terra firme forest (mean = 0.83 ± 0.57 trees ha–1
, N = 37 linear plots) than in
várzea forest (mean = 0.36 ± 0.26 trees ha–1
, N = 26 linear plots). C. guyanensis (the
only species occurring in both forest types), was found at densities an order of
magnitude higher in terra firme forest than in várzea forest (Table 3.1). C. guyanensis
and C. paupera were the most abundant species in terra firme and várzea forest,
respectively.
There were significant differences between the mean size (DBH) of some of the four
Copaifera species. Within terra firme forest, C. multijuga were significantly larger than
C. piresii. The two várzea forest species (C. guyanensis and C. paupera) were both
significantly larger than the three terra firme forest species (C. guyanensis, C. multijuga
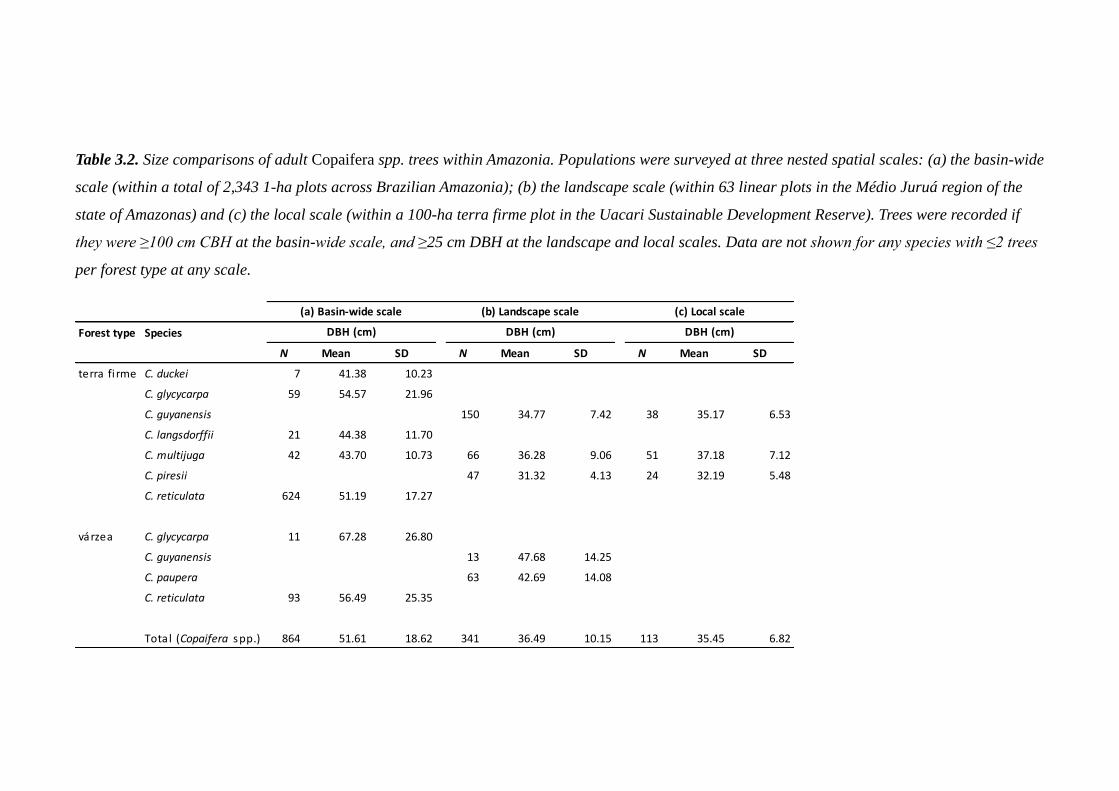
Table 3.2. Size comparisons of adult Copaifera spp. trees within Amazonia. Populations were surveyed at three nested spatial scales: (a) the basin-wide
scale (within a total of 2,343 1-ha plots across Brazilian Amazonia); (b) the landscape scale (within 63 linear plots in the Médio Juruá region of the
state of Amazonas) and (c) the local scale (within a 100-ha terra firme plot in the Uacari Sustainable Development Reserve). Trees were recorded if
they were ≥100 cm CBH at the basin-wide scale, and ≥25 cm DBH at the landscape and local scales. Data are not shown for any species with ≤2 trees
per forest type at any scale.
Forest type Species
N Mean SD N Mean SD N Mean SD
terra fi rme C. duckei 7 41.38 10.23
C. glycycarpa 59 54.57 21.96
C. guyanensis 150 34.77 7.42 38 35.17 6.53
C. langsdorffii 21 44.38 11.70
C. multijuga 42 43.70 10.73 66 36.28 9.06 51 37.18 7.12
C. piresii 47 31.32 4.13 24 32.19 5.48
C. reticulata 624 51.19 17.27
várzea C. glycycarpa 11 67.28 26.80
C. guyanensis 13 47.68 14.25
C. paupera 63 42.69 14.08
C. reticulata 93 56.49 25.35
Total (Copaifera spp.) 864 51.61 18.62 341 36.49 10.15 113 35.45 6.82
(c) Local scale(b) Landscape scale
DBH (cm)DBH (cm)DBH (cm)
(a) Basin-wide scale
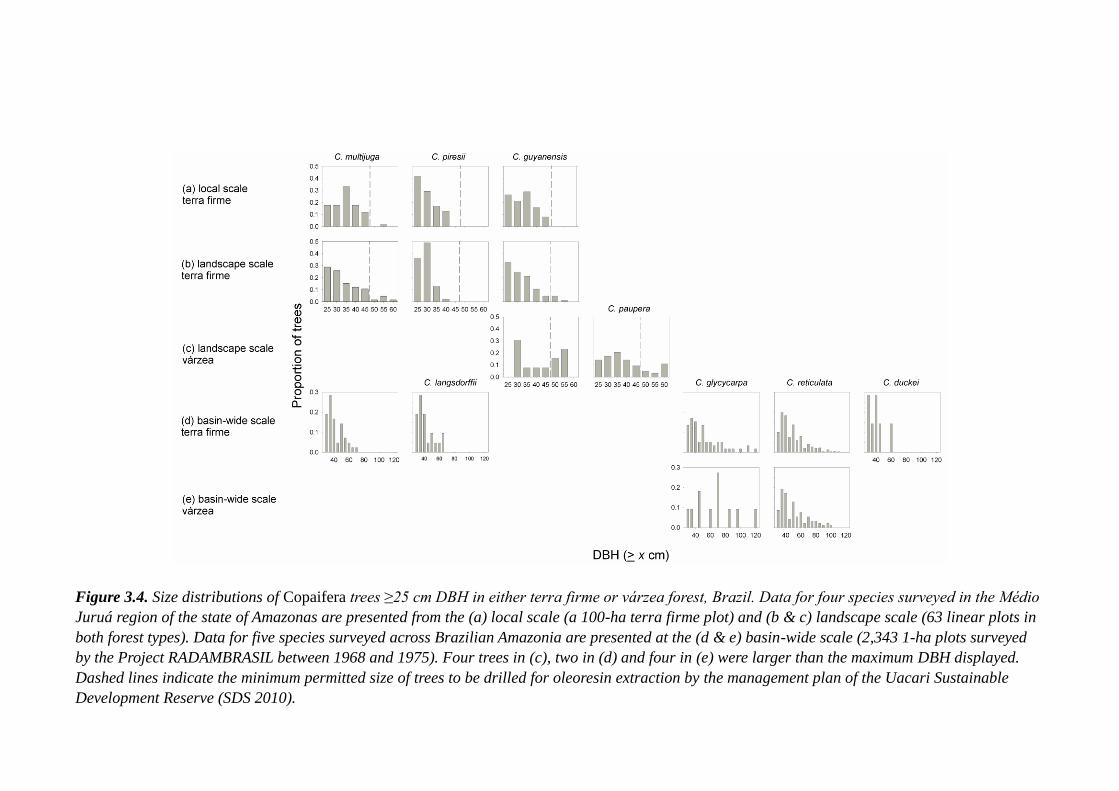
Figure 3.4. Size distributions of Copaifera trees ≥25 cm DBH in either terra firme or várzea forest, Brazil. Data for four species surveyed in the Médio
Juruá region of the state of Amazonas are presented from the (a) local scale (a 100-ha terra firme plot) and (b & c) landscape scale (63 linear plots in
both forest types). Data for five species surveyed across Brazilian Amazonia are presented at the (d & e) basin-wide scale (2,343 1-ha plots surveyed
by the Project RADAMBRASIL between 1968 and 1975). Four trees in (c), two in (d) and four in (e) were larger than the maximum DBH displayed.
Dashed lines indicate the minimum permitted size of trees to be drilled for oleoresin extraction by the management plan of the Uacari Sustainable
Development Reserve (SDS 2010).
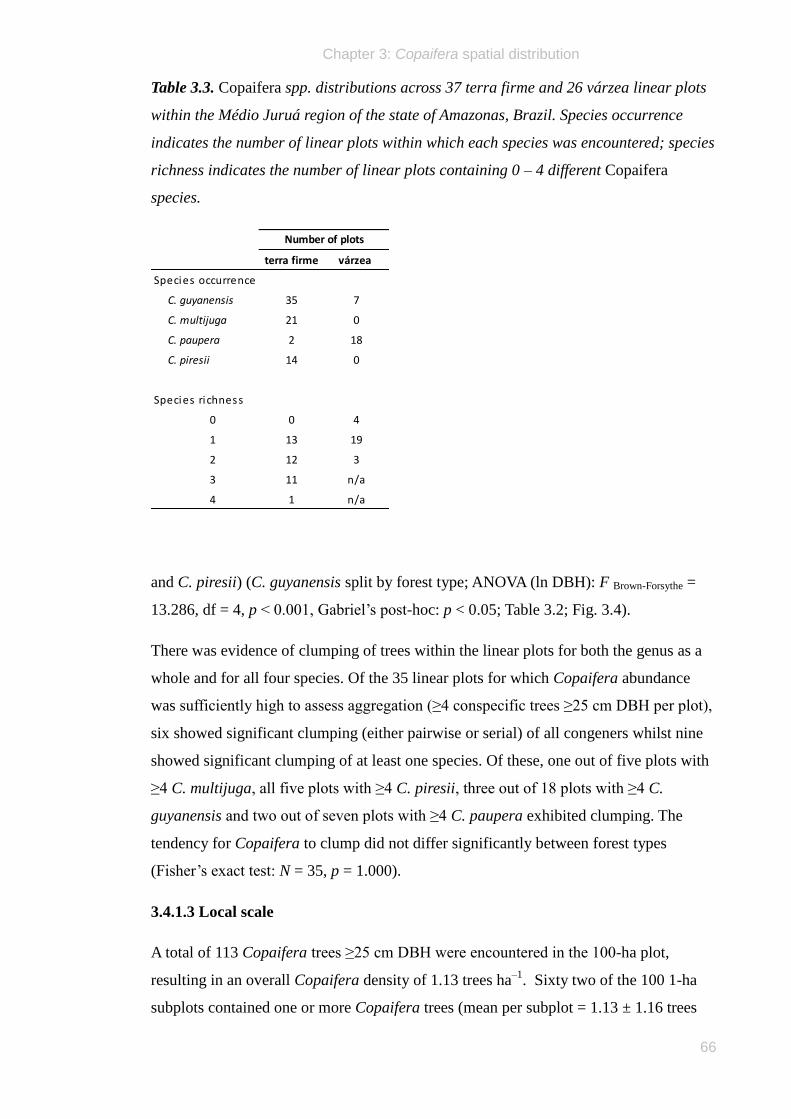
Chapter 3: Copaifera spatial distribution
66
Table 3.3. Copaifera spp. distributions across 37 terra firme and 26 várzea linear plots
within the Médio Juruá region of the state of Amazonas, Brazil. Species occurrence
indicates the number of linear plots within which each species was encountered; species
richness indicates the number of linear plots containing 0 – 4 different Copaifera
species.
terra firme várzea
Species occurrence
C. guyanensis 35 7
C. multijuga 21 0
C. paupera 2 18
C. piresii 14 0
Species richness
0 0 4
1 13 19
2 12 3
3 11 n/a
4 1 n/a
Number of plots
and C. piresii) (C. guyanensis split by forest type; ANOVA (ln DBH): F Brown-Forsythe =
13.286, df = 4, p < 0.001, Gabriel‟s post-hoc: p < 0.05; Table 3.2; Fig. 3.4).
There was evidence of clumping of trees within the linear plots for both the genus as a
whole and for all four species. Of the 35 linear plots for which Copaifera abundance
was sufficiently high to assess aggregation (≥4 conspecific trees ≥25 cm DBH per plot),
six showed significant clumping (either pairwise or serial) of all congeners whilst nine
showed significant clumping of at least one species. Of these, one out of five plots with
≥4 C. multijuga, all five plots with ≥4 C. piresii, three out of 18 plots with ≥4 C.
guyanensis and two out of seven plots with ≥4 C. paupera exhibited clumping. The
tendency for Copaifera to clump did not differ significantly between forest types
(Fisher‟s exact test: N = 35, p = 1.000).
3.4.1.3 Local scale
A total of 113 Copaifera trees ≥25 cm DBH were encountered in the 100-ha plot,
resulting in an overall Copaifera density of 1.13 trees ha–1
. Sixty two of the 100 1-ha
subplots contained one or more Copaifera trees (mean per subplot = 1.13 ± 1.16 trees
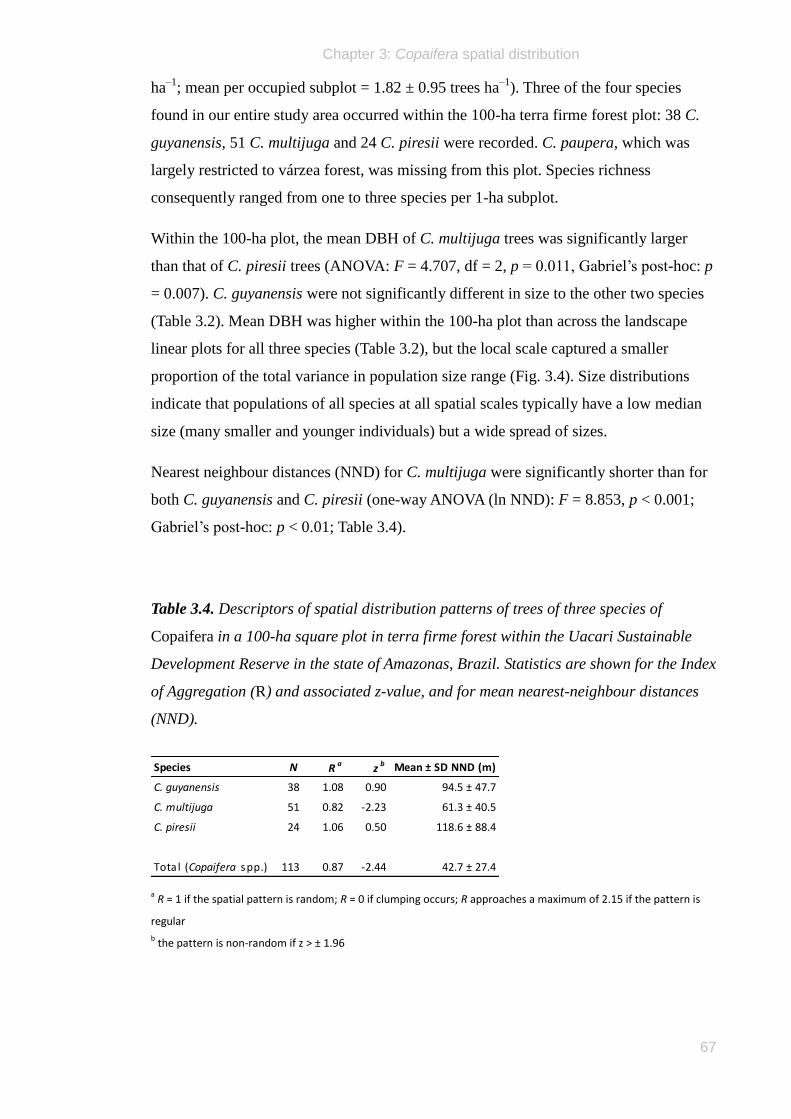
Chapter 3: Copaifera spatial distribution
67
ha–1
; mean per occupied subplot = 1.82 ± 0.95 trees ha–1
). Three of the four species
found in our entire study area occurred within the 100-ha terra firme forest plot: 38 C.
guyanensis, 51 C. multijuga and 24 C. piresii were recorded. C. paupera, which was
largely restricted to várzea forest, was missing from this plot. Species richness
consequently ranged from one to three species per 1-ha subplot.
Within the 100-ha plot, the mean DBH of C. multijuga trees was significantly larger
than that of C. piresii trees (ANOVA: F = 4.707, df = 2, p = 0.011, Gabriel‟s post-hoc: p
= 0.007). C. guyanensis were not significantly different in size to the other two species
(Table 3.2). Mean DBH was higher within the 100-ha plot than across the landscape
linear plots for all three species (Table 3.2), but the local scale captured a smaller
proportion of the total variance in population size range (Fig. 3.4). Size distributions
indicate that populations of all species at all spatial scales typically have a low median
size (many smaller and younger individuals) but a wide spread of sizes.
Nearest neighbour distances (NND) for C. multijuga were significantly shorter than for
both C. guyanensis and C. piresii (one-way ANOVA (ln NND): F = 8.853, p < 0.001;
Gabriel‟s post-hoc: p < 0.01; Table 3.4).
Table 3.4. Descriptors of spatial distribution patterns of trees of three species of
Copaifera in a 100-ha square plot in terra firme forest within the Uacari Sustainable
Development Reserve in the state of Amazonas, Brazil. Statistics are shown for the Index
of Aggregation (R) and associated z-value, and for mean nearest-neighbour distances
(NND).
Species N R a z b Mean ± SD NND (m)
C. guyanensis 38 1.08 0.90 94.5 ± 47.7
C. multijuga 51 0.82 -2.23 61.3 ± 40.5
C. piresii 24 1.06 0.50 118.6 ± 88.4
Total (Copaifera spp.) 113 0.87 -2.44 42.7 ± 27.4
a R = 1 if the spatial pattern is random; R = 0 if clumping occurs; R approaches a maximum of 2.15 if the pattern is
regular
b the pattern is non-random if z > ± 1.96
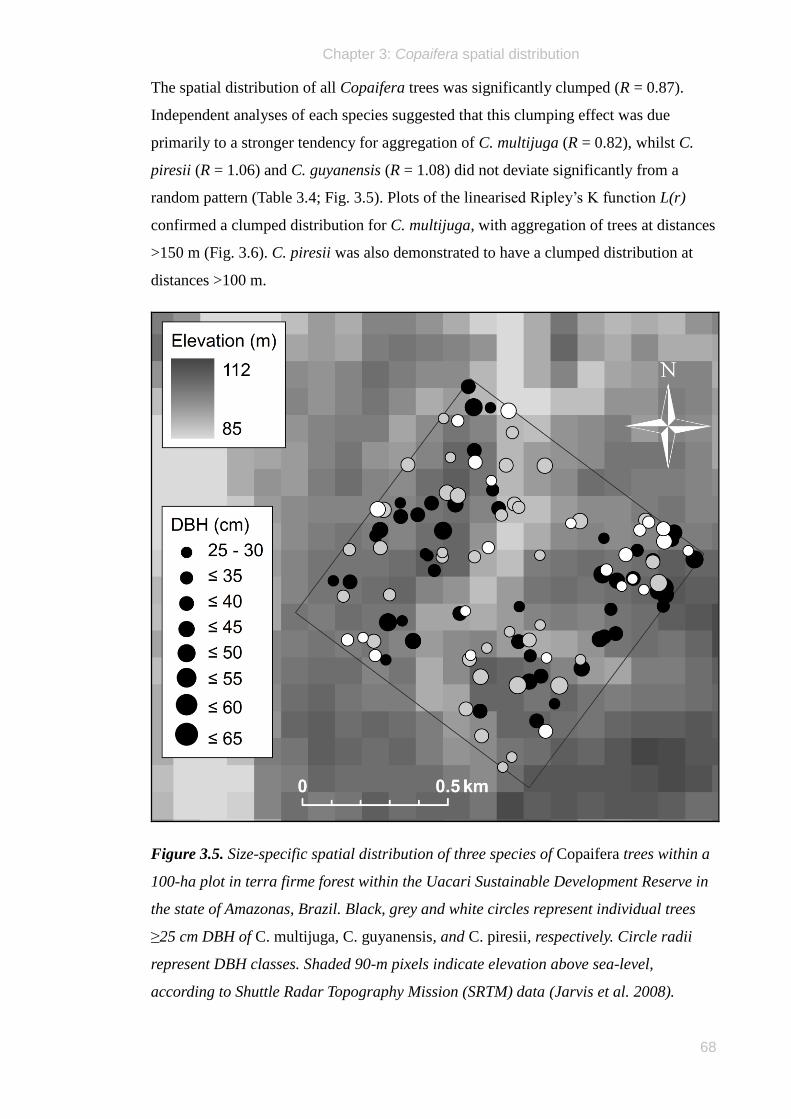
Chapter 3: Copaifera spatial distribution
68
The spatial distribution of all Copaifera trees was significantly clumped (R = 0.87).
Independent analyses of each species suggested that this clumping effect was due
primarily to a stronger tendency for aggregation of C. multijuga (R = 0.82), whilst C.
piresii (R = 1.06) and C. guyanensis (R = 1.08) did not deviate significantly from a
random pattern (Table 3.4; Fig. 3.5). Plots of the linearised Ripley‟s K function L(r)
confirmed a clumped distribution for C. multijuga, with aggregation of trees at distances
>150 m (Fig. 3.6). C. piresii was also demonstrated to have a clumped distribution at
distances >100 m.
Figure 3.5. Size-specific spatial distribution of three species of Copaifera trees within a
100-ha plot in terra firme forest within the Uacari Sustainable Development Reserve in
the state of Amazonas, Brazil. Black, grey and white circles represent individual trees
≥25 cm DBH of C. multijuga, C. guyanensis, and C. piresii, respectively. Circle radii
represent DBH classes. Shaded 90-m pixels indicate elevation above sea-level,
according to Shuttle Radar Topography Mission (SRTM) data (Jarvis et al. 2008).
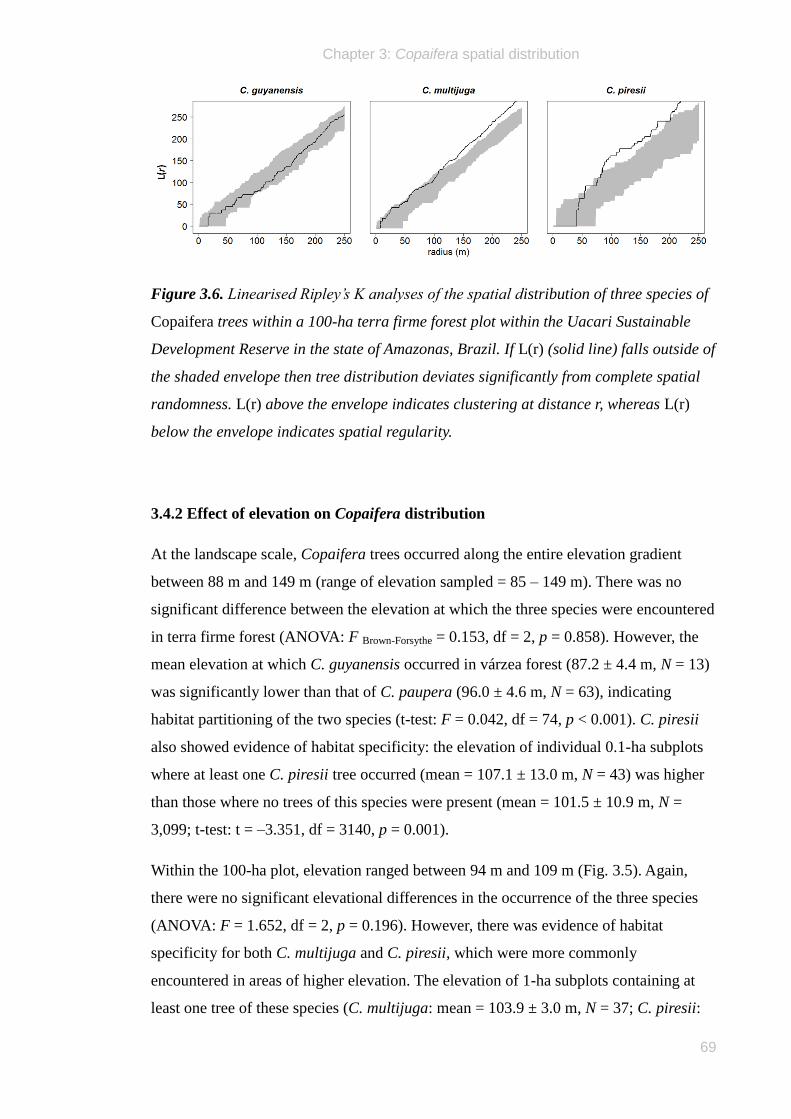
Chapter 3: Copaifera spatial distribution
69
Figure 3.6. Linearised Ripley‟s K analyses of the spatial distribution of three species of
Copaifera trees within a 100-ha terra firme forest plot within the Uacari Sustainable
Development Reserve in the state of Amazonas, Brazil. If L(r) (solid line) falls outside of
the shaded envelope then tree distribution deviates significantly from complete spatial
randomness. L(r) above the envelope indicates clustering at distance r, whereas L(r)
below the envelope indicates spatial regularity.
3.4.2 Effect of elevation on Copaifera distribution
At the landscape scale, Copaifera trees occurred along the entire elevation gradient
between 88 m and 149 m (range of elevation sampled = 85 – 149 m). There was no
significant difference between the elevation at which the three species were encountered
in terra firme forest (ANOVA: F Brown-Forsythe = 0.153, df = 2, p = 0.858). However, the
mean elevation at which C. guyanensis occurred in várzea forest (87.2 ± 4.4 m, N = 13)
was significantly lower than that of C. paupera (96.0 ± 4.6 m, N = 63), indicating
habitat partitioning of the two species (t-test: F = 0.042, df = 74, p < 0.001). C. piresii
also showed evidence of habitat specificity: the elevation of individual 0.1-ha subplots
where at least one C. piresii tree occurred (mean = 107.1 ± 13.0 m, N = 43) was higher
than those where no trees of this species were present (mean = 101.5 ± 10.9 m, N =
3,099; t-test: t = –3.351, df = 3140, p = 0.001).
Within the 100-ha plot, elevation ranged between 94 m and 109 m (Fig. 3.5). Again,
there were no significant elevational differences in the occurrence of the three species
(ANOVA: F = 1.652, df = 2, p = 0.196). However, there was evidence of habitat
specificity for both C. multijuga and C. piresii, which were more commonly
encountered in areas of higher elevation. The elevation of 1-ha subplots containing at
least one tree of these species (C. multijuga: mean = 103.9 ± 3.0 m, N = 37; C. piresii:
Chapter 3: Copaifera spatial distribution
70
mean = 104.4 ± 2.4 m, N = 21) was higher than those of unoccupied plots (C. multijuga:
mean = 102.5 ± 3.4 m, N = 63; C. piresii: mean = 102.7 ± 3.5 m, N = 79); (t-test (C.
multijuga): t = –2.067, df = 98, p = 0.041; t-test (C. piresii): t = –2.664, df = 44, p =
0.011; Fig. 3.5). C. guyanensis occurred at similar abundances at all elevations.
3.4.3 Comparing densities at nested scales
Twelve of the Projeto RADAMBRASIL 1-ha plots were located within our surveyed
landscape, but only two of these plots contained ≥1 Copaifera tree, with four trees (all
recorded as C. multijuga) in total. The overall density estimate for our study area from
these data was therefore 0.33 ± 0.89 trees ha–1
. This is comparable to the density of 0.25
± 0.62 Copaifera ha–1
within the 55 1-ha plots located within the wider Juruá River
watershed between the city of Eirunepé and the river‟s junction with the
Solimões/Amazon River. Considering the same minimum size threshold of 31.8 cm
DBH, the mean density of Copaifera across all 63 linear plots in our study landscape
was 0.39 ± 0.30 trees ha–1
, and across all 100 sub-units of the 100-ha terra firme plot
was 0.74 ± 0.93 trees ha–1
.
3.5 Discussion
At all spatial scales, our data showed that the density, DBH and aggregation of
Copaifera trees varied between species, with elevation, and between forest types. The
population size structure of all species and at all scales indicated populations with a
wide spread of tree sizes, dominated by smaller trees. Next, we compare the explanatory
congruence of different scales and discuss the relative merits of a cross-scale approach
to understanding and managing tropical NTFP distribution.
3.5.1 Adult density
Studies that have recorded Copaifera trees at the genus or species level across
Amazonia have reported tree densities ranging from 0.14 ha–1
(ter Steege and
Zondervan 2000) to 1.69 ha–1
(Barbosa 2007) (Table 3.1). This variation in densities
may be partly explained by: i) the minimum size threshold of recorded trees (range:
≥10.0 cm to ≥31.8 cm DBH; densities were higher when the minimum size cut-off was
smaller); ii) the spatial extent of the surveyed area (range: 5 to 2,300 ha; variation was
lower when larger areas were surveyed); or iii) the extent to which study site selection
was biased by known Copaifera abundance. Including all congeners, our mean densities
increased approximately two-fold from the basin-wide (0.37 ha–1
) to the landscape scale
Chapter 3: Copaifera spatial distribution
71
(0.63 ha–1
), and from the landscape to the local scale (1.13 ha–1
), and lie within the
range recorded elsewhere in the literature. However, our censused areas were much
larger than most other studies, lending greater support and population-level significance
to our estimates.
Similarly low densities have been recorded for other important Amazonian NTFP tree
species. Brazil nut (Bertholletia excelsa) density has been reported as 1.35 trees ≥10 cm
DBH ha–1
(Wadt et al. 2005), whilst rubber (Hevea brasiliensis) exhibits densities as
low as 1 – 1.5 tappable trees ha–1
(Schroth et al. 2003). Other NTFP trees occur at much
higher densities: Klimas et al. (2007) reported populations of andiroba (Carapa
guianensis) occurring at 25.5 trees ≥10 cm DBH ha–1
, whilst the palm Euterpe oleracea,
which is harvested for the fruit açai, occurs in natural abundances of up to 600 clumps
of trees ha–1
(Weinstein and Moegenburg 2004).
At the basin-wide scale, it should be noted that our estimates are based on data collected
~40 years ago, reflecting pre-deforestation tree abundance in many areas which are no
longer forested. Contemporary resource availability may be heavily depleted in areas
within the „arc of deforestation‟ of southern and eastern Amazonia.
At the landscape scale, densities within várzea forest were just 42.9% of those within
terra firme forest, possibly as a consequence of historical logging activity which
selectively removed larger Copaifera trees within mature floodplain forest of the Juruá
River (Scelza 2008). Extraction of Copaifera trees within the two extractive reserves in
our study area is now prohibited, so populations may eventually regenerate to former
levels.
3.5.2 Species distribution
Our data describing Copaifera species‟ distributions across both the basin-wide and
landscape scales are an important step in understanding the potential for commercial
harvesting of this resource. High inter-specific variability in oleoresin yield volumes
(Newton et al. 2011) and chemical composition (Veiga Junior et al. 2007) mean that the
incidence of economically-viable species will determine the local potential for initiating
or developing extractive industries based on oleoresin harvesting.
The mapped ranges of trees recorded under the Projeto RADAMBRASIL taxonomy
were based on more than three times as many sample points as the mapped geographic
origin of the herbarium specimens used by Martins-da-Silva et al. (2008), though the
Chapter 3: Copaifera spatial distribution
72
latter is considered the definitive contemporary taxonomic arrangement of the genus
(Fig. 3.3). Both taxonomies showed larger range sizes amongst more abundant species
(Gaston and Blackburn 2000) and there was considerable geographic congruence
between the two. For example, both maps in Fig. 3.3 indicate that C. multijuga – one of
the most commercially important species – is widespread throughout western Amazonia
and that C. glycycarpa is predominantly found in central Amazonia. Our mapped range
of C. langsdorffii corresponds closely to that of C. piresii in Martins-da-Silva (2008),
and we note that several type specimens in the INPA herbarium originally misclassified
as C. langsdorffii (an Atlantic Forest species) were recorded as C. piresii by R. Martins-
da-Silva (PN, personal observation). Irrespective of nomenclature, Projeto
RADAMBRASIL plots in which at least two Copaifera species were recorded probably
represent true areas of species overlap, since a single plant taxonomist is unlikely to
have attributed two different names to a single species. Moreover, our accurate
identification of the Copaifera species within our study area is supported by previous
collecting effort (Fig. 3.3).
3.5.3 Size-class structure
Copaifera trees in várzea forest were larger-girthed than in terra firme forest (Table 3.2;
Fig. 3.4). C. glycycarpa and C. reticulata at the basin-wide scale, and C. guyanensis at
the landscape scale, occurred in both forest types but their mean DBH was up to 12.7
cm larger within várzea forest. At all three scales, mean Copaifera DBH differed
between species. Differences in mean tree size have two practical implications. Firstly,
it has been demonstrated that larger trees yield greater oleoresin yields, but that the
relationship between DBH and yield volume varies between species (Newton et al.
2011). Inter-specific variation in population size structure reiterates the importance of
quantifying this relationship for each commercially-harvested species. Secondly,
government agencies set a minimum size for oleoresin extraction. For example, the
RDS Uacari management plan imposes a lower limit of 50 cm DBH (SDS 2010), whilst
other guidelines recommend a minimum of 40 cm DBH (Leite et al. 2001; Alechandre
et al. 2005). None of these cases explicitly define how these cut-off values were
selected. At a basin-wide scale, the mean DBH of four species was smaller than 50 cm,
whilst at the landscape scale 88% of all Copaifera encountered were below this size
threshold. All but one tree within the 100-ha plot were smaller than this criterion (Fig.
3.4). In contrast, several authors have found that trees larger than 25 cm DBH may yield
oleoresin (e.g. Plowden 2003; Newton et al. 2011). These findings suggest that a blanket
Chapter 3: Copaifera spatial distribution
73
minimum size threshold for harvesting may be inappropriate and that management plans
should be site- and species-specific in setting any lower size limit since Copaifera
populations may vary geographically and taxonomically.
3.5.4 Aggregated distributions
We found evidence of aggregation of trees within populations of some, but not all,
Copaifera species. At the local scale, all three measures of aggregation (NND, R, and
Ripley‟s K) indicated that C. multijuga had a significantly clumped distribution (Fig.
3.5). Ripley‟s K suggested that this aggregation tendency also applied to C. piresii and
this species showed consistently clumped distributions at the landscape scale. The mean
distance between neighbouring C. multijuga trees (61 m) was half that between C.
piresii trees (119 m). An aggregated population may indicate dispersal limitation,
environmental conditions, historical events, or density dependence (Boll et al. 2005).
Copaifera spp. are large-seeded species (seed size range = 2.2 – 3.6 cm length: J.
Hawes, unpublished data) dispersed by large-bodied arboreal frugivores, including
primates and birds (e.g. Aquino and Bodmer 2004). Since avian dispersal is often non-
random (Hutchings 1997), the first of these mechanisms may be partly responsible for
the aggregations observed. We discuss below the importance of environmental
variability on the distribution of this NTFP resource.
Aggregated NTFP populations have implications for extractors wishing to harvest a
given resource. Drilling Copaifera trees entails repeated visits to any given tree, since
the oleoresin is exuded slowly. There is also uncertainty that a given tree will yield any
oleoresin at all, so that individual extractors may drill several trees in a single day
(Newton et al. 2011). Clusters of C. multijuga trees spaced just 61 m apart therefore
offer opportunities for reduced travel distances, enhancing the efficiency and economic
viability of the harvest process.
3.5.5 Environmental variables
Many environmental variables affect tropical tree distributions, with the importance of
different factors expected to be scale-dependent (Willis and Whittaker 2002). In this
study, Copaifera occupancy was closely associated with elevation at the landscape and
local scales. In particular, Copaifera trees were frequently absent from low-lying,
poorly drained terra firme forest, even when differences in elevation from surrounding
areas of higher abundance was only a few meters (Fig. 3.5). These lowland areas often
Chapter 3: Copaifera spatial distribution
74
contained backwater swamps, characterized by monodominant stands of arborescent
palms and very low densities of hardwood trees (Peters et al. 1989).
3.5.6 Comparing scales
3.5.6.1 Selection of minimum tree size
The Projeto RADAMBRASIL forestry inventory was restricted to trees ≥31.8 cm DBH.
Our data suggest that 35% and 38% of Copaifera trees were between 25.0 and 31.8 cm
DBH in the landscape scale linear plots and the 100-ha plot, respectively (Fig. 3.4).
Because adult Copaifera spp. within this size class clearly occurred within many of the
1-ha plots which were recorded as zeros, the basin-wide inventory provides a severe
underestimate of adult density, which could be as high as 0.51 trees ha–1
. Given that
trees ≥25 cm DBH can produce viable oleoresin volumes and can easily be recorded by
field surveys with little extra effort, we suggest that smaller trees are also recorded by
future studies. In contrast, experienced observers in our study were not entirely
confident of reliably recording trees ≤25 cm DBH, since the characteristic trunk
markings are less recognizable at smaller sizes.
3.5.6.2 Selection of spatial scale
Basin-wide data cover many management units, so patterns of resource distribution may
be applicable in interpreting species‟ ranges or planning regional conservation policy.
The landscape scale is a useful resolution for examining variation within the resource
population available to individual extractors, who may access several hundred hectares
of forest (Peres and Lake 2003). On a local scale, mapping an entire population enables
the characterization of a resource using more detailed spatial statistics. However, a
limited study area may be unrepresentative, thereby failing to take account of variation
between habitat types or across an entire management unit (e.g. a large reserve).
The proportion of the study area censused at each spatial scale differed by several orders
of magnitude. Our survey at the local scale was exhaustive, with all trees ≥25 cm DBH
within the 100-ha plot mapped and measured. The 63 linear plots at the landscape scale
accounted for 530.6 ha (0.06%) of the 886,176-ha combined area of the two extractive
reserves, whilst at the basin-wide scale the 2,343 1-ha plots accounted for only
0.000005% of the 500,640,904 ha extent of Brazil‟s Amazônia Legal (ARPA 2009).
This enormous variation in survey coverage is an inevitable consequence of scale, but
has important implications for interpreting our results.
Chapter 3: Copaifera spatial distribution
75
Estimates of Copaifera distribution in the Juruá region obtained using the same (31.8
cm DBH) size threshold at all three spatial scales produced similar density estimates for
the basin-wide (0.33 ha–1
) and landscape (0.39 ha–1
) scales, but a density more than
twice as high for the local scale (0.74 ha–1
). Alternative sampling strategies within the
same geographic area can affect assessments of spatial distribution, and patterns
inferred from large-scale data may lead to conflicting conclusions in relation to those
obtained from a more detailed study within the same site. In the Médio Juruá region,
RADAMBRASIL data indicated relatively low densities of Copaifera trees, and
critically failed to account for patches of locally-high density.
3.5.7 Conclusions
Studying Copaifera species populations at three spatial scales has enabled us to better
understand variation in density and spatial distribution in relation to a forest resource of
importance to millions of rural and urban Amazonians. Alternative spatial scales offer
opportunities to variously explore and compare patterns of distribution, density and
aggregation, and to cross-validate patterns observed at more than one scale. Basin-wide,
landscape, and local studies are each associated with their own merits and limitations,
but in combination offer a more holistic understanding of tropical forest resource
distribution.
3.6 References
Alechandre, A., Leite, A., Azevedo, K., Campos, C.A., Silva, E.F., Da Melo, T., Souza,
N.M.D., Rola, L., 2005. Manejo de produtos florestais não madeireiros por moradores
da Reserva Extrativista Chico Mendes. In: Oliveira, M.A. (Ed.). Pesquisa
sociobioparticipativa na Amazônia Ocidental: aventuras e desventuras, pp. 15-76.
EDUFAC, Rio Branco.
Alencar, J.D.C., 1982. Estudos silviculturais de uma população natural de Copaifera
multijuga Hayne – Leguminosae, na Amazônia Central. 2 – Produção de óleo-resina.
Acta Amazonica 12, 75-90.
Aquino, R., Bodmer, R.E., 2004. Plantas útiles en la alimentación de primates en la
cuenca del Río Samiria, Amazonia Peruana. Neotropical Primates 12, 1-6.
ARPA, 2009. Programa Àreas Protegidas da Amazônia: Amazônia Brasileira. Instituto
Socioambiental, Manaus, Amazonas.
Chapter 3: Copaifera spatial distribution
76
Baddeley, A. and Turner, R., 2005. Spatstat: an R package for analyzing spatial point
patterns. Journal of Statistical Software 12, 1-42. ISSN: 1548-7660. URL:
www.jstatsoft.org.
Barbosa, K.S., 2007. Óleo-resina de Copaifera multijuga Hayne (Leg-Caesalpinoideae):
produção e análise química na Reserva de Desenvolvimento Sustentável do Tupé,
Manaus, AM. MSc dissertation. Universidade do Estado do Amazonas, Manaus,
Amazonas.
Boll, T., Svenning, J.C., Vormisto, J., Normand, S., Grandez, C., Balslev, H., 2005.
Spatial distribution and environmental preferences of the piassaba palm Aphandra
natalia (Arecaceae) along the Pastaza and Urituyacu rivers in Peru. Forest Ecology and
Management 213, 175-183.
Chambers, J. Q., dos Santos, J., Ribeiro, R.J., Higuchi, N. 2009. LBA-ECO CD-08 Tree
Inventory Data, Ducke Reserve, Manaus, Brazil: 1999. Data set from Oak Ridge
National Laboratory Distributed Active Archive Center, Oak Ridge, Tennessee, U.S.A.
doi:10.3334/ORNLDAAC/910. URL http://daac.ornl.gov.
Clark, P.J., Evans, F.C., 1954. Distance to nearest neighbor as a measure of spatial
relationships in populations. Ecology 35, 445-453.
Donnelly, K., 1978. Simulations to determine the variance and edge-effect of total
nearest neighbour distance. In: Hodder, I. (Ed.), Simulation methods in archaeology, pp.
91-95. Cambridge University Press, London.
Erickson, R.O., 1945. The Clematis fremontii var. Riehlii population in the Ozarks.
Annals of the Missouri Botanical Garden 32, 413-460.
Forman, R.T.T., 1964. Growth under controlled conditions to explain the hierarchical
distributions of a moss, Tetraphis pellucida. Ecological Monographs 34, 1-25.
Fortin, M.J., Dale, M.R.T., 2005. Spatial analysis: a guide for ecologists. Cambridge
University Press, Cambridge.
Freckleton, R.P., Matos, D.M.S., Bovi, M.L.A., Watkinson, A.R., 2003. Predicting the
impacts of harvesting using structured population models: the importance of density-
dependence and timing of harvest for a tropical palm tree. Journal of Applied Ecology
40, 846-858.
Chapter 3: Copaifera spatial distribution
77
Gaston, K.J., Blackburn, T.M., 2000. Pattern and process in macroecology. Blackwell
Science, Oxford.
Goreaud, F., Courband, B., Collinet, F., 1999. Spatial structure analysis applied to
modelling of forest dynamics: a few examples. In: Proceedings of the IUFRO
workshop, Empirical and process based models for forest tree and stand growth
simulation, Oeiras, Portugal.
Haugaasen, T., Peres, C.A., 2006. Floristic, edaphic and structural characteristics of
flooded and unflooded forests in the lower Rio Purús region of central Amazonia,
Brazil. Acta Amazonica 36, 25-36.
Hubbell, S.P., Ahumada, J.A., Condit, R., Foster, R.B., 2001. Local neighborhood
effects on long-term survival of individual trees in a neotropical forest. Ecological
Research 16, 859-875.
Hutchings, M.J., 1997. The structure of plant populations. In: Crawley, M.J. (Ed.). Plant
Ecology, pp. 325-358. Blackwell Science, Oxford.
IBGE, 2011. Instituto Brasileiro de Geografia e Estatística. Sistema IBGE de
recuperação automatica (SIDRA). URL www.sidra.ibge.gov.br.
Jarvis, A., Reuter, H.I., Nelson, A., Guevara, E. 2008. Hole-filled seamless SRTM data
V4, International Centre for Tropical Agriculture (CIAT). URL http://srtm.csi.cgiar.org.
Klimas, C.A., Kainer, K.A., Wadt, L.H.O., 2007. Population structure of Carapa
guianensis in two forest types in the southwestern Brazilian Amazon. Forest Ecology
and Management 250, 256-265.
Krebs, C.J., 1999. Ecological Methodology. Addison-Wesley Educational Publishers
Inc, Menlo Park.
Krebs, C.J., 2009. Ecology: the experimental analysis of distribution and abundance.
Pearson Education, San Francisco.
Leite, A., Alechandre, A., Rigamonte-Azevedo, C., Campos, C.A., Oliveira, A., 2001.
Recomendações para o manejo sustentável do óleo de copaíba. Universidade Federal do
Acre and Secretaria Executiva de Floresta e Extrativismo (SEFE), Rio Branco.
Chapter 3: Copaifera spatial distribution
78
Martins-da-Silva, R.C.V., Pereira, J.F., Lima, H.C., 2008. O gênero Copaifera
(Leguminosae – Caesalpinioideae) na Amazônia Brasileira. Rodriguésia 59, 455-476.
Medeiros, R.D., Vieira, G., 2008. Sustainability of extraction and production of copaíba
(Copaifera multijuga Hayne) oleoresin in Manaus, AM, Brazil. Forest Ecology and
Management 256, 282-288.
Newton, P., Watkinson, A.R., Peres, C.A., 2011. Determinants of yield in a non-timber
forest product: Copaifera oleoresin in Amazonian extractive reserves. Forest Ecology
and Management 261, 255-264.
Peres, C.A., Baider, C., Zuidema, P.A., Wadt, L.H.O., Kainer, K.A., Gomes-Silva,
D.A.P., Salomao, R.P., Simoes, L.L., Franciosi, E.R.N., Valverde, F.C., Gribel, R.,
Shepard, G.H., Kanashiro, M., Coventry, P., Yu, D.W., Watkinson, A.R., Freckleton,
R.P., 2003. Demographic threats to the sustainability of Brazil nut exploitation. Science
302, 2112-2114.
Peres, C.A., Lake, I.R., 2003. Extent of nontimber resource extraction in tropical
forests: accessibility to game vertebrates by hunters in the Amazon basin. Conservation
Biology 17, 521-535.
Peters, C.M., Balick, M.J., Kahn, F., Anderson, A.B., 1989. Oligarchic forests of
economic plants in Amazonia: utilization and conservation of an important tropical
resource. Conservation Biology 3, 341-349.
Phillips, O., Gentry, A.H., Reynel, C., Wilkin, P., Galvezdurand, C., 1994. Quantitative
ethnobotany and Amazonian conservation. Conservation Biology 8, 225-248.
Phillips, O.L., Vargas, P.N., Monteagudo, A.L., Cruz, A.P., Zans, M.E.C., Sanchez,
W.G., Yli-Halla, M., Rose, S., 2003. Habitat association among Amazonian tree species:
a landscape-scale approach. Journal of Ecology 91, 757-775.
Plowden, C., 2001. The ecology, management and marketing of NTFPs in the Alto Rio
Guama indigenous reserve (eastern Brazilian Amazon). PhD dissertation. Intercollege
Graduate Degree Program in Ecology. Penn State University, University Park.
Plowden, C., 2003. Production ecology of copaíba (Copaifera spp.) oleoresin in the
eastern Brazilian Amazon. Economic Botany 57, 491-501.
Chapter 3: Copaifera spatial distribution
79
Plowden, C., 2004. The ethnobotany of copaíba (Copaifera) oleoresin in the Amazon.
Economic Botany 58, 729-733.
RADAMBRASIL, 1982. Projeto RADAMBRASIL. Levantamento de recursos naturais.
Ministério das Minas e Energia, Rio de Janeiro.
Ramirez, N., Arroyo, M.K., 1990. Estructura poblacional de Copaifera pubiflora Benth.
(Leguminosae: Caesalpinioideae) en los Altos Llanos Centrales de Venezuela.
Biotropica 22, 124-132.
Reynolds, J.D., Peres, C.A., 2006. Overexploitation. In: Groom, M.J., Meffe, G.K.,
Carroll, C.R. (Eds.). Principles of conservation biology, pp. 253-277. Sinauer Associates
Inc, Sunderland, Massachusetts.
Rigamonte-Azevedo, O.C., 2004. Copaíba: estrutura populacional, produção e
qualidade do óleo-resina em populações nativas do sudoeste da Amazônia. MSc
dissertation. Universidade Federal do Acre, Rio Branco.
Rigamonte-Azevedo, O.C., Wadt, P.G.S., Wadt, L.H.O., 2006. Potencial de produção de
óleo-resina de copaíba (Copaifera spp) de populações naturais do sudoeste da
Amazônia. Sociedade de Investigações Florestais 30, 583-591.
Rodgers, A.R., Carr, A.P., Beyer, H.L., Smith, L., Kie, J.G., 2007. HRT: Home Range
Tools for ArcGIS. Version 1.1. Ontario Ministry of Natural Resources, Centre for
Northern Forest Ecosystem Research, Thunder Bay, Ontario, Canada.
Scelza, G.C., 2008. Desobriga: o movimento de contra-opressão ao sistema dos
seringais no Médio Juruá – AM (1970-2008). MSc dissertation. Instituto de Filosofia e
Ciências Sociais. Universidade Federal do Rio de Janeiro, Rio de Janeiro.
Schroth, G., Coutinho, P., Moraes, V.H.F., Albernaz, A.L., 2003. Rubber agroforests at
the Tapajós river, Brazilian Amazon - environmentally benign land use systems in an
old forest frontier region. Agriculture, Ecosystems and Environment 97, 151-165.
SDS, 2010. Plano de gestão da Reserva de Desenvolvimento Sustentavel de Uacari.
Série Técnica Planos de Gestão. Secretaria de Estado do Meio Ambiente e
Desenvolvimento Sustentàvel, Carauari.
ter Steege, H., Zondervan, G., 2000. A preliminary analysis of large-scale forest
inventory data of the Guiana Shield. In: ter Steege, H. (Ed.). Plant diversity in Guyana –
Chapter 3: Copaifera spatial distribution
80
with recommendation for a protected areas strategy, pp. 35-54. Tropenbos Foundation,
Wageningen, The Netherlands.
Thomas, L., Laake, J.L., Rexstad, E.,Strindberg, S., Marques, F.F.C., Buckland, S.T.,
Borchers, D.L., Anderson, D.R., Burnham, K.P., Burt, M.L., Hedley, S.L., Pollard, J.H.,
Bishop, J.R.B., Marques, T.A. 2009. Distance 6.0. Release 6.0. Research Unit for
Wildlife Population Assessment, University of St. Andrews, UK. URL
http://www.ruwpa.st-and.ac.uk/distance/.
Tuomisto, H., Ruokolainen, K., Yli-Halla, M., 2003. Dispersal, environment, and
floristic variation of western Amazonian forests. Science 299, 241-244.
Valencia, R., Foster, R.B., Villa, G., Condit, R., Svenning, J.C., Hernandez, C.,
Romoleroux, K., Losos, E., Magard, E., Balslev, H., 2004. Tree species distributions
and local habitat variation in the Amazon: large forest plot in eastern Ecuador. Journal
of Ecology 92, 214-229.
Veiga Junior, V.F., Pinto, A.C., 2002. O gênero Copaifera L. Quimica Nova 25, 273-
286.
Veiga Junior, V.F., Rosas, E.C., Carvalho, M.V., Henriques, M., Pinto, A.C., 2007.
Chemical composition and anti-inflammatory activity of copaiba oils from Copaifera
cearensis Huber ex Ducke, Copaifera reticulata Ducke and Copaifera multijuga Hayne
- a comparative study. Journal of Ethnopharmacology 112, 248-254.
Wadt, L.H.O., Kainer, K.A., Gomes-Silva, D.A.P., 2005. Population structure and nut
yield of a Bertholletia excelsa stand in southwestern Amazonia. Forest Ecology and
Management 211, 371-384.
Weinstein, S., Moegenburg, S., 2004. Açaí palm management in the Amazon estuary:
course for conservation or passage to plantations? Conservation and Society 2, 315-346.
Willis, K.J., Whittaker, R.J., 2002. Species diversity - scale matters. Science 295, 1245-
1248.
Wittmann, F., Schongart, J., Montero, J.C., Motzer, T., Junk, W.J., Piedade, M.T.F.,
Queiroz, H.L., Worbes, M., 2006. Tree species composition and diversity gradients in
white-water forests across the Amazon Basin. Journal of Biogeography 33, 1334-1347.
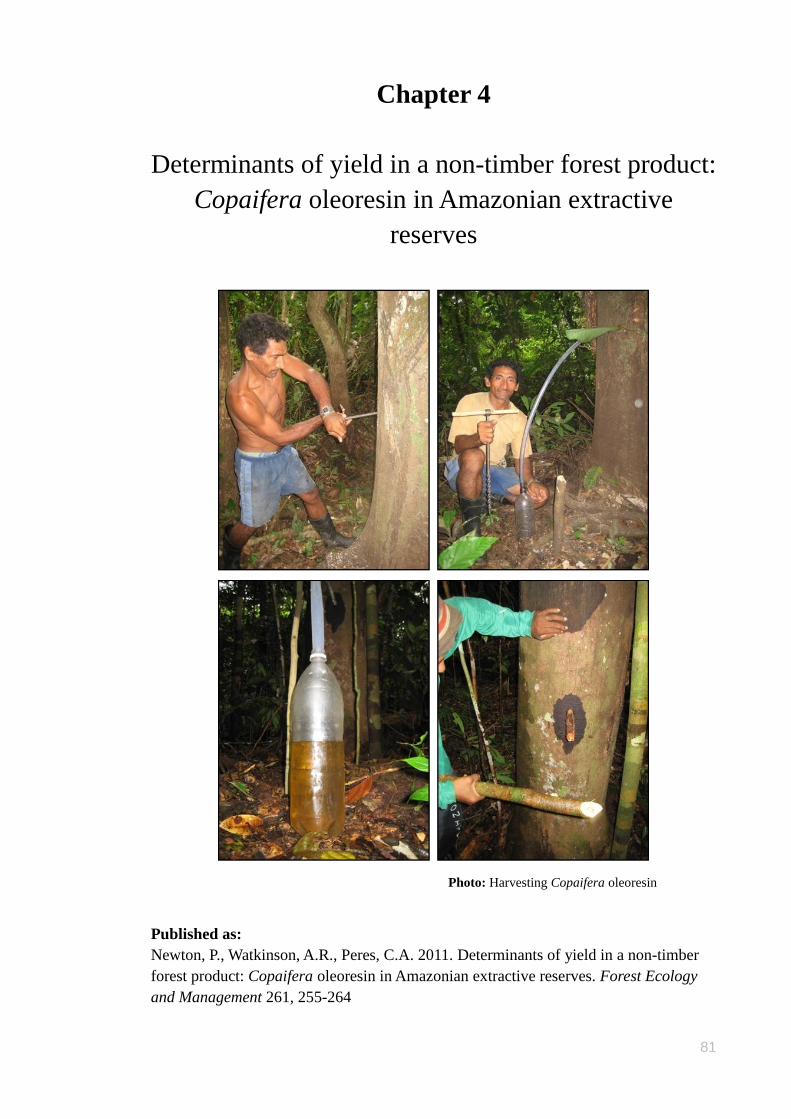
81
Chapter 4
Determinants of yield in a non-timber forest product:
Copaifera oleoresin in Amazonian extractive
reserves
Photo: Harvesting Copaifera oleoresin
Published as:
Newton, P., Watkinson, A.R., Peres, C.A. 2011. Determinants of yield in a non-timber
forest product: Copaifera oleoresin in Amazonian extractive reserves. Forest Ecology
and Management 261, 255-264
Chapter 4: Copaifera oleoresin harvest
82
4.1 Abstract
Developing sustainable extractive industries in otherwise intact tropical forest regions
requires a sound understanding of the production potential of key resource populations.
The oleoresin extracted from Copaifera trees is an economically important non-timber
forest product harvested throughout the lowland Amazon basin. We studied oleoresin
extraction from four species of Copaifera trees with known harvest histories within two
contiguous extractive reserves in western Brazilian Amazonia. We conducted a large-
scale experimental harvest of 179 previously unharvested Copaifera trees, in both
seasonally-flooded (várzea) and adjacent unflooded (terra firme) forests. The likelihood
of trees yielding any oleoresin was principally determined by their species identity: C.
multijuga was the only species to regularly yield oleoresin (70% of trees). Yield
volumes varied both among species and forest types: C. multijuga (restricted to terra
firme forest) had the highest mean yield of 505 ml, whilst C. guyanensis produced
higher volumes of oleoresin in várzea (139 ml) than terra firme (15 ml) forest.
Intraspecific differences were driven mainly by tree size. To assess extraction
sustainability, we reharvested a sample of C. multijuga trees and compared the oleoresin
production of 24 conspecific trees that had been initially harvested one year previously
with that of 17 trees initially harvested three years previously. Reharvested trees
produced just 35% of the oleoresin volume compared to that when originally drilled, but
this response was not affected by the time interval between consecutive harvests. We
demonstrate that, within a population of Copaifera, both morphological and
environmental factors restrict total productivity; consideration of these factors should
inform sustainable management practises. We additionally raise methodological
considerations that may improve the comparability of studies.
4.2 Introduction
Legally inhabited protected areas in Amazonia, including extractive reserves,
sustainable development reserves and indigenous territories, aim to reconcile the
interests of forest biodiversity conservation and ecosystem service provision with the
needs of local livelihoods (Allegretti 1990). Such multiple-use reserves account for over
35% of the Brazilian Amazon, and are an integral component of governmental strategies
to preserve intact areas of primary forest (Peres and Zimmerman 2001; Nepstad et al.
2006). One way in which reserve managers seek to achieve the dual roles of
maintaining forest integrity whilst promoting sustainable extractive activities is to
Chapter 4: Copaifera oleoresin harvest
83
develop small-scale projects in which forest dwellers exploit non-timber forest products
(NTFP).
The potential for NTFP extraction to play a role in tropical forest conservation has been
widely discussed. Advocates highlight the potential for direct local revenues coupled
with relatively benign impacts on forest ecosystem structure (e.g. Peters et al. 1989;
Nepstad and Schwartzman 1992). Yet detractors have shown that resource degradation
and market inequalities lessen the prospects of truly sustainable extraction (e.g. Arnold
and Perez 2001). Whilst it is unlikely that NTFP extraction will ever provide a panacea
for forest biodiversity conservation, small-scale extractive activities may still serve an
important role in subsidising the economies of forest dwellers (Belcher and
Schreckenberg 2007).
Tree oils and resins, in particular, represent an attractive extractive resource option,
since these products are non-perishable and have a relatively high value per unit weight.
However, detailed knowledge of the extraction of oils and resins, and the ecology of
source populations, is largely unavailable (Santos et al. 2001; Moegenburg and Levey
2002), in contrast to other NTFP such as Brazil nuts (e.g. Peres et al. 2003) and palm
hearts (e.g. Freckleton et al. 2003).
The translucent oleoresins extracted from trees of the genus Copaifera (Leguminosae:
Caesalpinioideae), known in Brazil as „óleo de copaíba‟, are harvested throughout the
lowland Amazon basin (Plowden 2004). Copaifera oleoresins are valued for their
medicinal uses: particularly for their antiseptic and anti-inflammatory properties (Veiga
Junior and Pinto 2002). These oleoresins are used by most rural households in
Amazonia, as well as being widely traded in towns and cities throughout Brazil. Wider
marketing by pharmaceutical companies has been developing both the domestic and
international markets for these therapeutic oils. The ~1.6 million km2 state of
Amazonas is the source of most of the Copaifera oleoresin produced in Brazil,
accounting for 91% of the total of 514,000 kg traded in 2008 (IBGE 2010). However,
the true socioeconomic value of this resource is severely underestimated by these
official figures as much Copaifera oleoresin is consumed in local households or
bartered across local communities rather than commercialised in large urban centres.
Copaifera oleoresin was historically often harvested in a destructive manner, with
extractors axing into the basal tree trunk to access the oleoresin, or simply draining the
oleoresin whilst felling the tree for timber (Plowden 2004). However, contemporary
Chapter 4: Copaifera oleoresin harvest
84
harvesting uses an alternative technique that is less invasive, using a borer to drill a hole
into the trunk from which the oleoresin is drained for 1-3 days before the hole is
plugged. If carefully harvested in this manner, a tree may survive many years to be
redrilled repeatedly for further extraction of accumulated oleoresin (Leite et al. 2001).
It has been suggested that the factors that influence oleoresin production by Copaifera
trees is a key priority within NTFP research (Santos et al. 2001). However, the alpha-
taxonomy of this genus was poorly studied until the recent publication of a key
describing the nine Copaifera species found across the Brazilian Amazon (Martins-da-
Silva et al. 2008). Previous studies investigating the factors affecting Copaifera
oleoresin production were consequently restricted to comparing different morphospecies
(Plowden 2003) or to examining a single, easily-identifiable species (Alencar 1982;
Medeiros and Vieira 2008).
This study examines the production of oleoresin by four species of Copaifera within a
single study area along the Juruá River of the western Brazilian Amazon. Our aim was
to determine the principal drivers of oleoresin production by comparing yields of
previously-unharvested individuals over a large spatial scale. The study included trees
in both permanently unflooded (terra firme) and seasonally-flooded (várzea) forests, the
main forest types in much of lowland Amazonia. Our results are then compared with
previous studies reporting yields of Copaifera.
4.3 Material and methods
4.3.1 Study site
The study was conducted within two contiguous protected areas bisected by the Juruá
River (a tributary of the Solimões River) in the state of Amazonas, Brazil. The
combined area of the federally-managed Médio Juruá Extractive Reserve (ResEx Médio
Juruá) and the state-managed Uacari Sustainable Development Reserve (RDS Uacari),
collectively termed “extractive reserves”, is 886,176 hectares (Fig. 4.1). Várzea forests
closer to the main river channel are seasonally flooded between January and June,
whilst terra firme forests on higher elevation are never flooded. These two reserves are
inhabited by some 4,000 legal residents, living in small communities of between 1 and
89 households. Livelihoods are variably centred on a mixed-strategy approach of small-
scale manioc (cassava) agriculture, fishing, and the extraction of
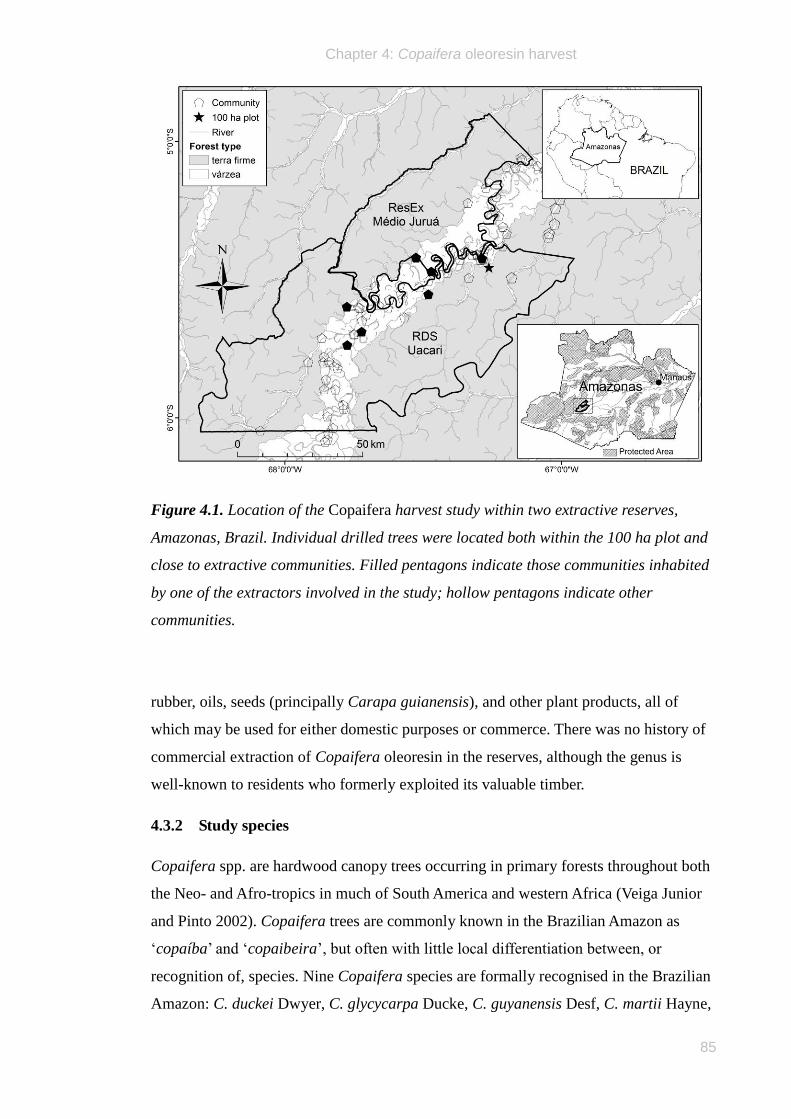
Chapter 4: Copaifera oleoresin harvest
85
Figure 4.1. Location of the Copaifera harvest study within two extractive reserves,
Amazonas, Brazil. Individual drilled trees were located both within the 100 ha plot and
close to extractive communities. Filled pentagons indicate those communities inhabited
by one of the extractors involved in the study; hollow pentagons indicate other
communities.
rubber, oils, seeds (principally Carapa guianensis), and other plant products, all of
which may be used for either domestic purposes or commerce. There was no history of
commercial extraction of Copaifera oleoresin in the reserves, although the genus is
well-known to residents who formerly exploited its valuable timber.
4.3.2 Study species
Copaifera spp. are hardwood canopy trees occurring in primary forests throughout both
the Neo- and Afro-tropics in much of South America and western Africa (Veiga Junior
and Pinto 2002). Copaifera trees are commonly known in the Brazilian Amazon as
„copaíba‟ and „copaibeira‟, but often with little local differentiation between, or
recognition of, species. Nine Copaifera species are formally recognised in the Brazilian
Amazon: C. duckei Dwyer, C. glycycarpa Ducke, C. guyanensis Desf, C. martii Hayne,
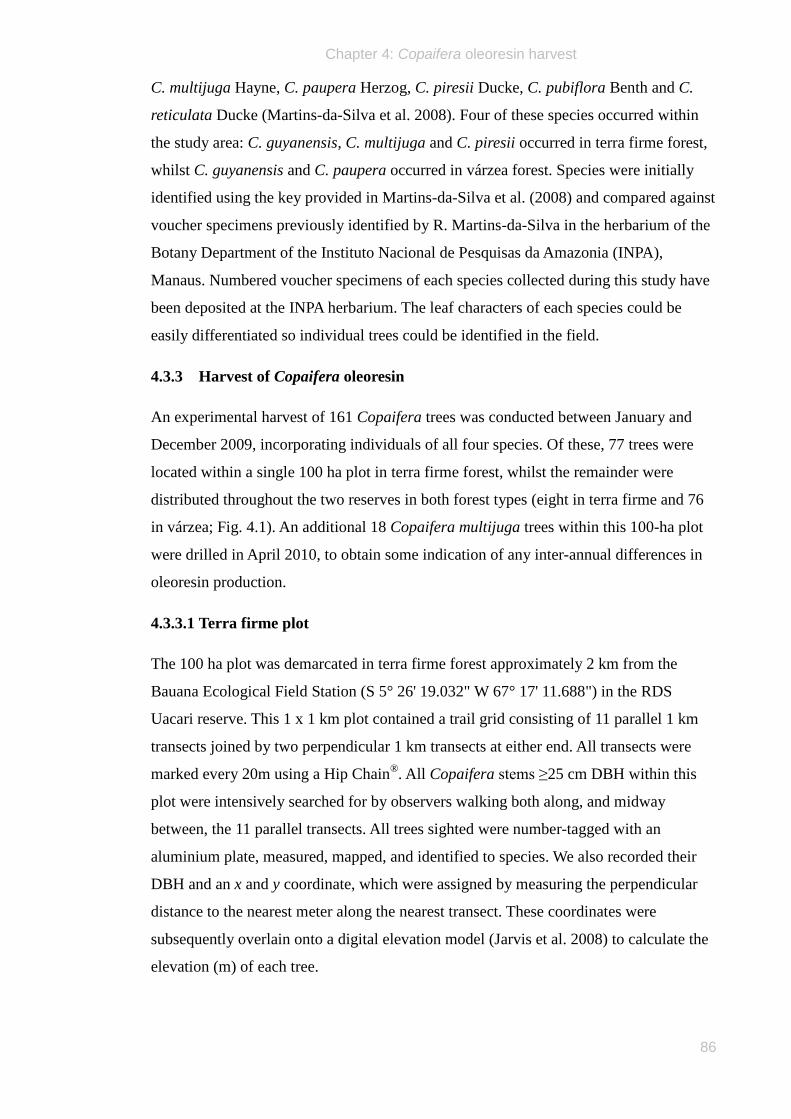
Chapter 4: Copaifera oleoresin harvest
86
C. multijuga Hayne, C. paupera Herzog, C. piresii Ducke, C. pubiflora Benth and C.
reticulata Ducke (Martins-da-Silva et al. 2008). Four of these species occurred within
the study area: C. guyanensis, C. multijuga and C. piresii occurred in terra firme forest,
whilst C. guyanensis and C. paupera occurred in várzea forest. Species were initially
identified using the key provided in Martins-da-Silva et al. (2008) and compared against
voucher specimens previously identified by R. Martins-da-Silva in the herbarium of the
Botany Department of the Instituto Nacional de Pesquisas da Amazonia (INPA),
Manaus. Numbered voucher specimens of each species collected during this study have
been deposited at the INPA herbarium. The leaf characters of each species could be
easily differentiated so individual trees could be identified in the field.
4.3.3 Harvest of Copaifera oleoresin
An experimental harvest of 161 Copaifera trees was conducted between January and
December 2009, incorporating individuals of all four species. Of these, 77 trees were
located within a single 100 ha plot in terra firme forest, whilst the remainder were
distributed throughout the two reserves in both forest types (eight in terra firme and 76
in várzea; Fig. 4.1). An additional 18 Copaifera multijuga trees within this 100-ha plot
were drilled in April 2010, to obtain some indication of any inter-annual differences in
oleoresin production.
4.3.3.1 Terra firme plot
The 100 ha plot was demarcated in terra firme forest approximately 2 km from the
Bauana Ecological Field Station (S 5° 26' 19.032" W 67° 17' 11.688") in the RDS
Uacari reserve. This 1 x 1 km plot contained a trail grid consisting of 11 parallel 1 km
transects joined by two perpendicular 1 km transects at either end. All transects were
marked every 20m using a Hip Chain®. All Copaifera stems ≥25 cm DBH within this
plot were intensively searched for by observers walking both along, and midway
between, the 11 parallel transects. All trees sighted were number-tagged with an
aluminium plate, measured, mapped, and identified to species. We also recorded their
DBH and an x and y coordinate, which were assigned by measuring the perpendicular
distance to the nearest meter along the nearest transect. These coordinates were
subsequently overlain onto a digital elevation model (Jarvis et al. 2008) to calculate the
elevation (m) of each tree.
Chapter 4: Copaifera oleoresin harvest
87
Copaifera trees in this plot were drilled in April 2009. Each tree was revisited
approximately 24 h later. If oleoresin had been collected, it was removed and measured
using a graduated cylinder. Return visits continued every 24 h for up to 72 h.
Monitoring of oleoresin yields continued for a further 24 h only if progressively more
oleoresin had accumulated during each of the previous three days. If there had been no
oleoresin production since the previous visit (or since being drilled), the hole was
tightly sealed using a cylindrical hardwood plug and the monitoring process terminated.
4.3.3.2 Wider reserve landscape
Reserve residents who had been previously equipped and trained to extract Copaifera
oleoresin were asked to record the volumetric amount of oleoresin extracted from each
tree that they drilled during 2009. A total of 100 trees were harvested in this manner by
extractors from seven different communities. Extractors used the same methodology as
in the 100 ha terra firme plot, except that they usually returned only once to the tree,
three days after drilling. The extractor marked each harvested tree with a numbered tag,
and recorded the dates of drilling and oleoresin collection. Oleoresin yields were
measured by the extractors, using calibrated graduated cups. All trees were subsequently
revisited by a member of the research team to record the height and position of the
drilled hole, measure the tree DBH, identify its species, record the forest type and
georeference its location and elevation with a GPS receiver. The research team had
worked closely with all of these extractors for a significant period of time prior to this
study, as part of a long-term project in the reserves. Absolute proof of oleoresin
collection was established by proxy of oleoresin samples which were retrieved by PN
for analysis in a separate study.
4.3.3.3 Repeated harvests
To examine the rate of oleoresin renewal by Copaifera trees and thus gain an indication
of the sustainability of resource extraction, 24 of the C. multijuga harvested in the 100
ha plot that yielded oleoresin in 2009 were redrilled in April 2010. The same
methodology was used as during the initial harvest, but in each case a new hole was
drilled into the trunk, usually ~20 cm above or below the original hole (in accordance
with extractors‟ training). In addition, 17 number-tagged C. multijuga that had yielded at
least some oleoresin when first drilled by a local extractor in 2007 (three years
previously) were relocated and redrilled. Since volumetric yields in 2007 were
estimated by extractors rather than actually measured, we used these estimates for the
Chapter 4: Copaifera oleoresin harvest
88
analyses of relative yields between harvests, but we considered only those trees
originally harvested in 2009 for analyses of absolute differences.
4.3.3.4 Harvest methodology
Only Copaifera trees with a diameter at breast height (DBH) equal to or greater than 25
cm were drilled. This DBH was used as a minimum cut-off since previous studies have
indicated that trees below this size are unlikely to yield oleoresin (e.g. Plowden 2003).
Drilling was undertaken by a total of ten local extractors who had been previously
trained in the methodology of harvesting Copaifera trees using a borer. Trees were
randomly selected from all of those encountered, at least within the 100-ha plot. In the
wider reserve landscape, extractors may have avoided obviously hollow trees, but
explained that they were otherwise unable to pre-determine yield likelihood or relative
volume. Only one extractor expressed prior knowledge of species‟ relative productivity.
None of the trees drilled showed scars or any other signs of having been previously
harvested, and could therefore be defined as „virgin‟. Three quarters of trees (75%) were
confirmed as being reproductively mature when drilled, on the basis of flowers,
fruits/seeds or seedlings directly associated with that tree.
Each tree was drilled in an identical manner, closely simulating practices employed by
local extractors in order to enhance comparability both with other studies and actual
harvests. The general protocol is described by Leite et al. (2001), whilst specific details
were determined by the methodology in which local extractors had been trained, in May
2008, by a visiting forest technician working on behalf of the Instituto de
Desenvolvimento Agropecuário e Florestal Sustentável do Estado do Amazonas
(IDAM). Each tree was initially drilled at a height of approximately 1 m (mean ± SD =
96.9 ± 20.2 cm) height above ground, using a 1.9 cm diameter borer. A single hole was
drilled in the first instance, either beneath the main bough of the tree, or on the
underside of any tree that was leaning. If there was no indication that the tree contained
oleoresin, no additional holes were drilled. If no oleoresin was encountered but „oily‟
debris was extracted on the borer, a second and occasionally third hole was drilled. Of
all the trees harvested, 140 were drilled with a single hole, 33 with two holes and only
six with three holes. Regardless of whether the tree showed immediate signs of
producing oleoresin or not, at least one hole was tightly fitted with a rigid PVC pipe of
26 cm in length, leading into flexible plastic tubing (1.2 m length, 2 cm diameter) which
in turn fed into a 2-litre plastic bottle on the ground. In accordance with the extractors‟
Chapter 4: Copaifera oleoresin harvest
89
training, all holes were drilled to a minimum of half of the tree DBH, unless either
oleoresin or a hollow was encountered at more superficial depths.
4.3.4 Data analysis
Data were analysed with respect to two response variables: whether or not an individual
tree yielded any detectable amount of oleoresin (yield likelihood) and, for those trees
that yielded at least 1 ml of oleoresin, the volume of oleoresin produced (yield volume).
To better understand the predictors of this first variable, we ran binomial tests (chi-
squared) and a logistic regression model entering species, DBH, forest type and terrain
elevation as explanatory variables. Parametric tests (ANOVA, multiple regression)
were used to identify significant predictors of the second response variable. Oleoresin
yields of redrilled trees were compared using a paired t-test. All analyses were
conducted in SPSS 16.0.
4.4 Results
A total of 179 previously unharvested Copaifera trees were drilled in 2009 and 2010.
This included individuals of all four species occurring in the study region (80 C.
guyanensis, 60 C. multijuga, 21 C. piresii and 18 C. paupera), with 103 trees in terra
firme forest and 76 in várzea forest. Next, we examine the key morphological and
environmental determinants of whether or not Copaifera trees produced any oleoresin.
4.4.1 Oleoresin production by Copaifera trees
4.4.1.1 Morphological factors
A total of 14 of the 179 trees drilled were hollow, effectively ruling out the possibility of
oleoresin yields (although five of these trees did yield a negligible volume). Hollowness
was not equally spread amongst species, with six C. multijuga (10%), four C.
guyanensis (5%), and four C. piresii (19%) found to be hollow. No hollow C. paupera
were encountered. Of the remaining 165 non-hollow drilled trees, only 71 (43.0%)
yielded any oleoresin (≥1 ml). Hollow trees were then excluded from further analyses.
The remaining trees either did not contain oleoresin or, possibly, the drilling method
failed to drain the oleoresin that they did contain.
There was a significant interspecific difference in the frequency with which any
oleoresin was extracted (2
= 24.88, N = 165, df = 3, p < 0.001). C. multijuga trees
yielded oleoresin significantly more frequently (70.4% of all non-hollow harvested
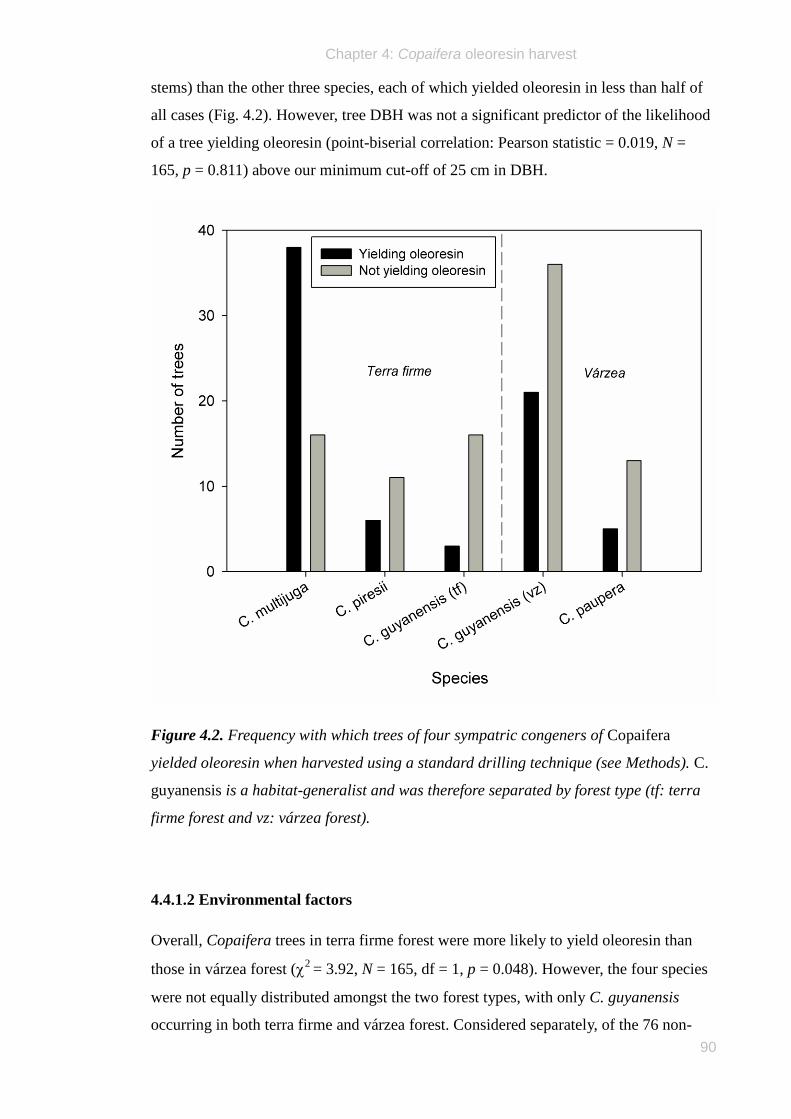
Chapter 4: Copaifera oleoresin harvest
90
stems) than the other three species, each of which yielded oleoresin in less than half of
all cases (Fig. 4.2). However, tree DBH was not a significant predictor of the likelihood
of a tree yielding oleoresin (point-biserial correlation: Pearson statistic = 0.019, N =
165, p = 0.811) above our minimum cut-off of 25 cm in DBH.
Figure 4.2. Frequency with which trees of four sympatric congeners of Copaifera
yielded oleoresin when harvested using a standard drilling technique (see Methods). C.
guyanensis is a habitat-generalist and was therefore separated by forest type (tf: terra
firme forest and vz: várzea forest).
4.4.1.2 Environmental factors
Overall, Copaifera trees in terra firme forest were more likely to yield oleoresin than
those in várzea forest (2
= 3.92, N = 165, df = 1, p = 0.048). However, the four species
were not equally distributed amongst the two forest types, with only C. guyanensis
occurring in both terra firme and várzea forest. Considered separately, of the 76 non-
Chapter 4: Copaifera oleoresin harvest
91
hollow C. guyanensis drilled, a greater proportion of trees yielded oleoresin in the
várzea forest (21/57, 36.8%) than in the terra firme forest (3/19, 15.8%), although this
difference was not statistically significant (2
Yates corr. = 2.030, N = 76, df = 1, p = 0.154).
Species was the only variable retained by the logistic regression model, with C.
guyanensis, C. paupera and C. piresii significantly less likely to yield any oleoresin
than C. multijuga, the baseline category (R2 (Nagelkerke) = 0.28,
2 (6) = 37.94, p < 0.001).
4.4.2 Volumetric yields
The morphological and environmental predictors of yield volume were assessed using
correlation and regression analyses for those trees yielding at least 1 ml of oleoresin.
False negatives may be prevalent in oleoresin harvest studies (Alechandre et al. 2005),
in that it can only be concluded that oleoresin was not found, rather than that the tree
did not actually contain oleoresin deposits. Our knowledge of the internal anatomy of
Copaifera trunks is extremely limited (but see Langenheim 1973 and Plowden 2003),
and so it is difficult to assert that these trees did not contain oleoresin stored in pockets
or ducts that were not accessed by the drilling process. To avoid including false
negatives, the remainder of the analysis considers only those trees that did yield ≥1 ml
of oleoresin.
4.4.2.1 Morphological factors
The mean (± SD) oleoresin volume yielded from the 61 trees for which at least a 1 ml
yield was recorded was 323.9 ± 618.4 ml (range = 1 - 4,246 ml, N = 61). However, of
those trees that yielded oleoresin, there was considerable variation in yield volumes
both within and between species (Table 4.1). The mean ln-transformed volume of
oleoresin yielded by the highest-yielding species (C. multijuga) was significantly
greater than that of the lowest-yielding species, C. piresii (one-way ANOVA: F = 3.528,
p = 0.020; Gabriel‟s posthoc: p = 0.038; Fig. 4.3). There were no significant differences
in yield volumes between the other species.
Larger trees yielded more oleoresin than smaller trees for both C. multijuga (r = 0.506,
N = 29, p one-tailed = 0.003; Fig. 4.4) and, within várzea forest, for C. guyanensis (r =
0.690, N = 17, p one-tailed = 0.001; Fig. 4.4) when excluding trees that yielded a minimal
oleoresin volume (<10 ml). When all trees (hollow, non-yielding and yielding) were
considered together, there was a significant positive correlation between DBH and yield
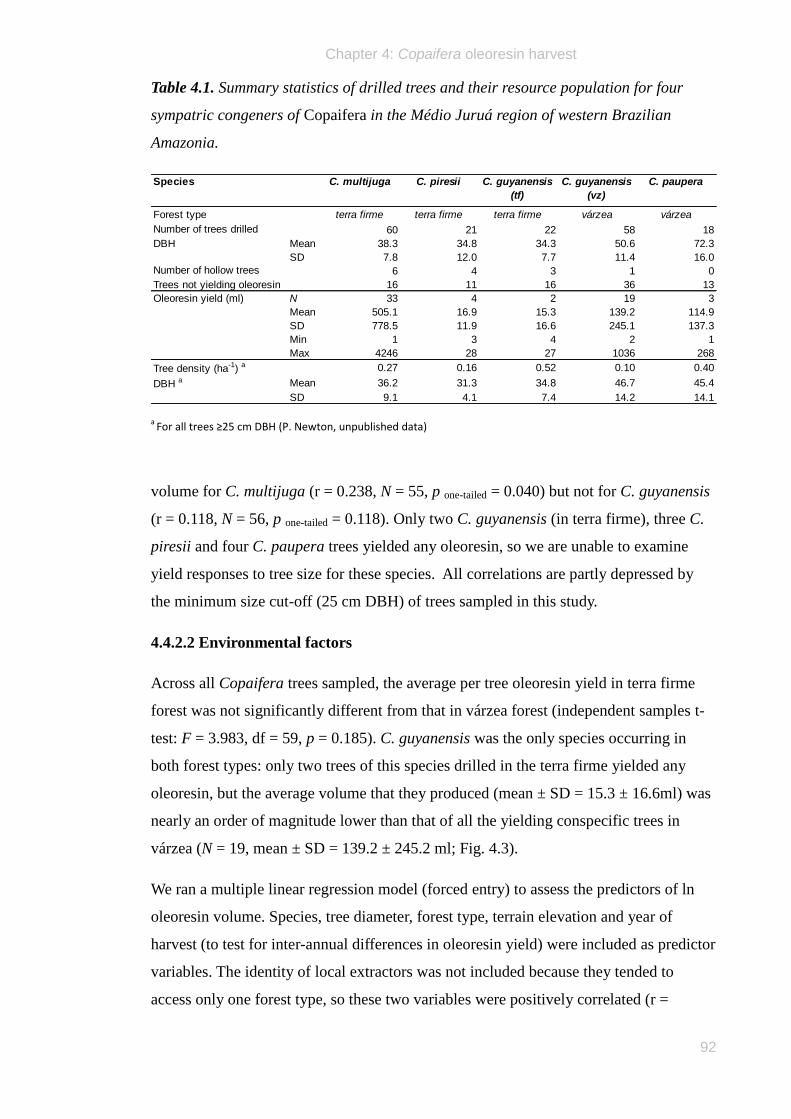
Chapter 4: Copaifera oleoresin harvest
92
Table 4.1. Summary statistics of drilled trees and their resource population for four
sympatric congeners of Copaifera in the Médio Juruá region of western Brazilian
Amazonia.
C. multijuga C. piresii C. guyanensis
(tf)
C. guyanensis
(vz)
C. paupera
terra firme terra firme terra firme várzea várzea
60 21 22 58 18
DBH Mean 38.3 34.8 34.3 50.6 72.3
SD 7.8 12.0 7.7 11.4 16.0
6 4 3 1 0
Trees not yielding oleoresin 16 11 16 36 13
N 33 4 2 19 3
Mean 505.1 16.9 15.3 139.2 114.9
SD 778.5 11.9 16.6 245.1 137.3
Min 1 3 4 2 1
Max 4246 28 27 1036 268
0.27 0.16 0.52 0.10 0.40
DBH a Mean 36.2 31.3 34.8 46.7 45.4
SD 9.1 4.1 7.4 14.2 14.1
Tree density (ha-1) a
Species
Oleoresin yield (ml)
Forest type
Number of trees drilled
Number of hollow trees
a For all trees ≥25 cm DBH (P. Newton, unpublished data)
volume for C. multijuga (r = 0.238, N = 55, p one-tailed = 0.040) but not for C. guyanensis
(r = 0.118, N = 56, p one-tailed = 0.118). Only two C. guyanensis (in terra firme), three C.
piresii and four C. paupera trees yielded any oleoresin, so we are unable to examine
yield responses to tree size for these species. All correlations are partly depressed by
the minimum size cut-off (25 cm DBH) of trees sampled in this study.
4.4.2.2 Environmental factors
Across all Copaifera trees sampled, the average per tree oleoresin yield in terra firme
forest was not significantly different from that in várzea forest (independent samples t-
test: F = 3.983, df = 59, p = 0.185). C. guyanensis was the only species occurring in
both forest types: only two trees of this species drilled in the terra firme yielded any
oleoresin, but the average volume that they produced (mean ± SD = 15.3 ± 16.6ml) was
nearly an order of magnitude lower than that of all the yielding conspecific trees in
várzea (N = 19, mean ± SD = 139.2 ± 245.2 ml; Fig. 4.3).
We ran a multiple linear regression model (forced entry) to assess the predictors of ln
oleoresin volume. Species, tree diameter, forest type, terrain elevation and year of
harvest (to test for inter-annual differences in oleoresin yield) were included as predictor
variables. The identity of local extractors was not included because they tended to
access only one forest type, so these two variables were positively correlated (r =
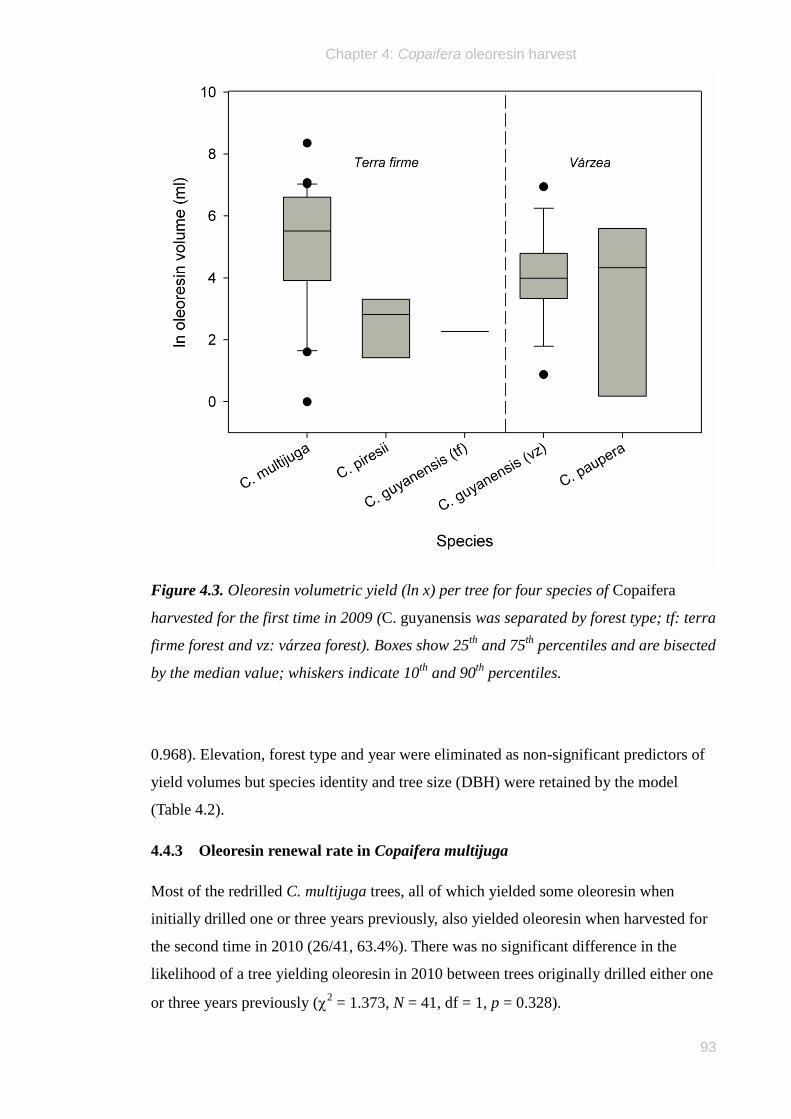
Chapter 4: Copaifera oleoresin harvest
93
Figure 4.3. Oleoresin volumetric yield (ln x) per tree for four species of Copaifera
harvested for the first time in 2009 (C. guyanensis was separated by forest type; tf: terra
firme forest and vz: várzea forest). Boxes show 25th
and 75th
percentiles and are bisected
by the median value; whiskers indicate 10th
and 90th
percentiles.
0.968). Elevation, forest type and year were eliminated as non-significant predictors of
yield volumes but species identity and tree size (DBH) were retained by the model
(Table 4.2).
4.4.3 Oleoresin renewal rate in Copaifera multijuga
Most of the redrilled C. multijuga trees, all of which yielded some oleoresin when
initially drilled one or three years previously, also yielded oleoresin when harvested for
the second time in 2010 (26/41, 63.4%). There was no significant difference in the
likelihood of a tree yielding oleoresin in 2010 between trees originally drilled either one
or three years previously (2 = 1.373, N = 41, df = 1, p = 0.328).
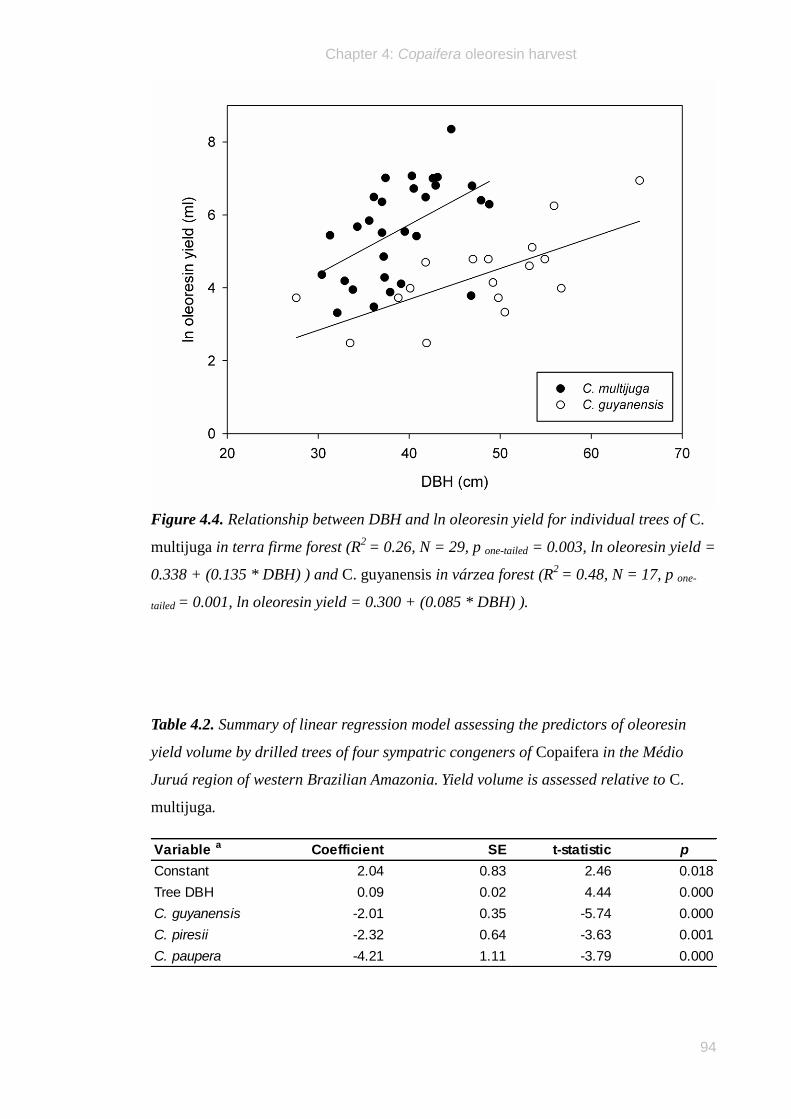
Chapter 4: Copaifera oleoresin harvest
94
Figure 4.4. Relationship between DBH and ln oleoresin yield for individual trees of C.
multijuga in terra firme forest (R2
= 0.26, N = 29, p one-tailed = 0.003, ln oleoresin yield =
0.338 + (0.135 * DBH) ) and C. guyanensis in várzea forest (R2
= 0.48, N = 17, p one-
tailed = 0.001, ln oleoresin yield = 0.300 + (0.085 * DBH) ).
Table 4.2. Summary of linear regression model assessing the predictors of oleoresin
yield volume by drilled trees of four sympatric congeners of Copaifera in the Médio
Juruá region of western Brazilian Amazonia. Yield volume is assessed relative to C.
multijuga.
Variable a Coefficient SE t-statistic p
Constant 2.04 0.83 2.46 0.018
Tree DBH 0.09 0.02 4.44 0.000
C. guyanensis -2.01 0.35 -5.74 0.000
C. piresii -2.32 0.64 -3.63 0.001
C. paupera -4.21 1.11 -3.79 0.000
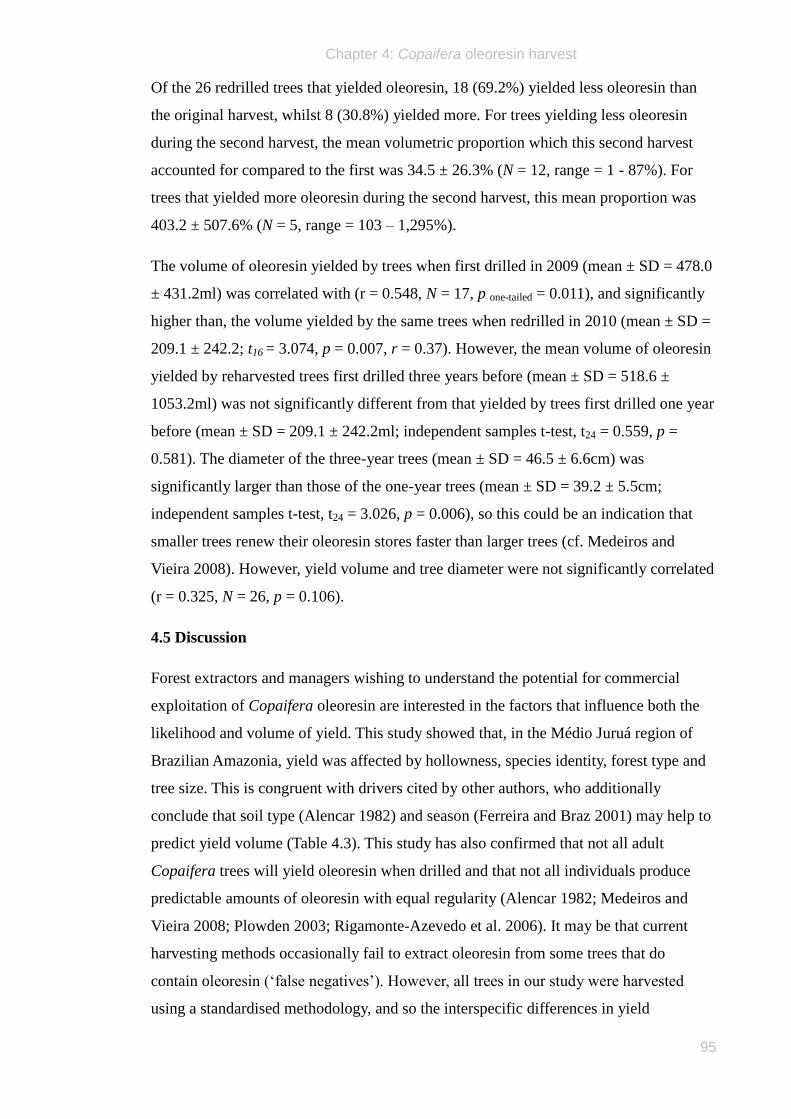
Chapter 4: Copaifera oleoresin harvest
95
Of the 26 redrilled trees that yielded oleoresin, 18 (69.2%) yielded less oleoresin than
the original harvest, whilst 8 (30.8%) yielded more. For trees yielding less oleoresin
during the second harvest, the mean volumetric proportion which this second harvest
accounted for compared to the first was 34.5 ± 26.3% (N = 12, range = 1 - 87%). For
trees that yielded more oleoresin during the second harvest, this mean proportion was
403.2 ± 507.6% (N = 5, range = 103 – 1,295%).
The volume of oleoresin yielded by trees when first drilled in 2009 (mean ± SD = 478.0
± 431.2ml) was correlated with (r = 0.548, N = 17, p one-tailed = 0.011), and significantly
higher than, the volume yielded by the same trees when redrilled in 2010 (mean ± SD =
209.1 ± 242.2; t16 = 3.074, p = 0.007, r = 0.37). However, the mean volume of oleoresin
yielded by reharvested trees first drilled three years before (mean ± SD = 518.6 ±
1053.2ml) was not significantly different from that yielded by trees first drilled one year
before (mean ± SD = 209.1 ± 242.2ml; independent samples t-test, t24 = 0.559, p =
0.581). The diameter of the three-year trees (mean ± SD = 46.5 ± 6.6cm) was
significantly larger than those of the one-year trees (mean ± SD = 39.2 ± 5.5cm;
independent samples t-test, t24 = 3.026, p = 0.006), so this could be an indication that
smaller trees renew their oleoresin stores faster than larger trees (cf. Medeiros and
Vieira 2008). However, yield volume and tree diameter were not significantly correlated
(r = 0.325, N = 26, p = 0.106).
4.5 Discussion
Forest extractors and managers wishing to understand the potential for commercial
exploitation of Copaifera oleoresin are interested in the factors that influence both the
likelihood and volume of yield. This study showed that, in the Médio Juruá region of
Brazilian Amazonia, yield was affected by hollowness, species identity, forest type and
tree size. This is congruent with drivers cited by other authors, who additionally
conclude that soil type (Alencar 1982) and season (Ferreira and Braz 2001) may help to
predict yield volume (Table 4.3). This study has also confirmed that not all adult
Copaifera trees will yield oleoresin when drilled and that not all individuals produce
predictable amounts of oleoresin with equal regularity (Alencar 1982; Medeiros and
Vieira 2008; Plowden 2003; Rigamonte-Azevedo et al. 2006). It may be that current
harvesting methods occasionally fail to extract oleoresin from some trees that do
contain oleoresin („false negatives‟). However, all trees in our study were harvested
using a standardised methodology, and so the interspecific differences in yield
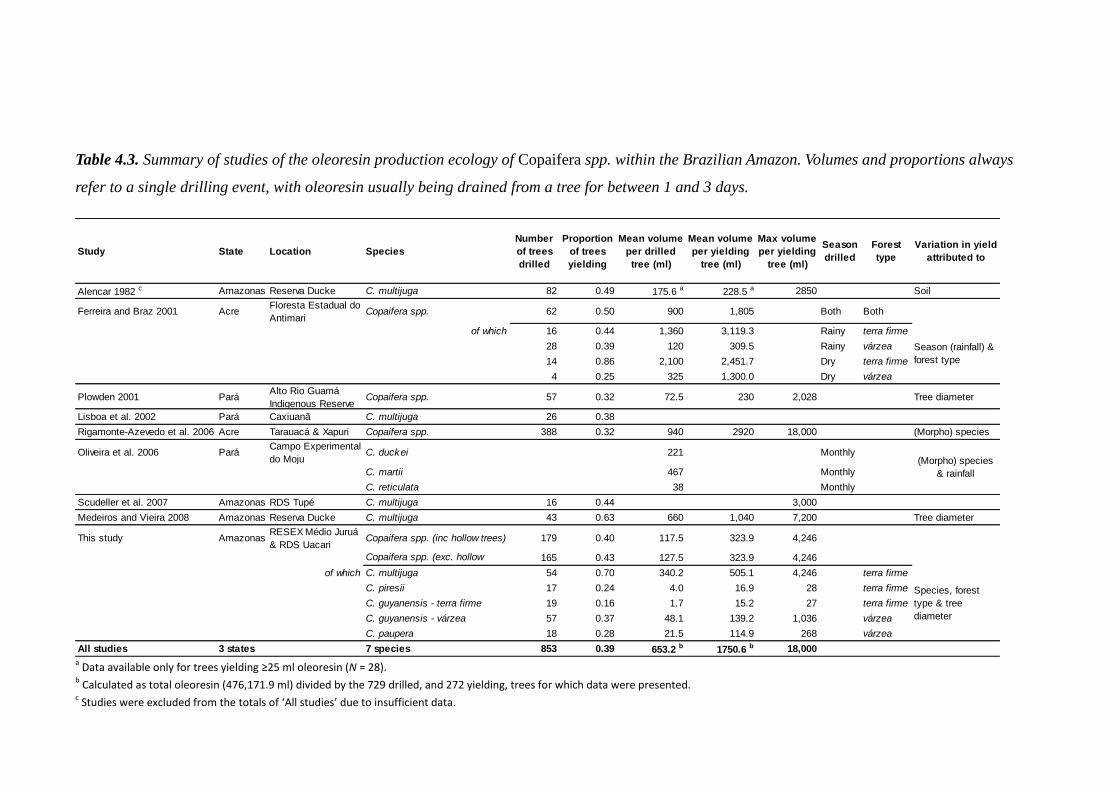
Table 4.3. Summary of studies of the oleoresin production ecology of Copaifera spp. within the Brazilian Amazon. Volumes and proportions always
refer to a single drilling event, with oleoresin usually being drained from a tree for between 1 and 3 days.
Study State Location Species
Number
of trees
drilled
Proportion
of trees
yielding
Mean volume
per drilled
tree (ml)
Mean volume
per yielding
tree (ml)
Max volume
per yielding
tree (ml)
Season
drilled
Forest
type
Variation in yield
attributed to
Alencar 1982 c Amazonas Reserva Ducke C. multijuga 82 0.49 175.6 a 228.5 a 2850 Soil
Ferreira and Braz 2001 AcreFloresta Estadual do
AntimariCopaifera spp. 62 0.50 900 1,805 Both Both
of which 16 0.44 1,360 3,119.3 Rainy terra firme
28 0.39 120 309.5 Rainy várzea
14 0.86 2,100 2,451.7 Dry terra firme
4 0.25 325 1,300.0 Dry várzea
Plowden 2001 ParáAlto Rio Guamá
Indigenous ReserveCopaifera spp. 57 0.32 72.5 230 2,028 Tree diameter
Lisboa et al. 2002 Pará Caxiuanã C. multijuga 26 0.38
Rigamonte-Azevedo et al. 2006 Acre Tarauacá & Xapuri Copaifera spp. 388 0.32 940 2920 18,000 (Morpho) species
Oliveira et al. 2006 ParáCampo Experimental
do Moju C. duckei 221 Monthly
C. martii 467 Monthly
C. reticulata 38 Monthly
Scudeller et al. 2007 Amazonas RDS Tupé C. multijuga 16 0.44 3,000
Medeiros and Vieira 2008 Amazonas Reserva Ducke C. multijuga 43 0.63 660 1,040 7,200 Tree diameter
This study AmazonasRESEX Médio Juruá
& RDS UacariCopaifera spp. (inc hollow trees) 179 0.40 117.5 323.9 4,246
Copaifera spp. (exc. hollow
trees)
165 0.43 127.5 323.9 4,246
of which C. multijuga 54 0.70 340.2 505.1 4,246 terra firme
C. piresii 17 0.24 4.0 16.9 28 terra firme
C. guyanensis - terra firme 19 0.16 1.7 15.2 27 terra firme
C. guyanensis - várzea 57 0.37 48.1 139.2 1,036 várzea
C. paupera 18 0.28 21.5 114.9 268 várzea
All studies 3 states 7 species 853 0.39 653.2 b 1750.6 b 18,000
Season (rainfall) &
forest type
Species, forest
type & tree
diameter
(Morpho) species
& rainfall
a Data available only for trees yielding ≥25 ml oleoresin (N = 28).
b Calculated as total oleoresin (476,171.9 ml) divided by the 729 drilled, and 272 yielding, trees for which data were presented.
c Studies were excluded from the totals of ‘All studies’ due to insufficient data.
Chapter 4: Copaifera oleoresin harvest
97
likelihood must represent a true absence of oleoresin in at least a proportion of these
trees. The proportion of non-yielding trees ≥25 cm DBH in this study (0.40) is
extremely close to the average of all trees across all previous studies (0.39; Table 4.3).
A minimum size threshold was used by this study and others to select individual trees
for drilling, restricting the proportion of the population available for harvest. Of these, a
total of 7.8% of trees that we drilled were hollow. Interspecific differences further
affected both the yield likelihood and volume. C. multijuga was the only species to
regularly produce oleoresin (70% of drilled trees), though C. paupera (28%) and C.
guyanensis (37%) both occasionally produced oleoresin in várzea forest. C. guyanensis
rarely produced oleoresin in terra firme (16% of drilled trees), indicating that the
production physiology of a single population may be affected by environmental
variables such as forest type and hydrology, which are intrinsically linked to soil
fertility.
Species identity was also important in determining the yield volume of those trees that
did yield oleoresin, with C. multijuga producing a higher mean yield (505 ml) than any
other species. Trees of larger diameter yielded more oleoresin than smaller ones: for C.
multijuga yield increased 3.9 fold for each 10 cm increase in DBH, while for C.
guyanensis yield increased 2.3 fold. Finally, yields were reduced by an average of 65%
between initial and subsequent harvests, but the length of inter-harvest rest period did
not seem to affect the yield volume.
4.5.1 Time-period of harvest
In this study, for every tree that was drilled, we left a plastic tube in place for a
minimum of 24 h after drilling. Some studies (e.g. Medeiros and Vieira 2008; Plowden
2003) closed the bored hole immediately if the tree did not exude oleoresin. However,
of the 33 C. multijuga trees for which we have data, 11 showed no indication of
containing oleoresin at the point of being drilled, but had yielded ≥1 ml by the time we
returned 24 h later. In other words, they began to exude oleoresin only after we had left
the tree. The mean volume of oleoresin yielded by such trees (122.9 ml) was not as high
as that for trees that began to exude oleoresin immediately (696.3 ml). However, had we
followed an alternative protocol (e.g. Medeiros and Vieira 2008), we would have
underestimated production and recorded 11% of our oleoresin-yielding trees as
containing no oleoresin.
Chapter 4: Copaifera oleoresin harvest
98
In their study, Rigamonte-Azevedo et al. (2006) noted that the volume of oleoresin
collected from a tree did not significantly increase after the initial 24 h and concluded
that this was therefore a sufficiently long period over which to monitor oleoresin
production by a drilled tree. Whilst we found a weak significant difference between the
total volume collected and that exuded in the first 24 h (t = –2.037 , df = 28, p = 0.051),
in 13 cases the tree exuded less than 80% of the total oleoresin volume collected in the
first 24 h period following drilling. Overall, only 54.8% of all oleoresin collected was
exuded in the first 24 h. Scudeller et al. (2007) similarly noted one tree that yielded only
65% of its oleoresin within a day of being drilled, the rest being exuded only after 5
days.
Since most published and reserve management guidelines advocate a rest period of up
to 3 years between harvest events, the volume of oleoresin extracted from an individual
tree on a single extractive event therefore represents that tree‟s entire annual or triennial
productivity, which extractors wish to maximise. Additionally, extractors with whom we
worked were trained to leave the oleoresin to drain for a minimum of 3 days. Therefore,
in the interests of realistically simulating an actual harvest and producing results that are
more comparable both with other studies and with actual harvests, it may be prudent to
retain the tubing in place for longer than 24 h if a tree is still producing oleoresin.
4.5.2 Hollowness and oleoresin cavities
It is sometimes, but not always, possible to predict whether a tree is hollow before
beginning the extraction process. Within our 100 ha plot, all trees selected for drilling
were harvested, regardless of whether or not they were suspected of being hollow.
However, when extractors operated unsupervised throughout the two reserves they
likely avoided sampling trees that were obviously hollow, perhaps explaining why no
hollow C. paupera trees were encountered, since these were all harvested outside of the
100 ha plot. Our range of up to 19% of hollow trees of any given species therefore
represents a conservative estimate of the proportion of individuals that is actually
hollow.
4.5.3 Interspecific differences
Within the Brazilian Amazon, C. multijuga is one of the most geographically
widespread species in the genus (Martins-da-Silva et al. 2008). Yield likelihood of
harvested trees of this species (70%) was comparable with that in previously studied
Chapter 4: Copaifera oleoresin harvest
99
conspecific populations elsewhere (49%: Alencar 1982; 63%: Medeiros and Vieira
2008; Table 4.3). In contrast with Plowden (2003), who found no significant differences
between (morpho) species, we found significant interspecific differences between the
yield likelihood and the yield volume (cf. Rigamonte-Azevedo et al. 2006). The yield
likelihood of C. multijuga was significantly higher than that of the other three
congeners, but the yield volume was not significantly higher than that of C. guyanensis
and C. paupera. In other words, it is more difficult for extractors to find productive trees
in várzea forest (cf. Ferreira and Braz 2001; Table 4.3), but those trees that yield
oleoresin produce comparable quantities. C. piresii and C. guyanensis in terra firme
forest exhibited both very low yield likelihoods and yield volumes, indicating that they
are less likely to become commercially viable species. Overall, per tree Copaifera
volumetric yield within our study site (mean = 117.5 ml) was lower than that across all
previous studies (653.2 ml), emphasising the existing variation between sites. Whilst the
number of published studies available for comparison is low, higher yields in the state
of Acre suggest that such variation may be regional, either as a consequence of species
composition or environmental differences (Table 4.3).
4.5.4 Tree size
Previous Copaifera studies have found that the smallest size-classes did not yield any
oleoresin (Plowden 2003). We did not find a statistically significant relationship
between DBH and yield likelihood, but this could be attributed to our sampling method.
We imposed a minimum DBH of 25 cm as a selection criterion for harvesting, with the
implication that smaller trees were not sampled.
We found a positive correlation between tree size and oleoresin production beyond our
minimum critical DBH. In contrast, both Medeiros and Vieira (2008) and Plowden
(2003) found that oleoresin production was highest amongst mid-sized trees. We did not
include non-yielding or hollow trees in our analysis, which may explain some of the
difference between studies. Additionally, tree size (most commonly measured as DBH)
is a continuous variable, yet these authors have searched for relationships between
oleoresin yield and categorical size classes. Since we found positive correlations
between tree DBH and oleoresin production we suggest that linear analyses may be a
more informative means of exploring yield data. This may be especially true given that
the population size structure varies across species (P. Newton unpublished data).

Chapter 4: Copaifera oleoresin harvest
100
There was a significant positive relationship between tree size and oleoresin yield
volume for both C. multijuga and C. guyanensis. Such relationships have been
previously identified for similarly-harvested tree species in extractive industries
elsewhere (e.g. sugar maple: Blum 1973). For Copaifera, this relationship is crucial to
determining appropriate minimum and optimal tree size-classes for extraction and in
planning long-term exploitation strategies. It is likely that species-specific rather than
genus-specific studies will help inform such management decisions.
4.5.5 Forest type
The clear distinction between terra firme and várzea forests affects many aspects of
Amazonian forest ecology (Haugaasen and Peres 2005, 2007, 2008). The superior yield
volume of C. multijuga supports the proposal of Ferreira and Braz (2001) that
Copaifera spp. in terra firme forest may be more productive than those in várzea forest.
However, we found that C. guyanensis yielded oleoresin more frequently in várzea
(36.8%) than terra firme (15.8%), suggesting that intraspecific variation in oleoresin
productivity in one forest type is not necessarily indicative of that in populations
straddling into adjacent forest types. Species accounts presented by Martins-da-Silva et
al. (2008) suggest that at least four Copaifera species occur in both terra firme and
várzea forests, so this distinction in productivity may be true of other species too.
Habitat differences have implications for resource management on a temporal as well as
a spatial scale. Our results indicate that várzea species (C. guyanensis and C. paupera)
can yield oleoresin volumes of up to 1036 ml and 268 ml, respectively, which may
render them target species for economically viable extraction. Given its persistent flood-
pulse, however, the várzea is sufficiently dry to enable Copaifera tree location and
drilling on foot for only approximately half of each year and this restricted access to the
resource may limit its potential to fit into the activity budgets of extractors. In our study
site, for example, activities such as rubber-tapping (of Hevea brasiliensis trees)
dominate in the low water-level season. Furthermore, the optimal seasonality and timing
of oleoresin harvesting within várzea forest remain unclear, given that the prolonged
inundation period likely affects the physiology and internal resource allocation of
Copaifera trees.
Chapter 4: Copaifera oleoresin harvest
101
4.5.6 Harvest sustainability
In line with previous studies (Alencar 1982; Plowden 2003; Medeiros and Vieira 2008),
the volume of oleoresin yielded was more than twice as high during the initial (mean =
478 ml) than in subsequent (mean = 209 ml) offtakes. However, we additionally found
that there were no significant differences between trees re-harvested after either three
years or one year, in terms of either the likelihood of oleoresin being yielded or the
volume of oleoresin that such trees produced. This suggests that the process of oleoresin
renewal by the tree begins within a year, or that oleoresin production is an annual
process. It also suggests that trees may never fully replenish the volume of oleoresin
that they originally contained, or at least come no closer to doing so after three years
than they do after only one year. Published guidelines (e.g. Leite et al. 2001; Machado
2008) suggest a minimum redrilling interval of three years following an initial harvest,
but this recommendation is not supported by our yield renewal data (though we are
unable to provide data on longer-term implications of redrilling trees more frequently).
That oleoresin yields from the second harvests are renewed deposits is a poorly
substantiated assumption, however, and our results may be confounded by the
impossibility of knowing whether the initial extraction event depleted all available
oleoresin. Eight trees actually yielded more oleoresin at the second harvest than the first
(cf. Alencar 1982), by between 103% and 1295%. In these cases at least, perhaps not all
oleoresin had been removed by the original drilling process, such that the oleoresin
subsequently removed one to three years later could have been accessed during the first
harvest. A third possibility is that the mechanics of the harvest extraction actually
stimulate oleoresin production by the tree.
The extent of this problem can be minimised by careful methodological design of
experimental harvests, which should mimic real-world methods used by local extractors
as closely as possible. To this effect, we sealed all drilled holes with a hardwood plug
between the initial and repeated harvests. This was justifiable since conversations with
several local extractors suggested that (1) they rarely have access to sufficient materials
to warrant leaving plastic tubing and stoppers in the forest, and (2) doing so would
undesirably facilitate detection, access to, and removal of any accumulated oleoresin by
other forest extractors using the same area. We therefore suggest that the alternative
technique of leaving plastic tubing in place between harvests (e.g. Medeiros and Vieira
2008) is less realistic in determining potential resource offtake. Furthermore, 88% of
Chapter 4: Copaifera oleoresin harvest
102
our yielding C. multijuga trees exuded oleoresin over a period considerably longer than
24 h. Medeiros and Vieira (2008) ceased collecting oleoresin within hours of drilling the
tree. Any oleoresin that subsequently collected in the plastic tubing that they left behind
was presumably recorded as having been „produced‟ after the initial drilling. In fact, the
6-month oleoresin volumes noted in their study may have included a significant
quantity of oleoresin that was exuded within days of the initial drilling, remaining in the
tubing until the tree was revisited 6 months later. We therefore emphasize the distinction
between accumulated storage at any given time and renewal of Copaifera oleoresins.
4.5.7 Copaifera research priorities
Explaining the determinants of yield likelihood and volume is critical to understanding
an individual tree‟s oleoresin productivity. To estimate the harvest viability of an entire
extractive system, however, a suite of additional factors need to be considered. These
include the heterogeneity in density and distribution between species and forest types
(Table 4.1), as well as resource accessibility, temporal and spatial patterns of extractor
activities and market variables. The study of Copaifera productivity as an economically-
viable NTFP therefore warrants further consideration within the context of an
integrative spatial analysis.
By drawing together and critically assessing the methodologies of several decades of
disparate research on the exploitation of Copaifera spp. (Table 4.3), we hope to increase
the likelihood of comparability between future studies. We suggest that future studies
should adopt methodologies that closely match real-world extractive practices, and
specifically ensure sufficient time for exhaustive collection of oleoresin deposits before
drilled holes are sealed. In terms of priorities, scant evidence exists in the literature of
the longer-term renewal of oleoresin stores by individual trees; this enquiry would
benefit from a means of ensuring exhaustive extraction during the initial harvest. It also
remains unclear whether the harvest of Copaifera oleoresin has any detectable impact
on the fecundity (e.g. seed crop size), seed/seedling viability or survival and growth rate
of drilled individuals; such questions require longer-term monitoring of harvested
populations (Ticktin 2004; Gaoue and Ticktin 2010).
4.5.8 Conclusions
We have shown that the production ecology of an NTFP resource population may be
affected by species identity, morphological (e.g. hollowness, tree size) and
Chapter 4: Copaifera oleoresin harvest
103
environmental (e.g. forest type) factors. A comprehensive understanding of the
relationship between these factors and resource offtake is clearly an important part of
designing sustainable extraction protocols for all key NTFP resources in tropical forest
regions. Such protocols are currently being developed within the context of many
sustainable development reserves and will need to be well-informed if these reserves are
to succeed in promoting both economically-viable and sustainable extractive industries
capable of both supplementing the incomes of their resident populations and retaining a
relatively intact forest cover in the long run.
4.6 References
Alechandre, A., Leite, A., Azevedo, K., Campos, C.A., Silva, E.F., Da Melo, T., Souza,
N.M.D., Rola, L., 2005. Manejo de produtos florestais não madeireiros por moradores
da Reserva Extrativista Chico Mendes. In: Oliveira, M.A. (Ed.). Pesquisa
sociobioparticipativa na Amazônia. Ocidental: aventuras e desventuras, pp. 15-76.
EDUFAC, Rio Branco.
Alencar, J.D.C., 1982. Estudos silviculturais de uma população natural de Copaifera
multijuga Hayne – Leguminosae, na Amazônia Central. 2 – Produção de óleo-resina.
Acta Amazonica 12, 75-90.
Allegretti, M.H., 1990. Extractive reserves: an alternative for reconciling development
and environmental conservation in Amazonia. In: Anderson, A.B. (Ed.). Alternatives to
deforestation: steps toward sustainable use of the Amazonian rain forest, pp. 252-264.
Columbia University Press, New York.
Arnold, J.E.M., Perez, M.R., 2001. Can non-timber forest products match tropical forest
conservation and development objectives? Ecological Economics 39, 437-447.
Belcher, B., Schreckenberg, K., 2007. Commercialisation of non-timber forest products:
a reality check. Development Policy Review 25, 355-377.
Blum, B.M., 1973. Relation of sap and sugar yields to physical characteristics of sugar
maple trees. Forest Science 19, 355-377.
Ferreira, L.A., Braz, E.M., 2001. Avaliação do potencial de extração e comercialização
do óleo-resina de copaíba (Copaifera spp.). The New York Botanical Garden/
Universidade Federal do Acre, Brazil. URL
www.nybg.org/bsci/acre/www1/evaluation.html.
Chapter 4: Copaifera oleoresin harvest
104
Freckleton, R.P., Matos, D.M.S., Bovi, M.L.A., Watkinson, A.R., 2003. Predicting the
impacts of harvesting using structured population models: the importance of density-
dependence and timing of harvest for a tropical palm tree. Journal of Applied Ecology
40, 846-858.
Gaoue, O.G., Ticktin, T., 2010. Effects of harvest of nontimber forest products and
ecological differences between sites on the demography of African mahogany.
Conservation Biology 24, 605-614.
Haugaasen, T., Peres, C.A., 2005. Mammal assemblage structure in Amazonian flooded
and unflooded forests. Journal of Tropical Ecology 21, 133-145.
Haugaasen, T., Peres, C.A., 2007. Vertebrate responses to fruit production in Amazonian
flooded and unflooded forests. Biodiversity and Conservation 16, 4165-4190.
Haugaasen, T., Peres, C.A., 2008. Population abundance and biomass of large-bodied
birds in Amazonian flooded and unflooded forests. Bird Conservation International 18,
87-101.
IBGE, 2010. Instituto Brasileiro de Geografia e Estatística. Sistema IBGE de
recuperação automatica (SIDRA). URL www.sidra.ibge.gov.br.
Jarvis A., Reuter, H.I., Nelson, A., Guevara, E. 2008. Hole-filled seamless SRTM data
V4, International Centre for Tropical Agriculture (CIAT). URL http://srtm.csi.cgiar.org.
Langenheim, J.H., 1973. Leguminous resin-producing trees in Africa and South
America. In: Meggers, B.J., Ayensu, E.S., Duckworth, W.D. (Eds.). Tropical forest
ecosystems in Africa and South America: a comparative review, pp. 89-104.
Smithsonian Institution Press, Washington, DC.
Leite, A., Alechandre, A., Rigamonte-Azevedo, C., Campos, C.A., Oliveira, A., 2001.
Recomendações para o manejo sustentável do óleo de copaíba. Universidade Federal do
Acre and Secretaria Executiva de Floresta e Extrativismo (SEFE), Rio Branco.
Lisboa, P.L.B., Gomes, I.A., Lisboa, R.G.L., Urbinati, C.V., 2002. O estilo amazônico
de sobreviver: manejo dos recursos naturais. In: Lisboa, P.L.B. (Ed.). Natureza, homem
e manejo de recursos naturais na região de Caxiuanã, Melgaço, Pará, pp. 41-170. Museu
Paraense Emilio Goeldi, Belém.
Chapter 4: Copaifera oleoresin harvest
105
Machado, F.S., 2008. Manejo de produtos florestais não madeireiros: um manual com
sugestões para o manejo participativo em comunidades da Amazônia. PESACRE and
CIFOR, Rio Branco.
Martins-da-Silva, R.C.V., Pereira, J. F. & Lima, H. C., 2008. O gênero Copaifera
(Leguminosae – Caesalpinioideae) na Amazônia Brasileira. Rodriguésia 59, 455-476.
Medeiros, R.D., Vieira, G., 2008. Sustainability of extraction and production of copaíba
(Copaifera multijuga Hayne) oleoresin in Manaus, AM, Brazil. Forest Ecology and
Management 256, 282-288.
Moegenburg, S.M., Levey, D.J., 2002. Prospects for conserving biodiversity in
Amazonian extractive reserves. Ecology Letters 5, 320-324.
Nepstad, D., Schwartzman, S., Bamberger, B., Santilli, M., Ray, D., Schlesinger, P.,
Lefebvre, P., Alencar, A., Prinz, E., Fiske, G., Rolla, A., 2006. Inhibition of Amazon
deforestation and fire by parks and indigenous lands. Conservation Biology 20, 65-73.
Nepstad, D.C., Schwartzman, S., 1992. Non-timber products from tropical forests:
evaluation of a conservation and development strategy. Advances in Economic Botany
9.
Oliveira, E.C.P., Lameira, O.A., Zoghbi, M.G.B., 2006. Identificaçao da epoca de coleta
do óleoresina de copaíba (Copaifera spp.) no municipio de Moju, PA. Revista Brasileira
de Plantas Medicinais 8, 14-23.
Peres, C.A., Baider, C., Zuidema, P.A., Wadt, L.H.O., Kainer, K.A., Gomes-Silva,
D.A.P., Salomao, R.P., Simoes, L.L., Franciosi, E.R.N., Valverde, F.C., Gribel, R.,
Shepard, G.H., Kanashiro, M., Coventry, P., Yu, D.W., Watkinson, A.R., Freckleton,
R.P., 2003. Demographic threats to the sustainability of Brazil nut exploitation. Science
302, 2112-2114.
Peres, C.A., Zimmerman, B., 2001. Perils in parks or parks in peril? Reconciling
conservation in Amazonian reserves with and without use. Conservation Biology 15,
793-797.
Peters, C.M., Gentry, A.H., Mendelsohn, R.O., 1989. Valuation of an Amazonian
rainforest. Nature 339, 655-656.
Chapter 4: Copaifera oleoresin harvest
106
Plowden, C., 2003. Production ecology of copaíba (Copaifera spp.) oleoresin in the
Eastern Brazilian Amazon. Economic Botany 57, 491-501.
Plowden, C., 2004. The ethnobotany of copaíba (Copaifera) oleoresin in the Amazon.
Economic Botany 58, 729-733.
Rigamonte-Azevedo, O.C., Wadt, P.G.S., Wadt, L.H.O., 2006. Potencial de produção de
óleo-resina de copaíba (Copaifera spp) de populações naturais do sudoeste da
Amazônia. Sociedade de Investigações Florestais 30, 583-591.
Santos, J.C., Leite, A.C.P., Wadt, L.H.O., Borges, K.H., Andrade, F.G., Menezes, R.S.,
Muniz, P.S.B., 2001. Demandas tecnológicas para o sistema produtivo de óleo de
copaíba (Copaifera spp.) no estado do Acre. Embrapa Acre, Rio Branco.
Scudeller, V.V., Rosa, A.L., Barbosa, K.S., 2007. Viabilidade econômica da extração do
óleo-resina de Copaifera multijuga Hayne na Amazônia central. Revista Brasileira de
Biociencias 5, 753-755.
Ticktin, T., 2004. The ecological implications of harvesting non-timber forest products.
Journal of Applied Ecology 41, 11-21.
Veiga Junior, V.F., Pinto, A.C., 2002. O gênero Copaifera L. Quimica Nova 25, 273-
286.
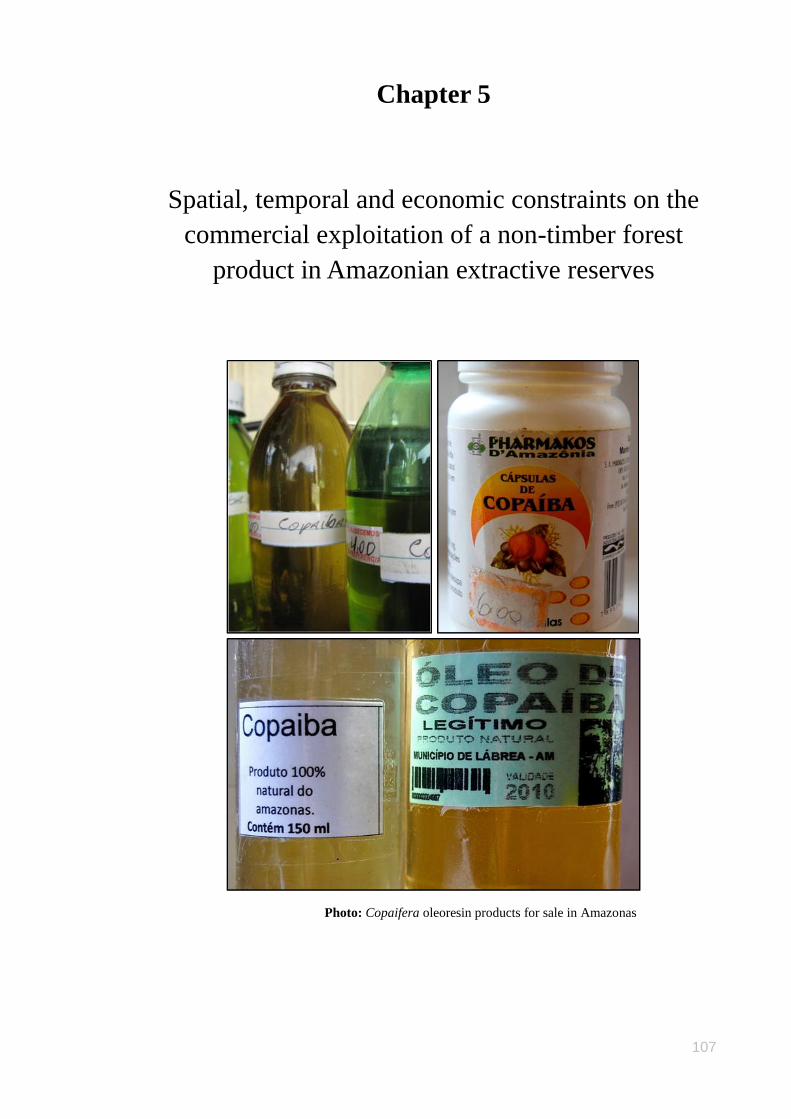
107
Chapter 5
Spatial, temporal and economic constraints on the
commercial exploitation of a non-timber forest
product in Amazonian extractive reserves
Photo: Copaifera oleoresin products for sale in Amazonas
Chapter 5: NTFP constraints
108
5.1 Abstract
Commercial extraction of non-timber forest products (NTFPs) contributes to the
livelihoods of millions of forest dwellers whilst purportedly having a more benign
impact on tropical forest ecosystems than alternative income-generating activities such
as agriculture. The increasing prevalence of government- and NGO-sponsored
programmes to encourage NTFP extractivism in the humid tropics has highlighted the
need for ecological and socioeconomic appraisal of the viability of extractive industries.
We adopted a holistic approach to examining NTFP resource potential and produced
robust landscape-scale estimates of the projected value of an economically important
Amazonian NTFP, the medicinal oleoresin of Copaifera trees, within two large
contiguous extractive reserves in Brazilian Amazonia. We integrated results derived
from spatial ecology and harvesting studies with socioeconomic and market data, and
mapped the distribution of communities within the reserves to create anisotropic
accessibility models which determined the spatial and temporal access to permanently
unflooded (terra firme) and seasonally-flooded (várzea) forest. The density of
productive tree species was higher in várzea forest but per tree productivity was greater
in terra firme forest, resulting in similar estimates of oleoresin yield per unit area (64 –
67 ml ha–1
) in both forest types. The estimated total volume of oleoresin accessible
within the two reserves was 38,635 litres for an initial harvest, with projected offtake for
a subsequent harvest falling to 8,274 litres. A greater area of várzea forest was
accessible within shorter travel times of ≤250 min; longer travel times allowed access to
increasingly greater volumes of oleoresin from terra firme forest. Socioeconomic data
demonstrated that a household that extracted just two litres of oleoresin per month could
generate 5% of its mean income; market data suggested that certification could increase
the value of the resource five-fold. We discuss the constraints to commercial viability of
NTFP extraction and conclude that whilst commercial harvests are unlikely to provide a
panacea for either tropical forest conservation or rural development, some resources can
make meaningful contributions to rural household economies.
5.2 Introduction
Non-timber forest products (NTFP) support the livelihoods of millions of rural people
and are harvested globally for both domestic consumption and commercial trade,
particularly throughout the tropics (Shackleton et al. 2011). Advocates of the NTFP
paradigm have highlighted the apparent convergence of social development and
Chapter 5: NTFP constraints
109
conservation objectives (e.g. Nepstad and Schwartzman 1992). This mutualism may be
facilitated by links between NTFP commercialisation and extractive reserves, payments
for environmental services (PES) programmes, or government-sponsored extractive
initiatives. Extractive reserves combine the goal of socioeconomic development with
that of biodiversity and environmental service conservation (Allegretti 1990), and many
reserves encourage the commercial extraction of NTFPs as a more ecologically-benign
income-generating alternative to swidden agriculture or cattle-ranching. Similar
objectives are embraced by PES programmes and other emerging Reducing Emissions
for Deforestation and Forest Degradation (REDD) schemes that prohibit forest
clearance (Wunder 2008). Such programmes often fund the development of commercial
extraction as a means of inducing preferable land-use behaviours. This has been met
with policy endorsement from the federal government which has recently announced
significant investments to support extractivism throughout rural Brazilian Amazonia
(Fiorese 2009). The commercial exploitation of NTFPs will therefore be an integral
component of the future development of rural economies across the region, irrespective
of whether or not these activities are ultimately ecologically desirable. Consequently,
there is a clear need for an assessment of the viability of NTFP extraction to guide this
process, particularly in areas with no history of commercial harvesting.
The NTFP paradigm is characterised by a discrepancy between the apparent abundance
of useful products contained in intact primary forest areas, and the difficulty of
developing a commercial trade in an NTFP resource that is economically and
ecologically sustainable (Belcher and Schreckenberg 2007). Pioneering valuations of
primary forests demonstrated the high density of plant resources with a utility value
(Myers 1988; Peters et al. 1989) but failed to account fully for the many ecological,
social, and economic factors which, in aggregate, determine the potential for
commercial NTFP harvesting. Ecological constraints include the spatial distribution
(Klimas et al. 2007), demographic impacts of harvesting (Freckleton et al. 2003), and
harvest yields (Medeiros and Vieira 2008) of the resource. Socioeconomic constraints to
commercial viability include the physical accessibility of the resource to extractors
(Peres and Lake 2003), the financial and opportunity costs of harvesting (Marshall et al.
2006), and the characteristics of local markets (Ruiz-Perez et al. 2004).
A comprehensive synthesis that draws together these elements of NTFP harvesting can
facilitate a quantitative assessment of the potential of a resource to generate revenue and
contribute to rural livelihoods. However, few studies have addressed the multiple
Chapter 5: NTFP constraints
110
constraints to a single NTFP case-study. Here, we adopt a holistic approach to estimate
the potential offtake of an Amazonian NTFP, focussing on the distinction between the
actual resource stock and that which is available to extractors.
The oleoresin harvested from trees of the genus Copaifera is an economically-important
NTFP occurring throughout the neotropics (Plowden 2004). Tree oils and resins
represent an attractive extractive resource option, since these products are non-
perishable and have a relatively high value per unit weight (Menezes et al. 2005).
Copaifera oleoresin was historically collected using destructive harvest methods by
either axing a wedge in the basal tree trunk, or simply draining the oleoresin when
felling the tree for timber (Plowden 2004). Contemporary extractors drill a hole into the
trunk from which oleoresin is drained; if the hole is then plugged, oleoresin deposits
may be replenished over time (Newton et al. 2011). Widely harvested in Brazilian
Amazonia, the oleoresin is valued for its therapeutic properties, which include anti-
inflammatory and analgesic uses (Veiga Junior and Pinto 2002). The state of Amazonas
is the principal source of Copaifera oleoresin in Brazil, producing 89% of the total 538
metric tons recorded in sales in 2009 (IBGE 2011). The state‟s production was worth
R$3.4 million (approximately USD 2.2 million; R$1 = USD 0.64, June 2011) in 2009,
but 94% of this oleoresin originated in just two adjacent municipalities, Apuí and Novo
Aripuanã, in south-eastern Amazonas. Copaifera oleoresin is therefore a good candidate
resource for commercial harvesting in other areas seeking to expand their extractive
economies (Menezes et al. 2005).
Using Copaifera oleoresin as an example, this study aims to demonstrate how an
integrative approach can contribute to an understanding of the extractive resource
potential of an NTFP. We aim to address the multiple constraints that contribute to an
assessment of the viability of commercial offtake, to generate robust landscape-scale
estimates of the potential volumes and economic values of this important Amazonian
resource.
5.3 Methods
5.3.1 Study site
The study was conducted within and around two large contiguous extractive reserves
bisected by the Juruá River, a major white-water tributary of the Amazon (Solimões)
River of western Brazilian Amazonia. The federally-managed Médio Juruá Extractive
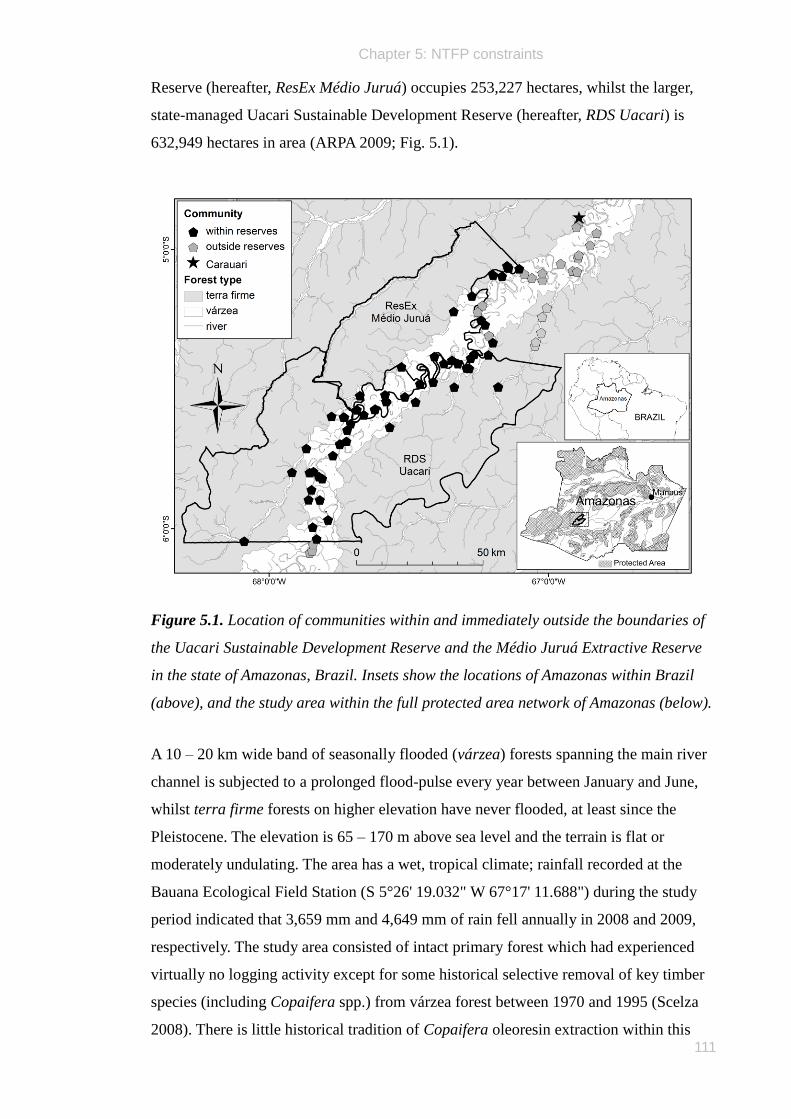
Chapter 5: NTFP constraints
111
Reserve (hereafter, ResEx Médio Juruá) occupies 253,227 hectares, whilst the larger,
state-managed Uacari Sustainable Development Reserve (hereafter, RDS Uacari) is
632,949 hectares in area (ARPA 2009; Fig. 5.1).
Figure 5.1. Location of communities within and immediately outside the boundaries of
the Uacari Sustainable Development Reserve and the Médio Juruá Extractive Reserve
in the state of Amazonas, Brazil. Insets show the locations of Amazonas within Brazil
(above), and the study area within the full protected area network of Amazonas (below).
A 10 – 20 km wide band of seasonally flooded (várzea) forests spanning the main river
channel is subjected to a prolonged flood-pulse every year between January and June,
whilst terra firme forests on higher elevation have never flooded, at least since the
Pleistocene. The elevation is 65 – 170 m above sea level and the terrain is flat or
moderately undulating. The area has a wet, tropical climate; rainfall recorded at the
Bauana Ecological Field Station (S 5°26' 19.032" W 67°17' 11.688") during the study
period indicated that 3,659 mm and 4,649 mm of rain fell annually in 2008 and 2009,
respectively. The study area consisted of intact primary forest which had experienced
virtually no logging activity except for some historical selective removal of key timber
species (including Copaifera spp.) from várzea forest between 1970 and 1995 (Scelza
2008). There is little historical tradition of Copaifera oleoresin extraction within this
Chapter 5: NTFP constraints
112
area, but the commercial harvesting of this resource is currently being actively
encouraged through the provision of training and materials by a state government
agency (the Instituto de Desenvolvimento Agropecuário e Florestal Sustentável do
Estado do Amazonas (IDAM)).
The ResEx Médio Juruá and the RDS Uacari, which were decreed in 1997 and 2005,
respectively, are currently inhabited by some 4,000 legal residents, living in ~74
communities of 1 – 89 households each. Many communities are located on the main
river channel, whilst others are found on the banks of tributaries and oxbow lakes on
either side of the Juruá River. Residents of these extractive reserves are variously
engaged in agricultural and extractive activities for both subsistence and cash income
(SDS 2010).
5.3.2 Study species
Copaifera species are hardwood canopy trees occurring in primary forests throughout
both the neo- and afro-tropics in much of South America and western Africa (Veiga
Junior and Pinto 2002). A recent review recognised nine species of Copaifera in
Brazilian Amazonia (Martins-da-Silva et al. 2008). Four of these species occurred
within the study area: C. guyanensis, C. multijuga and C. piresii occurred in terra firme
forest, whilst C. guyanensis and C. paupera occurred in várzea forest (Newton et al. in
review). These species were identified using the taxonomic key provided by Martins-da-
Silva et al. (2008) before being compared against voucher specimens previously
identified by R. Martins-da-Silva in the herbarium of the Botany Department of the
Instituto Nacional de Pesquisas da Amazônia (INPA), Manaus. Numbered voucher
specimens of each species identified during this study have been deposited at the INPA
herbarium.
5.3.3 Data acquisition
This study was conducted within the context of an interdisciplinary research project
aiming to understand the dynamics of extractive practices within multiple-use
Amazonian forest reserves. In this paper we combine data on human population
distribution, forest accessibility, and market values with data on Copaifera spatial
distribution (Chapter 3), Copaifera oleoresin yields (Newton et al. 2011), and household
incomes (Newton et al. in press b).
Chapter 5: NTFP constraints
113
5.3.3.1 Ecological data
Two previous studies, both of which were conducted within the same study landscape,
were used as sources of ecological data from which to estimate potential oleoresin yield.
We combined mean density values of Copaifera spp. trees ≥25 cm DBH, with data on
the spatial distribution and adult size distribution of each Copaifera species (Chapter 3).
Estimates of oleoresin yield likelihood and harvest volumes from initial and repeat
harvests, adjusted by tree DBH, were taken from Newton et al. (2011) (Table 5.1).
5.3.3.2 Socioeconomic data
We collected socioeconomic data from 127 households across 10 communities in the
ResEx Médio Juruá, three communities in the RDS Uacari, and two communities
immediately outside these reserves, all of which were located along a 380-km section of
the Juruá River (Fig. 5.1). Comprehensive weekly offtake surveys were conducted in 82
households across 10 communities between March 2008 and July 2010 (see Newton et
al. in press a for details of methods). Mean weekly household incomes were taken from
Newton et al. in press b). The location of every settlement within the study site was
mapped using a handheld GPS unit and the number of households recorded.
5.3.3.3 Market data
The economic value of Copaifera oleoresin was assessed from surveys of sales at three
hierarchical market levels. Within the reserves, in addition to the surveyed households,
known extractors were asked to note the volume and transaction prices of oleoresin
offtakes that they sold. In the nearest municipal town (Carauari) we interviewed the
owner of the only wholesale retailer regularly purchasing Copaifera oleoresin. In the
state capital (Manaus) we conducted market price surveys in the main city port and with
nearby retailers.
5.3.4 Data analysis
5.3.4.1 Reserve area
We calculated the combined area of the two reserves in ArcGIS 9.3, using polygon
shapefiles which matched the physically demarcated boundaries of these protected
areas. We excluded all areas outside the reserve boundaries; although this intact forest is
accessible to reserve residents, it is also used by people living outside of the reserves
and so was discounted from our estimates of reserve-scale productivity. However, we
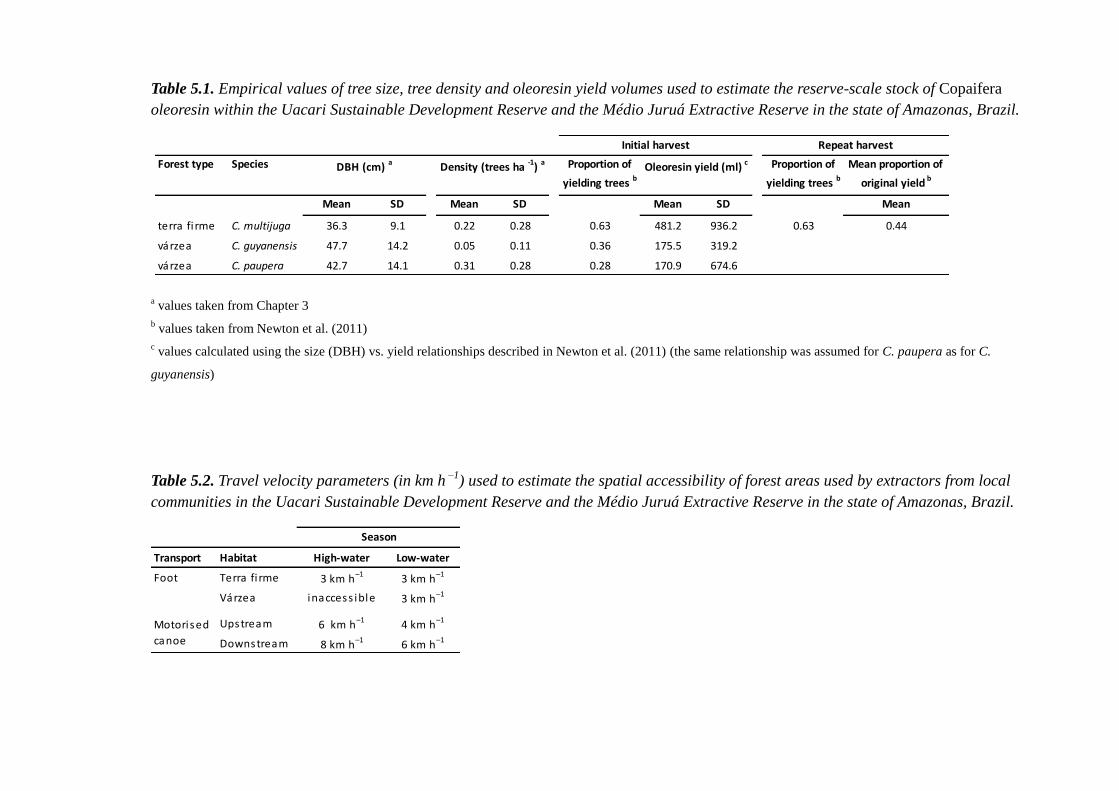
Table 5.1. Empirical values of tree size, tree density and oleoresin yield volumes used to estimate the reserve-scale stock of Copaifera
oleoresin within the Uacari Sustainable Development Reserve and the Médio Juruá Extractive Reserve in the state of Amazonas, Brazil.
Mean SD Mean SD Mean SD Mean
terra fi rme C. multijuga 36.3 9.1 0.22 0.28 0.63 481.2 936.2 0.63 0.44
várzea C. guyanensis 47.7 14.2 0.05 0.11 0.36 175.5 319.2
várzea C. paupera 42.7 14.1 0.31 0.28 0.28 170.9 674.6
Mean proportion of
original yield b
Repeat harvestInitial harvest
DBH (cm) aForest type Species Density (trees ha
-1)
a Proportion of
yielding trees b
Proportion of
yielding trees bOleoresin yield (ml)
c
a values taken from Chapter 3
b values taken from Newton et al. (2011)
c values calculated using the size (DBH) vs. yield relationships described in Newton et al. (2011) (the same relationship was assumed for C. paupera as for C.
guyanensis)
Table 5.2. Travel velocity parameters (in km h –1
) used to estimate the spatial accessibility of forest areas used by extractors from local
communities in the Uacari Sustainable Development Reserve and the Médio Juruá Extractive Reserve in the state of Amazonas, Brazil.
Transport Habitat High-water Low-water
Foot Terra fi rme 3 km h–1 3 km h–1
Várzea inaccess ible 3 km h–1
Upstream 6 km h–1 4 km h–1
Downstream 8 km h–1
6 km h–1
Season
Motorised
canoe
Chapter 5: NTFP constraints
115
included the small pocket of nominally unprotected forest encapsulated between the two
reserves (Fig. 5.1), since this is accessible only by reserve residents. The total area
included (889,499 ha) was thus slightly larger than the combined official areas of the
two reserves (ARPA 2009). The area covered by terra firme and várzea forest was
calculated in ArcGIS, using the vegetation classification used by Projeto
RADAMBRASIL (1977).
5.3.4.2 Forest accessibility
Anisotropic accessibility models were generated in ArcGIS 9.3 to estimate the total
forest area physically accessible to communities in both the low- and high-water
seasons. We considered resource accessibility to be determined by the combined
constraints of transport, time, and land-use (Geurs and Ritsema van Eck 2001). We
imposed an upper limit of 12 hours per day to harvest the resource and allocated four
hours for locating and drilling trees, thereby capping the return travel time at eight
hours. Travel from a community could be by motorised canoe, on foot, or by canoe and
then on foot. Travel velocity parameters were estimated from GPS tracks recorded in
situ and varied according to the mode and direction of travel (up- or down-stream), the
habitat traversed (terra firme or várzea) and the season (Table 5.2). High-water season
fluvial travel velocities were increased as a proxy for reduced travel distances resulting
from available fluvial short-cuts through meandering channels. However, várzea forest
was inaccessible on foot during the high-water season (approximately January – June).
Two cost distance analyses were conducted to estimate the total accessible area of
forest. Firstly, we calculated the geographic limits of fluvial travel for each community,
using the WWF hydrosheds river network data for Amazonia (Lehner et al. 2006). Each
250-m stretch of river was allocated a cost value based upon the time expended to reach
it from the nearest community. Secondly, we modelled the accessibility of terra firme
and várzea forest on foot, radiating from the entire extent of accessible rivers, oxbow
lakes, and perennial streams and constrained by the remaining travel time. Major
streams, rivers and lakes were modelled to act as barriers to travel on foot.
5.3.4.3 Total forest productivity
The estimated oleoresin production (ml ha–1
) of each forest type was calculated as a
function of mean tree density and oleoresin productivity for each species, using the
parameter values presented in Table 5.1. We interpreted the mean oleoresin yield
Chapter 5: NTFP constraints
116
frequencies and volumes (Newton et al. 2011) as indicating that C. multijuga was the
only species providing viable offtakes in terra firme forest, and that both C. guyanensis
and C. paupera were viable sources of oleoresin in várzea forest. Potential offtake was
therefore calculated for these three species, assuming that no trees had been previously
harvested. Estimates were repeated using an empirically-derived lower value of
oleoresin yields to represent the realistic potential for repeated harvests (Table 5.1). The
stock volume of oleoresin available to extractors was estimated by multiplying the
physically accessible area (ha) of each forest type by the per hectare oleoresin
productivity values. Estimated volumes were in turn converted to monetary values
based on trade survey data. Standard deviation values were used throughout to generate
estimates of variance.
5.4 Results
5.4.1 Total forest productivity
The combined forest area of the RDS Uacari and ResEx Médio Juruá was 889,499 ha,
of which 685,362 ha were terra firme forest and 204,137 ha were várzea forest. The
density of C. multijuga trees ≥25 DBH within terra firme forest (mean ± SD) was 0.22 ±
0.28 trees ha–1
whereas the combined density of C. guyanensis and C. paupera within
várzea forest was 0.36 ± 0.30 trees ha–1
(Table 5.1), resulting in a total estimate for the
combined reserve area of 150,780 ± 191,901 C. multijuga trees in terra firme forest and
73,489 ± 61,411 Copaifera spp. trees in várzea forest.
Várzea forest had a higher density of trees than terra firme forest but the mean per tree
productivity of C. multijuga (481.2 ± 936.2 ml) was more than twice as high as either of
the two várzea forest species (Table 5.1). The estimated potential initial yield volume of
oleoresin available per ha was therefore very similar in both terra firme forest (67.0 ±
155.9 ml ha–1
) and várzea forest (63.9 ± 235.8 ml ha
–1).
5.4.2 Proportion of forest accessible to extractors
In the low-water season, an estimated total of 305,906 ha of terra firme forest (44.6 %
of the total) and 191,431 ha of várzea forest (93.8 % of the total) were accessible within
an 8-hour return travel time by at least one community within the two reserves. A more
extensive area of terra firme forest (393,869 ha) was accessible in the high-water
season, since higher water-levels allowed farther upstream travel. Conversely, várzea
forest was inundated and therefore inaccessible on foot during this period (Fig. 5.2).
Chapter 5: NTFP constraints
117
Our models show that a greater area of várzea forest than terra firme forest was
accessible within shorter travel times of less than ~250 min (Fig. 5.3), since most
communities were located along the main river channel. Longer travel times (~250 –
480 min) allowed access to increasingly greater proportions of terra firme forest, since
most of the accessible várzea forest could be reached within a ~300-min return journey.
5.4.3 Estimate of harvestable resource volume
The similarity of the estimated per ha yield volumes meant that the predicted
availability of oleoresin in the two forest types at different travel distances closely
matched that of forest accessibility (Fig. 5.3). The total aggregate volume of Copaifera
oleoresin that might be accessed by communities from the initial harvest of trees was
estimated to be 38,635 ± 1,176,251 litres (26,408 ± 903,892 litres in terra firme forest
and 12,227 ± 752,692 litres in várzea). In the low-water season, the maximum aggregate
volume across both forest types was 32,737 ± 1,021,651 litres, whilst the high-water
season total was 26,408 ± 903,892 litres. A subsequent reharvest of the same tree
populations was estimated to produce an additional potential volume of 8,274 ± 2,888
litres (terra firme: 7,324 ± 2,878 litres; várzea: 950 ± 235 litres). However, the longer-
term sustainability of extraction depends upon subsequent rates of oleoresin renewal,
for which no data are available.
5.4.4 Economic value of Copaifera oleoresin
5.4.4.1 Current harvest levels and market values
The harvest of Copaifera oleoresin was an uncommon activity in these reserves, being
reported on just eight occasions by four different households – from a total of >6,000
weekly surveys across 127 households. Extracted oleoresin volumes ranged from 300
ml to 3 litres, and was both sold (3 occasions) and consumed (5 occasions).
Additionally, one extractor living in the RDS Uacari reported selling 5.8 litres of
oleoresin between May and October 2009, principally to other residents within the two
reserves (N = 20 sales). Oleoresin was sold for R$14 litre–1
if sold in larger quantities
(≥500 ml), or for R$30 litre–1
if sold in 100 ml bottles. A second extractor reported
making a single sale of 1.5 litres for R$25 to a trader in the port of the nearest municipal
town, Carauari. The main trader of oleoresin in Carauari reported buying the product
from extractors for R$12 – 15 litre–1
and selling to consumers for R$20 litre–1
. This was
consistent with the prices reported by extractors. Both extractors and the shopkeeper
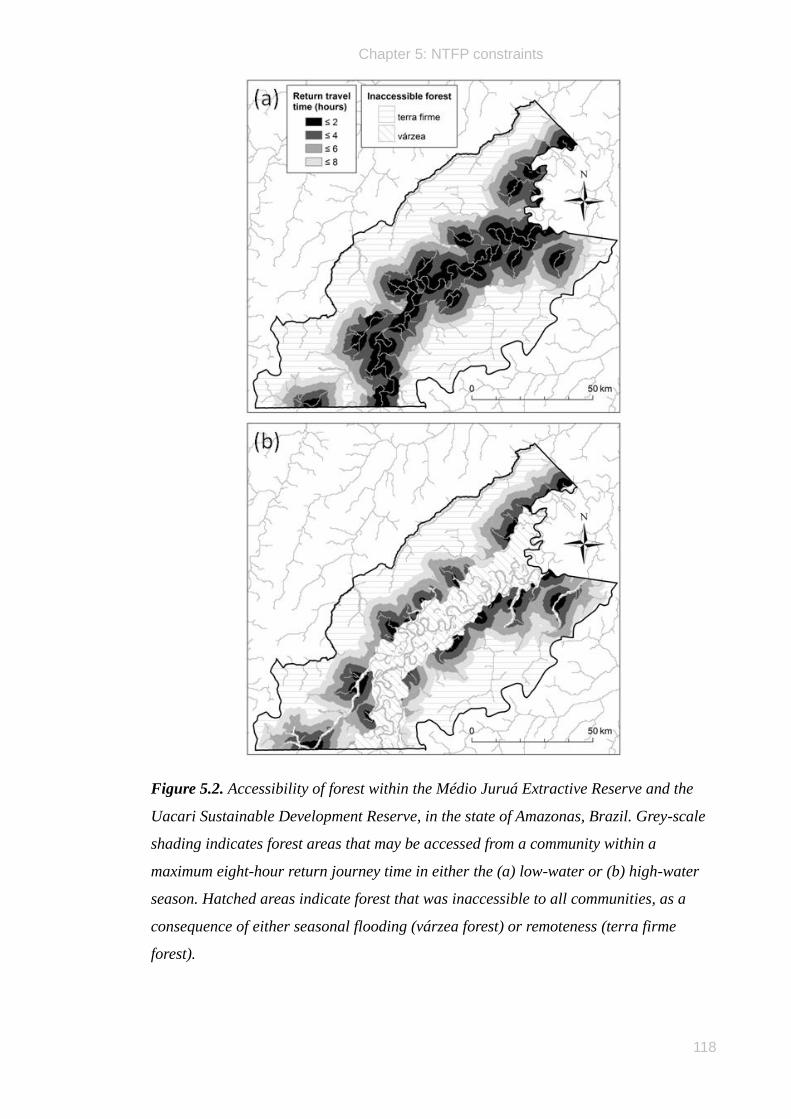
Chapter 5: NTFP constraints
118
Figure 5.2. Accessibility of forest within the Médio Juruá Extractive Reserve and the
Uacari Sustainable Development Reserve, in the state of Amazonas, Brazil. Grey-scale
shading indicates forest areas that may be accessed from a community within a
maximum eight-hour return journey time in either the (a) low-water or (b) high-water
season. Hatched areas indicate forest that was inaccessible to all communities, as a
consequence of either seasonal flooding (várzea forest) or remoteness (terra firme
forest).
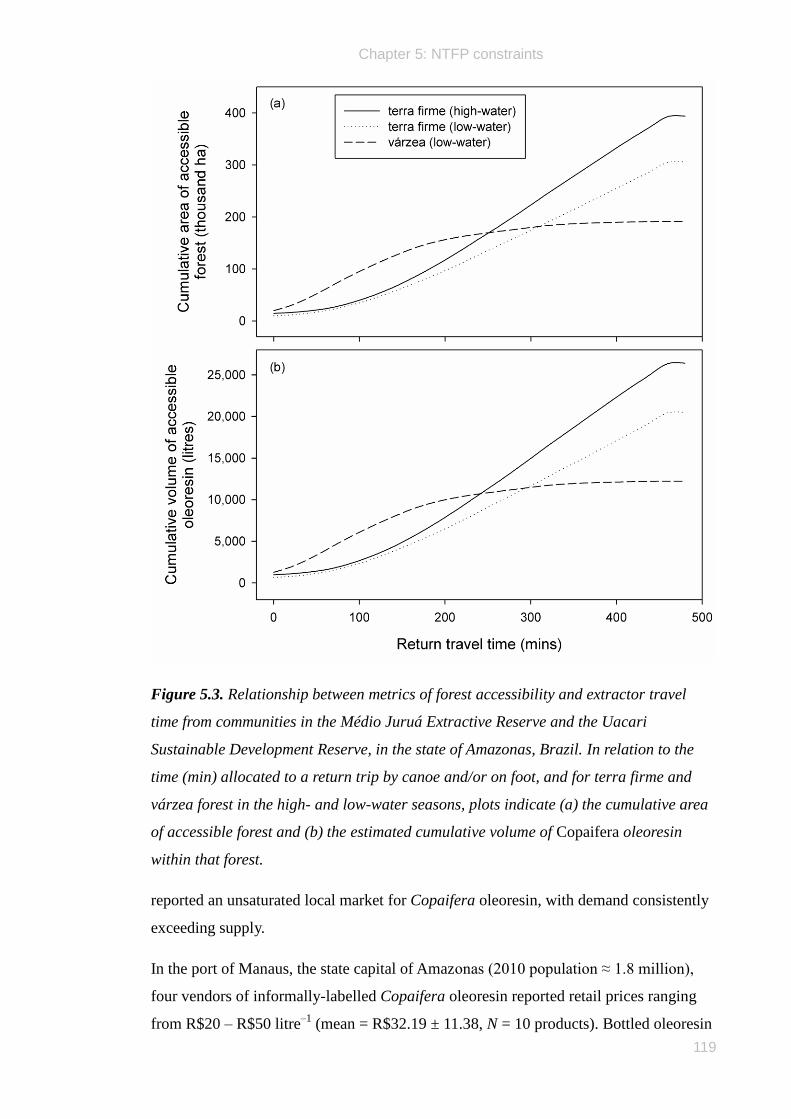
Chapter 5: NTFP constraints
119
Figure 5.3. Relationship between metrics of forest accessibility and extractor travel
time from communities in the Médio Juruá Extractive Reserve and the Uacari
Sustainable Development Reserve, in the state of Amazonas, Brazil. In relation to the
time (min) allocated to a return trip by canoe and/or on foot, and for terra firme and
várzea forest in the high- and low-water seasons, plots indicate (a) the cumulative area
of accessible forest and (b) the estimated cumulative volume of Copaifera oleoresin
within that forest.
reported an unsaturated local market for Copaifera oleoresin, with demand consistently
exceeding supply.
In the port of Manaus, the state capital of Amazonas (2010 population ≈ 1.8 million),
four vendors of informally-labelled Copaifera oleoresin reported retail prices ranging
from R$20 – R$50 litre–1
(mean = R$32.19 ± 11.38, N = 10 products). Bottled oleoresin
Chapter 5: NTFP constraints
120
volumes ranged from 50 to 1000 ml. Two other vendors sold more formal products that
were labelled with the source location, species, or processing company. These product
prices ranged from R$100 – R$333 litre–1
(mean = R$188.89 ± 126.20, N = 3), for
bottled volumes between 20 and 30 ml.
5.4.4.2 Potential economic value of the accessible resource
Using a conservative trading value to the extractor of R$14 litre–1
, we estimated the
stock of Copaifera oleoresin accessible from previously-unharvested trees within these
two reserves to be worth R$540,889 ± R$16,467,514. At the same market value, the
value of oleoresin from a subsequent repeat harvest is projected to be R$115,838 ±
R$40,431.
5.5 Discussion
The distribution, productivity, and accessibility of tropical NTFPs are highly spatially
and temporally variable. The total yields that can be viably extracted are constrained by
characteristics of the resource, the geography of the harvest landscape, the demography
and distribution of the extractor population, and market idiosyncrasies. In aggregate,
these constraints exacerbate the discrepancy between the potential and actual resource
stock volumes that can be feasibly harvested, regardless of the degree to which these
offtakes are sustainable. Here, we explore these constraints and show how they can limit
NTFP commercialisation in both space and time.
5.5.1 Spatial and temporal constraints
5.5.1.1 Resource distribution and productivity
The potential stock volume of any plant NTFP is determined largely by the product of
the species density across the landscape and the per plant productivity. Within this study
site, as in others, productive Copaifera trees were sparsely distributed; only one species
in terra firme forest and two in várzea forest provided evidence of significant oleoresin
production, and these species were found at low densities (0.05 – 0.31 ha–1
). Moreover,
only 28 – 63% of trees of these species yielded any oleoresin at all and even then the
volume produced within a single extraction event varied by several orders of magnitude
(1 – 4,246 ml) (Newton et al. 2011). Therefore, although individual trees may produce
up to 4.2 litres of oleoresin in a single harvest, extractors may have to drill numerous
trees before encountering one that yields an economically-viable oleoresin volume.
Chapter 5: NTFP constraints
121
Consequently, our estimates of per unit area oleoresin production are relatively low,
averaging only 67.0 ml ha–1
and 63.9 ml ha–1
in terra firme and várzea forest,
respectively.
Similar constraints apply to other important Amazonian NTFP tree species. For
example, densities of Brazil nut (Bertholletia excelsa) trees have been reported as being
similarly low, at 1.35 trees ≥10 cm DBH ha–1
(Wadt et al. 2005). Secondly, and
similarly to Copaifera, rubber (Hevea spp.) trees show variation in yield between
species and forest types. Not all rubber trees produce latex, and densities of tappable
trees may be as low as 1 – 1.5 ha–1
(Schroth et al. 2003). In our study site, Hevea spp.
occurred in both forest types but in terra firme forest the congener produces an inferior
quality of latex for which no market is currently available. Finally, some NTFPs such as
Brazil nuts and other trees harvested for their fruits and seeds show large supra-annual
variation in productivity at either the individual or population level (Bhat et al. 2003;
Kainer et al. 2007). Even in productive years, such NTFPs are only available for harvest
during a limited period of the plant phenological cycle. In contrast, Copaifera trees may
be harvested at any time of year – although seasonality may influence the yield volumes
of oleoresin (Ferreira and Braz 2001).
5.5.1.2 Physical accessibility
The spatial distribution of the human population of much of rural Amazonia is largely
determined by fluvial geography. In the absence of roads, rivers provide the principal
means of transport, so that all communities in our study area were located along the
edge of permanent water-bodies including the main Juruá river channel, perennial
tributaries, and oxbow lakes. We estimated that within an 8-hour return journey, reserve
residents could travel up to 27 km along this fluvial network and up to 12 km on foot
within the forest to harvest forest resources for subsistence and commerce. We capped
travel time at a single day‟s maximum travel distance, but extractor incentive to travel to
these farther areas is clearly a trade-off between resource value and the investment of
time, energy, and fuel required to harvest that resource, in addition to the opportunity
cost incurred. Here we applied our accessibility models to the extraction of Copaifera
oleoresin, but the models could be equally extended to any other extractive resource for
which similar spatial and temporal constraints apply.
Chapter 5: NTFP constraints
122
5.5.1.3 Local geography
As a consequence of the spatial configuration of local communities and the desire of
extractors to minimise travel costs, a resource is likely to become locally depleted in
more accessible areas (Belcher and Schreckenberg 2007). In contrast, 379,476 ha of the
forest in our study reserves farther from the main river channel (44.7% of the total
reserve area) were entirely depopulated and essentially inaccessible to extractors (Fig.
5.2). Resources contained within these remote forest areas were therefore likely to
remain unexploited.
The potential for communities to harvest resources depends in part on the relative
accessibility of terra firme and várzea forest, which varied widely in these reserves. For
example, terra firme areas for different communities accounted for between 0% and
66% of forest within a 5-km radius (Newton et al. in press; Fig. 5.1). Similar yields per
unit area were estimated for várzea forest as for terra firme forest, but the former forest
type was more easily accessible. In terms of reduced costs of transport and time, we
therefore predict that Copaifera oleoresin harvesting will be more profitable – and more
attractive – for extractors in communities with greater access to surrounding várzea
forest.
The spatial distribution of, and current engagement with, other resources may also be a
constraint on the total realised harvest. An extractor may be more incentivised to exploit
an NTFP resource if it can be harvested opportunistically whilst engaging in a
secondary activity such as hunting, effectively reducing the cost associated with
harvesting a single class of product.
5.5.1.4 Seasonality
Várzea forest is accessible on foot only during the low-water season, so extraction of
terrestrial resources from this forest type is restricted to these months (Fig. 5.2). For
example, rubber is one of the principal commercially-exploited NTFP in our focal
reserves but can only be harvested from várzea forest between August and December,
and the same constraint applies to the extraction of Copaifera oleoresin. In contrast,
terra firme forest is accessible on foot all year-round – although the accessible area of
this forest type was 29% greater in the high-water season. Furthermore, for many
communities it is easier to access terra firme forest during the high-water season when
canoes can be used to both bypass the intermediary várzea forest and facilitate
Chapter 5: NTFP constraints
123
transportation of forest resources; a walk of up to several hours may be necessary during
the low-water season just to overcome the várzea floodplain and reach the terra firme
boundary.
5.5.2 Economic constraints
5.5.2.1 Current markets
The sales prices per litre of Copaifera oleoresin recorded by our trade surveys were
lower than those reported by a recent national report on Amazonia-wide trade values
(range: R$15 – R$50 litre–1
; Imazon 2011) but higher than those previously reported
(e.g. Belem: USD 10 litre–1
, Shanley et al. 2002; Rio Branco and Porto Velho: R$0.50 –
R$15 litre–1
, Leite 1998; R$1 ≈ USD 0.64, June 2011). This discrepancy probably
results from the increasing value of Copaifera oleoresin: Shanley et al. (2002) reported
a doubling in price of this resource between 1994 and 2000, and national trade data
showed that the value per ton of oleoresin increased linearly from R$281 to R$7,710
between 1990 and 2009 (IBGE 2011). Price elasticity in response to dynamic supply
and demand curves clearly affects the value of the product to extractors, but the general
trend for increasing prices and greater demand from international as well as domestic
markets is an indication that markets for this and other NTFPs may be growing.
Accessibility of stable urban markets has often been cited as a significant barrier to
trade opportunities (e.g. Parry et al. 2010). However, the importance of distance from
individual communities to the nearest urban centre may be much reduced by favourable
product and market conditions. For example, Copaifera oleoresin is a non-perishable
resource with a long shelf-life and a high value per unit weight. Extractors can therefore
afford to wait for the optimum timing to transport these goods to markets, often by
combining these trips with other reasons for visiting the town. Additionally, in our focal
reserves, cantinas (small shops) operated by residents‟ associations are now operating in
many communities, providing local trade opportunities for agricultural and extractive
products. These purchase agricultural and extractive goods and sell non-perishable
consumables at prices that match those of urban markets. These local markets
effectively subsidise reserve residents by removing the traditional barrier of prohibitive
transport costs associated with settlements far from urban markets.
Chapter 5: NTFP constraints
124
5.5.2.2 Contribution to rural economies
Rural Amazonian communities vary in the extent to which they engage in either
agricultural or extractive income-generating activities (Newton et al. in press a).
Communities whose cash economies are derived primarily from extractive resources
may more readily engage with an extractive initiative such as Copaifera oleoresin
exploitation, which is likely to be more compatible with their current time-budgets and
patterns of forest access. Household cash incomes within these reserves ranged from
R$55 to R$1,656 month-1
(mean = R$563 ± 349, N = 82; Newton et al. in press b). At a
price of R$14 litre–1
, a household harvesting only two litres of Copaifera oleoresin per
month would generate 5% of this mean revenue. Our estimates of accessible oleoresin
volumes suggest that the resource stock is insufficient to support this level of offtake by
all reserve households, but imply that, even given current market values, oleoresin
extraction could make a meaningful contribution to some households‟ incomes.
5.5.2.3 Adding value
NTFP certification is a mechanism by which to add value to a product whilst
encouraging sustainable forest resource management (Shanley et al. 2005). Schemes
that certify the geographic source, extraction method, tree species, and purity of a
product are likely to benefit both consumers and extractors (Shanley et al. 2005).
Certification standards have been approved for many NTFP, including Copaifera
oleoresin in some areas (Imperador et al. 2009). However, the adulteration of Copaifera
oleoresin with vegetal oils by traders remains a widespread problem that can reduce the
value of the resource by artificially inflating supply and lessening consumer confidence
in the product (Barbosa et al. 2009). The development of simple purity tests based on
refractive indices and thin layer chromatography could help to eliminate this problem
(Barbosa et al. 2009). A greater understanding of the variation in physical and chemical
properties of oleoresins from different Copaifera species may also add considerable
value to this resource (Veiga Junior et al. 2007). Our market data suggest that labelled
and marked oleoresin may generate revenues five times higher than equivalent
quantities that are less formally sold.
5.5.2.4 Subsidised extractive industries
Formal markets for many NTFPs are an increasingly common component of the
economies of many extractive reserves, particularly as PES programmes and
Chapter 5: NTFP constraints
125
government initiatives actively support the start-up of extractive industries. For
example, several NTFPs extracted within our focal reserves benefit from secure markets
with annually-designated buying prices. Firstly, the fixed price at which extractors sell
Hevea latex (from rubber trees) has been maintained by subsidies from both a reserve
cooperative and the state government. Secondly, the local cooperative equitably
allocates an annual contract of purchase quotas for forest-harvested andiroba seeds
(Carapa guianensis, Meliaceae) and then collects these directly from each community
(Rizek 2006). The oil extracted from these seeds within a small processing plant in a
community in the ResEx Médio Juruá is then sold directly to a large national cosmetics
company (Natura 2007). This bypasses the traditional market chains consisting of
several middlemen, thereby attracting more favourable buying prices for extractors. Our
data showed minimal current engagement with commercial Copaifera oleoresin
harvesting, but we suggest that if a similarly well-defined market chain can be
developed for this resource then its value to extractors, and thus their motivation to
harvest, would increase substantially.
5.5.3 Conclusions
Forest extractivists have an excellent knowledge of the spatial distribution of forest
resources and are able to optimise the efficiency of harvesting trips by minimising travel
times and distances between resources. However, we have shown how the interaction of
ecological, sociodemographic, and economic constraints can affect the potential for the
commercial exploitation of an NTFP resource. In particular, spatial and temporal access
to different forest types determine the total value of resource available to extractors. An
extractor may be more incentivised to harvest a commercially valuable resource if a
stable or subsidised market exists for that NTFP. Under favourable market conditions,
Copaifera oleoresin could be a valuable addition to a diversifying portfolio of extractive
resources in Amazonian reserves.
5.6 References
Allegretti, M.H., 1990. Extractive reserves: an alternative for reconciling development
and environmental conservation in Amazonia. In: Anderson, A.B. (Ed.). Alternatives to
deforestation: steps toward sustainable use of the Amazonian rain forest, pp. 252-264.
Columbia University Press, New York.
Chapter 5: NTFP constraints
126
ARPA, 2009. Programa Àreas Protegidas da Amazônia: Amazônia Brasileira. Instituto
Socioambiental, Manaus.
Barbosa, K.d.S., Yoshida, M., Scudeller, V.V., 2009. Detection of adulterated copaíba
(Copaifera multijuga Hayne) oil-resins by refractive index and thin layer
chromatography. Revista Brasileira de Farmacognosia 19, 57-60.
Belcher, B., Schreckenberg, K., 2007. Commercialisation of non-timber forest products:
a reality check. Development Policy Review 25, 355-377.
Bhat, P.R., Murali, K.S., Hegde, G.T., Shastri, C.M., Bhat, D.M., Murthy, I.K.,
Ravindranath, N.H., 2003. Annual variation in non-timber forest product yield in the
Western Ghats, Karnataka, India. Current Science 85, 1350-1355.
Ferreira, L.A., Braz, E.M., 2001. Avaliação do potencial de extração e comercialização
do óleo-resina de copaíba (Copaifera spp.). The New York Botanical Garden/
Universidade Federal do Acre, Brazil.URL
www.nybg.org/bsci/acre/www1/evaluation.html.
Fiorese, C., 2009. Secretaria quer "revolução" do extrativismo na Amazônia. Notícias
da Amazônia. URL www.noticiasdaamazonia.com.br.
Freckleton, R.P., Matos, D.M.S., Bovi, M.L.A., Watkinson, A.R., 2003. Predicting the
impacts of harvesting using structured population models: the importance of density-
dependence and timing of harvest for a tropical palm tree. Journal of Applied Ecology
40, 846-858.
Geurs, K.T., Ritsema van Eck, J.R., 2001. Accessibility measures: review and
applications. National Institute of Public Health and the Environment (RIVM),
Bilthoven, The Netherlands.
IBGE, 2011. Instituto Brasileiro de Geografia e Estatística. Sistema IBGE de
recuperação automatica (SIDRA). URL www.sidra.ibge.gov.br.
Imazon, 2011. Instituto do Homem e Meio Ambiente da Amazônia. Preços
de Produtos Florestais Não Madeireiros. URL http://www.imazon.org.br/precos-de-
produtos-florestais.
Chapter 5: NTFP constraints
127
Imperador, A.M., Wadt, L.H.O., Crestema, S., 2009. Community forest certification of
non-timber forest products - according to the perspective of two certified communities
in the Brazilian Amazon. XIII World Forestry Congress, Buenos Aires, Argentina.
Kainer, K.A., Wadt, L.H.O., Staudhammer, C.L., 2007. Explaining variation in Brazil
nut fruit production. Forest Ecology and Management 250, 244-255.
Klimas, C.A., Kainer, K.A., Wadt, L.H.O., 2007. Population structure of Carapa
guianensis in two forest types in the southwestern Brazilian Amazon. Forest Ecology
and Management 250, 256-265.
Lehner, B., Verdin, K., Jarvis, A., 2006. HydroSHEDS Technical Documentation. World
Wildlife Fund US, Washington, DC. URL http://hydrosheds.cr.usgs.gov.
Leite, A.C.P., 1998. Estudo de mercado e comercialização do óleo de copaíba em São
Paulo, Rio Branco e Porto Velho. Ministério do Meio Ambiente e Recursos Hídricos da
Amazônia Legal - Projeto PED. Projeto SAF‟s e Turismo Ecológico, Rio Branco.
Marshall, E., Schreckenberg, K., Newton, A.C., 2006. Commercialization of non-timber
forest products – factors influencing success. UNEP World Conservation Monitoring
Centre, Cambridge.
Martins-da-Silva, R.C.V., Pereira, J. F. & Lima, H. C., 2008. O gênero Copaifera
(Leguminosae – Caesalpinioideae) na Amazônia Brasileira. Rodriguésia 59, 455-476.
Medeiros, R.D., Vieira, G., 2008. Sustainability of extraction and production of copaíba
(Copaifera multijuga Hayne) oleoresin in Manaus, AM, Brazil. Forest Ecology and
Management 256, 282-288.
Menezes, M., Pinheiro, M.R., Guazzell, A.C., Martins, F., 2005. Cadeia produtiva dos
óleos vegetais extrativos no estado do Amazonas. SDS, Manaus.
Myers, N., 1988. Tropical forests - much more than stocks of wood. Journal of Tropical
Ecology 4, 209-221.
Natura, 2007. Plano de desenvolvimento sustentável junto as comunidades do Médio
Juruá. CARE Brasil and Natura, São Paulo.
Chapter 5: NTFP constraints
128
Nepstad, D.C., Schwartzman, S., 1992. Non-timber products from tropical forests:
evaluation of a conservation and development strategy. Advances in Economic Botany
9, pp. vii – xii.
Newton, P. Endo, W., Peres, C.A. In press a. Determinants of livelihood strategy
variation in two extractive reserves in Amazonian flooded and unflooded forest.
Environmental Conservation.
Newton, P., Nichols, E., Endo, W., Peres, C.A. In press b. Consequences of actor level
livelihood heterogeneity for additionality in an undifferentiated payment-based
payments for environmental services programme in a tropical forest region. Global
Environmental Change.
Newton, P., Watkinson, A.R., Peres, C.A., 2011. Determinants of yield in a non-timber
forest product: Copaifera oleoresin in Amazonian extractive reserves. Forest Ecology
and Management 261, 255-264.
Parry, L., Day, B., Amaral, S., Peres, C.A., 2010. Drivers of rural exodus from
Amazonian headwaters. Population and Environment 32, 137-176.
Peres, C.A., Lake, I.R., 2003. Extent of nontimber resource extraction in tropical
forests: accessibility to game vertebrates by hunters in the Amazon basin. Conservation
Biology 17, 521-535.
Peters, C.M., Gentry, A.H., Mendelsohn, R.O., 1989. Valuation of an Amazonian
rainforest. Nature 339, 655-656.
Plowden, C., 2004. The ethnobotany of copaíba (Copaifera) oleoresin in the Amazon.
Economic Botany 58, 729-733.
RADAMBRASIL, 1977. Projeto RADAMBRASIL. Levantamento de recursos naturais:
folha SB. 19 Juruá. Ministério das Minas e Energia, Rio de Janeiro.
Rizek, M.B., 2006. Thesis. A comercialização de óleos vegetais na Reserva Extrativista
do Médio Rio Juruá, Carauari-AM: de uma estratégia de “desenvolvimento sustentável”
á mercantilização de comunidades tradicionais extrativistas. Instituto de Geociências.
Universidade Estadual Paulista, São Paulo.
Ruiz-Pérez, M., Belcher, B., Achdiawan, R., Alexiades, M., Aubertin, C., Caballero, J.,
Campbell, B., Clement, C., Cunningham, A., Fantini, A., de Foresta, H., García
Chapter 5: NTFP constraints
129
Fernández, C., Gautam, K.H., Hersch Martínez, P., de Jong, W., Kusters, K., Kutty,
M.G., López, C., Fu, M., Martínez Alfaro, M.A., Nair, T.K.R., Ndoye, O., Ocampo, R.,
Rai, N., Ricker, M., Schreckenberg, K., Shackleton, S., Shanley, P., Sunderland, T.,
Youn, Y., 2004. Markets drive the specialisation strategies of forest peoples. Ecology
and Society 9, 4.
Scelza, G.C., 2008. Desobriga: o movimento de contra-opressão ao sistema dos
seringais no Médio Juruá – AM (1970-2008). MSc dissertation. Instituto de Filosofia e
Ciências Sociais. p. 95. Universidade Federal do Rio de Janeiro, Rio de Janeiro.
Schroth, G., Coutinho, P., Moraes, V.H.F., Albernaz, A.L., 2003. Rubber agroforests at
the Tapajós river, Brazilian Amazon - environmentally benign land use systems in an
old forest frontier region. Agriculture, Ecosystems and Environment 97, 151-165.
Shackleton, S., Shackleton, C., Shanley, P., 2011. Non-timber forest products in the
global context. Springer-Verlag, Berlin.
Shanley, P., Luz, L., Swingland, I.R., 2002. The faint promise of a distant market: a
survey of Belem's trade in non-timber forest products. Biodiversity and Conservation
11, 615-636.
Shanley, P., Pierce, A., Laird, S., 2005. Beyond timber: certification of non-timber forest
products. Forest Trends; Center for International Forestry Research; People and Plants
International, Washington.
Veiga Junior, V.F., Pinto, A.C., 2002. O gênero Copaifera L. Quimica Nova 25, 273-
286.
Veiga Junior, V.F., Rosas, E.C., Carvalho, M.V., Henriques, M.G.M.O., Pinto, A.C.,
2007. Chemical composition and anti-inflammatory activity of copaiba oils from
Copaifera cearensis Huber ex Ducke, Copaifera reticulata Ducke and Copaifera
multijuga Hayne - a comparative study. Journal of Ethnopharmacology 112, 248-254.
Wadt, L.H.O., Kainer, K.A., Gomes-Silva, D.A.P., 2005. Population structure and nut
yield of a Bertholletia excelsa stand in Southwestern Amazonia. Forest Ecology and
Management 211, 371-384.
Wunder, S., 2008. Payments for environmental services and the poor: concepts and
preliminary evidence. Environment and Development Economics 13, 279-297.
130
Chapter 6
Consequences of actor level livelihood heterogeneity
for additionality in an undifferentiated payment-
based payments for environmental services
programme in a tropical forest region
Photo: Payments for environmental services (Wunder et al. 2005)
Published as:
Newton, P., Nichols, E., Endo, W., Peres, C.A. In press. Consequences of actor level
livelihood heterogeneity for additionality in an undifferentiated payment-based
payments for environmental services programme in a tropical forest region. Global
Environmental Change
Chapter 6: Payments for environmental services
131
6.1 Abstract
Primary tropical forests provide crucial environmental services, including carbon
storage and hydrological regulation. Options for promoting forest conservation include
payments for environmental services (PES) programmes that provide financial
incentives to local actors, in exchange for reduced forest clearance. The success of
voluntary PES (defined in terms of avoided primary forest conversion) is contingent
upon behavioural changes in enrolled actors. As both the degree of enrolment and
likelihood of sustained behavioural change depend upon how PES compensation
structures interact with existing actor economies, local heterogeneity in livelihood
strategies may play a strong role in the ultimate success of PES programmes,
particularly when compensation is not differentiated with respect to opportunity costs.
We examined the influence of livelihood heterogeneity on the potential success of a
deforestation-reduction PES with an undifferentiated reward structure. We collected
socioeconomic and demographic data at the household and community levels across
two large Amazonian extractive reserves where a spatially extensive PES programme
(Bolsa Floresta) operates. We show that demographic and socioeconomic status varies
widely across both households and communities, and found that households and
communities that are most and least likely to convert primary forest receive similar
financial incentives. Those households most engaged in manioc agriculture (the primary
driver of local primary forest conversion) both benefitted from the highest annual
incomes and incurred the greatest opportunity costs. We show that avoided primary
forest conversion could be greatly increased with differentiated payment structures
adjusted for local differences in opportunity costs and livelihood strategies, and present
two metrics that could help to achieve that goal.
6.2 Introduction
Tropical forest biomes harbour the highest levels of terrestrial biodiversity on Earth,
provide key environmental services, and support the livelihoods of millions of rural
people (Chhatre and Agrawal 2009). However, tropical forest loss continues – driven by
a multitude of factors including human-induced land-use change and forest degradation
(Rudel et al. 2009). In the last two decades, emissions from tropical deforestation have
contributed 15-23% of the annual global carbon emissions, particularly if subsequent
land-use is considered (van der Werf et al. 2009). To stem future losses of forest cover,
Chapter 6: Payments for environmental services
132
government and non-governmental agencies are increasingly embracing the
implementation of payments for environmental services (PES) programmes.
Environmental services (ES) are aspects of ecosystems used to produce human
wellbeing, either actively or passively (Boyd and Banzhaf 2007; Fisher et al. 2009).
PES programmes provide a mechanism through which the values of these services can
be converted into financial incentives for conservation (Engel et al. 2008; Wunder et al.
2008). Economic decision-making often fails to fully account for environmental service
provision (Liu et al. 2010); direct or market-based incentives such as PES therefore seek
to transfer funds from those that benefit from environmental services to those that
contribute to their production or conservation by inducing benign land-use practices
(Wunder 2005; Sommerville et al. 2009). PES have been broadly defined as “(1) a
voluntary transaction where (2) a well-defined ES (or corresponding land use) is (3)
being „bought‟ by a (minimum one) ES buyer (4) from a (minimum one) ES provider
(5) if and only if ES provision is secured (conditionality)” (Wunder 2005).
There is a growing demand to understand the extent to which PES programmes
contribute to concrete environmental gains (Wunder et al. 2008; Redford and Adams
2009). The overall success of any given PES programme can be measured in terms of
enrolment, conditionality, additionality, permanence, and leakage (Engel et al. 2008).
Firstly, potential service providers must be voluntarily attracted to enrol in the
programme. Secondly, the conditionality of service supply requires not only adequate
compensation for enrolled providers but also a monitoring system and penalty structures
(Meijerink 2008). Thirdly, enrolment and compliance must jointly produce
additionality; a change in land-use beyond what would have happened in the absence of
the programme. Should unrewarded land-use decisions by PES recipients be exactly the
same, no additional services have been secured (Engel et al. 2008). Whether
additionality can be expected to persist over time (permanence) and whether gains in
additionality come at the cost of displacing ecologically perverse land-use practices to
areas outside the project boundaries (leakage) are important additional metrics of
success for any PES programme.
Fundamental to enrolment, compliance, and ensuing additionality are PES programmes‟
payment structures (Wunder et al. 2008). Many programmes compensate enrolled
participants depending on the opportunity cost incurred by transitioning to the PES-
compliant land use, using metrics to assess the degree of behavioural change entailed or
Chapter 6: Payments for environmental services
133
the relative value of the land involved. Programmes with such differentiated payments
are more often seen in user-financed (rather than government-sponsored) programmes
implemented across small spatial scales. Examples of PES structures involving at least a
degree of differentiation include the Pago de Servicios Ambientales Hidrológicos
(PSAH) in Mexico (Muñoz-Piña et al. 2008), the Vittel watershed protection
programme in France (Perrot-Maître, 2006), and the Pimampiro programme in Ecuador
(Wunder and Albán 2008). The degree of refinement of differentiated payment schemes
varies greatly; from broad categories of land type (e.g. the PSAH pays a higher rate to
landowners protecting cloud forest), to custom pricing for individual plots within
landholdings (e.g. the Vittel PES). In contrast, other programmes uniformly distribute
benefits across all enrolled ES providers, regardless of variance in individual
opportunity costs (i.e. undifferentiated payments). Such programmes include many
government-financed schemes and pay undifferentiated rates per unit land area. This
flat-rate reward structure is often necessary as a consequence of vast spatial extents,
equity concerns or intractable transaction costs. Examples of undifferentiated payments
programmes include Socio Bosque in Ecuador (Chíu 2009) and Los Negros in Bolivia
(Asquith et al. 2008). PES programmes whose payments are neither differentiated by
opportunity cost nor by the extent of land area committed include the Simanjiro PES
agreement in Tanzania (Nelson et al. 2010) and Bolsa Floresta in Brazil (Viana 2008).
Although the development and poverty alleviation goals of PES programmes are usually
considered secondary to their environmental aims (Engel et al. 2008), PES are often
implemented in poor areas, where perceived or actual financial or development benefits
may influence both the initial commitment and subsequent adherence to programme
requirements by individual actors (Wunder 2008). Given that payments in PES
programmes are often targeted at both the actor (households) and community levels, an
understanding of local economic or livelihood factors that influence enrolment or
compliance at both levels of organisation will have strong implications for ultimate
programme success (Wunder 2007). However, few data are available to explicitly link
local livelihood strategies to the effect size of alternative PES payment structures.
The rural livelihood strategies of individual households and communities within legally-
occupied Amazonian reserves (hereafter, extractive reserves) tend to be very
heterogeneous, with variable engagement with agricultural and extractive activities and
consequential reliance on different forest types (Takasaki et al. 2001; Coomes 2004;
Long 2010). Households show strong congruence in livelihood strategy within any
Chapter 6: Payments for environmental services
134
given community, but accessibility to alternative forest types results in strong inter-
community variation in both livelihood strategy and the degree to which local
economies rely upon forest conversion into agricultural land (Newton et al. in press).
Households and communities enrolled in a PES programme designed to avoid small-
scale deforestation will therefore incur variable opportunity costs, depending on the
extent to which their behaviour must change in order to ensure PES compliance.
Here we consider how local heterogeneity in economic or livelihood factors affects the
effectiveness of undifferentiated payment structures in a PES programme designed to
reduce rates of primary forest conversion. As a case study, we examined the Bolsa
Floresta (Forest Conservation Allowance), an extensive PES programme established
across extractive reserves within Amazonas, the largest Brazilian state. Bolsa Floresta
(BF) began in 2007 and provides compensation to traditional populations for ES
flowing from primary forest retention, in the form of cash payments and developmental
support. The BF programme explicitly suppresses clearance of primary forest areas,
limiting agricultural expansion to the extent of previously available roçados (swidden
fields) and capoeira (secondary forest). With 7,190 households enrolled across 15
reserves to date, and an ambitious projected expansion into other reserves, BF
represents one of the largest-scale PES programmes implemented in a tropical forest
region (FAS 2011a). Like many PES in developing countries, BF is a hybrid
programme, mixing government and user financing (via international agencies, private
investors and NGOs) with local, NGO-based administration.
Heterogeneity in livelihood strategies of actors voluntarily enrolled in PES programmes
with undifferentiated payment structures may result in reduced social and environmental
benefit, when payments do not adequately exceed opportunity costs, or are inefficiently
spent on areas with low expected additionality. Within agricultural communities, the
opportunity costs of prohibited primary forest conversion depend heavily on the
availability of existing swidden fields and secondary-forest patches. For example,
compared to newly-established communities, older communities may have a greater
pool of surrounding secondary-forest to draw upon as a result of previous cycles of
swidden/fallow agriculture. Conversely, the largest communities may have saturated all
of the forest (primary and secondary) within a viable travel distance. Each of these
scenarios would lessen the likelihood of primary forest clearance in the absence of PES
payments, with a lower associated opportunity cost of foregone primary forest
conversion.
Chapter 6: Payments for environmental services
135
We assessed the potential scope of BF payments based on pre-PES livelihoods and
incomes, using data obtained across two large extractive reserves in western Brazilian
Amazonia. We explored the relative economic impact of BF compliance on recipients‟
incomes, and discuss the likelihood of the programme achieving its goals.
6.3 Methods
6.3.1 The Bolsa Floresta PES programme
The Bolsa Floresta is a voluntary PES programme that grants financial compensation to
individual households and communities in exchange for a commitment to zero
conversion of primary forest (Viana 2008). Deforestation in this region is largely driven
by chainsaw-operated clearance of small (0.1 – 6.6 ha, in our study area) patches of
primary, upland (terra firme) forest to cultivate food crops – primarily manioc, which is
the staple source of carbohydrates in Amazonia. Annual monitoring of deforestation
inside reserves is performed by partnering institutions using a combination of site
inspections and satellite images. All residents of participating reserves are actively
invited to enrol in the programme.
BF offers compensation at four different levels that can be accessed simultaneously by
participating communities. Bolsa Floresta Familiar (BFF) is a monthly payment of
R$50 (~ USD 30) awarded to individual families. Equal payments are awarded to all
enrolled households, regardless of the extent of intended avoided primary forest
conversion. In addition, two different compensation grants can be accessed at the
community level. Bolsa Floresta Renda (BFR) supports alternative income-generating
activities that do not rely on deforestation, including fishing and the extraction of non-
timber forest products such as natural oils, fruit, and honey. Enrolled communities are
awarded through development support averaging R$4,000 (~ USD 2,560) per
community per year (based on an average community size of 11.4 households). The
second community-level support programme, Bolsa Floresta Social (BFS), offers
enrolled communities a range of development infrastructure; also averaging an annual
cash reward of R$4,000 per community, this grant funds improvements in water
sanitation, basic education, health, communication, and transport (Viana 2008). Finally,
Bolsa Floresta Associação (BFA) supports the political organisation and cooperatives of
residents‟ associations active within each protected area. The BFA is calculated as 10%
of the aggregate value of all BFFs within a given extractive reserve and provides
logistical support to local leaders to promote social justice and guard the interests of
Chapter 6: Payments for environmental services
136
reserve residents. The benefit of the BFA is thus effectively divided evenly across all
enrolled communities within a target reserve. This study considers all four components,
although we focus on the BFF because this is the largest cash payment to individual
families.
6.3.2 Study site
This study was conducted within the context of a 3-year, interdisciplinary research
project aiming to understand the dynamics of extractive practices within multiple-use
Amazonian forest reserves. The study was conducted within and around two contiguous
extractive reserves: the federally-managed Médio Juruá Extractive Reserve (hereafter,
ResEx Médio Juruá) and state-managed Uacari Sustainable Development Reserve
(hereafter, RDS Uacari) (Fig. 6.1). The reserve complex is bisected by the Juruá River,
a large white-water tributary of the Amazon (Solimões) River in the state of Amazonas,
Brazil. A wide band of seasonally-flooded (várzea) forests along the main river channel
is inundated between January and June, whilst terra firme forests on higher elevation
are never flooded. The elevation is 65–170 m above sea level and the terrain is flat or
undulating.
The ResEx Médio Juruá and RDS Uacari were decreed in 1997 and 2005, respectively,
and are currently inhabited by some 4,000 legal residents distributed across
approximately 60 settlements of between 1 and 89 households (mean ± SD = 10.3 ±
13.2, median = 7, N = 50). Household occupancy was also extremely variable (mean ±
SD = 7.0 ± 3.0, range = 1 - 17, N = 179). Most communities are located along the main
river channel, while others are settled on the banks of tributaries and oxbow lakes on
either side of the Juruá River. Reserve residents variously engage in agricultural,
extractive and fishing activities for both subsistence and cash income (SDS 2010). We
collected socioeconomic data from 181 households across eight communities in the
ResEx Médio Juruá, 17 communities in the RDS Uacari, and two communities
immediately outside these reserves, all of which were located along a 380-km section of
the Juruá River (Fig. 6.1).
Currently, only residents of the RDS Uacari qualify for the BF programme, since the
programme has yet to be implemented in the ResEx Médio Juruá. However, to explore
the range of household and community livelihoods and economies, we consider data
from both reserves, because the geographic, sociopolitical and economic conditions
faced by residents of the ResEx Médio Juruá are essentially identical. De facto reserve
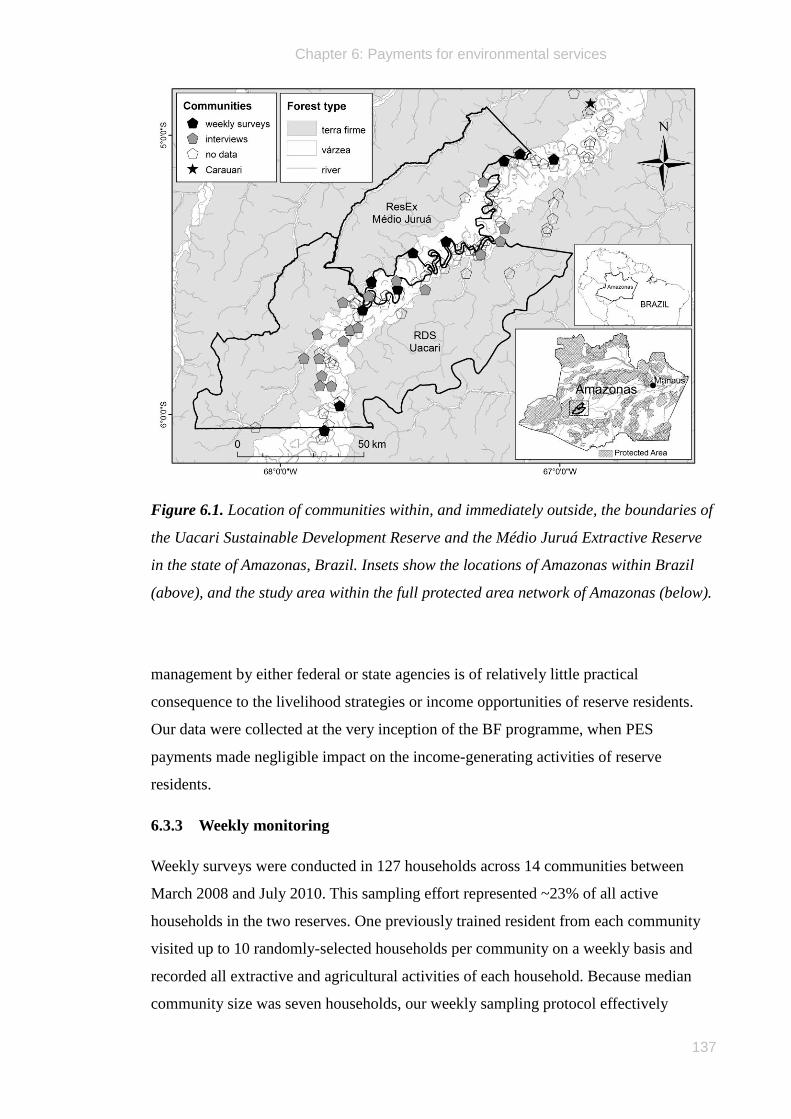
Chapter 6: Payments for environmental services
137
Figure 6.1. Location of communities within, and immediately outside, the boundaries of
the Uacari Sustainable Development Reserve and the Médio Juruá Extractive Reserve
in the state of Amazonas, Brazil. Insets show the locations of Amazonas within Brazil
(above), and the study area within the full protected area network of Amazonas (below).
management by either federal or state agencies is of relatively little practical
consequence to the livelihood strategies or income opportunities of reserve residents.
Our data were collected at the very inception of the BF programme, when PES
payments made negligible impact on the income-generating activities of reserve
residents.
6.3.3 Weekly monitoring
Weekly surveys were conducted in 127 households across 14 communities between
March 2008 and July 2010. This sampling effort represented ~23% of all active
households in the two reserves. One previously trained resident from each community
visited up to 10 randomly-selected households per community on a weekly basis and
recorded all extractive and agricultural activities of each household. Because median
community size was seven households, our weekly sampling protocol effectively
Chapter 6: Payments for environmental services
138
captured most households within a given settlement. Each week, this trained resident
(household monitor) questioned a senior household member about three types of cash-
income activities: i) cultivation of agricultural products; ii) extraction of plant forest
resources; and iii) fishing. For each activity, the household-scale quantities of all
resources collected or produced were recorded, together with the transaction values of
traded goods. We analysed data from all households for which data acquisition included
at least 40 weeks spread over a period of at least 365 consecutive days, resulting in a
subset of 82 households from 10 communities (mean number of weekly samples per
household = 66.6 ± 10.3). Other households sampled (N = 45) failed to capture a full
year-round seasonality cycle, and were therefore excluded from the analyses. All
monetary values are reported in Brazilian Reais (exchange rate R$1 = USD 0.64, June
2011).
6.3.4 One-off interviews
Two modes of voluntary, one-off interviews targeting all 181 households belonging to
27 communities were conducted between June and December 2009. Household
interviews were undertaken with one or more senior members of each household to
document household scale demographic profiles, income and perceptions of the BF
programme (RDS Uacari communities only). Community-level interviews were
conducted with a senior member of each community (usually the locally elected leader)
to document the overall demographic profile, physical geographic setting, infrastructure,
and material assets of each community. Both forms of interviews were structured,
although additional information was recorded on an ad-hoc basis whenever offered.
6.4 Results
6.4.1 Household cash economies
Mean monthly income varied widely between households (R$563 ± 349, N = 82, range
= R$55 – R$1,656 per household). Community-level income, estimated as the sum of
all household incomes and extrapolated to additionally account for those households
that were not surveyed weekly, was also highly variable (R$1,1701 ± 17,880, range =
R$2,722 – R$61,308 per community per month, N = 10). Unsurprisingly, communities
with more households had a higher total community income (r = 0.995, p < 0.001).
Manioc production accounted for 62.3% of all agricultural yield, but varied widely
across households (47.5 ± 50.6 kg, range = 0 – 270.4 kg of manioc per household per
Chapter 6: Payments for environmental services
139
week, N = 82). Production for consumption ranged from 0 to 59.9 kg of processed
manioc per household per week (mean = 14.5 ± 12.1 kg), whilst revenue generated from
sales ranged from R$0 to R$227.72 per household per week (mean = R$29.78 ± 42.25).
Prices per 50-kg sack were relatively stable both temporally and spatially (R$46.11 ±
16.20, N = 1,441 50-kg sacks).
Most interviewed households (139/180; 77.2%) received at least one form of cash state
benefit other than Bolsa Floresta. In particular, 73.3% of households received a Bolsa
Família allowance, which is paid at a rate of R$68 per family plus R$22 per school-
aged child, for up to a maximum of three children. Additionally, 14.4% of households
contained one or more persons (elderly or disabled) in receipt of a state pension, who on
average were paid R$453 per month.
6.4.2 Potential role of Bolsa Floresta payments in household cash economies
The monthly R$50 BFF flat-rate payment to individual households accounted for
between 2.9% and 69.5% of mean monthly income (N = 82, mean ± SD = 11.9 ±
11.1%). In addition, the cash value of community-level grants (BFR and BFS) each
equated to an extra R$29.24 per household per month (R$4,000 per 11.4 households per
year). The per capita value of the set-rate payments of BFF ranged between R$2.9 and
R$50.0 (R$ 9.2 ± 6.5) per month, depending on the number of occupants within the
household. The majority of households (135/180) were in receipt of a higher cash
income from other welfare payments than offered by the direct cash payment of the BFF
(mean ± SD recipient household income per month: from Bolsa Família = R$122 ± 277,
N = 132; from pensions = R$558 ± 210, N = 26).
6.4.3 Livelihood heterogeneity
The relative subsistence and monetary importance of manioc cultivation was highly
variable across households and communities, implying that opportunity costs incurred
in forgoing future cultivation in former primary forest areas varied widely across
individual families and communities. There was a positive correlation between
household size and the number of equally spaced stems of manioc in cultivation (a good
proxy of aggregate crop volume) in neighbouring swidden fields (r = 0.341, N = 171,
pone-tailed < 0.001). Manioc crop size and estimated planted area were strongly correlated
(r = 0.719, N = 22 fields, pone-tailed < 0.001), indicating that larger families tended to
Chapter 6: Payments for environmental services
140
cultivate larger areas, thereby placing correspondingly higher demand on suitable
agricultural land in unflooded terrain.
The proportion of total income represented by manioc agriculture also varied widely
between weekly-surveyed households (mean ± SD = 21.1 ± 22.3%, N = 82). Most
household and community-level variation in manioc cultivation in this swidden
agriculture system was driven by accessibility of surrounding terra firme forest (Newton
et al. in press). Hence, entire terra firme communities tended to engage heavily in
manioc agriculture, with a high level of intra-community congruence in the overall
livelihood of individual households. The proportion of total community income
represented by manioc was accordingly highly variable (range = 0 – 32.6%, mean =
11.2 ± 13.2%, N = 10).
6.4.4 Implications of income heterogeneity for Bolsa Floresta
Households that produced more manioc reported higher total income (r = 0.465, N = 82,
p < 0.001), thereby receiving a lower proportion of their total income from the set-rate
payments of the BFF, compared to households engaged principally in alternative
income-generating activities. The relative contribution of BFF payments to mean
monthly household income was therefore lower for those households more heavily
reliant on agriculture (Fig. 6.2).
6.4.5 Perceptions of opportunity costs
In general, BF participants were positively engaged with the concept of the PES
programme, with 43/45 respondents stating that they supported the programme.
However, six respondents indicated that the fixed value of the payments was too low.
For example, one informant from an upland community commented that “a swidden
field can make much more money [than the monthly R$50 BFF grant]” (interview
number: J183). In contrast, an interviewee from a seasonally-flooded forest community
whose income was principally derived from fishing rather than manioc cultivation
stated that he supported the programme “because I don‟t need to change anything I do
[to qualify for the BFF grant]” (J131). Another highlighted inter-community
heterogeneity, noting that “some [communities] have more secondary forest available
than others” (J184), which permits continued agricultural expansion into secondary
forest, while remaining compliant with BF requirements.
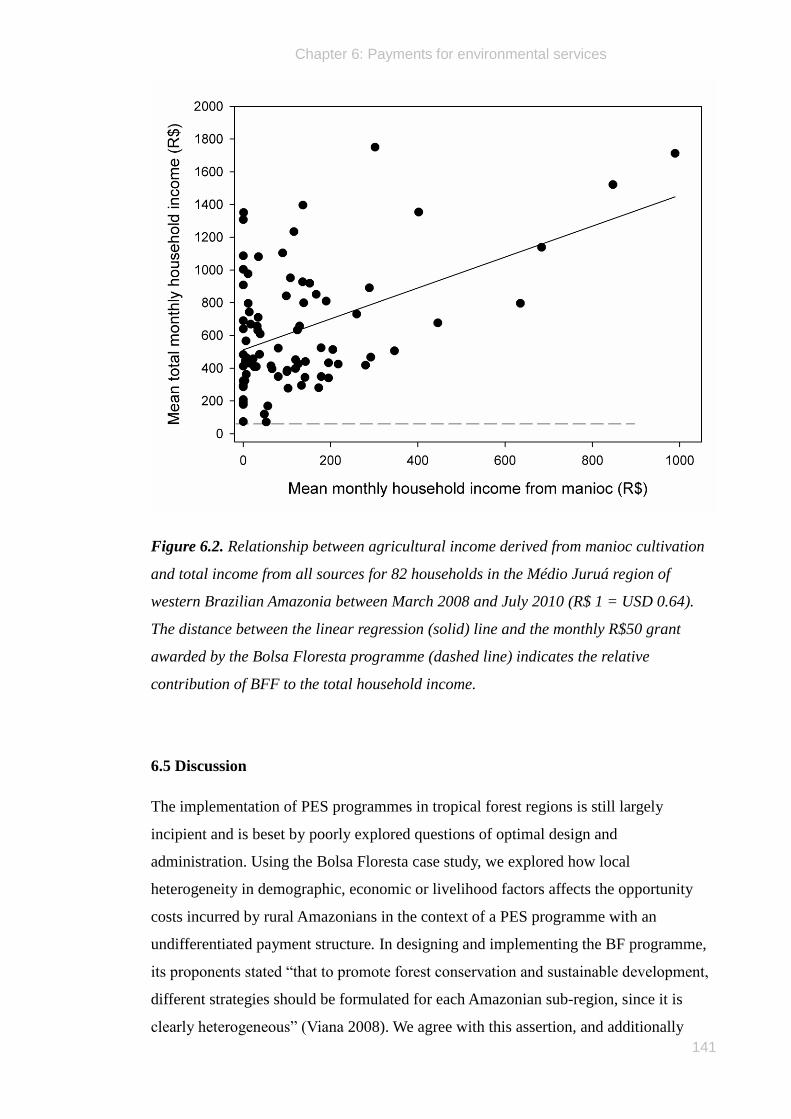
Chapter 6: Payments for environmental services
141
Figure 6.2. Relationship between agricultural income derived from manioc cultivation
and total income from all sources for 82 households in the Médio Juruá region of
western Brazilian Amazonia between March 2008 and July 2010 (R$ 1 = USD 0.64).
The distance between the linear regression (solid) line and the monthly R$50 grant
awarded by the Bolsa Floresta programme (dashed line) indicates the relative
contribution of BFF to the total household income.
6.5 Discussion
The implementation of PES programmes in tropical forest regions is still largely
incipient and is beset by poorly explored questions of optimal design and
administration. Using the Bolsa Floresta case study, we explored how local
heterogeneity in demographic, economic or livelihood factors affects the opportunity
costs incurred by rural Amazonians in the context of a PES programme with an
undifferentiated payment structure. In designing and implementing the BF programme,
its proponents stated “that to promote forest conservation and sustainable development,
different strategies should be formulated for each Amazonian sub-region, since it is
clearly heterogeneous” (Viana 2008). We agree with this assertion, and additionally
Chapter 6: Payments for environmental services
142
highlight the importance of taking into account local and landscape-scale heterogeneity
in incomes and livelihood strategies of PES participants to maximise the value of
conservation programmes while minimising local opportunity costs.
Evidence suggests that the economies of individual households and communities of
tropical forest dwellers vary significantly according to geography and local
demographics (Takasaki et al. 2001; Newton et al. in press). Our data show that
household and community income, family size, and livelihood strategy vary widely
across the two focal reserves. This is likely to contribute to similarly varying
opportunity costs faced by individual actors (households) as they decide to join the BF
programme, or to comply with its zero-primary forest conversion policy following
enrolment.
6.5.1 Cash-payments and development support
BF‟s fixed-value monthly payments to households and communities represented varying
proportions of household-scale cash income. The monthly R$50 BFF payment awarded
to individual families represented between 3.0% and 90.2% of mean monthly household
income. The large variation in household size (1-17 people per household) resulted in
much lower per capita values for the monthly BFF payment for larger families. A
family of two received R$25 per person per month, compared to just R$2.94 per person
per month in a household of 17 people.
In addition to this wide-ranging per capita contribution to household revenues, BFF
represents a lower cash contribution to household incomes relative to other existing
welfare payments. Bolsa Família, for example, is a poverty-alleviation government
subsidy available to all families with a mean monthly income lower than R$140
(Lindert et al. 2007). Most households interviewed received a Bolsa Família grant, with
a mean value of R$122 per month that was 2.5-fold greater than the BFF payment. In
addition, monthly state pensions (for the elderly or disabled) of ~R$453 per entitled
person again accounted for a much higher contribution to recipient households. Whilst
these other forms of welfare support are conceptually and administratively isolated from
the PES programme, recipient households tended to associate them together and
frequently compared the benchmark value of one against the other. In this light, BFF not
only carries a lower cash value than other subsidy programmes, but additionally
demands behavioural changes in cultivation practices that potentially incur a cost far
exceeding its benefit.
Chapter 6: Payments for environmental services
143
Household-level cash payments are just one component of the BF programme, which
also includes reserve-level grants to residents‟ associations (BFA) and community-level
grants for health and education programmes (BFS) and extractive industry infrastructure
(BFR). Translated into monetary worth this represents an estimated annual investment
of R$13,560 to the RDS Uacari (number of enrolled households in September 2010 =
226), plus a mean R$5,193 per community (mean RDS Uacari community size = 7.14
households). These payments effectively increase the benefit to each household to a
total of R$113.48 per month, with the total BF investment thus representing a much
higher proportion of the sum of households‟ annual income (range = 6.5 – 157.6%,
mean = 27.1 ± 25.2%, N = 82).
BF relies on three inter-related collective payments targeting communities or whole
protected areas for avoided primary forest clearance, in addition to individual household
level payments. Enrolled household decisions of whether or not to open a new primary
forest clearing, thereby falling out of compliance with the BF programme, are therefore
modulated by a larger social context, as they can threaten continued community level
payments. As both economic incentives and social norms are important drivers of
individual behaviour, participants who decide to not comply may be exposed to a range
of social pressures that together confer a greater likelihood of adherence to the
programme‟s requirements than financial incentives alone (Chen et al. 2009). Further
research into the interplay between household economies, social norms, and community
power structures will be important in clarifying the principal drivers of behavioural
change (e.g. Sommerville et al. 2010a).
6.5.2 Livelihood options and opportunity costs
Livelihood strategy is a crucial determinant of the pressure that an individual household
or community may place on standing forest. Since manioc production in swidden/fallow
systems is the principal driver of primary forest loss in these reserves, opportunity costs
of participating in BF faced by participants depending heavily on agriculture are higher
than those engaged primarily in fishing or plant extractivism. Within our two focal
reserves, economic specialisation is typical of most households, which derive over half
of their income from either agriculture or extractivism of fish or plant forest products
(Newton et al. in press). Heterogeneity may occur on a community level, with
congruence in livelihood strategy between households within the same community but
considerable variation between communities. Extractive communities in Amazonia are
Chapter 6: Payments for environmental services
144
often located closer to seasonally-flooded (várzea or igapó) forest habitat and often
plant the majority of their crops in cleared várzea forest patches and on fertile beaches
which require no regular clearance of additional forest, since they are annually
replenished by floodwater nutrients. They have a greater reliance on annual crops that
can be harvested within the six-month period during which these areas are above water.
Agricultural communities tend to be sited in upland areas located on oxbow lakes and
tributaries farther from the main river channel. These communities also tend to be larger
than extractive communities and swidden fields in these terra firme areas require fallow
periods of over 3 years between successive crops; two factors that result in a higher
demand for cleared forest areas. In this system, payments to households within
communities surrounded by seasonally-flooded forest are far less effective than
payments to households within communities embedded in terra firme forest. Extractive
households place the least pressure on primary forest, yet receive an equal value of
reward (Fig. 6.3).
We show that those households and communities that derive the highest incomes from
manioc agriculture (as opposed to plant extractivism, fishing or other agricultural
yields) are also those that generate the largest overall cash incomes. As a consequence,
the relative value of BF payments is lower for these households. Therefore, ironically,
heavily agricultural households, whose behaviour the BF programme specifically aims
to alter, receive the lowest financial incentives from its introduction.
Finally, if a PES programme precludes an economic activity it should consider the
substitute income-generating activities available, since it is usually easier for some
households to adapt than others. The opportunity costs incurred by a given household
reflect not just the proportion of income provided by PES compensations, but the
availability of income-generating activities that do not demand new forest clearance
(Fig. 6.3). Terra firme forests in our study landscape tend to have lower natural densities
of frequently marketed non-timber forest products (e.g. Hevea spp. rubber, Carapa
guyanensis oilseeds etc.). This poses additional questions for the appraisal of the
economic viability of alternative income-generating extractive activities that can be
pursued within relatively undisturbed forests.
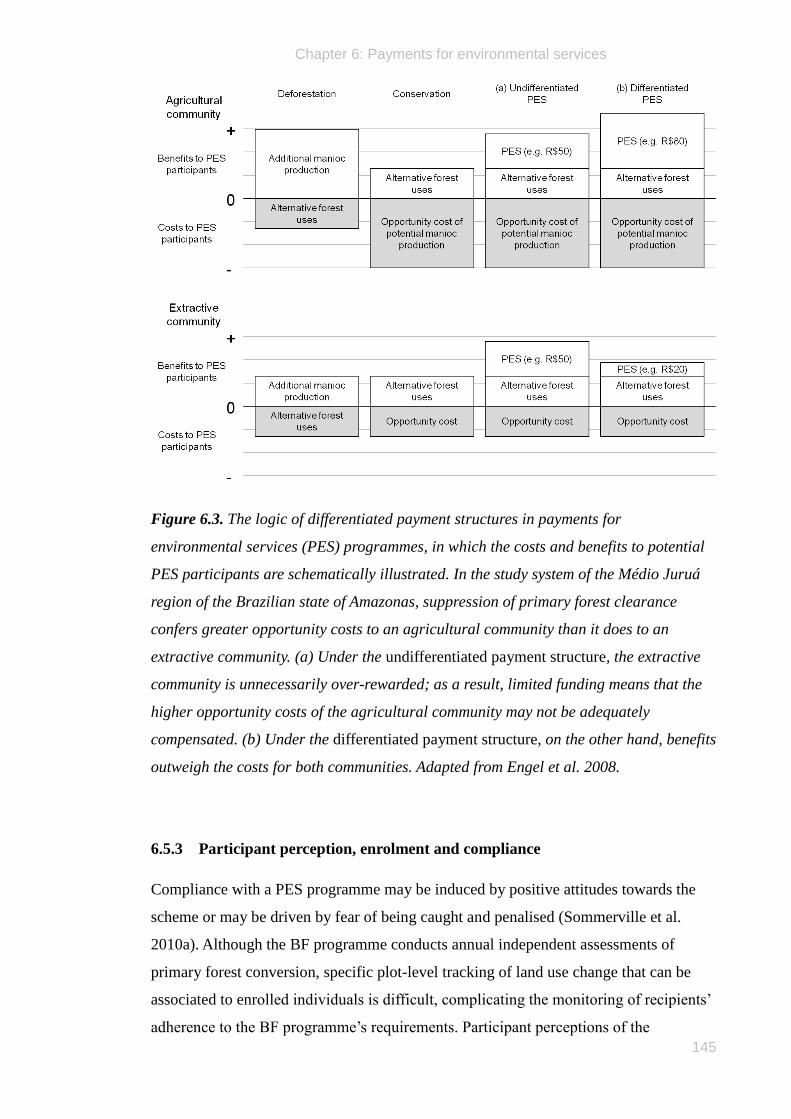
Chapter 6: Payments for environmental services
145
Figure 6.3. The logic of differentiated payment structures in payments for
environmental services (PES) programmes, in which the costs and benefits to potential
PES participants are schematically illustrated. In the study system of the Médio Juruá
region of the Brazilian state of Amazonas, suppression of primary forest clearance
confers greater opportunity costs to an agricultural community than it does to an
extractive community. (a) Under the undifferentiated payment structure, the extractive
community is unnecessarily over-rewarded; as a result, limited funding means that the
higher opportunity costs of the agricultural community may not be adequately
compensated. (b) Under the differentiated payment structure, on the other hand, benefits
outweigh the costs for both communities. Adapted from Engel et al. 2008.
6.5.3 Participant perception, enrolment and compliance
Compliance with a PES programme may be induced by positive attitudes towards the
scheme or may be driven by fear of being caught and penalised (Sommerville et al.
2010a). Although the BF programme conducts annual independent assessments of
primary forest conversion, specific plot-level tracking of land use change that can be
associated to enrolled individuals is difficult, complicating the monitoring of recipients‟
adherence to the BF programme‟s requirements. Participant perceptions of the
Chapter 6: Payments for environmental services
146
programme may therefore be a critical indicator of its likely success in the medium and
long-term.
Ad-hoc comments made by interviewees, and those surveyed elsewhere, indicate that
many recipients believe the value of the BFF payments to be too low (FAS 2011b).
The minimum production of manioc flour (farinha) must be sufficient to feed all
household members on a year-round basis. Smaller households therefore require smaller
cleared areas to meet their basic subsistence needs, but also have lower demand and a
reduced labour supply to clear-cut large forest areas for commercial production of
manioc. In our study area, there was a linear relationship between household size and
the area of former terra firme forest cleared for manioc monoculture. Larger households
are therefore likely to place the highest pressure on standing terra firme forest, yet
receive the lowest per capita compensation for agreeing not to do so. While our data are
insufficient to quantify whether households more heavily reliant on farinha production
were more dissatisfied with the value of the BFF payments, anecdotal evidence
indicates this to be a widespread concern within our focal reserves across both enrolled
and non-enrolled households.
6.5.4 Undifferentiated distribution of PES compensation
The undifferentiated payment structure of the Bolsa Floresta PES programme
minimises transaction costs in a spatially extensive and logistically challenging project
that pays hundreds of enrolled households across multiple conservation units. However,
this programme structure may ultimately cap the effectiveness of the BF programme. If
the value of PES compensation reflected the degree to which households depend on
primary forest clearance, the payments might be more effective in influencing the
behaviour of their recipients (Fig. 6.3).
Most undifferentiated PES programmes implement their payments according to the total
land area committed to the programme by the enrolled landowner. The Socio Bosque
programme in Ecuador awards payments of up to USD 30 per ha per year to farmers
based on the area of forest that they preserve (Chíu 2009). Similarly, the programme at
Los Negros in Bolivia rewards PES participants with one bee-hive per 10 ha of forest
protected per year (Asquith et al. 2008). Since land within Amazonian extractive
reserves is not actually owned by reserve residents, who are instead granted long-term
usufruct rights of the reserve territory, determining payments directly on the basis of
area is not a simple option. However, this in itself does not present an absolute barrier to
Chapter 6: Payments for environmental services
147
the development of differentiated payments and the relative opportunity costs of
enrolled PES participants can be assessed in alternative ways (Pagiola 2008).
Differentiated payment structures may bring significant efficiency benefits by
employing spatially-explicit rates that are tailored to the variable ES provision potential
and opportunity costs of different forest landscapes (Wunder 2005; Chen et al. 2010).
Such spatially targeted payments have been successful in a range of existing forest PES
schemes involving retention of carbon stocks or hydrological services. For instance, the
PSAH programme in Mexico pays a per hectare rate to enrolled landowners, with
higher rates in areas where the value of the ES provided is considered to be higher
(Muñoz-Piña et al. 2008). The Vittel PES programme discriminates four groups of
landowners, each with unique opportunity costs to PES compliance (Perrot-Maître
2006). Whilst administratively more complex, such an approach may enhance the
likelihood of distributing limited funds in a manner most likely to achieve the maximum
return in terms of forest protection (Wünscher et al. 2008). Conversely, undifferentiated
payment structures risk economic inefficiency, with many payments being directed at
low deforestation-risk landowners (Fig. 6.3).
Our data suggest that there is high potential for BF payments to be distributed across
households and communities that are unlikely to contribute to additionality of avoided
deforestation in this system, at least in the short-term (May and Millikan 2010). One
means to achieve a more efficient distribution of funding might be to develop a
conditional metric by which to assign BF payments to single households or
communities. While a community-level assessment of the location, abundance,
ownership, and land tenure system associated with secondary forest areas available to
expand manioc cultivation would have the highest likelihood of achieving true
additionality in avoided deforestation, the transaction costs of such a programme are
likely to be prohibitively high. Here we propose two proxies relying on simple
household-level interviews that can achieve a large degree of conditionality.
A demographically-adjusted payment structure would help to lessen the variation in per
capita value of BFF payments. Although households are the fundamental unit for
resource-use decision-making, household traits are rarely considered in determining
opportunity costs (Chen et al. 2010). Community payments already acknowledge
demographic heterogeneity by calculating the value of the BFR and BFS according to
the size of the recipient community. Extending the same logic to take account of

Chapter 6: Payments for environmental services
148
household size for BFF payments would also reduce inter-household variability in per
capita payment values. Other subsidies, such as the Bolsa Família grant, already take
account of varying family size by adjusting payments in proportion to the number of
school-age children. Of the 180 households we surveyed, 73% were already receiving
Bolsa Família, which was implemented nationwide, implying that the data required to
adjust payments by family size are already available.
A livelihood-adjusted payment structure could be applied in systems where the
relationship between opportunity costs and land-use in different habitat types can be
approximated (Fig 6.3). Explicit accounting of the pressure of individual households to
clear new forest areas can be used as a proxy for opportunity cost. The strong
household-scale relationship between farinha production and the number of manioc
stems planted in swidden fields or the area of these fields (Newton et al. in press) can
act as such a proxy in this system. These data can be more readily obtained from a
single interview, and in our experience can be accurately quantified by most senior
members of households.
The availability of terra firme and seasonally-inundated várzea forest within the
immediate vicinity of a community is the strongest determinant of household-scale
livelihood strategies within Amazonian reserves (Newton et al. in press). Alternatively,
therefore, landscape structure and composition can be readily assessed using satellite
imagery, thus serving as a straightforward and objective proxy of livelihood pattern.
This fails to consider variation in secondary-forest availability, which may be a key
determinant of opportunity costs, but even suboptimal payment differentiation is
demonstrably more efficient than complete undifferentiation (Chen et al. 2010).
A number of factors can reduce the desirability of a conditional approach in a PES
programme such as BF. The first of these is the fundamental question of whether
payments are acting solely as financial incentives to discourage primary forest
conversion, or also as a reward for those who have sustained forest permanence over the
years (May and Millikan 2010). This question applies both to entire protected areas and
to individual households. Many of the sustainable development reserves targeted by BF
are under little immediate deforestation pressure (INPE 2011), and we have argued that
many households within a given reserve may not engage in forest clear-cutting for
manioc agriculture. Such households pose a minimal threat to forest cover, so are
perhaps not immediate candidates for incentive-based mechanisms that compensate for

Chapter 6: Payments for environmental services
149
the opportunity cost of avoiding primary forest clearance. Their behaviour is unlikely to
be altered by anti-deforestation financial payments, which must be interpreted either as
economic inefficiency or as a reward for maintaining forest cover rather than an
incentive not to diminish it.
Secondly, whilst PES is fundamentally concerned with ES conservation, many PES
programmes, including BF, promote development goals as a secondary but core
aspiration. Poverty alleviation and socioeconomic development goals may not track
local variation in the ecological effectiveness of payments, and indeed may demand the
undifferentiated distribution of financial and practical investment across all individuals
within a system, for reasons of social equity and perceived fairness (Sommerville et al.
2010b). However, such social equity goals may eventually undermine the efficacy of
PES programmes in achieving their conservation goals (Pagiola et al. 2005; Wunder
2008).
Finally, a possible pitfall of a conditional approach can result from non-qualifying
households or communities that may realign their behaviour to become qualified for
PES, but in a manner detrimental to ES provision. For example, a household with no
previous history of manioc cultivation in terra firme areas could clear a field in order to
claim compensatory benefits or a community considering where to resettle in the
imminent future may be influenced by geographic variables that determine their
qualification for PES payments.
Wunder et al. (2008) note that other government-financed programmes are moving
away from undifferentiated payment structures in order to account for local
heterogeneity in land use practices. Developing differentiated payment systems based
on individual opportunity costs, whilst maintaining the benefits of a large-scale
programme, could considerably strengthen the likelihood of BF and other PES
programmes achieving their goals (Fig. 6.3; Wünscher et al. 2008).
6.5.5 Conclusions
Bolsa Floresta is a pioneer and ambitious PES programme that aims to curb
deforestation within Amazonian extractive reserves. However, its success is contingent
upon inducing behavioural change in those enrolled; a process which the programme is
catalysing by paying resident families an average 12% of their mean annual income
whilst providing financial and practical support to community development projects.
Chapter 6: Payments for environmental services
150
Here we draw attention to the economic inequality that an undifferentiated payment
structure may create given the large variation in family size, household income,
livelihood strategy and settlement geography – particularly in the degree to which
different families engage with manioc agriculture. Households and communities pose
varying degrees of threat to primary forest integrity and face unequal opportunity costs.
The current system of compensatory payments thus results in heterogeneous impacts on
recipients‟ economies and on their willingness to adhere to the programme‟s
requirements. Addressing such challenges in the design and implementation of
community-based PES interventions will be critical to the fine-tuning of BF and the
development of other PES programmes in tropical forest regions. More broadly, PES
programmes should consider this variability in determining the most effective means by
which to modulate land-use practices of programme recipients.
6.6 References
Asquith, N.M., Vargas, M.T., Wunder, S., 2008. Selling two environmental services: in-
kind payments for bird habitat and watershed protection in Los Negros, Bolivia.
Ecological Economics 65, 675-684.
Boyd, J., Banzhaf, S., 2007. What are ecosystem services? The need for standardized
environmental accounting units. Ecological Economics 63, 616-626.
Chen, X.D., Lupi, F., He, G.M., Liu, J.G., 2009. Linking social norms to efficient
conservation investment in payments for ecosystem services. Proceedings of the
National Academy of Sciences of the United States of America 106, 11812-11817.
Chen, X.D., Lupi, F., Vina, A., He, G.M., Liu, J.G., 2010. Using cost-effective targeting
to enhance the efficiency of conservation investments in payments for ecosystem
services. Conservation Biology 24, 1469-1478.
Chhatre, A., Agrawal, A., 2009. Trade-offs and synergies between carbon storage and
livelihood benefits from forest commons. Proceedings of the National Academy of
Sciences of the United States of America 106, 17667-17670.
Chìu, M.A., 2009. Implementing REDD: the Socio Bosque programme. Ministry of
Environment. Government of the Republic of Ecuador, Bonn.
Chapter 6: Payments for environmental services
151
Coomes, O.T., 2004. Rain forest 'conservation-through-use'? Chambira palm fibre
extraction and handicraft production in a land-constrained community, Peruvian
Amazon. Biodiversity and Conservation 13, 351-360.
Engel, S., Pagiola, S., Wunder, S., 2008. Designing payments for environmental
services in theory and practice: an overview of the issues. Ecological Economics 65,
663-674.
FAS, 2011a. Fundação Amazonas Sustentável. URL http://www.fas-amazonas.org.
FAS, 2011b. Fundação Amazonas Sustentável: relatório de pesquisa de opinião. URL
http://www.fas-amazonas.org/pt/useruploads/files/apresenta%C3%87%C3%83o_
resultado_geralx.pdf.
Fisher, B., Turner, R.K., Morling, P., 2009. Defining and classifying ecosystem services
for decision making. Ecological Economics 68, 643-653.
INPE, 2011. Instituto Nacional de Pesquisa Espacais. Projeto PRODES: monitoramento
da floresta Amazônica Brasileira por satélite. URL
http://www.obt.inpe.br/prodes/index.html.
Lindert, K., Linder, A., Hobbs, J., de la Brière, B., 2007. The nuts and bolts of Brazil's
Bolsa Família programme: implementing conditional cash transfers in a decentralized
context. SP Discussion Paper. The World Bank, Washington.
Liu, S., Costanza, R., Farber, S., Troy, A., 2010. Valuing ecosystem services: theory,
practice, and the need for a transdisciplinary synthesis. In: Ecological Economics
Reviews. pp. 54-78. Blackwell Publishing, Oxford.
Long, J., 2010. Making ends meet: conservation and forest dependency in Peru. Student
Conference for Conservation Science, American Museum of Natural History, New York.
URL http://symposia.cbc.amnh.org/sccsny-vid/long.php.
May, P.H., Millikan, B., 2010. The context of REDD+ in Brazil: drivers, agents and
institutions. Center for International Forestry Research, Bogor.
Meijerink, G., 2007. The role of measurement problems and monitoring in PES
schemes. In: Dellink, R.B., Ruijs, A. (Eds.). Economics of Poverty, Environment and
Natural Resource Use. Springer, Berlin.
Chapter 6: Payments for environmental services
152
Muñoz-Piña, C., Guevara, A., Torres, J.M., Braña, J., 2008. Paying for the hydrological
services of Mexico's forests: analysis, negotiations and results. Ecological Economics
65, 725-736.
Nelson, F., Foley, C., Foley, L.S., Leposo, A., Loure, E., Peterson, D., Peterson, M.,
Peterson, T., Sachedina, H., Williams, A., 2010. Payments for ecosystem services as a
framework for community-based conservation in northern Tanzania. Conservation
Biology 24, 78-85.
Newton, P., Whaldener, E., Peres, C.A. In press. Determinants of livelihood strategy
variation in two extractive reserves in Amazonian flooded and unflooded forests.
Environmental Conservation.
Pagiola, S., 2008. Payments for environmental services in Costa Rica. Ecological
Economics 65, 712-724.
Pagiola, S., Arcenas, A., Platais, G., 2005. Can payments for environmental services
help reduce poverty? An exploration of the issues and the evidence to date from Latin
America. World Development 33, 237-253.
Perrot-Maître, D., 2006. The Vittel payments for ecosystem services: a “perfect” PES
case? International Institute for Environment and Development, London, UK.
Redford, K.H., Adams, W.M., 2009. Payment for ecosystem services and the challenge
of saving nature. Conservation Biology 23, 785-787.
Rudel, T.K., Defries, R., Asner, G.P., Laurance, W.F., 2009. Changing drivers of
deforestation and new opportunities for conservation. Conservation Biology 23, 1396-
1405.
SDS, 2010. Plano de gestão da Reserva de Desenvolvimento Sustentavel de Uacari.
Série Técnica Planos de Gestão. Secretaria de Estado do Meio Ambiente e
Desenvolvimento Sustentàvel, Carauari.
Sommerville, M., Jones, J.P.G., Rahajaharison, M., Milner-Gulland, E.J., 2010b. The
role of fairness and benefit distribution in community-based payment for environmental
services interventions: a case study from Menabe, Madagascar. Ecological Economics
69, 1262-1271.
Chapter 6: Payments for environmental services
153
Sommerville, M., Milner-Gulland, E.J., Rahajaharison, M., Jones, J.P.G., 2010a. Impact
of a community-based payment for environmental services intervention on forest use in
Menabe, Madagascar. Conservation Biology 24, 1488-1498.
Sommerville, M. M., J. P.G. Jones, and E.J. Milner-Gulland. 2009. A revised conceptual
framework for payments for environmental services. Ecology and Society 14, 34. URL:
http://www.ecologyandsociety.org/vol14/iss2/art34/.
Takasaki, Y., Barham, B.L., Coomes, O.T., 2001. Amazonian peasants, rain forest use,
and income generation: the role of wealth and geographical factors. Society and Natural
Resources 14, 291-308.
van der Werf, G.R., Morton, D.C., DeFries, R.S., Olivier, J.G.J., Kasibhatla, P.S.,
Jackson, R.B., Collatz, G.J., Randerson, J.T., 2009. CO2 emissions from forest loss.
Nature Geoscience 2, 829-829.
Viana, V., 2008. Bolsa Floresta (Forest Conservation Allowance): an innovative
mechanism to promote health in traditional communities in the Amazon. Estudos
Avançados 22, 64.
Wunder, S., 2005. Payments for environmental services: some nuts and bolts. Center for
International Forestry Research, Bogor.
Wunder, S., 2007. The efficiency of payments for environmental services in tropical
conservation. Conservation Biology 21, 48-58.
Wunder, S., 2008. Payments for environmental services and the poor: concepts and
preliminary evidence. Environment and Development Economics 13, 279-297.
Wunder, S., Albán, M., 2008. Decentralized payments for environmental services: the
cases of Pimampiro and PROFAFOR in Ecuador. Ecological Economics 65, 685-698.
Wunder, S., Engel, S., Pagiola, S., 2008. Taking stock: a comparative analysis of
payments for environmental services programs in developed and developing countries.
Ecological Economics 65, 834-852.
Wünscher, T., Engel, S., Wunder, S., 2008. Spatial targeting of payments for
environmental services: a tool for boosting conservation benefits. Ecological Economics
65, 822-833.

154
Chapter 7
Concluding remarks
Photo: Juruá River
Chapter 7: Concluding remarks
155
7.1 Key findings
For over two decades, considerable academic, governmental, and NGO attention has
focused on management strategies that help alleviate poverty and improve the
socioeconomic wellbeing of tropical forest-dwellers whilst conserving the biodiversity
and environmental services associated with those forests. This thesis examined some of
the costs and benefits of two mechanisms that aim to achieve these dual goals – the
commercialisation of non-timber forest products (NTFPs) and payments for
environmental services (PES) programmes. We assessed the potential contribution of
these two mechanisms to rural economies and forest conservation, within the context of
the extractive forest reserve land-tenure system.
The first major finding of this thesis is that, even within a single site, there may be
considerable variation in the livelihood strategy and the extent of forest-dependency of
rural Amazonians. Forest extractivism, agriculture and fishing were important to all
households, but significant variation existed in their engagement with income-
generating activities. Much of this variation was attributed to the accessibility of
permanently-unflooded land suitable for perennial agriculture, which was manifested in
the congruence in livelihood strategies within communities but high variation between
communities. Different groups of forest-dwellers, even those sharing the same forest
reserve, thus place unequal demands and pressures on forest resources. These
differences need to be considered when implementing conservation and development
initiatives.
Secondly, this thesis found heterogeneity in the spatial distribution, size structure and
harvest yields of the neotropical tree genus, Copaifera, which is valued for its medicinal
oleoresin. Variation between congeners and between forest types affected the degree to
which this resource was accessible and determined the potential for commercial
harvesting. Considering the effects both of spatial scales and of environmental
determinants is fundamental to the management of non-timber forest resources.
Thirdly, this thesis showed that programmes that aim to conserve environmental
services by financially compensating rural people to avoid undesirable land-use
practices may benefit from a careful consideration of programme design in relation to
the opportunity costs of programme participants. Undifferentiated cash payments made
by the Bolsa Floresta programme to Amazonian reserve residents accounted for an
average of 12% of household incomes, but failed to account for the greater costs
Chapter 7: Concluding remarks
156
incurred by households that were more heavily dependent on agrarian than extractive
activities.
A final key finding, recurrent throughout the study, was the heterogeneity in resource
availability and utilisation between the two main forest types of western Amazonia:
terra firme and várzea. Livelihood strategies, NTFP distribution, harvest yields, resource
accessibility, and opportunity costs of altered land-use behaviour all varied significantly
between these two forest types. Ecological differences between terra firme and várzea
forests have been previously well-documented, but the implications of these differences
for forest-dependency and environmental policy have not been as clearly emphasised.
The spatial configuration of forest types in the neighbourhood of Amazonian
communities is therefore a key determinant of the likely impact of conservation and
development policy.
7.2 Conservation and extractivism in Amazonia
This study focused on western Brazilian Amazonia, which contains the world‟s largest
remaining tract of intact primary tropical forest. This region remains relatively free of
many of the pressures – cattle-ranching, soya cultivation, road-building, and fires – that
threaten the forests in southern and eastern Amazonia. Conservation strategies within
that „arc of deforestation‟ aim to minimise or reduce the impacts of these pressures,
conserving biodiversity and environmental services within a heavily human-modified
landscape (Peres et al. 2010). It has been argued that because deforestation is driven
much more by urban population growth and commercial agriculture than by rural
communities, measures to reduce pressures on forests by rural populations will be of
little effect in addressing the main causes of forest loss (DeFries et al. 2010). However,
the future of even relatively intact forest regions is far from certain, and there is a strong
case to be made for putting systems in place now to secure those forest areas against
inevitable future pressures (Soares-Filho et al. 2006). Contemporary conservation and
development programmes may help to forge strong allegiances between rural forest
users and management agencies, which could act as a powerful barrier to shifting
deforestation frontiers. By ingraining the ideas of forest conservation psychologically,
physically, and economically now, inhabited protected areas are much more likely to
constitute an effective conservation force in the future. To focus attention entirely on
those areas most impacted by current deforestation whilst ignoring intact forest areas
would be to take a considerable risk.
Chapter 7: Concluding remarks
157
7.2.1 Extractive reserves
Extractive reserves are an integral part of implementing this conservation strategy
within Brazilian Amazonia. With 41.8% of the state of Amazonas now designated as
legally-inhabited protected areas, the future of forests within this region is intricately
associated with the success of the extractive reserve concept. Reserves inhibit
deforestation and fire, and their creation is a fundamental step in the conservation
process (Nepstad et al. 2006; Oliveira et al. 2007). However, designation alone is
insufficient since park effectiveness correlates with basic management activities and a
protected area may exist as little more than a „paper park‟ – with little on-the-ground
enforcement (Peres and Terborgh 1995; Bruner et al. 2001). The extractive reserve
network is thus the foundation upon which successful management strategies need to be
built, providing the necessary administrative and institutional framework within which
to implement carefully-designed conservation and development programmes (Brown
and Rosendo 2000).
However, the rate and extent of expansion of the reserve network in Amazonia has been
shaped by a combination of political will and land-tenure opportunities, leading to a
complex matrix of reserve types and configurations (Silva 2005). This configuration
may not always optimise management efficiency – for example, our contiguous study
reserves along the Juruá River encompassed the same ecological, physical, and
socioeconomic systems, but were politically and administratively distinct. Separate
management of communities that access the same resources makes little objective sense
and may result in inequality – for example, in opportunities to engage in PES
programmes. By considering the wider landscape, studies such as this may help to
achieve greater management efficiency.
7.2.2 Non-timber forest product commercialisation
Forest resources are harvested for both subsistence needs and cash income across
tropical forest regions. Many of the ecological and socioeconomic costs and benefits of
commercial NTFP extraction have been well documented (Belcher and Kusters 2004).
The ubiquitous nature of commercial extractivism means that the debate in the academic
literature has necessarily shifted from asking whether NTFP extraction is a good idea
per se, towards asking how forest extractivism can best be managed to meet both
conservation and development goals. Which resources have the greatest potential for
commercialisation, and what the likely economic benefits and ecological costs of
Chapter 7: Concluding remarks
158
harvests may be, are important questions for managers seeking to implement extractive
initiatives. This thesis shows how a holistic appraisal of NTFP potential, which draws
on the spatial ecology, harvest yields, and socioeconomic context of extraction, can be
used to begin to answer some of these questions.
Particularly relevant to the contemporary study of NTFP commercialisation are the
dynamic socioeconomic context of extractivism and the changing nature of markets
available for tropical forest resources. Since this dynamism is removing many of the
traditional barriers to NTFP commercialisation, the economic system within which
resources are traded is increasingly usurping taxonomy as the criterium by which
products are grouped and evaluated. Within our study area, the economic landscape for
commercial NTFP extraction is being rapidly reshaped by reserve residents‟
associations, government subsidies, emerging local markets, trade co-operatives, direct
contracts with end-retailers, NGO training and material support, and PES development
grants. In combination, these support mechanisms could increase the viability and
attractiveness of forest resource extractivism as an income-generating opportunity to
many rural Amazonians.
7.2.3 Payments for environmental services programmes
A growing body of literature has developed increasingly sophisticated methods for
valuing the world‟s natural resources and environmental services (Fisher et al. 2009). At
the same time, the general public in more developed countries has become more
informed and worried about, and prepared to pay for, damage to the world‟s tropical
forests (PRP 2008). In part as a consequence, the prevalence of PES programmes as a
conservation mechanism is growing rapidly and will undoubtedly play a prominent role
in future tropical forest conservation strategies. PES has the potential to effect direct
changes in land-use behaviour, but this research highlights the importance of planning
PES programmes carefully and with transparent intentions.
7.2.4 A synthesis for tropical forest conservation and development
Neither the designation of extractive reserves, nor NTFP commercialisation, nor PES
programmes are likely to emerge as a panacea for tropical forest conservation. Indeed,
no single livelihood option or conservation strategy in any context is ever likely to
provide a straightforward solution, and there has perhaps been too much historical
expectation – particularly in the case of NTFP extraction – for this to be the case. It may
Chapter 7: Concluding remarks
159
be that there are fewer easy income-generating options available to forest-dwellers than
the literature has historically suggested.
This reality does not detract from the contribution that these strategies can make, in
synthesis, to achieving both conservation and development goals. At the most
fundamental level, protected areas, PES programmes, biodiversity conservation, and
livelihood development are inherently compatible aspirations but which conflict with
commercial logging and large-scale agriculture. Therefore, a multi-stranded strategy
that incorporates compensation for allowing intact primary forest to stand (e.g. PES
programmes) coupled with the development of sustainable income-generating activities
that maintain biodiversity and ecosystem services (e.g. NTFP extraction) within the
context of a strong administrative framework (e.g. extractive reserves) may represent a
powerful approach to a complex problem.
7.3 Future directions
7.3.1 Temporal considerations
Although this research used continuous weekly household data collected over a two-
year period – longer than many studies of rural livelihoods – these data still represent a
temporal „snap-shot‟ of the socioeconomic situation in this study site and say relatively
little about longitudinal variation in resource utilisation. This inevitable consequence of
engaging in a short-term project leaves some interesting questions unanswered.
It was shown that livelihood strategies were largely influenced by the physical
characteristics of the environment such as forest type, at least at the coarse division of
agricultural and extractive activities. However, finer scale components of household
subsistence and income-generating activities are likely to be influenced by dynamic
social and economic conditions. NTFP prices may fluctuate as a consequence of
changes in demand, subsidies, or markets. PES programmes actively seek to alter
behaviours and promote more ecologically-benign activities. Local communities grow
as a result of high birth rates but may decline as individuals, families or entire villages
emigrate to urban centres (Parry et al. 2010). Each of these processes was observed even
during the three-year study period, and any one of them may influence the relative
desirability or likelihood of a shift in livelihood strategy. Temporal shifts in income-
generation have been documented in extractive reserves (e.g. Salisbury and Schmink
2007), but most studies rely on respondent recall in semi-structured interviews.
Chapter 7: Concluding remarks
160
Repeated surveys of household resource-use would enable quantification of these
changes over years or decades.
Of relevance to the study of NTFP extraction are doubts concerning the longer-term
ecological consequences of harvests (Peters 1994). Harvest practices may alter
biological processes at the individual, population, community, or ecosystem level, but
there is a paucity of information available on the impacts of resin and oil harvests
(Ticktin 2004). The repeated Copaifera harvests (after one and three years) go some
way towards assessing the sustainability of this resource, but do not conclusively
demonstrate the longer-term replenishment of oleoresin stocks after multiple harvests.
Nor have they accounted for other potentially detrimental consequences of oleoresin
extraction to tree fitness, such as defence or fecundity (e.g. seed crop size and
germination success).
7.3.2 Towards a coherent understanding of extractive systems
This study is just one component of a multi-pronged project aiming to gain a holistic
understanding of the ecology and socioeconomics of extractive systems in intact
tropical forest areas (DEFRA 2011). Different research strands within the same project
framework are currently exploring the floristic composition, forest structure,
ethnobotany, fruit-frugivore interactions, density and distribution of large-vertebrate
taxa (mammalian and avian) and other NTFP resources, and animal protein offtake from
terrestrial vertebrates and fish within the same focal reserves. All of these data-sets are
spatially-explicit and cross-referenced, creating considerable scope for exploring further
questions regarding the agro-extractivist behaviour and resource utilisation of rural
Amazonians, much of which will build upon the research presented in this thesis.
7.3.3 Lessons from multi-site comparisons
This thesis has attempted to relate its results to those of studies elsewhere, serving to
place these data within a wider context. This objective was often impeded by a lack of
comparability between research methods. Where appropriate, data-collection
considerations have been suggested that would enhance comparability of data-sets
across studies. However, this goal is more likely to be achieved by regional or global
coordination to collect data using standardised sampling protocols. By increasing
comparability between sites and systems, common patterns and processes and their
drivers may be identified. Coordinated efforts are growing in prevalence, with the
Chapter 7: Concluding remarks
161
Poverty and Environment Network project (Angelson et al. 2011), Global Comparative
Study on REDD (CIFOR 2011), and RAINFOR plot network (Malhi et al. 2002)
collating data from multiple partners on tropical forest livelihoods, REDD initiatives
and floristic composition, respectively.
7.4 Policy and research dissemination
This study has produced a number of findings which may be of interest to government
agencies responsible for managing these and other extractive reserves, and to NGOs
involved in developing extractive activities and PES programmes in Amazonia. The
most important findings from a management perspective are summarised in the form of
a six-page brief in Portuguese, which has been disseminated to these agencies
(Appendix).
This thesis represents an attempt to understand the role that non-timber forest product
extraction and payments for environmental services programmes may have in
determining opportunities for conservation and livelihoods in Amazonian extractive
reserves. It is my hope that this research can contribute in a small way to the complex
challenge of tropical forest conservation in Amazonia.
“First I thought I was fighting for the rubber tappers, then I thought I was fighting for
the Amazon, then I realised I was fighting for humanity.”
Chico Mendes
7.5 References
Angelson, A., Larsen, H.O., Lund, J.F., Smith-Hall, C., Wunder, S., 2011. Measuring
livelihoods and environmental dependence. Earthscan, Edinburgh, UK.
Belcher, B., Kusters, K., 2004. Non-timber forest product commercialization:
development and conservation lessons. In: Kusters, K., Belcher, B. (Eds.). Forest
products, livelihoods and conservation: case studies of non-timber forest product
systems, pp. 1-22. Center for International Forestry Research, Bogor.
Chapter 7: Concluding remarks
162
Brown, K., Rosendo, S., 2000. Environmentalists, rubber tappers and empowerment:
The politics and economics of extractive reserves. Development and Change 31, 201-
227.
Bruner, A.G., Gullison, R.E., Rice, R.E., da Fonseca, G.A.B., 2001. Effectiveness of
parks in protecting tropical biodiversity. Science 291, 125-128.
CIFOR 2011. Center for International Forestry Research. Global Comparative Study on
REDD. URL: www.forestsclimatechange.org/global-comparative-study-on-redd.html.
DEFRA 2011. Department for Food Environment and Rural Affairs. The Darwin
Initiative Project 16-001: Community-based sustainable management of forest resources
in Amazonian extractive reserves. URL http://darwin.defra.gov.uk/project/16001/.
DeFries, R.S., Rudel, T., Uriarte, M., M., H., 2010. Deforestation driven by urban
population growth and agricultural trade in the twenty-first century. Nature Geoscience
3, 178-181.
Fisher, B., Turner, R.K., Morling, P., 2009. Defining and classifying ecosystem services
for decision making. Ecological Economics 68, 643-653.
Malhi, Y., Phillips, O.L., Lloyd, J., Baker, T., Wright, J., Almeida, S., Arroyo, L.,
Frederiksen, T., Grace, J., Higuchi, N., Killeen, T., Laurance, W.F., Leaño, C., Lewis,
S., Meir, P., Monteagudo, A., Neill, D., Vargas, P.N., Panfil, S.N., Patiño, S., Pitman,
N., Quesada, C.A., Rudas-Ll, A., Salomão, R., Saleska, S., Silva, N., Silveira, M.,
Sombroek, W.G., Valencia, R., Martinez, R.V., Vieira, I.C.G., Vinceti, B., 2002. An
international network to monitor the structure, composition and dynamics of Amazonian
forests (RAINFOR). Journal of Vegetation Science 13, 439-450.
Nepstad, D., Schwartzman, S., Bamberger, B., Santilli, M., Ray, D., Schlesinger, P.,
Lefebvre, P., Alencar, A., Prinz, E., Fiske, G., Rolla, A., 2006. Inhibition of Amazon
deforestation and fire by parks and indigenous lands. Conservation Biology 20, 65-73.
Oliveira, P.J.C., Asner, G.P., Knapp, D.E., Almeyda, A., Galvan-Gildemeister, R.,
Keene, S., Raybin, R.F., Smith, R.C., 2007. Land-use allocation protects the Peruvian
Amazon. Science 317, 1233-1236.
Chapter 7: Concluding remarks
163
Parry, L., Peres, C.A., Day, B., Amaral, S., 2010. Rural-urban migration brings
conservation threats and opportunities to Amazonian watersheds. Conservation Letters
3, 251-259.
Peres, C.A., Gardner, T.A., Barlow, J., Zuanon, J., Michalski, F., Lees, A.C., Vieira,
I.C.G., Moreira, F.M.S., Feeley, K.J., 2010. Biodiversity conservation in human-
modified Amazonian forest landscapes. Biological Conservation 143, 2314-2327.
Peres, C.A., Terborgh, J.W., 1995. Amazonian nature reserves: an analysis of the
defensibility status of existing conservation units and design criteria for the future.
Conservation Biology 9, 34-46.
Peters, C.M., 1994. Sustainable harvest of non-timber plant resources in tropical moist
forest: an ecological primer. Biodiversity Support Program, Washington, DC.
PRP 2008. The Prince‟s Rainforests Project. Lippincott market research programme.
URL: www.rainforestsos.org/wp-content/uploads/pdfs/pr-research-findings.pdf.
Salisbury, D.S., Schmink, M., 2007. Cows versus rubber: changing livelihoods among
Amazonian extractivists. Geoforum 38, 1233-1249.
Silva, M., 2005. The Brazilian protected areas program. Conservation Biology 19, 608-
611.
Soares-Filho, B.S., Nepstad, D.C., Curran, L.M., Cerqueira, G.C., Garcia, R.A., Ramos,
C.A., Voll, E., McDonald, A., Lefebvre, P., Schlesinger, P., 2006. Modelling
conservation in the Amazon basin. Nature 440, 520-523.
Ticktin, T., 2004. The ecological implications of harvesting non-timber forest products.
Journal of Applied Ecology 41, 11-21.
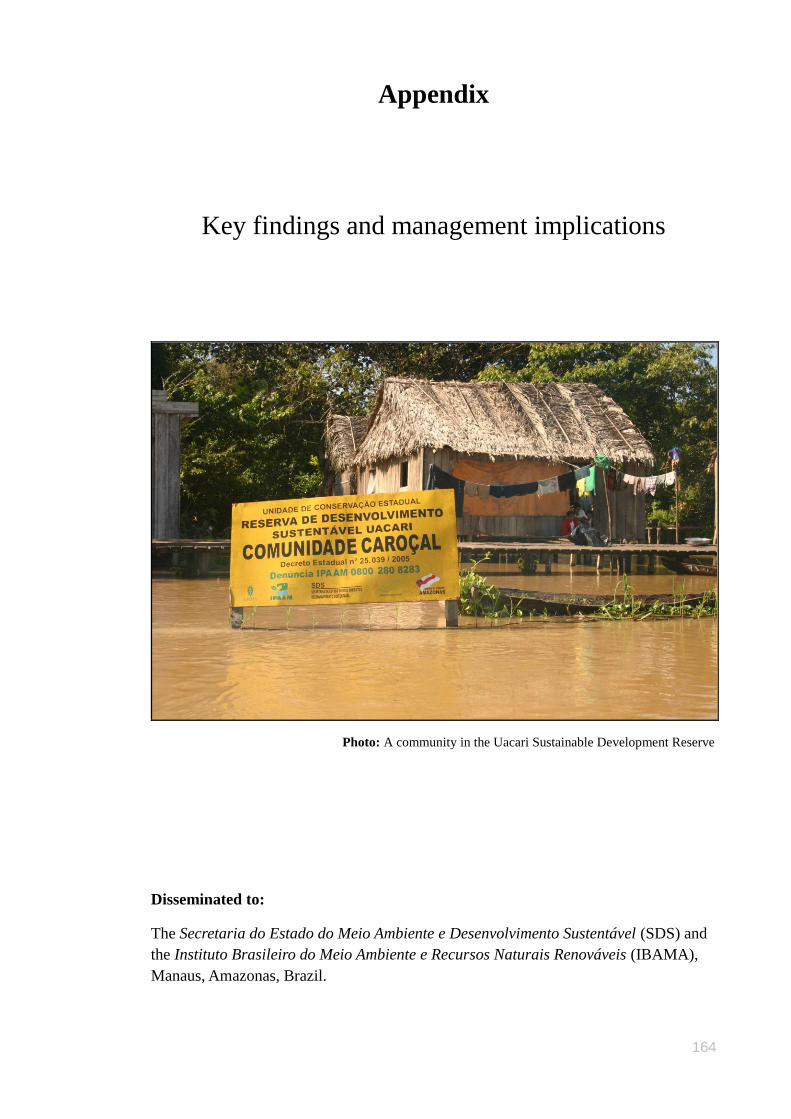
164
Appendix
Key findings and management implications
Photo: A community in the Uacari Sustainable Development Reserve
Disseminated to:
The Secretaria do Estado do Meio Ambiente e Desenvolvimento Sustentável (SDS) and
the Instituto Brasileiro do Meio Ambiente e Recursos Naturais Renováveis (IBAMA),
Manaus, Amazonas, Brazil.
Appendix: Key findings
165
Este documento contém um breve resumo de alguns dos principais resultados da
pesquisa realizada por Peter Newton – membro da equipe de Projeto Médio Juruá –
nas reservas RDS Uacari e ResEx Médio Juruá, Amazonas, Brasil, entre novembro de
2007 e julho de 2011. Os resultados apresentados aqui são parte da tese de
doutorado do PN, e foram selecionados para compor este documento por apresentarem
grande relevância para agências governamentais responsáveis pela gestão destas e de
outras reservas habitadas, assim como para as ONGs envolvidas na conservação e
desenvolvimento de projetos dentro delas. Para um detalhamento específico da
metodologia utilizada no trabalho favor consultar a tese de doutorado em si ou entrar em
contato com PN ([email protected]). Este documento, assim como a tese,
apresenta cinco principais enfoques comas seções a seguir apresentadas conforme
aparecem na tese, para facilitar a procura das referências. Cada seção contém um
objetivo e os principais resultados obtidos em nosso projeto sendo apresentadas algumas
considerações de manejo.
1. Estratégias de subsistência dos moradores das reservas
Objetivo: Analisar a extensão e as causas da variação nas estratégias de subsistência
entre famílias e comunidades.
Método: Pesquisas semanais em 82 casas em 10 comunidades (metodologia semelhante
à utilizada pelo ProBUC, programa da SDS-CEUC).
Resultados principais
a. Todas as famílias e comunidades estudadas trabalham com a agricultura, o
extrativismo florestal e a pesca para subsistência, mas tendem a se
concentrar em apenas uma destas atividades quando buscam geração de renda.
b. Recursos agrícolas foram produzidos de forma mais consistente ao longo do ano
do que os recursos extrativistas, que se apresentaram sazonalmente disponíveis.
c. Famílias dentro de uma mesma comunidade apresentaram estratégias de
subsistência semelhantes, havendo, no entanto, variação significativa entre as
comunidades.
d. Um grande número de recursos diferentes foram produzidos e extraídos pelas
famílias, mas a cada atividade foi dominada por poucos recursos-chaves.
Appendix: Key findings
166
Agricultura: mandioca representando 63% da produção; extrativismo:
lenha 40%, e açaí 21%; pesca: Characidae (tambaqui, pacu, piranha etc): 44%.
e. A variável determinante na variação da estratégia de subsistência entre as
comunidades foi a disponibilidade de floresta terra firme para a agricultura em
áreas próximas as comunidade.
Implicações para gestão
Os resultados apontam que a criação de programas que visem o desenvolvimento das
práticas de subsistência dos residentes destas unidades de conservação deveria ser
concebida em nível de comunidade – com a possibilidade de agrupamento de
comunidades que tenham características (geográficas) similares. Programas que visem
aumentar o rendimento (tendo como alvo à eficiência do processo de colheita ou coleta)
ou que visem conservar os recursos mais raros (limitando o desperdício)deveriam ser
realizados alvejando os recursos chaves identificados pela nossa pesquisa.
2. Distribuição espacial das espécies do Copaifera (copaíba)
Objetivo: Avaliar a densidade e distribuição de espécies de copaíba em três escalas de
espaciais.
Método: Escala Amazônia: dados do Projeto RADAMBRASIL de 2.343 parcelas de 1-
há; Escala das reservas: 63 transectos (4-5 km de cada) ao longo das duas reservas;
Escala local: busca exaustiva em parcela de 100-há de terra firme.
Resultados principais
a. Quatro espécies de copaíba (gênero: Copaifera) ocorrem nas reservas do
Médio Juruá: dois apenas em floresta de terra
firme (C. multijuga e C.piresii), um só na floresta de várzea (C. paupera)
e um em ambos ambientes (C. guyanensis).
b. A densidade media de árvores de Copaifera atráves das reservas foi de 0,83 ha–1
em terra firme 0,36 ha–1
em várzea; atingindo um máximo de 1,13 ha–1
na
parcela de terra firme.
c. A densidade, tamanho médio, e agregação das árvores variou entre as espécies
e entre os tipos de floresta. Por exemplo, as árvores em várzea foram maiores do
que em terra firme.
Appendix: Key findings
167
d. O plano de manejo do RDS Uacari atualmente proíbe a extração do óleo de
copaíba de árvores com DAP menores que 50 cm. Ao longo das
duas reservas, 88% das árvores foram menores do que este tamanho mínimo.
Implicações para gestão
O levantamento realizado é representativo com relação às características das árvores
presentes nas duas reservas. Desta forma os residentes de ambas as reservas segundo a
legislação atual apenas podem ter acesso à uma pequena parte dos recursos disponíveis.
Recomendo a realização de estudos específicos para a determinação de um tamanho
mínimo viável em ambos os aspectos, biológico e econômico da utilização da copaíba
para extração de óleo. Consulte a seção 3.
3. Volumes extraídos de óleo de copaíba (Copaifera)
Objetivo: Determinar os fatores que afetam a produtividade das árvores de copaíba.
Método: Extração experimental de 179 árvores em floresta de terra firme e várzea nas
duas reservas estudadas.
Resultados principais
a. Nem todas as árvores de copaíba produziram óleo quando perfuradas. Apenas
em uma espécie de copaíba (C. multijuga – em floresta de terra firme) a maioria
(70%) das árvores produziram oleoresina.
b. O volume de óleo produzido variou entre as espécies. As duas espécies da várzea
e apenas uma espécie da terra firme produziram volumes significativos de óleo.
Volume médio por árvore: C. multijuga (terra firme): 505 ml; C. guyanensis
(várzea): 139 ml; C. paupera (várzea): 115 ml. O volume máximo produzido
por uma única árvore perfurado foi 4,2 litros.
c. Árvores maiores produziram mais óleo do que as menores, entretanto árvores de
até 25 cm DAP produziram um pouco de óleo. Como comentado anteriormente
o plano de manejo da RDS de Uacari atualmente proíbe aextração de óleo de
copaíba de árvores com DAP menores que 50 cm.
d. Árvores perfuradas pela segunda vez após 1 ano e 3 anos produziram o mesmo
volume de óleo por árvore. Não encontramos nenhuma evidência de que as
árvores deixadas por um período de três anos entre as extrações foram mais

Appendix: Key findings
168
produtivas do que aquelas que ficaram por apenas 1 ano. Árvores perfuradas
pela segunda vez produziram em média 65% do volume original.
e. Espécies diferiram na proporção de árvores que produziram óleo, o volume
produzido, e que o efeito do tamanho da árvore em volume.
Implicações para gestão
Devido a grande diferença encontrada entre as espécies, as mesmas devem ser
consideradas separadamente no momento da geração de orientações de gestão para
copaíba em ambas as reservas. Da mesma forma devem ser abordadas estratégias
diferentes com relação à comunidades situadas próximas à áreas de terra firme ou de
várzea.
4. Potencial para a extração comercial de óleo de copaíba (Copaifera)
Objetivo: Avaliar a acessibilidade dos recursos florestais pelos extrativistas e estimar o
volume total de óleo de copaíba contida nas duas reservas estudadas.
Método: i) Dados sintetizados a partir das duas seções anteriores; ii) Modelos de
acessibilidade.
Resultados principais
a. A produtividade por hectare de óleo de copaíba estimada é baixa, como
resultado da baixa densidade de árvores, presença de espécies
improdutivas baixas proporções de árvores produtivas e alta variabilidade entre
árvores com relação ao volume produzido.
b. A densidade de árvores e a produtividade por árvore foram superiores em
florestas de terra firme, o que significa que este tipo de floresta é potencialmente
mais produtivo, em relação de óleo de copaíba, que a floresta de várzea.
c. O volume total de óleo de copaíba acessível ao longo das duas reservas
é estimado em 8.745 litros (7.638 litros em floresta de terra firme; 1.107 litros
em várzea) em uma extração inicial.
d. 65% da área das duas reservas são acessíveis para os extratores dispostos a
gastar até 8 horas em uma ida e volta, de canoa e a pé, para acessar estes
recursos.
Appendix: Key findings
169
e. Um proporção maior da floresta de terra firme é acessível na estação
chuvosa (58%) em detrimento à estação seca (45%).
f. Uma área maior de floresta de várzea do que de terra firme é acessível em
tempos de viagem de ≤ 250 minutos, devido à localização das comunidades,
geralmente próximas ao canal principal. Longos tempos de viagem (entre 250 e
480 minutos) permitem o acesso a largas poções da floresta de terra firme.
g. O preço médio de compra de óleo de copaíba pelos varejistas em Carauari foi
de R$ 14 litros–1
, e em Manaus foi de R$ 32 litro–1
. O óleo rotulado e certificado
apresentou um valor maior.
Implicações para gestão
Existe atualmente uma pequena quantidade de óleo de copaíba sendo extraída dentro
das reservas, talvez devido à baixa produtividade e a dificuldade de acesso. Entretanto, a
atividade de extração de óleo de copaíba pode ser um suplemento econômico,
particularmente no caso de que sejam garantidos um alto preço de revenda deste óleo -
o que poderia ser feito através do desenvolvimento de programas de certificação do óleo
ou através do estabelecimento de mercados formais (como acontece com o óleo de
andiroba) para o óleo produzido na reserva.
5. Uma avaliação da programa Bolsa Floresta
Objetivo: Avaliar o impacto da remuneração obtida através deste programa de
Pagamento por Serviçios Ambientais (PSA) sobre a economia dos moradores das
reservas.
Método: Mesmo que o da seção 1.
Resultados principais
a. A renda da família e da comunidade, assim como o tamanho da família e a
estratégia de sobrevivência variavam muito através das duas reservas.
b. Famílias menores receberam pagamentos do Bolsa Floresta maiores per capita
do que famílias maiores.
Appendix: Key findings
170
c. Famílias mais dependentes da agricultura tiveram o rendimento familiar
aumentado, recebendo desta forma um incentivo relativamente menor
do Bolsa Floresta.
d. Famílias mais dependentes da agricultura tiveram um custo de oportunidade
maior como resultado de não serem capazes de plantar em áreas de floresta
primária.
e. Esperamos que famílias mais dependentes da agricultura sejam
menos incentivadas a participar na programa Bolsa Floresta e tenham uma
pressão maior para quebrar os termos de seu acordo de não plantar em
floresta primária.
Implicações para gestão
A estrutura de pagamento poderiam ser ajustada para dar conta da variabilidade nos
tamanhos das famílias ou estratégias de subsistência sendo um sistema mais justo e mais
eficaz.