Embed Size (px)
DESCRIPTION
PROGRAMA DE ENGENHARIA DE TRANSPORTES (PET). OPPORTUNITIES FOR USE OF BIODIESEL IN TRANSPORT. THE EXPERIENCE OF PET/COPPE/UFRJ IN THE BRAZILIAN SCENARIO (A BRIEF DESCRIPTION). MÁRCIO DE ALMEIDA D’AGOSTO [email protected]. Rio de Janeiro, 01 de outubro de / 2013. SUMMARY. - PowerPoint PPT Presentation
Citation preview

OPPORTUNITIES FOR USE OF BIODIESEL IN TRANSPORT
Rio de Janeiro, 01 de outubro de /2013.
MÁRCIO DE ALMEIDA D’AGOSTO
PROGRAMA DE ENGENHARIA DE TRANSPORTES (PET)
THE EXPERIENCE OF PET/COPPE/UFRJ IN THE BRAZILIAN SCENARIO
(A BRIEF DESCRIPTION)
SUMMARY
1.Why is it important? Brazilian transportation
sector in figures.
2.What are the Brazilian options? Biofuels.
3.What about our experience?
PET/COPPE/UFRJ – 13 years of experience.
4.Final comments.
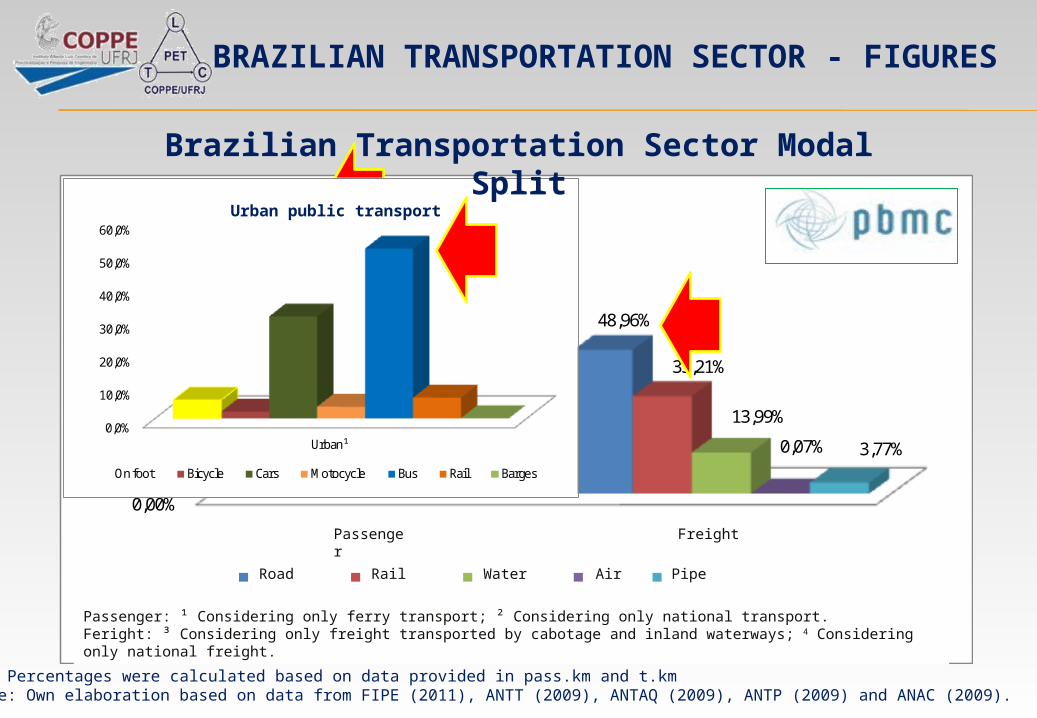
Note: Percentages were calculated based on data provided in pass.km and t.kmSource: Own elaboration based on data from FIPE (2011), ANTT (2009), ANTAQ (2009), ANTP (2009) and ANAC (2009).
BRAZILIAN TRANSPORTATION SECTOR - FIGURES
0,00%
10,00%
20,00%
30,00%
40,00%
50,00%
60,00%
70,00%
80,00%
90,00%
Passageiro Carga
89,23%
48,96%
3,22%
33,21%
0,03%
13,99%7,51% 0,07% 3,77%
Rodoviário Ferroviário Aquaviário Aéreo Duto
Passageiro: ¹ Considera apenas transporte por barca; ² Considera apenas transporte nacional.Carga: ³Considera somente carga transportada por cabotagem e navegação interior; 4 Considera somente carga nacional.
Passenger Freight
Road Rail Water Air Pipe
Passenger: ¹ Considering only ferry transport; ² Considering only national transport.Feright: ³ Considering only freight transported by cabotage and inland waterways; 4 Considering only national freight.
0,0%
10,0%
20,0%
30,0%
40,0%
50,0%
60,0%
Urban¹
On foot Bicycle Cars Motocycle Bus Rail Barges
Urban public transport
Brazilian Transportation Sector Modal Split
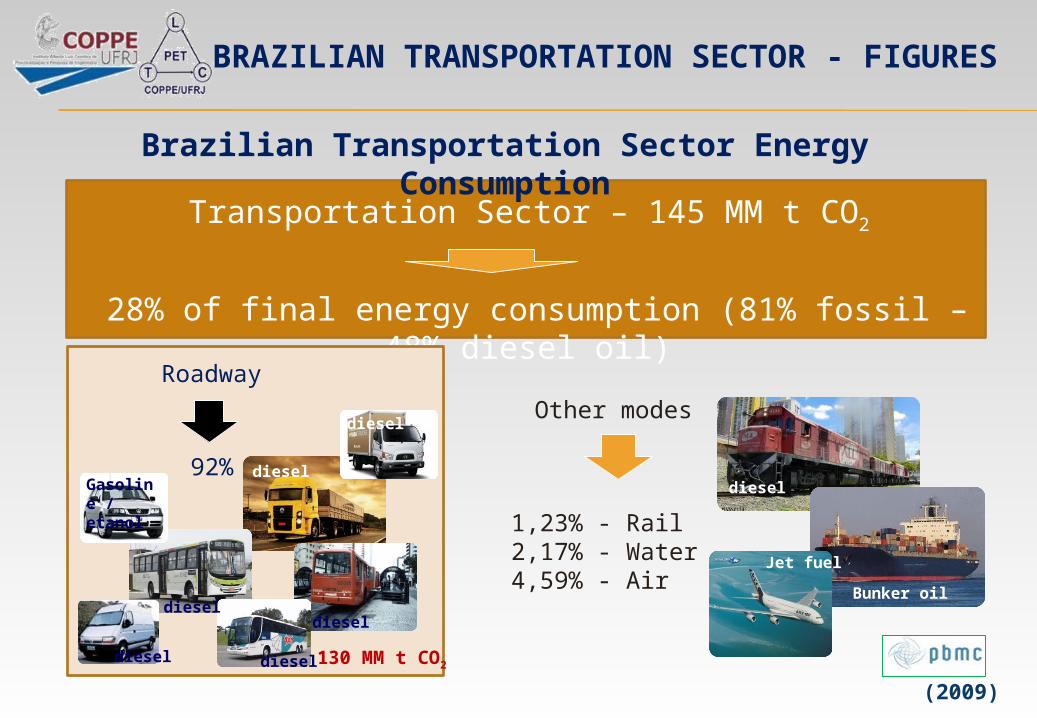
Transportation Sector – 145 MM t CO2
28% of final energy consumption (81% fossil – 48% diesel oil)
Other modes
1,23% - Rail2,17% - Water4,59% - Air
BRAZILIAN TRANSPORTATION SECTOR - FIGURES
Brazilian Transportation Sector Energy Consumption
Roadway
92%
130 MM t CO2
diesel
diesel
diesel
diesel
diesel
diesel
Gasoline / etanol
(2009)
diesel
Bunker oil
Jet fuel
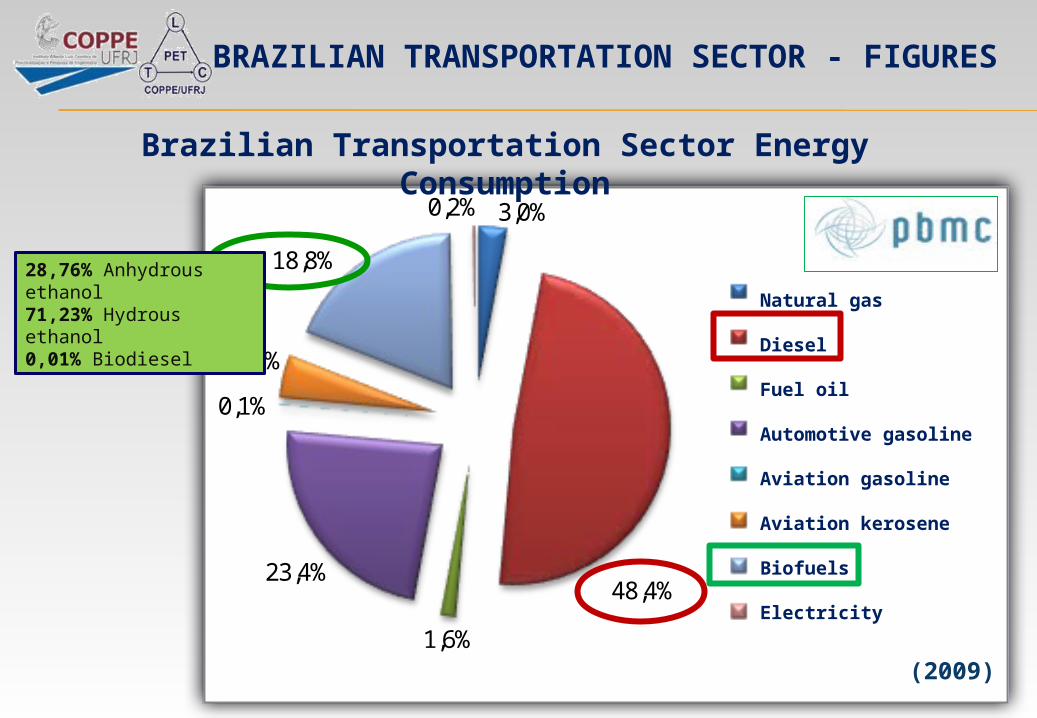
3,0%
48,4%
1,6%
23,4%
0,1%
4,5%
18,8%
0,2%
Gás natural
Óleo diesel
Óleo combustível
Gasolina automotiva
Gasolina de aviação
Querosene de aviação
Biocombustíveis
Eletricidade
(2009)
Natural gas
Diesel
Fuel oil
Automotive gasoline
Aviation gasoline
Aviation kerosene
Biofuels
Electricity
BRAZILIAN TRANSPORTATION SECTOR - FIGURES
Brazilian Transportation Sector Energy Consumption
28,76% Anhydrous ethanol71,23% Hydrous ethanol0,01% Biodiesel
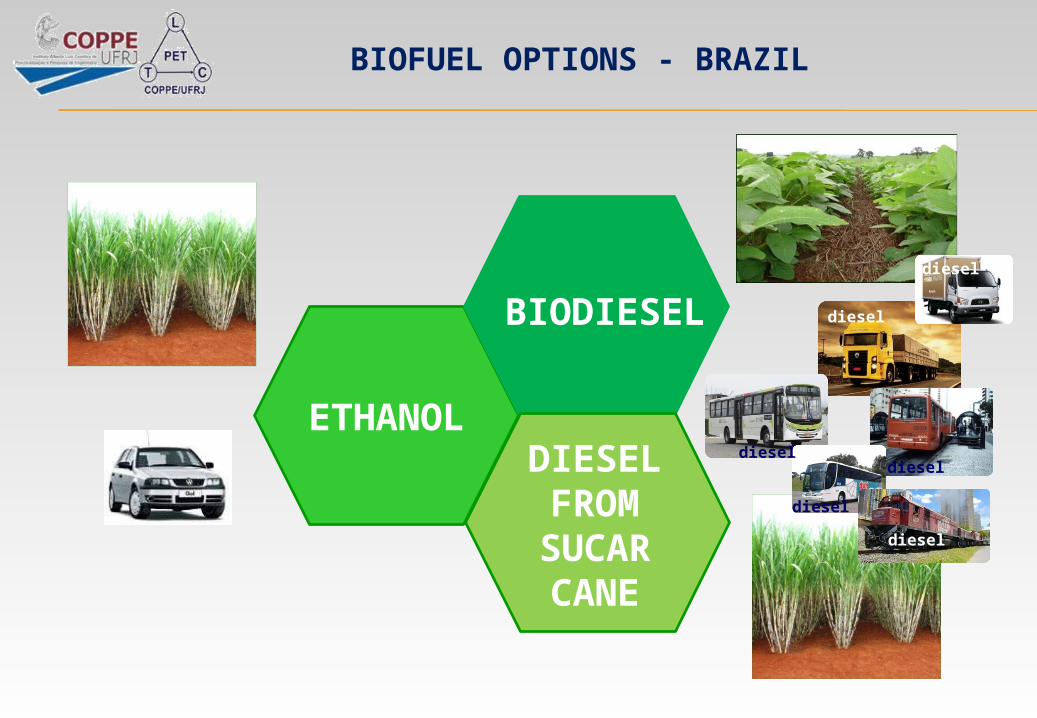
BIOFUEL OPTIONS - BRAZIL
ETHANOL
BIODIESEL
DIESEL FROM
SUCAR CANE
diesel
diesel
diesel
diesel
diesel
diesel
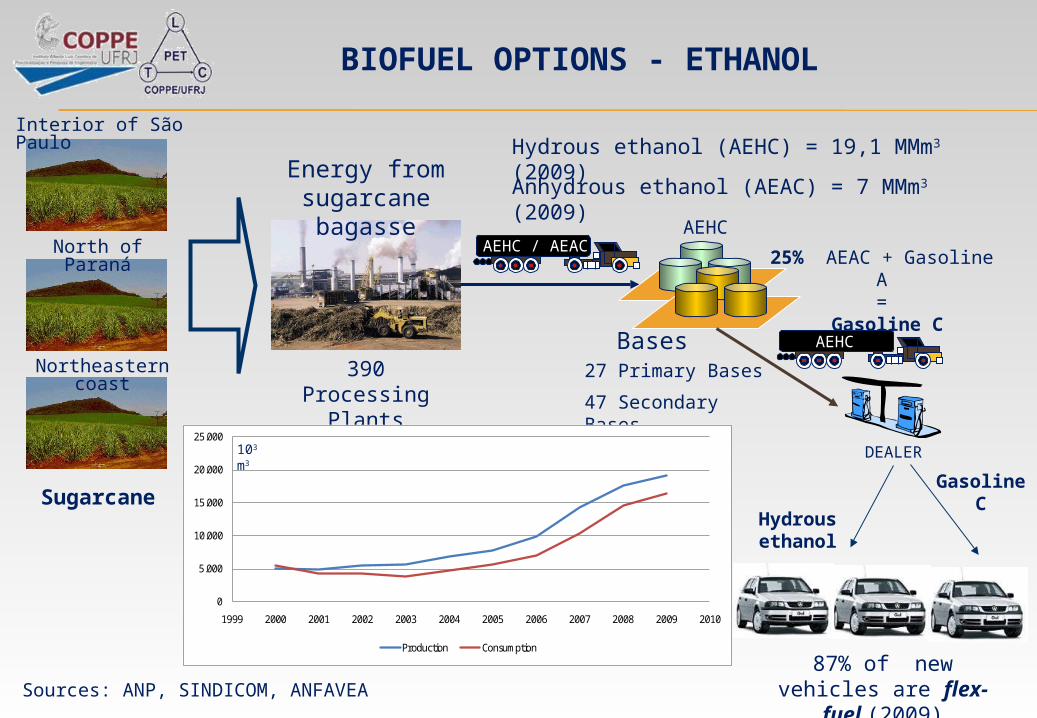
390 Processing Plants
Bases
AEHC
25% AEAC + Gasoline A=
Gasoline C
AEHC / AEAC
DEALER
AEHC
Hydrous ethanol (AEHC) = 19,1 MMm3 (2009)
Anhydrous ethanol (AEAC) = 7 MMm3 (2009)
27 Primary Bases
47 Secondary Bases
Energy from sugarcane bagasse
87% of new vehicles are flex-fuel (2009)
Northeastern coast
Sugarcane
Sources: ANP, SINDICOM, ANFAVEA
BIOFUEL OPTIONS - ETHANOL
Hydrous ethanol
Gasoline C
North of Paraná
Interior of São Paulo
0
5.000
10.000
15.000
20.000
25.000
1999 2000 2001 2002 2003 2004 2005 2006 2007 2008 2009 2010
Production Consumption
103 m3

PRODUÇÃO(48 plantas)
Metanol Etanol
B100
Produtor de Biodiesel
B5
2010
Distribuidor
Refinaria
B100 Diesel
Extração de Óleo
Catalisador
Óleo
B100
Produtor de Biodiesel
PostosFrotista
Co-produtos
Gordura Animal
Óleo Residual
171.929 m3
Glicerina
71% soja
20% sebo bovino
95%
1,6 milhões de m3 de biodiesel em 2009
INP
UT
S
CatalystEthanolMethanolCo-product
Animal fat
Residual oil
PRODUCTION(48 plants)
Biodisel producer
Biodiesel producer
Fleet owner
Refinery
Distributor
Stations
5% biodiesel added to petro-diesel
Oil extraction71% soybean
20% beef tallow
Co-products171,929 m³
glycerin1.6 million m³ biodiesel
(2009)
BIOFUEL OPTIONS - BIODIESEL

A M Y R I S
BIOFUEL OPTIONS – DIESEL FROM SUGAR CANE
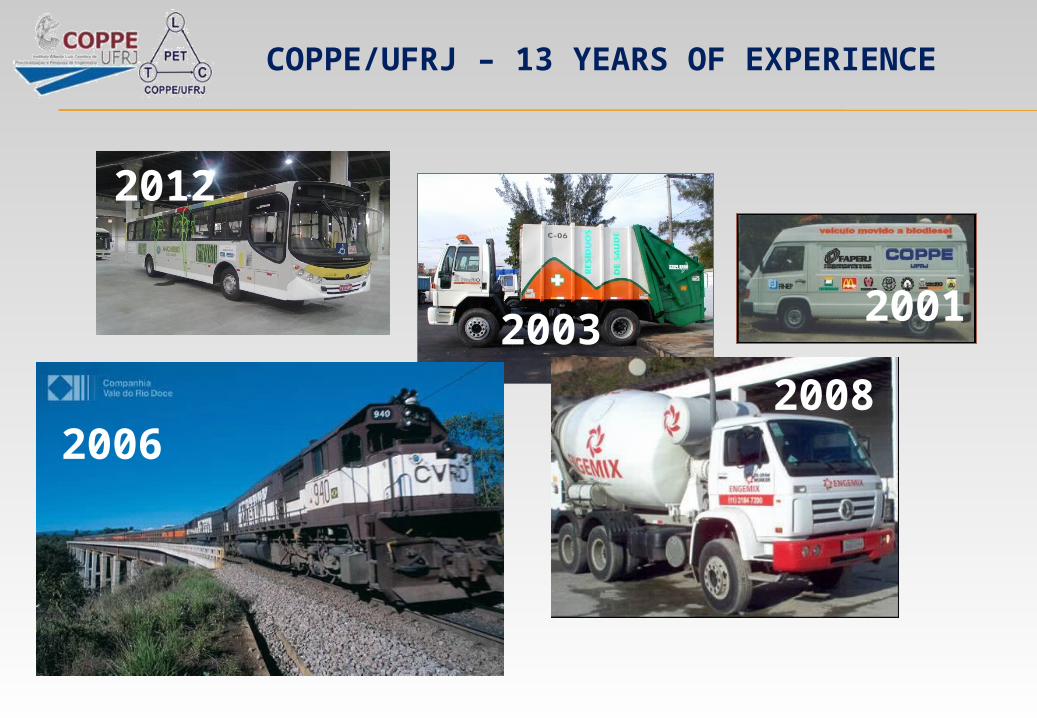
COPPE/UFRJ – 13 YEARS OF EXPERIENCE
20012003
20062008
2012
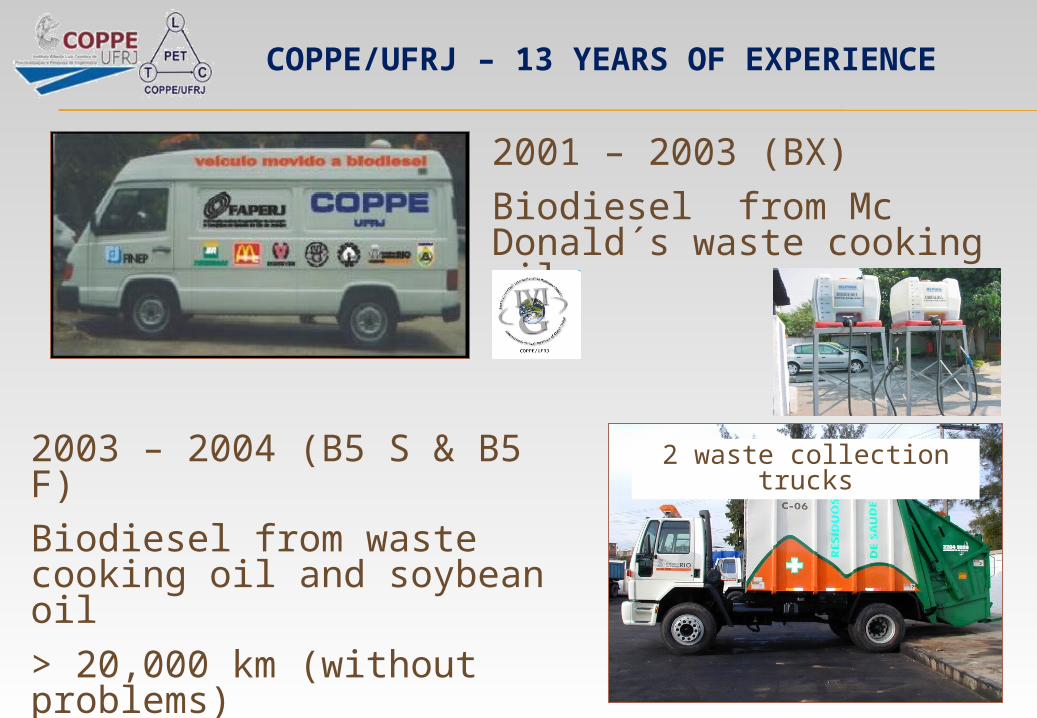
2001 – 2003 (BX)
Biodiesel from Mc Donald´s waste cooking oil
2003 – 2004 (B5 S & B5 F)
Biodiesel from waste cooking oil and soybean oil
> 20,000 km (without problems)
2 waste collection trucks
COPPE/UFRJ – 13 YEARS OF EXPERIENCE
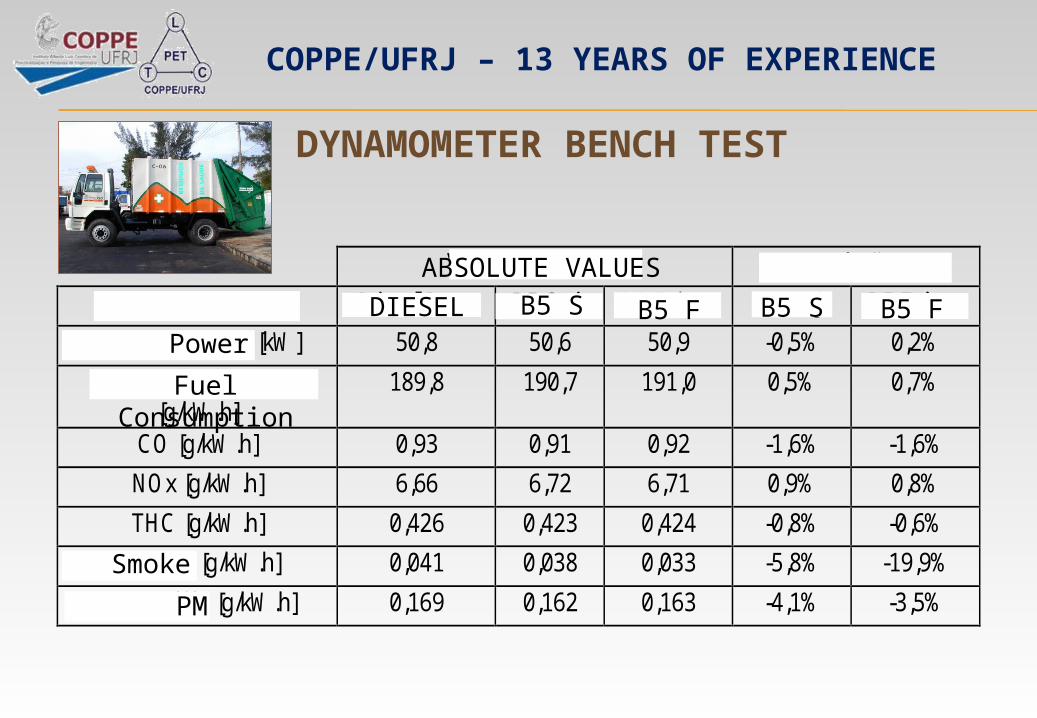
Valores Absolutos Variações
Parâmetro medido Diesel Base B5 Soja B5 Fritura B5 Soja B5 Fritura
Potência efetiva [kW] 50,8 50,6 50,9 -0,5% 0,2%
Consumo específico [g/kW.h]
189,8 190,7 191,0 0,5% 0,7%
CO [g/kW.h] 0,93 0,91 0,92 -1,6% -1,6%
NOx [g/kW.h] 6,66 6,72 6,71 0,9% 0,8%
THC [g/kW.h] 0,426 0,423 0,424 -0,8% -0,6%
Fuligem [g/kW.h] 0,041 0,038 0,033 -5,8% -19,9%
MP medido [g/kW.h] 0,169 0,162 0,163 -4,1% -3,5%
Power
Smoke
PM
Fuel Consumption
B5 S B5 SB5 F B5 FDIESEL
ABSOLUTE VALUES
DYNAMOMETER BENCH TEST
COPPE/UFRJ – 13 YEARS OF EXPERIENCE
0,00%
5,00%
10,00%
15,00%
20,00%
25,00%
30,00%
35,00%
40,00%
45,00%
50,00%
< 5% 5% a 10% 10% a 15% 15% a 20% 20% a 25% > 25%
Percentual de Biodiesel na Mistura
Per
cent
ual d
e O
corr
ênci
a no
Tes
te
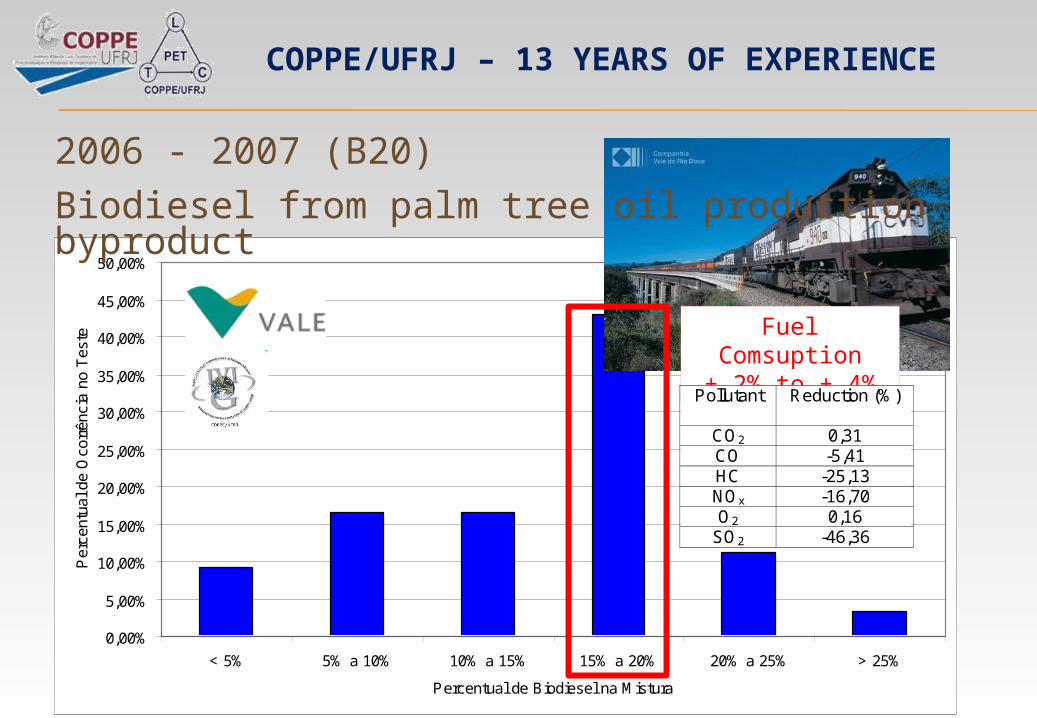
2006 - 2007 (B20)
Biodiesel from palm tree oil production byproduct
Fuel Comsuption+ 2% to + 4%
Pollutant Reduction (%)
CO2 0,31 CO -5,41 HC -25,13 NOx -16,70 O2 0,16
SO2 -46,36
COPPE/UFRJ – 13 YEARS OF EXPERIENCE
COPPE Comb

1,200
1,300
1,400
1,500
1,600
1,700
1,800
1,900
0 1 2 3 4 5 6 7 8
Veículos Testados
Efi
ciên
cia
[km
/l]
2365 2367 2481 2407
1,200
1,300
1,400
1,500
1,600
1,700
1,800
1,900
0 1 2 3 4 5 6 7 8
Veículos Testados
Efi
ciên
cia
[km
/l]
2365 2367 2481 2407
3 concrete mixer trucks
2006 - 2008 (B5)
Biodiesel from castor beans oil
Reference
COPPE/UFRJ – 13 YEARS OF EXPERIENCE
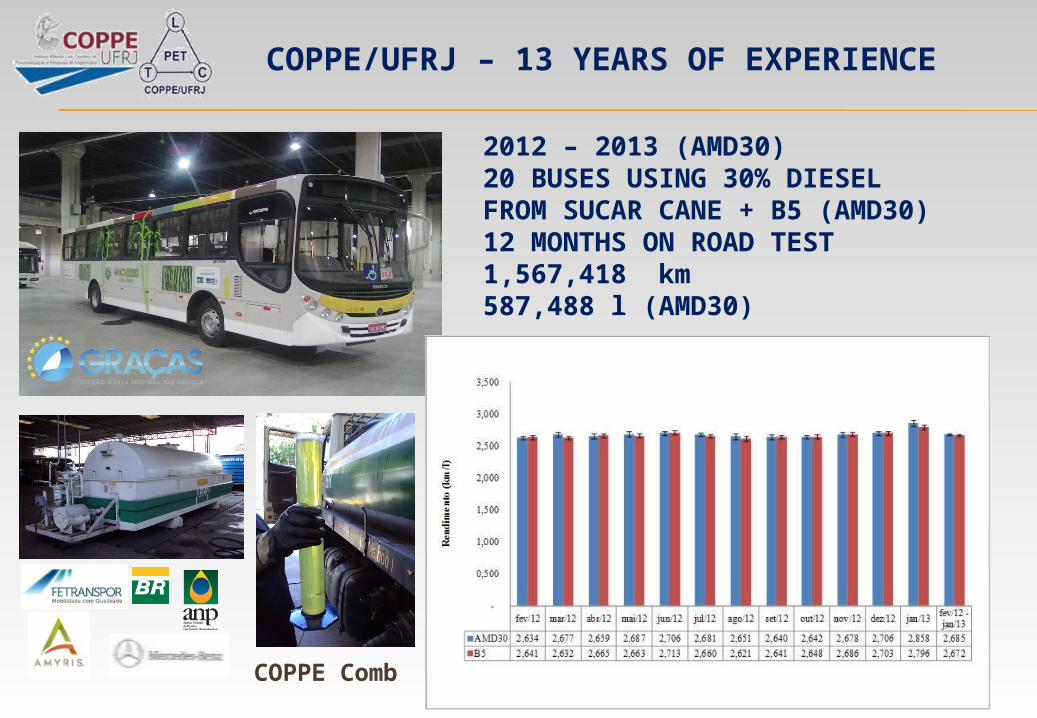
2012 – 2013 (AMD30)20 BUSES USING 30% DIESEL FROM SUCAR CANE + B5 (AMD30)12 MONTHS ON ROAD TEST1,567,418 km587,488 l (AMD30)
COPPE/UFRJ – 13 YEARS OF EXPERIENCE
COPPE Comb
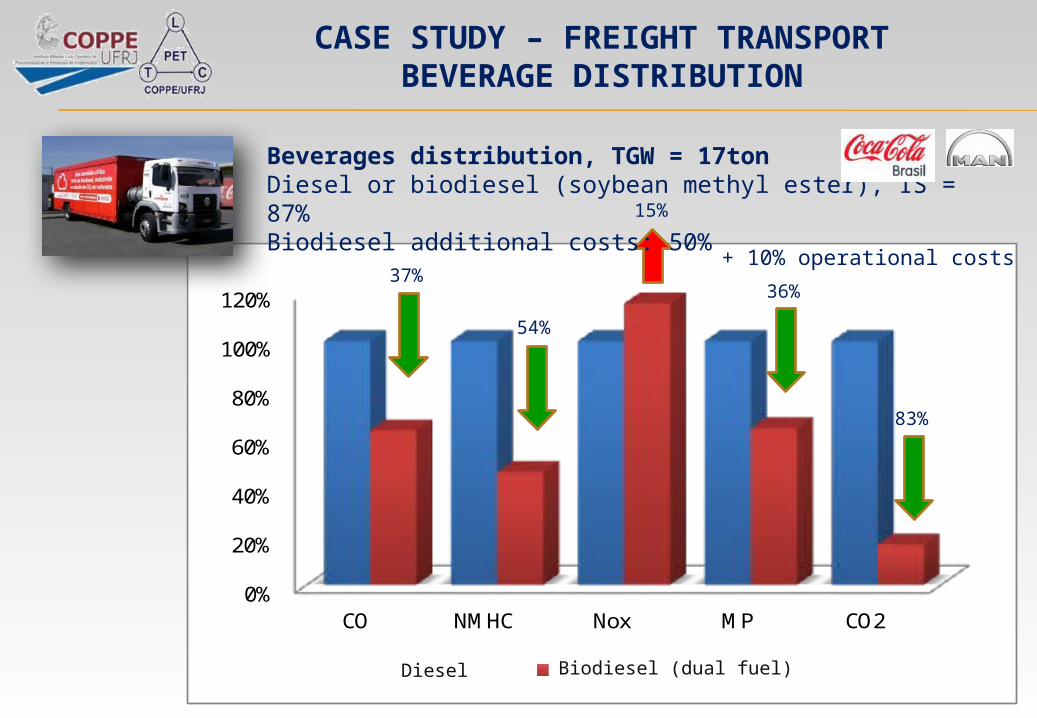
0%
20%
40%
60%
80%
100%
120%
CO NMHC Nox MP CO2
Óleo diesel Biodiesel (Duplo combustível)
+ 10% operational costs
Diesel Biodiesel (dual fuel)
37%
54%
15%
36%
83%
Beverages distribution, TGW = 17tonDiesel or biodiesel (soybean methyl ester), IS = 87%Biodiesel additional costs: 50%
CASE STUDY – FREIGHT TRANSPORTBEVERAGE DISTRIBUTION
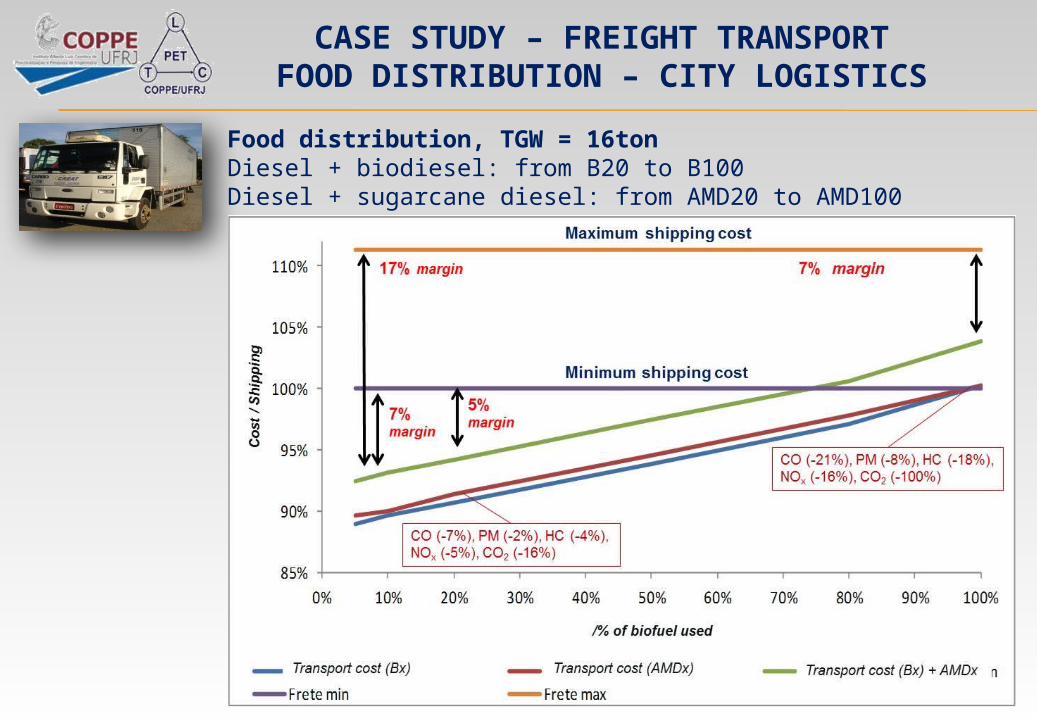
Food distribution, TGW = 16tonDiesel + biodiesel: from B20 to B100Diesel + sugarcane diesel: from AMD20 to AMD100
CASE STUDY – FREIGHT TRANSPORTFOOD DISTRIBUTION – CITY LOGISTICS

FINAL COMMENTS
1.Brazil is world leader in the production of
biofuels for transportation – it is an example!
2.We have a large set of opportunities – lets
improved them!
3.PET/COPPE/UFRJ and many other unities in
UFRJ are engaged to override this challenge!
INVITATION
LABORATÓRIO DE TRANSPORTE DE CARGA - LTC
www.ltc.coppe.ufrj.brCoordenator: Márcio de Almeida D’Agosto
Centro de Tecnologia, Bloco H, Sala 119Cidade Universitária, Ilha do Fundão,
CEP: 21.949-900 – Rio de Janeiro – RJTel: (21) 2562-8139 / 2562-8129
October/2013.
OPPORTUNITIES FOR USE OF BIODIESEL IN TRANSPORT
THE EXPERIENCE OF PET/COPPE/UFRJ IN THE BRAZILIAN SCENARIO
(A BRIEF DESCRIPTION)