Embed Size (px)
Citation preview

This report is made possible by the generous support of the American people through the support of the Office of Health, Infectious Diseases, and Nutrition, Bureau for Global Health, U.S. Agency for International Development (USAID) and the Office of Food for Peace, under terms of Cooperative Agreement No. AID-OAA-A-12-00005, through the Food and Nutrition Technical Assistance III Project (FANTA), managed by FHI 360. The contents are the responsibility of FHI 360 and do not necessarily reflect the views of USAID or the United States Government. Recommended Citation: Mathys, Ellen. 2016. Opportunities to Provide Refugees and Ugandans with Alternative Livelihood Activities in Uganda’s Kamwenge District. Washington, DC: FHI 360/FANTA.
Food and Nutrition Technical Assistance III Project (FANTA) FHI 360 1825 Connecticut Avenue, NW Washington, DC 20009-5721 T 202-884-8000 F 202-884-8432 [email protected] www.fantaproject.org

Opportunities to Provide Refugees and Ugandans with Alternative Livelihood Activities in Uganda’s Kamwenge District
Contents
Abbreviations and Acronyms .............................................................................................................. i Executive Summary ............................................................................................................................. 1
1. Introduction ......................................................................................................................... 2
2. Displacement Context: Refugee Settlements and Refugee Hosting Districts in Uganda ................................................................................................................................. 5
2.1 National Overview of Uganda’s Refugee Situation ................................................................ 5
2.2 Drivers of Displacement from the DRC .................................................................................. 5
3. Food Security and Development Context in Kamwenge District and Rwamwanja Refugee Settlement ............................................................................................................ 9
3.1 Food Security and Livelihoods in Kamwenge District ............................................................ 9
3.1.1 Poverty and Development in Kamwenge District .......................................................... 9
3.1.2 Food Security Status in Kamwenge District ................................................................ 12
3.1.3 Livelihoods of Ugandans in Kamwenge District .......................................................... 14
3.1.4 Crop Production in Kamwenge District ....................................................................... 14
3.1.5 Livestock in Kamwenge District .................................................................................. 20
3.1.6 Markets and Trade in Kamwenge District ................................................................... 20
3.1.7 Savings and Credit in Kamwenge District ................................................................... 22
3.1.8 Remittances in Kamwenge District ............................................................................. 22
3.1.9 Gender, Youth, and Vulnerable Groups in Kamwenge District ................................... 22
3.1.10 MCHN and WASH in Kamwenge District .................................................................... 23
3.2 Food Security and Livelihoods in Rwamwanja Refugee Settlement ................................... 28
3.2.1 Food Security Status in Rwamwanja Refugee Settlement ......................................... 28
3.2.2 Livelihoods in Rwamwanja Refugee Settlement ......................................................... 29
3.2.3 Crop Production in Rwamwanja Refugee Settlement ................................................. 35
3.2.4 Livestock in Rwamwanja Refugee Settlement ............................................................ 35
3.2.5 Markets and Trade in Rwamwanja Refugee Settlement ............................................. 35
3.2.6 Savings and Finance in Rwamwanja Refugee Settlement ......................................... 36
3.2.7 Remittances in Rwamwanja Refugee Settlement ....................................................... 37
3.2.8 Gender, Youth, and Vulnerable Groups in Rwamwanja Refugee Settlement ............ 37
3.2.9 MCHN and WASH in Rwamwanja Refugee Settlement ............................................. 38
3.3 Conflict in Kamwenge District and Rwamwanja Refugee Settlement .................................. 40
4. Uganda’s Policies, Strategies, and Plans for Refugees and Individuals Seeking Asylum ................................................................................................................ 41
4.1 GOU Policies, Strategies, and Plans .................................................................................... 41
4.2 UN Policies, Strategies, and Plans ....................................................................................... 44
5. Selected Programs in Rwamwanja Refugee Settlement .............................................. 45
5.1 UN and Multilateral Programs .............................................................................................. 45
5.2 United States Government-Supported Programs ................................................................ 46

Opportunities to Provide Refugees and Ugandans with Alternative Livelihood Activities in Uganda’s Kamwenge District
5.3 Programs Supported by Other Donors and Actors .............................................................. 46
6. Opportunities and Constraints for Food Security and Livelihoods Programs .......... 49
6.1 Introduction ........................................................................................................................... 49
6.2 Graduation-Based Livelihoods Programs Among Non-Refugee Populations ..................... 49
6.3 Graduation-Based Livelihoods Programs Among Refugee Populations ............................. 50
6.4 Enabling Factors for Graduation-Based Livelihoods Programs in Rwamwanja Refugee Settlement ............................................................................................................................ 52
6.5 Constraints and Challenges for Graduation-Based Livelihoods Programs in Rwamwanja Refugee Settlement .............................................................................................................. 53
6.6 Opportunities for Graduation-Based Livelihoods Programs in Rwamwanja Refugee Settlement and Kamwenge District ...................................................................................... 54
6.7 Cross-Cutting Issues and Other Considerations ................................................................. 56
References .......................................................................................................................................... 58
List of Tables
Table 1. Ugandan and Refugee Populations in all Refugee Hosting Districts in Uganda (September 2016) ................................................................................................................ 7
Table 2. Legal, Demographic, and Country of Origin Information for Refugees (Registered) in Rwamwanja Refugee Settlement and for All Refugees in Uganda (September 2016) ....... 8
Table 3. Selected Development and Livelihoods Indicators by Region, Uganda ............................ 10
Table 4. Selected Development and Livelihoods Indicators for Western Region, Mid-Western Sub-Region and Kamwenge District ................................................................................... 11
Table 5. National Crop Production Estimates for Uganda (MT, 2010-2014) ................................... 17
Table 6. Regional Crop Production Estimates for Uganda (MT, 2008) ............................................ 17
Table 7. Acreage Planted and Production Estimates in Kamwenge District (MT, 2008) ................. 18
Table 8. Livestock Estimates in Kamwenge District, Western Region, and National (MT, 2008) ... 20
Table 9. Gender Indicators for Mid-Western Sub-Region and Uganda ........................................... 24
Table 10. MCHN and WASH Indicators for Mid-Western Sub-Region and Uganda .......................... 25
Table 11. Selected Development and Food Security Indicators for Refugees, Rwamwanja Settlement ........................................................................................................................... 31
Table 12. Economic Behaviors of Self-Employed Refugees (Main Household Income Earner), Rwamwanja Settlement ...................................................................................................... 32
Table 13. Economic Behaviors of Refugees who are Employed by Others (Main Household Income Earner), Rwamwanja Settlement ........................................................................... 33
Table 14. Level of Education of Refugee (Main Household Income Earner) Upon Arrival to Refugee Settlement, Rwamwanja Settlement .................................................................... 33
Table 15. Power Sources and Information/Communication Technologies (ICT) in Refugee Households, Rwamwanja Settlement ................................................................................. 34
Table 16. MCHN and WASH Indicators for Rwamwanja Refugee Settlement .................................. 38

Opportunities to Provide Refugees and Ugandans with Alternative Livelihood Activities in Uganda’s Kamwenge District
Table 17. WFP Programs in Uganda (2016) ...................................................................................... 47
List of Figures
Figure 1. Regional Poverty Trends (Poverty Headcount Index, 2005/2006 to 2012/2013) .............. 10
Figure 2. Seasonal Calendar of Uganda ........................................................................................... 16
Figure 3. Percent of Production Sold, Consumed, Stored, and Used for Other Purposes, Western Region (2008) ..................................................................................................................... 19
Figure 4. Percent of Households Receiving Different Types of Assistance, Rwamwanja Settlement ...................................................................................................... 29
Figure 5. Average Monthly Income of Refugee Households, Rwamwanja Refugee Settlement (USh/month) ........................................................................................................................ 37
List of Maps
Map 1. Location of Kamwenge District, Uganda .............................................................................. 3
Map 2. Location of Registered Refugees and Asylum Seekers in Uganda (November 1, 2016) .... 4
Map 3a. Current Food Security Outcomes (October 2016 - January 2017) ……………..………... 13 Map 3b. Projected Food Security Outcomes (February - May 2017) ………………………………..13
Map 4. Livelihood Zones of Uganda ............................................................................................... 15
Map 5. Market Flows of Bananas in Uganda.................................................................................. 21
Map 6. Market Flows of Maize in Uganda ...................................................................................... 21
Map 7. Trade Network for Refugee-Grown Maize .......................................................................... 36

Opportunities to Provide Refugees and Ugandans with Alternative Livelihood Activities in Uganda’s Kamwenge District
i
Abbreviations and Acronyms
AMFIU Association of Microfinance Institutions of Uganda
CGAP Consultative Group to Assist the Poor
DAR Development Assistance to Refugee Hosting Areas Program
DRC Democratic Republic of the Congo
FAO United Nations Food and Agriculture Organization
FEWS NET Famine Early Warning Systems Network Project
FFP Office of Food for Peace
GOU Government of Uganda
HIP Humanitarian Innovation Project
IGA Income generating activity
MCHN Maternal and child health and nutrition
MT Metric tons
NDP National Development Plan
NGO Non-governmental organization
NPHC National Population and Housing Census
PRDP Peace, Recovery and Development Plan/Programme
PRRO Protracted Relief and Recovery Operation
ReHoPE Refugee and Host Community Empowerment Strategy
SGBV Sexual and gender-based violence
SRS Self-Reliance Strategy
UN United Nations
UNHCR United Nations High Commissioner for Refugees
UNICEF United Nations Children’s Fund
USAID United States Agency for International Development
UNHS Uganda National Household Survey
USh Ugandan shilling
UNCT United Nations Country Team
WASH Water, sanitation and hygiene
WFP World Food Programme

Opportunities to Provide Refugees and Ugandans with Alternative Livelihood Activities in Uganda’s Kamwenge District
1
Executive Summary
This food security desk review for Kamwenge District and Rwamwanja Refugee Settlement, in western Uganda, was requested by the United States Agency for International Development Office of Food for Peace (USAID/FFP) to help guide FFP development food security activity applicants to design activities to address food security needs in the region. The document draws from secondary resources to understand the food security and broader developmental context of the area. The review analyzes the food security situation in Kamwenge District and Rwamwanja Refugee Settlement, as well as key policies, strategies and programs of the Government of Uganda and partners that are relevant to food security and livelihoods activities in Rwamwanja Refugee Settlement and the surrounding Kamwenge District.
Kamwenge District suffers from widespread chronic food insecurity. A study of chronic food insecurity in Uganda in 2015 found that in Mid-Western Sub-Region, where Kamwenge District is located, almost two thirds (62%) of the population suffers from mild (28%), moderate (17%), or severe (17%) chronic food insecurity (FAO Uganda 2015). The nutrition situation is also concerning: the Uganda Demographic and Health Survey for 2011 found that in the Mid-Western Sub-Region 44% of children under 5 were stunted, 16% were underweight, 3% were wasted, and 39% of children 6-59 months of age were anemic.
Rwamwanja Refugee Settlement hosts around 57,000 refugees, almost all of whom have sought safe haven from the violence that plagues the eastern Democratic Republic of the Congo since 2012. Refugees receive food or cash assistance for the first five years after arrival, which accounts in significant part for the observation that in 2015, over four fifths (84%) of refugees had an acceptable food consumption score. Yet, almost half (51%) were adopting livelihood coping strategies that indicated stress on the household, and shocks – particularly illness – are widespread (GOU, UNICEF, WFP and UNHCR 2015). For many refugees who began receiving food/cash assistance in 2012, this assistance is due to be phased out in 2016/2017.
The Government of Uganda, United Nations Country Team (UNCT) and partners have established policies and strategies that emphasize economic self-reliance for refugees, integration of refugees into local populations (e.g., via use of the same health, education, and agricultural extension services), and equity in the support of refugees and their Ugandan neighbors in the refugee hosting districts. In accordance with those principles, USAID/FFP is planning to support an activity designed to promote self-reliance in terms of livelihoods among Rwamwanja’s refugees and their Ugandan counterparts in Kamwenge District. The use of a graduation approach to livelihoods has been identified to ensure that beneficiaries will receive the support and services that they need to achieve self-reliance sustainably after the activity ends after a specific period of time. This desk review aims to synthesize available information on the food security and development context in Rwamwanja Refugee Settlement and Kamwenge District, to inform and support that effort. Additionally, opportunities and constraints for graduation-based livelihoods programs in Rwamwanja Refugee Settlement and Kamwenge District, as well as selected cross cutting issues and other considerations have been identified.

Opportunities to Provide Refugees and Ugandans with Alternative Livelihood Activities in Uganda’s Kamwenge District
2
1. Introduction
An unprecedented number of people – an estimated 65.3 million – are currently displaced; that figure includes 21.3 million refugees, half of whom are under 18 years of age (UNHCR 2016a). Today’s refugees are less likely to be able to go home than at any time in the past 30 years (UNHCR 2016a). Some two-thirds of refugees have been displaced for at least five years and the average length of refugee displacement is estimated at two decades (Betts et al. 2014). Refugees displaced for long periods of time have often fled fragile states, protracted conflict and/or religious or cultural persecution.
The United Nations High Commissioner for Refugees (UNHCR) works with host country governments to find durable solutions for each refugee and asylum seeker, such as voluntary repatriation, citizenship in the host country, or resettlement in a third country.1 Humanitarian assistance is often provided to refugee populations in the early phases of displacement, but protracted displacement requires a shift to multi-year, more development-oriented programming to promote self-reliance among refugee populations and to reduce their dependence (and that of host communities, where such support is also provided) on costly external assistance. Development-oriented programming for refugees in situations of protracted displacement must account for specific economic, legal, and sociocultural realities of refugee contexts. Attention must also be given to supporting nationals in host communities, particularly where poverty, food insecurity, and malnutrition rates are comparable among the refugee and host populations.
The United States Agency for International Development Office of Food for Peace (USAID/FFP) requested this food security desk review for the refugee hosting district of Kamwenge, Uganda to help FFP development food security activity applicants to design activities focused on development-oriented livelihood activities for refugees and Ugandans in the refugee hosting communities. The objective of this review is to synthesize and present existing secondary data, and identify gaps in information that exist related to livelihood needs and opportunities for refugees and host communities in Kamwenge District. As of November 1, 2016, Uganda was hosting almost 900,000 refugees from countries including the Republic of South Sudan (South Sudan), the Democratic Republic of the Congo (DRC), Burundi, Somalia, and Rwanda. This is the largest refugee caseload in Uganda’s history. The Government of Uganda (GOU) has a progressive policy approach to refugees, that recognizes a range of refugee rights, including the right to land, freedom to work, unrestricted mobility, and the right to essential social services. However, ensuring refugees’ human dignity, well-being, and equity and harmony with host communities, requires a concerted and collaborative effort involving the GOU, donors like USAID, other international and national partners, and communities. The GOU and its partners share a vision of achieving those outcomes through self-reliance and resilience among refugees and refugee host districts. `
This desk review draws from secondary sources on Uganda’s history, politics, economy, and food security situation, as well as from GOU programs and policies relevant to refugees and their host districts. Interviews and secondary data collection were also conducted with key actors, such as United Nations (UN) agencies and implementing organizations. The review analyzes the food
1 The term “refugee” connotes someone who has been forced to flee his or her country because of persecution, war, or violence, and has a well-founded fear of persecution for reasons of race, religion, nationality, political opinion or membership in a particular social group. The term “asylum seeker” connotes someone who has fled his/her own country, sought sanctuary in another country, and applied for asylum, which is the right to be recognized as a refugee and receive legal protection and material assistance. Source: UNHCR 2016b.

Opportunities to Provide Refugees and Ugandans with Alternative Livelihood Activities in Uganda’s Kamwenge District
3
security situation and context in Rwamwanja Refugee Settlement and in Kamwenge District (Maps 1 and 2).
This review is organized as follows: after this Introduction, Section 2 provides an overview of the displacement context in Uganda. Section 3 presents the food security, nutrition, and broader development contexts of Kamwenge District and Rwamwanja Refugee Settlement. Section 4 gives an overview of the GOU’s key settlement policies and programs for refugees and individuals seeking asylum. Section 5 highlights current programs operating in Rwamwanja Refugee Settlement and Kamwenge District. Section 6 discusses opportunities and constraints for food security and livelihoods programming in the target area.
Map 1. Location of Kamwenge District, Uganda
Source: UBOS and ICF 2012.
SOUTH

Opportunities to Provide Refugees and Ugandans with Alternative Livelihood Activities in Uganda’s Kamwenge District
4
Map 2. Location of Registered Refugees and Asylum Seekers in Uganda (November 1, 2016)
Source: UNHCR 2016c.

Opportunities to Provide Refugees and Ugandans with Alternative Livelihood Activities in Uganda’s Kamwenge District
5
2. Displacement Context: Refugee Settlements and Refugee Hosting Districts in Uganda
2.1 National Overview of Uganda’s Refugee Situation As of November 1, 2016, Uganda hosted 898,082 refugees and asylum seekers from South Sudan, DRC, Burundi, Somalia, Rwanda, Eritrea, Sudan, Ethiopia, and other countries (Map 2). Detailed breakdowns by age, gender, and other variables are not yet available for this November 1 figure, but detailed figures for the end of September 2016 are summarized in Table 1. As of September 30, Uganda hosted 789,790 refugees, of whom about 74% (582,947) lived in established rural settlements in eight predominantly rural refugee host districts.2 Around 11% (84,875) have self-settled in Kampala, as the GOU has not established refugee settlements in the capital. The remaining 15% (121,948) were at transit centers in northern Uganda, awaiting registration.
Map 2 and Table 2 provide country of origin information for refugees by location. In Northern Region, refugees of predominantly South Sudanese origin reside in Adjumani District (Adjumani Settlement), Arua District (Arua Settlement), and Yumbe District (the newly established Bidibidi Settlement). Kiryandongo District (Kiryandongo Settlement) lies in the north of Western Region, and thus serves as another destination for refugees of mainly South Sudanese origin. The four remaining refugee host districts are located in Western Region: Kyegegwa District (Kyaka II Settlement), Hoima District (Kyangwali Settlement), Isingiro District (Nakivale and Oruchinga Settlements), and Kamwenge District (Rwamwanja Settlement). These four western refugee host districts predominantly host refugees who originated in DRC to the west.
Table 2 provides more detailed population data on Rwamwanja Refugee Settlement in Kamwenge District, the focus of this desk review. Kamwenge District lies in the Mid-Western Sub-Region of Uganda’s Western Region, about 190 miles from Kampala (Map 1). Kamwenge District includes Kamwenge Town Council, as well as two counties – Kitagwenda and Kibale – which are further divided into 13 sub-counties, 75 parishes, and 610 villages (GOU Kamwenge District 2016). An estimated 57,000 people resided at Rwamwanja Refugee Settlement as of August 2016. Rwamwanja Refugee Settlement is populated almost entirely (99%) by Congolese refugees. It was previously used to host Rwandan refugees, but closed following the repatriation of the Rwandans in 1995. Between 1995 and 2012, Ugandans moved onto the occupied land. When the Camp Commandant and other GOU representatives arrived to reclaim the land for the settlement of Congolese refugees, the resulting confrontation led to the unfortunate loss of life of the Camp Commandant.
2.2 Drivers of Displacement from the DRC DRC is the country of origin for 28% of Uganda’s refugees (UNHCR 2016d). Eastern DRC suffers from deeply entrenched economic, social, and political conflicts, which fuel an ongoing humanitarian and displacement crisis and contribute to instability in the region. Up to 70 local militia and other armed groups attack and terrorize civilians in eastern DRC (CFR 2016a). Rwamwanja Refugee Settlement was re-established in 2012 to accommodate refugees fleeing fighting in North Kivu, primarily between the Government of the DRC and a rebel group called the March 23 Movement
2 The eight rural refugee hosting districts are: Adjumani, Arua, Kiryandongo, Kyegegwa, Hoima, Isingiro, Kamwenge, and Yumbe Districts. A small number of refugees are hosted in Koboko Settlement in Koboko District; the GOU and UNHCR include these numbers in the figures for neighboring Arua District.

Opportunities to Provide Refugees and Ugandans with Alternative Livelihood Activities in Uganda’s Kamwenge District
6
(UNHCR 2014a). Although the March 23 Movement was defeated in 2013, continued fighting by various rebel groups fuels insecurity and displacement, because violence, rape, and killings are inflicted by small rebel groups on civilians (UNHCR 2014a, Asiimwe 2015).
Compounding this local crisis, DRC is quickly becoming embroiled in a national crisis around succession to President Joseph Kabila, whose presidential term – mandated by the Congolese Constitution to be his last – ends on December 19, 2016 (ICG 2016a). The period leading up to the presidential, legislative, and provincial elections has been marred by corruption and political persecution of opposition parties by the Kabila administration, and a lack of a clear and consensus-based public dialogue process. The number of Congolese refugees seeking safe haven in Uganda has varied with the sporadic nature of conflicts in the region, but UNHCR estimates the number of Congolese refugees in Uganda at 187,809 in 2013, 214,279 in 2014, 215,309 in 2015, and 222,650 in September 2016 (UNHCR 2016d). Currently about one sixth (16%) of Congolese refugees in Uganda reside in Kampala; most of the remainder reside in the Rwamwanja, Nakivale, Kyangwali, and Kyaka II Refugee Settlements (UNHCR 2016d). The number of Congolese refugees in Uganda will depend on efforts by the Government of the DRC to disarm rebel groups, as well as political developments at the national level in that country and in neighboring countries, but it is possible that the situation may not be resolved for some time to come.

Opportunities to Provide Refugees and Ugandans with Alternative Livelihood Activities in Uganda’s Kamwenge District
7
Table 1. Ugandan and Refugee Populations in all Refugee Hosting Districts in Uganda (September 2016)
Region Sub-region
Total district population (Ugandans and refugees
combined)
Total population of refugees in district (all settlements
combined) Number of refugees in district (Sept 30, 2016) as a % of the total population of the district (mid-2016)
District
Total district population (mid-2016) (and % of national population, UBOS 2015)
Refugee settlements in district
Total refugee population (UNHCR Sept 30, 2016)
Northern West Nile Adjumani 237,100 (0.6%) Adjumani Settlement
190,567 (24.1%)
80.4%
Northern West Nile Arua (including Koboko)
824,600 (2.2%) Rhino Camp, Koboko Settlements
57,184 (7.2%)
6.9%
Northern West Nile Yumbe 535,600 (1.2%) Bidibidi Settlement
8,285 (1.0%)
1.5%
Western Western Kiryandongo 282,400 (0.7%) Kiryandongo Settlement
66,369 (8.4%)
23.5%
Western Western Kamwenge 451,500 (1.2%) Rwamwanja Settlement
61,517 (7.8%)
13.6%
Western Western Hoima 619,000 (1.7%) Kyangwali Settlement
43,141 5.5%
7.0%
Western Western Kyegegwa 318,300 (0.9%) Kyaka II Settlement
28,892 (3.7%)
9.1%
Western Southwest Isingiro 525,100 (1.4%) Nakivale, Oruchinga Settlements
126,692 (16.0%)
24.1%
Kampala Kampala Kampala 1,568,900 (4.3%) Dispersed (no settlements)
84,875 (10.7%)
5.4%
National (Ugandans)
36,860,700 (100%)
National (all refugees and asylum seekers)
Registered: 667,842 Unregistered: 121,948 Total (100%): 789,770
2.1% (including registered and unregistered refugees)
Sources: GOU (2015), UBOS (2015), UNHCR (2016d).

Opportunities to Provide Refugees and Ugandans with Alternative Livelihood Activities in Uganda’s Kamwenge District
8
Table 2. Legal, Demographic, and Country of Origin Information for Refugees (Registered) in Rwamwanja Refugee Settlement and for All Refugees in Uganda (September 2016)
Rwamwanja Settlement
All Refugees in Uganda (Rural and Urban)
Status
Refugees 61,056 (99.3%) 628,238 (94.1%)
Asylum seekers 461 (0.7%) 39,584 (5.9%)
Total 61,517 (100.0%) 667,842 (100.0%)
Gender
Male 30,112 (48.9%) 326,077 (48.8%)
Female 31,405 (51.1%) 341,745 (51.2%)
Total 61,517 (100.0%) 667,842 (100.0%)
Age
Young children (<5 yrs) 14,175 (23.0%) 104,130 (15.6%)
Children (5-17 yrs) 23,147 (37.6%) 280,150 (41.9%)
Adults (18-59 yrs) 22,983 (37.4%) 267,743 (40.0%)
Elderly (60+ yrs) 1,212 (2.0%) 15,799 (2.4%)
Total 61,517 (100.0%) 667,842 (100.0%)
Countries of Origin
South Sudan 0 (0.0%) 327,728 (49.1%)
DRC 61,469 (99.9%) 222,650 (33.3%)
Burundi 0 (0.0%) 42,730 (6.4%)
Somalia 0 (0.0%) 38,068 (5.7%)
Rwanda 48 (0.1%) 17,734 (2.7%)
Eritrea 0 (0.0%) 11,720 (1.8%)
Sudan 0 (0.0%) 3,255 (0.5%)
Ethiopia 0 (0.0%) 2,859 (0.4%)
Other 0 (0.0%) 1,078 (0.2%)
Total 61,517 (100.0%) 667,842 (100.0%) Source: UNHCR (2016d).
Opportunities to Provide Refugees and Ugandans with Alternative Livelihood Activities in Uganda’s Kamwenge District
9
3. Food Security and Development Context in Kamwenge District and Rwamwanja Refugee Settlement
Quality data on refugees in Uganda are scarce, and the comparison of data for refugees and host communities are complicated by differing timeframes and research methodologies across the available studies. This section draws from settlement-level and urban research on refugee food security and economies, as well as on surveys and studies that cover Kamwenge District and Rwamwanja Refugee Settlement. The paper also summarizes research on Ugandan refugee populations by the University of Oxford Refugee Studies Centre’s Humanitarian Innovation Project (HIP) on the refugee populations of Kyangwali, Rwamwanja, and Nakivale Settlements and Kampala (University of Oxford 2014). A joint 2016 UNHCR, World Bank, and GOU assessment of Uganda’s refugee management approach also informs the discussion below (GOU, UNHCR, and World Bank 2016). Section 3.1 provides an overview of food security and livelihoods in Kamwenge District (focused on Ugandans, unless otherwise noted). Section 3.2 discusses food security and livelihoods in Rwamwanja Refugee Settlement. Section 3.3 discusses conflict in both Kamwenge District and Rwamwanja Refugee Settlement.
3.1 Food Security and Livelihoods in Kamwenge District 3.1.1 Poverty and Development in Kamwenge District The national poverty incidence in Uganda declined from 31% in 2005/2006 to 20% in 2012/2013, a drop of 37% (Figure 1). Poverty incidence is higher in Northern and Eastern Regions than in Central and Western Regions. Poverty incidence in Western Region dropped by over half (58%) from 2005/2006 to 2012/2013, the largest decline (in relative terms) of all four regions. Poverty reduction was driven largely by growth of the agriculture sector, driven in turn by high food prices on national and world markets, increases in the area under cultivation, and to a lesser extent the adoption of improved agricultural technologies.
Poverty is disproportionately concentrated among rural Ugandans – fully 90% of the poor lived in rural areas in 2013 (World Bank 2015). Being poor in Uganda is associated with: larger household size; higher dependency ratio; low educational attainment; lower access to electricity, piped water, mobile phones; and reporting farming as the primary economic occupation (World Bank 2015). Poor households are more likely than non-poor households to engage in employment in the informal sector characterized by low productivity work, low remuneration, hazardous working conditions, limited access to finance, low social mobility, lack of social protection, low accumulation of assets, and low skill development (World Bank 2015).
Western Region faces formidable challenges to pro-poor development going forward (Table 3). Almost one third (31%) of households in Western Region are female headed. Two-thirds (66%) of household heads have not completed primary education. Availability of key services is low: only half of communities (55%) have primary schools; 18% have a health facility; 34% have agricultural extension services; 10% have veterinary services; 11% have a market for selling crops; and one out of twenty has a financial institution (Table 3). Agricultural sector growth will require greater modernization and adoption of improved technologies and inputs going forward (World Bank 2015).
Table 4 presents development-related indicators for Kamwenge District, as well as for Mid-Western Sub-Region and Western Region where Kamwenge is located. Poverty is fueled by high fertility rates, and Kamwenge District’s total fertility rate of 6.9 births per woman is higher than Uganda’s

Opportunities to Provide Refugees and Ugandans with Alternative Livelihood Activities in Uganda’s Kamwenge District
10
16.4%20.5%
24.9%
60.7%
31.1%
4.7%8.7%
24.5%
43.7%
19.7%
0%
10%
20%
30%
40%
50%
60%
70%
Central Western Eastern Northern National
2005/2006 2012/2013
rate of 6.2 births per woman, which is already one of the highest in the world (UBOS and ICF 2012, GOU Higher Local Government 2009). A little over a third (37%) of children 6-12 years of age are currently attending school. Most (85%) households practice subsistence farming. The majority of households live in homes with non-permanent walls (83%) and floors (78%), with unimproved or no toilet facilities (84%).
Figure 1. Regional Poverty Trends (Poverty Headcount Index, 2005/2006 to 2012/2013)
Sources: UBOS 2014.
Table 3. Selected Development and Livelihoods Indicators by Region, Uganda
Central Eastern Northern Western
Household size 4.2 5.4 5.0 4.8
Dependency ratio 101 130 134 116
Household is headed by a female (%) 30 30 35 31
Head has no education (%) 14 19 27 25
Head has some primary education (%) 43 50 41 41
Head has completed primary education (%) 9 7 8 11
Head has some secondary education (%) 19 15 12 11
Head has completed secondary education (%) 7 5 3 5
Head has tertiary education (%) 6 3 5 5
Literacy rate among 18+ year olds (% literate) 79 60 56 72
Owns a mobile phone (%) 82 52 35 63
Has electricity (%) 40 6 3 8
Has piped water (%) 20 5 1 6
Availability of tarmac roads (%) 53 21 19 27
No toilet (%) 5 8 29 2
Owns land (%) 59 78 80 86
Median monthly nominal wages (UGX) 170,000 77,000 66,000 110,000
Pov
erty
hea
dcou
nt in
dex
(%)

Opportunities to Provide Refugees and Ugandans with Alternative Livelihood Activities in Uganda’s Kamwenge District
11
Percent of communities in which the following are available (%):
Primary school (public or private) 80.8 56.6 31.4 54.8
Health clinic or center (public or private) 27.8 17.3 12.7 17.8
Agricultural extension 12.1 26.4 13.2 34.2
Veterinary services 12.9 15.7 3.6 10.3
Market for selling agricultural produce 7.4 15.8 4.8 11.0
Bank or financial institution 3.4 5.5 0.1 5.8
Sources: UBOS 2014, World Bank 2015.
Table 4. Selected Development and Livelihoods Indicators for Western Region, Mid-Western Sub-Region and Kamwenge District
Indicator Western Region
Mid-Western Sub-Region
Kamwenge District National
Demographics
Sex ratio - 95.2 - 94.1
Female-headed households (%): - 30 - 31
Household size (persons/hh) - 4.6 4.7
Dependency ratio - 120.7 119.1
Population density (persons/sq. km.) - - 177 173
% of children who are orphans (<18 yrs) (%) - - 8.5 8.0
Ownership of a birth certificate (<5 yrs) (%) - - 18.0 27.5
Education
% children 6-12 years of age currently attending school (%)
- - 36.7 87.4
Literacy rate (18+ years) - - 66.7 81.5 (18-30 yrs)
Economics and Livelihoods
Percent of households whose primary economic activity is (%)
Agriculture, forestry and/or fishing 65 - - 33.8
Trade 11 - - 22.7
Manufacturing 7 - - 16.5
Transportation 3 - - 4.2
Construction 3 - - 4.6
Other services 13 - - 18.2
% of HH whose main source of livelihood is subsistence farming (%)
- - 85.0 64.7
Percent of smallholder farmers who access their land by (%)
Ownership with lease or certificate 37 - - -

Opportunities to Provide Refugees and Ugandans with Alternative Livelihood Activities in Uganda’s Kamwenge District
12
Ownership under customary law 37 - - -
Access the land communally (sharing with others)
4 - - -
Do not know/Other 23 - - -
% of HH that receive remittances (%) - - 13.9 17.6
Percent of households in each national welfare quintile (Anderson et al 2016)
Lowest - 8 - 20
Second - 15 - 20
Third - 21 - 20
Fourth - 26 - 20
Highest - 30 - 20
Median monthly wages for paid employment (USh)
Female employees - 77,000 - 66,000
Male employees - 127,000 - 132,000
Percent of the population that is unemployed - 7.5 - 9.4
Access to Assets and Services
% of HH with non-permanent wall (%) - - 82.9 56.3
% of HH with non-permanent roof (%) - - 17.4 29.4
% of HH with non-permanent floor (%) - - 77.7 33.4
% of HH with unprotected/unimproved water source (%)
- - 33.9 28.8
% of HH with unimproved or no toilet facility (%) - - 83.7 66.5
Sources: GOU UBOS 2014, Anderson et al 2016, UBOS 2016a, UBOS 2016b.
3.1.2 Food Security Status in Kamwenge District Chronic food insecurity is widespread in Kamwenge District. An analysis of chronic food insecurity in Uganda conducted by the United Nations Food and Agriculture Organization (FAO 2015) analyzed and classified levels of chronic food insecurity by sub-region. Chronic food insecurity was analyzed according to the following components: food security dimensions (availability, access, and utilization); livelihood capitals; hazards and vulnerability; and food security outcomes (food consumption quality and quantity) (FAO Uganda 2015). Almost two thirds (62%) of the population of Mid-Western Sub-Region suffers from mild (28%), moderate (17%), or severe (17%) chronic food insecurity. An analysis of the drivers of chronic food insecurity found that food utilization related factors - such as infant and young child feeding, water, sanitation and hygiene, and illness - are the major limiting factors. Poor food access was a minor limiting factor, indicating that food access was problematic but not as strong of a driver as poor food utilization. And in contrast to northern and eastern Uganda, food availability is not a limiting factor for food security in Mid-Western Sub-Region (FAO Uganda 2015).
The same study found that human and financial capital constraints are major limiting factors to food security in Mid-Western Sub-Region, and livelihood strategies, physical, natural, and social capital constraints were minor limiting factors to food security (FAO Uganda 2015). Human capital

Opportunities to Provide Refugees and Ugandans with Alternative Livelihood Activities in Uganda’s Kamwenge District
13
constraints include limited labor power, poor human resources development, and chronically high malnutrition rates. Financial capital constraints result from the inadequacy of access to finance for producers to address and overcome infrastructure, service, and production constraints. Policies, institutions, and processes were also found to be a major limiting factor in the sub-region, due to inadequate agricultural and veterinary extension services, financial services, and poor enforcement of existing GOU policies, laws, and ordinances (FAO Uganda 2015).
Kamwenge District and Western Uganda experience high levels of chronic food insecurity, but a lower risk of large-scale food and humanitarian crises than northern Uganda, and Karamoja in particular. The acute food insecurity situation in Uganda is monitored and projected by the USAID-funded Famine Early Warning Systems Network Project (FEWS NET). For the period of October 2016 to May 2017, FEWS NET projected that Western Region would experience minimal acute food insecurity (Phase 1), whereas most of Karamoja would be stressed (Phase 2) or crisis (Phase 3) (Map 3a) (FEWS NET 2016a). In bimodal areas of Uganda (i.e., most of the country, except for Karamoja), a long dry spell has caused moisture stress and wilting in staple crops, leading to crop losses in southwest and central Uganda. Fortunately, households are expected to earn enough income from the sale of cash crops to meet their food and non-food needs (FEWS NET 2016b). Households in western Uganda have a broad range of cash crops to draw upon, including coffee, tea, cotton, pulses, tobacco, sugar cane, and extractive products such as mining and timber (FAO Uganda 2015). However, the chronic food insecurity in Kamwenge is due to poor utilization and not a result of food availability. So even though FEWS NET expects most households to be able to meet their food needs, food insecurity will remain until the utilization improves.
Map 3a. Current food security outcomes (October 2016 – January 2017)
Source: FEWS NET 2016c.
Map 3b. Projected food security outcomes (February – May 2017)
Source: FEWS NET 2016c.

Opportunities to Provide Refugees and Ugandans with Alternative Livelihood Activities in Uganda’s Kamwenge District
14
3.1.3 Livelihoods of Ugandans in Kamwenge District According to the national livelihood zoning exercise, one livelihood zone encompasses all of Kamwenge District - the Central and Southern Maize and Cassava Livelihood Zone, which is a low-productivity zone in the southwest of Uganda’s Cattle Corridor (UG38 on Map 4) (FEWS NET 2010). About two thirds (65%) of households in Western Region report that their main economic activity relates to agriculture, forestry and/or fishing, and over half (55%) of the working population reports that they are engaged in subsistence agriculture, often in combination with other income generating activities (UBOS 2014). The figure is even higher for Kamwenge District specifically, where fully 85% of the population reports that subsistence farming provides the main source of livelihood (Table 4). Farming is dominated by bimodal smallholder subsistence production. Better-off households grow crops and livestock products for consumption and sale, and purchase food (FEWS NET 2010). Poor households obtain food via their own production, purchase, and exchanging labor for food; and earn income from sale of crops, labor, firewood, and charcoal (FEWS NET 2010).
Relatively little information is available regarding off-farm income generating activities in Kamwenge District. For the third of households (35%) that report that their main economic activity is not subsistence farming, the households reported engaging in: trade (11%), manufacturing (7%), transportation and construction (3% each), and various other services (13%). Trade includes commerce in food crops, cash crops (especially coffee and cotton), and non-food items. Manufacturing is concentrated in urban centers such as Kamwenge Town Council, and includes activities related to the extractive resources sector (e.g., lead, silver, zinc, and limestone/marble, as well as firewood, charcoal, and timber) and manufacturing of agricultural equipment (UCMP 2016). Business enterprises present in Kamwenge District include fishing, apiary production (beekeeping), livestock production enterprises (cattle, dairy cattle, goats, pigs, poultry), horticulture and fruit production (GOU Higher Local Government 2009). Finally, the abundance of riverine and wetland resources in Kamwenge, such as Lake George, the Mpanga River, Rushango River, and others, support artisanal fishing and fishing-based enterprises.
3.1.4 Crop Production in Kamwenge District The average amount of land put under cultivation by households in Kamwenge District was 0.8 ha (2.0 acres) in 2008 (UBOS 2010). Multiple land tenure regimes co-exist. Smallholder farmers in Western Region access their land via formal ownership with a lease or certificate (37% of households), ownership under customary law (37% of households), accessing land communally and sharing with others (5% of households), and other mechanisms (23% of households) (UBOS 2014). Climate conditions are considered to be broadly favorable for crops, water, and pasture in Kamwenge (GOU Higher Local Government 2009). Rainfall in Kamwenge District is relatively abundant at 1,200 mm/year, although rainy seasons are perceived to be increasingly erratic (GOU Higher Local Government 2009). Figure 2 presents the Ugandan seasonal calendar.
The main crops produced in Kamwenge District are maize, bananas, beans, cassava, Irish potatoes, sweet potatoes, groundnuts, and increasingly upland rice (GOU Higher Local Government 2009). The major cash crops grown include coffee, cotton, and tea (GOU Higher Local Government 2009). The GOU provides annual production estimates at national level (Table 5). National crop production averaged 14.7 million MT from 2010-2014. Regional production estimates are only available from the most recent agricultural census (2008, Table 6). Table 7 synthesizes area planted and production estimates for Kamwenge District from 2008. The 2008 agricultural census found that Western Region accounted for one fifth (21%) of Uganda’s maize, one fourth (28%) of Uganda’s finger millet, 17% of the country’s sorghum, 44% of the country’s beans, 68% of bananas (food type), 57% of bananas (beer type), 48% of bananas (sweet type), 15% of cassava, 20% of sweet potatoes, and 88% of Irish potatoes (UBOS 2010).

Opportunities to Provide Refugees and Ugandans with Alternative Livelihood Activities in Uganda’s Kamwenge District
15
Map 4. Livelihood Zones of Uganda
Source: FEWS NET 2010.

Opportunities to Provide Refugees and Ugandans with Alternative Livelihood Activities in Uganda’s Kamwenge District
16
Figure 2. Seasonal Calendar of Uganda
Source: FEWS NET 2013.
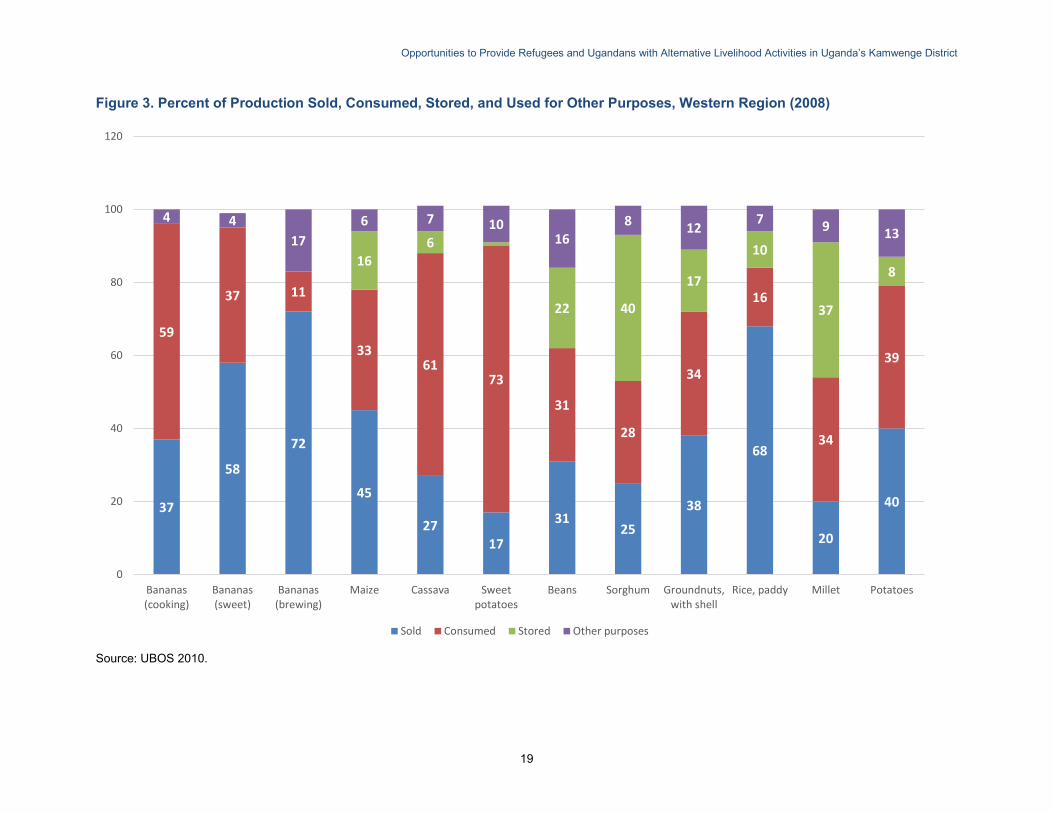
Figure 3 illustrates the proportions of production of the major crops that are sold, consumed, stored, and put to other uses for Western Region specifically. Cooking bananas, cassava, sweet potatoes, and millet are primarily consumed within the household, while sweet bananas, beer bananas, maize, and rice are primarily sold. Beans, sorghum, groundnuts, and Irish potatoes are divided fairly evenly between sale and consumption.
According to the GOU National Agriculture Policy (2013), the main threats to agricultural development in Uganda include: low production and productivity; low value added to agricultural produce; lack of sustainable or dependable access to markets; lack of capacity in GOU institutions and lack of enforcement of existing policies and strategies; labor constraints; high prevalence of disease; insecure land tenure and land fragmentation (driven by high fertility rates); and inadequate attention to climate change and environmental sustainability considerations (GOU 2013). The World Bank-based Consultative Group to Assist the Poor (CGAP) has found that 84% of smallholder farmers reported that their agricultural production activities were seriously affected by weather-related events in the previous three years; 66% reported being seriously affected by pests or diseases; and 40% reported being seriously affected by unexpected market price fluctuation over the same period (Anderson et al. 2016). Perhaps because of all of these challenges facing agriculture in Uganda as well as their proximity to Kampala, Western Region has the highest percentage of smallholder farmers who wish to leave farming (43%) (Anderson et al. 2016). These smallholder farmers state that they would take full time employment if they were offered a job, would be open to doing off-farm work, and do not regard agricultural activities as the legacy that they want to leave for their families (Anderson et al. 2016). These attitudes are much more prevalent among younger farmers than those over 40 years of age (Anderson et al. 2016).
The National Agriculture Policy lists factors that favor the country’s agricultural development, including: adequate land and water resources for agricultural production; high potential to improve productivity; high export potential for agricultural products to regional and international markets; renewed regional and international focus on agriculture as a critical mechanism for sustainable social and economic development; and increasing medium and large-scale private sector investment in agricultural value chains.

Opportunities to Provide Refugees and Ugandans with Alternative Livelihood Activities in Uganda’s Kamwenge District
17
Table 5. National Crop Production Estimates for Uganda (MT, 2010-2014)
Crop 2010 2011 2012 2013 2014 Average (2010-2014)
Plantain bananas (all types)3 4,694,000 4,699,000 4,503,000 4,375,000 4,578,000 4,569,800
Maize 2,374,000 2,551,000 2,734,000 2,748,000 2,868,000 2,655,000
Cassava 3,017,000 2,712,000 2,807,000 2,980,000 2,812,700 2,865740
Sweet potatoes 1,987,203 1,798,000 1,852,000 1,811,000 1,817,900 1,853,221
Beans 949,000 915,000 870,000 941,000 1,011,000 937,200
Sorghum 391,000 437,000 336,000 299,000 299,000 352,400
Groundnuts, with shell 276,000 327,000 295,000 295,000 295,600 297,720
Sunflower seed 253,000 265,000 230,000 238,000 290,000 255,200
Rice, paddy 218,000 233000 212,000 214,000 237,000 222,800
Millet 268,000 257,000 244,000 228,000 236,000 246,600
Potatoes 167,000 180,000 185,000 175,000 181,000 177,600
Sesame seed 119,000 142,000 124,000 124,000 145,000 130,800
Soybeans 27,216 32,000 23,000 23,000 27,900 26,623
Wheat 20,000 23,000 20,000 20,000 22,000 21,000
Field peas 17,000 17,000 12,000 17,000 17,000 16,000
Cow peas 12,000 12,000 10,000 13,000 13,000 12,000
Pigeon peas 13,000 13,000 13,000 13,000 13,000 13,000
TOTAL 14,802,419 14,613,000 14,470,000 14,514,000 14,864,100 14,652,704 Source: UBOS 2015.
Table 6. Regional Crop Production Estimates for Uganda (MT, 2008)
3 The category of bananas includes bananas for eating (cooking banana/matoke and sweet banana) and bananas for beer.

Opportunities to Provide Refugees and Ugandans with Alternative Livelihood Activities in Uganda’s Kamwenge District
18
Crop Central Western Northern Eastern National
Plantain bananas (all types) 1,039,834 2,883,653 31,626 342,236 4,297,349
Maize 449,858 497,744 305,796 1,108,556 2,361,954
Cassava 409,810 440,190 983,124 1,061,185 2,894,309
Sweet potatoes 312,405 366,297 292,932 847,139 1,818,773
Sorghum 2,678 62,716 177,090 133,310 375,794
Rice, paddy 2,174 16,649 43,719 128,196 190,738
Millet 13,735 77,786 78,573 106,841 276,935
Potatoes 13,291 135,210 1,311 4,625 154,437
TOTAL 2,243,785 4,480,245 1,914,171 3,732,088 12,370,289 Source: UBOS 2015.
Table 7. Acreage Planted and Production Estimates in Kamwenge District (MT, 2008)
Crop Area planted (ha) Production (MT)
Plantain bananas (all types) 16,371 113,212
Maize 18,071 21,729
Sorghum 2,573 1,428
Cassava 4,879 20,931
Sweet potatoes 3,243 18,444
Rice 127 90
Irish potatoes 1,193 4,737
Finger millet 2,110 1,449
Source: UBOS 2010.
Opportunities to Provide Refugees and Ugandans with Alternative Livelihood Activities in Uganda’s Kamwenge District
19
Figure 3. Percent of Production Sold, Consumed, Stored, and Used for Other Purposes, Western Region (2008)
37
58
72
45
2717
3125
38
68
20
40
59
37 11
3361
73
31
28
34
16
34
39
166 1
22 40
17
10
37
8
4 4
17
6 7 1016
8 127 9 13
0
20
40
60
80
100
120
Bananas(cooking)
Bananas(sweet)
Bananas(brewing)
Maize Cassava Sweetpotatoes
Beans Sorghum Groundnuts,with shell
Rice, paddy Millet Potatoes
Sold Consumed Stored Other purposes
Source: UBOS 2010.

Opportunities to Provide Refugees and Ugandans with Alternative Livelihood Activities in Uganda’s Kamwenge District
20
3.1.5 Livestock in Kamwenge District Kamwenge is located at the southwestern edge of Uganda’s mixed-farming zone, and includes arid-semi-arid and humid/sub-humid areas. The average household in Kamwenge District was estimated to own 5 cattle, 9.4 goats, 4.4 pigs, and 11 chickens (UBOS 2011). Livestock are kept for milk, eggs, and occasionally meat consumption, and for sale. Most animals are sold live and then slaughtered for consumption in Ugandan destination markets.
Table 8. Livestock Estimates in Kamwenge District, Western Region, and National (MT, 2008)
Kamwenge District Western Region National
Cattle 120,906 2,548,620 11,408,750
Goats 154,422 3,452,240 12,449,670
Sheep 26,239 567,390 3,410,370
Pigs 34,280 778,350 3,184,310
Chickens 339,191 7,210,120 37,385,800
Turkeys 363 21,900 348,330
Ducks 11,237 300,610 1,458,250
Total 686,638 14,879,230 69,645,480
Source: MAAIF 2011.
3.1.6 Markets and Trade in Kamwenge District Relatively little data has been published about markets and trade at the sub-national level in Uganda. The Ugandan National Household Survey (UNHS 2012-2013) found that in the Mid-Western Sub-Region, only 10% of communities had markets where agricultural inputs were sold; 19% had markets where agricultural produce was sold; and 12% had markets where non-agricultural produce was sold (UBOS 2014). In terms of transportation, the UNHS also found that only 17% of communities had tarmac (paved) trunk roads, while 86% had unpaved trunk roads, 98% had feeder roads, and 99% had community roads (UBOS 2014).
FEWS NET monitors and reports prices monthly for major commodities (cooking banana/matoke, sorghum, millet, cassava chips, beans and maize). FEWS NET monitored markets in Arua, Gulu, Lira, Soroti, Mbale, Masindi, Kampala, and Mbarara. Using this data, it has produced market and trade flow maps for major crops in Uganda. Maps 5 and 6 present the flow of bananas and maize in Uganda. Bananas, maize, and other crops sold by Kamwenge’s producers tend to be taken by traders to large urban markets in western and southwestern Uganda (e.g., Hoima, Mubende, Mbarara), Kampala, and towards markets serving the food deficit areas of northern Uganda.

Opportunities to Provide Refugees and Ugandans with Alternative Livelihood Activities in Uganda’s Kamwenge District
21
Map 5. Market Flows of Bananas in Uganda
Source: FEWS NET 2008.
Map 6. Market Flows of Maize in Uganda
Source: FEWS NET 2011.

Opportunities to Provide Refugees and Ugandans with Alternative Livelihood Activities in Uganda’s Kamwenge District
22
3.1.7 Savings and Credit in Kamwenge District Smallholder farmers in Mid-Western Sub-Region have fairly low levels of financial literacy and little savings or access to credit. The UNHS (2012-2013) found that only 3% of communities in Mid-Western Sub-Region had a financial institution (UBOS 2014). CGAP research found that smallholder farmers in Western Region were unlikely to ever have used a mobile money provider for financial activities: only 28% of households reported ever having used a mobile money provider, and only 20% of households reported having a registered account with a mobile money provider (Anderson et al. 2016). These numbers may improve in the future, however, because Uganda has a vibrant microfinance industry. The Association of Microfinance Institutions of Uganda member microfinance institutions (MFIs) are operating in 90 districts across every region of the country (AMFIU 2013). The following microfinance institutions operate in Kamwenge District: BRAC Uganda, Finance Trust, Kahunge Rural SACCO, Kamwenge Zibumbe SACCO, and Post Bank (AMFIU 2013). BRAC Uganda’s network of regional offices, area offices, and branches provide microloans to households and women who are not served by other microfinance institutions (BRAC Uganda 2015). BRAC Uganda also has a small enterprise program, which extends loans to entrepreneurs seeking to expand their small businesses. The small enterprise program operates through 90 branches in 39 districts, and targets men and women who need more credit than is available through microloans, but lack the collateral required for loans from commercial banks (BRAC Uganda 2015).
3.1.8 Remittances in Kamwenge District Around 14% of households in Kamwenge District report receiving remittances from abroad (Table 4). There is substantial national-level data available on remittance flows to Uganda and the impact of remittances on development and household poverty. Remittance flows to Uganda are relatively large: The World Bank estimates that Uganda received $1.1 billion in remittances in 2015 (KNOMAD 2016). World Bank-funded research in 2010 found that nationally, an estimated 39% of Ugandans have a relative living outside of Uganda, and 18% of Ugandans receive remittances frequently, while 7% receive remittances infrequently. An estimated 14% of Ugandans do not receive remittances and the balance (61%) does not have a relative living outside of Uganda. Ugandans who do get remittances receive an average of $160 per transfer, 6 times per year. Most (64%) of these funds are sent via banks by relatives who live either elsewhere in Africa (45%) or in the Americas (21%). Most (87%) of recipients are of working age (between 18 and 49 years) and male (61% vs. 39% female); and three-quarters (77%) live in rural areas. One-tenth (10%) of recipients had a household income <10,000 USh, 22% had a household income of between 100,000 and 300,000 USh, 35% had an income between 300,000 and 900,000 USh, 12% had an income of 900,000 USh or more, and 21% did not report their household income level (Bendixen and Amandi International 2010). Remittance recipients tend to use the funds to support their livelihoods and for economic development of their households. When asked what portion of the remittance money they spend on daily necessities such as food, clothes, housing, utilities, and medicine, 12% of recipients said “all of it,” 13% said “about three-quarters of it,” 25% said “about half of it,” 35% said “a quarter or less of it,” and 13% said “none of it” (Bendixen and Amandi International 2010).
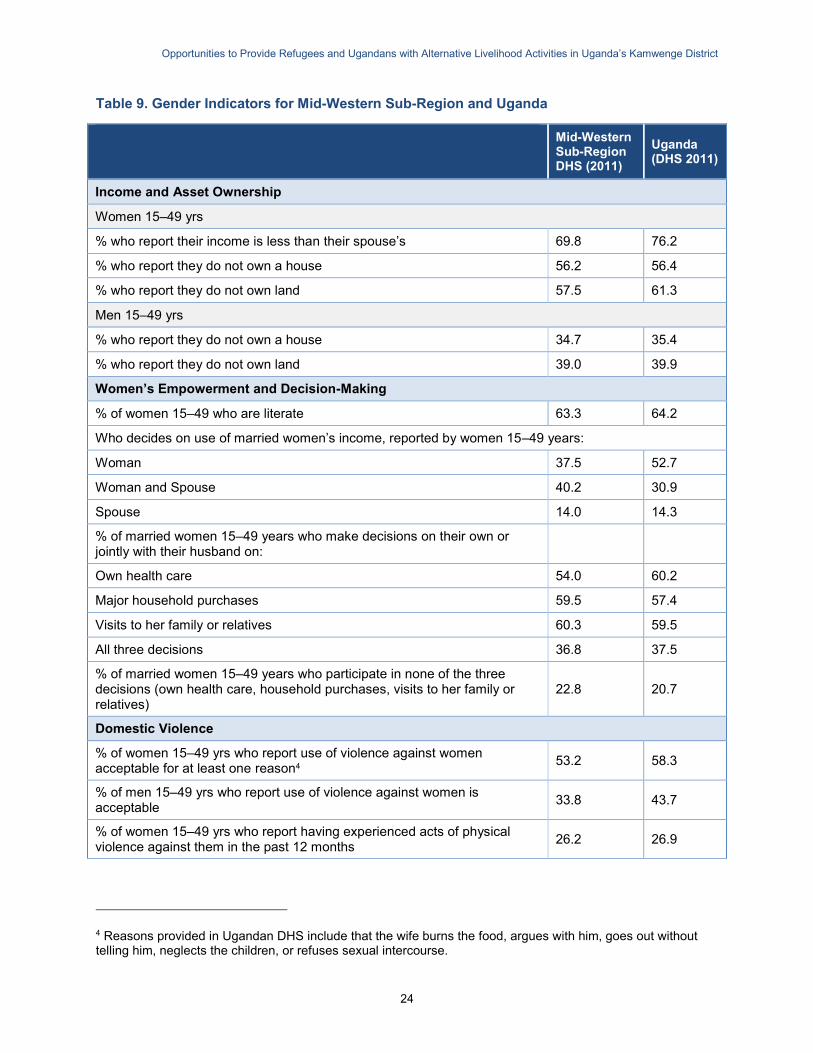
3.1.9 Gender, Youth, and Vulnerable Groups in Kamwenge District The gender context in Western Uganda is one of culturally rooted gender inequalities, women’s disempowerment, early marriage, high fertility rates including among adolescents, a high unmet need for family planning, unequal access to education for girls, pervasive sexual and gender-based violence (SGBV), limited access to land ownership, productive assets, and microfinance, and limited control over household income and decision-making among women (Table 9). Such is the case in part, because gender inequities are coded into customary law that often supersedes Ugandan law in

Opportunities to Provide Refugees and Ugandans with Alternative Livelihood Activities in Uganda’s Kamwenge District
23
practice (USAID 2016). Female-headed households are at higher risk of poverty in Uganda and elsewhere. As noted above (Section 3.1.1), almost a third (30%) of households in Mid-Western Sub-Region are female-headed (UBOS 2014). USAID/Uganda’s Inclusive Development Analysis revealed that female-headed households are more vulnerable than male-headed households because of gender inequities in livelihoods, income, control over natural resources, decision-making in households and communities, and realization of basic rights.
Children and youth also face many challenges in Uganda. Youth in Uganda suffer from high unemployment, limited access to education or facilities where they can develop practical skills, low literacy and numeracy rates, and limited access to land and credit. Children face high risk of malnutrition, morbidity and inadequate access to essential health services, discussed below.
3.1.10 MCHN and WASH in Kamwenge District Although Kamwenge is in a better-off region of the country, the maternal and child health and nutrition (MCHN) situation is concerning. In Mid-Western Sub-Region, 44% of children under 5 are stunted, 3% are wasted, and 16% are underweight (Table 10). Almost four out of ten have anemia (39%). In the two weeks preceding the 2011 DHS survey, almost a fifth (19%), over a fourth (39%) and almost a fifth (17%) of children had diarrhea, a fever and acute respiratory infection symptoms respectively. About 60% of children receive all basic immunizations by 2 years of age.
The nutrition and health situation of women is closely associated with that of their children. Women in the Mid-Western Sub-Region have a high total fertility rate (6.4 children per woman), with an interbirth interval of 31 months (Table 10). Women bear the brunt of the burden of domestic tasks, as well as significant work responsibilities in this predominantly agricultural district. Together with frequent pregnancies, the factors support a cycle of undernutrition of women and children. Slightly over a fourth (27%) of married women are using any modern form of birth control. Most (96%) pregnant women receive some antenatal care from a skilled provider, but only 56% of births are delivered by a skilled provider. Access to iron supplements, deworming supplements and long-lasting insecticidal nets among pregnant women is inadequate.
Poor conditions and behaviors related to water, sanitation and hygiene (WASH) are known contributors to malnutrition and illness in Western Uganda. In Kamwenge District specifically, a third (34%) of households have unimproved or unprotected water sources, and 84% of households have unimproved or no toilet facility (Table 4) (UBOS 2014). Only a fifth (22%) of households have hand washing stations, and only a third (32%) of those hand-washing stations have soap and water (Table 10).
Opportunities to Provide Refugees and Ugandans with Alternative Livelihood Activities in Uganda’s Kamwenge District
24
Table 9. Gender Indicators for Mid-Western Sub-Region and Uganda
Mid-Western Sub-Region DHS (2011)
Uganda (DHS 2011)
Income and Asset Ownership
Women 15–49 yrs
% who report their income is less than their spouse’s 69.8 76.2
% who report they do not own a house 56.2 56.4
% who report they do not own land 57.5 61.3
Men 15–49 yrs
% who report they do not own a house 34.7 35.4
% who report they do not own land 39.0 39.9
Women’s Empowerment and Decision-Making
% of women 15–49 who are literate 63.3 64.2
Who decides on use of married women’s income, reported by women 15–49 years:
Woman 37.5 52.7
Woman and Spouse 40.2 30.9
Spouse 14.0 14.3
% of married women 15–49 years who make decisions on their own or jointly with their husband on:
Own health care 54.0 60.2
Major household purchases 59.5 57.4
Visits to her family or relatives 60.3 59.5
All three decisions 36.8 37.5
% of married women 15–49 years who participate in none of the three decisions (own health care, household purchases, visits to her family or relatives)
22.8 20.7
Domestic Violence
% of women 15–49 yrs who report use of violence against women acceptable for at least one reason4 53.2 58.3
% of men 15–49 yrs who report use of violence against women is acceptable 33.8 43.7
% of women 15–49 yrs who report having experienced acts of physical violence against them in the past 12 months 26.2 26.9
4 Reasons provided in Ugandan DHS include that the wife burns the food, argues with him, goes out without telling him, neglects the children, or refuses sexual intercourse.

Opportunities to Provide Refugees and Ugandans with Alternative Livelihood Activities in Uganda’s Kamwenge District
25
Mid-Western Sub-Region DHS (2011)
Uganda (DHS 2011)
% of women 15–49 yrs who report experiencing sexual violence in the past 12 months 15.5 16.2
Educational Attainment
Women 15–49 yrs
% who report no formal education 16.0 12.9
% who report some/completed primary school 58.5 59.4
% who report some/ completed secondary school 21.5 22.5
% who report are age-literate 63.3 64.2
Men 15–49 yrs
% who report no formal education 4.2 4.1
% who report some/completed primary school 65.7 60.2
% who report some/ completed secondary school 21.3 27.2
% who report they are age-literate 74.6 77.5
Table 10. MCHN and WASH Indicators for Mid-Western Sub-Region and Uganda
Mid-Western Sub-Region DHS (2011)
Uganda (DHS 2011)
Children’s Health and Nutrition
% of children under 5 stunted (HAZ < -2) 43.9 33.4
% of children under 5 wasted (WHZ < -2) 2.7 4.7
% of children under 5 underweight (WAZ < -2)
15.5 13.8
% children 6–59 months with MUAC < 125 mm — —
% children 6–59 months with MUAC < 115 mm — —
% of children 6–59 months with anemia (Hb < 11g/dL) 38.6 49.3
% children 6–59 months received deworming in past 6 months (with card or mother’s recall) 52.7 50.2
% children 6–59 months received vitamin A supplementation in past 6 months (with card or mother’s recall) 60.0 56.8
% children 6–59 living in house with iodized salt 98.4 99
% children ever breastfed 98.3 98.3
% of children breastfed within 1 hour of birth 61.2 52.5
% children who received prelacteal feeds 48.0 41.1
% of children under 6 months exclusively breastfed — 63.2

Opportunities to Provide Refugees and Ugandans with Alternative Livelihood Activities in Uganda’s Kamwenge District
26
Mid-Western Sub-Region DHS (2011)
Uganda (DHS 2011)
Median duration (months) of exclusive breastfeeding 4.4 3.4
Median duration of breastfeeding (months) 16.5 19.4
% with minimum diet diversity — 12.8
% with minimum feeding frequency — 44.8
% with minimum acceptable diet — 5.8
% of children under 5 who had diarrhea in the 2 weeks preceding the survey 18.8 23.4
% of children under 5 classified as having malaria (based on microscopy)5 — 18.9
% of children under 5 with fever in 2 weeks preceding survey9 28.4 30.7
% of children under 5 who had acute respiratory infection symptoms in the 2 weeks preceding the survey 16.8 14.8
Immunization
% of children 12–23 months who received all basic immunizations 59.7 51.6
Prevention and Treatment of Child Illness
% of children under 5 with diarrhea for whom advice or treatment was sought from a healthy facility or provider 64.4 72.4
Among children under 5 who had diarrhea in the 2 weeks preceding the survey, % who received oral rehydration therapy 38.5 48.2
Among children under 5 who had diarrhea in the 2 weeks preceding the survey, % who received zinc supplements 3.6 1.9
% of children under 5 with fever for whom advice or treatment was sought from a health facility or provider9 83.4 82.0
% of children under 5 with acute respiratory infection for whom advice or treatment was sought from a health facility or provider 76.0 78.7
% of children under 5 who slept under an insecticidal net the previous night9 82.3 74.2
Maternal Mortality
Maternal mortality ratio (per 100,000 live births) — 432
Marriage
Median age at first union (of women 20–49 yrs) 17.9 18.1
% of women 15–49 yrs in a polygamous union 23.7 24.6
Fertility and Family Planning
Total fertility rate (child per woman) 6.4 6.2
Number of ideal children as reported by women age 15–49 yrs 4.9 4.8
Median age at first birth (of women 20–49 yrs) 18.8 18.9
5 Data from UBOS and ICF International. 2015. Malaria Indicators Survey. Kampala, Uganda: UBOS.

Opportunities to Provide Refugees and Ugandans with Alternative Livelihood Activities in Uganda’s Kamwenge District
27
Mid-Western Sub-Region DHS (2011)
Uganda (DHS 2011)
% of women 15–19 yrs who have begun childbearing by age 19 22.6 23.8
Median number of months since preceding births (of women 15–49) 30.8 30.2
% of currently married women 15–49 using any modern method of birth control 26.8 26.0
% of women in union reporting wanting to limit births 39.8 42.5
Pregnancy and Delivery Care
% of pregnant women 15–49 receiving antenatal care from a skilled provider 95.9 95.4
% of pregnant women 15–49 attending 4 or more antenatal care visits — 47.6
% of births delivered by a skilled provider 55.8 58
Anemia and Micronutrients
% of women 15–49 who are anemic (non-pregnant <12.0g/Dl; pregnant < 11.0g/Dl) 17.3 23.0
% of women 15–49 reporting having taken iron supplements for more than 90 days during their last pregnancy 4.0 3.9
% of women 15-49 reporting having taken deworming supplements during their last pregnancy 51.7 49.9
% of pregnant women 15–49 who slept under a long-lasting insecticidal net the previous night6 83.3 75.4
% of women 15–49 who gave birth in the preceding 2 years who reported receiving 2 doses of intermittent preventive treatment of malaria10 51.0 45.2
% living in houses with iodized salt (among women with a child born in the previous 5 years) 98.4 99
Water, Sanitation and Hygiene
% households with access to improved sanitation — 16.4
% households with open defecation as primary method — —
% households with access to improved water source — 70.3
% households that treat water — 46.8
Average water access (liters/person /day) (approximate) — —
% households with hand-washing stations 22.1 29
% of hand-washing stations with soap and water 31.8 27
6 UBOS and ICF International. 2015. Uganda Malaria Indicator Survey 2014-2015. Kampala Uganda and Rockville, MD: UBOS and ICF International.

Opportunities to Provide Refugees and Ugandans with Alternative Livelihood Activities in Uganda’s Kamwenge District
28
3.2 Food Security and Livelihoods in Rwamwanja Refugee Settlement 3.2.1 Food Security Status in Rwamwanja Refugee Settlement The food security situation in Kamwenge District, where Rwamwanja Refugee Settlement is located, is broadly characterized by widespread chronic food insecurity, driven by inadequate food accessibility and utilization, and a weak policy and systems environment. Per GOU policy, all refugees in Uganda are integrated into local economies, production systems, and market networks. A relatively recent (2015) food security and nutrition assessment found a mixed – but overall positive - food security situation in Rwamwanja Refugee Settlement (GOU, UNICEF, WFP and UNHCR 2015). Over four fifths (84%) of households had an acceptable food consumption score, 14% had a borderline food consumption score, and a small minority (2%) had a poor food consumption score (GOU, UNICEF, WFP and UNHCR 2015). The FCS reflects current food security status at the time of data collection. The utilization of food consumption coping strategies was assessed via the Reduced Coping Strategies Index, which measures behaviors adopted by households when they have difficulty covering their food needs, such as reliance on less preferred and/or less expensive foods, borrowing foods, relying on help from friends or relatives, reducing the number of meals eaten per day, reducing the portion size of meals. The assessment estimated the reduced coping strategies index of 9.64, which indicates a fairly low prevalence of these consumption-based coping strategies. The study also assessed the prevalence of livelihood coping strategies, and found that: about half (51%) of households were not adopting livelihood coping strategies at all; one fifth (21%) were adopting stress coping strategies; only 8% were adopting crisis coping strategies, and one fifth (21%) were adopting emergency coping strategies.
Access to humanitarian assistance may account at least in part for the low level of food insecurity in this study. UNHCR, the United Nations World Food Programme (WFP), and partners provide humanitarian assistance to refugees upon arrival, to be phased out after a 5-year period. Research conducted in Rwamwanja in 2014 found that almost all (99.7%) of the refugees reported receiving food assistance, as they had arrived within the previous five years (Figure 4). Accordingly, many refugees in Rwamwanja reported feeling “very dependent” on UNHCR, WFP, and/or other organizations (78.7% of households), while one fifth (19.2%) reported feeling somewhat dependent on these organizations, and only 2.1% of refugees reported not feeling dependent on these organizations for basic needs (GOU, UNICEF, WFP and UNHCR 2015). It is possible that the households experiencing food insecurity (as measured by the use of consumption of livelihood coping strategies) include those who are not receiving a ration, and/or those experiencing illness in a family member (the most frequent shock reported in that 2015 study).

Opportunities to Provide Refugees and Ugandans with Alternative Livelihood Activities in Uganda’s Kamwenge District
29
Figure 4. Percent of Households Receiving Different Types of Assistance, Rwamwanja Settlement
99.7%
30.4% 30.4%
14.3%8.8%
1.9% 0.8% 0.3%0%
10%
20%
30%
40%
50%
60%
70%
80%
90%
100%
Food items Medical care Education Non-fooditems
Livelihoodinputs
Legal services Job trainingand business
advice
Money
Type of assistance
Per
cen
t o
f h
ou
seh
old
s (%
)
Source: University of Oxford 2014.
3.2.2 Livelihoods in Rwamwanja Refugee Settlement Like their Ugandan neighbors, refugees in Rwamwanja Settlement practice predominantly agricultural livelihoods. Over half (56%) of households reported working on other people’s plots for money, and about the same percentage (55%) of households reported farming their own plot and selling some proportion of the production in a 2014 study (University of Oxford 2014). Similarly, the 2015 assessment discussed above found that the most important income sources for refugees in Rwamwanja were crop production and sale, followed by agricultural wage labor (GOU, UNICEF, WFP and UNHCR 2015).
Refugees at Rwamwanja Refugee Settlement supplement on-farm labor with a range of income-generating activities. Most households (96%) have at least one income earner (Table 11). Refugees are mainly engaged in livelihood activities associated with low incomes and no job security (GOU, UNHCR and World Bank 2016). A small percentage of households reported hawking/vending (3%), animal husbandry/livestock sale (2%), owning a small shop (2%), or any of several dozen other income generating activities (University of Oxford 2014).7
Uganda’s refugee policies allow refugees to seek employment outside of the settlement if they obtain the proper authorization. Refugees’ ability to secure employment is influenced by many factors: the duration of their stay (i.e. time since arrival), level of education, attitude of the host community, employment history, possession of important personal identification documents, language barriers, interviewing skills, discrimination (real or perceived), and social networks (GOU, UNHCR and World Bank 2016).
7 Other IGAs included: running a bar or café, carpentry, trade/middleman, formal employment, boda-boda/motorcycle taxi, construction, brickmaking, tailoring, paid community work; teacher/school (elementary or secondary school or religious school); fast-food stand; selling clothing, textiles, shoes, and /or accessories; bicycle mechanic; fishery; doctor/nurse; employee at fuel station; taxi/mini-bus; clergy (priest, pastor, imam, evangelist); restaurant; hair plaiting/beauty services (without shop); commercial goods transport; cinema; pharmacy; general mechanic; daily casual labor; craft-making; cleaners; butchery; begging; beauty/hair salon; security guard; brokerage; money lender; phone charging; and porters.

Opportunities to Provide Refugees and Ugandans with Alternative Livelihood Activities in Uganda’s Kamwenge District
30
Similarly, data on livelihoods activities of Congolese refugees living elsewhere in Uganda portray diverse livelihoods patterns including on-farm and off-farm activities. Among refugees in Kyangwali and Nakivale Settlements, Congolese refugees most frequently reported that their top source of livelihood was farming their own plots, followed by farm labor for others, construction work, running a small shop, or employment with an organization (Betts et al. 2014). Congolese refugees who have self-settled in Kampala were the most likely to report engagement in various types of businesses (e.g., selling clothes or textiles, tailoring, brokerage, or providing hair and beauty services) as their top source of livelihood, rather than agriculture (Betts et al. 2014).
Most self-employed/entrepreneur refugees do not employ non-household members in their primary livelihood activity, but a minority do (15.2% in Rwamwanja) (University of Oxford 2014). Among the self-employed/entrepreneur refugees who employ non-household members in their business, most (85-95%) employ between 1 and 4 people (University of Oxford 2014). In the relatively new Settlement of Rwamwanja, all such employees are refugees (University of Oxford 2014). Further, refugees are the most commonly reported employer of other refugees in the Rwamwanja Refugee Settlement. Most self-employed/entrepreneur refugees in Rwamwanja prefer to sell their goods and services within their settlements (Table 12). Almost all (98%) of the refugees in Rwamwanja reported selling goods and services only inside the settlement (University of Oxford 2014). However, this does not mean that all of their customers are refugees. Four-fifths (81%) of self-employed refugees in Rwamwanja reported that their largest sales come from Ugandan customers (University of Oxford 2014). A quarter (27%) of self-employed refugees report buying the supplies for their income generating activity (IGA) outside the settlement at least some of the time, while 70-73% of self-employed refugees buy their supplies only within the settlement. It should be noted, however, that the suppliers they buy from may be purchasing from Ugandan wholesalers or middlemen from outside the settlement.
An estimated 84% of employed refugees in Rwamwanja are employed by Ugandans, while only a quarter (25%) are employed by refugees (Table 13) (University of Oxford 2014).8 As refugees shift from working for Ugandans to working for other refugees, they are more likely to work within the boundaries of the settlement.
The education level of refugees is quite low. Between one-fifth to one-third have never been to school, and almost half have completed some primary education (Table 14). Despite this, refugees use technology such as mobile phones extensively, where available, and they can be quite innovative (Table 15). In addition, high social connectedness among some refugee groups enables vibrant and profitable trade economies in the settlements, with products procured from and sold as far away as in global markets.
8 The figures add up to more than 100% because respondents were permitted to provide more than one answer to the question.

Opportunities to Provide Refugees and Ugandans with Alternative Livelihood Activities in Uganda’s Kamwenge District
31
Table 11. Selected Development and Food Security Indicators for Refugees, Rwamwanja Settlement
Indicator Rwamwanja Settlement
Household size (people/HH) 4.7
% female headed households 18%
Average land size per HH (acres): Flatland (garden) Upland (cultivation)
0.18 0.32
% land “owned” (allocated and used): Flatland (garden) Upland (cultivation) Swamp
56% 44% 0%
% HH owning any goats 5%
% HH owning any poultry 18%
% HH with >=1 income earner (%) 96%
% HH owing debt 45%
Average HH debt (UG Shillings) 41,600
Source: GOU, UNICEF, WFP and UNHCR (2015).

Opportunities to Provide Refugees and Ugandans with Alternative Livelihood Activities in Uganda’s Kamwenge District
32
Table 12. Economic Behaviors of Self-Employed Refugees (Main Household Income Earner), Rwamwanja Settlement
Indicator Rwamwanja Settlement
Percent of self-employed refugees who typically sell their goods and services at this type of location (%)
Only inside settlement 98.1%
Only outside settlement 1.1%
Both inside and outside settlement 0%
Don’t know/refused to answer 0.8%
Percent of self-employed refugees who derive their largest sales from this type of customer (%)
Ugandans 81.3%
Refugees of same country of origin 17.7%
Refugees of different country of origin 0.8%
Don’t know/refused to answer 0.3%
Percent of self-employed refugees who buy the supplies for their primary livelihood activity at this type of location (%)
Only inside settlement 69.6%
Only outside settlement 23.7%
Both inside and outside settlement 6.4%
Don’t know/refused to answer 0.3%
Percent of self-employed refugees who employ any non-household members in their primary livelihood activity (%)
Yes 15.2%
No 83.7%
Don’t know/refused to answer 1.1%
Among self-employed refugees who employ at least one non-household member in their primary livelihood activity, the number of people employed (%)
1-2 people 42.1%
3-4 people 43.9%
5-6 people 14.0%
Among self-employed refugees who employ at least one non-household member in their primary livelihood activity, the nationality of the person(s) employed (%)
Refugee 100%
Ugandan 0%
Source: University of Oxford 2014.

Opportunities to Provide Refugees and Ugandans with Alternative Livelihood Activities in Uganda’s Kamwenge District
33
Table 13. Economic Behaviors of Refugees who are Employed by Others (Main Household Income Earner), Rwamwanja Settlement
Indicator Rwamwanja Settlement
Among HH whose main household income earner’s primary livelihood activity is employment by others, the nationality of the main household income earner’s employer* (%)
Ugandan 83.6%
Refugee 25.1%
UNHCR or other implementing or operational partner agency 7.3%
Among HH whose main household income earner’s primary livelihood activity is employment by others, the location where the main household income earner works (%)
Villages near the settlement 81.3%
Inside the settlement 37.0%
Larger Ugandan towns 0.5%
Source: University of Oxford 2014.
Table 14. Level of Education of Refugee (Main Household Income Earner) Upon Arrival to Refugee Settlement, Rwamwanja Settlement
Indicator Rwamwanja Settlement
% of HH in which the main household income earner has this level of education upon arrival to Kamwenge Refugee Settlement
Never been to school 34.1%
Primary school begun or completed 45.2%
Secondary school begun or completed 17.8%
University begun or completed 1.0%
Vocational training school 0.7%
Master degree or above 0%
Don’t know 1.2%
Source: University of Oxford 2014.

Opportunities to Provide Refugees and Ugandans with Alternative Livelihood Activities in Uganda’s Kamwenge District
34
Table 15. Power Sources and Information/Communication Technologies (ICT) in Refugee Households, Rwamwanja Settlement
Indicator Rwamwanja Settlement
% of HH using this type of power source in the HH* (%)
Wood for fire 7.6%
Fuel 4.4%
Generator 1.7%
Solar panel 1.5%
Charcoal for fire 0.7%
Large battery 0.5%
Electricity from a power line 0%
Other 4.4%
% of main household earners who use a mobile phone in their primary livelihood activity (%)
Yes 21.5%
No 78.5%
Among those HH whose main household income earner use a mobile phone in their primary livelihood activity, the mobile phone is used for* (%)
Communicate with suppliers, customers and colleagues 96.8%
Find out market information 51.2%
Transfer money for business transactions 9.4%
Learn new business skills 0%
% of HH that use (%)
Mobile phone 51.3%
Radio 26.0%
Personal computer 0.2%
Internet 3.9%
For HH in which at least one HH member uses the internet, how they access the internet* (%)
Mobile phone 95.8%
Internet café 8.3%
Computer (owned/borrowed) 4.2%
* Multiple responses permitted, so percentages may not add to 100%.
Source: University of Oxford 2014.

Opportunities to Provide Refugees and Ugandans with Alternative Livelihood Activities in Uganda’s Kamwenge District
35
3.2.3 Crop Production in Rwamwanja Refugee Settlement By Ugandan law, refugees cannot “own” land (i.e., hold in perpetuity), but they are allocated land by the GOU, and they can rent land from Ugandan nationals. Likewise, many refugees who do not wish to farm rent the land that they have been allocated to other refugees and engage in off-farm IGAs (Betts et al. 2014). The GOU aims to allocate a land plot of between 30 x 50 m (0.37 acres/0.15 ha) and 50 x 100 m (1.24 acres/0.5 ha) to each refugee household, for shelter, farming and livestock (Johansen S 2016). The average land size per household in Rwamwanja is a half-acre, split between flatland for a house and kitchen garden, and an upland plot for cultivation (Table 11). The size of land allocated to households is reducing annually across Uganda’s refugee settlements because of high population density, long duration of displacement, and competing claims to land by local communities. Neither the GOU nor the UN has conducted a formal agricultural survey among refugees to assess production and productivity.
3.2.4 Livestock in Rwamwanja Refugee Settlement Relatively few households own livestock in this relatively recently established settlement (18% for poultry, 5% for goats) (Table 5). Investment in livestock is a priority of local households to diversify household income, as well as provide a valuable source of milk, eggs and meat for the diet. Given the small land parcels allocated to households and the sensitivity of the issue of land allocation when Rwamwanja Settlement was established, planning for growing livestock numbers would need to address land constraints and establish agreements governing land and water source use with the local communities.
3.2.5 Markets and Trade in Rwamwanja Refugee Settlement Research conducted by the University of Oxford’s HIP clearly demonstrates the strength and scope of economic relationships among refugees and between refugees and Ugandan nationals. Most households in Rwamwanja purchase goods and services from both Ugandans and refugees. The large majority of refugees in Rwamwanja reported buying goods and services from Ugandan nationals (89.7%) and three-quarters (77.6%) buy goods from refugees. (About half (55%) of Rwamwanja’s refugees report traveling outside of the settlement at least once weekly to purchase daily goods and services; the rest leave the settlement less frequently (28.2% at least once monthly, 1.8% at least once annually, and 14.8% never leave their settlement to purchase daily goods/services) (University of Oxford 2014). Although data on the average distance traveled is not available, the overwhelming majority (99.0%) of refugees who purchase daily goods and services outside of Rwamwanja Refugee Settlement, make those purchases in nearby villages, rather than traveling to Hoima or Kampala.
Some refugees are connected to urban markets in urban trading centers, but most self-employed refugee entrepreneurs conduct their business primarily inside the settlement. An estimated 98.1% of refugee entrepreneurs in Rwamwanja only sell their goods and services inside the settlement (University of Oxford 2014). They may leave the settlement to purchase supplies in large towns such as Hoima, the town closest to Rwamwanja Refugee Settlement. Less than three-quarters of self-employed refugee entrepreneurs (69.6%) report only buying their supplies inside the settlement (University of Oxford 2014).
Uganda law permits Ugandan nationals to request authorization to enter settlements for trade purposes. An estimated 81.3% of refugee entrepreneurs in Rwamwanja reported that Ugandan customers account for a larger portion of sales than refugees (University of Oxford 2014). Because

Opportunities to Provide Refugees and Ugandans with Alternative Livelihood Activities in Uganda’s Kamwenge District
36
refugee produce is known for its high quality and low prices, Ugandans enter refugee settlements to purchase foodstuffs including maize, beans, sorghum, cassava, and potatoes (University of Oxford 2014). Ugandan middlemen and crop traders purchase tons of maize in settlement markets, and then resell it in Hoima, Kampala, other Ugandan cities (including in northern Uganda), or neighboring countries (University of Oxford 2014). Map 7 presents the trade network of maize grown by refugees in Kyangwali, Nakivale and Kampala; although Rwamwanja is not included, the map reflects domestic demand for refugee-grown production that refugees in Kamwenge may aim to meet.
Map 7. Trade Network for Refugee-Grown Maize
Source: Betts et al. 2014.
3.2.6 Savings and Finance in Rwamwanja Refugee Settlement Almost half (45%) of refugees in Rwamwanja Refugee Settlement report having debt, and the average debt level is 41,600 USh (Table 5) (GOU, UNICEF, WFP and UNHCR 2015). The most common reason for new debt is to cover health expenses, followed by purchase of food (GOU, UNICEF, WFP and UNHCR 2015). Despite the plethora of microfinance institutions operating in Uganda, very little data is available on credit accessibility and savings in Uganda’s rural refugee communities. The Oxford HIP found that lack of access to credit is a significant barrier to IGAs and innovation across refugee populations in Uganda (Betts et al. 2015). Given this global finding, it is likely that few refugees in Uganda’s settlements have access to loans from financial institutions such as banks or microfinance institutions. Institutions are often reluctant to provide services to refugees,

Opportunities to Provide Refugees and Ugandans with Alternative Livelihood Activities in Uganda’s Kamwenge District
37
who often lack documentation of their education, work and credit history, and who may repatriate or resettle before repaying their loans.
In the absence formal mechanisms, refugees often establish informal, community-based mechanisms to fill the gap. Rotating credit and savings associations, for example, allow members to contribute monthly to a shared fund, from which they can borrow at a reasonable interest rate (e.g., 5%) to secure start-up or investment capital for IGAs (Betts et al. 2014). Some refugee communities in Uganda, such as the Somali, have cultural traditions whereby community members donate funds to support vulnerable community members. Loans are also individually arranged between refugees who have social connections (Betts et al. 2014). In addition, there have been a few cases in which refugees in Uganda’s settlements established small microfinance businesses (Omata and Kaplan 2013).
3.2.7 Remittances in Rwamwanja Refugee Settlement The GOU National Population and Housing Census (NPHC) contains data on remittances received in the settlements. Only 14.5% of Rwamwanja’s refugees reported receiving remittances from abroad in the 2014 NPHC (UBOS 2016b). Remittances from employed friends and family are a more important income source for some refugees than others. Refugees in Rwamwanja did not include remittances as one of their top two sources of income (GOU, UNICEF, WFP and UNHCR 2015).
3.2.8 Gender, Youth, and Vulnerable Groups in Rwamwanja Refugee Settlement The refugee population of Rwamwanja Settlement is gender balanced (51% female), but disproportionately skewed toward youth under 18 years of age (60%) in Rwamwanja, Table 1). Research on refugee livelihoods in Uganda found that the poorest, least self-sufficient, and most vulnerable groups included disabled people, orphans, elderly people, those who are chronically ill, widows, female-headed households, and recent refugee arrivals (Omata and Kaplan 2013). Many use negative coping strategies because of their vulnerability (e.g., widows engaged in commercial sex, or begging among orphans, people with disabilities, and the elderly). These refugees are often unable to meet basic food and non-food needs because of reduced physical capacity and limited access to markets, social networks, and assets.
Figure 5. Average Monthly Income of Refugee Households, Rwamwanja Refugee Settlement (USh/month)
Source: University of Oxford 2014.
1.1%
22.3% 22.3% 21.2%
9.9%
6.9%6.2%
10.3%
0%
5%
10%
15%
20%
25%
0 USh 1-50,000USh
50,001 –100,000 USh
100,001 –150,000 USh
150,001 –200,000 USh
200,001 –250,000 USh
250,001 –300,000 USh
300,001 –2,000,000
USh
Per
cen
t o
f h
ou
seh
old
s (%
)
Montly income (USh/month)

Opportunities to Provide Refugees and Ugandans with Alternative Livelihood Activities in Uganda’s Kamwenge District
38
3.2.9 MCHN and WASH in Rwamwanja Refugee Settlement Table 16 synthesizes indicators for MCHN and WASH in Rwamwanja Settlement from 2015. Four in ten children (41%) is stunted, and half (49%) has anemia. Morbidity in children is widespread, with 22%, 45% and 35% of children having diarrhea, fever and/or acute respiratory infection symptoms in the previous two weeks respectively. Almost all children are breastfed, but complementary foods are introduced late, and among children 9-23 months, only 43% had minimum meal frequency, 16% had minimum dietary diversity, and 0% had a minimum acceptable diet. There is room for improvement of immunization, deworming, vitamin A supplementation, oral rehydration therapy, and mosquito net use.
Many women are mildly underweight, although moderate and severe underweight are rare (1.7% of women). A quarter (25%) of women are anemic, which is probably attributable in part to frequent pregnancies and inadequate coverage of iron/folate supplementation in pregnancy, as well as inadequate dietary diversity.
Most households (92%) obtain water from a borehole, and piped water is uncommon (6%). Three quarters of households (78%) use private latrines. Handwashing/hygiene information was not available.
Table 16. MCHN and WASH Indicators for Rwamwanja Refugee Settlement
Rwamwanja Settlement (2015)
Children’s Health and Nutrition
% of children under 5 stunted (HAZ <-2) 41.4
% of children under 5 underweight (WAZ <-2) 15.1
% of children under 5 with global acute malnutrition (GAM) 3.4
% of children under 5 with severe acute malnutrition (SAM) 0.6
% of children 6-59 months with MUAC <125 mm 5.4
% of children 6-59 months with MUAC <115 mm 0.9
% of children 6-59 months with anemia (HB < 11 g/dL) 49.2
% of children under 5 who had diarrhea in the 2 weeks preceding the survey 21.8
% of children under 5 who had a fever in the 2 weeks preceding the survey 45.4
% of children under 5 who had symptoms of acute respiratory infection in previous 2 weeks 34.5
% of children under 6 months exclusively breastfed 87.2
% of children 6-8 months who did not receive complementary foods in previous 24 hours 51.6
% of children 9-23 months with minimum feeding (meal) frequency 43.0
% of children 6-23 months with minimum dietary diversity 16.4
% of children 6-23 months with minimum acceptable diet 0.0
% of children 0-23 months with timely initiation of breastfeeding 98.4
% of children 12-15 months still being breastfed 81.8

Opportunities to Provide Refugees and Ugandans with Alternative Livelihood Activities in Uganda’s Kamwenge District
39
Rwamwanja Settlement (2015)
% of children 20-23 months still being breastfed 64.0
% of children 6-8 months who have been introduced to solid, semi-solid or soft foods 51.6
% of children 6-23 months consuming iron-rich or iron-fortified foods 42.1
% of children 0-23 months being bottle fed 0.0
Immunization
% of children 12-23 months with measles coverage (with card) 32.7
% of children 12-23 months with measles coverage (with or without card) 53.9
% of children 12-23 months who have received DPT 3 coverage (with card) 46.5
% of children 12-23 months who have received DPT 3 coverage (with or without card) 76.5
Prevention and Treatment of Child Illness
% of children 12-23 months who have received de-worming (with card) 23.5
% of children 12-23 months who have received de-worming (with or without card) 44.7
% of children 12-23 months who have received Vitamin A supplementation (with card) 26.3
% of children 12-23 months who have received Vitamin A supplementation (with or without card) 47.5
Among children under 5 who had diarrhea in the 2 weeks preceding the survey, % who received oral rehydration therapy 34.5
% of households owning at least one mosquito net 33.4
% of children under 5 who slept under mosquito net the previous night 41.0
Women’s Health and Nutrition
% of women 15-49 who are moderately or severely underweight (BMI <18.5) 1.7
% of women 15-49 with anemia (HB < 11 g/dL) 25.1
Pregnancy
% of women 15-49 who are currently pregnant 16.4
% of women 15-49 who are currently breastfeeding 52.0
% of women 15-49 who are currently pregnant and breastfeeding 1.1
% of women 15-49 who are currently not pregnant and not breastfeeding 30.5
% of women 15-49 who are currently pregnant and are attending antenatal care services 61.0
% of women 15-49 who are currently pregnant and receiving iron/folate supplements 59.2
Water, Sanitation and Hygiene
% of households receiving water from each type of source:
Piped water 6.1
Protected well or spring 0.0

Opportunities to Provide Refugees and Ugandans with Alternative Livelihood Activities in Uganda’s Kamwenge District
40
Rwamwanja Settlement (2015)
Borehole 92.1
Open well or spring, surface water or rain water 1.9
UNHCR tanker/truck 0.0
Average (mean) volume of water used daily by households (liters) 50.5
% of households that use each type of latrine:
Latrine (not shared) 77.5
Latrine (shared) 11.6
No latrine 10.9
Source: GOU, UNICEF, WFP and UNHCR 2015.
3.3 Conflict in Kamwenge District and Rwamwanja Refugee Settlement Countries that host refugees are sometimes plagued by inter-ethnic tensions and conflict, and such tensions may be present in refugee settlements, as well. The GOU and UNHCR aim to strike a balance between promoting peaceful co-existence between different groups wherever possible, and providing separate areas of residence between known adversaries, where necessary. Overall, stakeholders (local leaders in host communities, refugee welfare councils, officials from the Office of the Prime Minister, district and local government officials, implementing partners, and UNHCR) report that relations are remarkably peaceful among refugees and between refugees and host communities across Uganda (GOU, UNHCR and World Bank 2016). The Ugandan people’s general welcoming and friendly approach to outsiders helps to promote peace. Also, longer refugees stays tend to favor peaceful coexistence through greater economic interdependence, intermarriage, and mutual socio-cultural familiarity.
Conflict over land is often the main driver of conflict between refugees and host communities. To set aside land for refugee settlements and villages, the GOU must negotiate land allocations with host communities. Host communities’ perceptions of the fairness of these land negotiations are key to triggering or preventing conflict. Conflict can arise if the process of moving/evicting the local population is not handled delicately, particularly if the host community had been using the land prior to the establishment of the refugee settlement. Whenever conflict occurs, efforts are needed to reduce security/safety risks to women, girls, boys, and men. During the establishment of Rwamwanja Settlement in 2012, a Camp Commandant died during a land dispute between local community members who claimed ownership of the land and representatives of the Office of the Prime Minister, who were charged with establishment of Rwamwanja Settlement and transfer of Congolese refugees to this new site (Basiime and Mutegeki 2012).
However, the GOU has a rule known as the 70/30 rule, which dictates that externally funded and implemented activities in Uganda should ensure that a minimum of 30% of the benefit of the intervention will go towards Ugandan nationals. The 70/30 rule is intended to promote equitable development and avert/minimize conflict. This national commitment to helping refugee host districts boost health and development outcomes, self-reliance, and resilience among refugees and nationals, alike, has contributed to the generally positive nature of relations among refugees and between refugees and host populations.

Opportunities to Provide Refugees and Ugandans with Alternative Livelihood Activities in Uganda’s Kamwenge District
41
4. Uganda’s Policies, Strategies, and Plans for Refugees and Individuals Seeking Asylum
4.1 GOU Policies, Strategies, and Plans The GOU’s approach to hosting refugees is broadly characterized by: opening its doors to all refugees; recognition of a wide array of rights of refugees; confirming their implicit coverage by the Ugandan Constitution as well as national policies, strategies and plans; inclusion in national systems and processes; promoting their self-reliance; and seeking equity in welfare and service provision between refugees and hosting district populations (GOU, UNHCR and World Bank 2016).
The GOU Office of the Prime Minister Department of Refugees works with district governments, UNHCR and other international partners to seek sustainable solutions for refugees and individuals seeking asylum. Sustainable solutions refer to long term solutions for legal and residence status of refugees, and typically include availing permanent citizenship in the country of refuge, voluntary repatriation (return) to the country of origin, and voluntary permanent resettlement in a third country. Uganda’s legal regime for protecting refugees consists of international/regional conventions and declarations, and national legislation and regulations (GOU, UNHCR and World Bank 2016). Three international/regional agreements are instrumental: Uganda is a signatory to the Convention Relating to the Status of Refugees (1951), the 1976 Protocol Relating to the Status of Refugees, and the 1969 Organization of African Unity Convention Governing the Specific Aspects of Refugee Problems in Africa.
The two most important national legal instruments that explicitly address refugees are the GOU Refugee Act (2006) (GOU 2006) and the GOU Refugee Regulations (2010) (UNHCR 2015a). The Refugee Act (2006) defines the term “refugee,” outlines the rights and responsibilities of refugees in Uganda, and describes the process for finding durable solutions for refugees (Akello and Dobbs 2009). The law states that refugees have the right to work, freedom of movement, and the right to live in settlements (rather than refugee camps), all of which are designed to support self-reliance (Akello and Dobbs 2009). The GOU Refugee Regulations (2010) further clarify the rights and obligations of refugees under Ugandan law, in accordance with international standards and conventions.
The GOU and partners – most notably the UNCT9 - have articulated strategies for operationalizing these international and national policy instruments. The first two are: the GOU/UNHCR Self-Reliance Strategy for Refugee Hosting Areas in Moyo, Arua, and Adjumani Districts (Self Reliance Strategy, or SRS, 1999); and the associated GOU Development Assistance to Refugee Hosting Areas Program (DAR) (GOU 2009). The SRS laid out a vision for self-reliance programming for the refugee populations in northern Uganda. The DAR was developed to operationalize the SRS, and had five main pillars: making the SRS a national strategy and initiating national efforts to promote development, good governance and peaceful coexistence in all refugee host districts; strengthening effective governance and integrating refugees and host communities into development planning at the district level; prioritizing IGAs and diversified livelihoods for self-reliance; promoting coexistence
9 In Uganda, the UN Country Team includes UNICEF, WFP, UNFPA, UNHCR, WHO, FAO, OHCHR, UNAIDS, UNDSS, UNDP, non-resident agencies (HABITAT, IFAD, ILO, OCHA, UNCDF, UN ESCO, UNIDO, UNIFEM), World Bank, IMF, and IOM. (Source: UNOCHA (xxx). Eastern Africa: Uganda. Available: http://www.unocha.org/eastern-africa/about-us/about-ocha-eastern-africa/uganda.)

Opportunities to Provide Refugees and Ugandans with Alternative Livelihood Activities in Uganda’s Kamwenge District
42
and providing security for refugees and host communities; and empowering refugee and host communities to take the lead in their own development (GOU, UNHCR and World Bank 2016).
The third and fourth strategies for guiding refugee related operations in Uganda are being established presently: the GOU Settlement Transformative Agenda (2015, draft); and the GOU/UNCT Refugee and Host Community Empowerment Strategy (ReHoPE, 2015, draft) (UNCT 2015). The STA is part of the second National Development Plan 2 (NDPII). The NDPII stipulates that the GOU must “formulate and implement a national refugee policy; develop and implement a Refugee Settlement Transformative Agenda; develop and implement a contingency plan for refugee emergencies; review domestic laws governing refugees; develop and implement projects and programs for refugees and refugee host areas; and receive and grant asylum to refugees in accordance with national, regional, and international covenants” (UNPA 2015). The STA integrates refugees into national development policies and programming, rather than pushing for separate multi-year programming specifically for refugees. The goals are to achieve self-reliance for refugees, and to promote long-term social development in refugee host areas, while protecting national and local interests. The GOU has requested a $50 million soft loan from the World Bank (WB) to fund the Settlement Transformative Agenda.
Led by UNHCR and the UNCT in collaboration with the GOU, ReHoPE is a new strategic framework for community self-reliance and resilience in refugee host districts (UNCT 2015). The ReHoPE Strategic Framework will guide the ReHoPE Joint Programme. The goal of ReHoPE is to coordinate GOU, UNCT and partner resources so that refugees are protected by the GOU, live in safety and dignity with host communities, and progressively attain lasting solutions. ReHoPE aims to strengthen the self-reliance and resilience of refugee and host communities by: fostering sustainable livelihoods for refugees and host communities, thereby contributing to socio-economic growth; progressively improving social service delivery capacity in refugee host areas, with a view to integrating services with local government systems; and creating an enabling environment for refugees to live in safety, harmony and dignity with host communities and protect their natural environment while contributing to social cohesion. ReHoPE describes two broad livelihood pathways in rural Uganda: a market-oriented agricultural pathway and an off-farm pathway focused on employment and/or business (UNCT 2015). The ReHoPE Joint Programme will be developed alongside the STA to ensure consistent and comprehensive programming. ReHoPE provides a basis for joint programming of up to $350 million over five years, involving UN agencies, the WB, the GOU, development partners, development donors, and the private sector. In June–July 2016, a UNHCR consultant went to Uganda to design the ReHoPE Joint Programme. It will contain three pillars: 1) a soft loan from the WB for the Settlement Transformative Agenda; 2) ReHoPE funding from UNHCR; and 3) bilateral funding, including FFP-supported development programs). The process will have two phases: strategy development and implementation (O’Brien 2016).
In addition to laws, policies, and strategies focusing on refugees, key GOU policies that guide economic development in Uganda include:
Vision 2040 (2007–2040): This document aims to operationalize the national vision statement, “A Transformed Ugandan Society, from a Peasant to a Modern and Prosperous Country within 30 Years” (UNPA 2007). The Vision 2040 document does not specifically mention refugees.
National Development Plan II (NDPII, 2016-2020): The theme of the second National Development Plan is “Strengthening Uganda’s Competitiveness for Sustainable Wealth Creation, Employment, and Inclusive Growth” (UNPA 2015). The NDPII does not explicitly discuss refugees.

Opportunities to Provide Refugees and Ugandans with Alternative Livelihood Activities in Uganda’s Kamwenge District
43
National Land Policy (2013): The National Land Policy directs the GOU to resolve ambiguities in land allocation to nationals and refugees to minimize the risk of conflict (MLHUD 2013).
National Agriculture Policy (2013): The National Agriculture Policy does not specifically mention refugees (MAAIF 2013).
Peace, Recovery, and Development Programme II (PRDP2, 2015/2016-2019/2020): The PRDP was initially established in 2009 to support stabilization, recovery, and development in Northern Uganda (GOU 2012). The PRDP1 and PRDP2 focused on nationals and do not explicitly address the needs of refugees or the impacts of refugee populations on social services in northern Uganda.
Uganda Nutrition Action Plan (2011-2016): With the goal of reducing malnutrition among women of reproductive age, infants, and young children, the multisectoral Uganda Nutrition Action Plan 2011–2016 guides nutrition programming throughout Uganda. Eight sectors have committed to its five objectives, which focus on improving access to and use of nutrition services, enhancing consumption of diverse diets, protecting households from shock, strengthening the policy environment and programming, and creating awareness and commitment to nutrition programs (GOU 2011). Refugees are not explicitly mentioned in the Nutrition Action Plan.
The GOU Office of the Prime Minister operates on-site Settlement Management Teams and oversees a Refugee Welfare Council, which includes refugee representatives (Omata and Kaplan 2013). Refugees reside in settlements, not formal camps. The GOU gives them a plot of land upon which to build a residence and to cultivate, as well as access to health care, education, and other services. They can enter into contracts, including land leases with Ugandans. They also have the right to GOU identity cards and documents including birth, death, marriage, and education certificates (UNCT 2015, GOU, UNHCR and World Bank 2016). More generally, the GOU assumes responsibility for the protection and overall management of the settlements. It places a high priority on ensuring equitable services and development for both refugees and the host community in refugee host districts, and advocates with partners to ensure that 30% of the assistance given to refugee populations benefits host communities.
High refugee flows into Uganda are straining the government’s ability to implement these progressive policies. Refugees in Uganda who cannot be repatriated or resettled in a third country can very rarely attain Uganda citizenship, even refugees who are born in Uganda and have one Ugandan parent (UNCT 2015, GOU, UNHCR and World Bank 2016). Many refugees in Uganda have been in the country for more than 10 or even 20 years. They often are well integrated into the Ugandan economy, may have intermarried with Ugandans, do not intend to repatriate to their country of origin, and have no reasonable expectation of third country resettlement. Such refugees remain in limbo because long-term legal solutions are still being formalized. The fact that such situations are likely to be protracted underscores the need for self-reliance and resilience programming for the population of host districts.
The GOU recognizes the enormous and complex impact that refugee populations can have on host communities, and understands the need to provide integrated programs that benefit refugees and Ugandan nationals, alike, in refugee host districts. Many refugees are settled in underdeveloped areas with high levels of chronic poverty, especially in northern Uganda, so the needs are often great in host populations, as well. As mentioned in Section 3.3, the GOU has determined that externally funded programs and initiatives that benefit refugees should benefit host communities as well, to the ratio of 70/30 (70% benefit to refugees, 30% benefit to Ugandans). This may be achieved by separately funded and implemented initiatives targeting the distinct populations, or by establishing or strengthening systems, facilities and services that the two populations share.

Opportunities to Provide Refugees and Ugandans with Alternative Livelihood Activities in Uganda’s Kamwenge District
44
4.2 UN Policies, Strategies, and Plans The UNCT is a key partner in ensuring the protection of refugees and providing life-saving assistance to refugees and host communities in Uganda. The efforts of the UN in Uganda are guided by:
The Delivering as One (DaO) Initiative in Uganda: The DaO Initiative was launched as a global pilot by the UN in 2007, and it was adopted in Uganda in 2011 (United Nations Uganda 2016a). Under the DaO Initiative, an empowered resident coordinator leads the UNCT to implement one nationally owned UN strategy in the country, called the United Nations Development Assistance Framework, and to provide support for joint analysis, thinking, prioritization, budgeting, and programming (United Nations Uganda 2016a).
United Nations Development Assistance Framework for Uganda (UNDAF, 2016-2020): The UNDAF places special emphasis on building resilience in refugee and host communities, as well as in Karamoja (United Nations Uganda 2016b). The UNDAF has three major focal areas, in line with national developmental objectives: 1) supporting good governance as related to rule of law, human rights, gender equality, institutional development, peace, security and resilience; 2) enhancing human capital through skills strengthening, health, social protection, SGBV and violence against children, and HIV/AIDS; and 3) supporting sustainable and inclusive development through natural resource management and climate change resilience, infrastructure, protection and trade, and employment.
UNHCR Handbook for Self-Reliance (2005): The UNHCR Handbook for Self-Reliance lays out the rationale for adopting a community development approach for refugees, and identifies the principles and tasks integral to this approach (UNHCR 2015c).
UNHCR Livelihood Programming in UNHCR: Operational Guidelines (2012): The 2012 Operational Guidelines provide detailed guidance for undertaking livelihoods assessments, designing and planning livelihoods projects, establishing partnerships, conducting monitoring and evaluation, and phasing out and handing over livelihoods projects in refugee populations (UNHCR 2012).
UNHCR Global Strategy for Livelihoods (2014): The Global Strategy for Livelihoods articulates four strategic objectives: 1) promote the right to work and right to development; 2) enable people to preserve and protect their productive assets as well as meet their immediate consumption needs; 3) develop and expand proven and innovative ways of supporting people’s economic self-reliance; and 4) improve planning, learning and practice on successful approaches to livelihoods development and their impact on self-reliance (UNHCR 2014b).
UNHCR Livelihood Strategy for Uganda Operation (expected in 2016/2017): A strategy for UNHCR’s livelihoods activities is currently in development.
Regional frameworks that guide refugee crisis management: The GOU and UNHCR aim to be consistent with existing strategies for managing refugee crises in refugees’ countries of origin. The Framework of Hope: Peace, Security, and Cooperation Framework for the Democratic Republic of Congo and the Region therefore guides programming for refugees from DRC, the population in Kamwenge District’s Rwamwanja Settlement.

Opportunities to Provide Refugees and Ugandans with Alternative Livelihood Activities in Uganda’s Kamwenge District
45
5. Selected Programs in Rwamwanja Refugee Settlement
5.1 UN and Multilateral Programs UNHCR works with the GOU’s Office of the Prime Minister to protect refugees and to identify and implement durable solutions for refugees, especially voluntary repatriation and third country resettlement, given that a pathway to legal citizenship is not easily available to refugees in Uganda. The Office of the Prime Minister appoints and oversees camp commanders to run the settlements, while UNHCR coordinates the maintenance and management of transit centers, reception centers, way stations, and collection points (UNHCR 2015b). UNHCR also funds many essential services, generally provided by non-governmental organizations (NGOs), as well as distribution of non-food items to refugees.
WFP is implementing a Country Programme (2016–2020) and a complementary Protracted Relief and Recovery Operation (PRRO, 2016–2018) in Uganda (WFP 2015, WFP 2016). The Country Programme is largely focused on Karamoja, while the PRRO focuses on refugees and host communities, vulnerable households in Karamoja, and national level capacity strengthening (Table 17). The Country Programme has three components: agriculture and market support (AMS), including training for smallholder farmer organizations; strengthened nutrition services, including prevention and management of acute malnutrition; and school feeding in Karamoja’s primary schools. The nutrition services component also includes a micronutrient powder pilot in Eastern Uganda.
The PRRO also three components: refugee response and livelihoods, building resilience in Karamoja, and strengthening emergency preparedness. The refugee response and livelihoods component includes general food assistance as well as a cash transfer pilot for refugees; a livelihoods project pilot for refugees and host communities; and prevention and management of acute malnutrition among refugees. The resilience component allows for conditional cash transfers to highly food-insecure households in Karamoja, supports productive asset creation, and provides food assistance during the lean season. The emergency preparedness component focuses on strengthening the GOU’s capacity in the following areas: emergency preparedness and response, early warning systems, and food security and nutrition information systems.
The influx of refugees from South Sudan has necessitated two budget revisions to the PRRO in 2016, to increase food and cash assistance levels to cover new arrivals. Refugees receive either cash or food as general assistance. They may also qualify for targeted supplementary feeding for treatment of malnutrition (TSFP), targeted supplementary feeding for prevention of malnutrition in specific groups (MCHN), and/or livelihood support. As of December 2016, food and cash assistance programs served an estimated 1,086,350 refugees in Uganda (Table 17).
UNHCR and WFP are partnering on a global Joint Programme on the Promotion of Self-Reliance in Protracted Refugee Situations (GOU, WFP, UNHCR 2015). The program’s objective is to “increase refugees’ self-reliance in protracted refugee situations, improve their access to livelihood opportunities, and reduce long-term reliance on humanitarian assistance” (GOU, WFP, UNHCR 2015). Country-specific research and pilots are being undertaken under this joint program to explore whether a multi-stage joint approach to refugee assistance by WFP and UNHCR can promote self-reliance among refugees (WFP 2013). Under the program, UNHCR and WFP are piloting a joint project for self-reliance in Rwamwanja and Kyangwali Settlements from 2015–2018 that will (GOU, WFP, UNHCR 2015):

Opportunities to Provide Refugees and Ugandans with Alternative Livelihood Activities in Uganda’s Kamwenge District
46
Support agricultural activities for 3,500 households
Support non-farm IGAs for 1,500 households
Ensure that 70% of beneficiaries are refugees and 30% are host community members
Provide vocational training and training in basic business and financial skills, agronomics, and postharvest handling techniques.
Provide access to an Income Generation Activity Fund, build community stores, and offer extension services and outreach.
FAO interventions in Uganda are guided by the FAO Country Programming Framework (2015–2019). In addition to supporting national efforts to mitigate climate change and food security monitoring, FAO provides direct assistance to refugees in various settlements, focused on agriculture/livestock support (FAO 2016).
The work of the United Nations Children’s Fund (UNICEF) in Uganda is guided by its Country Programme Action Plan (2016–2020). UNICEF manages a broad portfolio of activities encompassing primary health care, immunizations, public nutrition, HIV prevention, water, sanitation, hygiene, emergency response, national health and education system strengthening, social protection, education, and early childhood development (UNICEF Uganda 2016a). In refugee settings, UNICEF provides screening and treatment for acute malnutrition; immunizations against polio and measles; deworming medicines; vitamin A supplementation; psychosocial support; access to safe water, sanitation, and hygiene facilities and information; early childhood development kits; and support for social protection, family tracing, and reunification (UNICEF Uganda 2016b).
The World Bank is in the process of developing its Uganda Country Partnership Framework (2016–2021), based on the World Bank’s Systematic Country Diagnostic (2015) (World Bank 2015). The SCD does not have an explicit focus on refugees, but the World Bank is strengthening refugee operations through several initiatives. First, the World Bank and UNHCR conducted an insightful assessment into the progressive management approach toward refugees in Uganda, released in 2016 (GOU, UNHCR and World Bank 2016). Second, the World Bank participates in the ReHoPE Strategy; it is expected to fund the GOU’s STA, which should align with ReHoPE.
5.2 United States Government-Supported Programs The US Government has allocated over $450 million annually for programming in Uganda since FY 2014 (Table 18). Most of those funds (over $300 million) are allocated to Uganda via US State Department or US Agency for International Development (USAID) global health programs. Among the USAID-managed global health programs supporting Uganda are programs that work on tuberculosis, malaria, maternal and child health and nutrition (MCHN), family planning and reproductive health (FP/RH), and health and nutrition. The US Government also funds development assistance programs under the Feed the Future Initiative, as well as programs focusing on climate change and the environment, democracy and governance, and education. USAID/FFP funds WFP’s assistance to refugees in Uganda (Table 17).
5.3 Programs Supported by Other Donors and Actors A number of NGOs were identified by the desk review to be presently, or in the recent past, operating food security or livelihoods-related programs in Rwamwanja Refugee Settlement. The Lutheran World Federation has provided on-site feeding, shelter, health, SGBV, water and sanitation, and education (LWF 2016, UNHCR 2014a). Finn Church Aid manages education

Opportunities to Provide Refugees and Ugandans with Alternative Livelihood Activities in Uganda’s Kamwenge District
47
services and provides a vocational training program in Rwamwanja for refugees and local young people (FCA 2015). The Adventist Development and Relief Agency works in the areas of livelihoods and environment, implementing food security activities in partnership with FAO, including the provision of seeds, equipment, and agricultural knowledge and skills (ADRA Uganda 2016). Samaritan’s Purse is a WFP partner, supporting food and cash distribution and provision of support to farmers. Feed the Hungry has implemented school feeding services (UNHCR 2014). African Initiatives for Relief and Development has worked in the area of logistics including shelter, roads, water, health, nutrition and livelihoods (AIRD 2016, UNHCR 2014). Save the Children has implemented in the area of child protection and early childhood education.
Table 17. WFP Programs in Uganda (2016)
Name Components Target Populations Activities and target populations
Country Programme Uganda (2016-2020) CP 200894
Component 1: Agriculture and Market Support
25,000 smallholder farmers in Karamoja
Training for smallholder farmers and farmer organizations Refresher trainings
Component 2: Strengthened Nutrition Services
42,290 children 6-23 months in Karamoja
Targeted supplementary feeding program for children 6-23 months as treatment for MAM
42,290 children 24-59 months in Karamoja
Targeted supplementary feeding program for children 24-59 months as treatment for MAM
21,140 people of other ages - Karamoja
Targeted supplementary feeding program for people in other age groups as treatment for MAM
18,980 PLW in Karamoja Targeted supplementary feeding program for pregnant/lactating women to prevent malnutrition
27,330 children 6-23 months in Karamoja
Targeted supplementary feeding program for children 6-23 months as prevention of malnutrition
42,000 children 6-23 months in Eastern Uganda
Pilot use of micronutrient powder (MNP) in Eastern Uganda to prevent micronutrient deficiencies
Component 3: School Feeding
123,440 children in Karamoja’s primary schools
School-based targeted food distribution supplemented with supplementation by locally-produced maize (home-grown school feeding)
Protracted Relief and Recovery Operation (January 2016 – December 2018) PRRO 200852
Component 1: Refugee response and livelihoods
398,000 – food - refugees 200,000 – cash - refugees
General food assistance to refugees, including a scaled-up cash transfer pilot
42,000 - refugees 18,000 - host community
Livelihood project (pilot) for refugees and host community
14,340 children 6-23 months - refugees
Targeted supplementary feeding program for children 6-23 months as treatment for MAM (TSFP)
14,340 children 24-59 months - refugees
Targeted supplementary feeding program for children 24-59 months as treatment for MAM (TFSP)

Opportunities to Provide Refugees and Ugandans with Alternative Livelihood Activities in Uganda’s Kamwenge District
48
2,825 pregnant and lactating women
Targeted supplementary feeding program for pregnant and lactating women as treatment for MAM (TFSP)
3,186 people of other ages - refugees
Targeted supplementary feeding program for people in other age groups as treatment for MAM (TFSP)
35,050 PLW - refugees Targeted supplementary feeding program for pregnant/lactating women to prevent malnutrition (MCHN)
64,330 children 6-23 months - refugees
Targeted supplementary feeding program for children 6-23 months as prevention of malnutrition (MCHN)
Component 2: Building resilience in Karamoja
Food - 423,300 people in Karamoja Cash – 47,050 people in Karamoja
Conditional transfer for the most food insecure households in Karamoja; productive asset creation (FFA) focused on soil and water conservation, water production and agricultural assets; food assistance during 4-month lean season; part of the WFP/FAO/UNICEF Joint Resilience Strategy
Component 3: Strengthening emergency preparedness in GOU
GOU institutions Technical assistance to relevant institutions and offices; support to local government to update and operationalize emergency response plans; strengthening early warning systems, supply chain management, and harmonize the food security and nutrition information systems currently utilized by all partners in Karamoja
Source: WFP 2016.

Opportunities to Provide Refugees and Ugandans with Alternative Livelihood Activities in Uganda’s Kamwenge District
49
6. Opportunities and Constraints for Food Security and Livelihoods Programs
6.1 Introduction The complex social, political, and humanitarian crises driving refugee flows into Uganda are unlikely to be resolved quickly. Humanitarian interventions with short-term funding, such as general food distributions and free distribution of non-food items and productive inputs, can save lives in the early phase of displacement but if continued for years, risk cultivating dependence on costly external assistance rather than cultivating self-reliance. This desk review describes the food security situation in Kamwenge District and in Rwamwanja Settlement (Section 3), and selected ongoing policies and programs (Sections 4 and 5), and on the basis of that overview, identifies possible entry points and considerations for livelihoods programs in this area.
A ‘graduation’ approach to food security and poverty reduction programming has been proposed for Rwamwanja Refugee Settlement, for several reasons. The refugees are provided a full food ration upon arrival, which is gradually phased out over a five-year period. The premise underlying this approach is that cultivation on the allocated household plot, supplemented by income generating activities, should obviate the need for free food distribution for all except the most vulnerable households after a five-year period. A graduation approach to livelihoods programs aims to provide a specific package of services that enables recipients to “graduate” or transition to a higher economic level, with sustainable impacts on poverty and food security. Graduation programs aim to enable households reach a point where they can take advantage of technical, financial and social services already available in the public and private sector, which the household would not otherwise have been able to effectively access or utilize if they had not participated in the initial livelihoods program.
Section 6 briefly discusses graduation-based livelihoods programs in non-refugee populations where the approach was developed (Section 6.2) and in refugee populations where it is now being piloted (Section 6.3). This section also discusses enabling factors for implementing graduation-based livelihoods programs in Rwamwanja Refugee Settlement (Section 6.4); constraints and challenges for graduation-based livelihoods programs in Rwamwanja Refugee Settlement (Section 6.5); and potential opportunities for graduation-based livelihoods programs in Rwamwanja Refugee Settlement (Section 6.6). Finally, Section 6.7 presents cross-cutting issues and other considerations for implementing graduation-based livelihoods programs in Rwamwanja Refugee Settlement and Kamwenge District, jointly or in parallel, with an eye towards ensuring equity and capitalizing upon synergies between refugees and their non-refugee neighboring populations.
6.2 Graduation-Based Livelihoods Programs Among Non-Refugee Populations
The graduation approach was first developed by the organization BRAC in Bangladesh, based upon their work on poverty alleviation for the extreme poor in the 1970s. The graduation approach was designed to provide a “step up” for those who would otherwise be excluded from programs – even from programs that target the poor and food insecure. Graduation approaches to livelihood and poverty reduction programs evolved out of the recognition that extremely poor people face unique obstacles that prevent them from participating in the microfinance programs that were helping the economically active poor sustainably move out of poverty. The extremely poor are highly vulnerable to economic shocks and food insecurity. They are highly conflict averse and tend to have few assets, highly unstable incomes, and little or no formal education or training. Often geographically and

Opportunities to Provide Refugees and Ugandans with Alternative Livelihood Activities in Uganda’s Kamwenge District
50
socially isolated as well as illiterate, many lack access to social safety nets and social networks (CGAP 2014). Because they must focus so much attention on the tasks of ensuring daily survival, they are often too overwhelmed to think about adopting long-term livelihoods strategies, and focus instead on increasing household food consumption (CGAP 2014).
The graduation approach targets the bottom half of those living below national poverty lines, or roughly those living on less than $1.25 per day.10 The approach draws from three development approaches: social protection, livelihoods development, and financial inclusion (CGAP 2014). The graduation approach includes five core elements, provided in the following sequence (CGAP 2014):
Consumption Support – Support provided to the client in the form of cash or food to ensure that basic food needs are met so that the client can shift his/her focus from survival to livelihoods and other medium to long-term issues.
Savings – Encouragement and support to begin savings, such as through self-help groups, financial literacy training, and/or linkages with financial services providers.
Asset transfer – Conduct market analysis and asset transfers to selected income-generating activity, which should be appropriate for the clients’ skillsets. There should be market demand for the goods and/or services offered, and ongoing support for the activity should be available.
Skills training – Technical skills training should occur simultaneously with the market analysis and asset transfers. It should be highly focused, short in duration, and linked to refresher training. It should also include referrals to existing resources.
Life coaching – Life skills coaching typically provides one-on-one personal coaching to the client to increase self-confidence, improve self-care, reduce social isolation and boost visibility in the community. Life skills coaching is often seen as time and labor intensive, but it is absolutely essential for the success of the graduation approach of the extreme poor.
There is a growing body of evidence on the effectiveness and impact of the graduation approach in non-displaced populations. From 2006–2014, pilots of the graduation approach were conducted in at least ten sites in eight countries by the World Bank’s CGAP and the Ford Foundation. The results demonstrated that 75–98% of the participants met the graduation criteria within 18 to 36 months of starting the program (CGAP 2014).11 These results are encouraging, but until recently, research was not conducted to determine if the approach could be equally efficacious in refugee settings.
6.3 Graduation-Based Livelihoods Programs Among Refugee Populations
Poverty tends to be endemic in many refugee settlements. Households assets (e.g., livestock, savings and valuables) have often been left behind before fleeing the country. New arrivals to refugee camps and settlements, especially those fleeing conflict, may have experienced acute psychosocial and physical trauma. They are often subjected to national policies and practices that constrain their mobility and prohibit them from engaging in employment and economic activities. Depending upon the social and ethnic composition of the refugee community that becomes their new home, refugees may or may not develop strong social bonds that provide social support as well as access to community support mechanisms. Also, they may or may not enjoy the benefit of a welcoming and supportive host country and community.
10 This paper focuses on the Graduation Approach as developed and described by CGAP and BRAC. 11 The pilot countries included Haiti, India, Pakistan, Honduras, Peru, Ethiopia, Yemen, and Ghana.

Opportunities to Provide Refugees and Ugandans with Alternative Livelihood Activities in Uganda’s Kamwenge District
51
Refugee populations pose unique challenges for livelihood and microfinance programming. Microfinance institutions are often hesitant to fund or implement such programs for refugees because of a concern that repatriation or resettlement will preclude receiving full benefit from and repayment of the loan. Typically, microfinance program design emphasizes sustainability, but sustainability can be problematic in displaced and mobile communities. Refugees typically lack documentation on their work and financial/credit history, which complicates lenders’ ability to assess their eligibility for loans. The high repayment rates frequently achieved by microfinance projects in non-refugee populations can be attributed in part to linkages to clients’ social networks, which provide social pressure to repay the loan on time and access to financial support when clients encounter difficulty repaying the loan. In this way, social networks effectively spread risk and responsibility within the community, creating a greater sense of investment among clients (Nourse 2004). Microcredit institutions may fear that weak social bonds in refugee communities will reduce repayment rates.
From 2011–2012, UNHCR and WFP conducted joint impact evaluations of food assistance for refugees in protracted situations, which revealed some of the factors that enable or constrain refugee livelihoods (WFP and UNHCR 2013). Mixed-method impact evaluations in Bangladesh, Chad, Ethiopia, and Rwanda, looked at the impact of a joint programming model in which three sequential, broadly staged interventions took place over the short, medium and long term. The short-term phase involved life-saving general food distribution with full rations on the assumption of minimal levels of self-reliance. The medium-term phase involved a shift to partial rations and provision of essential services (e.g. water, sanitation, education, housing, and other services), with the expectation that beneficiaries would begin to establish livelihoods and improve their nutritional status. Finally, the long-term phase involved further decreases in food assistance, complemented by livelihood interventions for asset-building and ultimately, self-reliance. Evaluation findings determined that chronic malnutrition and anemia prevalence remained high, but global acute malnutrition and severe acute malnutrition rates seemed to show some improvement, although results were mixed. Possible reasons for the mixed results included funding shortfalls, pipeline breaks (supply shortages), record management issues, limited access to labor markets or land, an inadequate environment for income-generating activities, and limited mobility rights or transportation access. Importantly, many of the factors deemed most essential for the development of livelihoods and self-sufficiency are in the control of the national host country government, not the United Nations – particularly the right to land, access to labor markets, and mobility rights.
There is limited documentation on graduation approach design and implementation among refugees. However, UNHCR’s Global Strategy for Livelihoods (2014–2018) incorporates a graduation model, linking a sequence of activities from provision of consumption support to livelihoods and market level interventions to promote self-reliance. UNHCR partnered with the NGO Trickle Up and BRAC University to implement the graduation approach in Egypt and Costa Rica starting in 2013 in both protracted and crisis refugee settings and in both urban areas and camp settings. Also, UNHCR and WFP are piloting graduation-based livelihood programs in Chad, as well as the OPM/WFP/UNHCR Pilot Joint Project for Self-Reliance in Uganda (UNHCR 2014; GOU, WFP, UNHCR 2015).
Many lessons have emerged on tailoring the graduation approach for refugee populations from field practice (Nourse 2004). For example, because refugee communities may have weaker social networks than normal rural communities, increased monitoring and mentoring may be required to support clients and to motivate loan repayment (Nourse 2004). Also, although microfinance programming generally emphasizes institution-building for sustainability, if refugees are using credit services provided by other refugees or from institutions that only serve refugees, then a sustainability strategy should be developed in accordance with local circumstances. Every

Opportunities to Provide Refugees and Ugandans with Alternative Livelihood Activities in Uganda’s Kamwenge District
52
microfinance institution that serves refugees should have a phase-out strategy in place for free and subsidized services to improve sustainability.
Microfinance programs can be integrated into a repatriation and reintegration strategy, as shown by the American Refugee Committee’s microenterprise development work in West Africa (e.g. Refuge to Return for Sierra Leone’s refugees and returnees) (Nourse 2004). In this example, the strategy aimed to ensure that the target population would continue receiving the same services they had enjoyed prior to leaving the country after repatriation, as well. Also, because refugees often lack documentation on their professional qualifications and credit history, it is important to provide them with documentation of their loan and repayment history so they can also take out loans once they return to their country of origin. Providing documentation of their credit history can also motivate them to repay their loans on time (Nourse 2004). Finally, the program should be presented (or branded) as a development program rather than an emergency intervention, to reinforce the idea that repayment on time is required.
Often, food security, nutrition, and livelihood services for refugees are provided by emergency actors, which may lack expertise and skills in microfinance and livelihood/development programming. Humanitarian programming tends to have short implementation timelines (e.g., 3–12 months) and focus on short-term effects on humanitarian outcomes (e.g. acute malnutrition, morbidity and mortality). Implementing microfinance and graduation programming in refugee communities requires donors and implementing agencies to adopt the appropriate mind-sets, skill sets, resources, and M&E plans to avoid pitfalls.
Refugee communities often lack access to basic needs and services that would help them take advantage of livelihood opportunities. For refugees to invest in livestock, it may be necessary to negotiate access to water and land for grazing with the GOU. Access to fuel/firewood may also need to be negotiated. Safety nets may be necessary for the provision of food and non-food items as well as essential social services, in order to protect assets that the refugees may have already accumulated. Refugees need safe shelter for both physical protection and protection of assets. In the financial arena, refugees often do not know how to transfer funds and remittances or access other financial services, and they need support in this regard.
6.4 Enabling Factors for Graduation-Based Livelihoods Programs in Rwamwanja Refugee Settlement
Uganda’s Rwamwanja Settlement offers numerous enabling factors for graduation-based livelihoods programming. Many were discussed in Sections 3-5 above, so they are only briefly reiterated here:
1. Political capital, and legal and policy environment: The GOU’s remarkably progressive policies towards refugees open up opportunities for livelihoods programming that would not be permitted in many other countries, most notably the right to land, the right to mobility, and the right to work (UNHCR 2014). The GOU does provide avenues for accessing permits to leave refugee settlements and engage in employment with refugee or host community members. The GOU’s explicit focus is the inclusion of refugees in national development efforts, and the promotion of self-reliance among refugees.
2. Physical and natural capital: Refugees are allocated plots for farming, and live in settlements rather than closed camps. In addition, southwestern Uganda enjoys high agricultural productivity, temperate climate conditions, and low poverty rates.
3. Human capital: Rwamwanja is gender balanced (51% female, 49% male). Refugees constitute around 13% of the district population.

Opportunities to Provide Refugees and Ugandans with Alternative Livelihood Activities in Uganda’s Kamwenge District
53
4. Social capital: The vast majority (99%) of Rwamwanja’s refugees share Congolese nationality and cultural background. There are many sociocultural and economic similarities between eastern DRC and Uganda. Culturally, Ugandans are welcoming to refugees as a rule, and ready to engage with refugees in trade or employment relationships. Intermarriage boosts cultural and linguistic familiarity.
5. Financial and economic capital: Incomes in Rwamwanja are very low, but local/informal mechanisms for accessing credit do exist in the settlement, and microfinance institutions are already operating in Kamwenge District.
6. Systems and services: Although they are weak, education and health services do exist in Rwamwanja Settlement and Kamwenge District.
7. Livelihoods patterns: Congolese refugees are seasoned farmers with similar cropping patterns to those of southwestern Uganda. Although refugees often arrive at Rwamwanja without assets, many bring skills and expertise in agriculture and other income-generating activities that are relevant to the Ugandan context. Additionally, they have expressed a strong demand for livelihoods support: in 2014, refugees in Rwamwanja reported wanting business support (45% of respondents), and financial support (44%) (University of Oxford 2014).
8. Markets and trade dynamics: There is an effective demand for refugee-grown maize in southwestern Uganda, to serve domestic markets, particularly in urban centers and deficit areas in northern Uganda. Kamwenge District also serves national trade networks for cash crops such as coffee, tea, cotton, tobacco and sugar cane. Private sector entities purchase grain and produce and supply the shops located in settlements with other commodities. In terms of labor market dynamics, Ugandans employ refugees, and as refugees gain sufficient income and capital to start businesses, refugees employ Ugandans.
6.5 Constraints and Challenges for Graduation-Based Livelihoods Programs in Rwamwanja Refugee Settlement
This desk review found the following constraints and challenges to graduation-based food security and livelihoods programs in Rwamwanja settlement:
1. Political capital, and legal and policy environment: Although the GOU provides protections and rights to refugees that are not common in other host countries, refugees still face legal constraints such as inability to legally own land and the need to obtain and purchase a permit to travel outside the settlement. There is currently no pathway to citizenship for Ugandan refugees, even if they remain in Uganda for decades and inter-marry with Ugandan nationals. Because of capacity and funding constraints, enforcement of existing policies and strategies is weak.
2. Physical and natural capital: Farm plots allocated to refugees are very small and diminishing in size due to population pressure and land fragmentation (UNHCR 2015c). Road/transport, market, water/sanitation and power infrastructure are poor, and access to the internet is extremely limited. Few refugees own valuable capital such as livestock, or agricultural or manufacturing equipment. Land is not available to refugees specifically for grazing, which hinders herd accumulation barring investment in zero-grazing techniques. Heavy reliance on firewood and wood charcoal production for use and sale poses sustainability concerns.
3. Human capital: The refugee population has a high youth burden – 60% of the population is under the age of 18, and 9% of children are orphans. Malnutrition and high rates of morbidity are endemic, costly, and detrimental to labor power in affected households. School attendance and educational outcomes are poor, and refugees often lack the necessary knowledge or business

Opportunities to Provide Refugees and Ugandans with Alternative Livelihood Activities in Uganda’s Kamwenge District
54
skills to start their own income generating activities. The high fertility rate undermines development gains. The prevalence of psychosocial trauma and sexual and gender based violence are unknown, but are known to be high in conflict-affected eastern DRC.
4. Social capital: Although Ugandans are generally welcoming to refugees, Congolese refugees face language and cultural barriers vis-à-vis their Ugandan neighbors.
5. Financial and economic capital: Incomes and salaries are low for men and women, and females earn lower salaries than their male counterparts. Although microfinance institutions operate in the district, microfinance products tailored to refugee settings are not readily available in the settlement, and refugees frequently lack documentation of their work history and education.
6. Shocks, hazards and stresses: Southwestern Uganda is likely to experience increasingly erratic rainfall patterns in the future, given climate change predictions. Drought/dry spells frequently threaten agriculture. Pests and diseases to crops and livestock are reported to be major shocks to production. Malaria, HIV, tuberculosis, acute respiratory illnesses, diarrhea and other illnesses continue to impose excess morbidity and mortality and reduce labor power of the population. Market shocks (e.g., high staple food prices) affect this population due to their constrained market access and mobility.
7. Systems and services: The availability, access, and quality of agricultural and veterinary extension services from both the GOU and private sector actors are limited.
8. Food system factors: Refugee households often lack food storage infrastructure, and combined with their lack of knowledge about post-harvest handling techniques and lack of access to technology, this often leads to high post-harvest losses and reduced availability of crops for sale later in the season.
9. Markets and trade dynamics: The poor road infrastructure results in significant costs to transport goods, services, and individuals among the settlements, nearby communities, and urban centers and driving up trade costs. Settlements and host communities sell raw grain to traders, but often miss out on opportunities for value-added commodities. Producers lack the organization that would provide efficiencies of scale and support capacity strengthening of producers. Market infrastructure is poor and inadequate for scaling up or modernizing value added processing.
6.6 Opportunities for Graduation-Based Livelihoods Programs in Rwamwanja Refugee Settlement and Kamwenge District
Based upon the desk review findings, this document identifies some opportunities and entry points for implementing graduation-based livelihoods activities in Rwamwanja Settlement and Kamwenge District. Local feasibility and design issues can be informed by more in-depth, preferably mixed-methods, research.
1. Most western Ugandan and eastern Congolese households focus their livelihoods on working the household farm, supplemented by agricultural labor for others. The economies of Rwamwanja Settlement and Kamwenge District are predominantly agricultural, focused on subsistence production of bananas, maize, cassava and sweet potatoes, as well as cash crops coffee and tea.
2. Storage techniques and equipment are needed to reduce post-harvest losses, boost local food availability in the months after the harvest, and increase supply available for marketing. The local

Opportunities to Provide Refugees and Ugandans with Alternative Livelihood Activities in Uganda’s Kamwenge District
55
production of improved storage granaries provides an IGA that meets a demonstrated local demand.
3. Refugees may wish to leave Rwamwanja Settlement to purchase inputs and supplies in nearby villages and towns, to sell produce to Ugandans, or to seek employment among Ugandans. Likewise, Ugandans may wish to enter the settlement to purchase produce from the settlement, sell supplies to shops in the settlement, or even seek employment. These movements presently require the purchase of a permit, which can be impractical or cost-prohibitive. If these administrative requirements are barriers to economic activities, research can be conducted to explore options for either reducing or supporting the cost (e.g., temporary subsidization) to enable greater movement between Rwamwanja Settlement and the rest of the district.
4. The prevalence of participation in producers’ associations, such as farmers’ cooperatives, appears to be quite low in Rwamwanja. To incentivize traders from Hoima and other cities to travel to Rwamwanja to purchase produce, efficiencies of scale can be identified and capitalized upon. Grouping of producers into associations can facilitate the exchange and provision of agricultural extension, provide a springboard for post-harvest handling and storage interventions, and strengthen producers’ negotiations with traders on sale prices. French-language instruction/demonstration would likely boost uptake among the Congolese. The policy environment around association of refugees should be explored, to identify opportunities to link refugee producer/trader groups with Ugandan producer/trader groups.
5. Producers have limited access to formal finance and capital. Fortunately, western Uganda has a vibrant microfinance industry. Existing private sector microfinance actors such as BRAC may be willing to develop microfinance products specifically for refugees, if given the support and technical assistance, drawing on similar experiences in other refugee populations. Similarly, the use of mobile money services can be expanded, to support business activities within and outside of Rwamwanja Settlement, and enable refugees and Ugandans to conduct economic activity in and establish trade connections between rural and urban settings.
6. Particular effort may be required to establish or obtain documentation of refugees’ identity, work history and educational qualifications, to reduce barriers to mobility, employment or training.
7. The graduation approach encompasses life coaching to counter the lack of social networks and social skills among the very poor. Among refugees, life coaching/social support may be called for to help them overcome sociocultural trauma from conflict and displacement, as well as linguistic and cultural familiarity issues in their country of refuge.
8. Very little capacity for milling and value added processing are currently present in Rwamwanja Settlement. Investment in establishing the capacity and infrastructure for milling and value added processing in Rwamwanja Settlement and Kamwenge District, including for maize, sorghum and cassava, would generate income and boost employment opportunities.
9. Given the land availability and access constraints, investments in agriculture should emphasize intensification strategies rather than extensive approaches to expanding land under cultivation.
10. The GOU agricultural extension system is underfunded relative to the needs of rural and refugee producers. Activities may seek to strengthen the capacity of existing GOU extension agents, supplemented by activity-supported and/or private actors to provide extension services. Radio-based extension and market information programming activities would assist producers to adopt improved and recommended techniques and negotiate more effectively with traders.
11. Graduation and microfinance programming presents may opportunities to link refugees and Ugandans in economic enterprises, especially since both populations have demonstrated a

Opportunities to Provide Refugees and Ugandans with Alternative Livelihood Activities in Uganda’s Kamwenge District
56
willingness to engage in market and employment relationships, and even in privately organized training and apprenticeship arrangements.
12. As refugees generate private savings, they tend to invest in livestock (cattle, goats and sheep). Small stock activities engage women as well as men, and provide opportunities for women (including female heads of households) to earn income. Livestock production can be supported, as guided by gender, land and conflict analyses to ensure allocation for livestock is equitable and conflict-sensitive. A market analysis should also be conducted to determine how best to enter into livestock markets serving neighboring Ugandan towns.
13. More research is needed on the land tenure and land access situation in Kamwenge and Rwamwanja, infrastructure, gender, intra-household issues, and other contextual factors that affect food security.
14. Providing refugees with access to social networks, including of Ugandan producer groups, traders and professional associations, can be key to their economic development. Research on refugee economies in Uganda demonstrate that Ugandans and refugees readily establish employment and trade relationships with each other, as social networks are established and the economy of the settlement develops.
6.7 Cross-Cutting Issues and Other Considerations 1. GOU policy instruments state that refugees and host communities are entitled to use the same
national health and education services. Thus, interventions to strengthen these services will boost contacts and familiarity between Ugandans and refugees, which can serve to reduce conflict if implemented in accordance with conflict-sensitive programming principles and practices. Joint programming (serving refugees and Ugandans) should be explored where feasible, and informed by conflict management and mitigation analysis.
2. UNHCR is mandated to provide protection to refugees. Rwamwanja’s refugees fled a civil conflict with ethnic dimensions, so external agencies should be sensitive to potential drivers of conflict within the refugee population, as well as between refugees and Ugandans. Proactive engagement with local government and community leaders is essential, to ensure equitable and integrated development for refugees and Ugandans. In the context of Western Uganda, equitable development implies bringing food security, livelihoods and development outcomes for refugees and Ugandans to the same level.
3. Existing food security data among refugees and Ugandans alike demonstrates widespread chronic food insecurity, driven by poor utilization (e.g., MCHN and WASH) and food access.
4. Any public works or employment schemes should take into consideration the seasonal calendar for agricultural labor, to avoid competing with or undermining concurrent agricultural tasks such as planting and harvesting.
5. Given that most refugees are women and youth, security and safety should be a high priority for all activities. Gender equity should be considered at every stage, based upon available data on underlying inequities in education, control over decision-making, control over income and assets, and other areas. Preventing, identifying, and addressing exploitation of refugees and community members by staff and others should always be a priority, and agency policies and procedures must be proactive in this regard. More research is needed on the unique needs of vulnerable groups, particularly female heads of households, disabled persons, orphans, and trauma victims.
6. UNHCR and other organizations with humanitarian mandates tend to serve refugees, while development organizations tend to serve host communities, with significant differences in

Opportunities to Provide Refugees and Ugandans with Alternative Livelihood Activities in Uganda’s Kamwenge District
57
approach and focus. Humanitarian organizations may lack key skills and experience to be able to conduct livelihoods and development-focused activities effectively. In addition, the overwhelming influx of South Sudanese refugees into northern Uganda continues to place an enormous strain on UNHCR and humanitarian partners, and potentially divert attention and resources away from the more stable settlements in western and southwestern Uganda.

Opportunities to Provide Refugees and Ugandans with Alternative Livelihood Activities in Uganda’s Kamwenge District
58
References
ADRA Uganda. 2016. “Rwamwanja.” Available: http://adrauganda.org/2016/04/06/rwamwanja/.
African Initiative for Relief and Development (AIRD). 2016. “Uganda.” Available: http://airdinternational.org/where-we-work/uganda/.
Akello, V.; and Dobbs, L. 2009. Uganda’s Progressive Refugee Act Becomes Operational. Geneva: UNHCR. Available: http://www.unhcr.org/news/latest/2009/6/4a3f9e076/ugandas-progressive-refugee-act-becomes-operational.html.
Anderson, J.; Learch, C.; and Gardner, S. 2016. National Survey and Segmentation of Smallholder Households in Uganda: Understanding Their Demand for Financial, Agricultural, and Digital Solutions. Washington DC: Consultative Group to Assist the Poor (CGAP).
Asiimwe, D. 2015. DR Congo Refugees Cross Into Uganda. East African. Date: 11/21/2015. Available: http://reliefweb.int/report/uganda/dr-congo-refugees-cross-uganda.
Association of Microfinance Institutions of Uganda (AMFIU). 2013. The Uganda Microfinance Directory (2003/2004). Kampala: AMFIU. Available: http://www.amfiu.org.ug/images/docs/carol/Directory2013.pdf.
Basiime, F.; and Mutegeki, G. 2012. “Refugee Camp Chief Killed in Land Dispute.” Daily Monitor, 3/4/2012. Available: http://mobile.monitor.co.ug/News/TodaysPaper/691252-1358654-format-xhtml-rfl89h/index.html.
Bendixen and Amandi International. 2010. Remittances to Uganda. Washington DC: The World Bank.
Betts, A.; Bloom, L.; Kaplan, J.; and Omata, N. 2014. Refugee Economies: Rethinking Popular Assumptions. University of Oxford, Refugee Studies Centre. Available: https://www.rsc.ox.ac.uk/files/publications/other/refugee-economies-2014.pdf.
Betts, A.; Bloom, L.; and Weaver, N. 2015. Refugee Innovation: Humanitarian Innovation that Starts with Communities. Oxford: University of Oxford. Available: https://www.rsc.ox.ac.uk/files/publications/other/refugee-innovation-web-5-3mb.pdf.
BRAC Uganda. 2015. Uganda Annual Report (2015). Kampala: BRAC Uganda. Available: http://www.brac.net/uganda#who_we_are/
Consultative Group to Assist the Poor (CGAP). 2014. From Extreme Poverty to Sustainable Livelihoods: A Technical Guide to the Graduation Approach. Washington DC: CGAP. Available: http://www.cgap.org/sites/default/files/graduation_guide_final.pdf.
Council on Foreign Relations (CFR). 2016a. Violence in the Democratic Republic of Congo. Available: http://www.cfr.org/global/global-conflict-tracker/p32137#!/conflict/violence-in-the-democratic-republic-of-congo.
CFR. 2016b. Civil War in South Sudan. Available: http://www.cfr.org/global/global-conflict-tracker/p32137#!/conflict/civil-war-in-south-sudan.
Eastern Congo Initiative. 2016. “About DRC: History of the Conflict.” Available: http://www.easterncongo.org/about-drc/history-of-the-conflict.
Edwards, A. 2016. “South Sudan fighting drives surge of refugees to Uganda.” Available: http://www.unhcr.org/57973cde4.html.

Opportunities to Provide Refugees and Ugandans with Alternative Livelihood Activities in Uganda’s Kamwenge District
59
FAO Uganda. 2015. Report of the Integrated Food Security Phase Classification Chronic Analysis for Uganda. Kampala: FAO Uganda IPC Technical Working Group. Available: http://www.ipcinfo.org/fileadmin/user_upload/ipcinfo/docs/IPC_Uganda_ChronicFI_Situation_Feb2015-2018.pdf.
FAO Uganda. 2016. Uganda and FAO Building Resilience and Food and Nutrition Security. Kampala: FAO Uganda. Available: http://www.fao.org/3/a-au755e.pdf.
FEWS NET. 2008. “Production and Trade Flow Maps: Banana, Normal Year (Map).” Available: http://www.fews.net/east-africa/uganda/production-and-trade-flow-maps/december-2008.
FEWS NET. 2010. Livelihood Mapping and Zoning Exercise: Uganda. Available: http://www.fews.net/east-africa/uganda/livelihood-description/april-2011.
FEWS NET. 2011. “Production and Trade Flow Maps: Maize, Season 1 (Map).” Available: http://www.fews.net/east-africa/uganda/production-and-trade-flow-maps/november-2011
FEWS NET 2013. “Uganda Seasonal Calendar.” Available: http://www.fews.net/east-africa/uganda/seasonal-calendar/december-2013.
FEWS NET. 2016a. Uganda Food Security Outlook Update: August 2016. Washington DC: FEWS NET. Available: http://reliefweb.int/sites/reliefweb.int/files/resources/Uganda_FSOU_08_2016.pdf.
FEWS NET. 2016b. Staple Food Prices Increase Atypically in Karamoja: Key Message Update (July 2016). Available: http://www.fews.net/print/east-africa/uganda/key-message-update/july-2016.
Finn Church Aid (FCA). 2015. “Finn Church Aid to organise education for refugees in Uganda for three years.” Available: https://www.kirkonulkomaanapu.fi/en/latest-news/news/fca-to-organise-education-for-refugees-in-uganda-for-three-years/.
Global Knowledge Partnership on Migration and Development (KNOMAD). 2016. Migration and Remittances: Recent Developments and Outlook (Migration Development Brief 26). Washington DC: The World Bank. Available: https://openknowledge.worldbank.org/bitstream/handle/10986/24012/9781464809132.pdf?sequence=2&isAllowed=y.
Government of Uganda (GOU). 2006. The Refugees Act 2006. Kampala: GOU. Available: http://www.refworld.org/docid/4b7baba52.html.
GOU. 2009. Self-Reliance Strategy for Refugee Hosting Areas in Moyo, Arua and Adjumani Districts. Kampala: GOU.
GOU. 2011. Uganda Nutrition Action Plan 2011-2016: Scaling Up Multi-Sectoral Efforts to Establish a Strong Nutrition Foundation for Uganda’s Development. Kampala: GOU.
GOU. 2012. Peace, Recovery and Development Plan II (PRDP 2): Grant Guidelines for Local Governments. Kampala: GOU.
GOU. 2013. National Agriculture Policy. Kampala: GOU. Available: http://www.agriculture.go.ug/userfiles/National%20Agriculture%20Policy_booklet_A5_option-web%20version.pdf.
GOU Higher Local Government. 2009. Statistical Abstract: Kamwenge District. Kampala: GOU. Available: http://www.ubos.org/onlinefiles/uploads/ubos/2009_HLG_%20Abstract_printed/Kamwenge%20District%202009%20Statistical%20Abstract%20_Edited_.pdf.
GOU Kamwenge District. 2016. “Kamwenge District.” Available: http://kamwenge.go.ug/.

Opportunities to Provide Refugees and Ugandans with Alternative Livelihood Activities in Uganda’s Kamwenge District
60
GOU, UNHCR and World Bank. 2016. An Assessment of Uganda’s Progressive Approach to Refugee Management. Washington DC: World Bank. Available: https://openknowledge.worldbank.org/bitstream/handle/10986/24736/An0assessment00o0refugee0management.pdf?sequence=1&isAllowed=y.
GOU, UNICEF, WFP and UNHCR. 2015. Food and Nutrition Security Assessment among Refugee Settlements in Uganda. Rome: WFP. Available: http://documents.wfp.org/stellent/groups/public/documents/ena/wfp271906.pdf.
GOU, WFP, UNHCR. 2015. OPM-WFP-UNHCR Uganda Pilot Joint Project for Self-Reliance: Enhancing Livelihoods in Refugee and Host Communities of Rwamwanja and Kyangwali. Rome: WFP.
International Crisis Group (ICG). 2016a. A Nuanced but Firm Political Approach for DR Congo’s Decisive Autumn. Available: https://www.crisisgroup.org/africa/central-africa/democratic-republic-congo/nuanced-firm-political-approach-dr-congo-s-decisive-autumn.
ICG. 2016b. South Sudan’s Risky Political Impasse. Available: https://www.crisisgroup.org/africa/horn-africa/south-sudan/south-sudan-risky-political-impasse.
Johansen, S. 2016. Personal communication. UNHCR, Durable Solutions Officer. Date: 8/12/2016.
Lutheran World Federation World Service (LWF). 2016. “Uganda.” Available: www.lutheranworld.org/content/uganda.
Ministry of Agriculture, Animal Industry, and Fisheries (MAAIF). 2011. Statistical Abstract 2011. Kampala: MAAIF.
Ministry of Agriculture, Animal Industry, and Fisheries (MAAIF). 2013. Uganda National Agriculture Policy. Kampala: GOU. Available: http://www.agriculture.go.ug/userfiles/National%20Agriculture%20Policy_booklet_A5_option-web%20version.pdf.
Nourse, T. 2004. Refuge to Return: Operational Lessons for Serving Mobile Populations in Conflict-Affected Environments. AMAP Micropaper No. 4. USAID. Available: http://pdf.usaid.gov/pdf_docs/PNADE300.pdf.
O’Brien, S. 2016. Personal communication. USAID/FFP, Foreign Service Officer. Date: 7/9/16.
Omata, N., and Kaplan, J. 2013. Refugee Livelihoods in Kampala, Nakivale and Kyangwali Refugee Settlements: Patterns of Engagement with the Private Sector. University of Oxford, Refugee Studies Centre. Available: https://www.rsc.ox.ac.uk/files/publications/working-paper-series/wp95-refugee-livelihoods-kampala-nakivale-kyangwali-2013.pdf.
Patinkin, J. 2016. “Witnesses Say South Sudan Soldiers Raped Dozens Near UN Camp.” July 27, 2016. http://www.nytimes.com/aponline/2016/07/27/world/africa/ap-af-south-sudan-targeted-rapes.html?_r=0.
Uganda Bureau of Statistics (UBOS). 2010. Uganda Census of Agriculture (2008/2009). Kampala: GOU. Available: http://www.ubos.org/publications/agriculture/.
UBOS. 2011. Sub-County Development Programme: Kamwenge District Local Government Report. Kampala: GOU.
UBOS. 2014. Uganda National Household Survey 2012/2013. Kampala, Uganda: UBOS.
UBOS. 2015. Statistical Abstract 2015. Kampala: GOU.

Opportunities to Provide Refugees and Ugandans with Alternative Livelihood Activities in Uganda’s Kamwenge District
61
UBOS. 2016a. The National Population and Housing Census 2014: Final Report. Kampala, Uganda. Available: http://www.ubos.org/onlinefiles/uploads/ubos/NPHC/2014%20National%20Census%20Main%20Report.pdf.
UBOS. 2016b. The National Population and Housing Census 2014: Subcounty Report – Western Region. Kampala, Uganda. Available: http://www.ubos.org/onlinefiles/uploads/ubos/census_2014_regional_reports/Census_2014_Report_Western_Region.pdf.
UBOS and ICF International Inc. 2012. Uganda Demographic and Health Survey 2011. Kampala, Uganda: UBOS and Calverton, MD: ICF International, Inc.
UBOS and ICF International. 2015. Uganda Malaria Indicator Survey 2014-2015. Kampala Uganda and Rockville, MD: UBOS and ICF International.
Uganda Chamber of Mines and Petroleum (UCMP). 2016. “What Minerals Exist in Uganda?” Available: http://www.ucmp.ug/details?imgt=news&cid=30&name=%20WHAT%20MINERALS%20EXIST%20IN%20UGANDA?&typ=news
Uganda Ministry of Lands, Housing and Urban Development (MLHUD). 2013. Uganda National Land Policy. Kampala: GOU. Available: http://landportal.info/sites/landportal.info/files/the_uganda_national_land_policy-_february_2013.pdf.
Uganda National Planning Authority (UNPA). 2007. Vision 2040. Kampala: GOU. Available: http://npa.ug/uganda-vision-2040/.
UNPA. 2015. Second National Development Plan (NDPII): 2015/6-2019/20. Kampala: GOU. Available: http://npa.ug/wp-content/uploads/NDPII-Final.pdf.
UNICEF Uganda. 2016a. “UNICEF Uganda: What We Do.” Available: http://www.unicef.org/uganda/activities.html.
UNICEF Uganda. 2016b. Uganda Humanitarian Situation Update - South Sudanese Refugee Crisis. Kampala: UNICEF Uganda. Available: http://reliefweb.int/sites/reliefweb.int/files/resources/UNICEF%20Uganda%20South%20Sudan%20Crisis%20Sitrep%207%20-%2027%20July%202016%20.pdf.
United Nations Country Team (UNCT). 2015. Refugee and Host Population Empowerment: ReHoPE Strategic Framework (Final Draft). Kampala: UNCT.
UNHCR. 2012. Livelihood Programming in UNHCR: Operational Guidelines. Geneva: UNHCR. Available: http://www.unhcr.org/publications/operations/4fbdf17c9/livelihood-programming-unhcr-operational-guidelines.html.
UNHCR. 2014a. UNHCR Uganda: Rwamwanja Fact Sheet 2014. Geneva: UNHCR.
UNHCR. 2014b. Global Strategy for Livelihoods: A UNHCR Strategy (2014-2018). Geneva: UNHCR. Available: Global Strategy for Livelihoods: A UNHCR Strategy.
UNHCR. 2015a. Creative Solutions for Protracted Refugees in Uganda. Geneva: UNHCR.
UNHCR. 2015b. Uganda Factsheet: September 2015. Geneva: UNHCR. Available: http://www.unhcr.org/524d880a9.pdf.
UNHCR. 2015c. Handbook for Self-Reliance. Geneva: UNHCR. Available: http://www.unhcr.org/pubs/self_reliance/handbook_for_self_reliance.pdf.
UNHCR. 2015d. UNHCR Global Appeal 2015 Update. Available: http://www.unhcr.org/ga15/index.xml.

Opportunities to Provide Refugees and Ugandans with Alternative Livelihood Activities in Uganda’s Kamwenge District
62
UNHCR. 2016a. “Figures at a Glance.” Available: www.unhcr.org/en-us/figures-at-a-glance.html.
UNHCR. 2016b. “What is a Refugee?” Geneva: UNHCR. Available: http://www.unrefugees.org/what-is-a-refugee/.
UNHCR. 2016c. Uganda – Refugees and Asylum Seekers in Country (as of 1 November 2016) (Map). Geneva: UNHCR. Available: http://reliefweb.int/sites/reliefweb.int/files/resources/UGA_REFPopinCountry_Oct2016.pdf.
UNHCR. 2016d. Statistical Summary as of September 2016: Refugees and Asylum Seekers in Uganda. Geneva: UNHCR.
UNHCR. 2016e. Emergency Update on the South Sudan Refugee Situation: Uganda. Inter-Agency Daily #9, 21st July 2016. Geneva: UNHCR.
United Nations Uganda. 2016a. Delivering as One. Kampala: United Nations Uganda. Available: http://un-ug.org/page/delivering-one.
United Nations Uganda. 2016b. One Programme. Kampala: United Nations Uganda. Available: http://un-ug.org/page/one-programme.
United Nations Uganda. 2016c. United Nations Development Assistance Framework for Uganda, 2016 – 2020. Kampala: United Nations Uganda. Available: http://un-ug.org/report/united-nations-development-assistance-framework-2016-2020.
United States Department of State (US DOS). 2015. Congressional Budget Justification: Foreign Operations (Appendix 2, Fiscal Year 2015). Washington DC: USDOS. Available: http://www.state.gov/documents/organization/224069.pdf.
US DOS. 2016. Congressional Budget Justification: Foreign Operations (Appendix 2, Fiscal Year 2016). Washington DC: USDOS. Available: http://www.state.gov/documents/organization/238221.pdf.
University of Oxford. 2014. Joint Rwamwanja Livelihood Study. Oxford: University of Oxford, Refugees Studies Centre.
USAID (2016). USAID/Uganda Gender Assessment. Washington DC: USAID. Available: https://www.usaid.gov/sites/default/files/documents/1860/USAID_Uganda_Gender_Assessment.pdf.
World Bank. 2015. Uganda Systematic Country Diagnostic: Boosting Inclusive Growth and Accelerating Poverty Reduction. Washington DC: World Bank. Available: http://documents.worldbank.org/curated/en/401861467998756667/pdf/97145-CSD-P151913-IDA-SecM2015-0247-IFC-SecM2015-0173-MIGA-SecM2015-0119-Box393266B-OUO-9.pdf.
World Food Programme (WFP). 2013. Synthesis Report of the Joint WFP and UNHCR Impact Evaluations on the Contribution of Food Assistance to Durable Solutions in Protracted Refugee Situations. Available: http://www.unhcr.org/51b827cb9.pdf.
WFP. 2015. Country Programme Uganda 200894 (2016-2020). Rome: WFP. Available: http://www.wfp.org/operations/200894-uganda-country-programme-2016-2020.
WFP. 2016. Budget Increase to Uganda Protracted Relief and Recovery Operation 200852. Rome: WFP. Available: http://documents.wfp.org/stellent/groups/internal/documents/projects/wfp288327.pdf?_ga=1.74073426.1769007502.1475008271.
WFP and UNHCR. 2013. Synthesis Report of the Joint WFP and UNHCR Impact Evaluations on the Contribution of Food Assistance to Durable Solutions in Protracted Refugee Situations. Rome: WFP. Available: http://documents.wfp.org/stellent/groups/public/documents/resources/wfp258889.pdf.