Embed Size (px)
Citation preview

Do not refresh this file
Opportunity Day Presentation 20 May 2013
A World Leading Natural Rubber Player
Do not refresh this file
1
Do not refresh this file
1
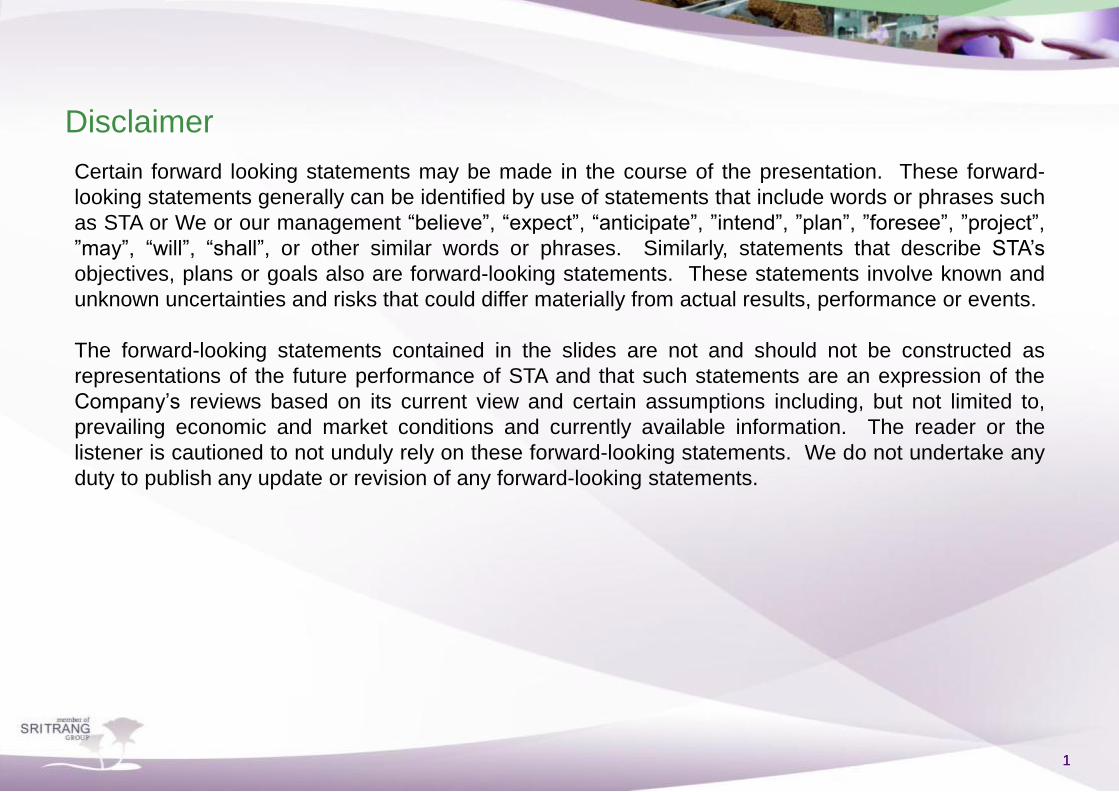
Disclaimer
Certain forward looking statements may be made in the course of the presentation. These forward-
looking statements generally can be identified by use of statements that include words or phrases such
as STA or We or our management “believe”, “expect”, “anticipate”, ”intend”, ”plan”, ”foresee”, ”project”,
”may”, “will”, “shall”, or other similar words or phrases. Similarly, statements that describe STA’s
objectives, plans or goals also are forward-looking statements. These statements involve known and
unknown uncertainties and risks that could differ materially from actual results, performance or events.
The forward-looking statements contained in the slides are not and should not be constructed as
representations of the future performance of STA and that such statements are an expression of the
Company’s reviews based on its current view and certain assumptions including, but not limited to,
prevailing economic and market conditions and currently available information. The reader or the
listener is cautioned to not unduly rely on these forward-looking statements. We do not undertake any
duty to publish any update or revision of any forward-looking statements.
628363-027

Do not refresh this file
2
Do not refresh this file
2
Our Executive Directors
Dr. Viyavood Sincharoenkul
Chairman & Managing Director
Kitichai Sincharoenkul
Executive Director
Paul Sumade Lee
Executive Director
Founding member of Sri Trang and
appointed as Chairman in 2010
26 years of experience in the natural
rubber industry
Joined Sri Trang in 1988 and has served
as a Director since 1995
23 years of experience in the natural
rubber industry
Joined Sri Trang in 2004 and appointed
as a Director in 2010
8 years of experience in the natural
rubber industry
628363-027
Chaiyos Sincharoenkul
Executive Director
Prasit Panidkul
Executive Director
A Director since our inception
43 yrs of experience in natural rubber
industry
A Director since our inception
26 yrs of experience in natural rubber
industry

628363-027
I. Sri Trang Business Highlights
II. Natural Rubber Industry Snapshot
III. Financial Highlights
IV. Growth Strategy
AGENDA
Do not refresh this file
4
Do not refresh this file
4
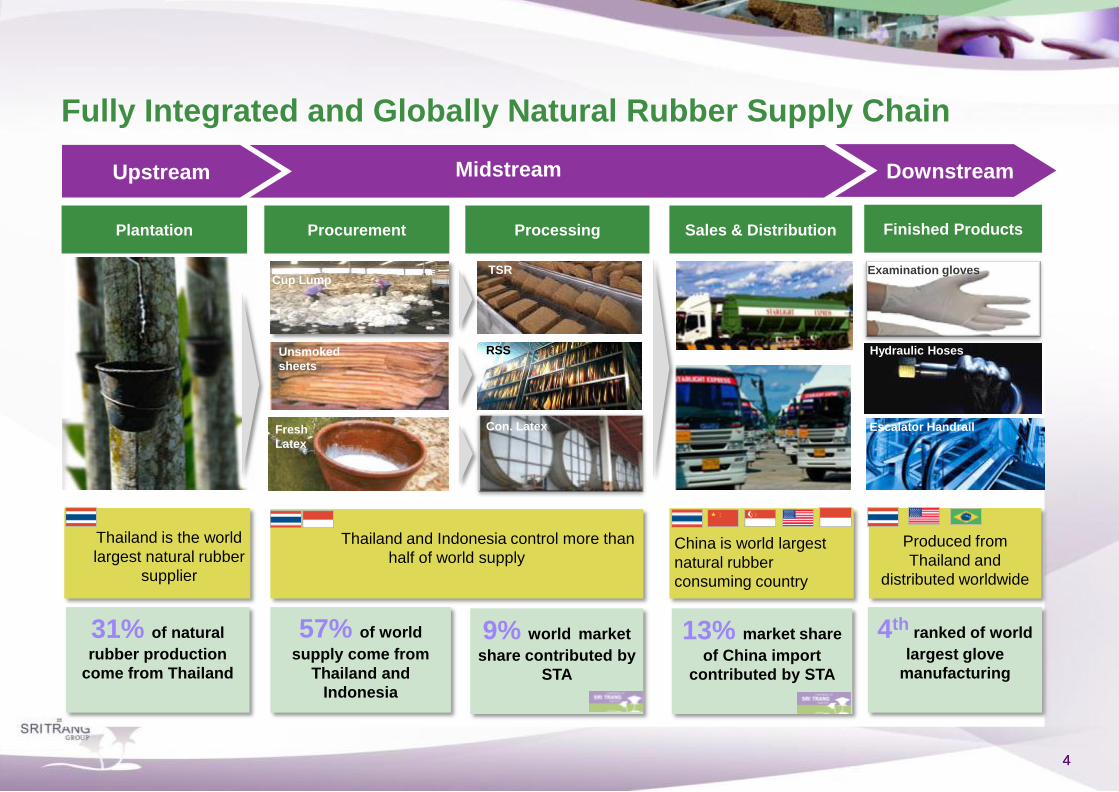
9% world market
share contributed by
STA
Fully Integrated and Globally Natural Rubber Supply Chain
Upstream Midstream
Finished Products Plantation Procurement Processing
628363-027
31% of natural
rubber production
come from Thailand
Sales & Distribution
RSS
TSR
Con. Latex
Unsmoked
sheets
Fresh
Latex
Cup Lump
Hydraulic Hoses
Examination gloves
Downstream
Thailand is the world
largest natural rubber
supplier
Thailand and Indonesia control more than
half of world supply
China is world largest
natural rubber
consuming country
Produced from
Thailand and
distributed worldwide
57% of world
supply come from
Thailand and
Indonesia
13% market share
of China import
contributed by STA
4th ranked of world
largest glove
manufacturing
Escalator Handrail

Do not refresh this file
5
Do not refresh this file
5
(By tonnage) (‘000 tons)
(By tonnage)
Sri Trang9%
Rest of the world91%
Sri Trang 18%
Rest of Thailand
82%
795
913
932
955
976
3,015
3,522
0 1000 2000 3000 4000
PRC (#6)
India (#5)
Malaysia (#4)
Vietnam (#3)
Sri Trang
Indonesia (#2)
Thailand (#1)
Sri Trang 13%
Others 87%
Sri Trang - Dominant Natural Rubber Processors
Global NR market share Sri Trang vs. leading natural rubber producing
countries
Thailand NR production share China NR imports 2012
(By tonnage)

Do not refresh this file
6
Do not refresh this file
6
World Largest Midstream Natural Rubber Producer
628363-027
Concentrated
Latex
Ribbed Smoked
Sheet (RSS)
Technically
Specified Rubber (TSR)
Existing plants
Plants under construction
23 factories, 21 in Thailand
and 2 in Indonesia
1.2 million tons per
annum for production capacity
61 procurement units,
40 in Thailand and 21 in Indonesia

Do not refresh this file
7
Do not refresh this file
7
Our Midstream Business Strategy
628363-027
TSR RSS Con. Latex
Full range of natural rubber products
• Serve all downstream businesses & capture all
possible market segments
• Create production efficiency
• Excellent diversification
• More than sufficient raw material to secure from
world largest Natural Rubber producing
countries
• Well-balanced seasonal management
Thailand Indonesia
Strategic Production base
Type of Product No. of plant Total production capacity
TSR 12 828,850
RSS 5 206,392
LTX 6 191,488
Total 23 1,226,730

Do not refresh this file
8
Do not refresh this file
8
Thailand as our focus for upstream
Strategic Expansion to Upstream Business
> 4,700 hectare rubber
plantation in Thailand
> 60% with an average
gestation period of 2 years
Will mature for first commercial
tapping from 2016 Tapping
Under gestation
Land development
Chiang Mai Chiang Rai
Lampang
Utaradit Sukhothai
Pitsanulok Pichit Sakon Nakhorn
Surat Thani
Krabi Songkhla
Petchaboon
Sakaeo
Prae
Chumporn

Do not refresh this file
9
Do not refresh this file
9
Income Diversification through Investment in Downstream Business
Latex / nitrile examination gloves for medical and industrial purposes
Operated through 40.2% owned associate SSC
World top four and Thailand largest glove manufacturer
Production capacity of 14 billion pieces per annum
Operated through 42.5%-owned associate in Thailand and 50%-owned associate in PRC
Largest hydraulic hoses producer in Thailand
Production capacity of 42.5 million meter per annum
10%-owned entity in PRC
Production capacity of 1.4 million meter per annum
Examination Gloves High-pressure
hydraulic hoses Escalator handrails

Do not refresh this file
10
Do not refresh this file
10
Plantation
Procurement
Processing Finished products
Sale & Distribution
Gain direct access to supply
information
Ability to control the quality of
supply
Reduce purchasing volumes to
transact with intermediaries
Minimise operating cost
Ability to control the quality of supply
First-hand
understanding of
customer
requirements
Quick access to
reliable market
information
Be flexible to any market
conditions and able to manage
production and position
efficiently
Distinctive Advantage - Capture Value throughout the Supply Chain

628363-027
I. Sri Trang Business Highlights
II. Natural Rubber Industry Snapshot
III. Financial Highlights
IV. Growth Strategy
AGENDA

Do not refresh this file
12
Do not refresh this file
12
Natural Rubber Industry Supply Chain
NR supply by type of plantation
Estates 22%
Small Holdings
78%
Source: IRSG,
NR demand by end use
Latex
13%
Other
uses
17%
Tyre
70%
Replacement market 70%
Original equipped market 30%
Market Segmentation

Do not refresh this file
13
Do not refresh this file
13
World Major NR Producing and Consuming Countries
628363-027
7.6 7.9
8.7 9.2
9.7 10.2 10.2
9.3
10.8 11.0
10.9 11.6
7.3 8.0
8.7 8.9
9.8 9.9 10.1 9.7 10.4
11.0 11.4 11.8
(0.25) 0.07 0.03 (0.30) 0.14 (0.29) (0.05) 0.36 (0.38) 0.05 0.46 0.18
(2.0)
-
2.0
4.0
6.0
8.0
10.0
12.0
14.0
2002 2003 2004 2005 2006 2007 2008 2009 2010 2011 2012 2013F
Demand Supply Supply surplus/(deficit)
Indonesia 26%
Thailand 31%
China 7%
Malaysia 8%
Vietnam 8%
India 8%
Others 12%
China 34%
North America
10% Europe 10%
India 9%
Japan 7%
Thailand 5%
Others 25%
Unit : million tons
(by tonnage) (by tonnage)
25%
35%
45%
55%
65%
1992 1994 1996 1998 2000 2002 2004 2006 2008 2010 2012
Advanced¹ Emerging
Overall NR demand and supply Demand trend moves to emerging market
Source: IRSG and LMC 1 Advanced markets include USA, Canada, Western Europe and East Asia
Major suppliers of Natural Rubber Major consumers of Natural Rubber

Do not refresh this file
14
Do not refresh this file
14
Supply Limited in Equator Countries
628363-027
1,274
795
913
932
955
3,015
3,522
Others
China
India
Malaysia
Vietnam
Indonesia
Thailand
0 500 1,000 1,500 2,000 2,500 3,000 3,500 4,000
2,814
2,000
640 607 506 504
55 101
670
785
434 470 405 255
225 27
3,484
2,785
1,074 1,077 911
759
280 128
0
500
1,000
1,500
2,000
2,500
3,000
3,500
4,000 Immature area (Hectares)
Tapped area (Hectares)
Yield per hectare (Kg.)
Unit : ‘000 tons
0
500
1,000
1,500
2,000
2,500
3,000
3,500
4,000
4,500
1990 1993 1996 1999 2002 2005 2008 2011 2014 2017 2020
Malaysia Indonesia Thailand India
PRC Vietnam Other
Unit : ‘000 tons
Rubber tree grows well in tropical area Thailand - the world largest NR supplier
Area for rubber plantation Global natural rubber production by country
Do not refresh this file
15
Do not refresh this file
15
-15%
-10%
-5%
0%
5%
10%
15%
2012 2013 2014 2015 2016 2017 2018 2019 2020 2021 2022
USA
EU
Brazil
China
Japan
Indonesia
Russia
India
Others
Total
-10.0%
-5.0%
0.0%
5.0%
10.0%
15.0%
20.0%
-1%
0%
1%
2%
3%
4%
5%
6%
2003 2004 2005 2006 2007 2008 2009 2010 2011 2012 2013f
GDP (LHS) NR consumption (RHS)
0%
1%
2%
3%
4%
5%
6%
7%
8%
0
200
400
600
800
1,000
1,200
1,400
1,600
2012 2013 2014 2015 2016 2017 2018 2019 2020 2021 2022
PC LCV M/HCV
PC (% growth) LCV (% growth) M/HCV (% growth)
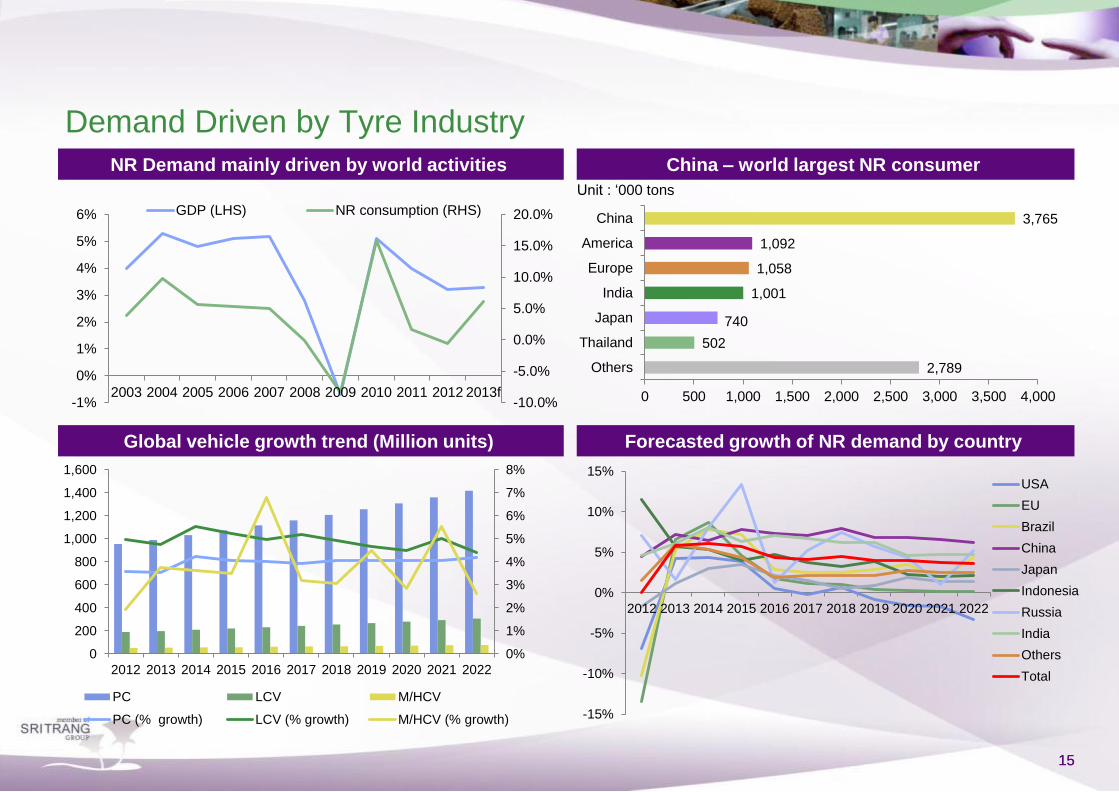
2,789
502
740
1,001
1,058
1,092
3,765
Others
Thailand
Japan
India
Europe
America
China
0 500 1,000 1,500 2,000 2,500 3,000 3,500 4,000
China – world largest NR consumer
Forecasted growth of NR demand by country
NR Demand mainly driven by world activities
Global vehicle growth trend (Million units)
Demand Driven by Tyre Industry
Unit : ‘000 tons

Do not refresh this file
16
Do not refresh this file
16
Consistent Demand for Natural Rubber
Source: IRSG
20
30
40
50
60
Jan
-07
Ap
r-0
7
Jul-
07
Oct-
07
Jan
-08
Ap
r-0
8
Jul-
08
Oct-
08
Jan
-09
Ap
r-0
9
Jul-
09
Oct-
09
Jan
-10
Ap
r-1
0
Jul-
10
Oct-
10
Jan
-11
Ap
r-1
1
Jul-
11
Oct-
11
Jan
-12
Ap
r-1
2
Jul-
12
Oct-
12
Share of natural rubber in rubber consumption (%)
39-49%
Synthetic Rubber
Natural Rubber
Heat
resistance Elasticity
Resilient demand for natural rubber
-100%
-50%
0%
50%
100%
150%
200%Brent Crude oil Butadiene-Rubber Natural Rubber
Price movement
• Natural rubber and synthetic rubber are substitute and
complimentary products
• The substitution between synthetic rubber and natural rubber is
limited (less than 10%)

Do not refresh this file
17
Do not refresh this file
17
Natural Rubber Price Interaction
628363-027
(400)
(300)
(200)
(100)
0
100
200
300
0
1,000
2,000
3,000
4,000
5,000
6,000
Ja
n-0
7
Ap
r-0
7
Jul-07
Oct-
07
Ja
n-0
8
Ap
r-0
8
Ju
l-0
8
Oct-
08
Ja
n-0
9
Ap
r-0
9
Ju
l-0
9
Oct-
09
Ja
n-1
0
Ap
r-1
0
Ju
l-1
0
Oct-
10
Ja
n-1
1
Ap
r-1
1
Ju
l-1
1
Oct-
11
Ja
n-1
2
Ap
r-1
2
Ju
l-1
2
Oct-
12
Supply surplus / (deficit) (RHS) SICOM price (TSR20) (LHS)
0
500
1,000
1,500
2,000
2,500
0
2,000
4,000
6,000
Ja
n-0
7
Ap
r-0
7
Jul-07
Oct-
07
Ja
n-0
8
Ap
r-0
8
Ju
l-0
8
Oct-
08
Ja
n-0
9
Ap
r-0
9
Ju
l-0
9
Oct-
09
Ja
n-1
0
Ap
r-1
0
Ju
l-1
0
Oct-
10
Ja
n-1
1
Ap
r-1
1
Ju
l-1
1
Oct-
11
Ja
n-1
2
Ap
r-1
2
Ju
l-1
2
Oct-
12
Total stock (RHS) SICOM price (TSR20) (LHS)
(US
D p
er
ton
s)
NR price VS. fundamental demand/supply
(Un
it : ‘00
0 to
ns)
NR price VS. global stock
(US
D p
er
ton
s) (U
nit : ‘0
00
ton
s)
628363-027
I. Sri Trang Business Highlights
II. Natural Rubber Industry Snapshot
III. Financial Highlights
IV. Growth Strategy
AGENDA

Do not refresh this file
19
Do not refresh this file
19
628363-027
Financial Highlights
A record sale volume
Revenues & ASP
Net Profit improvement
Continue business
expansion
• Achieved 975,604 tons sold in FY 2012, 3% increase from
FY 2011
• 269,706 tons sold in Q1 2013, up 2% YoY and 6% QoQ
• Total revenue of THB 99,639 mm in FY 2012, down 26% YoY
due to downward movement of NR price
• Average selling price decreased by 28% from FY2011
• Total revenue of THB 24,240 million in Q1 2013, down 17% YoY but up 6% QoQ
• Net profit of THB 1,379 mm for FY 2012, up 6% YoY
• Net profit of THB 850 million for Q1 2013, up 114% YoY and
34% QoQ
• Achieve optimum capacity of 1.1 mm tons at the end of 2012
• Current optimum capacity of 1.2 mm tons
• Aim to achieve optimum capacity of 1.5 mm tons per annum
by the end of 2014

Do not refresh this file
20
Do not refresh this file
20
Revenue Breakdown by Product
Yearly (THB mm) Quarterly (THB mm)
628363-027
-17.2% +6.3%
-25.5%
13,591
77,500
6,436
2,386
2,112
24,943
96,139
10,236
133,704
99,639
FY 2011 FY 2012
RSS TSR Con. Latex Others
2,750
18,070
1,4621,568
517598 512
3,6672,6003,3314,909
21,940
19,23618,254
18,299
1,5081,534
1,932
706
485
29,266
24,61822,960
24,24022,794
Q1 2012 Q2 2012 Q3 2012 Q4 2012 Q1 2013
RSS TSR Con. Latex Others

Do not refresh this file
21
Do not refresh this file
21
Revenue Breakdown by Geography
Yearly (THB mm) Quarterly (THB mm)
628363-027
-17.2% +6.3%
-25.5%
10,720 9,057 9,809 11,851 12,355
12,309
10,999 9,033 7,865
8,396
3,882
2,636 2,337 1,744
2,020
2,222
1,781
1,699 1,282 1,370
133
145
82 53 99
29,266
24,618 22,960 22,794
24,240
Q1 2012 Q2 2012 Q3 3012 Q4 2012 Q1 2013
PRC ASIA (Ex. PRC) USA Europe Others

Do not refresh this file
22
Do not refresh this file
22
Adjusted GP and GPM*
Margin % THB mm Margin % THB mm
628363-027
+109.4% +11.3%
-39.5%
* GP and GPM after adjusting for (reversal) allowance of inventory and realised forex gains / losses
4,318
7,139
4.3%
5.3%
0
1,000
2,000
3,000
4,000
5,000
6,000
7,000
FY 2011 FY 2012
0%
2%
4%
6%
8%
10%
763
1,168
950
1,436
1,598
4.1%
4.7%
2.6%
6.6%
6.3%
0
200
400
600
800
1,000
1,200
1,400
1,600
Q1 2012 Q2 2012 Q3 2012 Q4 2012 Q1 2013
0%
1%
2%
3%
4%
5%
6%
7%
Yearly (THB mm) Quarterly (THB mm)
Do not refresh this file
23
Do not refresh this file
23
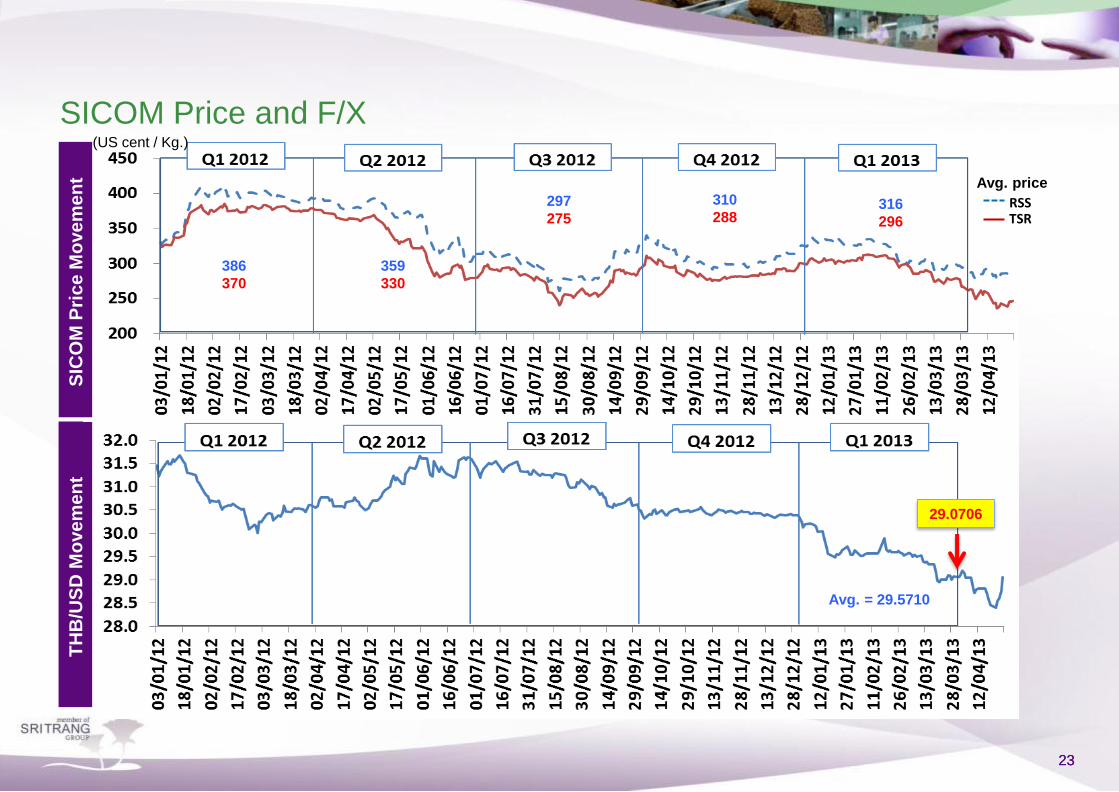
SICOM Price and F/X
628363-027
TH
B/U
SD
Mo
ve
me
nt
SIC
OM
Pri
ce M
ovem
en
t
297
275
386
370
359
330
310
288 316
296
RSS TSR
Avg. price
29.0706
Avg. = 29.5710
(US cent / Kg.)

Do not refresh this file
24
Do not refresh this file
24
Net profit and Net profit margin
Quarterly (THB mm) Yearly (THB mm)
Net profit Net profit margin %
628363-027
+5.6%
Net profit Net profit margin %
+113.9% +33.8%
1,306
1,379
1.0%
1.4%
0.0%
0.5%
1.0%
1.5%
2.0%
2.5%
3.0%
0
200
400
600
800
1,000
1,200
1,400
FY 2011 FY 2012
398
-441
787
636
850
1.4%
-1.8%
3.4%
2.8%
3.5%
(4)%
(3)%
(2)%
(1)%
0%
1%
2%
3%
4%
-500
-300
-100
100
300
500
700
900
Q1 2012 Q2 2012 Q3 2012 Q4 2012 Q1 2013

Do not refresh this file
25
Do not refresh this file
25
Return on Assets and Return on Equity
ROA ROE
628363-027
EBITDA (THB mm)
3,883
5,579
3,311 2,840
FY 2009 FY 2010 FY 2011 FY 2012
EBITDA margin
8.4%
6.7%
2.5% 2.9%
FY2009 FY2010 FY2011 FY 2012
11.74% 12.59%
3.36% 3.59%
FY2009 FY2010 FY2011 FY 2012
36.08%
43.21%
9.19% 7.46%
FY2009 FY2010 FY2011 FY 2012

Do not refresh this file
26
Do not refresh this file
26
Healthy leverage and coverage ratios
Debt / equity Net debt / equity
2.16
2.62
1.22 0.94
FY2009 FY2010 FY2011 FY2012
2.03
2.45
1.10 0.86
FY2009 FY2010 FY2011 FY2012
628363-027
Debt = Total liabilities
Equity = Total equity
Assets = Total assets
Net debt = debt – cash
Cash = cash and cash equivalents + fixed deposits at financial institutions
Interest Coverage = EBITDA/finance costs
Interest Coverage
18.85
10.90
3.74 4.00
FY2009 FY2010 FY2011 FY2012

628363-027
I. Sri Trang Business Highlights
II. Natural Rubber Industry Snapshot
III. Financial Highlights
IV. Growth Strategy
AGENDA

Do not refresh this file
28
Do not refresh this file
28
2013 Target & Future Growth Strategy
2013 2014 2015
Rubber plantation: Achieve 50,000 rai
(approx. 8,000 hectares)
Midstream business: Achieve production
capacity of more than 1.5
million tons per year
Target Capacity : 1.2 mil tons
Sale volume : 1.15 mil tons
Gross profit : 5-7%
Net profit : 2-3%
Dividend policy : 30% of net profit

Do not refresh this file
29
Do not refresh this file
29
Upstream strategy update
628363-027
Enhance profitability and
reduce volatility in earning
Create procurement
networks for potential raw
material from neighboring
area
Pinpoint strategic locations
for midstream factories in
the future
Ability to procure raw
material at appropriate
price
10,600
17,300
29,385
50,000
Mar'11 Mar'12 Mar'13 Dec'14 (f)
Land development Gestation Tapping area
Achieve 50,000 rai of rubber plantation
• Balance location mix for long-term management
• Ensure sufficiency of saplings from both suppliers and
in-house development
• Synergise across natural rubber value chain
Unit :Rai

Do not refresh this file
30
Do not refresh this file
30
Midstream strategy update
628363-027
Capacity expansion to increase market share
tons p.a.
• Thailand & Indonesia are primary countries for expansion with
focus on diversification to new territories
• Explore new potential country to establish footprints of crumb
rubber plant
• Seek for M&A opportunity for a leap-frog growth at reasonable
cost & return
4%
6%
8%
10%
12%
14%
-
300,000
600,000
900,000
1,200,000
1,500,000
1,800,000
RSS Latex TSR Market share
Increase profitability
Maintain world largest
fully-integrated Natural
Rubber processor
position
Benefit from economies
of scale
Balance the bargaining
power with suppliers and
customers
Enhance accessibility to
different sources of fund
to support our operation
and expansion

Do not refresh this file
31
Do not refresh this file
31
Sale & Marketing Strategy
628363-027
Well-balanced portfolio of customers worldwide
Japan
France
USA
Germany
Italy Korea
Taiwan
China
Finland
India
Goodyear Tire & Rubber Co.
Coopper Tire & Rubber Co.
Group Michelin
Nokian
Tyres
P.L.C
Pirelli & C.S.p.A
Continental A.G.
Hangzhou Zhongce Rubber Co. Ltd.
Double Coin Holdings Ltd.
Shandong Linglong Rubber Co. Ltd.
JK Tyres
MRF Ltd.
Apollo Tyres Ltd.
Giti Tire Co. Ltd.
Hankook Tire Co. Ltd.
Kumho Tire Co. Ltd.
Toyo Tire & Rubber Co. Ltd.
Bridgestone Corp.
Sumitomo Rubber Industries Ltd.
Yokohama Rubber Co. Ltd.
Maxxis International /
Cheng Shin Rubber Singapore
0%
2%
4%
6%
8%
10%
12%
14%
16%
0
1,000
2,000
3,000
4,000
2005 2006 2007 2008 2009 2010 2011 2012
NR Import by China (LHS) %Contribution by STA (RHS)
• Increase sales team to capture demand growth.
• Create “Sri Trang” standard to meet all
requirements from customers
• Maintain and further improve the reputation of
“most trusted” partner with all tyre makers
Increase coverage of customers in China
• Cover all classes of more than 250 customers to
serve all demand from every corner of the word.
• No single customer accounts for more than 6% of our
total sales.
• Get direct access to end-users to gain demand flow
and market sentiment.
Contribution of STA on China NR Import

Do not refresh this file
32
Do not refresh this file
32
Our Vision
628363-027
Green Rubber Product
Green Company
Green Supply
Green Factory
Passionately, we drive possibilities
>> the green rubber company >>

Do not refresh this file
33
Do not refresh this file
33
Q&A
628363-027