Embed Size (px)
Citation preview
Optical characterization of low-index transparent thin filmson transparent substrates by spectroscopic ellipsometry
Kenneth M. Gustin
The potential usefulness and limitations of spectroscopic ellipsometry in the optical characterization of lowindex transparent thin films on transparent glass substrates of only slightly lower index are demonstrated byMonte Carlo simulation. Whereas the film thickness and refractive index may be accurately determined to+3 A and +0.0015, respectively, the extinction coefficient cannot be obtained accurately. Results areindependent of the angle of incidence and film thickness.
1. Introduction
Optical evaluation of materials for coating purposesfrequently involves thin-film specimens such as a di-electric thin film deposited on a glass substrate orsilicon wafer. Our laboratory recently undertook asystematic investigation of the growth of aluminumoxide thin films formed by a novel chemical vapordeposition technique.' The need arose to characterizeoptically approximately 120 samples in a timely fash-ion. The vast majority of these samples were thinfilms deposited on Corning 7059 glass or on Kodakcover slides2; the rest were deposited on crystallinesilicon wafers.
An examination of the literature revealed manystudies dealing with (film-substrate) systems forwhich the refractive indices of the two materials differby at least 0.5 with either the substrate or the filmexhibiting moderate optical absorption. This refrac-tive-index contrast enables one to take advantage ofreadily accessible optical methods, such as classical(R,7) measurements.3-6 Recently, spectroscopic el-lipsometry has become more accessible to the experi-mental community thanks to the commercial produc-tion of high-speed automated spectrometers.7 Thesemethods often lend themselves to numerical inversionof the experimental spectra, thus yielding the optical
The author is with Universit6 Pierre et Marie Curie-Paris VI,Laboratoire d'Optique des Solides, U.A. CNRS 040-781, 4 placeJussieu, 75252 Paris CEDEX 05, France.
Received 24 March 1987.0003-6935/87/183796-07$02.00/0.© 1987 Optical Society of America.
constants of the substrate, or the optical constants ofthe film along with the film thickness.
However, in the case of a thin transparent film (nf1.66) on a glass substrate (n8 1.52), the small refrac-tive-index difference renders the classical (R,T) dataprone to mathematical nonuniqueness in the inversionprocess. In fact, even small experimental errors in the(R,T) data can lead to such large estimation uncertain-ties in the resulting values for the film thickness andrefractive index that these latter turn out to be uselessin practice. The nonuniqueness problem is particu-larly evident in the case of very thin films, such as thoserepresenting early stages of film growth.8 A literaturesearch failed to produce any reference to a spectro-scopic ellipsometry9-13 study of low-index transparentthin films in combination with transparent glass sub-strates, where the two materials differ little in refrac-tive index.
A study was, therefore, performed by Monte Carlosimulation to illustrate the potential usefulness andlimitations of spectroscopic ellipsometry in the opticalcharacterization of such samples. The following ques-tions are addressed:
Does the angle of incidence at which experimentalmeasurements are to be made need to be selectedjudiciously so as to avoid inherent lack of sensitivity inthe eventual data reduction?
To what extent does random noise in the experimen-tal spectra propagate during the data reduction?
Can a simple computational strategy be found sothat reliable data reduction may be performed quicklyand without recourse to large (and perhaps inaccessi-ble) computers?
All the numerical work for this study was done inBASIC on a Hewlett-Packard 87 minicomputer identi-cal to the one which accompanies the Sopra ES2Gspectroscopic ellipsometer.
3796 APPLIED OPTICS / Vol. 26, No. 18 / 15 September 1987
.9
n0
D
hs = nS + i kr
.
vi
Le -
L7
LO I
N
14
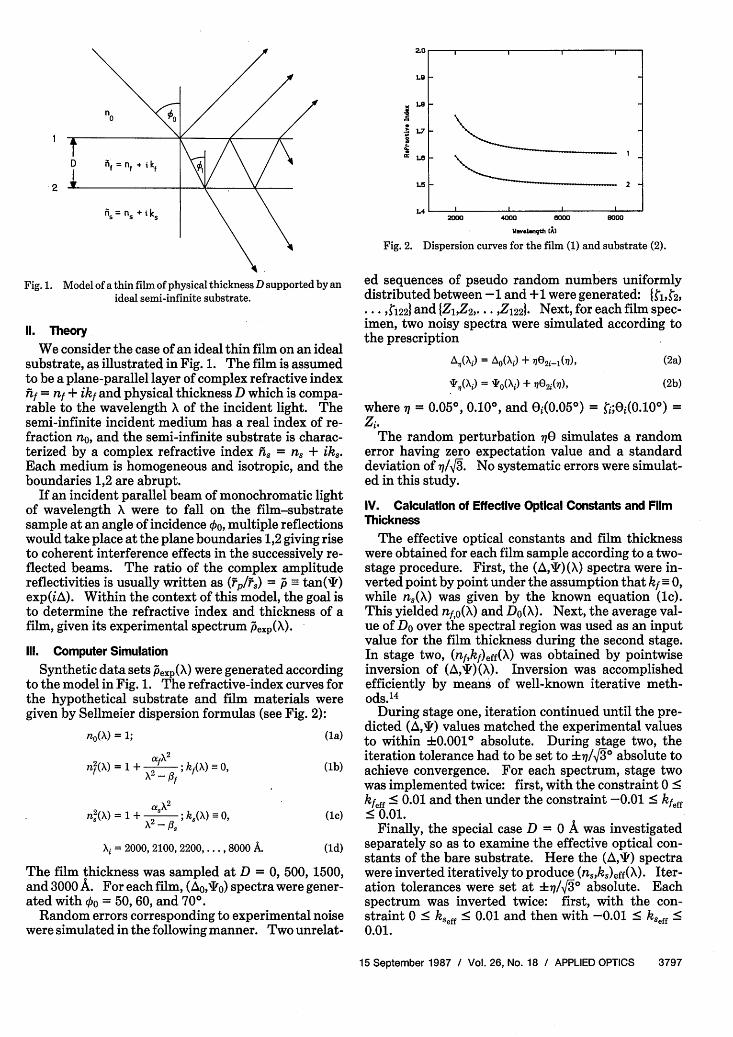
Fig. 1. Model of a thin film of physical thickness D supported by anideal semi-infinite substrate.
II. Theory
We consider the case of an ideal thin film on an idealsubstrate, as illustrated in Fig. 1. The film is assumedto be a plane-parallel layer of complex refractive indexif = nf + ikf and physical thickness D which is compa-rable to the wavelength X of the incident light. Thesemi-infinite incident medium has a real index of re-fraction no, and the semi-infinite substrate is charac-terized by a complex refractive index h, = n + ik,.Each medium is homogeneous and isotropic, and theboundaries 1,2 are abrupt.
If an incident parallel beam of monochromatic lightof wavelength X were to fall on the film-substratesample at an angle of incidence 00, multiple reflectionswould take place at the plane boundaries 1,2 giving riseto coherent interference effects in the successively re-flected beams. The ratio of the complex amplitudereflectivities is usually written as (p/P,) = p tan(t)exp(iA). Within the context of this model, the goal isto determine the refractive index and thickness of afilm, given its experimental spectrum &exp(X).
Ill. Computer Simulation
Synthetic data sets Pexp(X) were generated accordingto the model in Fig. 1. The refractive-index curves forthe hypothetical substrate and film materials weregiven by Sellmeier dispersion formulas (see Fig. 2):
no(X) = 1; (la)
2 2
n,,(X) -1 + .- k )(X) _o, (ic)
Xi= 2000, 2100, 2200,...,8000 A (1d)
The film thickness was sampled at D = 0, 500, 1500,and 3000 A. For each film, (A0,'o) spectra were gener-ated with 00 = 50, 60, and 700.
Random errors corresponding to experimental noisewere simulated in the following manner. Two unrelat-
Wlimplqy A)
Fig. 2. Dispersion curves for the film (1) and substrate (2).
ed sequences of pseudo random numbers uniformlydistributed between -1 and +1 were generated: Itit2,. . ,1221 and {Z1,Z2, ... ,Z 221. Next, for each film spec-imen, two noisy spectra were simulated according tothe prescription
ApXi) = Ao(Xi) + 02i- 1 (7),
4'(\) = PO(Xi) + 0O2i(7),
(2a)
(2b)
where 7 = 0.050, 0.10°, and Oi(O.050) = ;OL(0.100) =
Zi.The random perturbation nO simulates a random
error having zero expectation value and a standarddeviation of 77/3. No systematic errors were simulat-ed in this study.
IV. Calculation of Effective Optical Constants and FilmThickness
The effective optical constants and film thicknesswere obtained for each film sample according to a two-stage procedure. First, the (A,I)(X) spectra were in-verted point by point under the assumption that kf 0,while n(X) was given by the known equation (c).This yielded nfO(X) and Do(X). Next, the average val-ue of Do over the spectral region was used as an inputvalue for the film thickness during the second stage.In stage two, (nfkf)eff(X) was obtained by pointwiseinversion of (A,)(X). Inversion was accomplishedefficiently by means of well-known iterative meth-ods.' 4
During stage one, iteration continued until the pre-dicted (A,I) values matched the experimental valuesto within ±0.0010 absolute. During stage two, theiteration tolerance had to be set to +i7/3o absolute toachieve convergence. For each spectrum, stage twowas implemented twice: first, with the constraint 0 <kfeff S 0.01 and then under the constraint -0.01 < kfeff< 0.01.
Finally, the special case D = 0 A was investigatedseparately so as to examine the effective optical con-stants of the bare substrate. Here the (A,') spectrawere inverted iteratively to produce (nsks)eff(X). Iter-ation tolerances were set at +i7/J3i absolute. Eachspectrum was inverted twice: first, with the con-straint 0 < kSeff < 0.01 and then with -0.01 • kSeff <0.01.
15 September 1987 / Vol. 26, No. 18 / APPLIED OPTICS 3797
2 -
2000 4000 m000 8000
Io . X
l
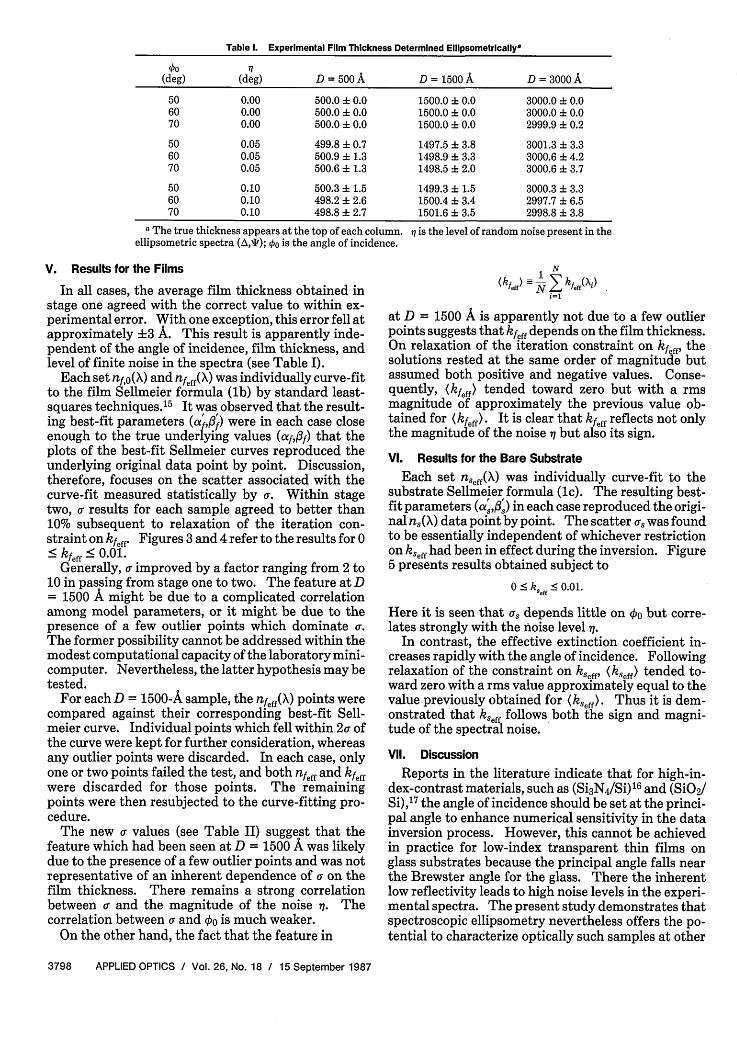
Table 1. Experimental Film Thickness Determined Eilipsometricallya
0o 7(deg) (deg) D = 500A D = 1500A D = 3000A
50 0.00 500.0 + 0.0 1500.0 + 0.0 3000.0 + 0.060 0.00 500.0 + 0.0 1500.0 + 0.0 3000.0 + 0.070 0.00 500.0 + 0.0 1500.0 + 0.0 2999.9 + 0.2
50 0.05 499.8 + 0.7 1497.5 + 3.8 3001.3 + 3.360 0.05 500.9 + 1.3 1498.9 + 3.3 3000.6 + 4.270 0.05 500.6 ± 1.3 1498.5 + 2.0 3000.6 + 3.7
50 0.10 500.3 + 1.5 1499.3 + 1.5 3000.3 + 3.360 0.10 498.2 + 2.6 1500.4 + 3.4 2997.7 + 6.570 0.10 498.8 + 2.7 1501.6 + 3.5 2998.8 + 3.8
a The true thickness appears at the top of each coluellipsometric spectra (A,'); /O is the angle of inciden
V. Results for the Films
In all cases, the average film thickness obtained instage one agreed with the correct value to within ex-perimental error. With one exception, this error fell atapproximately ±3 A. This result is apparently inde-pendent of the angle of incidence, film thickness, andlevel of finite noise in the spectra (see Table I).
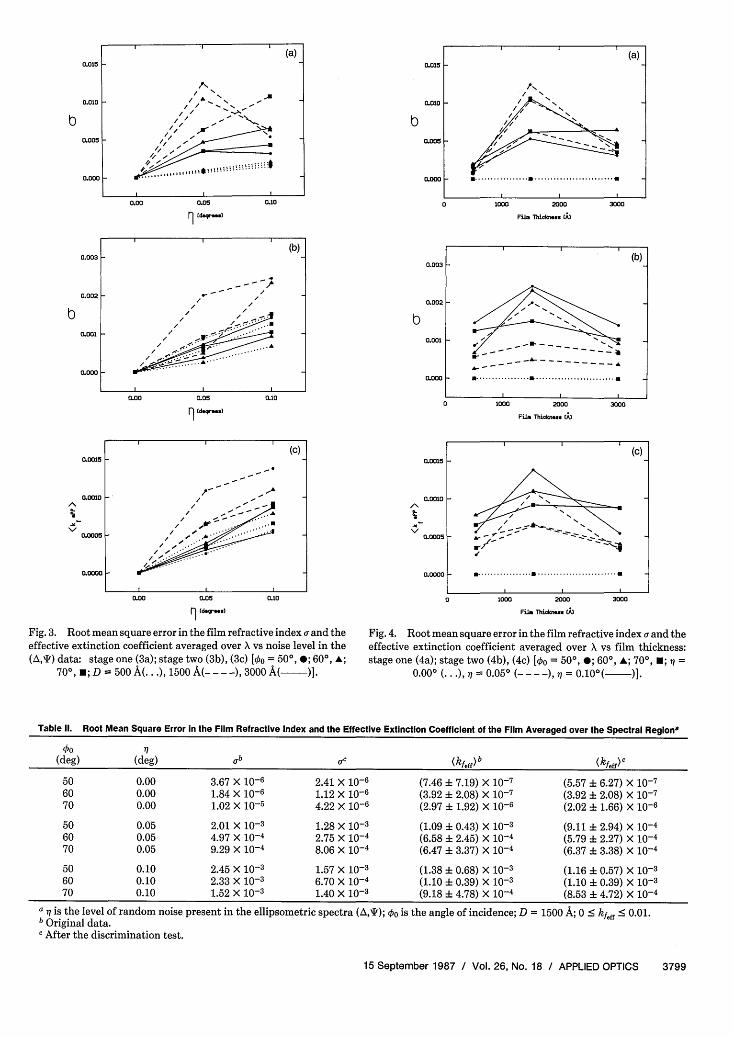
Each set nfo(X) and nfeff(X) was individually curve-fitto the film Sellmeier formula (lb) by standard least-squares techniques.' 5 It was observed that the result-ing best-fit parameters ( fI) were in each case closeenough to the true underlying values (af,flf) that theplots of the best-fit Sellmeier curves reproduced theunderlying original data point by point. Discussion,therefore, focuses on the scatter associated with thecurve-fit measured statistically by a. Within stagetwo, a results for each sample agreed to better than10% subsequent to relaxation of the iteration con-straint on kfeff. Figures 3 and 4 refer to the results for 0< kfeff < 0.01.
Generally, a improved by a factor ranging from 2 to10 in passing from stage one to two. The feature at D= 1500 A might be due to a complicated correlationamong model parameters, or it might be due to thepresence of a few outlier points which dominate a.The former possibility cannot be addressed within themodest computational capacity of the laboratory mini-computer. Nevertheless, the latter hypothesis may betested.
For each D = 1500-A sample, the nfeff(X) points werecompared against their corresponding best-fit Sell-meier curve. Individual points which fell within 2c ofthe curve were kept for further consideration, whereasany outlier points were discarded. In each case, onlyone or two points failed the test, and both nfeff and kfeffwere discarded for those points. The remainingpoints were then resubjected to the curve-fitting pro-cedure.
The new a values (see Table II) suggest that thefeature which had been seen at D = 1500 A was likelydue to the presence of a few outlier points and was notrepresentative of an inherent dependence of a on thefilm thickness. There remains a strong correlationbetween and the magnitude of the noise . Thecorrelation between a and 00 is much weaker.
On the other hand, the fact that the feature in
mn. q1 is the level of random noise present in thece.
N(kfff) - N kfff(X)
at D = 1500 A is apparently not due to a few outlierpoints suggests that kfeff depends on the film thickness.On relaxation of the iteration constraint on kfeff, thesolutions rested at the same order of magnitude butassumed both positive and negative values. Conse-quently, (kfeff) tended toward zero but with a rmsmagnitude of approximately the previous value ob-tained for (keff). It is clear that kfeff reflects not onlythe magnitude of the noise i7 but also its sign.
VI. Results for the Bare Substrate
Each set nlseff(X) was individually curve-fit to thesubstrate Sellmeier formula (1c). The resulting best-fit parameters (a'S3) in each case reproduced the origi-nal n,(X) data point by point. The scatter as was foundto be essentially independent of whichever restrictionon kSeff had been in effect during the inversion. Figure5 presents results obtained subject to
0OkS <e0.01.
Here it is seen that a. depends little on qo but corre-lates strongly with the noise level x7.
In contrast, the effective extinction coefficient in-creases rapidly with the angle of incidence. Followingrelaxation of the constraint on eff, (kseff) tended to-ward zero with a rms value approximately equal to thevalue previously obtained for (kseff). Thus it is dem-onstrated that kSeff follows both the sign and magni-tude of the spectral noise.
VII. Discussion
Reports in the literature indicate that for high-in-dex-contrast materials, such as (Si3N4/Si)'6 and (SiO2/Si),'7 the angle of incidence should be set at the princi-pal angle to enhance numerical sensitivity in the datainversion process. However, this cannot be achievedin practice for low-index transparent thin films onglass substrates because the principal angle falls nearthe Brewster angle for the glass. There the inherentlow reflectivity leads to high noise levels in the experi-mental spectra. The present study demonstrates thatspectroscopic ellipsometry nevertheless offers the po-tential to characterize optically such samples at other
3798 APPLIED OPTICS / Vol. 26, No. 18 / 15 September 1987
0.015
0.010 H
0.005
0.000 -
0.00 0.05 0.10
td
0.015
0.010
b0.005
0.000
(a)
I, '
0 1000 2000 3000
Fil. Thikn.. Al
I 1000 2000 3000
Fil. Thic.e- Al
0.0015
0.0010'N
0.00 05
0.0000
0.00 0.05 0.lO
9 td.-l
Fig. 3. Root mean square error in the film refractive index a and theeffective extinction coefficient averaged over X vs noise level in the(A,'I) data: stage one (3a); stage two (3b), (3c) [o = 500, 0; 600, A;
70°, *; D = 500 A(. . .), 1500 A(- - - -), 3000 A( )].
0.0015 H
O.010 H
0.0005 h
0.0000
0 1000 2000
Film Thid t;l
3000
Fig. 4. Root mean square error in the film refractive index a and theeffective extinction coefficient averaged over X vs film thickness:stage one (4a); stage two (4b), (4c) [00 = 500, ; 600, A; 70°, *; =
0.00° (.. ),,q = 0.05° (----), = 010°( )].
Table 11. Root Mean Square Error In the Film Refractive Index and the Effective Extinction Coefficient of the Film Averaged over the Spectral Regiona
00 77(deg) (deg) ab IYC (kfeff)b (kfeff)c
50 0.00 3.67 X 10⁻⁶ 2.41 X 10⁻⁶ (7.46 7.19) X 10-7 (5.57 ± 6.27) X 10-760 0.00 1.84 X 10⁻⁶ 1.12 X 10⁻⁶ (3.92 + 2.08) X 10-7 (3.92 + 2.08) X 10-770 0.00 1.02 X 10⁻⁵ 4.22 X 10⁻⁶ (2.97 + 1.92) X 10-6 (2.02 + 1.66) X 10-6
50 0.05 2.01 X 10⁻³ 1.28 X 10⁻³ (1.09 + 0.43) X 10-3 (9.11 ± 2.94) X 10-460 0.05 4.97 X 10⁻⁴ 2.75 X 10⁻⁴ (6.58 + 2.45) X 10-4 (5.79 2.27) X 10-470 0.05 9.29 X 10⁻⁴ 8.06 X 10⁻⁴ (6.47 + 3.37) X 10-4 (6.37 + 3.38) X 10-4
50 0.10 2.45 X 10⁻³ 1.57 X 10⁻³ (1.38 + 0.68) X 10-3 (1.16 + 0.57) X 10-360 0.10 2.33 X 10⁻³ 6.70 X 10⁻⁴ (1.10 + 0.39) X 10-3 (1.10 + 0.39) X 10-370 0.10 1.52 X 10⁻³ 1.40 X 10⁻³ (9.18 ± 4.78) X 10-4 (8.53 + 4.72) X 10-4
= 1500 A; 0 S kfeff S 0.01.
15 September 1987 / Vol. 26, No. 18 / APPLIED OPTICS 3799
0
(a)
A - I" / . N , -
/ / II-I,.,
// I X
~~~~~~~~~.$
0.003 H
0.002 H
0.001 F-
0.000
(b)
/ 1
/
-I-//~~~~~~~~~~~
0.00
0.003
0.002
b0.001
0.000 F
I
(b)
- - -------- --
............................................
0.05
9 (dt)l
0.10
(C)
/ N~~~~
A -~ - - ,~ Nr/ a,
_ ...
a 1 is the level of random noise present in the ellipsometric spectra (A,f); 0/o is the angle of incidence; Db Original data.c After the discrimination test.
r -8 (a)

angles of incidence which are experimentally accessi-ble.
Following a simple two-step procedure, the filmthickness and refractive index may be obtained accu-rately to within +3 A and ±0.0015, respectively, intypical conditions.7 These results are essentially in-dependent of the film thickness and of the angle ofincidence. Although earlier work by Humlicekl8"9suggests that significant thickness dependence mightbe possible, none was observed in the present study.
It was impossible to calculate accurate values of theextinction coefficients for the films. The effectivevalues obtained correlate strongly with the noise levelin the experimental spectra and also with the filmthickness. To investigate rigorously such matters,other error analysis methods are appropriated Nev-ertheless, some insight into the above observationsmay still be gained.
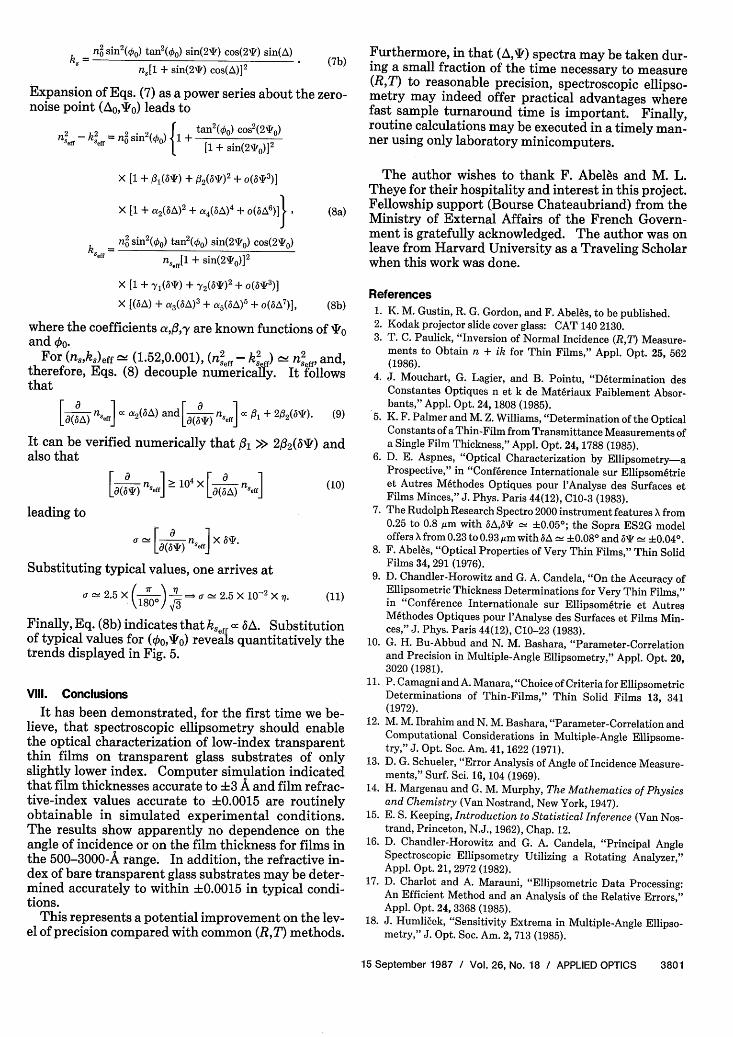
Abelbs8 derived the following equations which illus-trate the dependence of the angles (A,') on the filmthickness and optical constants, valid in the very thin-film limit:
A = Anfilm + ) YOS2
X r (z - -)(e- edz 1LX s - eO)[S2(es + eO) - Jseo
(3a)
' = "no film - (2rD) YOS2 sin(2*nofilm)
X Im( eo)[S2(e + eO)-e Ie , (3b)
where Yo = no cos(00), S = no sin(400), and the dielectricconstants are given by eo = n2, Zs = el, + ie2, and Z = cl +LE2.
For transparent substrates, Eqs. (3) lead to
A Ano film + ( A ) [1 - (no/n)2][1-(n 1n)2 ] , (4a)
"'no film - (2nkD sin(2*nofilm)[1 - (non,/n2)2]5, (4b)
where
2 (2irY0S2)(n - nY[S 2 (n2 + n2) - n2nOn1. (4c)
It follows immediately that the experimental errors inA and I lead directly to estimation errors in nf, kf, andD:
BA Kc (2AnD) Anf + (n At) D, (5a)
(X ) (X )O c (c ) tbn1+ (n p) Bkf + (nf•) 8.0. (Sb)
In stage one calculations, all the correlation is artifi--cially forced into relation (5a). Subsequent calcula-tion of (nffkf)eff in stage two allows correlation with Hiand should produce a decrease in bnfeff (i.e., a). Al-though relations (3) have already been discussed else-where in the very thin-film limit,8'20 '2 ' the present
0.003
0.002
0.0
0.000
0 0X0
'N
OA0X04
0.0002
0.0000
0.00 0.05 0.10
Cdsqr.a
(b)
I I0.00 0.05 0.10
d sd-.l
Fig. 5. Root mean square error in the substrate refractive index a,and the effective extinction coefficient averaged over X vs noise level
in the (Add) data: [o = 500, 0; 600, A; 700, El.
study offers the first evidence that relations similar to(5) remain valid for thicker films as well.
We turn now to the special case of the bare glasssubstrate. Classical (RT) measurements for such-a-material would typically yield T 0.920 + 0.001.Assuming negligible absorption, the limiting precisionin n, would be
n,5n3. (Tn,)X T i 4 X 0.001.
The present study demonstrates that spectroscopicellipsometry should be capable of improving this limitto n8 +0.0015 in typical experimental conditions.Significantly, this level of precision appears not todepend on the angle of incidence for those ho I OBrew-
ster- The effective extinction coefficient for the sub-strate correlates strongly with experimental noise andshould not be interpreted as an optical extinction coef-ficient.
The source of correlation in, the bare substrate mod-el may be illustrated with recourse to the exact equa-tion of ellipsometry22 given by
h = no sin( 0 ) 1 + (1 )2 tan2(00)]1/2 , (6)
which is equivalent to 23
n2 - k 2 = n2 sin 2(00)
{ tan 2(0o)[cos2(21) - sin2(2*) sin2(A)][ + sin(2P) cos(A)]2 }
3800 APPLIED OPTICS / Vol. 26, No. 18 / 15 September 1987
(a)
= n2 sin2(00 ) tan 2 (00 ) sin(2'V) cos(2T) sin(A) (7b)
n,[1 + sin(2AF) cos(A)]2
Expansion of Eqs. (7) as a power series about the zero-noise point (o 0,I 0) leads to
n2 - k2 = nsin2(00) 1 + tan (00 ) cos2(2T)8eff Se,, si0 / 0 [1 + sin(2qV0)]2
X [1 + 131(6t') + 32(64I)2 + o(t'p 3 )]
X 1l + a2(bA)2 + a4 (bA)4 + o(bA6)]} (8a)
ksef =no sin(0 0 ) tan2 (00 ) sin(24V0 ) cos(2V0 )
nSff[l + sin(24V0 )]2
X [1 + 'yl(5*) + 72(bq')2 + O(6J3)]
X [(A) + a3 (IA)7 + a5 (6A)5 + O(6A7)], (8b)
where the coefficients a,-y are known functions of Ioand 00.
For (sks)eff (1.52,0.001), (2eff - k2eff) n 2eff and,therefore, Eqs. (8) decouple numerically. It followsthat
adv nf[ a2 A) and n f l + 22(6*). (9)
It can be verified numerically that 31 >> 22(') andalso that
[(53 n, f > 104 X [(a) n.,,ff] (0
leading to
Substituting typical values, one arrives at
a 2.5 X (8)2 L a 2.5 X 10⁻² X . (11)
Finally, Eq. (8b) indicates that keff 15 A. Substitutionof typical values for (00,'O) reveals quantitatively thetrends displayed in Fig. 5.
Vil. Conclusions
It has been demonstrated, for the first time we be-lieve, that spectroscopic ellipsometry should enablethe optical characterization of low-index transparentthin films on transparent glass substrates of onlyslightly lower index. Computer simulation indicatedthat film thicknesses accurate to 3 A and film refrac-tive-index values accurate to 0.0015 are routinelyobtainable in simulated experimental conditions.The results show apparently no dependence on theangle of incidence or on the film thickness for films inthe 500-3000-A range. In addition, the refractive in-dex of bare transparent glass substrates may be deter-mined accurately to within ±0.0015 in typical condi-tions.
This represents a potential improvement on the lev-el of precision compared with common (R,T) methods.
Furthermore, in that (A,') spectra may be taken dur-ing a small fraction of the time necessary to measure(RM to reasonable precision, spectroscopic ellipso-metry may indeed offer practical advantages wherefast sample turnaround time is important. Finally,routine calculations may be executed in a timely man-ner using only laboratory minicomputers.
The author wishes to thank F. Abeles and M. L.Theye for their hospitality and interest in this project.Fellowship support (Bourse Chateaubriand) from theMinistry of External Affairs of the French Govern-ment is gratefully acknowledged. The author was onleave from Harvard University as a Traveling Scholarwhen this work was done.
References
1. K. M. Gustin, R. G. Gordon, and F. Abeles, to be published.2. Kodak projector slide cover glass: CAT 140 2130.3. T. C. Paulick, "Inversion of Normal Incidence (R,T) Measure-
ments to Obtain n + ik for Thin Films," Appl. Opt. 25, 562(1986).
4. J. Mouchart, G. Lagier, and B. Pointu, "D6termination desConstantes Optiques n et k de Mat6riaux Faiblement Absor-bants," Appl. Opt. 24, 1808 (1985).
5. K. F. Palmer and M. Z. Williams, "Determination of the OpticalConstants of a Thin-Film from Transmittance Measurements ofa Single Film Thickness," Appl. Opt. 24, 1788 (1985).
6. D. E. Aspnes, "Optical Characterization by Ellipsometry-aProspective," in "Conf6rence Internationale sur Ellipsom6trieet Autres Mthodes Optiques pour 'Analyse des Surfaces etFilms Minces," J. Phys. Paris 44(12), C10-3 (1983).
7. The Rudolph Research Spectro 2000 instrument features X from0.25 to 0.8 ,un with A,6bT' +0.050; the Sopra ES2G modeloffers from 0.23 to 0.93,um with At +0.080 and t +0.040.
8. F. Abeles, "Optical Properties of Very Thin Films," Thin SolidFilms 34, 291 (1976).
9. D. Chandler-Horowitz and G. A. Candela, "On the Accuracy ofEllipsometric Thickness Determinations for Very Thin Films,"in "Conf6rence Internationale sur Ellipsom6trie et AutresM6thodes Optiques pour 'Analyse des Surfaces et Films Min-ces," J. Phys. Paris 44(12), C1O-23 (1983).
10. G. H. Bu-Abbud and N. M. Bashara, "Parameter-Correlationand Precision in Multiple-Angle Ellipsometry," Appl. Opt. 20,3020 (1981).
11. P. Camagni and A. Manara, "Choice of Criteria for EllipsometricDeterminations of Thin-Films," Thin Solid Films 13, 341(1972).
12. M. M. Ibrahim and N. M. Bashara, "Parameter-Correlation andComputational Considerations in Multiple-Angle Ellipsome-try," J. Opt. Soc. Am. 41, 1622 (1971).
13. D. G. Schueler, "Error Analysis of Angle of Incidence Measure-ments," Surf. Sci. 16, 104 (1969).
14. H. Margenau and G. M. Murphy, The Mathematics of Physicsand Chemistry (Van Nostrand, New York, 1947).
15. E. S. Keeping, Introduction to Statistical Inference (Van Nos-trand, Princeton, N.J., 1962), Chap. 12.
16. D. Chandler-Horowitz and G. A. Candela, "Principal AngleSpectroscopic Ellipsometry Utilizing a Rotating Analyzer,"Appl. Opt. 21, 2972 (1982).
17. D. Charlot and A. Marauni, "Ellipsometric Data Processing:An Efficient Method and an Analysis of the Relative Errors,"Appl. Opt. 24, 3368 (1985).
18. J. Humlicek, "Sensitivity Extrema in Multiple-Angle Ellipso-metry," J. Opt. Soc. Am. 2, 713 (1985).
15 September 1987 / Vol. 26, No. 18 / APPLIED OPTICS 3801
19. Y. Gaillyova, E. Schmidt, and J. Humlicek, "Multiple-AngleEllipsometry of Si-SiO2 Polycrystalline Si System," J. Opt. Soc.Am. 2, 723 (1985).
20. G. Vuye and T. L6pez-Rlos, "Precision in the EllipsometricDetermination of the Optical Constants of Very Thin Films,"Appl. Opt. 21, 2968 (1982).
21. D. E. Aspnes, in Optical Properties of Solids: New Develop-ments, B. 0. Seraphin, Ed. (North-Holland, Amsterdam, 1976),Chap. 15, p. 186.
22. R. M. A. Azzam and N. M. Bashara, Ellipsometry and PolarizedLight (North-Holland, Amsterdam, 1977), p. 274.
23. K. L. Chopra, Thin-Film Phenomena (McGraw-Hill, New York,1969), p. 722.
OSA Meetings Schedule
OPTICAL SOCIETY OF AMERICA
1816 Jefferson Place N.W.
Washington, DC 20036
28 September-1 October 1987 LASER ANDMOTE SENSING: INSTRUMENTATIONNIQUES TOPICAL MEETING, Cape CodMeetings Department at OSA
OPTICAL RE-AND TECH-Information:
19-23 October 1987 ANNUAL MEETING OPTICAL SOCIETY
OF AMERICA, Rochester Information: Meetings De-partment at OSA
20-23 October 1987 WORKSHOP ON OPTICAL FABRICA-TION AND TESTING, Rochester Information: Meet-ings, Department at OSA
26-28 October 1987 TUNABLE SOLID-STATE LASERSTOPICAL MEETING, Williamsburg Information: Meet-ings Department at OSA
25-27 January 1988 CONFERENCE ON OPTICAL FIBERCOMMUNICATION, New Orleans Information: Meet-ings Department at OSA
27-29 January 1988 CONFERENCE ON OPTICAL FIBERSENSORS, New Orleans Information: Meetings De-
partment at OSA
12-14 April 1988 OPTICAL INTERFERENCE COATINGSTOPICAL MEETING, Tucson Information: MeetingsDepartment at OSA
25-29 April 1988 CLEO 88, CONFERENCE ON LASERSAND ELECTRO-OPTICS, Anaheim Information: Meet-ings Department at OSA
September 1988 SHORT WAVELENGTH COHERENT RADI-ATION TOPICAL MEETING, Cape Cod Information:
Meetings Department at OSA
31 October-4 November 1988 ANNUAL MEETING OPTICALSOCIETY OF AMERICA, Santa Clara Information:Meetings Department at OSA
19-23 February 1989 CONFERENCE ON OPTICAL FIBERCOMMUNICATION, Dallas Information: Meetings De-partment at OSA
24-28 April 1989 CONFERENCE ON LASERS AND ELEC-TRO-OPTICS, Baltimore Information: Meetings De-partment at OSA
24-28 April 1989 INTERNATIONAL QUANTUM ELECTRON-ICS CONFERENCE, Baltimore Information: MeetingsDepartment at OSA
15-20 October 1989 ANNUAL MEETING OPTICAL SOCIETYOF AMERICA, Orlando Information: Meetings Depart-
ment at OSA
3802 APPLIED OPTICS / Vol. 26, No. 18 / 15 September 1987


![[FlhJ16fa] Film thickness by interference pattern and optical characterization of polyaniline by spectroscopic ellipsometry](https://img.pdfslide.net/doc/110x75/589982551a28abb97c8b592f/flhj16fa-film-thickness-by-interference-pattern-and-optical-characterization.jpg)