Embed Size (px)
Citation preview

INSTITUTE OF PHYSICS PUBLISHING JOURNAL OF PHYSICS B: ATOMIC, MOLECULAR AND OPTICAL PHYSICS
J. Phys. B: At. Mol. Opt. Phys. 38 (2005) S469–S495 doi:10.1088/0953-4075/38/9/003
Optical frequency/wavelength references
L Hollberg, C W Oates, G Wilpers, C W Hoyt, Z W Barber,S A Diddams, W H Oskay and J C Bergquist
NIST, Boulder, CO 80305, USA
E-mail: [email protected]
Received 19 January 2005Published 25 April 2005Online at stacks.iop.org/JPhysB/38/S469
AbstractFor more than 100 years, optical atomic/molecular frequency references haveplayed important roles in science and technology, and provide standardsenabling precision measurements. Frequency-stable optical sources have beencentral to experimental tests of Einstein’s relativity, and also serve to realizeour base unit of length. The technology has evolved from atomic dischargelamps and interferometry, to narrow atomic resonances in laser-cooled atomsthat are probed by frequency-stabilized cw lasers that in turn control opticalfrequency synthesizers (combs) based on ultra-fast mode-locked lasers. Recenttechnological advances have improved the performance of optical frequencyreferences by almost four orders of magnitude in the last eight years. Thishas stimulated new enthusiasm for the development of optical atomic clocks,and allows new probes into nature, such as searches for time variation offundamental constants and precision spectroscopy.
1. Introduction
Ideas for using visible light from atomic transitions for precision instrumentation andmetrology go back at least to the 1800s. There are several good reasons to use opticalfrequencies, and with the scientific and technological advances of the last century—relativity, quantum mechanics, electronics, coherent microwave sources, lasers . . . —wenow have optical frequency references (OFRs) with truly exceptional performance. Opticalatomic frequency references were developed out of basic scientific explorations in precisionspectroscopy of atoms and molecules. They are now used in numerous scientific applications,serve to realize the unit of length, the metre, in the international system (SI), and are practicaltools for dimensional metrology. Over the last 100 years the frequency accuracy of OFR hasimproved by about nine orders of magnitude, from 6 digits achievable with discharge lampsto modern frequency-stabilized lasers referenced to laser-cooled atoms that have a frequencyreproducibility of about 15 digits.
0953-4075/05/090469+27$30.00 © 2005 IOP Publishing Ltd Printed in the UK S469

S470 L Hollberg et al
∆νDetector
Feedback SystemLocks Oscillator to atomic resonance
456 986 240 494 158
Optical Freq. Synthesizer Divider
νaClock Oscillator
High-Q resonatorLaser linewidth < 1 Hz
Laser
Atoms
Coherent Optical pulses out
Microwave pulses out
Counter
Figure 1. Schematic diagram of a modern optical frequency reference based on a spectrally sharpatomic resonance. The atomic resonance is probed by a narrow linewidth laser that is pre-stabilizedto a high-Q Fabry–Perot cavity. On longer times scales the feedback control system steers the laserfrequency to the atomic resonance. By adding the totalizing optical frequency counter/dividershown at the bottom of the figure, the optical frequency reference becomes an optical atomic clock.
By ‘optical frequency references’ or standards we mean a stable optical frequency that isreferenced to a quantum transition in an atom, ion or molecule (all considered to be an atom,for simplicity in what follows) as shown in figure 1.
In addition to many practical considerations, the performance of frequency referencesis characterized by two basic figures of merit: accuracy and instability. These have formaldefinitions [1, 2]. But, as expected, instability is a measure of how much the frequency changesover time, and accuracy is a measure of how well the standard gives the correct frequency. Ifwe consider the history of time keeping and compare clocks as different as sundials, pendulumclocks and quartz clocks, it is clear that greater accuracy and better instability are possible asthe oscillation frequency increases. The improvement in clock performance that is anticipatedby using optical frequencies derives mainly from the much higher frequencies, which dividetime into smaller intervals. Whereas the oscillator in a caesium atomic clock vibrates at amicrowave frequency (f ∼ 1010 Hz), a clock using a visible laser as its oscillator ‘ticks’ about105 times faster, potentially allowing time intervals to be measured with a similar increase inprecision. The fractional frequency instability that is expected for an atomic clock with Natoms operating in the quantum-projection-noise limit is approximately σy ≈ �ν
ν0s/n≈ �ν
ν0√
Nτ,
where �ν is the linewidth of the transition, ν0 is the oscillation frequency, s/n is the signal-to-noise ratio, and τ is the averaging time [2, 3]. (Frequently, for simplicity of notation, we willuse the word ‘stability’ to describe a frequency that is stable in time, but the actual numericalvalues will be given in terms of fractional frequency ‘instability’ as in the equation above.)
In the late 1990s all the pieces were coming together for a major advance in theperformance of optical frequency standards. Four main factors contributed to the rapid advancein performance: advanced methods for laser cooling and trapping of atoms to microkelvintemperatures [4], methods for laser frequency stabilization using high finesse Fabry–Perotcavities producing laser linewidths less than 1 Hz at 500 THz [5–7], methods of precisionlaser spectroscopy of trapped atoms producing line Q as high as (ν/�ν) = 1014 [8–10],and, finally, a convenient method for synthesizing and counting optical frequencies using

Optical frequency/wavelength references S471
1.E-15
1.E-14
1.E-13
1.E-12
1.E-11
1.E-10
1.E-09
1.E-08
1970 1975 1980 1985 1990 1995 2000 2005
Year
Fra
ctio
nal
Fre
qu
ency
Un
cert
ain
ty IROptical
Laser-Based Frequency Standards
Cs microwave
Figure 2. Fractional frequency uncertainty of state-of-the-art optical frequency standards versesdate. The fractional frequency uncertainty represents the ‘accuracy’ of optical standards whichcan be compared to the dot-dash line representing the approximate performance of state-of-the-artCs primary frequency standards at corresponding dates.
femtosecond laser optical frequency combs [11–13]. It now seems clear to most experts thatthe highest performance atomic clocks of the near future will be based on stable lasers probingnarrow optical transitions in cold atoms. Already, OFRs have demonstrated better stabilitythan the best microwave frequency standards for measurement times from a few seconds to afew hours [14]. And in several national laboratories, accuracies approaching a few parts in1015 have been shown [15–17]. Optical clocks are now a reality and are beginning to performat levels that eclipse previous non-optical technologies.
The accuracies to which optical atomic frequencies have been determined relative toprimary Cs frequency standards are illustrated in figure 2 [18–23]. For the plot we havearbitrarily chosen the starting date as 1972, the year when the 3.39 µm methane-stabilizedHeNe laser was first measured, but, in fact, there were a few measurements of far-infrared andCO2 laser frequency references prior to that date.
This paper does not comprehensively review optical frequency standards, but selectivelyuses highlights of experiments to illustrate the state-of-the-art and to provide some perspectiveon how optical frequency standards have evolved, as well as their close connection toEinstein’s theory of relativity over the past 100 years. Many modern high accuracy testsof special relativity (SR) have been founded on precision laser measurements and opticalatomic frequency references. Moreover, the international system (SI) units of time, frequencyand length are based on the quantum clock transition in Cs (a microwave transition) and thenow-defined speed of light c. Other SI base units, the ampere and candela, also rely onfrequency as part of their definition. Within the theoretical foundation of SR, the constantvelocity of light and existing stable optical frequency references, it is very natural that bothlength and time could be measured with light. Recent advances in the technologies of opticalfrequency standards significantly enhance our capabilities to measure physical quantities inspace–time and quantum energy differences.
A large number of people have contributed to the ideas discussed here, and seriousresearch efforts are growing in laboratories around the world. Many of the most importantconcepts for OFR and optical clocks can be traced to leading pioneers in the field such asJ L Hall, V P Chebotayev, S N Bagayev, C J Borde, A Clairon, T W Hansch, G Kramer,

S472 L Hollberg et al
J Helmcke and many many others. In the limited space here our discussion is necessarilyincomplete, and we apologize from the outset for not giving proper recognition of importantcontributions of unnamed others. In hopes of rectifying this we refer the reader to some papersand compilations that provide different perspectives and more thorough reviews [7, 24–30].
2. Historical perspective on optical frequency references
The connection between Michelson’s experimental results and Einstein’s relativity is obvioustoday. Even so, scientists and historians have long discussed the relative significance of thecontributions of Michelson, Lorentz, Fitzgerald, Poincare and others to our understandingof space–time and the development of Einstein’s relativity. In any case, precision opticalmeasurements of length, frequency and the velocity of light have played central roles[31, 32]. We do not have to search far to find the thread that connects Michelson’s experimentsand Einstein’s relativity to our modern optical atomic clocks. Now, 100 years later, we areat the beginning of the era when optical frequency standards are expected to overtake theirmicrowave counterparts as the highest performance atomic frequency standards.
It appears that the idea to use optical references for length measurements goes backat least to Babinet about 1829 [33, 34], and it is well documented that as early as 1887,Michelson proposed using optical atomic emission lines (i.e. atomic energy level differences)and optical interferometry for length metrology [35–38]. Interferometry was used to measurethe wavelengths of light from atomic emission sources in terms of the standard metre bar. Theresulting wavelength references were subsequently used for other length measurements. Thisapproach represents the beginning of the application of optical frequency references basedon quantum transitions as metrological tools. However, real frequency-referenced opticalmetrology would have to wait 96 years until both units of time and length were based onatomic transitions and the speed of light was taken as a fixed and defined number. Michelsonpioneered the use of optical atomic wavelength references and optical interferometry for thecalibration of gauge blocks and length standards. Starting about 1892, studies were proceedingto identify the most appropriate optical atomic lines for precision length metrology and todevelop appropriate measurement technologies. Promising candidates included well-knownstrong emission lines of Na, Li, Hg, H and Cd. As is usually the case, with the developmentof a new promising technology there was an interesting parallel evolution of the scientificpsychology.
The brilliant green (mercury) line gives beautifully clear circles even with a differenceof path of half a million waves, so that in all probability this will be used as the ultimatestandard of length (Michelson and Morley (1889) [36]).
The green mercury line is one of the most complex yet examined (Michelson 1892).
Michelson, Morley, Benoit, Fabry and Perot developed extremely ingenious opto-mechanical systems and powerful interferometric methods [38–41]. Precise wavelengthmeasurements by these scientists between 1893 and 1906 were used in 1927 by the CIPM(Comite International des Poids et Mesures) to define the ‘Angstrom’ unit in terms of thewavelength of the red Cd transition at 644 nm. This served as an independent ‘spectroscopicunit of length’, and presumably was done because of its practical utility in spectroscopy.It is noteworthy that the definition of physical length remained connected to the official metrebar in Paris [41]. After considerable experimental work on optical sources and wavelengthmetrology the 86Kr emission line at 605.7 nm was chosen as the official SI definition ofthe metre in 1960, finally replacing the metre bar. This optical atomic length standard was

Optical frequency/wavelength references S473
implemented interferometrically and endured for 23 years, being replaced in 1983 when themetre was redefined in terms of atomic frequency units based on the SI second (Cs ∼ 9.2 GHzclock transition) and the defined speed of light [34, 42].
2.1. The velocity of light and metre from optical frequency references
The speed of light c has intrigued humans since the beginning of time, and it plays a central rolein both theoretical and experimental physics and in practical applications. The imaginativeexperiments of Ole Rømer in 1676 were the first to show that the velocity of light was actuallyfinite. Rømer’s experiments used the periodically pulsed source of light provided by eclipsesof Jupiter’s moons and the reference of length provided by the motion of Earth along its orbitaround the sun. It is interesting that Rømer’s original experiments on the velocity of lightwere performed at l’Observatoire de Paris, which still serves today as the location of theprimary atomic frequency standards of France [43]. More precise astronomical measurementsof c by E Halley and others followed [44, 45]. Subsequent ground-based measurements withrotating mirrors and toothed wheels confirmed the astronomical measurements and improvedthe precision [45].
In the 1890s, the situation became both more complicated and more interesting as highprecision optical interferometry measurements by Michelson indicated that light did not followexactly the same Doppler shift rules that were well known for the velocity of sound.
Measuring the velocity of light requires a known length for the light to traverse, a methodfor detecting the light transit, and some type of reference clock to measure the duration ofthe transit. To come up with an absolute number the length and time references must becalibrated in a traceable way to the standard units of measure of that date. Throughoutthe last century, optical measurements of the velocity of light and optical tests of specialrelativity evolved from measurements of the difference in the arrival time of light pulses, tointerferometric measurements of phase differences of white light traversing different opticalpaths but maintaining nearly equal time delays, to interferometry using narrow atomic emissionlines derived from flames and discharge lamps, to coherent laser interferometry over longerdistances and time intervals, to modern phase-coherent measurements of optical frequencyand phase that span the electromagnetic spectrum from microwaves to the UV. The latestexperiments use length and time standards referenced to stable atomic transitions, and opticalfrequency references ultimately resulted in the speed of light being defined as a constant inthe SI systems of units.
Although, the experimental technologies used by scientists for the early measurementswere very different from the tools at our disposal today (and presumably dwarfed by theexperiments and technologies of the future), the field of metrology has always relied on state-of-the-art instruments of their time. A historic example is the speed of light measurementsmade by Michelson and collaborators in the 1920s [46–49]. In that case the optical path lengthwas between Mounts Wilson and San Antonio in California. The 35 km distance betweenthe mountain tops was measured with a claimed uncertainty of ∼18 mm (approx. 1 partin 2000 000) by the US Coast and Geodetic Survey using accurate surveying methods thatrelied upon 50 m long Invar tapes that were calibrated by the National Bureau of Standards(now NIST). (This brings up another curious connection between precision metrology, testsof relativity, and fundamental science. It turns out that Invar was invented by C-E Guillaume,who was the director of the BIPM 1915–1936 and who won the 1920 Nobel Prize in physicsfor Invar and its understanding [41].) The timing reference for Michelson’s speed of lightmeasurements was actually a driven mechanical tuning-fork operating at about 135 Hz andcalibrated against a standard pendulum, which was in turn calibrated to the then astronomical

S474 L Hollberg et al
definition of the SI second (1/(86 400) of the mean solar day). Some mistakes were made inthese precision measurements even after years of developing the measurement technologies(e.g. even with optical pulses generated with cw discharge lamps and rotating mirrors thegroup velocity dispersion effects were non-negligible for the light pulses travelling throughair). As always, when the actual numerical values are important, it is necessary to have multipleexperiments, different methods and several groups involved. In any case, it is quite remarkablethat experiments using surveying tapes for length and tuning forks for time measured the speedof light to c = 299 796 ± 4 km s−1, a value consistent with the accepted number today withina precision of ∼1.3 × 10⁻⁵ [45, 49].
The precision in the SI unit of length improved rapidly with advances in atomic physicsand laser spectroscopy using frequency stabilized lasers. Lasers were far superior to lamps inspectral and spatial coherence, and when stabilized to atomic transitions, provided much betterwavelength (actually frequency) reproducibility than was possible with even the best dischargelamps. A paradigm change and landmark achievement occurred when measurements of thespeed of light evolved from detection of the arrival time of an optical envelope, to directmeasurements of the frequency and wavelength combined with the basic relationship c = λν.Highly precise measurements of c were made using microwave resonators by L Essen andothers from about 1947 on, but it took another 34 years before this was achieved with highlystable lasers by a team effort at NBS (now NIST) [50]. The main impediment to the practicalimplementation of length metrology based on laser frequencies was that even though laserfrequencies could be very stable and reproducible, the actual frequencies of the atomicallystabilized lasers were not known at that time with sufficient precision in terms of the SI unitof time/frequency, which since 1967 has been the Cs 9192 631 770 Hz hyperfine transition.(As an aside, it is interesting that L Essen is also recognized for the first publication of anoperating Cs atomic clock at NPL in 1955 [51], while similar Cs clock activities were ongoingat other locations including MIT with Zacharis and at NIST with Lyons and Kusch [52–54].)
Most of the leading national measurement laboratories, NRC, NPL, NIST, PTB, BNM-SYRTE, VNIIFTRI and Institute of Thermal Physics-Novosibirsk, started significant researchefforts focused on the goal of measuring the frequency of atomically stabilized lasers. Towardsthat purpose, optical frequency ‘chains’ were developed to multiply the frequency of thecaesium atom at 9.2 GHz up to optical frequencies in the hundreds of terahertz range. Theseelaborate systems typically consisted of electronic frequency multipliers from microwaveto millimetre waves, and eventually to laser radiation in the far-infrared region, then throughseveral IR lasers eventually reaching the 3.39 µm HeNe laser (88 THz) stabilized to a saturatedabsorption signal in methane, CH4. The first frequency measurement of the metrologicallyimportant CH4-stabilized HeNe laser was accomplished by Evenson et al in 1972 [55]. Thathistoric and heroic effort, along with others that followed shortly thereafter, provided theimpetus for fixing the speed of light. To make that change it was also necessary to knowthe wavelength of the CH4-stabilized laser relative to the then standard of length providedby the orange 605.7 nm, 2p10–5d5 emission line from a 86Kr discharge lamp. This wasaccomplished by Barger and Hall in 1973 using precise interferometric comparisons of the3.39 µm HeNe laser [56]. The leading uncertainties were due to the asymmetries in the 86Kremission lineshape. Very high accuracy measurements of this wavelength ratio, and the ratioof the Kr line to the important iodine-stabilized 633 nm HeNe laser, were also made by Rowleyet al at NPL and Baird et al at NRC [57–59]. It appears that some of the early wavelengthcomparisons of the 3.39 µm methane-stabilized laser relative to the 86Kr lamp, completed byR Barger and P Giacomo at the BIPM about 1970, actually used one of the original Michelsoninterferometers from Michelson’s time at the BIPM (figure 3) [60, 61]. Combining the highaccuracy frequency and wavelength measurements of the 3.39 µm CH4 reference and the

Optical frequency/wavelength references S475
Figure 3. Photograph of a Michelson inteferometer at BIPM used by Michelson for dimensionalmetrology with light. It seems that this same instrument was used in about 1970 by Barger andGiacomo to make wavelength comparisons between the 86Kr lamp that served to define the metreand a methane stabilized 3.39 µm HeNe laser. (2003 photo with permission from Tai Hyun Yoon,KRISS, Korea).
633 nm iodine line served as the ‘final’ measurements of the speed of light. They resulted ina fixed and defined speed of light, c = 299 792 458 m s−1 exactly, as recommended officiallyby the CGPM (Conference Generale des Poids and Mesures) in 1975 [50, 62–67].
It took another ten years before actual frequency measurements reached the visible regionof the spectrum by using the elaborate optical frequency chain illustrated in figure 4 [68].Finally, in 1983 optical frequency chains were able to measure the frequency of the verystable and technologically important red HeNe laser (633 nm) stabilized to molecular iodine[69]. That and other optical frequency measurements provided the solid foundation for the1983 redefinition of the metre in terms of the speed of light and the SI second [34, 42, 70].Those earliest frequency chains were not phase coherent because the lasers were not all phaselocked together, nonetheless they were real frequency measurements as opposed to wavelengthmeasurements. Phase-coherent optical synthesis to the visible from microwave sources wasfirst achieved with a harmonic chain by PTB in 1996 [71].
By definition in the SI, ‘the metre is the length of the path travelled by light in vacuumduring a time interval of 1/299 792 458 of a second’; now length, time and the velocity of lightare consistently connected to the highly reproducible and accurate atomic frequency standard.This approach seems most natural in the framework of Einstein’s relativity with the fixedvelocity of light c in all reference frames. Excellent historical technical summaries of thedevelopment of optical frequency standards and the frequency measurements that led to thedefined speed of light and eventual redefinition of the metre can be found in reviews by Petley,Rowley, Jennings and Hall, who were some of the principals involved in these importantmeasurements [20, 25, 34, 63]. With the redefinition of the metre, the international standardsbodies (the CGPM/CIPM) prescribe three basic methods for ‘realizing’ the SI metre. Theseare approximately as follows: (1) by a time interval measurement and the defined velocity oflight L = c�t, (2) from the wavelength of light with a known frequency measured relative to theCs frequency λ = c/ν and (3) by using one of now 13 recommended radiations of frequencystabilized lasers, or lamps (Hg, Kr, Cd), or iodine absorption lines. All are described in

S476 L Hollberg et al
ν7=147.915857Xe (2.03µm)
ν6=88.376 181 627HeNe (3.39µm): CH4 P(7)
SAν7= ν6 +ν’CO2 + ν”CO2+ ν7B
ν5= 29.442 483 315CO2 R[30] (10.2 µm)
ν4= 32.134 266 891CO2 R[10] (9.3 µm)
SAν5= ν4-3ν2- 0.020 + ν5B
ν9=260.103264Ne ( 20Ne)
ν8= 196.780372HeNe (1.52 µm)
SAν9= ν8 +ν’CO2 + ν”CO2+ ν9B
ν3= 10.718 068 6H2O (28µm)
ν2= 0.890 760 550HCN (337 µm)
SAν3= 12ν2 + 0.029 + ν3B
ν1= 0.074 232 545 83Klystron
ν0= 0.010 600 363 69Klystron
SAν1= 7ν0 + ν1B
ν10/2 (HeNe)1.15 µm
x 2 XTAL
ν10127I2
CHARTREUSE
ν10= 2ν9 +ν10B
ν10= 520.206837 THz
SA
SA
SA
SA
ν8= ν7 +νCO + ν8B
ν6= 3ν5 +0.049+ ν6B
ν4= 3ν3 - 0.020 + ν4B
ν2= 12ν1 + ν2B
CounterCs Freq.Standard
SA Spectrum Analyser
Klystron
Diode
xtal xtal
13C16O2 9 µmR(20)
C16O2 9 µmR(22)
ν= 48.862 075CO (6.1 µm)
CO2 9 µm P(8)
CO2 9 µm P(36)
Laser FrequencySynthesis Chain
(all frequencies in THz)
Figure 4. Diagram of the optical frequency chain used by Jennings et al for the first measurementof a visible laser frequency relative to the Cs atomic frequency standard [68, 69]. The system wasbased on a series of harmonic multiplication steps from the ∼9 GHz caesium frequency to theiodine line at 520 THz (described as chartreuse in colour by Jennings, Evenson et al). The chainrelied upon klystrons in the microwave range and then a number of different types of lasers sourcesfrom the far-infrared to the visible, all of which needed to be frequency stabilized. Equations tothe left indicate the mixing relationship for each link in the chain, where the νiB (i = 1, 2, 3 . . .)
represent the various beatnote frequencies that are measured with a spectrum analyser or counter.
detail with numerical values and uncertainties in the latest official report on optical frequencyreferences for length metrology by T Quinn of the BIPM [72, 73]
Today, high quality optical frequency references have uncertainties that are orders ofmagnitude smaller than the uncertainties achieved in actual length metrology. Dimensionaluncertainties are not limited by frequency standards but rather by physical effects in materials

Optical frequency/wavelength references S477
and optical interferometry (optical phase shifts, index of refraction, diffraction, opticalaberrations, material creep, thermal expansion, etc). In fact, even the first few frequencymeasurements of the 633 nm I2–HeNe laser [69] (with fractional frequency uncertainties of≈2 × 10⁻¹⁰) are still adequate (even 20 years later) for present high accuracy dimensionalmeasurements. Once the frequency of the atomically stabilized laser is known, it can bereproduced and used for a traceable realization of the SI metre. It is not necessary to goback to the caesium definition of frequency unless higher accuracy is required. Present iodinestabilized HeNe lasers have frequency uncertainties of about 5 kHz at 473 THz (∼1 × 10⁻¹¹,fractionally) with resetabilities of individual lasers about an order of magnitude better[72, 74–78].
2.2. Optical frequency references and Einstein’s relativity
The original Michelson–Morley experiments were designed to measure the characteristics ofthe ‘luminiferous ether’ that was hypothesized to permeate all of space and serve as the mediumfor transmission of light. The experiments compared the relative phase of optical fields thatmade two-way transits over paths with different orientations in space but with nearly equalpath lengths. Searches for differential phase delays were analysed with respect to the motionof the earth around the sun. Discrepancies between the experimental results and expectationsbased on an ether forced alternative theoretical interpretations. To distinguish between thetheories more precise experiments were required. The goal was to precisely measure therelative velocity of light both along the direction of motion and orthogonal to the motion withan accuracy that could unambiguously resolve effects to second order in velocity, O(v/c)2.The largest conveniently available velocity at that time was the velocity of the Earth in its orbitaround the sun, so (v/c)2 ≈ 10−8. Relative optical path length measurements to a fractionalprecision about 100 times better than this were required to make definitive statements aboutthe actual magnitude of the second-order terms [79–81]. These experiments, now regarded asevidence for the constancy of speed of light and a repudiation of the ether, were viewed bymany at that time as disappointing failures because they did not detect the ether that certainlymust exist. The results now seem central to SR, but some historians claim that Einsteinwas not influenced very much by Michelson’s experiments; and it also seems that Michelsonwas not an enthusiastic supporter of the relativistic interpretations of the experimental results[82, 83]. Nonetheless, 100 years later the puzzle fits together rather nicely.
Laser-based tests of special relativity (SR) were done as early as 1964 by Jaseja, Javan,Murray and Townes using ‘infrared masers’ (1 µm HeNe lasers) [84]. Improved versions ofthese Michelson–Morley and Kennedy–Thorndyke-type experiments by Brillet and Hall (seefigure 5), and Hils and Hall respectively, were done as comparisons between an optical pathlength of a physical spacer and an optical atomic frequency of a quantum-based reference[85, 86]. In those cases, resonant modes of a stable Fabry–Perot cavity were compared toaccurate and stable HeNe lasers stabilized to either the 3.39 µm methane reference or the633 nm iodine transition. The results of comparing physical lengths to atomic frequencystandards can be interpreted in the context of SR by adding small expansion parameters tothe theory, as is done in the well-known test theories of Robertson, and Mansouri and Sexel(RMS) [87–89]. Experimental data are used to constrain the values of the small parametersin the theory and thus set limits on possible deviations from SR. Detailed discussions ofexperimental tests of relativity can be found in the excellent books by Born, Will, Zhang andother compilations [31, 32, 90, 91].
Some recent versions of these experiments use cryogenic optical Fabry–Perot cavities ora microwave resonator to test spatial isotropy and continue to reduced uncertainties [92–95].

S478 L Hollberg et al
Figure 5. Diagram of the experimental apparatus used by Brillet and Hall in 1979 for an isotropy ofspace experiment of the Michelson–Morley type [85]. In this case, the optical length of the physicalFabry–Perot etalon was compared to an optical frequency standard (Ref. Laser) that was a 3.39 µmmethane stabilized HeNe laser. The etalon, transfer HeNe laser and associated components weremounted on a stable granite block that was continuously rotated about a vertical axis. (Figureadapted with permission from [85].)
To date, and within the RMS framework, no experimentally reproducible discrepancy fromSR has been found at the level of ∼2 × 10⁻⁹ for Michelson–Morley, and ∼4 × 10⁻⁷ forKennedy–Thorndyke-type experiments. These experiments essentially test for variations inthe two-way speed of light relative to a preferred frame as a function of orientation and velocity,respectively.
The relativistic time dilation, or second-order Doppler shift v′ = ν(1 − (v/c)2)1/2 causesproblematic frequency shifts (∼5 × 10⁻¹³ fractionally) in atomic clocks that use roomtemperature atoms with corresponding thermal velocities of ∼300 m s−1. This problembecomes negligible when using laser-cooled atoms with low velocities (∼10 cm s−1).Conversely, the time-dilation effect can be enhanced and measured by using precision laserspectroscopy of fast moving atomic beams as done by Snyder, Riis, McGowan and Saathoffand their respective colleagues [96–99]. Measuring the optical frequency difference betweenfast and slow atoms determines the relativistic time dilation. The experiment with the highestprecision used an apparatus similar to that shown in figure 6. Again, special relativity holdswithin experimental uncertainties, presently at the level of ∼2 × 10⁻⁷ for the magnitude ofthe time dilation factor.
The gravitational red shift is a central component of Einstein’s relativity and is a majorfrequency shift for high accuracy atomic frequency standards. In the gravitational potentialof the Earth U, the fractional frequency shift is �f /f = −�U/c2 ∼ (1.09 × 10⁻¹⁶ m−1)�z,where �z is a relative change in height above the Earth. In the global positioning system(GPS) the gravitational red-shift and second-order Doppler shift are significant and must betaken into account for precise timing [100]. At our NIST laboratory in Boulder, the elevationis ∼1650 m corresponding to a gravitational red shift of ∼1.8 × 10⁻¹³ (fractionally) relative tosimilar clocks at sea level (where the SI second is defined). This requires knowing the red shiftat the NIST building with a fractional uncertainty of ∼0.1% for international comparisons to

Optical frequency/wavelength references S479
Figure 6. Simplified diagram of the apparatus used by Saathoff et al [99] to measure the timedilation effect (second-order Doppler shift, transverse Doppler shift) by using a saturated absorptiontransition in a beam of fast Li+ ions (548 nm when at rest). Lasers with very different wavelengths(Ar+ laser at 514 nm and a dye laser at 585 nm) were used to compensate the very large Dopplershifts that occur parallel and anti-parallel to the ion beam direction. (Figure adapted with permissionfrom [99].)
achieve the level of accuracy of modern primary Cs fountain standards ∼5 × 10⁻¹⁶ [101, 102].Even a few metres of elevation makes a significant, measurable difference in the frequency.Optical frequency standards have not yet played an important role in experimental tests of thegravitational red shift, but their exceptional stability should prove useful for future gravitationalred-shift measurements.
Another question is whether the fundamental ‘constants’ (such as the fine structureconstant e2/hc, me/mp, g factors, etc) and hence atomic clocks are really constant in time.This has been a topic of discussion since Dirac suggested that the constants might vary basedon arguments relating to the expansion of the universe and simple relationships betweenconstants. Clocks are made from the most stable and measurable physical quantities thatwe find in nature, and for now, these are based on differences in atomic energy levels. It isthus natural to use stable atomic frequency references to test physical principles and theoriesand to search for new physics or forces that might depend on time, space, velocity, etc.The theories of such clock tests have been discussed in detail, and a few high precisionexperiments have been done [31, 103–110]. A popular experimental approach is to measureratios of atomic frequencies and search for any reproducible systematic changes that occurover time. Reproducible measurements can be made as long as any time variation of the‘constants’ occurs on a time scale that is longer than the time interval between frequencymeasurements, which is limited by the averaging time required to reach the accuracy of thestandards. Measurements between optical standards can presently be made at a level of∼2 × 10⁻¹⁵ in 10 s (more on this in section 5.1). By comparing atoms with different atomicnumber Z it is possible to make some qualified statements about possible time variations ofratios of fundamental constants, including the fine structure constant α, the electron to protonmass ratio me/mp, and gyromagnetic ratios. These atomic physics experiments can also beviewed as tests of SR since atoms with large Z have significant relativistic corrections to theatomic wavefunctions. Thus a change in α or relativity could show up as differential changes inthe energy levels between light and heavy atoms [111]. Astronomical observations of optical

S480 L Hollberg et al
-150
-100
-50
0
50
100
150F
requ
ency
Offs
et (
Hz)
1/1/1996 1/1/1998 1/1/2000 1/1/2002 1/1/2004
Measurement Date
Figure 7. Historical record of published absolute frequency measurements of the Ca and Hg+
optical standards (456 THz and 1064 THz respectively) relative to the Cs primary frequencystandard. The vertical axis is in units of hertz away from the respective mean values. The Hg+ data(open circles, green) were taken at NIST, while the Ca data come from both PTB (triangles, red)and NIST (squares, red) [118, 119].
atomic transitions have shown hints that the atomic frequencies might have been different inthe early universe [112, 113]. However, the astronomical data are, at present, inconclusive[114–116]. At the current epoch, the few high-accuracy laboratory experiments that havebeen completed show no reproducible, convincing evidence of time-dependent changes toatomic clock frequencies [15, 108, 109, 117]. Some data showing the Ca and Hg+ opticalfrequencies measured relative to Cs standard over some years are shown in figure 7. There arevarious ways to interpret these data in terms of possible variations of fundamental constants,but it is clear from the data that within measurement uncertainties there is no indication of anysystematic temporal variation of these atomic frequencies relative to each other.
The higher precision and accuracy becoming available with optical atomic frequencystandards (see figure 2) will allow tests of Einstein’s relativity and other foundations ofphysics with much higher accuracy. In essence, the optical atomic frequency standards andoptical frequency combs offer more precise rulers for time, frequency and length than havebeen available, and will allow deeper probing into the structure of space/time. Our enthusiasmfor the future of stable optical frequency references is not new.
Optical and infrared masers make possible and attractive new experiments andrefinements of old ones, where great precision in measurement of length is needed.(C H Townes (1964) regarding laser tests of relativity [84].)
With the improved experimental tools of today, we can certainly travel further down this paththat was started long ago.

Optical frequency/wavelength references S481
3. Present status of optical frequency standards
Experimental atomic physics is the foundation that supports optical frequency standards, andthe current technology is based on precision, nonlinear laser spectroscopy of simple atomsthat have been laser cooled and trapped. The two basic types of optical atomic frequencystandards are systems based on single trapped ions and those that use clouds of cold neutrals.They share many of the same technologies but have some characteristic differences.
As we start this discussion it is useful to recall generally what we mean by specificcharacteristics, such as frequency stability (does the frequency change over a specified timeinterval τ ), frequency reproducibility (self-reproducibility is a measure of whether a singlereference gives the same frequency each time it is used, moved, turned off or on etc, and cross-reproducibility measures how well similar frequency standards give the same frequency), andaccuracy (which has two meanings: how well does the standard produce an exact frequencyin terms of the SI ‘second’, or sometimes it is used more loosely to mean how well does thestandard represents the natural frequency of that specific atomic transition). Some experimentsrequire only frequencies that are stable, for example, when looking for effects that canbe modulated, as in the rotating interferometers in Michelson–Morley experiments. Otherexperiments, such as searches for time variation of fundamental constants, require accuratemeasurements that can be repeated. Good stability is a necessary condition but it is insufficientto guarantee high accuracy.
3.1. Single ion optical frequency standards
The essential ingredient of an optical frequency standard is the atomic transition to which thefrequency of the optical oscillator is steered. Ideally, these references are anchors in frequencyspace that are totally immune to any perturbations. But the motion of atoms produces shiftsthat can never be fully eliminated because the atoms never come fully to rest; and, likewise,external perturbations, which can cause shifts to the internal level structure are never fullyeradicated. The pursuit of the ‘best’ optical frequency and time standard has coalesced inmost laboratories to an effort to identify the ‘best’ anchor—where ‘best’ refers to the optimumcompromise between stability and accuracy on one hand and practical issues, such as reliableand simple lasers, on the other. Clearly, the best stability and highest accuracy will be providedby slowly moving laser-cooled atoms and trapped ions. In such systems, fractional frequencyinstabilities at or below 10−14 at 1 s and reproducibilities better than one part in 1015 havealready been demonstrated [14–16, 108, 119, 120]. It may be possible to benignly hold laser-cooled atoms in optical wells generated by the intersection of light beams far detuned fromany internal transition [10]. If the atoms are sufficiently cold, their motion will be confinedto an individual well and hence to vibrational excursions less than an optical wavelength (theso-called Lamb–Dicke limit). In this limit, a domain achieved routinely with laser-cooled andtrapped ions and, more recently, with laser-cooled and lattice-trapped neutral atoms, first-orderDoppler shifts are eliminated and second-order shifts are reduced to below 10−18. A millionatoms confined to the Lamb–Dicke limit offer enticing predictions for stability and accuracyof an optical clock, but much work remains.
Narrow, weakly allowed optical transitions of single, laser-cooled, trapped ions are nearlyideal references for optical frequency and time standards. High resolution is possible becauseperturbations can be made small and interrogation times long. A key advantage of single ionsis that they can be laser cooled to the lowest vibrational state of motion and benignly confinedto the Lamb–Dicke limit. Therefore, because the laser-cooled ion is restricted to a smallvolume in space, most systematic shifts are either small, such as Doppler shifts to all orders,

S482 L Hollberg et al
2P1199Hg+ Cryogenic
rf trap
Quantum Jump Spectroscopy
Cooling
0.8 mm
~6.5 Hz
60
40
20
00 200
Time (ms) ∆ f 282 nm
Cou
nt R
ate
(kH
z)
400 600 -7 0 7
Clock282 nm
194 nm
Repump
2
F = 1
F = 140.5 GHz
F = 0
F = 2
6.9 GHzF = 0
2S12
2D52
Figure 8. Some of the key components of the Hg+ single-ion optical clock. Upper left is asimplified optical energy level diagram of 199Hg+ and to its right is a diagram of the miniature,cryogenic ion-trap showing the two endcap electrodes and the centre, ring electrode. Lower leftshows quantum jumps used for state detection of the clock transition [122]. If the ion remains inthe ground state following a clock excitation pulse at 282 nm, the ion will readily fluoresce onthe strongly allowed transition at 194 nm. Conversely, if the clock transition is made, then nofluorescence at 194 nm is seen. Lower right is a Fourier-limited spectrum of the clock transition(probe time, 120 ms) [9].
or can be well controlled. Most single-ion optical clocks are expected to ultimately reachsystematic fractional frequency uncertainties approaching 10−18. Furthermore, the fractionalfrequency uncertainty reported for several single-ion standards, all based on weakly allowed,electric-quadrupole transitions, are less than 1 × 10⁻¹⁴ [15, 17, 108, 121]. In figure 8, weshow some of the essential features and components of the optical time and frequency standardbased on a single Hg+ ion.
One of the largest systematic uncertainties that had previously limited the accuracy of theHg+ standard as well as each of the other ion-based optical standards so far demonstrated isthe electric-quadrupole shift that arises from the interaction of the excited state quadrupolemoment with any static electric-field gradient. Recently, the quadrupole moments pertinentto the optical clock transitions in Sr+ [17], Yb+ [16] and Hg+ [123] have been measured andcompared to the predicted values obtained from a multiconfiguration Dirac–Hartree–Fockcalculation. Any quadrupole shift of the clock frequency in 199Hg+ is now conservativelyestimated to be fractionally less than 1 × 10⁻¹⁵ [123]. More importantly, we expect that thequadrupole shift will no longer limit the accuracy of the mercury ion optical clock when it isoperated with alternating orthogonal components of a small applied magnetic field of constantamplitude [124], which is stepped each measurement cycle. (We note that an alternate schemeexists and has been used to cancel the quadrupole shift of the clock frequency in Sr+ [17].)
In a complementary effort at NIST, we are working towards the development of a two-ion,‘quantum logic’ optical clock [125]. In this system, two ions of different species are held in
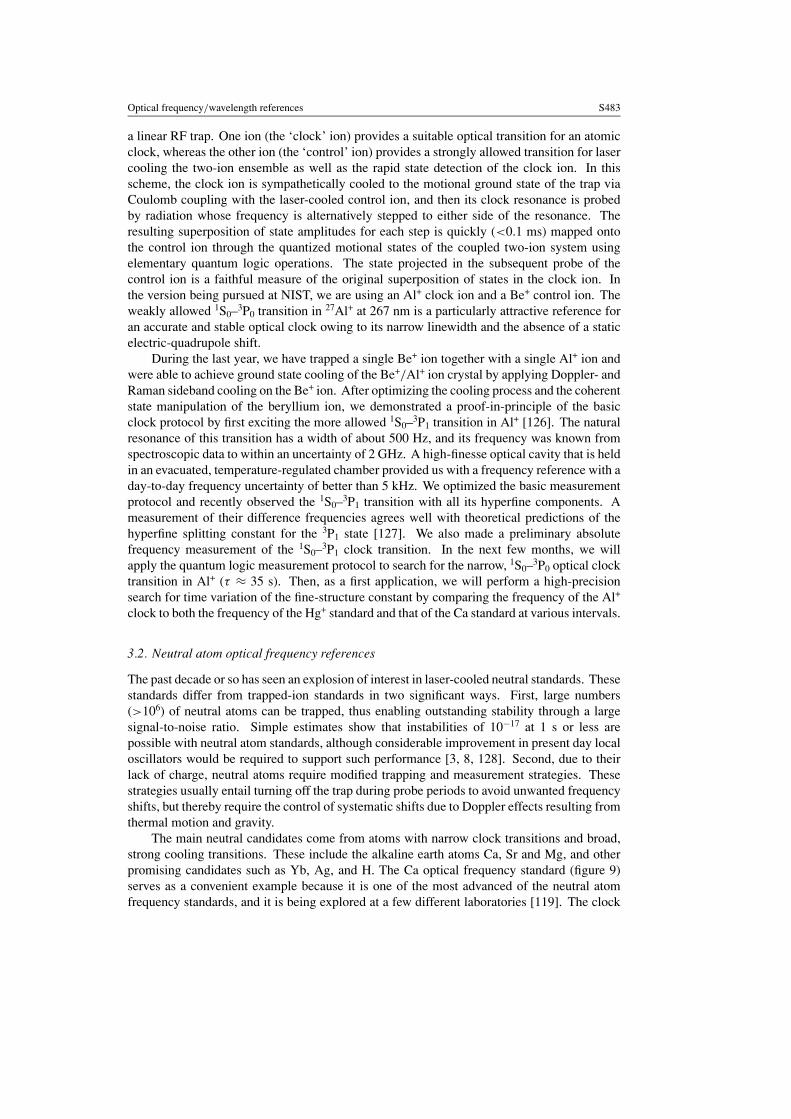
Optical frequency/wavelength references S483
a linear RF trap. One ion (the ‘clock’ ion) provides a suitable optical transition for an atomicclock, whereas the other ion (the ‘control’ ion) provides a strongly allowed transition for lasercooling the two-ion ensemble as well as the rapid state detection of the clock ion. In thisscheme, the clock ion is sympathetically cooled to the motional ground state of the trap viaCoulomb coupling with the laser-cooled control ion, and then its clock resonance is probedby radiation whose frequency is alternatively stepped to either side of the resonance. Theresulting superposition of state amplitudes for each step is quickly (<0.1 ms) mapped ontothe control ion through the quantized motional states of the coupled two-ion system usingelementary quantum logic operations. The state projected in the subsequent probe of thecontrol ion is a faithful measure of the original superposition of states in the clock ion. Inthe version being pursued at NIST, we are using an Al+ clock ion and a Be+ control ion. Theweakly allowed 1S0–3P0 transition in 27Al+ at 267 nm is a particularly attractive reference foran accurate and stable optical clock owing to its narrow linewidth and the absence of a staticelectric-quadrupole shift.
During the last year, we have trapped a single Be+ ion together with a single Al+ ion andwere able to achieve ground state cooling of the Be+/Al+ ion crystal by applying Doppler- andRaman sideband cooling on the Be+ ion. After optimizing the cooling process and the coherentstate manipulation of the beryllium ion, we demonstrated a proof-in-principle of the basicclock protocol by first exciting the more allowed 1S0–3P1 transition in Al+ [126]. The naturalresonance of this transition has a width of about 500 Hz, and its frequency was known fromspectroscopic data to within an uncertainty of 2 GHz. A high-finesse optical cavity that is heldin an evacuated, temperature-regulated chamber provided us with a frequency reference with aday-to-day frequency uncertainty of better than 5 kHz. We optimized the basic measurementprotocol and recently observed the 1S0–3P1 transition with all its hyperfine components. Ameasurement of their difference frequencies agrees well with theoretical predictions of thehyperfine splitting constant for the 3P1 state [127]. We also made a preliminary absolutefrequency measurement of the 1S0–3P1 clock transition. In the next few months, we willapply the quantum logic measurement protocol to search for the narrow, 1S0–3P0 optical clocktransition in Al+ (τ ≈ 35 s). Then, as a first application, we will perform a high-precisionsearch for time variation of the fine-structure constant by comparing the frequency of the Al+
clock to both the frequency of the Hg+ standard and that of the Ca standard at various intervals.
3.2. Neutral atom optical frequency references
The past decade or so has seen an explosion of interest in laser-cooled neutral standards. Thesestandards differ from trapped-ion standards in two significant ways. First, large numbers(>106) of neutral atoms can be trapped, thus enabling outstanding stability through a largesignal-to-noise ratio. Simple estimates show that instabilities of 10−17 at 1 s or less arepossible with neutral atom standards, although considerable improvement in present day localoscillators would be required to support such performance [3, 8, 128]. Second, due to theirlack of charge, neutral atoms require modified trapping and measurement strategies. Thesestrategies usually entail turning off the trap during probe periods to avoid unwanted frequencyshifts, but thereby require the control of systematic shifts due to Doppler effects resulting fromthermal motion and gravity.
The main neutral candidates come from atoms with narrow clock transitions and broad,strong cooling transitions. These include the alkaline earth atoms Ca, Sr and Mg, and otherpromising candidates such as Yb, Ag, and H. The Ca optical frequency standard (figure 9)serves as a convenient example because it is one of the most advanced of the neutral atomfrequency standards, and it is being explored at a few different laboratories [119]. The clock

S484 L Hollberg et al
423 nm
657 nm
552 nm
1S0
1S0
1P1
3P1
Figure 9. Relevant energy levels of 40Ca for laser cooling and the optical clock. First stage lasercooling uses the 423 nm transition, while the second stage uses the 657 nm clock transition inconjunction with the 552 nm quenching transition. The clock signal is derived from the transitionat 657 nm, which has a natural linewidth of 400 Hz.
Cavity
Servo Detector
Probe laser657 nm
Femtosecond LaserFrequency Comb
Steer to atomicresonance
Ca ExcitationSpectrum
MOT
AOM
PMT
FibreFibre
Fibre
ServoSystem
Figure 10. Schematic of the calcium atomic clock apparatus. Using two stages of laser cooling,about 106 atoms are trapped and cooled to a temperature of 10 µK. With the trapping laser lightblocked, the freely expanding atoms are probed by a laser that is pre-stabilized on a narrowresonance of an optical cavity. A servo system keeps the probe laser frequency fixed on the atomicresonance via a signal derived from the excitation spectrum. Light is sent through a fibre to amode-locked femtosecond-laser frequency comb where the optical oscillations can be countedand/or compared to other frequency standards.
transition at 657 nm has a natural linewidth of 400 Hz and can be easily accessed withinexpensive diode lasers. The laser cooling transition at 423 nm (35 MHz linewidth) is usedto collect millions of atoms in a magneto-optic trap (MOT) with a residual temperature of2 mK. Advanced versions of the standard now use a second stage of laser cooling based onthe clock transition to further reduce the atomic temperature and thereby the Doppler shifts[129, 130]. Because the laser cooling light induces large Stark shifts on the clock transition,this light is turned off and the atoms are released for ballistic expansion during probing ofthe clock transition. This approach necessarily leads to a measurement cycle that containsalternate periods of trapping and probing.
For the calcium atomic clock at NIST, a typical cycle commences with a 15 ms trappingperiod during which several million atoms from a beam are loaded into a 423 nm MOT (theclock apparatus is depicted in figure 10). This is followed by 7 ms of second-stage coolingthat transfers 25% of the atoms into a shallower MOT producing a residual temperature of10 µK. With the laser cooling beams extinguished, the clock transition is then excited witha Borde–Ramsey sequence [131] consisting of two pairs of 3 µs counter-propagating pulsesseparated in time by ∼330 µs. The probe beams are filtered with optical fibres to ensurespatial modes of high quality. In order to achieve high resolution on the clock transition,it is necessary to pre-stabilize the frequency of the probe laser on a narrow resonance of a

Optical frequency/wavelength references S485
high finesse cavity that is environmentally isolated. This enables the probe laser to achieve alaser linewidth of a few hertz for times of several seconds. Depending on its detuning fromthe atomic resonance, the excitation pulse sequence from the stabilized laser excites somefraction of the atoms from the 1S0 ground state to the 3P1 state. This transfer is measuredwith a shelving detection scheme [122, 132]. Shelving detection uses resonance fluorescenceinduced on a strong transition (here the 423 nm cooling transition) to measure the absenceof population in the ground state rather than detecting a weak decay fluorescence signal at657 nm from the population in the excited state. With neutral atoms, we can normalize thesignal to the number of atoms in the trap by applying two such detection pulses [119, 133].To generate the excitation spectrum, we slowly sweep the frequency of the stabilized laserrelative to its reference cavity fringe with an acousto-optic modulator, while the measurementcycle is continuously repeated. Figure 10 shows a Fourier-transform-limited spectrum takenat relatively low resolution (fringe period = 23.1 kHz), as determined by excitation pulseduration and temporal separation.
For clock operation, the resolution is increased to ∼770 Hz and a modulation servotechnique is used to keep the probe laser frequency locked to the central fringe of the spectrum.A fraction of the probe light is sent through an optical fibre to a mode-locked femtosecond-lasercomb measurement system, which is used to compare the performance of the standard withother atomic standards. Such comparisons have demonstrated fractional frequency instabilityas low as 5 × 10⁻¹⁵ at 1 s for the NIST Ca standard. This is an exceptionally good stability,but is limited by the small ratio of actual probe time (∼1 ms) to atom preparation/detectiontime (∼25 ms), which leads to an effective increase in the frequency noise spectrum of theprobe laser (through the Dick effect) [128, 134–136]. Future standards (neutral and ion-based)will require that this ratio is increased considerably in order to achieve optimum performancelevels.
We are now at the stage where such standards work very well and have excellentstability, but we face the arduous task of verifying that all systematic errors are as smallas projected. Many of these errors result from fundamental physics effects (such as residualDoppler shifts, blackbody radiation-induced frequency shifts, gravitational shifts), while othersinvolve nonfundamental technical issues (such as optical table vibrations, frequency chirpsin the acousto-optic modulators and defects in the spatial modes of the probe laser beams).Presently, a few papers have begun to address the fundamental issues in detail at the 10−16 level,while, overall, fractional frequency uncertainties are now moving just below the 10−14 level,limited mainly by technical rather than fundamental issues. Encouragingly, two different labshave measured the absolute frequency of the Ca transition at the ∼10−14 level with excellentagreement [119].
As mentioned previously, there are transitions in other neutral atoms that have attractedconsiderable interest for use as optical frequency standards [10, 109, 137–145], however,at this stage it is not clear which can give the best performance or most the useful atomicclock.
Atomic hydrogen is particularly interesting because its theoretical simplicity allows directconnection between experimental results and fundamental physics [109, 140, 146, 147].Hydrogen also has an attractive 1S–2S clock transition with a narrow linewidth and, withsome effort, can be cooled to fairly low velocities. It is nearly unique in that the energylevel differences in hydrogen can be calculated to approximately the same level of accuracyas they can be measured. Comparisons between theory and experiment for hydrogen havegiven a wealth of information on atomic structure, Rydberg constant, the Lamb shift, size ofthe proton, etc. The technological challenges with hydrogen are a significant impediment toits development as an optical clock, but the fundamental physics that can be extracted makes

S486 L Hollberg et al
the pursuit very worthwhile. Also, for theoretical reasons there is growing interest in preciseoptical frequency measurements in helium for connection to fundamental physics [148].
Perhaps the most promising approach for future neutral atom standards is to use odd-numbered isotopes of two-electron atoms, for which it is possible to excite highly forbiddentransitions (natural linewidths of 1 to 10 mHz) in atoms confined in an optical lattice [10].The wavelength of the lattice laser is chosen to yield equal Stark shifts for both the groundand excited states, leaving the clock frequency unchanged. With the atoms confined to theLamb–Dicke regime (i.e. a fraction of a wavelength), residual Doppler effects will be negligibleand long interaction times will be possible. If higher-order Stark shifts can be adequatelysuppressed, such a system could attain the accuracy level promised by single trapped-ionsystems but with the improved stability that comes with large numbers of atoms. Presently,at least seven groups are pursuing lattice-based standards in Ca, Sr and Yb, with severalexperiments poised to reach maturity in the near future [10, 138, 142, 144, 145, 149]. If it ispossible to cool and confine large numbers of neutral atoms in optical lattices to the Lamb–Dicke limit while at the same time maintaining negligible perturbations to the clock transitionsthen these systems could indeed be the ultimate optical frequency standards. Such a systemcould have all the advantages of trapped ions—tight confinement, no Doppler, no collisions,long interaction times—as well as the advantages of neutrals—large numbers, large signal-to-noise ratios and convenient laser wavelengths. This might be the best of both worlds; however,there are many scientific and technical issues that must be addressed, including, higher orderpolarization sensitivities, potential Stark shifts from two-photon transitions, non-trivial opticalpumping, efficient internal and external state preparation and achievable cycle times [10, 137,142, 149, 150].
Further in the future, we might even imagine loading an optical lattice with coherentatoms organized to achieve one atom in the ground state of each lattice site, forming a Mottinsulator transition (see the chapter by E Bloch in these proceedings). Coherently preparedatoms in such a lattice could also be exploited by applying entanglement ideas proposed for ionclocks [125] but implemented with neutral atoms, as is being studied for quantum informationprocessing. Under these conditions, the instability could scale as 1/N rather than 1/N1/2.
4. Other applications of optical atomic frequency references
Perhaps the most promising commercial applications of OFR will be in communication andnavigation systems, or for special uses such as coherent optical radar. Beyond their present usein scientific applications (such as references for precision spectroscopy) and length metrology,OFRs are just beginning to see some new applications.
One modern application with widespread use of optical frequency references is inoptical communication systems utilizing wavelength division multiplexing (WDM). Relativelyrecently, the telecom industry moved to WDM optical communication systems to achieve highdata rates over optical fibres. In fact, for the ‘wavelength’ multiplexing, the industry wiselychose a frequency-based optical grid. The International Telecommunication Union (ITU)frequency grid for dense wavelength division multiplexing is fixed on an optical frequency of193.1 THz (∼1552 nm) and supports a variety of channel spacings ranging from 100 GHzdown to 12.5 GHz [151]. The accuracy and stability required for the ITU-grid are not atthe same levels of performance previously discussed (even 1 GHz at 193 THz is fractionally5 × 10−6); but nonetheless, these systems do demand atomic and molecular references forcalibration purposes [152, 153]. Some research programmes continue to explore coherentoptical communication systems that might benefit from optical frequency references withhigher precision, or perhaps optical frequency combs.

Optical frequency/wavelength references S487
Many of the real-world applications of atomic frequency references do not requirehigh absolute frequency accuracy, but rather require robust stable frequency sources forsynchronization of events or the precise measurement of time intervals. In these cases havinghigh stability might be more important than absolute accuracy. The excellent stability ofoptical standards bring new capabilities for ultra-precise timing, subfemtosecond timing jitterand low-phase-noise microwave signals as described below.
5. Optical frequency metrology
The harmonic optical frequency chains developed in the 1970s and 1980s proved that it waspossible to count optical frequencies, and these systems played important roles in laboratoriesresponsible for primary standards. However, the chains were too large, complicated andunreliable to see widespread use. That all changed in 1999 when Udem et al demonstrated[154, 155] that Hansch’s idea [156] of using ultrafast mode-locked lasers for optical frequencymetrology was indeed valid to a high degree of accuracy—just as expected from the Fouriertransform. They showed that the frequencies of the discreet modes produced by a mode-locked Ti:sapphire laser and spanning ∼20 THz were indeed spaced precisely by the pulserepetition rate frep [154]. That paradigm-changing demonstration revolutionized the field. Thefrequency of any mode of the optical frequency comb produced by a mode-locked laser couldbe described by the simple comb equation fN = Nfrep + f0, where f0 is an offset frequencycommon to all modes.
Another critical achievement of the optical comb technology was the broadening of theoptical spectrum to cover a spectral bandwidth of an octave. This was first accomplishedusing microstructure optical fibres whose broadening capabilities were discovered aboutin 1999. With an optical octave spanned, the femtosecond laser optical frequency combs(FLFC) could be stabilized using the ‘self-referencing’ method [13, 157], as first demonstratedexperimentally by Jones et al [158]. The technology of optical frequency combs and theirapplications have developed rapidly over the past five years. Some recent reviews give goodsummaries of the field [11, 159–162]. In contrast to the harmonic optical frequency chains,the FLFC are fairly easy to operate, robust and reliable. The ultrashort pulses from stabilizedself-referenced FLFC provide exquisite timing markers (sub-fs timing jitter is possible) and thespectrally broad optical frequency comb provides an almost ideal ruler for optical frequencysynthesis and measurement. When self-referenced and locked directly to an optical frequencyreference the comb transfers the accuracy and good stability to other spectral regions (fromthe RF to UV) and phase coherently divides the optical frequency to the microwave rangewhere it can be interfaced with electronic signals (see figure 11) [163]. When used as anoptical frequency divider these system now provide microwave signals with unprecedentedlow phase noise. Atomically stabilized FLFCs, when used as optical frequency dividers, nowprovide some unique capabilities, such as relative timing precision of femtoseconds, withunprecedented stability producing microwave signals with phase-noise 20 to 40 dB lower thanthe best existing microwave sources [164–166].
Several recent experiments have tested the fidelity of the FLFCs, including: uniformityof the comb spacing, second harmonic ratios, reproducibility as a frequency translator anddivider, etc [154, 167–169]. Even with the high nonlinearities, the strong optical frequencychirp, and distortion of the optical pulses in the lasers and nonlinear fibres, the time-averagedfrequencies of the optical comb lines obey the simple optical comb equation. The experimentsconclude that, at least for averaging times longer than about 100 ms, the modes of the FLFCare well described by the simple comb equation, and when averaged for several hours can givea precision of 19 to 20 digits [170–172]. Thus, the FLFC are accurate frequency synthesizers

S488 L Hollberg et al
Femtosecondlaser frequencycomb (FLFC)
Self-ReferencingServo
Cavity
Servo
Servo
AtomicSample
Error Signal
ReferenceLaser
Microwavefrequency output
Photodiode
× 2f0
fm = m frep
I( f )
f
I( f )
Figure 11. Diagram of a FLFC locked to a stable optical frequency reference based on anoptical atomic reference and a stable Fabry–Perot cavity. The mode-locked laser is self-referenced(by the 1f–2f method) and provides two outputs, a precisely controlled optical frequency combfi = (N ′ ± i)frep + f0 (where i is an integer and N′ is the mode number closest to the frequencyof the optical reference), and an electrical pulse train at frep that produces a microwave combfm = mfrep.
that span from RF to UV, providing frequency uncertainties as small as the primary frequencystandards can support.
Most high performance FLFC are based on mode-locked Ti:sapphire lasers, but otherstable optical frequency combs that can span an octave or more and be self-referenced have nowbeen demonstrated with Cr:LiSAF [173] (100 MHz, 100 mW, centred at 850 nm) Cr:Forsterite[174, 175] (400 MHz, 400 mW centred at 1.3 µm) and fibre lasers [176–179] (50 MHz,100 mW, centred at 1.5 µm). It is intriguing that even though the average frequencies seem tobe ‘perfect’, some recent experiments indicate that the noise properties of some types of opticalfrequency combs (particularly those in the near IR 1 to 2 µm range) can be more complicatedand interesting than might be expected from the simple comb equation [175, 177].
5.1. Optical stability advantage
The accuracy of the primary atomic frequency standards has improved considerably, whichmeans that the evaluation of systematic uncertainties now requires long averaging times asdictated by short-term instabilities. For state-of-the-art microwave atomic standards usingquartz-based local oscillators (LOs), the short-term instability is limited to about 1 × 10⁻¹³,and, if the atomic instability improves with time as 1 × 10⁻¹³ τ−1/2 (τ in seconds) it requires∼3 h or more of signal averaging to make one measurement at the 1 × 10⁻¹⁵ level. Evenmeasuring between hydrogen masers and a Cs fountain standard within the same building cantake a day or two of averaging to make an accurate frequency measurement at the 1 × 10⁻¹⁵
level. Verifying systematic errors using these references then requires a sequence of longaverages to evaluate all possible uncertainties [180–182]. The situation is much worse whentrying to get the number out of the laboratory and to another location across the world, sinceaveraging GPS signals might require 20 days to reach 1 × 10⁻¹⁵. As accuracy improves, theprocess becomes increasingly difficult and quadratically more time consuming, thus short-term stability must be improved. Some alternatives exist for the microwave standards, forexample, a UWA-SYRTE collaboration takes advantage of the better short-term stability of
Optical frequency/wavelength references S489
10-16
2
3
4
5
678
10-15
2
3
4
5
678
10-14
Fra
ctio
nal
Fre
qu
ency
Inst
abili
ty
102 3 4 5 6 7 8
1002 3 4 5 6 7 8
10002 3 4 5
Averaging Time (s)
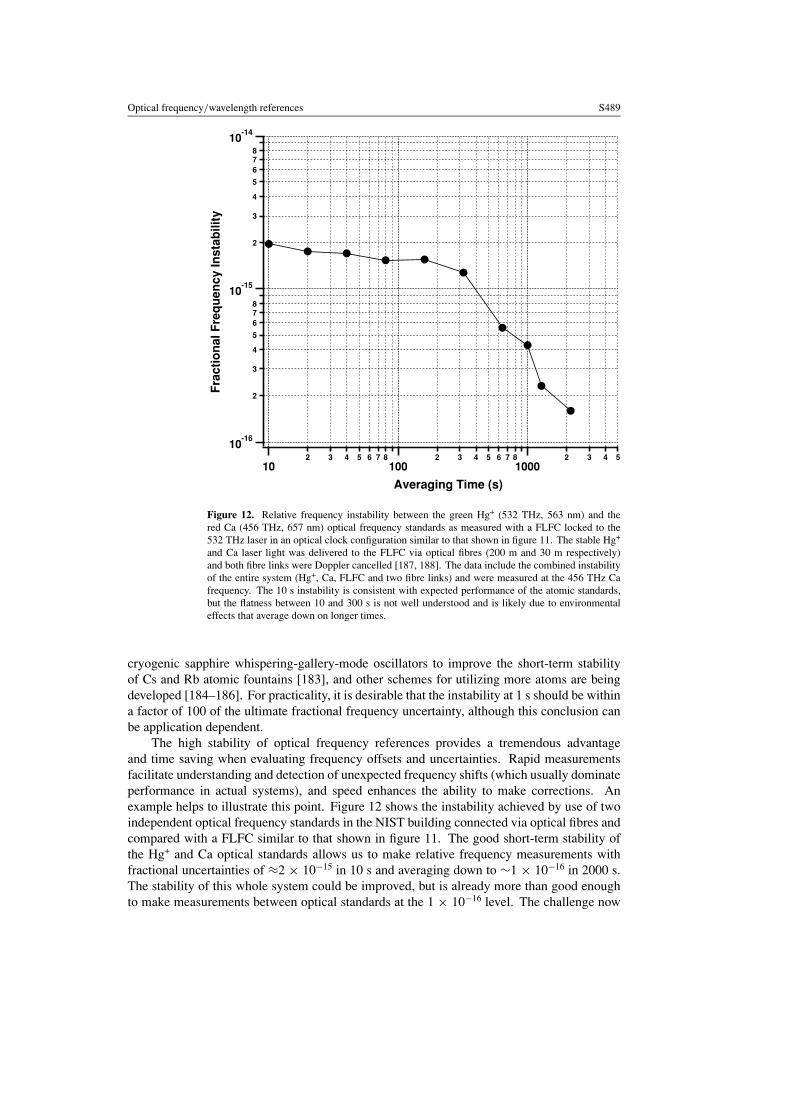
Figure 12. Relative frequency instability between the green Hg+ (532 THz, 563 nm) and thered Ca (456 THz, 657 nm) optical frequency standards as measured with a FLFC locked to the532 THz laser in an optical clock configuration similar to that shown in figure 11. The stable Hg+
and Ca laser light was delivered to the FLFC via optical fibres (200 m and 30 m respectively)and both fibre links were Doppler cancelled [187, 188]. The data include the combined instabilityof the entire system (Hg+, Ca, FLFC and two fibre links) and were measured at the 456 THz Cafrequency. The 10 s instability is consistent with expected performance of the atomic standards,but the flatness between 10 and 300 s is not well understood and is likely due to environmentaleffects that average down on longer times.
cryogenic sapphire whispering-gallery-mode oscillators to improve the short-term stabilityof Cs and Rb atomic fountains [183], and other schemes for utilizing more atoms are beingdeveloped [184–186]. For practicality, it is desirable that the instability at 1 s should be withina factor of 100 of the ultimate fractional frequency uncertainty, although this conclusion canbe application dependent.
The high stability of optical frequency references provides a tremendous advantageand time saving when evaluating frequency offsets and uncertainties. Rapid measurementsfacilitate understanding and detection of unexpected frequency shifts (which usually dominateperformance in actual systems), and speed enhances the ability to make corrections. Anexample helps to illustrate this point. Figure 12 shows the instability achieved by use of twoindependent optical frequency standards in the NIST building connected via optical fibres andcompared with a FLFC similar to that shown in figure 11. The good short-term stability ofthe Hg+ and Ca optical standards allows us to make relative frequency measurements withfractional uncertainties of ≈2 × 10⁻¹⁵ in 10 s and averaging down to ∼1 × 10⁻¹⁶ in 2000 s.The stability of this whole system could be improved, but is already more than good enoughto make measurements between optical standards at the 1 × 10⁻¹⁶ level. The challenge now

S490 L Hollberg et al
is for the optical frequency standards to set absolute frequency uncertainties at comparablelevels.
6. Summary
In the past 100 years, optical frequency references based on narrow quantum transitions haveplayed critical roles in the discovery of new physics and in testing fundamental theories, andhave provided new tools and technologies for precision measurements that now serve as afoundation for our base units. As stability and accuracy improve, the effects of Einstein’srelativity become increasingly important—a fractional frequency uncertainty of 10−18 wouldrequire knowledge of the geoid potential surface to <1 cm. Alternatively, perhaps OFR willbe used for measuring gravitational potentials and making more stringent experimental testsof Einstein’s ideas.
With recent advances, OFRs are demonstrating performance that makes them thecompelling choices for the atomic clocks of the not-too-distant future. Some optical frequencyreferences are demonstrating unprecedented frequency stability, and a few are beginning toshow frequency reproducibility that is comparable to that of the best caesium atomic fountainstandards. Several groups (including PTB, NRC, NPL, BNM-SYRTE, Max-Planck Garching,University of Tokyo, JILA, NIST . . . ) are working hard to develop systems with high accuracyand stability, and numerous interesting atomic systems are being considered. However, at thispoint, the optimal choices are not yet clear. It is conceivable that one atomic system will beoptimal for the best short-term stability and another for ultimate accuracy (much as is the casetoday, where hydrogen masers typically provide good short-term stability and caesium clocksgive ultimate accuracy).
When technologies have major advances, there is naturally an initial period of enthusiasmthat the new discoveries will solve all our past problems. Perhaps we are just coming out ofthat phase now with optical atomic clocks; the systems are working and delivering spectaculardata, but much hard work remains to reach the 10−18 accuracy levels that have been promisedfor more than 20 years now.
In any case, the high stability of optical frequency standards afford unsurpassed newcapabilities, including femtosecond timing resolution when stabilized to atomic transitions,Doppler-cancelled optical fibre transmission, ultra-low-phase-noise microwaves and spectraland temporal coherence across the visible with coherence times of several seconds. Wecan even imagine future advanced systems using arrays of coherent atomic samples, as inspin-squeezing or Mott-insulator BEC experiments, that might allow Heisenberg-limitedperformance. In that case 106 coherent atoms, with a 500 THz transition, and a 1 Hzlinewidth, could give an instability of σy ≈ �ν
ν0√
Nτ≈ 10−21 τ−1/2. It is probably unreasonable
to extrapolate so far beyond the present performance and experience, but why not strive forlimits that the physics says should be possible? One reason is that the present experimentaltechnologies are certainly not up to the task. Laser oscillators are not nearly good enough,and technological constraints and even thermal noise introduce severe limitations [189]. Butneither are there obvious fundamental reasons that these projections are unachievable. Itseems remarkable that in principle just a few atoms and one second of averaging could providesufficient information to achieve such high frequency resolution. If for some reasons theselimits are not achievable, then there must be interesting science along the way. Only time willtell whether all the projections and promises can be realized; but if history is any indicator,Michelson’s ‘A Plea for Light’ in 1888 [190] has proven well founded, and 117 years later wecontinue to add more voices to the chorus.

Optical frequency/wavelength references S491
Acknowledgments
We thank our many colleagues at NIST and other laboratories around the world for importantcontributions to this paper and to the field of optical frequency standards. This is truly a worldwide enterprise. We are particularly indebted to J L Hall for helpful comments, to T H Yoonfrom KRISS for the photo of the Michelson interferometer, and L Robertsson for trackingdown historical details at BIPM.
Contribution of National Institute of Standards and Technology, not subject to copyright.
References
[1] Barnes J A et al 1970 IEEE Trans. Instrum. Meas. 20 105–20[2] Sullivan D B, Allan D W, Howe D A and Walls F L (ed) 1990 Characterization of Clocks and Oscillators (NIST
Tech. Note 1337)[3] Hollberg L et al 2001 IEEE J. Quantum Electron. 37 1502–13[4] Metcalf H J and van der Straten P 1999 Laser-Cooling and Trapping (New York: Springer)[5] Drever R W P, Hall J L, Kowalski F V, Hough J, Ford G M, Munley A J and Ward H 1983 Appl. Phys. B 31
97–105[6] Young B C, Cruz F C, Itano W M and Bergquist J C 1999 Phys. Rev. Lett. 82 3799–802[7] Hall J L and Ye J (ed) 2001 Laser frequency stabilization: standards, measurement and applications Proc. SPIE
4269[8] Wilpers G, Binnewies T, Degenhardt C, Sterr U, Helmcke J and Riehle F 2002 Phys. Rev. Lett. 89 230801[9] Rafac R J, Young B C, Beall J A, Itano W M, Wineland D J and Bergquist J C 2000 Phys. Rev. Lett. 85 2462–5
[10] Katori H, Takamoto M, Pal’chikov V G and Ovsiannikov V D 2003 Phys. Rev. Lett. 91 173005[11] Holzwarth R, Zimmerman M, Udem T and Hansch T W 2001 IEEE J. Quantum Electron. 37 1493–501[12] Diddams S A, Jones D J, Ye J, Cundiff T, Hall J L, Ranka J K, Windeler R S, Holzwarth R, Udem T and
Hansch T W 2000 Phys. Rev. Lett. 84 5102–5[13] Telle H R, Steinmeyer G, Dunlop A E, Stenger J, Sutter D H and Keller U 1999 Appl. Phys. B 69 327[14] Bergquist J C, Diddams S A, Oates C W, Curtis E A, Hollberg L, Drullinger R E, Itano W M, Wineland D J
and Udem T 2002 Proc. XV Int. Conf. on Laser Spectroscopy ed V V S Chu, A J Kerman and C Chen(Singapore: World Scientific) pp 106–14
[15] Bize S et al 2003 Phys. Rev. Lett. 90 1508021[16] Tamm C, Schneider T and Peik E 2004 Laser spectroscopy Proc. XVI Int. Conf. Laser Spectroscopy 2003
ed P Hannaford and H Bachor (Singapore: World Scientific) pp 40–8[17] Margolis H S, Barwood G, Huang G, Klein H A, Lea S N, Szymaniec K and Gill P 2004 Science 306 1355[18] Hocker L O, Javan A, Rao D R, Frenkel L and Sullivan T 1967 Appl. Phys. Lett. 10 147–9[19] Javan A 1968 Ann. New York Acad. Sci. 168 715–20[20] Jennings D A, Evenson K M and Knight D J E 1986 Proc. IEEE 74 168–79[21] Klement’ev V M, Matyugin Y A and Chebotaev V P 1978 Sov. J. Quantum Electron. 8 953–8[22] Chebotayev V P 1979 Radio Sci. 14 573–84[23] Baird K M, Evenson K M, Hanes G R, Jennings D A and Petersen F R 1979 Opt. Lett. 4 263–4[24] Gill P (ed) 2002 Frequency standards and metrology Proc. 6th Symp. (Singapore: World Scientific)[25] Hall J L 2000 IEEE J. Sel. Top. Quantum Electron. 6 1136–44[26] Madej A A and Bernard J E 2001 Frequency measurements and control: advanced techniques and future trends
Topics in Applied Physics vol 79 ed A N Luiten (Heidelberg: Springer) pp 153–94[27] Fisk P T H 1997 Rep. Prog. Phys. 60 761–817[28] Hall J L and Ye J 2003 IEEE Trans. Instrum. Meas. 52 227–31[29] Baklanov E V and Pokasov P 2003 Quantum Electron. 33 383–400[30] Ye J, Schnatz H and Hollberg L 2003 IEEE J. Sel. Top. Quantum Electron. 9 1041–58[31] Will C M 1981 Theory and Experiment in Gravitational Physics (Cambridge: Cambridge University Press)[32] Zhang Y Z 1997 Special Relativity and its Experimental Foundations vol 4 (Singapore: World Scientific)[33] Essen L and Gordon-Smith A C 1948 Proc. R. Soc. Lond. A 194 348–61[34] Petley B W 1983 Nature 303 373–6[35] Michelson A A and Morley E W 1887 Am. J. Sci. 34 333[36] Michelson A A 1889 Am. J. Sci. 38 225[37] Michelson A A 1893 Astron. Astrophys. 12 556–60

S492 L Hollberg et al
[38] Bennett J M, McAllister D T and Cabe G M 1973 Appl. Opt. 12 2253–79[39] Michelson A A 1911 Science 34 893–902[40] Benoit R, Fabry C and Perot A 1907 Comptes Rendus 144 1082–6[41] BIPM-web-site Bureau International des Poids et Mesures http://www.bipm.org/[42] Giacomo P 1984 Metrologia 20 25–30[43] BNM-SYRTE, l’Obsrvatoire de Paris, http://www.obspm.fr/, BNM-SYRTE Bureau National de Metrologie-
Systemes de Reference Temps Espace, http://opdaf1.obspm.fr/[44] Tuinstra F 2004 Phys. Today 57 16[45] Froome K D and Essen L 1969 The Velocity of Light and Radio Waves (London: Academic)[46] Michelson A A 1924 Astrophys. J. 60 256–61[47] Michelson A A 1927 Astrophys. J. 65 1–22[48] Bowie W 1927 Astrophys. J. 65 14–22[49] Shankland R S 1967 Am. J. Phys. 35 1095–6[50] Evenson K M, Wells J S, Danielso Bl, Day G W and Petersen F R 1972 Phys. Rev. Lett. 29 1346–9[51] Essen L and Parry J V L 1955 Nature 176 280–2[52] Weiss R 1966 Contribution to Festschrift for J R Zacharias, http://emvogil-3.mit.edu/∼weiss/documents/
zachfountain.pdf[53] Lyons H 1952 Ann. New York Acad. Sci. 55 831–71[54] Jones T 2000 Splitting the Second, the Story of Atomic Time (Bristol: Institute of Physics Publishing)[55] Evenson K M, Wells J S, Mullen L O and Day G W 1972 Appl. Phys. Lett. 20 133–4[56] Barger R L and Hall J L 1973 Appl. Phys. Lett. 22 196–9[57] Rowley W R C and Wallard A J 1973 J. Phys. E: Sci. Instrum. 6 647–52[58] Wood P T, Shotton K C and Rowley W R C 1978 Appl. Opt. 17 1048–54[59] Baird K M, Smith D S and Berger W E 1973 Opt. Commun. 7 107–9[60] Hall J L 2004 Private communication
Giacomo P 2003 Private communication[61] BIPM-Director’s-Report, Interferometric measurements, copies kindly provided by L Robertsson of BIPM
(1969–1970)[62] Blaney T G, Bradley C C, Edwards G J, Jolliffe B W, Knight D J E, Rowley W R C, Shotton K C and Woods P T
1974 Nature 251 46–7[63] Rowley W R C, Jolliffe B W, Shotton K C, Wallard A J and Woods P T 1976 Opt. Quantum Electron. 8 1–14[64] Baird K M, Smith D S and Whitford B G 1979 Opt. Commun. 31 367–8[65] Bay Z, Luther G G and White J A 1972 Phys. Rev. Lett. 29 189–92[66] Rowley W R C, Shotton K C and Woods P T 1980 Opt. Commun. 34 429–30[67] Hanes G R, Baird K M and DeRemigis J 1973 Appl. Opt. 12 1600–5[68] Pollock C R, Jennings D A, Petersen F R, Wells J S, Drullinger R E, Beaty E C and Evenson K M 1983
Opt. Lett. 8 133–5[69] Jennings D A, Pollock C R, Petersen F R, Drullinger R E, Evenson K M, Wells J S, Hall J L and Layer H P
1983 Opt. Lett. 8 136–8[70] Giacomo P 1984 Am. J. Phys. 52 607–13[71] Schnatz H, Lipphardt B, Helmcke J, Riehle F and Zinner G 1996 Phys. Rev. Lett. 76 18–21[72] Quinn T J 2003 Metrologia 40 103–33[73] BIPM-mep http://www.bipm.org/en/home/mep.html[74] Madej A A, Bernard J E, Robertsson L, Ma L S, Zucco M and Windeler R S 2004 Metrologia 41 152–60[75] Bernard J E, Madej A A, Siemsen K J and Marmet L 2001 Opt. Commun. 187 211–8[76] Picard S et al 2003 IEEE Trans. Instrum. Meas. 52 236–9[77] Ma L S, Picard S, Zucco M, Chartier J M, Robertsson L and Windeler R S 2004 Metrologia 41 65–8[78] Ma L S, Robertsson L, Picard S, Chartier J-M, Karlsson H, Prieto E, Ranka J K and Windeler R S 2003 IEEE
Trans. Instrum. Meas. 32 232–5[79] Michelson A A and Morley E W 1887 Am. J. Sci. 34[80] 1928 Proc. Conf. on the Michelson–Morley Experiment (Mt Wilson Observatory, Pasadena, CA, 4–5 February
1928) Astrophys. J. 68 341–402[81] Shankland R S 1964 Am. J. Phys. 32 16–35[82] Livingston D M 1973 The Master of Light: A Biography of Albert A Michelson (New York: Charles Scribner)[83] Shankland R S 1973 Appl. Opt. 12 2280–7[84] Jaseja T S, Javan A, Murray J and Townes C H 1964 Phys. Rev. 133 A1221–5[85] Brillet A and Hall J L 1979 Phys. Rev. Lett. 42 549–52[86] Hils D and Hall J L 1990 Phys. Rev. Lett. 64 1697–700

Optical frequency/wavelength references S493
[87] Robertson H P 1949 Rev. Mod. Phys. 21 378–82[88] Mansouri R and Sexl R U 1977 Gen. Rel. Grav. 8 497–513[89] Mansouri R and Sexl R U 1977 Gen. Rel. Grav. 8 515–24[90] Born M 1962 Einstein’s Theory of Relativity (New York: Dover)[91] Roberts T 2000 http://math.ucr.edu/home/baez/physics/Relativity/SR/experiments.html[92] Braxmaier C, Muller H, Pradl O, Mlynek J, Peters A and Schiller S 2002 Phys. Rev. Lett. 88 010401[93] Muller H, Herrmann S, Braxmaier C, Schiller S and Peters A 2003 Phys. Rev. Lett. 91 020401[94] Wolf P, Bize S, Clairon A, Luiten A N, Santarelli C and Tobar M E 2003 Phys. Rev. Lett. 90 060402[95] Wolf P, Bize S, Clairon A, Santarelli C, Luiten A N and Tobar M E 2003 Tests of Lorentz invariance using
a microwave resonator: an update Proc. EFTF & FCS Joint Meeting (Tampa, FL 2003) (Piscataway, NJ:IEEE) pp 205–10
[96] Snyder J J and Hall J L 1975 Laser spectroscopy Proc. 2nd Int. Conf. (Megeve, 23–27 June 1975) vol 43ed J C P-P S Haroche, T W Hansch and S E Harris (Berlin: Springer) pp 6–17
[97] Riis E, Andersen L-U A, Bjerre N, Poulsen O, Lee S A and Hall J L 1988 Phys. Rev. Lett. 60 81–4[98] McGowen R W, Giltner D M, Sternberg S J and Lee S A 1993 Phys. Rev. Lett. 70 251–4[99] Saathoff G, Karpuk S, Eisenbarth U, Huber G, Krohn S, Munoz Horta R, Reinhardt S, Schwalm D, Wolf A and
Gwinner G 2003 Phys. Rev. Lett. 91 190403[100] Ashby N 2003 Liv. Rev. Rel. 6 1–45 www.livingreviews.org/Articles/Volume6/2003-1ashby[101] Heavner T P, Jefferts S R, Donley E A, Shirley J H and Parker T E 2004 Proc. Joint Mtg. IEEE Intl. Freq.
Cont. Symp. UFFC Conf.[102] Jefferts S R, Heavner T P and Donley E A 2004 Japan. J. Appl. Phys. 43 2803–7[103] Dyson F J 1972 Aspects of Quantum Theory ed A S and E P Wigner (Cambridge: Cambridge University Press)
pp 213–36[104] Prestage J D, Tjoelker R L and Maleki L 1995 Phys. Rev. Lett. 74 3511–4[105] Domnin Y S, Kopylov L N, Malimon A N, Tenishev V P and Shumyatskii P S 1996 Quantum Electron. 26
1081–4[106] Karshenboim S G 2000 Can. J. Phys. 78 639–78[107] Karshenboim S G 2002 Laser Physics at the Limits vol 34 ed D M H Figger and C Zimmerman (Berlin:
Springer) pp 165–76[108] Peik E, Lipphardt B, Schnatz H, Schneider T, Tamm C and Karshenboim S G 2004 Phys. Rev. Lett. 93 170801[109] Fischer M et al 2004 Phys. Rev. Lett. 92 230802[110] Bluhm R, Kostelecky V A, Lane C D and Russell N 2002 Phys. Rev. Lett. 88 090801[111] Dzuba V A, Flambaum V V and Webb J K 1999 Phys. Rev. A 59 230–7[112] Flambaum V 2004 Laser spectroscopy Proc. XVI Int. Conf. on Laser Spectroscopy ed P Hannaford and
H Bachor (Singapore: World Scientific) pp 49–57[113] Webb J K, Murphy M T, Flambaum V, Dzuba V A, Barrow J D, Churchill C W, Prochaska J X and Wolfe A M
2001 Phys. Rev. Lett. 87 091301[114] Kozlov M G, Korol V A, Berengut J C, Dzuba V A and Flambaum V V 2004 Phys. Rev. A 70 062108[115] Quast R, Reimers D and Levshakov S A 2004 Astron. Astrophys. 415 L7–11[116] Chand H, Srianand R, Petitjean P and Aracil B 2004 Astron. Astrophys. 417 853–71[117] Marion H et al 2003 Phys. Rev. Lett. 90 150801[118] Diddams S A, Bergquist J C, Jefferts S R and Oates C W 2004 Science 306 1318–24[119] Sterr U, Degenhardt C, Stoehr H, Lisdat C, Schnatz H, Helmcke J, Riehle F, Wilpers G, Oates C W and
Hollberg L 2004 C. R. Phys. 5 845–55[120] Oates C W, Curtis E A and Hollberg L 2000 Opt. Lett. 25 1603–5[121] Madej A A, Bernard J E, Dube P, Marmet L and Windeler R S 2004 Phys. Rev. A 70 012507[122] Dehmelt H 1982 IEEE Trans. Instrum. Meas. 31 83–7[123] Oskay W H, Itano W M and Bergquist J C 2005 Phys. Rev. Lett. at press[124] Itano W M 2000 J. Res. Natl Bur. Stand. 105 829–37[125] Wineland D J, Bergquist J C, Bollinger J J, Drullinger R E and Itano W M 2002 Quantum Computers and
Atomic Clocks (St Andrews, Fife, Scotland) (Singapore: World Scientific) pp 361–7[126] Schmidt P O, Rosenband T, Langer C, Itano W M, Bergquist J C and Wineland D J 2005 submitted[127] Itano W M 2004 Private communication[128] Quessada A, Kovacich R P, Courtillot I, Clairon A, Santarelli C and Lemonde P 2003 J. Opt. B: Quantum
Semi-Class. Opt. 5 S150–4[129] Curtis E A, Oates C W and Hollberg L 2001 Phys. Rev. A 64 031403[130] Binnewies T, Wilpers G, Sterr U, Riehle F, Helmcke J, Mehlstaubler T E, Rasel E M and Ertmer W 2001
Phys. Rev. Lett. 87 123002

S494 L Hollberg et al
[131] Borde C J, Salomon C, Avrillier S, Van Lerberghe A, Breant C, Bassi D and Scoles G 1984 Phys. Rev. A 301836–48
[132] Wineland D J, Bergquist J C, Itano W M and Drullinger R E 1980 Opt. Lett. 5 245–7[133] Oates C W, Bondu F, Fox R W and Hollberg L 1999 Eur. Phys. J. D 7 449–60[134] Maleki L 1998 IEEE Trans. Ultrason. Ferroelectr. Freq. Control 45 876[135] Presti L L, Rovera D and Marchi A D 1998 IEEE Trans. Ultrason. Ferroelectr. Freq. Control 45 899–905[136] Santarelli G, Audoin C, Makdissi A A, Laurent P, Dick G J and Clairon A 1998 IEEE Trans. Ultrason.
Ferroelectr. Freq. Control 45 887–94[137] Takamoto M and Katori H 2003 Phys. Rev. Lett. 91 223001[138] Courtillot I, Quessada A, Kovacich R P, Brusch A, Kolker D, Zondy J J, Rovera D G and Lemonde P 2003
Phys. Rev. A 68 030501[139] Ruschewitz F, Peng J L, Hinderthur H, Schaffrath N, Sengstock K and Ertmer W 1998 Phys. Rev. Lett. 80
3173–6[140] Cesar C L, Fried D G, Killian T C, Polcyn A D, Sandberg J C, Yu I A, Greytak T J, Kleppner D and Doyle J M
1996 Phys. Rev. Lett. 77 255–8[141] Niering M et al 2000 Phys. Rev. Lett. 84 5496–9[142] Porsev S G, Derevianko A and Fortson E N 2004 Phys. Rev. A 69 021403[143] Badr T, Plimmer M D, Juncar P, Himbert M E, Silver J D and Rovera D G 2004 Eur. Phys. J. D 31 3–10[144] Xu X-Y, Loftus T, Dunn J W, Greene C H, Hall J L, Gallagher A and Ye C Y 2003 Phys. Rev. Lett. 91 193002[145] Yoon T H, Park C Y and Park S J 2004 Phys. Rev. A 70 061803[146] Karshenboim S G, Pavone F S, Bassani G F, Inguscio M and Hansch T W (ed) 2001 The Hydrogen Atom:
Precision Physics of Simple Atom Systems (Berlin: Springer)[147] Kolachevsky N, Fischer M, Karshenboim S G and Hansch T W 2004 Phys. Rev. Lett. 92 033003[148] Cancio Pastor P, Guisfredi G, De Natale P, Hagel G, de Mauro C and Inguscio M 2004 Phys. Rev. Lett. 92
023001[149] Hong T, Cramer C, Nagourney W and Fortson E N 2005 Phys. Rev. Lett. 94 050801[150] Yasuda M and Katori H 2004 Phys. Rev. Lett. 92 153004[151] International Telecommunications Union 2002 Frequency grid for optical communication channels (ITU
Recommendation G.694.1 (06/02))[152] Gilbert S L, Swann W and Dennis T 2001 Proc. Soc. Photo-Opt. Instrum. Eng. 4269 184–91[153] Dennis T, Curtis E A, Oates C W, Hollberg L and Gilbert S L 2002 J. Lightwave Technol. 20 776–82[154] Udem T, Reichert J, Holzwarth R and Hansch T W 1999 Opt. Lett. 24 881–3[155] Udem T, Reichert J, Holzwarth R and Hansch T W 1999 Phys. Rev. Lett. 82 3568–71[156] Eckstein J N, Ferguson A I and Hansch T W 1978 Phys. Rev. Lett. 40 847–50[157] Reichert J, Holzwarth R, Udem T and Hansch T W 1999 Opt. Commun. 172 59–68[158] Jones D J, Diddams S A, Ranka J K, Stentz A, Windeler R S, Hall J L and Cundiff S T 2000 Science 288
635–9[159] Diddams S A, Ye J and Hollberg L 2005 Femtosecond Optical Frequency Comb: Principle, Operation and
Applications ed E S Cundiff and J Ye (New York: Springer) pp 225–62[160] Udem T, Holzwarth R and Hansch T W 2002 Nature 416 233–7[161] Cundiff S T and Ye J 2003 Rev. Mod. Phys. 75 325–42[162] Hall J L, Ye J, Diddams S A, Ma L S, Cundiff S T and Jones D J 2001 IEEE J. Quantum Electron. 37 1482–92[163] Diddams S A et al 2001 Science 293 825–8[164] Bartels A, Diddams S A, Ramond T M and Hollberg L 2003 Opt. Lett. 28 663–5[165] Bartels A, Diddams S A, Oates C W, Wilpers G, Bergquist J C, Oskay W H and Hollberg L 2004 Opt. Lett. 30
667–9[166] Hollberg L, Diddams S A, Bartels A, McFerran J, Ivanov E N, Wilpers G, Oates C W, Oskay W H and
Bergquist J C 2004 Generation of Microwaves with Ultra-Low Phase-Noise from an Optical Clock (Ogunquit,Maine) (Piscataway, NJ: IEEE)
[167] Holzwarth R, Udem T, Hansch T W, Knight J C, Wadsworth W J and Russell P S J 2000 Phys. Rev. Lett. 852264–7
[168] Diddams S A, Hollberg L, Ma L S and Robertsson L 2002 Opt. Lett. 27 58–60[169] Ma L S, Robertsson L, Picard S, Zucco M, Bi Z, Wu S and Windeler R S 2004 Opt. Lett. 29 641–3[170] Ma L S, Bi Z, Bartels A, Robertsson L, Zucco M, Windeler R S, Wilpers G, Oates C W, Hollberg L and
Diddams S A 2004 Science 303 1843–5[171] Zimmerman M, Gohle C, Holzwarth R, Udem T and Hansch T W 2004 Opt. Lett. 29 310–2[172] Stenger J, Schnatz H, Tamm C and Telle H R 2002 Phys. Rev. Lett. 88 073601

Optical frequency/wavelength references S495
[173] Holzwarth R, Zimmerman M, Udem T, Hansch T W, Russbuldt P, Gabel K, Poprawe R, Knight J C,Wadsworth W J and Russell P S 2001 Opt. Lett. 26 1376–8
[174] Thomann I, Bartels A, Corwin K L, Newbury N R, Hollberg L, Diddams S A, Nicholson J W and Yan M F2003 Opt. Lett. 28 1368–70
[175] Kim K, Washburn B R, Wilpers G, Oates C W, Hollberg L, Newbury N R, Diddams S A, Nicholson J W andYan M F 2005 Opt. Lett. 30 932–4
[176] Tauser F, Leitenstorfer A and Zinth W 2003 Opt. Exp. 11 594–600[177] Washburn B R, Diddams S A, Newbury N R, Nicholson J W, Yan M F and Jorgensen C G 2004 Opt. Lett. 29
250–2[178] Hong F L, Minoshima K, Onae A, Inaba H, Takada H, Hirai A and Matsumoto H 2003 Opt. Lett. 28 1516–8[179] Hundertmark H, Wandt D, Fallnich C, Haverkamp N and Telle H R 2004 Opt. Exp. 12 770–5[180] Jefferts S R 2002 Metrologia 39 321–36[181] Weyers S, Hubner U, Schroder R, Tamm C and Bauch A 2001 Metrologia 38 343–52[182] Levi F, Lorini L, Calonico D and Godone A 2004 IEEE Trans. Ultrason. Ferroelectr. Freq. Control 51 1216–24[183] Santarelli C, Laurent P, Lemonde P, Clairon A, Mann A G, Chang S, Luiten A N and Salomon C 1999 Phys.
Rev. Lett. 82 4619–22[184] Fertig C and Gibble K 2000 Phys. Rev. Lett. 85 1622–5[185] Levi F, Godone A, Lorini L, Jefferts S R, Heavner T P and Calosso C 2002 The Multiple Velocity Fountain:
A New Scheme for the Cold Collision Frequency Shift Reduction (St Andrews, Fife, Scotland) (Singapore:World Scientific) pp 466–8
[186] Fertig C, Legere R, Rees J I, Gibble K, Kokkelmans S, Verhaar B J, Prestage J D, Klipstein W, Seidel Dand Thompson R 2002 Cold Collision Frequency Shifts and Laser-Cooled 87Rb Clocks (St Andrews, Fife,Scotland) (Singapore: World Scientific) pp 213–21
[187] Bergquist J C, Itano W M and Wineland D J 1994 Proc. Int. School of Physics ‘Enrico Fermi’, Frontiers inLaser Spectroscopy ed T W Hansch and M Inguscio (Amsterdam: North-Holland) pp 359–76
[188] Ma L-S, Jungner P, Ye J and Hall J L 1994 Opt. Lett. 19 1777–9[189] Numata K, Kemery A and Camp J 2004 Phys. Rev. Lett. 93 250602[190] Michelson A A 1888 Proc. Am. Assoc. Adv. Sci. 37 67–78