Embed Size (px)
Citation preview
OPTICAL PROPERTIES OF SKIN,SUBCUTANEOUS, AND MUSCLE TISSUES:
A REVIEW
ALEXEY N. BASHKATOV*,z, ELINA A. GENINA*
and VALERY V. TUCHIN*,y*Institute of Optics and Biophotonics
Saratov State University,Saratov 410012, Russia
yInstitute of Precise Mechanics and Controlof RAS, Saratov 410028, Russia
The development of optical methods in modern medicine in the areas of diagnostics, therapy, andsurgery has stimulated the investigation of optical properties of various biological tissues, sincethe e±cacy of laser treatment depends on the photon propagation and °uence rate distributionwithin irradiated tissues. In this work, an overview of published absorption and scatteringproperties of skin and subcutaneous tissues measured in wide wavelength range is presented.Basic principles of measurements of the tissue optical properties and techniques used for pro-cessing of the measured data are outlined.
Keywords: Absorption coe±cient; scattering coe±cient; anisotropy factor; reduced scatteringcoe±cient; refractive index.
1. Introduction
Recent technological advancements in the photonicsindustry have spurred real progress toward thedevelopment of clinical functional imaging, surgical,and therapeutic systems. The development of theoptical methods for medicine in the areas of diag-nostics, surgery, and therapy has stimulated theinvestigation of optical properties of human tissues,since the e±cacy of optical probing of the tissuesdepends on the photon propagation and °uence ratedistribution within irradiated tissues. Monitoring ofblood oxygenation and tissue metabolism, detectionof skin malignancies, and skin optical imaging are
examples of light diagnostic applications in derma-
tology. Therapeutic optical technologies mostly
include photothermal and photodynamic therapy.For these applications, knowledge of optical
properties of skin and subcutaneous tissues is of great
importance for interpretation and quanti¯cation of
the diagnostic data, and for prediction of light dis-
tribution and absorbed energy for therapeutic and
surgical use. In this review, we are presenting an
overview of optical properties of skin and subcu-
taneous (including muscle) tissues measured in a
wide range of wavelengths.
‡Corresponding author.
Journal of Innovative Optical Health SciencesVol. 4, No. 1 (2011) 9�38#.c World Scienti¯c Publishing CompanyDOI: 10.1142/S1793545811001319
9
2. Basic Principles of Measurementsof Tissue Optical Properties
Methods for determining the optical parameters oftissues can be divided into two large groups, directand indirect methods.1�12 Direct methods includethose based on some fundamental concepts andrules such as the Bouguer�Beer�Lambert law, thesingle-scattering phase function for thin samples, orthe e®ective light penetration depth for slabs. Theparameters measured are the collimated lighttransmission Tc and the angular dependence of thescattered light intensity, Ið�Þ (W=cm2 sr) for thinsamples or the °uence rate distribution inside aslab. The normalized scattering angular dependenceis equal to the scattering phase function Ið�Þ=Ið0Þ �pð�Þ, 1/sr. These methods are advantageous in thatthey use very simple analytic expressions for dataprocessing and reconstruction of optical parametersof tissue: �a; �s, and g, where �a is the absorptioncoe±cient, �s is the scattering coe±cient, and g isthe anisotropy factor of scattering. Their dis-advantages are related to the necessity to strictlyful¯ll experimental conditions dictated by theselected model (single scattering in thin samples,exclusion of the e®ects of light polarization andrefraction at cuvette edges, etc.; in the case of slabswith multiple scattering, the recording detector(usually a ¯ber light guide with an isotropicallyscattering ball at the tip end) must be placed farfrom both the light source and the mediumboundaries).
Indirect methods obtain the solution of theinverse scattering problem using a theoretical modelof light propagation in a medium. They are, in turn,divided into iterative and non-iterative models. Theformer uses equations in which the optical proper-ties are de¯ned through parameters directly relatedto the quantities being evaluated. The latter arebased on the two-°ux Kubelka�Munk model andmulti-°ux models. In indirect iterative methods, theoptical properties are implicitly de¯ned throughmeasured parameters. Quantities determining theoptical properties of a scattering medium areenumerated until the estimated and measuredvalues for re°ectance and transmittance coincidewith the desired accuracy. These methods arecumbersome, but the optical models currently in usemay be even more complicated than those under-lying non-iterative methods (examples include the
di®usion theory, inverse adding-doubling (IAD),and inverse Monte Carlo (IMC) methods).
The optical properties of a tissue could bemeasured by di®erent methods: The single- ordouble-integrating sphere method combined withcollimated transmittance measurements is mostoften used for in vitro studies of tissues. Thisapproach implies either sequential or simultaneousdetermination of three parameters: collimatedtransmittance Tc ¼ Ic=I0 (Ic is the intensity oftransmitted light measured using a distant photo-detector with a small aperture,W=cm2, and I0 is theintensity of incident radiation, W=cm2Þ, totaltransmittance Tt ¼ Tc þ Td (Td being di®use trans-mittance), and di®use re°ectance Rd. The opticalparameters of the tissue are deduced from thesemeasurements using di®erent theoretical expressionsor numerical methods (two-°ux and multi-°uxmodels, the IMC or IAD methods) relating �a; �s,and g to the parameters being investigated.
Any three measurements from the following ¯veare su±cient for the evaluation of all three opticalparameters2:
. Total (or di®use) transmittance for collimated ordi®use radiation;
. Total (or di®use) re°ectance for collimated ordi®use radiation;
. Absorption by a sample placed inside an inte-grating sphere;
. Collimated transmittance (of unscattered light);and
. Angular distribution of radiation scattered by thesample.
Iterative methods normally take into account dis-crepancies between refractive indices at sampleboundaries as well as the multilayer nature of thesample. The following factors are responsible for theerrors in the estimated values of optical coe±cientsand need to be borne in mind in a comparativeanalysis of optical parameters obtained fromdi®erent experiments2,13�18:
. The physiological conditions of tissues (the degreeof hydration, homogeneity, species-speci¯c varia-bility, frozen/thawed or ¯xed/un¯xed state,in vitro/in vivo measurements, smooth/roughsurface);
. The geometry of irradiation;
. The matching/mismatching interface refractiveindices;
10 A. N. Bashkatov, E. A. Genina & V. V. Tuchin
. The angular resolution of photodetectors;
. The separation of radiation experiencing forwardscattering from unscattered radiation; and
. The theory used to solve the inverse problem.
To analyze light propagation under multiplescattering conditions, it is assumed that absorbingand scattering centers are uniformly distributedacross the tissue. Ultraviolet-A (UV-A), visible, ornear-infrared (NIR) radiation is normally subjectedto anisotropic scattering characterized by a clearlyapparent direction of photons undergoing singlescattering, which may be due to the presence oflarge cellular organelles (mitochondria, lysosomes,Golgi apparatus, etc.).1�4,7�12,19
When the scattering medium is illuminated byunpolarized light and/or only the intensity of mul-tiple scattered light needs to be computed, a su±-ciently strictmathematical description of continuouswave (CW) light propagation in amedium is possiblein the framework of the scalar stationary radiationtransfer theory (RTT).1�4,7�12,19,20 This theory isvalid for an ensemble of scatterers located far fromone another and has been successfully used to workout some practical aspects of tissue optics. The mainstationary equation of RTT for monochromatic lighthas the form
@Ið~r;~s Þ@s
¼ ��tIð~r;~sÞ
þ �s4�
Z4�
Ið~r;~sÞpð~s;~s 0Þd� 0 ð1Þ
where Ið~r;~sÞ is the radiance (or speci¯c intensity)-average power °ux density at point ~r in the givendirection~s,W=cm2 sr; pð~s;~s 0Þ is the scattering phasefunction, 1/sr; d� 0 is the unit solid angle about thedirection ~s 0, sr, and �t ¼ �a þ �s is the totalattenuation coe±cient. It is assumed that there areno radiation sources inside the medium.
The scalar approximation of the radiativetransfer equation (RTE) gives poor accuracy whenthe size of the scattering particles is much smallerthan the wavelength, but provides acceptableresults for particles comparable to and larger thanthe wavelength.21,22
The phase function pð~s;~s 0Þ describes the scat-tering properties of the medium and is, in fact, theprobability density function for scattering in thedirection ~s 0 of a photon traveling in the direction ~s;in other words, it characterizes an elementary
scattering act. If scattering is symmetric relative tothe direction of the incident wave, then the phasefunction depends only on the scattering angle �(angle between directions ~s and ~s 0Þ, i.e., pð~s;~s 0Þ ¼pð�Þ. The assumption of random distribution ofscatterers in a medium (i.e., the absence of spatialcorrelation in the tissue structure) leads to nor-malization:
R �0pð�Þ2� sin �d� ¼ 1. In practice, the
phase function is usually well approximated withthe aid of the postulated Henyey�Greensteinfunction (HGF)1�4,7�11,15,16,23�62:
pð�Þ ¼ 1
4�
1� g2
ð1þ g2 � 2g cos �Þ3=2 ð2Þ
where g is the scattering anisotropy parameter(mean cosine of the scattering angle �)
g � hcos �i ¼Z �
0
pð�Þ cos � � 2� sin �d�:
The value of g varies in the range from �1 to 1;g ¼ 0 corresponds to isotropic (Rayleigh) scatter-ing, g ¼ 1 to total forward scattering (Mie scatter-ing at large particles), and g ¼ �1 to totalbackward scattering.1�4,7�11,20,21
3. Integrating Sphere Technique
One of the indirect methods to determine opticalproperties of tissues in vitro is the integratingsphere technique.2,11,13�18,27�40,42�50,53�58,60�83 Dif-fuse re°ectance Rd, total Tt, and/or di®use trans-mittance Td, and collimated transmittance Tc aremeasured. In general, the absorption and scatteringcoe±cients and anisotropy factor can be obtainedfrom these data using an inverse method based onthe radiative transfer theory. When the scatteringphase function pð�Þ is available from goniophoto-metry, g can be readily calculated. In this case, forthe determination of �a and �s it is su±cient tomeasure Rd and Tt only. Sometimes in experimentswith tissue and blood samples, a double-integratingsphere con¯guration is preferable, since in this caseboth re°ectance and transmittance can be measuredsimultaneously and less degradation of the sample isexpected during measurements. Nevertheless, in thecase of a double-integrating sphere arrangement ofthe experiment in addition to the single-integratingsphere corrections of measured signals, multipleexchange of light between the spheres should beaccounted for.29,37,74
Optical Properties of Skin and Subcutaneous Tissues 11
Some tissues (e.g., melanin-containing) and bloodhave high total attenuation coe±cients in the visibleand NIR spectral range. Therefore, the collimatedtransmittance measurement for such samples (e.g.,the undiluted blood layer with a moderate thickness� 0:1 mm is a technically di±cult task.56 To solvethis problem, a powerful light source combined witha sensitive detector must be used.75 Alternatively, itis possible to collect the collimated light togetherwith some forward-scattered light using the thirdintegrating sphere.76 In this case, the collimatedtransmittance is separated from the scattered °uxon the stage of the data processing in use, e.g., a MCtechnique60 or a small angle approximation.79
Another approach was exactly the same as was usedin Refs. 43, 67, 69, 70. In these studies, the di®usere°ectance, total and di®use transmittance havebeen measured, and IMC algorithm, taking intoaccount geometry of the measurement, has beenused for treatment of the experimental data.
4. Kubelka{Munk and Multi-Flux
Approach
To separate the light beam attenuation due toabsorption from the loss due to scattering the one-dimensional (1D), two-°ux Kubelka�Munk (KM)model can be used as the simplest approachto solve the problem. This approach has beenwidely used to determine the absorption andscattering coe±cients of biological tissues, pro-vided the scattering is signi¯cantly dominant overthe absorption.2,11,20,24,63,64,73,85�87 The KM modelassumes that light incident on a slab of tissuebecause of interaction with the scattering mediacan be modeled by two °uxes, counterpropagatingin the tissue slab. The optical °ux, which propa-gates in the same direction as the incident °ux, isdecreased by absorption and scattering processesand is also increased by backscattering of the coun-terpropagating °ux in the same direction. Changes incounterpropagating °ux are determined in an ana-logous manner. The fraction of each °ux lost byabsorption per unit path length is denoted asK, whilethe fraction lost due to scattering is called S. Themain assumptions of the KMmodel include:K and Sparameters are assumed to be uniform throughoutthe tissue slab; all light °uxes are di®use; and theamount of light lost from the edges of the sampleduring re°ectance measurements is negligible. Basic
KM model does not account for re°ections atboundaries at which index of refraction mismatchesexist.
Following the KM model and di®usion approxi-mation of the RTE, the KM parameters wereexpressed in terms of light transport theory: theabsorption and scattering coe±cients and scatteringanisotropy factor.2,86 Thus, when scattering sig-ni¯cantly prevails during absorption, a simple ex-perimental method using modi¯ed KM modelexpressions can be successfully employed as
S ¼ 1
bd¼ ln
1�Rdða� bÞTt
� �;
K ¼ Sða� 1Þ; a ¼ 1� T 2t þR2
d
2Rd
; b ¼ffiffiffiffiffiffiffiffiffiffiffiffiffia2 � 1
p;
K ¼ 2�a; S ¼ 3
4�sð1� gÞ � 1
4�a;
�t ¼ �a þ �s; � 0s ¼ �sð1� gÞ > �a;
ð3Þwhere �t is determined based on Bouguer�Beer�Lambert law (Tc ¼ expð��tlÞÞ from measuredvalues of collimated transmittance Tc, where l istissue sample thickness. Thus, all three parameters(�a; �s, and g) can be found from the experimentaldata for total transmittance Tt, di®use re°ectanceRd, and collimated transmittance Tc of the sample.
Often, such simple methods as the KM mod-el13,15,16,28,30�44,47,56,62,67�70 or di®usion approxima-tion57,60,61,88,89 are used as the ¯rst step of theinverse algorithm for estimation of the opticalproperties of tissues and blood. The estimatedvalues of the optical properties are then used tocalculate the re°ected and transmitted signals,employing one of the more sophisticated models oflight propagation in tissue or blood. At the nextstep, the calculated values are compared with themeasured ones. If the required accuracy is notachieved, the current optical properties are alteredusing one of the optimization algorithms. The pro-cedures of altering the optical properties and cal-culating the re°ected and transmitted signals arerepeated until the calculated values match themeasured values with the required accuracy.
5. IAD Method
The IAD method provides a tool for the rapidand accurate solution of inverse scattering
12 A. N. Bashkatov, E. A. Genina & V. V. Tuchin
problem.15,16,25�40,42,44,62,66,77,78 It is based on thegeneral method for the solution of the transportequation for plane-parallel layers suggested by vande Hulst90 and introduced to tissue optics byPrahl.30,78,91 An important advantage of the IADmethod when applied to tissue optics is the possi-bility of rapidly obtaining iterative solutions withthe aid of up-to-date microcomputers; moreover, itis °exible enough to take into account anisotropy ofscattering and the internal re°ection from thesample boundaries. The method includes the fol-lowing steps:
(1) The choice of optical parameters to bemeasured;(2) Counting re°ections and transmissions;(3) Comparison of calculated and measured re°ec-
tance and transmittance; and(4) Repetition of the procedure until the estimated
and measured values coincides with the desiredaccuracy.
In principle, the method allows for any intendedaccuracy to be achieved for all the parameters beingmeasured, provided the necessary computer time isavailable. An error of 3% or less is consideredacceptable.30 Also, the method may be used todirectly correct experimental ¯ndings obtained withthe aid of integrating spheres. The term \doubling"in the name of the method means that the re°ectionand transmission estimates for a layer at certainingoing and outgoing light angles may be used tocalculate both the transmittance and re°ectance fora layer twice as thick by means of superimposingone upon the other and summing the contributionsof each layer to the total re°ectance and transmit-tance. Re°ection and transmission in a layer havingan arbitrary thickness are calculated in consecutiveorder, ¯rst for the thin layer with the same opticalcharacteristics (single scattering), then by con-secutive doubling of the thickness, for any selectedlayer. The term \adding" indicates that the dou-bling procedure may be extended to heterogeneouslayers for modeling multilayer tissues or taking intoaccount internal re°ections related to abruptchange in refractive index.30
The adding-doubling technique is a numericalmethod for solving the 1D transport equation inslab geometry.30,78,86 It can be used for media withan arbitrary phase function and arbitrary angulardistribution of the spatially uniform incident radi-ation. Thus, ¯nite beam size and side losses of lightcannot be taken into account. The method is based
on the observation that for an arbitrary incidentradiance angular distribution Iinð�cÞ, where �c is thecosine of the polar angle, the angular distribution ofthe re°ected radiance (normalized to an incidentdi®use °ux) is given by Prahl et al.30,78,86:
Irefð�cÞ ¼Z 1
0
Iinð�0cÞRð�0c; �cÞ2�0cd�0c; ð4Þ
where Rð�0c; �cÞ is the re°ection redistribution func-tion determined by the optical properties of the slab.
The distribution of the transmitted radiance canbe expressed in a similar manner, with obvioussubstitution of the transmission redistributionfunction T ð�0c; �cÞ. If M quadrature points areselected to span over the interval (0, 1), the re-spective matrices can approximate the re°ectionand transmission redistribution functions:
Rð�0ci; �cjÞ ! Rij; T ð�0ci; �cjÞ ! Tij: ð5ÞThese matrices are referred to as the re°ection andtransmission operators, respectively. If a slab withboundaries indexed as 0 and 2 is comprised of twolayers, (01) and (12), with an internal interface 1between the layers, the re°ection and transmissionoperators for the whole slab (02) can be expressed as
T02 ¼ T12ðE�R10R12Þ�1T01;
R20 ¼ T12ðE�R10R12Þ�1R10T21 þR21;
T20 ¼ T10ðE�R12R10Þ�1T21;
R02 ¼ T10ðE�R12R10Þ�1R12T01 þR01;
ð6Þ
where E is the identity matrix de¯ned in this case as
Eij ¼1
2�ciwi
�ij; ð7Þ
where wi is the weight assigned to the ith quad-rature point and �ij is a Kronecker delta symbol,�ij ¼ 1 if i ¼ j, and �ij ¼ 0 if i 6¼ j.
The de¯nition of the matrix multiplication alsoslightly di®ers from the standard. Speci¯cally
ðABÞik �XMj¼1
Aij2�cjwjBjk: ð8Þ
Equation (6) allows one to calculate the re°ec-tion and transmission operators of a slab when thoseof the comprising layers are known. The idea ofmethod is to start with a thin layer for which theRTE can be simpli¯ed and solved with relative ease,producing the re°ection and transmission operatorsfor the thin layer, then to proceed by doubling the
Optical Properties of Skin and Subcutaneous Tissues 13
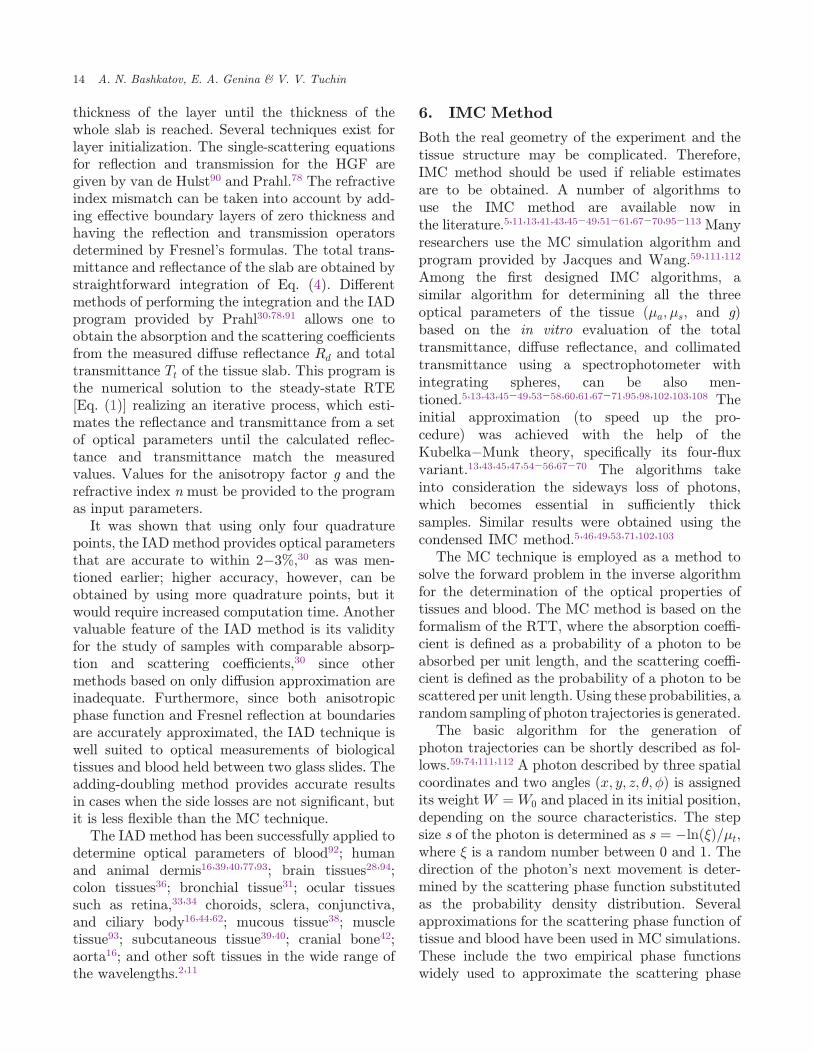
thickness of the layer until the thickness of thewhole slab is reached. Several techniques exist forlayer initialization. The single-scattering equationsfor re°ection and transmission for the HGF aregiven by van de Hulst90 and Prahl.78 The refractiveindex mismatch can be taken into account by add-ing e®ective boundary layers of zero thickness andhaving the re°ection and transmission operatorsdetermined by Fresnel's formulas. The total trans-mittance and re°ectance of the slab are obtained bystraightforward integration of Eq. (4). Di®erentmethods of performing the integration and the IADprogram provided by Prahl30,78,91 allows one toobtain the absorption and the scattering coe±cientsfrom the measured di®use re°ectance Rd and totaltransmittance Tt of the tissue slab. This program isthe numerical solution to the steady-state RTE[Eq. (1)] realizing an iterative process, which esti-mates the re°ectance and transmittance from a setof optical parameters until the calculated re°ec-tance and transmittance match the measuredvalues. Values for the anisotropy factor g and therefractive index n must be provided to the programas input parameters.
It was shown that using only four quadraturepoints, the IAD method provides optical parametersthat are accurate to within 2�3%,30 as was men-tioned earlier; higher accuracy, however, can beobtained by using more quadrature points, but itwould require increased computation time. Anothervaluable feature of the IAD method is its validityfor the study of samples with comparable absorp-tion and scattering coe±cients,30 since othermethods based on only di®usion approximation areinadequate. Furthermore, since both anisotropicphase function and Fresnel re°ection at boundariesare accurately approximated, the IAD technique iswell suited to optical measurements of biologicaltissues and blood held between two glass slides. Theadding-doubling method provides accurate resultsin cases when the side losses are not signi¯cant, butit is less °exible than the MC technique.
The IAD method has been successfully applied todetermine optical parameters of blood92; humanand animal dermis16,39,40,77,93; brain tissues28,94;colon tissues36; bronchial tissue31; ocular tissuessuch as retina,33,34 choroids, sclera, conjunctiva,and ciliary body16,44,62; mucous tissue38; muscletissue93; subcutaneous tissue39,40; cranial bone42;aorta16; and other soft tissues in the wide range ofthe wavelengths.2,11
6. IMC Method
Both the real geometry of the experiment and thetissue structure may be complicated. Therefore,IMC method should be used if reliable estimatesare to be obtained. A number of algorithms touse the IMC method are available now inthe literature.5,11,13,41,43,45�49,51�61,67�70,95�113 Manyresearchers use the MC simulation algorithm andprogram provided by Jacques and Wang.59,111,112
Among the ¯rst designed IMC algorithms, asimilar algorithm for determining all the threeoptical parameters of the tissue ð�a; �s, and g)based on the in vitro evaluation of the totaltransmittance, di®use re°ectance, and collimatedtransmittance using a spectrophotometer withintegrating spheres, can be also men-tioned.5,13,43,45�49,53�58,60,61,67�71,95,98,102,103,108 Theinitial approximation (to speed up the pro-cedure) was achieved with the help of theKubelka�Munk theory, speci¯cally its four-°uxvariant.13,43,45,47,54�56,67�70 The algorithms takeinto consideration the sideways loss of photons,which becomes essential in su±ciently thicksamples. Similar results were obtained using thecondensed IMC method.5,46,49,53,71,102,103
The MC technique is employed as a method tosolve the forward problem in the inverse algorithmfor the determination of the optical properties oftissues and blood. The MC method is based on theformalism of the RTT, where the absorption coe±-cient is de¯ned as a probability of a photon to beabsorbed per unit length, and the scattering coe±-cient is de¯ned as the probability of a photon to bescattered per unit length. Using these probabilities, arandom sampling of photon trajectories is generated.
The basic algorithm for the generation ofphoton trajectories can be shortly described as fol-lows.59,74,111,112 A photon described by three spatialcoordinates and two angles ðx; y; z; �; �Þ is assignedits weight W ¼ W0 and placed in its initial position,depending on the source characteristics. The stepsize s of the photon is determined as s ¼ �lnð�Þ=�t,where � is a random number between 0 and 1. Thedirection of the photon's next movement is deter-mined by the scattering phase function substitutedas the probability density distribution. Severalapproximations for the scattering phase function oftissue and blood have been used in MC simulations.These include the two empirical phase functionswidely used to approximate the scattering phase
14 A. N. Bashkatov, E. A. Genina & V. V. Tuchin
function of tissue and blood, Henyey�Greensteinphase function (HGPF) [see Eq. (2)], the Gegen-bauer kernel phase function (GKPF),113�115 andtheoretical Mie phase function.116 The HGPF hasone parameter g that may be represented as thein¯nite series of Legendre polynomials P 1
nðcos �Þ,
pHGð�Þ ¼1
4�
X1n¼0
ð2nþ 1ÞfnP 1nðcos �Þ; ð9Þ
where fn ¼ gn is the nth order moment of the phasefunction.
The GKPF has two variable parameters, � and g:
pGKð�Þ ¼ K½1þ g2 � 2g cosð�Þ��ð�þ1Þ; ð10Þwhere
K ¼�g��1ð1� g2Þ2�½ð1þ gÞ2� � ð1� gÞ2���1;
� > �1=2; jgj � 1:
The GKPF is a generalization of the HGPF andcan be reduced to HGPF by setting � ¼ 0:5. TheGKPF may be represented as the in¯nite series ofGegenbauer polynomials, C �
n114,115:
pGKð�Þ ¼2K
ð1� g2ÞX1n¼0
1þ n
�
� �C �
n ½cosð�Þ�gn:
ð11ÞThe HGPF and GKPF are widely employed in
radiative transport calculations for the descrip-tion of the single-scattering process in wholeblood56,67�70,74,75,92,113 and tissues5,13,15,16,25,28�49,
53,57�62,77,93�98,100,101,103,106�109,117 because oftheir mathematical simplicity. However, it is clearthat the HGPF and GKPF cannot be used foraccurate calculations of the angular light distri-bution scattered by a single particle. For some cal-culations, theoretical Mie phase function may beuseful116:
pð�Þ ¼ 1
k2r2ðjS1j2 þ jS2j2Þ; ð12Þ
where S1 and S2 are functions of the polar scatteringangle and can be obtained from the Mie theory as
S1ð�Þ ¼X1n¼1
2nþ 1
nðnþ 1Þ fan�nðcos �Þ þ bnnðcos �Þg;
S2ð�Þ ¼X1n¼1
2nþ 1
nðnþ 1Þ fbn�nðcos �Þ þ annðcos �Þg:
ð13Þ
The parameters �n and n represent
�nðcos �Þ ¼ 1
sin �P 1
nðcos �Þ;
nðcos �Þ ¼ d
d�P 1
nðcos �Þ;ð14Þ
where P 1nðcos �Þ is the associated Legendre poly-
nomial. The following recursive relationships areused to calculate �n and n:
�n ¼ 2n� 1
n� 1�n�1 cos ��
n
n� 1�n�2;
n ¼ n�n cos �� ðnþ 1Þ�n�1;
ð15Þ
and the initial values are
�1 ¼ 1; �2 ¼ cos �;
1 ¼ cos �; 2 ¼ 3 cos 2�:
�ð16Þ
The coe±cients an and bn are de¯ned as:
an ¼ nð�Þ 0nðm�Þ �m nðm�Þ 0
nð�Þnð�Þ 0
nðm�Þ �m nðm�Þ 0nð�Þ
bn ¼ m nð�Þ 0nðm�Þ � nðm�Þ 0
nð�Þmnð�Þ 0
nðm�Þ � nðm�Þ 0nð�Þm ¼ np=n0; � ¼ 2�an0=�0
ð17Þ
where a is the radius of spherical particles, �0 is thelight wavelength in vacuum, n; n;
0n, and
0n are
the Riccati�Bessel functions of the ¯rst and secondkind, n0 is the refractive index of the groundmaterial,and np is the refractive index of scattering particles.
For the HGPF, the random scattering angle �HGrnd
is given by
�HGrnd ¼ arccos
1
2g1þ g2 � 1� g2
1� gþ 2g�
� �2
� �� :
ð18ÞFor the GKPF, the random scattering angle �GK
rnd
is determined as113
�GKrnd ¼ arccos ð1þ g2 � 1=
ffiffiffiffiffiffiffiffirnd
�p
Þ=2gh i
; ð19Þ
where rnd ¼ 2�g�=K þ ð1þ gÞ�2�, and � and Kare de¯ned in Eq. (10).
If experimental scattering phase function is knownfor the discrete set of scattering angles �i; fð�Þ ¼fð�iÞ, it can be determined in the total angular rangeusing the spline-interpolation technique. Then,the value of the function Fn ¼ R �n
0fð�Þd� can be
calculated numerically for any value of �n. It is easy
Optical Properties of Skin and Subcutaneous Tissues 15
to see that Fn is a non-decreasing function that ismapping the interval (0, 1). Therefore, when randomvalue � is sampled, � exprnd is determined by settingFn ¼ �.
The Mie phase function can be tabulated andtreated in the same way as the experimental phasefunction.113 In most cases, azimuthal symmetry isassumed. This leads to pð�Þ ¼ 1=2� and, conse-quently, �rnd ¼ 2��. At each step, the photon losespart of its weight due to absorption:W ¼ Wð1� �Þ,where � ¼ �s=�t is the albedo of the medium.
When the photon reaches the boundary, part ofits weight is transmitted according to the Fresnelequations. The amount transmitted through theboundary is added to the re°ectance or transmit-tance. Since the refraction angle is determined bythe Snell's law, the angular distribution of theoutgoing light can be calculated. The photon withthe remaining part of the weight is specularlyre°ected and continues its random walk.
When the photon's weight becomes lower than apredetermined minimal value, the photon can beterminated using the \Russian roulette" pro-cedure.59,60,111,112,118,119 This procedure saves time,since it does not make sense to continue the randomwalk of the photon, which will not essentially con-tribute to the measured signal. On the other hand,it ensures that the energy balance is maintainedthroughout the simulation process.
The MC method has several advantages over theother methods because it may take into accountmismatched medium-glass and glass�air interfaces,losses of light at the edges of the sample, any phasefunction of the medium, and the ¯nite size andarbitrary angular distribution of the incident beam.If the collimated transmittance is measured, thenthe contribution of scattered light into themeasured collimated signal can be accountedfor.11,59,60 The only disadvantage of this method isthe long time needed to ensure good statisticalconvergence, since it is a statistical approach. Thestandard deviation of a quantity (di®use re°ec-tance, transmittance, etc.) approximated by MCtechnique decreases proportionally to 1=
ffiffiffiffiffiN
p, where
N is the total number of launched photons.It is worthy of note that stable operation of the
algorithm was maintained by generation of 105 to5� 105 photons per iteration. Two to ¯ve iterationswere usually necessary to estimate the optical par-ameters with approximately 2% accuracy. Thecomputer time required can be reduced not only by
the condensed IMC method46 but also by means ofgraphical solution of the inverse problem99�101 or bymeans of generating a look-up table5,49,53,71,102,103,105
following a preliminary MC simulation. In the lastcase, a linear or spline interpolations120 between thedata points can be used to improve the accuracy ofthe selection process.
In general, in vivo �a and � 0s values for human
skin proved to be signi¯cantly smaller than thoseobtained in vitro (about 10 and two times, respec-tively).11,46,53,58,95,121,122 For �a, the discrepancymay be attributed to the low sensitivity of thedouble-integrating sphere, and goniometric tech-niques have been applied for in vitro measurementsat weak absorption combined with strong scatteringð�a � �sÞ and the sample preparation methods. For� 0s, the discrepancy may be related to the strong
dependence of the method on variations in therelative refractive index of scatterers and theground medium of the tissue m, � 0
s ðm� 1Þ2,which can be quite di®erent for living and sampledtissue.99,123 The ex vivo measurements using theintegrating sphere technique with correspondingIMC models, and very carefully prepared humantissue samples allow for accurate evaluation of�a and � 0
s, which are very close to in vivomeasurements.13,14,53,58,95,121,122,124
7. Direct Measurement of the
Scattering Phase Function
Direct measurement of the scattering phase func-tion pð�Þ is important for the choice of an adequatemodel for the tissue being examined.5,8,11,74,113,125
The scattering phase function is usually determinedfrom goniophotometric measurements in relativelythin tissue samples.3,5,11,24,32�34,71,92,102,113,126�141
The measured scattering angular dependencecan be approximated either by theHGPF24,32�34,76,128,129,136,138,139 [see Eq. (2)] or by aset of HGPFs, with each function characterizing thetype of scatterers and speci¯c contribution to theangular dependence [see Eq. (9)].11,127 In the limit-ing case of a two-component model of a mediumcontaining large and small (compared with thewavelength) scatterers, the angular dependenceis represented in the form of anisotropic and iso-tropic components.19,24,39,43,102,124,129,132,133,137,139
Other approximating functions are equally useful,e.g., those obtained from the Rayleigh�Gans
16 A. N. Bashkatov, E. A. Genina & V. V. Tuchin
approximation,124 ensuing from the Mie the-ory,96,97,134,138 or a two-parameter GKPF [HGPF isa special simpler case of this phase function, seeEq. (10)].72,113,128 Some of these types of approxi-mations were used to ¯nd the dependence of thescattering anisotropy factor g for dermis and epi-dermis on the wavelengths in the range from 300 to1,300 nm, which proved to coincide fairly well withthe empirical formula,86
ge gd 0:62þ �� 0:29� 10�3; ð20Þon the assumption of a 10% contribution of iso-tropic scattering (at wavelength 633 nm).139 Thewavelength � is given in nanometers. Another formof the spectral dependence of anisotropy factor canbe presented as
gð�Þ ¼ AþBð1� expð�ð�� CÞ=DÞÞ; ð21Þwhere A, B, C, D are some of the empiricalconstants.
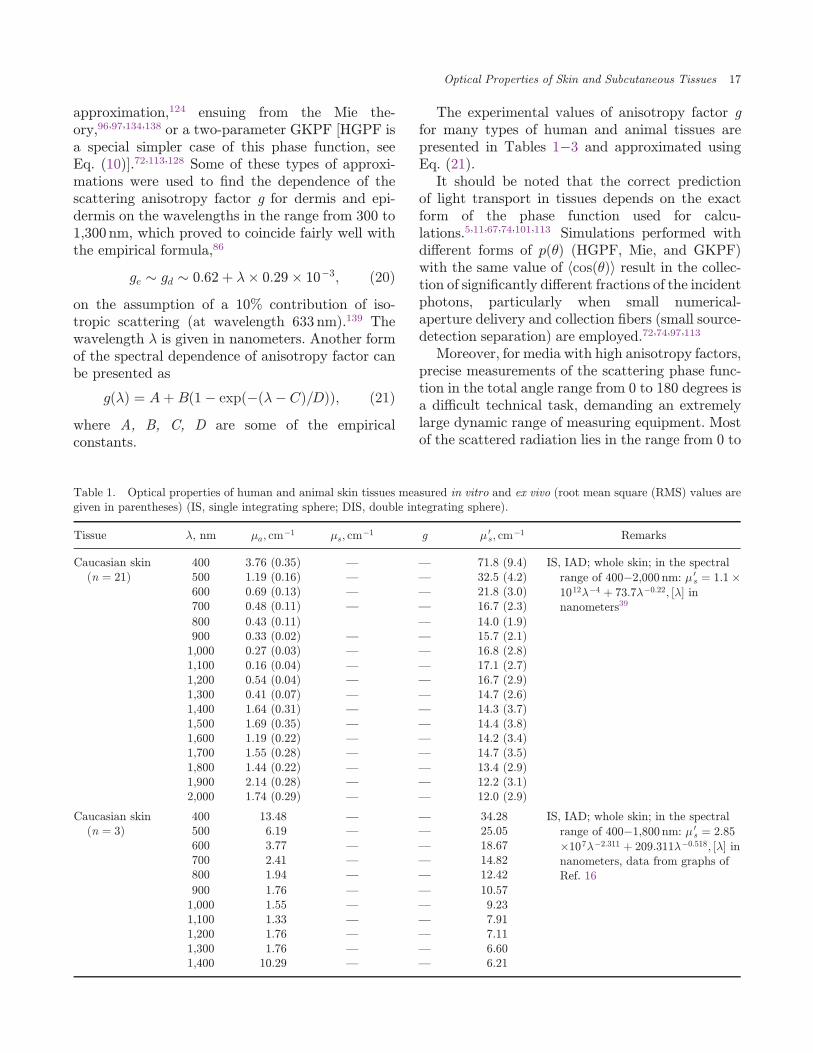
The experimental values of anisotropy factor gfor many types of human and animal tissues arepresented in Tables 1�3 and approximated usingEq. (21).
It should be noted that the correct predictionof light transport in tissues depends on the exactform of the phase function used for calcu-lations.5,11,67,74,101,113 Simulations performed withdi®erent forms of pð�Þ (HGPF, Mie, and GKPF)with the same value of hcosð�Þi result in the collec-tion of signi¯cantly di®erent fractions of the incidentphotons, particularly when small numerical-aperture delivery and collection ¯bers (small source-detection separation) are employed.72,74,97,113
Moreover, for media with high anisotropy factors,precise measurements of the scattering phase func-tion in the total angle range from 0 to 180 degrees isa di±cult technical task, demanding an extremelylarge dynamic range of measuring equipment. Mostof the scattered radiation lies in the range from 0 to
Table 1. Optical properties of human and animal skin tissues measured in vitro and ex vivo (root mean square (RMS) values aregiven in parentheses) (IS, single integrating sphere; DIS, double integrating sphere).
Tissue �, nm �a; cm�1 �s; cm
�1 g � 0s; cm
�1 Remarks
Caucasian skinðn ¼ 21Þ
400 3.76 (0.35) — — 71.8 (9.4) IS, IAD; whole skin; in the spectral
range of 400�2,000 nm: � 0s ¼ 1:1�
1012��4 þ 73:7��0:22; ½�� innanometers39
500 1.19 (0.16) — — 32.5 (4.2)600 0.69 (0.13) — — 21.8 (3.0)700 0.48 (0.11) — — 16.7 (2.3)
800 0.43 (0.11) — 14.0 (1.9)900 0.33 (0.02) — — 15.7 (2.1)1,000 0.27 (0.03) — — 16.8 (2.8)1,100 0.16 (0.04) — — 17.1 (2.7)1,200 0.54 (0.04) — — 16.7 (2.9)1,300 0.41 (0.07) — — 14.7 (2.6)1,400 1.64 (0.31) — — 14.3 (3.7)1,500 1.69 (0.35) — — 14.4 (3.8)1,600 1.19 (0.22) — — 14.2 (3.4)1,700 1.55 (0.28) — — 14.7 (3.5)1,800 1.44 (0.22) — — 13.4 (2.9)1,900 2.14 (0.28) — — 12.2 (3.1)2,000 1.74 (0.29) — — 12.0 (2.9)
Caucasian skinðn ¼ 3Þ
400 13.48 — — 34.28 IS, IAD; whole skin; in the spectral
range of 400�1,800 nm: � 0s ¼ 2:85
�107��2:311 þ 209:311��0:518; ½�� innanometers, data from graphs ofRef. 16
500 6.19 — — 25.05600 3.77 — — 18.67700 2.41 — — 14.82800 1.94 — — 12.42
900 1.76 — — 10.571,000 1.55 — — 9.231,100 1.33 — — 7.911,200 1.76 — — 7.111,300 1.76 — — 6.601,400 10.29 — — 6.21
Optical Properties of Skin and Subcutaneous Tissues 17
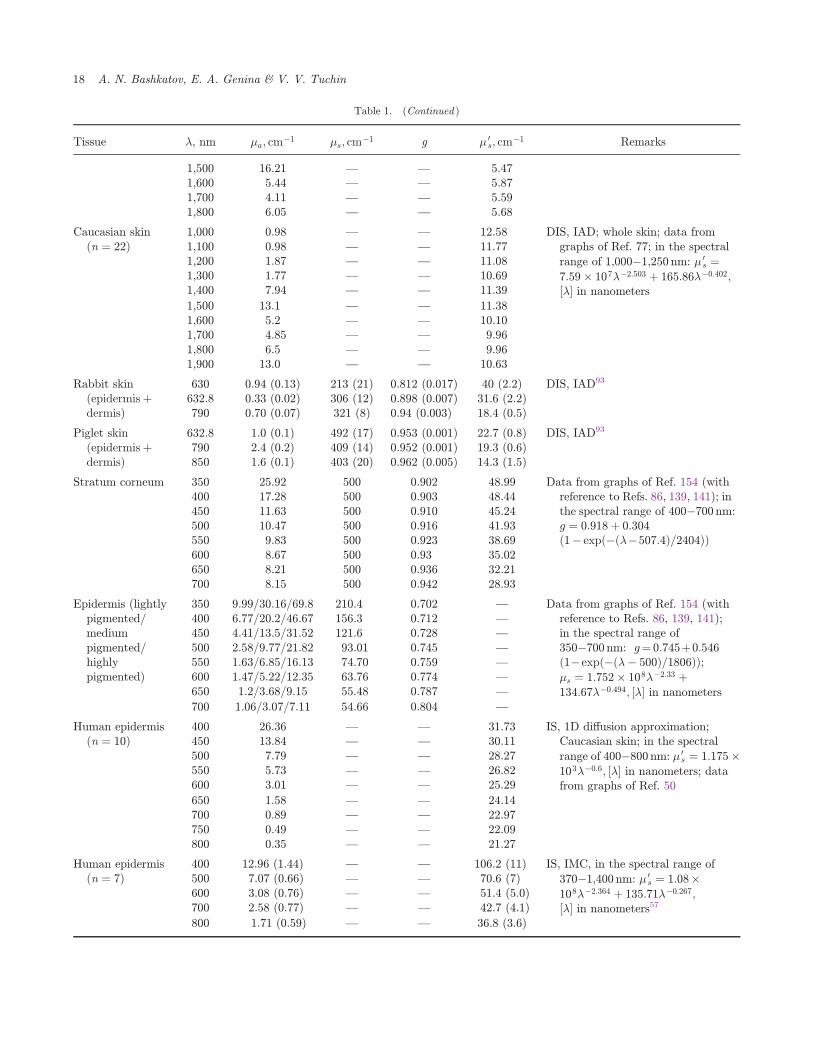
Table 1. (Continued )
Tissue �, nm �a; cm�1 �s; cm
�1 g � 0s; cm
�1 Remarks
1,500 16.21 — — 5.471,600 5.44 — — 5.871,700 4.11 — — 5.591,800 6.05 — — 5.68
Caucasian skinðn ¼ 22Þ
1,000 0.98 — — 12.58 DIS, IAD; whole skin; data fromgraphs of Ref. 77; in the spectral
range of 1,000�1,250 nm: � 0s ¼
7:59� 107��2:503 þ 165:86��0:402;½�� in nanometers
1,100 0.98 — — 11.771,200 1.87 — — 11.081,300 1.77 — — 10.691,400 7.94 — — 11.39
1,500 13.1 — — 11.381,600 5.2 — — 10.101,700 4.85 — — 9.961,800 6.5 — — 9.961,900 13.0 — — 10.63
Rabbit skinðepidermisþdermisÞ
630 0.94 (0.13) 213 (21) 0.812 (0.017) 40 (2.2) DIS, IAD93
632.8 0.33 (0.02) 306 (12) 0.898 (0.007) 31.6 (2.2)790 0.70 (0.07) 321 (8) 0.94 (0.003) 18.4 (0.5)
Piglet skinðepidermisþdermisÞ
632.8 1.0 (0.1) 492 (17) 0.953 (0.001) 22.7 (0.8) DIS, IAD93
790 2.4 (0.2) 409 (14) 0.952 (0.001) 19.3 (0.6)850 1.6 (0.1) 403 (20) 0.962 (0.005) 14.3 (1.5)
Stratum corneum 350 25.92 500 0.902 48.99 Data from graphs of Ref. 154 (withreference to Refs. 86, 139, 141); inthe spectral range of 400�700 nm:g ¼ 0:918þ 0:304ð1� expð�ð��507:4Þ=2404ÞÞ
400 17.28 500 0.903 48.44450 11.63 500 0.910 45.24500 10.47 500 0.916 41.93550 9.83 500 0.923 38.69600 8.67 500 0.93 35.02650 8.21 500 0.936 32.21700 8.15 500 0.942 28.93
Epidermis (lightlypigmented/mediumpigmented/highlypigmented)
350 9.99/30.16/69.8 210.4 0.702 — Data from graphs of Ref. 154 (withreference to Refs. 86, 139, 141);in the spectral range of350�700 nm: g¼ 0:745þ0:546ð1�expð�ð�� 500Þ=1806ÞÞ;�s ¼ 1:752� 108��2:33 þ134:67��0:494; ½�� in nanometers
400 6.77/20.2/46.67 156.3 0.712 —
450 4.41/13.5/31.52 121.6 0.728 —
500 2.58/9.77/21.82 93.01 0.745 —
550 1.63/6.85/16.13 74.70 0.759 —
600 1.47/5.22/12.35 63.76 0.774 —
650 1.2/3.68/9.15 55.48 0.787 —
700 1.06/3.07/7.11 54.66 0.804 —
Human epidermisðn ¼ 10Þ
400 26.36 — — 31.73 IS, 1D di®usion approximation;Caucasian skin; in the spectral
range of 400�800 nm: � 0s ¼ 1:175�
103��0:6; ½�� in nanometers; datafrom graphs of Ref. 50
450 13.84 — — 30.11500 7.79 — — 28.27550 5.73 — — 26.82600 3.01 — — 25.29
650 1.58 — — 24.14700 0.89 — — 22.97750 0.49 — — 22.09800 0.35 — — 21.27
Human epidermisðn ¼ 7Þ
400 12.96 (1.44) — — 106.2 (11) IS, IMC, in the spectral range of
370�1,400 nm: � 0s ¼ 1:08�
108��2:364 þ 135:71��0:267;½�� in nanometers57
500 7.07 (0.66) — — 70.6 (7)600 3.08 (0.76) — — 51.4 (5.0)700 2.58 (0.77) — — 42.7 (4.1)
800 1.71 (0.59) — — 36.8 (3.6)
18 A. N. Bashkatov, E. A. Genina & V. V. Tuchin
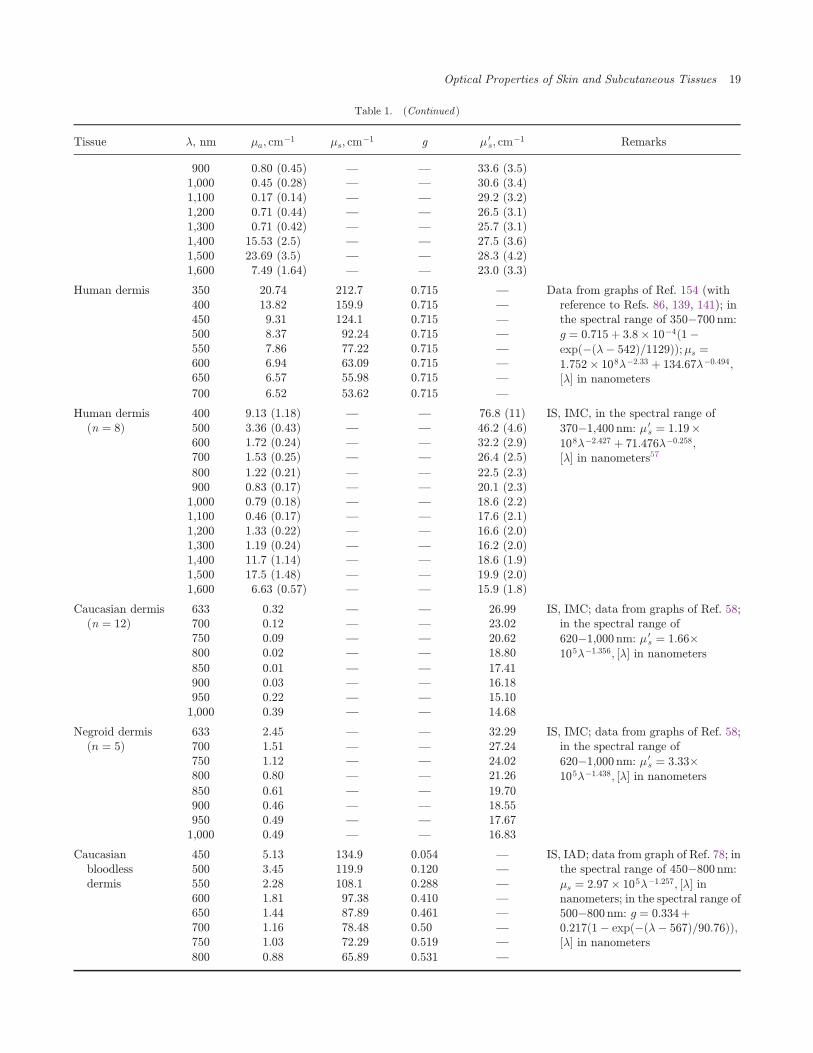
Table 1. (Continued )
Tissue �, nm �a; cm�1 �s; cm
�1 g � 0s; cm
�1 Remarks
900 0.80 (0.45) — — 33.6 (3.5)1,000 0.45 (0.28) — — 30.6 (3.4)1,100 0.17 (0.14) — — 29.2 (3.2)1,200 0.71 (0.44) — — 26.5 (3.1)1,300 0.71 (0.42) — — 25.7 (3.1)1,400 15.53 (2.5) — — 27.5 (3.6)1,500 23.69 (3.5) — — 28.3 (4.2)1,600 7.49 (1.64) — — 23.0 (3.3)
Human dermis 350 20.74 212.7 0.715 — Data from graphs of Ref. 154 (withreference to Refs. 86, 139, 141); inthe spectral range of 350�700 nm:
g ¼ 0:715þ 3:8� 10�4ð1�expð�ð�� 542Þ=1129ÞÞ;�s ¼1:752� 108��2:33 þ 134:67��0:494;½�� in nanometers
400 13.82 159.9 0.715 —
450 9.31 124.1 0.715 —
500 8.37 92.24 0.715 —
550 7.86 77.22 0.715 —
600 6.94 63.09 0.715 —
650 6.57 55.98 0.715 —
700 6.52 53.62 0.715 —
Human dermisðn ¼ 8Þ
400 9.13 (1.18) — — 76.8 (11) IS, IMC, in the spectral range of
370�1,400 nm: � 0s ¼ 1:19�
108��2:427 þ 71:476��0:258;½�� in nanometers57
500 3.36 (0.43) — — 46.2 (4.6)600 1.72 (0.24) — — 32.2 (2.9)700 1.53 (0.25) — — 26.4 (2.5)
800 1.22 (0.21) — — 22.5 (2.3)900 0.83 (0.17) — — 20.1 (2.3)1,000 0.79 (0.18) — — 18.6 (2.2)1,100 0.46 (0.17) — — 17.6 (2.1)1,200 1.33 (0.22) — — 16.6 (2.0)1,300 1.19 (0.24) — — 16.2 (2.0)1,400 11.7 (1.14) — — 18.6 (1.9)1,500 17.5 (1.48) — — 19.9 (2.0)1,600 6.63 (0.57) — — 15.9 (1.8)
Caucasian dermisðn ¼ 12Þ
633 0.32 — — 26.99 IS, IMC; data from graphs of Ref. 58;in the spectral range of
620�1,000 nm: � 0s ¼ 1:66�
105��1:356; ½�� in nanometers
700 0.12 — — 23.02750 0.09 — — 20.62800 0.02 — — 18.80
850 0.01 — — 17.41900 0.03 — — 16.18950 0.22 — — 15.101,000 0.39 — — 14.68
Negroid dermisðn ¼ 5Þ
633 2.45 — — 32.29 IS, IMC; data from graphs of Ref. 58;in the spectral range of
620�1,000 nm: � 0s ¼ 3:33�
105��1:438; ½�� in nanometers
700 1.51 — — 27.24750 1.12 — — 24.02800 0.80 — — 21.26
850 0.61 — — 19.70900 0.46 — — 18.55950 0.49 — — 17.671,000 0.49 — — 16.83
Caucasianbloodlessdermis
450 5.13 134.9 0.054 — IS, IAD; data from graph of Ref. 78; inthe spectral range of 450�800 nm:
�s ¼ 2:97� 105��1:257; ½�� innanometers; in the spectral range of500�800 nm: g ¼ 0:334þ0:217ð1� expð�ð�� 567Þ=90:76ÞÞ;½�� in nanometers
500 3.45 119.9 0.120 —
550 2.28 108.1 0.288 —
600 1.81 97.38 0.410 —
650 1.44 87.89 0.461 —
700 1.16 78.48 0.50 —
750 1.03 72.29 0.519 —
800 0.88 65.89 0.531 —
Optical Properties of Skin and Subcutaneous Tissues 19
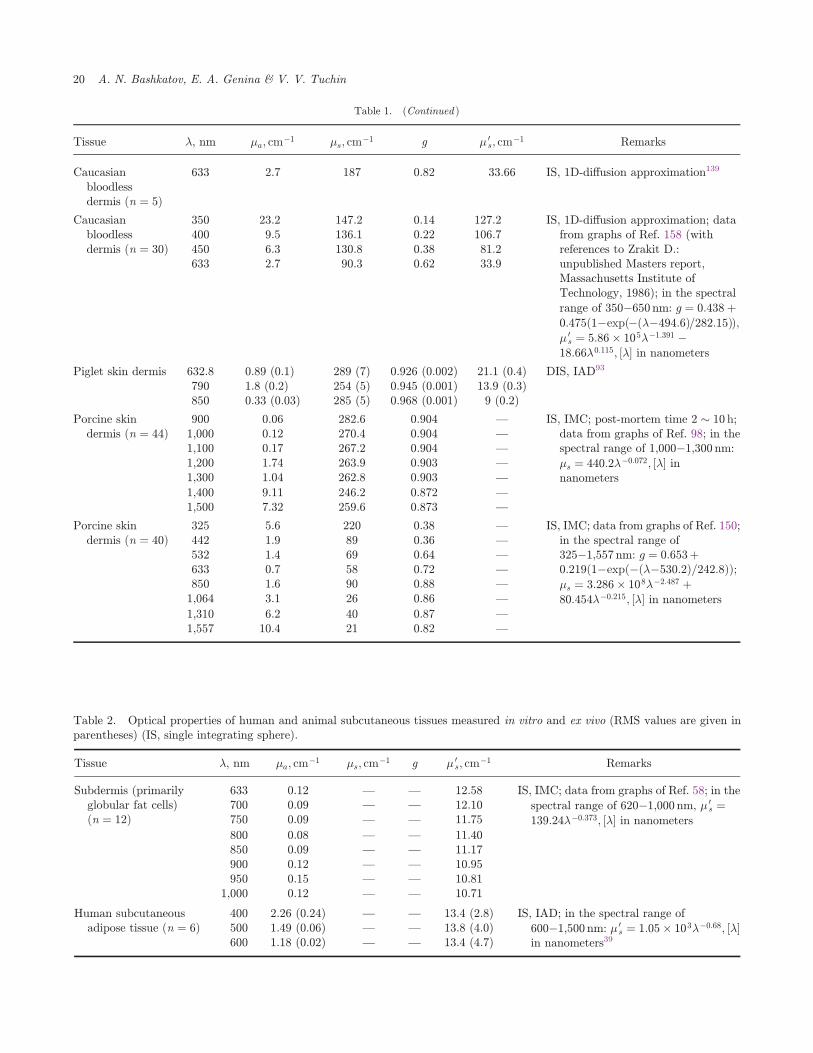
Table 1. (Continued )
Tissue �, nm �a; cm�1 �s; cm
�1 g � 0s; cm
�1 Remarks
Caucasianbloodlessdermis ðn ¼ 5Þ
633 2.7 187 0.82 33.66 IS, 1D-di®usion approximation139
Caucasianbloodlessdermis ðn ¼ 30Þ
350 23.2 147.2 0.14 127.2 IS, 1D-di®usion approximation; datafrom graphs of Ref. 158 (withreferences to Zrakit D.:unpublished Masters report,Massachusetts Institute ofTechnology, 1986); in the spectral
range of 350�650 nm: g ¼ 0:438þ0:475ð1�expð�ð��494:6Þ=282:15ÞÞ;� 0s ¼ 5:86� 105��1:391 �
18:66�0:115; ½�� in nanometers
400 9.5 136.1 0.22 106.7450 6.3 130.8 0.38 81.2633 2.7 90.3 0.62 33.9
Piglet skin dermis 632.8 0.89 (0.1) 289 (7) 0.926 (0.002) 21.1 (0.4) DIS, IAD93
790 1.8 (0.2) 254 (5) 0.945 (0.001) 13.9 (0.3)850 0.33 (0.03) 285 (5) 0.968 (0.001) 9 (0.2)
Porcine skindermis ðn ¼ 44Þ
900 0.06 282.6 0.904 — IS, IMC; post-mortem time 2 10 h;data from graphs of Ref. 98; in thespectral range of 1,000�1,300 nm:
�s ¼ 440:2��0:072; ½�� innanometers
1,000 0.12 270.4 0.904 —
1,100 0.17 267.2 0.904 —
1,200 1.74 263.9 0.903 —
1,300 1.04 262.8 0.903 —
1,400 9.11 246.2 0.872 —
1,500 7.32 259.6 0.873 —
Porcine skindermis ðn ¼ 40Þ
325 5.6 220 0.38 — IS, IMC; data from graphs of Ref. 150;in the spectral range of325�1,557 nm: g ¼ 0:653þ0:219ð1�expð�ð��530:2Þ=242:8ÞÞ;�s ¼ 3:286� 108��2:487 þ80:454��0:215; ½�� in nanometers
442 1.9 89 0.36 —
532 1.4 69 0.64 —
633 0.7 58 0.72 —
850 1.6 90 0.88 —
1,064 3.1 26 0.86 —
1,310 6.2 40 0.87 —
1,557 10.4 21 0.82 —
Table 2. Optical properties of human and animal subcutaneous tissues measured in vitro and ex vivo (RMS values are given inparentheses) (IS, single integrating sphere).
Tissue �, nm �a; cm�1 �s; cm
�1 g � 0s; cm
�1 Remarks
Subdermis (primarilyglobular fat cells)ðn ¼ 12Þ
633 0.12 — — 12.58 IS, IMC; data from graphs of Ref. 58; in the
spectral range of 620�1,000 nm, � 0s ¼
139:24��0:373; ½�� in nanometers
700 0.09 — — 12.10750 0.09 — — 11.75
800 0.08 — — 11.40850 0.09 — — 11.17900 0.12 — — 10.95950 0.15 — — 10.81
1,000 0.12 — — 10.71
Human subcutaneousadipose tissue ðn ¼ 6Þ
400 2.26 (0.24) — — 13.4 (2.8) IS, IAD; in the spectral range of
600�1,500 nm: � 0s ¼ 1:05� 103��0:68; ½��
in nanometers39500 1.49 (0.06) — — 13.8 (4.0)600 1.18 (0.02) — — 13.4 (4.7)
20 A. N. Bashkatov, E. A. Genina & V. V. Tuchin
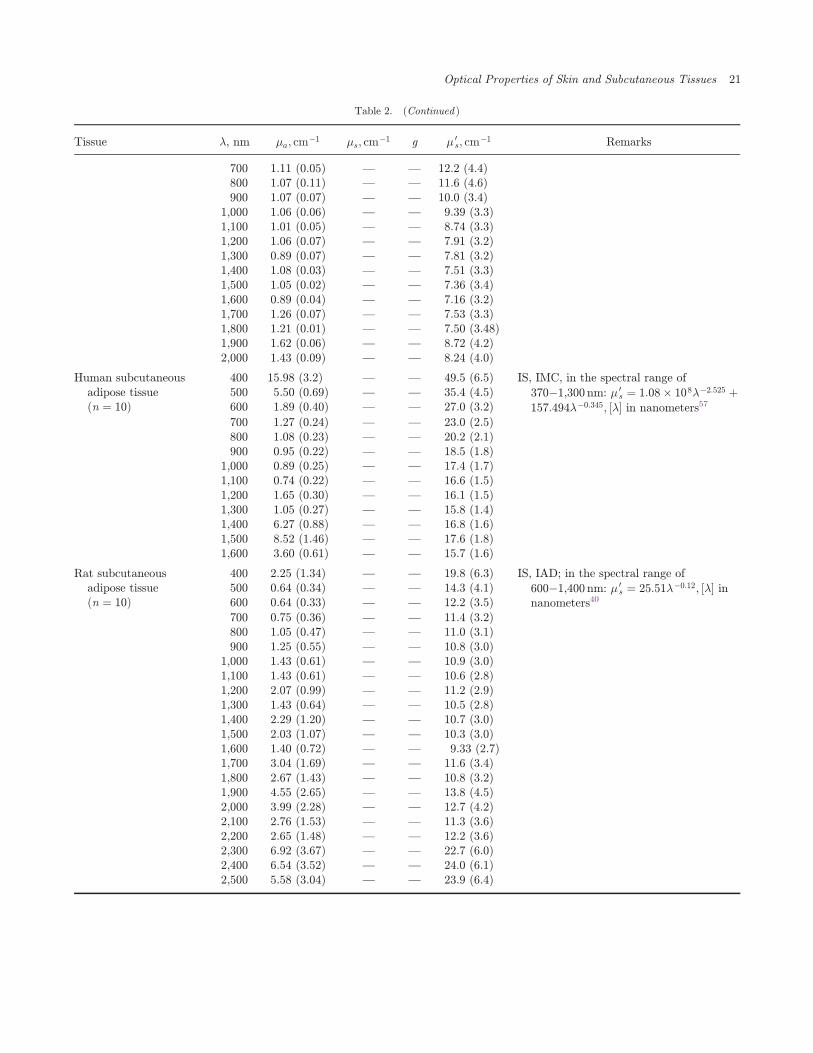
Table 2. (Continued )
Tissue �, nm �a; cm�1 �s; cm
�1 g � 0s; cm
�1 Remarks
700 1.11 (0.05) — — 12.2 (4.4)800 1.07 (0.11) — — 11.6 (4.6)900 1.07 (0.07) — — 10.0 (3.4)
1,000 1.06 (0.06) — — 9.39 (3.3)1,100 1.01 (0.05) — — 8.74 (3.3)1,200 1.06 (0.07) — — 7.91 (3.2)1,300 0.89 (0.07) — — 7.81 (3.2)1,400 1.08 (0.03) — — 7.51 (3.3)1,500 1.05 (0.02) — — 7.36 (3.4)1,600 0.89 (0.04) — — 7.16 (3.2)1,700 1.26 (0.07) — — 7.53 (3.3)1,800 1.21 (0.01) — — 7.50 (3.48)1,900 1.62 (0.06) — — 8.72 (4.2)2,000 1.43 (0.09) — — 8.24 (4.0)
Human subcutaneousadipose tissueðn ¼ 10Þ
400 15.98 (3.2) — — 49.5 (6.5) IS, IMC, in the spectral range of
370�1,300 nm: � 0s ¼ 1:08� 108��2:525 þ
157:494��0:345; ½�� in nanometers57500 5.50 (0.69) — — 35.4 (4.5)600 1.89 (0.40) — — 27.0 (3.2)
700 1.27 (0.24) — — 23.0 (2.5)800 1.08 (0.23) — — 20.2 (2.1)900 0.95 (0.22) — — 18.5 (1.8)
1,000 0.89 (0.25) — — 17.4 (1.7)1,100 0.74 (0.22) — — 16.6 (1.5)1,200 1.65 (0.30) — — 16.1 (1.5)1,300 1.05 (0.27) — — 15.8 (1.4)1,400 6.27 (0.88) — — 16.8 (1.6)1,500 8.52 (1.46) — — 17.6 (1.8)1,600 3.60 (0.61) — — 15.7 (1.6)
Rat subcutaneousadipose tissueðn ¼ 10Þ
400 2.25 (1.34) — — 19.8 (6.3) IS, IAD; in the spectral range of
600�1,400 nm: � 0s ¼ 25:51��0:12; ½�� in
nanometers40500 0.64 (0.34) — — 14.3 (4.1)600 0.64 (0.33) — — 12.2 (3.5)
700 0.75 (0.36) — — 11.4 (3.2)800 1.05 (0.47) — — 11.0 (3.1)900 1.25 (0.55) — — 10.8 (3.0)
1,000 1.43 (0.61) — — 10.9 (3.0)1,100 1.43 (0.61) — — 10.6 (2.8)1,200 2.07 (0.99) — — 11.2 (2.9)1,300 1.43 (0.64) — — 10.5 (2.8)1,400 2.29 (1.20) — — 10.7 (3.0)1,500 2.03 (1.07) — — 10.3 (3.0)1,600 1.40 (0.72) — — 9.33 (2.7)1,700 3.04 (1.69) — — 11.6 (3.4)1,800 2.67 (1.43) — — 10.8 (3.2)1,900 4.55 (2.65) — — 13.8 (4.5)2,000 3.99 (2.28) — — 12.7 (4.2)2,100 2.76 (1.53) — — 11.3 (3.6)2,200 2.65 (1.48) — — 12.2 (3.6)2,300 6.92 (3.67) — — 22.7 (6.0)2,400 6.54 (3.52) — — 24.0 (6.1)2,500 5.58 (3.04) — — 23.9 (6.4)
Optical Properties of Skin and Subcutaneous Tissues 21
30 degrees, counting from the direction of the inci-dent beam. In addition, measurements at anglesclose to 90 degrees are strongly a®ected by scatteringof higher orders, even for the samples of moderateoptical thickness.142
8. Optical Properties of Tissues
The above-discussed methods and techniques weresuccessfully applied for estimation of optical prop-erties of a wide number of tissues. Evidently, manytypes of animal and human tissues may have veryclose optical properties, but some speci¯city isexpected. Early published data on optical propertiesof both human and animal tissues are presentedin Refs. 2, 13�19, 28, 31�44, 47, 50�58, 61�64,
66�84, 86�88, 92�99, 102, 103, 122, 124, 139, 141,143�158.
Measurements of skin and subcutaneous tissuesoptical properties taken in vitro and ex vivo bydi®erent research groups are summarized inTables 1�3. Data presented in the tables re°ect wellthe situation in the ¯eld of the tissue optical par-ameters measurements. It is clearly observed thatmajor attention was paid to investigations of opticalproperties of skin tissues because of great importanceand perspectives of optical tomography of subcu-taneous tumors and optical monitoring and treat-ment of cutaneous diseases. Nevertheless, in general,not many data for optical transport parameters areavailable in the literature. Moreover, these data aredependent on the tissue preparation technique,sample storage procedure, appliedmeasuringmethod
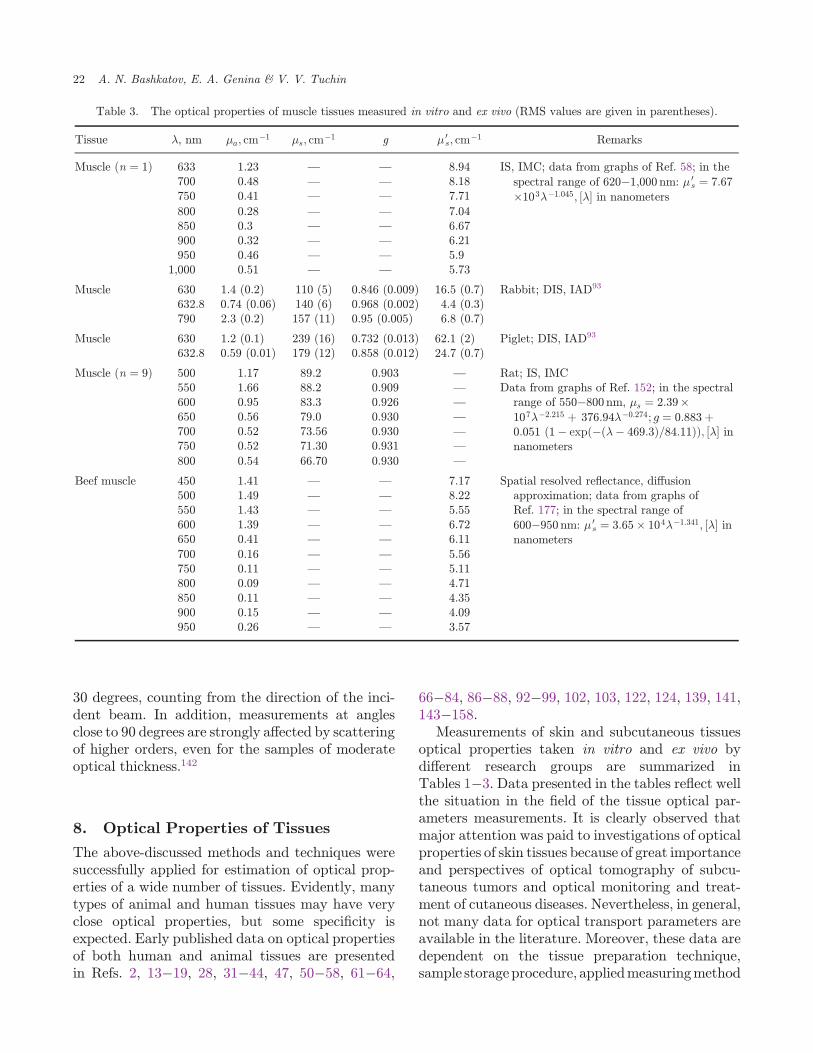
Table 3. The optical properties of muscle tissues measured in vitro and ex vivo (RMS values are given in parentheses).
Tissue �, nm �a; cm�1 �s; cm
�1 g � 0s; cm
�1 Remarks
Muscle ðn ¼ 1Þ 633 1.23 — — 8.94 IS, IMC; data from graphs of Ref. 58; in the
spectral range of 620�1,000 nm: � 0s ¼ 7:67
�103��1:045; ½�� in nanometers
700 0.48 — — 8.18750 0.41 — — 7.71
800 0.28 — — 7.04850 0.3 — — 6.67900 0.32 — — 6.21950 0.46 — — 5.9
1,000 0.51 — — 5.73
Muscle 630 1.4 (0.2) 110 (5) 0.846 (0.009) 16.5 (0.7) Rabbit; DIS, IAD93
632.8 0.74 (0.06) 140 (6) 0.968 (0.002) 4.4 (0.3)790 2.3 (0.2) 157 (11) 0.95 (0.005) 6.8 (0.7)
Muscle 630 1.2 (0.1) 239 (16) 0.732 (0.013) 62.1 (2) Piglet; DIS, IAD93
632.8 0.59 (0.01) 179 (12) 0.858 (0.012) 24.7 (0.7)
Muscle ðn ¼ 9Þ 500 1.17 89.2 0.903 — Rat; IS, IMC550 1.66 88.2 0.909 — Data from graphs of Ref. 152; in the spectral
range of 550�800 nm, �s ¼ 2:39�107��2:215 þ 376:94��0:274; g ¼ 0:883þ0:051 ð1� expð�ð�� 469:3Þ=84:11ÞÞ; ½�� innanometers
600 0.95 83.3 0.926 —
650 0.56 79.0 0.930 —
700 0.52 73.56 0.930 —
750 0.52 71.30 0.931 —
800 0.54 66.70 0.930 —
Beef muscle 450 1.41 — — 7.17 Spatial resolved re°ectance, di®usionapproximation; data from graphs ofRef. 177; in the spectral range of
600�950 nm: � 0s ¼ 3:65� 104��1:341; ½�� in
nanometers
500 1.49 — — 8.22550 1.43 — — 5.55600 1.39 — — 6.72650 0.41 — — 6.11
700 0.16 — — 5.56750 0.11 — — 5.11800 0.09 — — 4.71850 0.11 — — 4.35900 0.15 — — 4.09950 0.26 — — 3.57
22 A. N. Bashkatov, E. A. Genina & V. V. Tuchin
and inverse problem-solving algorithm, measuringinstrumentation noise, and systematic errors.
8.1. Skin tissues optical properties
Skin presents a complex heterogeneous mediumwhere blood and pigment content are spatially dis-tributed variably in depth.159,160 Skin consists ofthree main visible layers from surface: epidermis(100�150�m thick, the blood-free layer), dermis(1�4mm thick, vascularized layer), and subcu-taneous fat (hypodermis or adipose tissue) (from1mm to 6mm thick, depending on the body site).
The randomly inhomogeneous distribution ofblood and various chromophores and pigments inskin produces variations of average optical proper-ties of skin layers. Nonetheless, it is possible to de¯nethe regions in the skin, where the gradient of skincells structure, chromophores, or blood amountschanging with a depth equals roughly zero.161 Thisallows subdividing these layers into sublayersregarding the physiological nature, physical andoptical properties of their cells, and pigments con-tent. The epidermis can be subdivided into the twosublayers: non-living and living epidermis, andconsist of four distinct cell types: keratinocytes(produce keratin), melanocytes (produce melanin),Langerhans cells, andMerkel cells. The predominantcells are the keratinocytes and they are arranged in¯ve strata: the stratum corneum, stratum lucidum,stratum granulosum, stratum spinosum, and stra-tum basale. The non-living epidermis or stratumcorneum ( 20 �m thick) consists of only deadsquamous cells, which are highly keratinized witha high lipid ð 20%Þ and protein ð 60%Þ content,and has a relatively low ð 20%Þ water con-tent.159�162 Living epidermis ( 100 �m thick)contains most of the skin pigmentation, mainlymelanin, which is produced in the melanocytesoccurring in the stratum basale, and it is found inmembranous particles called melanosomes.163 Thereare two types of this pigment: the red/yellowphaeomelanin and a brown/back eumelanin.163 Theratio between the concentration of phaeomelaninand eumelanin present in human skin varies fromindividual to individual, with much overlap betweenskin types. Parsad et al.164 reported the valuesbetween 0.049 and 0.36. The melanin absorptionlevel depends on how many melanosomes per unitvolume are in epidermis. The volume fraction of the
epidermis occupied by melanosomes varies from1.3% (lightly pigmented specimens) to 43% (darklypigmented specimens).19 A basal lamina separatesthe epidermis from the dermis.
Dermis is a vascularized layer and the mainabsorbers in the visible spectral range are the bloodhemoglobin, -carotene (0:22�0:63 nmol=g165) andbilirubin. In the IR spectral range, absorptionproperties of skin dermis are de¯ned by absorptionof water. The scattering properties of the dermis aremainly de¯ned by the ¯brous structure of the tissue,where collagen ¯brils are packed in collagen bundlesand have lamellae structure. The light scatters onboth single ¯brils and scattering centers, which areformed by the interlacement of the collagen ¯brilsand bundles. The dermis consists of two structurallydi®erent layers, papillary and reticular, which di®erprincipally by the size of collagen ¯bers and bloodcontent. The small size of the collagen ¯bers in thepapillary dermis (diameter of an order of magnitudeless than visible light wavelength) makes this layerhighly backscattering. Within the reticular dermis,the large size of collagen ¯ber bundles causes highlyforward-directed scattering. Thus, any light whichreaches this layer is passed on deeper into the skinand contributes to some extent to the spectrumre°ected from the skin.166 The blood volume frac-tion in the skin varies from 0.2%19 to 4%.167 Thevolume fraction of water in the dermis is estimatedas 70%,77 75%,168 65%,169 and 65.1�75.8%,170
which, on average, yields 70:2 5:2%. To sum up,the average scattering properties of the skin arede¯ned by the scattering properties of the dermisbecause of relatively big thickness of the layer (up to4mm) and comparable scattering coe±cients of theepidermis and the reticular dermis. Absorption ofhemoglobin and water of skin dermis, and melaninand lipids of skin epidermis de¯ne absorptionproperties of the whole skin.
The in vitro and ex vivo skin tissues' opticalproperties have been measured with integratingsphere technique in the visible and NIR spectralranges16,39,50,57,58,77,78,86,93,98,139,141,150,154,158 and theresults are summarized in Table 1.
8.2. Subcutaneous adipose tissue
optical properties
The subcutaneous adipose tissue is formed byaggregation of fat cells (adipocytes) containing
Optical Properties of Skin and Subcutaneous Tissues 23
stored fat (lipids) in the form of a number of smalldroplets for lean or normal humans and a few oreven single big drop in each cell for obese humans;and the lipids are mostly presented by triglycer-ides.171,172 The diameters of the adipocytes are inthe ranges from 15 �m to 250 �m173 and their meandiameter varied from 50 �m171 to 120 �m.172 In thespaces between the cells, there are blood capillaries(arterial and venous plexus), nerves, and reticular¯brils connecting each cell and providing metabolicactivity of fat tissue.171,172 Absorption of the humanadipose tissue is de¯ned by absorption of hemo-globin, lipids, and water (10:9 1:4%Þ.174 Themain scatterers of adipose tissue are spherical dro-plets of lipids, which are uniformly distributedwithin adipocytes.
The adipose tissue optical properties have beenmeasured with integrating sphere technique in thevisible and NIR spectral ranges39,40,57,58 and theresults are summarized in Table 2.
8.3. Muscle optical properties
Muscle is one of the most abundant tissues in thehuman body and knowledge of its optical propertiesis very important for therapeutic and diagnosticapplications. It is well understood that muscle ismade up of individual components known as muscle¯bers. These ¯bers are made from myo¯brils, whichare long cylinders of about 1�2�m diameter.175 Theterm \muscle" refers to multiple bundles of muscle¯bers held together by connective tissue. The gapamong themyo¯brils is full of sarcoplasma consistingof cellular organelles. Absorption of the muscle tissueis de¯ned by absorption of hemoglobin and water(52:0 0:3%174 or 73 0:5%176). The optical prop-erties of muscle tissue have been measured in thevisible and NIR spectral ranges58,93,152,177 and thesedata are summarized in Table 3.
9. Refractive Index Measurements
Measuring refractive indices in tissues and theirconstituent components is an important focus ofinterest in tissue optics because the index of refrac-tion determines light re°ection and refraction at theinterfaces between air and tissue, detecting ¯ber andtissue, and tissue layers; it also strongly in°uenceslight propagation and distribution within tissues,
de¯nes the speed of light in tissue, and governs howthe photons migrate.3,4,7�11,19,21,111,115,116 Althoughthese studies have a rather long history, the meanvalues of refractive indices for many tissues aremissing in the literature. According to Ref. 11, mostof them have refractive indices for visible light in the1.335�1.620 range (e.g. 1.55 in the stratum corneum,1.620 in enamel, and 1.386 at the lens surface). It isworthwhile noting that in vitro and in vivomeasurements may di®er signi¯cantly. For example,the refractive index in rat mesenteric tissue in vitrowas found to be 1.52 compared with only 1.38 in thein vivo study. This di®erence can be accounted by thedecreased refractivity of ground matter, n0, due toimpaired hydration. Indeed, the optical properties oftissues, including refractive indices, are known todepend on water content. The refractive indices ofwater over a broad wavelength range from 200 nm to200 �m have been reported in Ref. 178.
To model tissue by a mixture of water and a bio-organic compound of a tissue is more adequate. Forinstance, the refractive index of human skin can beapproximated by a 70/30 mixture of water andprotein.77 Assuming that a protein has a constantrefractive index value of 1.5 over the entire wave-length range, the authors of Ref. 77 have suggestedthe following expression for estimation of skin indexof refraction:
nskinð�Þ ¼ 0:7ð1:58� 8:45� 10�4�þ 1:1� 10�6�2
� 7:19� 10�10�3 þ 2:32� 10�13�4
� 2:98� 10�17�5Þ þ 0:3� 1:5; ð22Þwhere wavelength � is in nanometers.For di®erent parts of a biological cell, values of
refractive index in the NIR range can be estimated asfollows: extracellular °uid, n ¼ 1:35�1:36; cyto-plasm, 1.360�1.375; cell membrane, 1.46; nucleus,1.38�1.41; mitochondria and organelles, 1.38�1.41;and melanin, 1.6�1.7.11,146,147 Scattering arises frommismatches in refractive index of the componentsthatmake up the cell.Organelles and subcomponentsof organelles having refractive indices di®erent fromtheir surroundings are expected to be the primarysources of cellular scattering. In tissueswhere cells aresurrounded by other cells or tissue structures ofsimilar index, certain organelles become the import-ant scatterers.9�11 Mitochondria (0:5�1:5�m in di-ameter), lysosomes ð0:5�mÞ, and peroxisomesð0:5�mÞ are very important scatterers whose size,relative to the wavelength of light, suggests that
24 A. N. Bashkatov, E. A. Genina & V. V. Tuchin
they must make a signi¯cant contribution to back-scattering. Granular melanin, traditionally thoughtof as an absorber, must be considered an importantscatterer because of its size and high refractiveindex.32,41,179 Structures consisting of membranelayers, such as the endoplasmic reticulum or Golgiapparatus, may prove signi¯cant because they con-tain index °uctuations of high spatial frequency andamplitude. Besides cell components, ¯brous tissuestructures such as collagen and elastin ¯bers must beconsidered as important scatterers.
Refractivity measurements in a number ofstrongly scattering tissues at 633 nm performed witha ¯ber-optic refractometer.180 The method is basedon a simple concept: that the cone of light originatingfrom an optical ¯ber is dependent on the refractiveindices of the cladding material, core material(quartz), and air into which the cone of light emer-ges. The cladding on a 1mm-core-diameter optical¯ber was stripped from the ¯ber, and the tissue forwhich the index is to bemeasured was substituted forthe cladding. With the index for air ðn0Þ and thequartz ¯ber ðnqÞ known, along with the emittedangular light distribution ð�Þmeasured at the optical¯ber's output, the following equation for the deter-mination of tissue index of refraction ðnÞ can be de-rived from the expression for the ¯ber numericalaperture (NA)180:
n ¼ ðn2q � ½n0 sin ��2Þ1=2: ð23Þ
Using this simple and sensitive technique, it wasfound that fatty tissue has the largest refractiveindex (1.455), followed by kidney (1.418), musculartissue (1.41), and then blood and spleen (1.4).180 Thelowest refractive indices were found in lungs and liver(1.38 and 1.368, respectively).180
The principle of total internal re°ection at laserbeam irradiation is also used for tissue and bloodrefraction measurements.181,182 A thin tissue sampleis sandwiched between two right-angled prisms thatare made of ZF5 glass with a high refractive index,n0 ¼ 1:70827, and angle, � ¼ 29�55 041:4 00. For anincident laser beam polarized in the S-plane, forthe determination of the mean refractive index oftissues, Eq. (24) is valid:181
n ¼ sin it � cos�þ sin�� ½n20 � sin2it�1=2 ð24Þ
where the incident angle of total re°ectance it is ameasurable parameter.
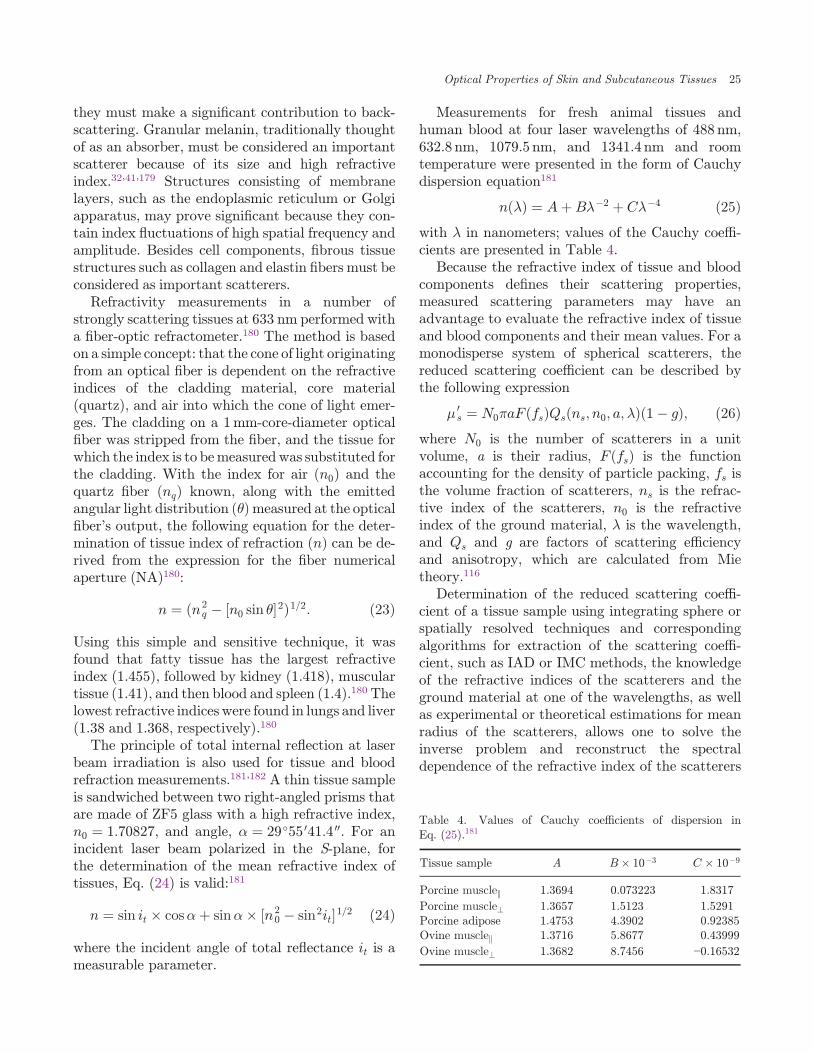
Measurements for fresh animal tissues andhuman blood at four laser wavelengths of 488 nm,632.8 nm, 1079.5 nm, and 1341.4 nm and roomtemperature were presented in the form of Cauchydispersion equation181
nð�Þ ¼ AþB��2 þ C��4 ð25Þwith � in nanometers; values of the Cauchy coe±-cients are presented in Table 4.
Because the refractive index of tissue and bloodcomponents de¯nes their scattering properties,measured scattering parameters may have anadvantage to evaluate the refractive index of tissueand blood components and their mean values. For amonodisperse system of spherical scatterers, thereduced scattering coe±cient can be described bythe following expression
� 0s ¼ N0�aF ðfsÞQsðns;n0; a; �Þð1� gÞ; ð26Þ
where N0 is the number of scatterers in a unitvolume, a is their radius, F ðfsÞ is the functionaccounting for the density of particle packing, fs isthe volume fraction of scatterers, ns is the refrac-tive index of the scatterers, n0 is the refractiveindex of the ground material, � is the wavelength,and Qs and g are factors of scattering e±ciencyand anisotropy, which are calculated from Mietheory.116
Determination of the reduced scattering coe±-cient of a tissue sample using integrating sphere orspatially resolved techniques and correspondingalgorithms for extraction of the scattering coe±-cient, such as IAD or IMC methods, the knowledgeof the refractive indices of the scatterers and theground material at one of the wavelengths, as wellas experimental or theoretical estimations for meanradius of the scatterers, allows one to solve theinverse problem and reconstruct the spectraldependence of the refractive index of the scatterers
Table 4. Values of Cauchy coe±cients of dispersion inEq. (25).181
Tissue sample A B� 10�3 C � 10�9
Porcine musclejj 1.3694 0.073223 1.8317
Porcine muscle? 1.3657 1.5123 1.5291Porcine adipose 1.4753 4.3902 0.92385Ovine musclejj 1.3716 5.8677 0.43999
Ovine muscle? 1.3682 8.7456 −0.16532
Optical Properties of Skin and Subcutaneous Tissues 25
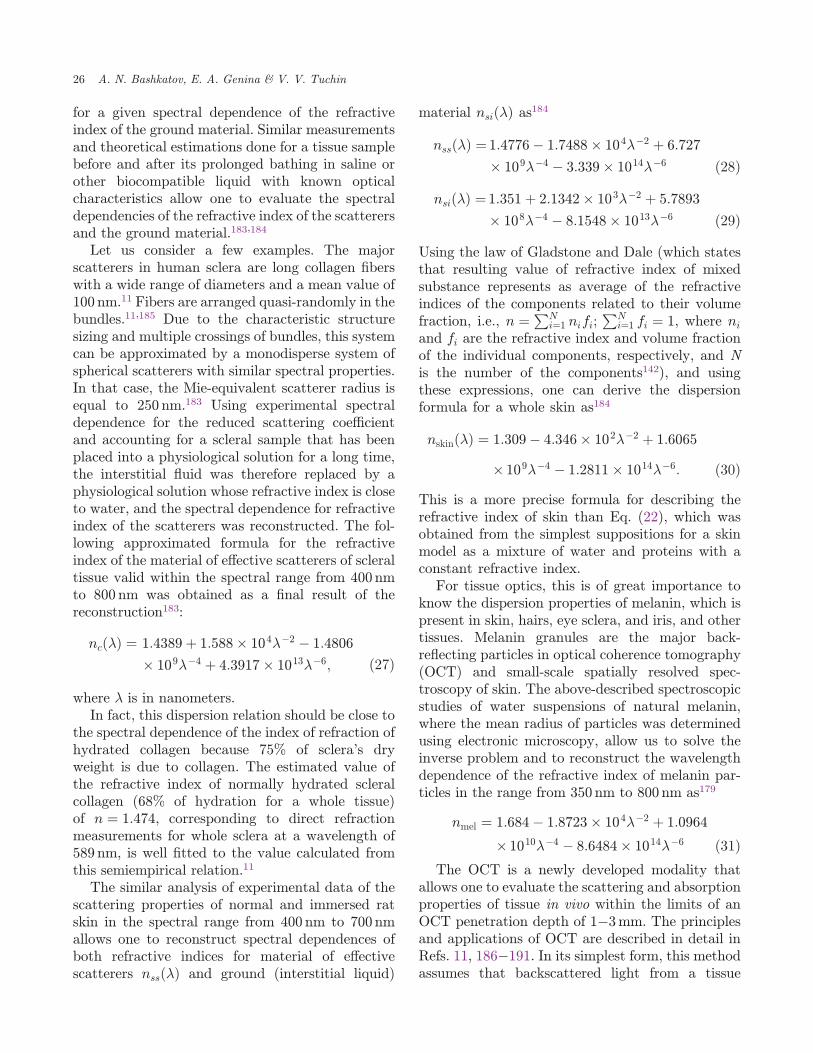
for a given spectral dependence of the refractiveindex of the ground material. Similar measurementsand theoretical estimations done for a tissue samplebefore and after its prolonged bathing in saline orother biocompatible liquid with known opticalcharacteristics allow one to evaluate the spectraldependencies of the refractive index of the scatterersand the ground material.183,184
Let us consider a few examples. The majorscatterers in human sclera are long collagen ¯berswith a wide range of diameters and a mean value of100 nm.11 Fibers are arranged quasi-randomly in thebundles.11,185 Due to the characteristic structuresizing and multiple crossings of bundles, this systemcan be approximated by a monodisperse system ofspherical scatterers with similar spectral properties.In that case, the Mie-equivalent scatterer radius isequal to 250 nm.183 Using experimental spectraldependence for the reduced scattering coe±cientand accounting for a scleral sample that has beenplaced into a physiological solution for a long time,the interstitial °uid was therefore replaced by aphysiological solution whose refractive index is closeto water, and the spectral dependence for refractiveindex of the scatterers was reconstructed. The fol-lowing approximated formula for the refractiveindex of the material of e®ective scatterers of scleraltissue valid within the spectral range from 400 nmto 800 nm was obtained as a ¯nal result of thereconstruction183:
ncð�Þ ¼ 1:4389þ 1:588� 104��2 � 1:4806
� 109��4 þ 4:3917� 1013��6; ð27Þ
where � is in nanometers.In fact, this dispersion relation should be close to
the spectral dependence of the index of refraction ofhydrated collagen because 75% of sclera's dryweight is due to collagen. The estimated value ofthe refractive index of normally hydrated scleralcollagen (68% of hydration for a whole tissue)of n ¼ 1:474, corresponding to direct refractionmeasurements for whole sclera at a wavelength of589 nm, is well ¯tted to the value calculated fromthis semiempirical relation.11
The similar analysis of experimental data of thescattering properties of normal and immersed ratskin in the spectral range from 400 nm to 700 nmallows one to reconstruct spectral dependences ofboth refractive indices for material of e®ectivescatterers nssð�Þ and ground (interstitial liquid)
material nsið�Þ as184
nssð�Þ ¼ 1:4776� 1:7488� 104��2 þ 6:727
� 109��4 � 3:339� 1014��6 ð28Þ
nsið�Þ ¼ 1:351þ 2:1342� 103��2 þ 5:7893
� 108��4 � 8:1548� 1013��6 ð29ÞUsing the law of Gladstone and Dale (which statesthat resulting value of refractive index of mixedsubstance represents as average of the refractiveindices of the components related to their volumefraction, i.e., n ¼ PN
i¼1 nifi;PN
i¼1 fi ¼ 1, where ni
and fi are the refractive index and volume fractionof the individual components, respectively, and Nis the number of the components142), and usingthese expressions, one can derive the dispersionformula for a whole skin as184
nskinð�Þ ¼ 1:309� 4:346� 102��2 þ 1:6065
� 109��4 � 1:2811� 1014��6: ð30ÞThis is a more precise formula for describing therefractive index of skin than Eq. (22), which wasobtained from the simplest suppositions for a skinmodel as a mixture of water and proteins with aconstant refractive index.
For tissue optics, this is of great importance toknow the dispersion properties of melanin, which ispresent in skin, hairs, eye sclera, and iris, and othertissues. Melanin granules are the major back-re°ecting particles in optical coherence tomography(OCT) and small-scale spatially resolved spec-troscopy of skin. The above-described spectroscopicstudies of water suspensions of natural melanin,where the mean radius of particles was determinedusing electronic microscopy, allow us to solve theinverse problem and to reconstruct the wavelengthdependence of the refractive index of melanin par-ticles in the range from 350 nm to 800 nm as179
nmel ¼ 1:684� 1:8723� 104��2 þ 1:0964
� 1010��4 � 8:6484� 1014��6 ð31ÞThe OCT is a newly developed modality that
allows one to evaluate the scattering and absorptionproperties of tissue in vivo within the limits of anOCT penetration depth of 1�3mm. The principlesand applications of OCT are described in detail inRefs. 11, 186�191. In its simplest form, this methodassumes that backscattered light from a tissue
26 A. N. Bashkatov, E. A. Genina & V. V. Tuchin
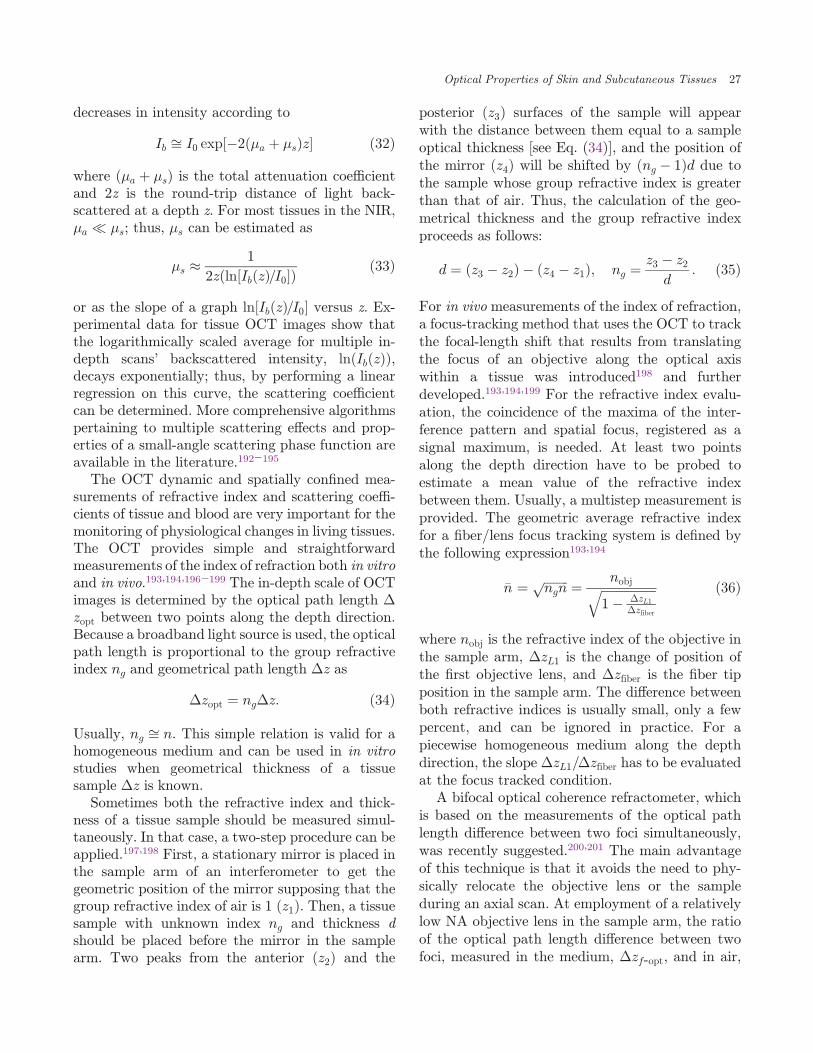
decreases in intensity according to
Ib ffi I0 exp½�2ð�a þ �sÞz� ð32Þ
where ð�a þ �sÞ is the total attenuation coe±cientand 2z is the round-trip distance of light back-scattered at a depth z. For most tissues in the NIR,�a � �s; thus, �s can be estimated as
�s �1
2zðln½IbðzÞ=I0�Þð33Þ
or as the slope of a graph ln½IbðzÞ=I0� versus z. Ex-perimental data for tissue OCT images show thatthe logarithmically scaled average for multiple in-depth scans' backscattered intensity, lnðIbðzÞÞ,decays exponentially; thus, by performing a linearregression on this curve, the scattering coe±cientcan be determined. More comprehensive algorithmspertaining to multiple scattering e®ects and prop-erties of a small-angle scattering phase function areavailable in the literature.192�195
The OCT dynamic and spatially con¯ned mea-surements of refractive index and scattering coe±-cients of tissue and blood are very important for themonitoring of physiological changes in living tissues.The OCT provides simple and straightforwardmeasurements of the index of refraction both in vitroand in vivo.193,194,196�199 The in-depth scale of OCTimages is determined by the optical path length �zopt between two points along the depth direction.Because a broadband light source is used, the opticalpath length is proportional to the group refractiveindex ng and geometrical path length �z as
�zopt ¼ ng�z: ð34Þ
Usually, ng ffi n. This simple relation is valid for ahomogeneous medium and can be used in in vitrostudies when geometrical thickness of a tissuesample �z is known.
Sometimes both the refractive index and thick-ness of a tissue sample should be measured simul-taneously. In that case, a two-step procedure can beapplied.197,198 First, a stationary mirror is placed inthe sample arm of an interferometer to get thegeometric position of the mirror supposing that thegroup refractive index of air is 1 ðz1Þ. Then, a tissuesample with unknown index ng and thickness dshould be placed before the mirror in the samplearm. Two peaks from the anterior ðz2Þ and the
posterior ðz3Þ surfaces of the sample will appearwith the distance between them equal to a sampleoptical thickness [see Eq. (34)], and the position ofthe mirror ðz4Þ will be shifted by ðng � 1Þd due tothe sample whose group refractive index is greaterthan that of air. Thus, the calculation of the geo-metrical thickness and the group refractive indexproceeds as follows:
d ¼ ðz3 � z2Þ � ðz4 � z1Þ; ng ¼z3 � z2
d: ð35Þ
For in vivo measurements of the index of refraction,a focus-tracking method that uses the OCT to trackthe focal-length shift that results from translatingthe focus of an objective along the optical axiswithin a tissue was introduced198 and furtherdeveloped.193,194,199 For the refractive index evalu-ation, the coincidence of the maxima of the inter-ference pattern and spatial focus, registered as asignal maximum, is needed. At least two pointsalong the depth direction have to be probed toestimate a mean value of the refractive indexbetween them. Usually, a multistep measurement isprovided. The geometric average refractive indexfor a ¯ber/lens focus tracking system is de¯ned bythe following expression193,194
�n ¼ ffiffiffiffiffiffiffiffingn
p ¼ nobjffiffiffiffiffiffiffiffiffiffiffiffiffiffiffiffiffiffi1� �zL1
�zfiber
q ð36Þ
where nobj is the refractive index of the objective inthe sample arm, �zL1 is the change of position ofthe ¯rst objective lens, and �zfiber is the ¯ber tipposition in the sample arm. The di®erence betweenboth refractive indices is usually small, only a fewpercent, and can be ignored in practice. For apiecewise homogeneous medium along the depthdirection, the slope �zL1=�zfiber has to be evaluatedat the focus tracked condition.
A bifocal optical coherence refractometer, whichis based on the measurements of the optical pathlength di®erence between two foci simultaneously,was recently suggested.200,201 The main advantageof this technique is that it avoids the need to phy-sically relocate the objective lens or the sampleduring an axial scan. At employment of a relativelylow NA objective lens in the sample arm, the ratioof the optical path length di®erence between twofoci, measured in the medium, �zf-opt, and in air,
Optical Properties of Skin and Subcutaneous Tissues 27
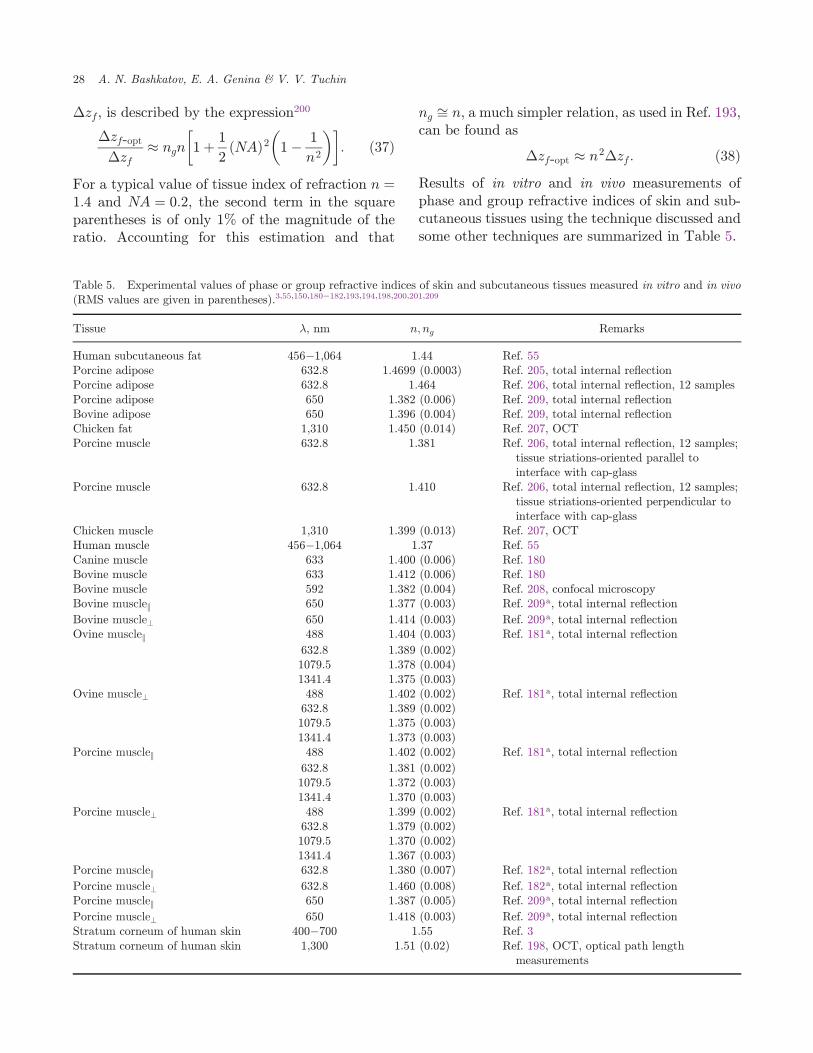
�zf , is described by the expression200
�zf-opt�zf
� ngn 1þ 1
2ðNAÞ2 1� 1
n2
� �� �: ð37Þ
For a typical value of tissue index of refraction n ¼1:4 and NA ¼ 0:2, the second term in the squareparentheses is of only 1% of the magnitude of theratio. Accounting for this estimation and that
ng ffi n, a much simpler relation, as used in Ref. 193,can be found as
�zf-opt � n2�zf : ð38ÞResults of in vitro and in vivo measurements ofphase and group refractive indices of skin and sub-cutaneous tissues using the technique discussed andsome other techniques are summarized in Table 5.
Table 5. Experimental values of phase or group refractive indices of skin and subcutaneous tissues measured in vitro and in vivo(RMS values are given in parentheses).3,55,150,180�182,193,194,198,200,201,209
Tissue �, nm n;ng Remarks
Human subcutaneous fat 456�1,064 1.44 Ref. 55Porcine adipose 632.8 1.4699 (0.0003) Ref. 205, total internal re°ectionPorcine adipose 632.8 1.464 Ref. 206, total internal re°ection, 12 samplesPorcine adipose 650 1.382 (0.006) Ref. 209, total internal re°ectionBovine adipose 650 1.396 (0.004) Ref. 209, total internal re°ectionChicken fat 1,310 1.450 (0.014) Ref. 207, OCTPorcine muscle 632.8 1.381 Ref. 206, total internal re°ection, 12 samples;
tissue striations-oriented parallel tointerface with cap-glass
Porcine muscle 632.8 1.410 Ref. 206, total internal re°ection, 12 samples;tissue striations-oriented perpendicular tointerface with cap-glass
Chicken muscle 1,310 1.399 (0.013) Ref. 207, OCTHuman muscle 456�1,064 1.37 Ref. 55Canine muscle 633 1.400 (0.006) Ref. 180Bovine muscle 633 1.412 (0.006) Ref. 180Bovine muscle 592 1.382 (0.004) Ref. 208, confocal microscopyBovine musclejj 650 1.377 (0.003) Ref. 209a, total internal re°ection
Bovine muscle? 650 1.414 (0.003) Ref. 209a, total internal re°ectionOvine musclejj 488 1.404 (0.003) Ref. 181a, total internal re°ection
632.8 1.389 (0.002)1079.5 1.378 (0.004)1341.4 1.375 (0.003)
Ovine muscle? 488 1.402 (0.002) Ref. 181a, total internal re°ection632.8 1.389 (0.002)1079.5 1.375 (0.003)1341.4 1.373 (0.003)
Porcine musclejj 488 1.402 (0.002) Ref. 181a, total internal re°ection
632.8 1.381 (0.002)1079.5 1.372 (0.003)1341.4 1.370 (0.003)
Porcine muscle? 488 1.399 (0.002) Ref. 181a, total internal re°ection632.8 1.379 (0.002)1079.5 1.370 (0.002)1341.4 1.367 (0.003)
Porcine musclejj 632.8 1.380 (0.007) Ref. 182a, total internal re°ection
Porcine muscle? 632.8 1.460 (0.008) Ref. 182a, total internal re°ectionPorcine musclejj 650 1.387 (0.005) Ref. 209a, total internal re°ection
Porcine muscle? 650 1.418 (0.003) Ref. 209a, total internal re°ectionStratum corneum of human skin 400�700 1.55 Ref. 3Stratum corneum of human skin 1,300 1.51 (0.02) Ref. 198, OCT, optical path length
measurements
28 A. N. Bashkatov, E. A. Genina & V. V. Tuchin
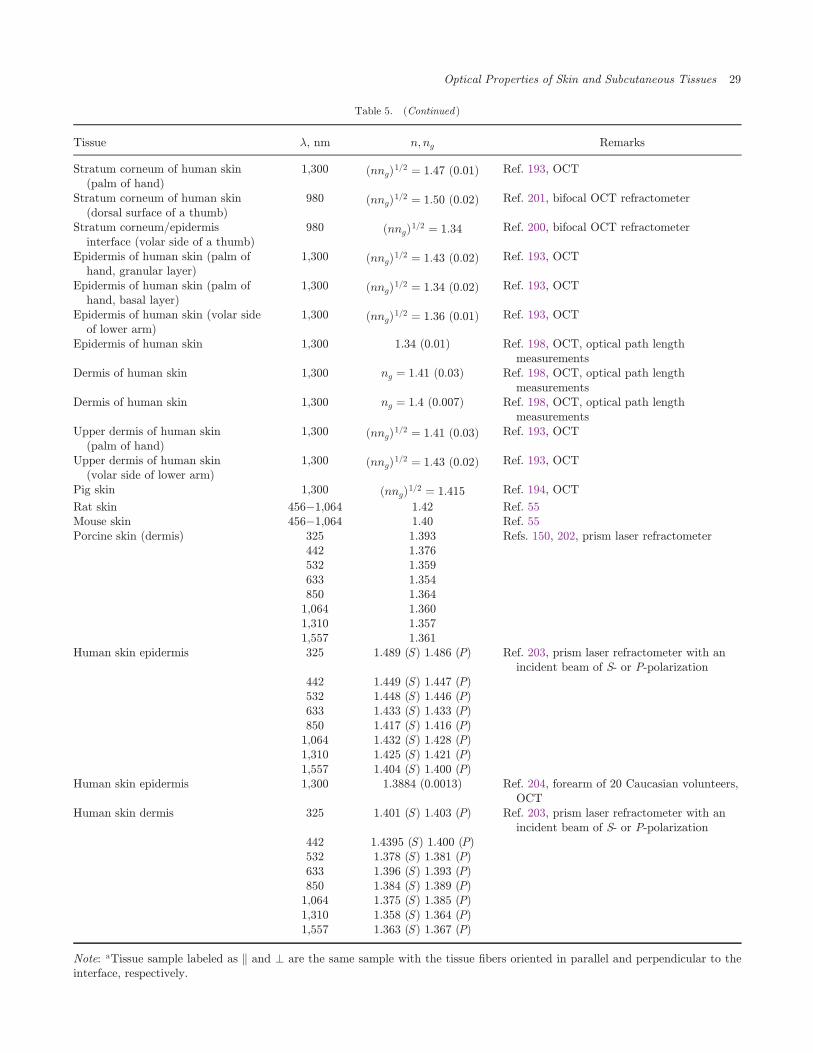
Table 5. (Continued )
Tissue �, nm n;ng Remarks
Stratum corneum of human skin(palm of hand)
1,300 ðnngÞ1=2 ¼ 1:47 ð0:01Þ Ref. 193, OCT
Stratum corneum of human skin(dorsal surface of a thumb)
980 ðnngÞ1=2 ¼ 1:50 ð0:02Þ Ref. 201, bifocal OCT refractometer
Stratum corneum/epidermisinterface (volar side of a thumb)
980 ðnngÞ1=2 ¼ 1:34 Ref. 200, bifocal OCT refractometer
Epidermis of human skin (palm ofhand, granular layer)
1,300 ðnngÞ1=2 ¼ 1:43 ð0:02Þ Ref. 193, OCT
Epidermis of human skin (palm ofhand, basal layer)
1,300 ðnngÞ1=2 ¼ 1:34 ð0:02Þ Ref. 193, OCT
Epidermis of human skin (volar sideof lower arm)
1,300 ðnngÞ1=2 ¼ 1:36 ð0:01Þ Ref. 193, OCT
Epidermis of human skin 1,300 1.34 (0.01) Ref. 198, OCT, optical path lengthmeasurements
Dermis of human skin 1,300 ng ¼ 1:41 ð0:03Þ Ref. 198, OCT, optical path lengthmeasurements
Dermis of human skin 1,300 ng ¼ 1:4 ð0:007Þ Ref. 198, OCT, optical path lengthmeasurements
Upper dermis of human skin(palm of hand)
1,300 ðnngÞ1=2 ¼ 1:41 ð0:03Þ Ref. 193, OCT
Upper dermis of human skin(volar side of lower arm)
1,300 ðnngÞ1=2 ¼ 1:43 ð0:02Þ Ref. 193, OCT
Pig skin 1,300 ðnngÞ1=2 ¼ 1:415 Ref. 194, OCT
Rat skin 456�1,064 1.42 Ref. 55Mouse skin 456�1,064 1.40 Ref. 55Porcine skin (dermis) 325 1.393 Refs. 150, 202, prism laser refractometer
442 1.376532 1.359633 1.354850 1.3641,064 1.3601,310 1.3571,557 1.361
Human skin epidermis 325 1.489 (S) 1.486 (P) Ref. 203, prism laser refractometer with anincident beam of S- or P-polarization
442 1.449 (S) 1.447 (P)532 1.448 (S) 1.446 (P)633 1.433 (S) 1.433 (P)850 1.417 (S) 1.416 (P)1,064 1.432 (S) 1.428 (P)1,310 1.425 (S) 1.421 (P)1,557 1.404 (S) 1.400 (P)
Human skin epidermis 1,300 1.3884 (0.0013) Ref. 204, forearm of 20 Caucasian volunteers,OCT
Human skin dermis 325 1.401 (S) 1.403 (P) Ref. 203, prism laser refractometer with anincident beam of S- or P-polarization
442 1.4395 (S) 1.400 (P)532 1.378 (S) 1.381 (P)633 1.396 (S) 1.393 (P)850 1.384 (S) 1.389 (P)1,064 1.375 (S) 1.385 (P)1,310 1.358 (S) 1.364 (P)1,557 1.363 (S) 1.367 (P)
Note: aTissue sample labeled as jj and ? are the same sample with the tissue ¯bers oriented in parallel and perpendicular to theinterface, respectively.
Optical Properties of Skin and Subcutaneous Tissues 29
10. Summary
We believe that this overview of tissue opticalproperties will provide users a possibility to predictoptical properties of tissues under their interest andevaluate light distribution in the organ underexamination or treatment. We have tried to collectas complete as possible data on optical properties ofskin and subcutaneous tissues and presented someof these data in the form of approximation formulasas a function of the wavelength for easy use. In spiteof this and availability of other reviews,1�7,10,11,55
evidently, the data collection and measurementsshould be continued in order to have more completeand precise information about di®erent tissuesin norm and pathology, to recognize age-related,disease-related, and treatment-related changes ofoptical properties. Data on blood optical propertiescan be found in the following Refs. 10�12, 54�56,67�70, 72, 74, 75, 113, 128, 130, 131, 134, 181.
Acknowledgments
The research described in this paper has beenmade possible by grants: 224014 Photonics4life-FP7-ICT-2007-2; RFBR-08-02-92224-NNSF a(RF-P.R. of China); and Governmental contracts02.740.11.0484, 02.740.11.0770, and 02.740.11.0879.
References
1. G. J. Mueller, D. H. Sliney (eds.), Dosimetry ofLaser Radiation in Medicine and Biology, IS5,SPIE Press, Bellingham, WA (1989).
2. W.-F. Cheong, S. A. Prahl, A. J. Welch, \A reviewof the optical properties of biological tissues,"IEEE J. Quantum Electr. 26, 2166�2185 (1990).
3. F. A. Duck, Physical Properties of Tissue:A Comprehensive Reference Book, AcademicPress, London (1990).
4. A. J. Welch, M. C. J. van Gemert (eds.), TissueOptics, Academic Press, New York (1992).
5. P. van der Zee, \Methods for measuring the opticalproperties of tissue samples in the visible and near-infrared wavelength range," in Medical OpticalTomography: Functional Imaging and Monitoring,G. Mueller, B. Chance, R. Alfano, et al. (eds.), pp.166�192, SPIE Press, Institute Series, Vol. 11,Bellingham, WA (1993).
6. G. Müller, A. Roggan (eds.), Laser-Induced Inter-stitial Thermotherapy, PM25, SPIE Press, Bel-lingham, WA (1995).
7. M. H. Niemz, Laser-Tissue Interactions. Funda-mentals and Applications, 3rd ed., Springer-Verlag,Berlin (2007).
8. V. V. Tuchin, \Light scattering study of tissues,"Phys. — Uspekhi 40, 495�515 (1997).
9. V. V. Tuchin (ed.), Handbook of Optical Biome-dical Diagnostics, PM107, SPIE Press, Bellingham,WA (2002).
10. T. Vo-Dinh (ed.), Biomedical Photonics Handbook,CRC Press, Boca Raton (2003).
11. V. V. Tuchin, Tissue Optics: Light ScatteringMethods and Instruments for Medical Diagnosis,SPIE Press, Bellingham, WA (2007).
12. V. V. Tuchin, \Optical spectroscopy of biologicalmaterials," in Encyclopedia of Applied Spec-troscopy, D. L. Andrews (ed.), pp. 555�626, Wiley-VCH Verlag GmbH & Co. KGaA, Weinheim(2009).
13. A. Roggan, D. Schadel, U. Netz, J.-P. Ritz, C. T.Germer, G. Müller, \The e®ect of preparationtechnique on the optical parameters of biologicaltissue," Appl. Phys. B: Lasers Opt. 69, 445�453(1999).
14. E. A. Genina, A. N. Bashkatov, V. I. Kochubey,V. V. Tuchin, \E®ect of storage conditions of skinsamples on their optical characteristics," Opt.Spectrosc. 107, 934�938 (2009).
15. E. Chan, T. Menovsky, A. J. Welch, \E®ects ofcryogenic grinding on soft-tissue optical proper-ties," Appl. Opt. 35, 4526�4532 (1996).
16. E. K. Chan, B. Sorg, D. Protsenko, M. O'Neil,M. Motamedi, A. J. Welch, \E®ects of compressionon soft tissue optical properties," IEEE J. Sel. Top.Quantum Electron. 2, 943�950 (1996).
17. I. F. Cilesiz, A. J. Welch, \Light dosimetry: E®ectsof dehydration and thermal damage on the opticalproperties of the human aorta," Appl. Opt. 32,477�487 (1993).
18. D. Zhu, Q. Luo, J. Cen, \E®ects of dehydration onthe optical properties of in vitro porcine liver,"Lasers Surg. Med. 33, 226�231 (2003).
19. S. L. Jacques, \Origins of tissue optical propertiesin the UVA, visible and NIR regions," in Advancesin Optical Imaging and Photon Migration, R. R.Alfano, J. G. Fujimoto (eds.), pp. 364�371, OSATOPS: Optical Society of America, Vol. 2,Washington, DC (1996).
20. A. Ishimaru, Wave Propagation and Scattering inRandom Media, IEEE Press, New York (1997).
21. M. I. Mishchenko, L. D. Travis, A. A. Lacis,Scattering, Absorption, and Emission of Light bySmall Particles, Cambridge University Press(2002).
22. C. Chandrasekhar, Radiative Transfer, Dover,Toronto, Ontario (1960).
30 A. N. Bashkatov, E. A. Genina & V. V. Tuchin
23. L. G. Henyey, J. L. Greenstein, \Di®use radiationin the galaxy," Astrophys. J. 93, 70�83 (1941).
24. G. Yoon, A. J. Welch, M. Motamedi, C. J.Martinus, M. J. C. van Gemert, \Development andapplication of three-dimensional light distributionmodel for laser irradiated tissue," IEEE J. Quan-tum Electron. 23, 1721�1733 (1987).
25. M. Chandra, K. Vishwanath, G. D. Fichter, E. Liao,S. J. Hollister, M.-A. Mycek, \Quantitative mol-ecular sensing in biological tissues: An approachto non-invasive optical characterization,"Opt. Exp.14, 6157�6171 (2006).
26. Y.-C. Chen, J. L. Ferracane, S. A. Prahl, \A pilotstudy of a simple photon migration model for pre-dicting depth of cure in dental composite," Dent.Mater. 21, 1075�1086 (2005).
27. G. de Vries, J. F. Beek, G. W. Lucassen, M. J. C.van Gemert, \The e®ect of light losses in doubleintegrating spheres on optical properties estima-tion," IEEE J. Sel. Top. Quantum Electron. 5,944�947 (1999).
28. S. C. Gebhart, W.-C. Lin, A. Mahadevan-Jansen,\In vitro determination of normal and neoplastichuman brain tissue optical properties using inverseadding-doubling," Phys. Med. Biol. 51, 2011�2027(2006).
29. J. W. Pickering, S. A. Prahl, N. van Wieringen,J. F. Beek, H. J. C. M. Sterenborg, M. J. C. vanGemert, \Double-integrating-sphere system formeasuring the optical properties of tissue," Appl.Opt. 32, 399�410 (1993).
30. S. A. Prahl, M. J. C. van Gemert, A. J. Welch,\Determining the optical properties of turbidmedia by using the adding-doubling method,"Appl. Opt. 32, 559�568 (1993).
31. J. Qu, C. MacAulay, S. Lam, B. Palcic, \Opticalproperties of normal and carcinomatous bronchialtissue," Appl. Opt. 33, 7397�7405 (1994).
32. D. K. Sardar, M. L. Mayo, R. D. Glickman,\Optical characterization of melanin," J. Biomed.Opt. 6, 404�411 (2001).
33. D. K. Sardar, F. S. Salinas, J. J. Perez, A. T. C.Tsin, \Optical characterization of bovine retinaltissues," J. Biomed. Opt. 9, 624�631 (2004).
34. D. K. Sardar, R. M. Yow, A. T. C. Tsin, R. Sardar,\Optical scattering, absorption, and polarizationof healthy and neovascularized human retinaltissues," J. Biomed. Opt. 10, 051501 (2005).
35. D. K. Sardar, G.-Y. Swanland, R. M. Yow, R. J.Thomas, A. T. C. Tsin, \Optical properties ofocular tissues in the near infrared region," LasersMed. Sci. 22, 46�52 (2007).
36. H.-J. Wei, D. Xing, J.-J. Lu, H.-M. Gu, G.-Y. Wu,Y. Jin, \Determination of optical properties ofnormal and adenomatous human colon tissues
in vitro using integrating sphere techniques,"World J. Gastroenterology 11, 2413�2419 (2005).
37. D. Zhu, W. Lu, S. Zeng, Q. Luo, \E®ect of losses ofsample between two integrating spheres on opticalproperties estimation," J. Biomed. Opt. 12, 064004(2007).
38. A. N. Bashkatov, E. A. Genina, V. I. Kochubey,V. V. Tuchin, E. E. Chikina, A. B. Knyazev, O. V.Mareev, \Optical properties of mucous membranein the spectral range 350�2000 nm," Opt. Spec-trosc. 97, 978�983 (2004).
39. A. N. Bashkatov, E. A. Genina, V. I. Kochubey,V. V. Tuchin, \Optical properties of human skin,subcutaneous and mucous tissues in the wave-length range from 400 to 2000 nm," J. Phys. D:Appl. Phys. 38, 2543�2555 (2005).
40. A. N. Bashkatov, E. A. Genina, V. I. Kochubey,V. V. Tuchin, \Optical properties of the subcu-taneous adipose tissue in the spectral range400�2500 nm," Opt. Spectrosc. 99, 836�842(2005).
41. A. N. Bashkatov, E. A. Genina, V. I. Kochubey,V. V. Tuchin, \Estimate of the melanin content inhuman hairs by the inverse Monte Carlo methodusing a system for digital image analysis," Quan-tum Electron. 36, 1111�1118 (2006).
42. A. N. Bashkatov, E. A. Genina, V. I. Kochubey,V. V. Tuchin, \Optical properties of human cranialbone in the spectral range from 800 to 2000 nm,"Proc. SPIE 6163, 616310 (2006).
43. A. N. Bashkatov, E. A. Genina, V. I. Kochubey,A. A. Gavrilova, S. V. Kapralov, V. A. Grishaev,V. V. Tuchin, \Optical properties of humanstomach mucosa in the spectral range from 400 to2000 nm: Prognosis for gastroenterology," Med.Laser Appl. 22, 95�104 (2007).
44. A. N. Bashkatov, E. A. Genina, V. I. Kochubey,V. V. Tuchin, \Optical properties of human sclerain spectral range 370�2500 nm," Opt. Spectrosc.109, 197�204 (2010).
45. J. S. Dam, T. Dalgaard, P. E. Fabricius,S. Andersson-Engels, \Multiple polynomial re-gression method for determination of biomedicaloptical properties from integrating sphere mea-surements," Appl. Opt. 39, 1202�1209 (2000).
46. R. Graa®, M. H. Koelink, F. F. M. de Mul, W. G.Zijlstra, A. C. M. Dassel, J. G. Aarnoudse,\Condensed Monte Carlo simulations for thedescription of light transport," Appl. Opt. 32,426�434 (1993).
47. M. Hammer, A. Roggan, D. Schweitzer, G. Müller,\Optical properties of ocular fundus tissues — anin vitro study using the double-integrating-spheretechnique and inverse Monte Carlo simulation,"Phys. Med. Biol. 40, 963�978 (1995).
Optical Properties of Skin and Subcutaneous Tissues 31
48. C. K. Hayakawa, J. Spanier, F. Bevilacqua, A. K.Dunn, J. S. You, B. J. Tromberg, V. Venugopalan,\Perturbation Monte Carlo methods to solveinverse photon migration problems in hetero-geneous tissues," Opt. Lett. 26(17), 1335�1337(2001).
49. C. J. Hourdakis, A. Perris, \A Monte Carloestimation of tissue optical properties for use inlaser dosimetry," Phys. Med. Biol. 40, 351�364(1995).
50. R. Marchesini, C. Clemente, E. Pignoli, M. Bram-billa, \Optical properties of in vitro epidermis andtheir possible relationship with optical properties ofin vivo skin," J. Photochem. Photobiol. B 16,127�140 (1992).
51. G. M. Palmer, N. Ramanujam, \Monte Carlo-basedinverse model for calculating tissue optical proper-ties. Part I: Theory and validation on syntheticphantoms," Appl. Opt. 45, 1062�1071 (2006).
52. G. M. Palmer, N. Ramanujam, \Monte Carlo-based inverse model for calculating tissue opticalproperties. Part II: Application to breast cancerdiagnosis," Appl. Opt. 45, 1072�1078 (2006).
53. P. M. Ripley, J. G. Laufer, A. D. Gordon, R. J.Connell, S. G. Bown, \Near-infrared optical prop-erties of ex vivo human uterus determined by theMonte Carlo inversion technique," Phys. Med.Biol. 44, 2451�2462 (1999).
54. A. Roggan, O. Minet, C. Schroder, G. Müller, \Thedetermination of optical tissue properties withdouble integrating sphere technique and MonteCarlo simulations," Proc. SPIE 2100, 42�56(1994).
55. A. Roggan, K. D€orschel, O. Minet et al., \Theoptical properties of biological tissue in the nearinfrared wavelength range — Review and mea-surements," in Laser-Induced Interstitial Thermo-therapy, PM25, G. Müller, A. Roggan (eds.),pp. 10�44, SPIE Press, Bellingham, WA (1995).
56. A. Roggan, M. Friebel, K. Dorschel, A. Hahn,G. Müller, \Optical properties of circulatinghuman blood in the wavelength range400�2500 nm," J. Biomed. Opt. 4, 36�46 (1999).
57. E. Salomatina, B. Jiang, J. Novak, A. N.Yaroslavsky, \Optical properties of normal andcancerous human skin in the visible and near-infrared spectral range," J. Biomed. Opt. 11,064026 (2006).
58. C. R. Simpson, M. Kohl, M. Essenpreis, M. Cope,\Near-infrared optical properties of ex vivo humanskin and subcutaneous tissues measured using theMonte Carlo inversion technique," Phys. Med.Biol. 43, 2465�2478 (1998).
59. L.Wang, S. L. Jacques, L. Zheng, \MCML—MonteCarlo modeling of light transport in multi-layered
tissues," Comp. Methods Progr. Biomed. 47,131�146 (1995).
60. I. V. Yaroslavsky, A. N. Yaroslavsky, T. Goldbach,H.-J. Schwarzmaier, \Inverse hybrid technique fordetermining the optical properties of turbid mediafrom integrating-sphere measurements," Appl.Opt. 35, 6797�6809 (1996).
61. A. N. Yaroslavsky, P. C. Schulze, I. V. Yaroslavsky,R. Schober, F. Ulrich, H.-J. Schwarzmaier, \Opticalproperties of selected native and coagulated humanbrain tissues in vitro in the visible and near-infraredspectral range," Phys. Med. Biol. 47, 2059�2073(2002).
62. B. Nemati, H.G.Rylander III, A. J.Welch, \Opticalproperties of conjunctiva, sclera, and the ciliarybody and their consequences for trans-scleralcyclophotocoagulation," Appl. Opt. 35, 3321�3327(1996).
63. D. W. Ebert, C. Roberts, S. K. Farrar, W. M.Johnston, A. S. Litsky, A. L. Bertone, \Articularcartilage optical properties in the spectral range300�850 nm," J. Biomed. Opt. 3, 326�333 (1998).
64. S. K. Farrar, C. Roberts, W. M. Johnston, P. A.Weber, \Optical properties of human trabecularmeshwork in the visible and near-infrared region,"Lasers Surg. Med. 25, 348�362 (1999).
65. A. Dimofte, J. C. Finlay, T. C. Zhu, \A method fordetermination of the absorption and scatteringproperties interstitially in turbid media," Phys.Med. Biol. 50, 2291�2311 (2005).
66. J. W. Pickering, S. Bosman, P. Posthumus,P. Blokland, J. F. Beek, M. J. C. van Gemert,\Changes in the optical properties (at 632.8 nm)of slowly heated myocardium," Appl. Opt. 32,367�371 (1993).
67. M. Friebel, A. Roggan, G. Müller, M. Meinke,\Determination of optical properties of humanblood in the spectral range 250 to 1100 nmusing Monte Carlo simulations with hematocrit-dependent e®ective scattering phase functions,"J. Biomed. Opt. 11, 034021 (2006).
68. M. Friebel, J. Helfmann, U. Netz, M. Meinke,\In°uence of oxygen saturation on the opticalscattering properties of human red blood cells inthe spectral range 250 to 2000 nm," J. Biomed.Opt. 14, 034001 (2009).
69. M. Meinke, G. Müller, J. Helfmann, M. Friebel,\Empirical model functions to calculate hemato-crit-dependent optical properties of human blood,"Appl. Opt. 46, 1742�1753 (2007).
70. M. Meinke, G. Müller, J. Helfmann, M. Friebel,\Optical properties of platelets and blood plasmaand their in°uence on the optical behavior of wholeblood in the visible to near-infrared wavelengthrange," J. Biomed. Opt. 12, 014024 (2007).
32 A. N. Bashkatov, E. A. Genina & V. V. Tuchin
71. P. van der Zee, M. Essenpreis, D. T. Delpy,\Optical properties of brain tissue," Proc. SPIE1888, 454�465 (1993).
72. A. N. Yaroslavsky, I. V. Yaroslavsky, T. Goldbach,H.-J. Schwarzmaier, \The optical properties ofblood in the near-infrared spectral range," Proc.SPIE 2678, 314�324 (1996).
73. D. Spitzer, J. J. Ten Bosch, \The absorption andscattering of light in bovine and human dentalenamel," Calc. Tiss. Res. 17, 129�137 (1975).
74. A. N. Yaroslavsky, A. V. Priezzhev, J. Rodriguez,I. V. Yaroslavsky, H. Battarbee, \Optics of blood,"Chap. 2 in Handbook of Optical Biomedical Diag-nostics, PM107, V. V. Tuchin (ed.), pp. 169�216,SPIE Press, Bellingham, WA (2002).
75. A. M. K. Nilsson, G. W. Lucassen, W. Verkruysse,S. Andersson-Engels, M. J. C. van Gemert,\Changes in optical properties of human wholeblood in vitro due to slow heating," Photochem.Photobiol. 65, 366�373 (1997).
76. A. N. Yaroslavsky, A. Vervoorts, A. V. Priezzhev,I. V. Yaroslavsky, J. G. Moser, H.-J. Schwarzma-ier, \Can tumor cell suspension serve as an opticalmodel of tumor tissue in situ?," Proc. SPIE 3565,165�173 (1999).
77. T. L. Troy, S. N. Thennadil, \Optical properties ofhuman skin in the near-infrared wavelength rangeof 1000 to 2200 nm," J. Biomed. Opt. 6, 167�176(2001).
78. S. A. Prahl, Light Transport in Tissue, Ph.D.Thesis, University of Texas, Austin (1988).
79. D. Zhu, J. Wang, Z. Zhi, X. Wen, Q. Luo,\Imaging dermal blood °ow through the intact ratskin with an optical clearing method," J. Biomed.Opt. 15, 026008 (2010).
80. C. Liu, Z. Zhi, V. V. Tuchin, Q. Luo, D. Zhu,\Enhancement of skin optical clearing e±cacyusing photo-irradiation," Lasers Surg. Med. 42,132�140 (2010).
81. X. Wen, Z. Mao, Z. Han, V. V. Tuchin, D. Zhu,\In vivo skin optical clearing by glycerol solutions:Mechanism," J. Biophotonics 3, 44�52 (2010).
82. X. Wen, V. V. Tuchin, Q. Luo, D. Zhu,\Controlling of scattering of intralipid by usingoptical clearing agents," Phys. Med. Biol. 54,6917�6930 (2009).
83. Z. Zhi, Z. Han, Q. Luo, D. Zhu, \Improve opticalclearing of skin in vitro with propylene glycol as apenetration enhancer," J. Innovative Opt. HealthSci. 2, 269�278 (2009).
84. A. N. Yaroslavsky, I. V. Yaroslavsky, H.-J.Schwarzmaier, \Small-angle approximation todetermine radiance distribution of a ¯nite beampropagating through turbid medium," Proc. SPIE3195, 110�120 (1998).
85. P. Kubelka, F. Munk, \Ein beitrag zur optik derfarbanstriche," Z. Tech. Phys. 12, 593�601 (1931).
86. M. J. C. van Gemert, S. L. Jacques, H. J. C. M.Sterenborg, W. M. Star, \Skin optics," IEEETrans. Biomed. Eng. 36, 1146�1154 (1989).
87. R. R. Anderson, J. A. Parrish, \The optics ofhuman skin," J. Invest. Dermatol. 77, 13�19(1981).
88. P. R. Bargo, S. A. Prahl, T. T. Goodell, R. A.Sleven, G. Koval, G. Blair, S. L. Jacques, \In vivodetermination of optical properties of normal andtumor tissue with white light re°ectance and anempirical light transport model during endoscopy,"J. Biomed. Opt. 10, 034018 (2005).
89. C.K.Hayakawa,B.Y.Hill, J. S.You, F.Bevilacqua,J. Spanier, V. Venugopalan, \Use of the �-P1
approximation for recovery of optical absorption,scattering, and asymmetry coe±cients in turbidmedia," Appl. Opt. 43, 4677�4688 (2004).
90. H. C. van de Hulst, Multiple Light Scattering.Tables, Formulas and Applications, AcademicPress (1980).
91. S. A. Prahl, Inverse adding-doubling for opticalproperties measurements, http://omlc.ogi.edu/software/iad/index.html (2007).
92. D. K. Sardar, L. B. Levy, \Optical properties ofwhole blood," Lasers Med. Sci. 13, 106�111(1998).
93. J. F. Beek, P. Blokland, P. Posthumus, M. Aalders,J. W. Pickering, H. J. C. M. Sterenborg, M. J. C.van Gemert, \In vitro double-integrating-sphereoptical properties of tissues between 630 and 1064nm," Phys. Med. Biol. 42, 2255�2261 (1997).
94. E. A. Genina, A. N. Bashkatov, V. I. Kochubey,V. V. Tuchin, \Optical clearing of human duramater," Opt. Spectrosc. 98, 470�476 (2005).
95. J. Laufer, R. Simpson, M. Kohl, M. Essenpreis,M. Cope, \E®ect of temperature on the opticalproperties of ex vivo human dermis and sub-dermis," Phys. Med. Biol. 43, 2479�2489 (1998).
96. F. Bevilacqua, P. Marquet, C. Depeursinge, E. B.de Haller, \Determination of reduced scatteringand absorption coe±cients by a single charge-coupled-device array measurement. Part II:Measurements on biological tissues," Opt. Eng. 34,2064�2069 (1995).
97. F. Bevilacqua, D. Piguet, P. Marquet, J. D. Gross,B. J. Tromberg, C. Depeursinge, \In vivo localdetermination of tissue optical properties: Appli-cations to human brain," Appl. Opt. 38, 4939�4950 (1999).
98. Y. Du, X. H. Hu, M. Cariveau, G. W. Kalmus,J. Q. Lu, \Optical properties of porcine skin dermisbetween 900 nm and 1500 nm," Phys. Med. Biol.46, 167�181 (2001).
Optical Properties of Skin and Subcutaneous Tissues 33
99. O. S. Khalil, S.-J. Yeh, M. G. Lowery, X. Wu,C. F. Hanna, S. Kantor, T.-W. Jeng, J. S. Kanger,R. A. Bolt, F. F. de Mul, \Temperature modu-lation of the visible and near infrared absorp-tion and scattering coe±cients of human skin,"J. Biomed. Opt. 8, 191�205 (2003).
100. T. J. Pfefer, L. S. Matchette, C. L. Bennett, J. A.Gall, J. N. Wilke, A. J. Durkin, M. N. Ediger,\Re°ectance-based determination of optical prop-erties in highly attenuating tissue," J. Biomed.Opt. 8, 206�215 (2003).
101. P. Thueler, I. Charvet, F. Bevilacqua, M. S.Ghislain, G. Ory, P. Marquet, P. Meda, B. Ver-meulen, C. Depeursinge, \In vivo endoscopic tissuediagnostics based on spectroscopic absorption,scattering, and phase function properties," J. Bio-med. Opt. 8, 495�503 (2003).
102. M. Firbank, M. Hiraoka, M. Essenpreis, D. T.Delpy, \Measurement of the optical properties ofthe skull in the wavelength range 650�950 nm,"Phys. Med. Biol. 38, 503�510 (1993).
103. N. Ugryumova, S. L. Matcher, D. P. Attenburrow,\Measurement of bone mineral density via lightscattering," Phys. Med. Biol. 49, 469�483 (2004).
104. G. Alexandrakis, D. R. Busch, G. W. Faris, M. S.Patterson, \Determination of the optical propertiesof two-layer turbid media by use of a frequency-domain hybrid Monte Carlo di®usion model,"Appl. Opt. 40, 3810�3821 (2001).
105. A. Kienle, M. S. Patterson, \Determination of theoptical properties of turbid media from a singleMonte Carlo simulation," Phys. Med. Biol. 41,2221�2227 (1996).
106. D. Kumar, R. Srinivasan, M. Singh, \Opticalcharacterization of mammalian tissues by laserre°ectometry and Monte Carlo simulation," Med.Eng. Phys. 26, 363�369 (2004).
107. I. Nishidate, Y. Aizu, H. Mishina, \Estimation ofabsorbing components in a local layer embedded inthe turbid media on the basis of visible to near-infrared (VIS-NIR) re°ectance spectra," Opt. Rev.10, 427�435 (2003).
108. I. Nishidate, Y. Aizu, H. Mishina, \Estimation ofmelanin and hemoglobin in skin tissue using mul-tiple regression analysis aided by Monte Carlosimulation," J. Biomed. Opt. 9, 700�710 (2004).
109. I. Seo, J. S. You, C. K. Hayakawa, V. Venugopa-lan, \Perturbation and di®erential Monte Carlomethods for measurement of optical properties in alayered epithelial tissue model," J. Biomed. Opt.12, 014030 (2007).
110. C. Zhu, G. M. Palmer, T. M. Breslin, J. Harter,N. Ramanujam, \Diagnosis of breast cancer usingdi®use re°ectance spectroscopy: Comparison ofa Monte Carlo versus partial least squares
analysis-based feature extraction technique,"Lasers Surg. Med. 38, 714�724 (2006).
111. S. L. Jacques, L. Wang, \Monte Carlo modeling oflight transport in tissue," in Optical-ThermalResponse of Laser-Irradiated Tissue, A. J. Welch,M. J. C. van Gemert (eds.), pp. 73�100, PlenumPress, New York (1995).
112. L. Wang, S. L. Jacques, Monte Carlo modeling oflight transport in multi-layered tissues in StandardC, The University of Texas, M. D. Anderson CancerCenter, Houston, Texas, http://ece.ogi.edu/omlc(1992).
113. A. N. Yaroslavsky, I. V. Yaroslavsky, T. Goldbach,H.-J. Schwarzmaier, \In°uence of the scatteringphase function approximation on the opticalproperties of blood determined from the integrat-ing sphere measurements," J. Biomed. Opt. 4,47�53 (1999).
114. L. O. Reynolds, N. J. McCormick, \Approximatetwo-parameter phase function for light scattering,"J. Opt. Soc. Am. 70, 1206�1212 (1980).
115. P. W. Barber, S. C. Hill, Light Scattering by Par-ticles: Computational Methods, World Scienti¯c,Singapore (1990).
116. C. F. Bohren, D. R. Hu®man, Absorption andScattering of Light by Small Particles, Wiley, NewYork (1983).
117. T. J. Farrell, M. S. Patterson, B. C. Wilson, \Adi®usion theory model of spatially resolved, steady-state di®use re°ectance for the noninvasive deter-mination of tissue optical properties in vivo," Med.Phys. 19, 879�888 (1992).
118. I. V. Yaroslavsky, V. V. Tuchin, \Light propa-gation in multilayer scattering media. Modeling bythe Monte Carlo method," Opt. Spectrosc. 72,505�509 (1992).
119. M. Keijzer, S. L. Jacques, S. A. Prahl, A. J. Welch,\Light distributions in artery tissue: Monte Carlosimulations for ¯nite-diameter laser beams,"Lasers Surg. Med. 9, 148�154 (1989).
120. W. H. Press, S. A. Tuekolsky, W. T. Vettering, B.P. Flannery, Numerical Recipes in C: The Art ofScienti¯c Computing, Cambridge University Press,Cambridge (1992).
121. R. M. P. Doornbos, R. Lang, M. C. Aalders, F. W.Cross, H. J. C. M. Sterenborg, \The determinationof in vivo human tissue optical properties andabsolute chromophore concentrations usingspatially resolved steady-state di®use re°ectancespectroscopy," Phys. Med. Biol. 44, 967�981(1999).
122. E. Salomatina, A. N. Yaroslavsky, \Evaluation ofthe in vivo and ex vivo optical properties in a mouseear model," Phys. Med. Biol. 53, 2797�2807(2008).
34 A. N. Bashkatov, E. A. Genina & V. V. Tuchin
123. R. Graa®, J. G. Aarnoudse, J. R. Zijp, P. M. A.Sloot, F. F. M. de Mul, J. Greve, M. H. Koelink,\Reduced light-scattering properties for mixturesof spherical particles: A simple approximationderived from Mie calculations," Appl. Opt. 31,1370�1376 (1992).
124. R. Graa®, A. C. M. Dassel, M. H. Koelink, F. F. M.de Mul, J. G. Aarnoudse, W. G. Zijlstra, \Opticalproperties of human dermis in vitro and in vivo,"Appl. Opt. 32, 435�447 (1993).
125. T. Binzoni, T. S. Leung, A. H. Gandjbakhche,D. Rufenacht, D. T. Delpy, \The use of theHenyey�Greenstein phase function in Monte Carlosimulations in biomedical optics," Phys. Med. Biol.51, N313�N322 (2006).
126. J. E. Choukeife, J. P. L'Huillier, \Measurements ofscattering e®ects within tissue-like media at twowavelengths of 632.8 nm and 680 nm," LasersMed. Sci. 14, 286�296 (1999).
127. F. K. Forster, A. Kienle, R. Michels, R. Hibst,\Phase function measurements on nonsphericalscatterers using a two-axis goniometer," J. Biomed.Opt. 11, 024018 (2006).
128. M. Hammer, A. N. Yaroslavsky, D. Schweitzer,\A scattering phase function for blood with phys-iological haematoctit," Phys. Med. Biol. 46,N65�N69 (2001).
129. R. Marchesini, A. Bertoni, S. Andreola, E. Melloni,A. E. Sichirollo, \Extinction and absorption coef-¯cients and scattering phase functions of humantissues in vitro," Appl. Opt. 28, 2318�2324 (1989).
130. C. V. L. Pop, S. Neamtu, \Aggregation of redblood cells in suspension: Study by light-scatteringtechnique at small angles," J. Biomed. Opt. 13,041308 (2008).
131. I. Turcu, C. V. L. Pop, S. Neamtu, \High-resol-ution angle-resolved measurements of light scat-tered at small angles by red blood cells insuspension," Appl. Opt. 45, 1964�1971 (2006).
132. D. Fried, R. E. Glena, J. D. B. Featherstone,W. Seka, \Nature of light scattering in dentalenamel and dentin at visible and near-infraredwavelengths," Appl. Opt. 34, 1278�1285 (1995).
133. C. L. Darling, G. D. Huynh, D. Fried, \Lightscattering properties of natural and arti¯ciallydemineralized dental enamel at 1310 nm," J. Bio-med. Opt. 11, 034023 (2006).
134. J. M. Steinke, A. P. Shepherd, \Comparison of Mietheory and the light scattering of red blood cells,"Appl. Opt. 27, 4027�4033 (1988).
135. S. P. Treweek, J. C. Barbenel, \Direct measurementof the optical properties of human breast skin,"Med.Biol. Eng. Comp. 34, 285�289 (1996).
136. A. N. Yaroslavskaya, S. R. Utz, S. N. Tatarintsev,V. V. Tuchin, \Angular scattering properties of
human epidermal layers," Proc. SPIE 2100,38�41 (1994).
137. J. R. Zijp, J. J. Ten Bosch, \Optical properties ofbovine muscle tissue in vitro: A comparison ofmethods," Phys. Med. Biol. 43, 3065�3081 (1998).
138. R. Drezek, A. Dunn, R. Richards-Kortum, \Lightscattering from cells: Finite-di®erence time-domainsimulations and goniometric measurements," Appl.Opt. 38, 3651�3661 (1999).
139. S. L. Jacques, C. A. Alter, S. A. Prahl, \Angulardependence of the He�Ne laser light scattering byhuman dermis," Lasers Life Sci. 1, 309�333(1987).
140. J. D. Hardy, H. T. Hammel, D. Murgatroyd,\Spectral transmittance and re°ectance of excisedhuman skin," J. Appl. Physiol. 9, 257�264 (1956).
141. W. A. G. Bruls, J. C. van der Leun, \Forwardscattering properties of human epidermal layers,"Photochem. Photobiol. 40, 231�242 (1984).
142. N. G. Khlebtsov, I. L. Maksimova, V. V. Tuchin,L. V. Wang, \Introduction to light scattering bybiological objects," Chap. 1 in Handbook of OpticalBiomedical Diagnostics, PM107, V. V. Tuchin(ed.), pp. 31�167, SPIE Press, Bellingham, WA(2002).
143. R. Zhang, W. Verkruysse, B. Choi, J. A. Viator,B. Jung, L. O. Svaasand, G. Aguilar, J. S. Nelson,\Determination of human skin optical propertiesfrom spectrophotometric measurements based onoptimization by genetic algorithms," J. Biomed.Opt. 10, 024030 (2005).
144. V. G. Peters, D. R. Wyman, M. S. Patterson, G. L.Frank \Optical properties of normal and diseasedhuman breast tissues in the visible and near-infra-red," Phys. Med. Biol. 35, 1317�1334 (1990).
145. N. Ghosh, S. K. Mohanty, S. K. Majumder, P. K.Gupta, \Measurement of optical transport prop-erties of normal and malignant human breasttissue," Appl. Opt. 40, 176�184 (2001).
146. J. M. Schmitt, G. Kumar, \Optical scatteringproperties of soft tissue: A discrete particle model,"Appl. Opt. 37, 2788�2797 (1998).
147. R. K. Wang, \Modeling optical properties of softtissue by fractal distribution of scatterers,"J. Modern Opt. 47, 103�120 (2000).
148. W.-C. Lin, M. Motamedi, A. J. Welch, \Dynamicsof tissue optics during laser heating of turbidmedia," Appl. Opt. 35, 3413�3420 (1996).
149. C.-T. Germer, A. Roggan, J. P. Ritz, C. Isbert,D. Albrecht, G. Müller, H. J. Buhr, \Opticalproperties of native and coagulated human livertissue and liver metastases in the near-infraredrange," Lasers Surg. Med. 23, 194�203 (1998).
150. X. Ma, J. Q. Lu, H. Ding, X.-H. Hu, \Bulk opticalparameters of porcine skin dermis at eight
Optical Properties of Skin and Subcutaneous Tissues 35
wavelengths from 325 to 1557 nm," Opt. Lett. 30,412�414 (2005).
151. D. J. Maitland, J. T. Walsh Jr., J. B. Prystowsky,\Optical properties of human gall bladder tissueand bile," Appl. Opt. 32, 586�591 (1993).
152. A. M. K. Nilsson, R. Berg, S. Andersson-Engels,\Measurements of the optical properties of tissue inconjunction with photodynamic therapy," Appl.Opt. 34, 4609�4619 (1995).
153. P. Parsa, S. L. Jacques, N. S. Nishioka, \Opticalproperties of rat liver between 350�2200 nm,"Appl. Opt. 28, 2325�2330 (1989).
154. S. V. Patwardhan, A. P. Dhawan, P. A. Relue,\Monte Carlo simulation of light-tissue interaction:three-dimensional simulation for trans-illumina-tion-based imaging of skin lesions," IEEE Trans.Biomed. Eng. 52, 1227�1236 (2005).
155. J.-P. Ritz, A. Roggan, C. Isbert, G. Müller,H. Buhr, C.-T. Germer, \Optical properties ofnative and coagulated porcine liver tissue between400 and 2400 nm," Lasers Surg. Med. 29, 205�212(2001).
156. H.-J. Schwarzmaier, A. N. Yaroslavsky, A. Terenji,S. Willmann, I. V. Yaroslavsky, T. Kahn,\Changes in the optical properties of laser coagu-lated and thermally coagulated bovine myocar-dium," Proc. SPIE 3254, 361�365 (1998).
157. J.-I. Youn, S. A. Telenkov, E. Kim, N. C.Bhavaraju, B. J. F. Wong, J. W. Valvano, T. E.Milner, \Optical and thermal properties of nasalseptal cartilage," Lasers Surg. Med. 27, 119�128(2000).
158. S. L. Jacques, \The role of skin optics in diagnosticand therapeutic uses of lasers," in Lasers inDermatology, R. Steiner (ed.), pp. 1�21, Springer-Verlag, Berlin (1991).
159. G. F. Odland, \Structure of the skin," in Physi-ology, Biochemistry, and Molecular Biology of theSkin, Vol. 1, L. A. Goldsmith (ed.), pp. 3�62,Oxford University Press, Oxford (1991).
160. T. J. Ryan, \Cutaneous circulation," in Physi-ology, Biochemestry, and Molecular Biology of theSkin, Vol. 2, L. A. Goldsmith (ed.), pp. 1019�1084,Oxford University Press, Oxford (1991).
161. K. S. Stenn, \The skin," in Cell and Tissue Biology,L. Weiss (ed.), pp. 541�572, Urban and Shwar-zenberg, Baltimore (1988).
162. M. A. Farage, K. W. Miller, P. Elsner, H. I. Mai-bach, \Structural characteristics of the aging skin:A review," J. Toxicology (Cutaneous Ocul. Tox-icol.) 26, 343�357 (2007).
163. M. R. Chedekel, \Photophysics and photochemistryof melanin," in Melanin: Its Role in HumanPhotoprotection, L. Zeise, M. R. Chedekel,
T. B. Fitzpatrick (eds.), pp. 11�22, Overland Park,Valdenmar (1995).
164. D. Parsad, K. Wakamatsu, A. J. Kanwar,B. Kumar, S. Ito, \Eumelanin and phaeomelanincontents of depigmented and repigmented skin invitiligo patients," Br. J. Dermatol. 149, 624�626(2003).
165. M. E. Darvin, I. Gersonde, M. Meinke, W. Sterry,J. Lademann, \Non-invasive in vivo determinationof the carotenoids beta-carotene and lycopeneconcentrations in the human skin using the Ramanspectroscopic method," J. Phys. D: Appl. Phys. 38,2696�2700 (2005)
166. E. Claridge, S. Cotton, P. Hall, M. Moncrie®,\From colour to tissue histology: Physics-basedinterpretation of images of pigmented skin lesions,"Med. Image Anal. 7, 489�502 (2003).
167. I. V. Meglinski, S. J. Matcher, \Quantitativeassessment of skin layers absorption and skinre°ectance spectra simulation in visible andnear-infrared spectral region," Physiol. Meas. 23,741�753 (2002).
168. G. Altshuler, M. Smirnov, I. Yaroslavsky, \Latticeof optical islets: A novel treatment modality inphotomedicine," J. Phys. D: Appl. Phys. 38,2732�2747 (2005).
169. S. L. Jacques, \Optical assessment of cutaneousblood volume depends on the vessel's size distri-bution: A computer simulation study," J. Biopho-tonics 3, 75�81 (2010).
170. R. F. Reinoso, B. A. Telfer, M. Rowland, \Tissuewater content in rats measured by desiccation,"J. Pharmacol. Toxicol. Methods 38, 87�92 (1997).
171. Y. Taton, Obesity, Pathophysiology, Diagnostics,Therapy, Medical Press, Warsaw (1981).
172. D. Y. Shurigin, P. O. Vyazitskiy, K. A. Sidorov,Obesity, Medicine, Leningrad (1975).
173. M. I. Gurr, R. T. Jung, M. P. Robinson, W. P. T.James, \Adipose tissue cellularity in man: The re-lationship between fat cell size and number, themass and distribution of body fat and the history ofweight gain and loss," Int. J. Obesity 6, 419�436(1982).
174. G.Nishimura, I.Kida,M.Tamura, \Characterizationof optical parameters with a human forearm at theregion from 1.15 to 1.52 �m using di®use re°ectancemeasurements," Phys. Med. Biol. 51, 2997�3011(2006).
175. K. S. Saladin, Anatomy and Physiology/Watnick,New York, 2010.
176. P. Ballard, D. E. Leahy, M. Rowland, \Predictionof in vivo tissue distribution from in vitro data.1. Experiments with markers of aqueous spaces,"Pharm. Res. 17, 660�663 (2000).
36 A. N. Bashkatov, E. A. Genina & V. V. Tuchin
177. J. J. Xia, E. P. Berg, J. W. Lee, G. Yao,\Characterizing beef muscles with optical scatter-ing and absorption coe±cients in VIS-NIR region,"Meat Science 75, 78�83 (2007).
178. G. Hale, M. R. Querry, \Optical constants of waterin the 200 nm to 200�m wavelength region," Appl.Opt. 12, 555�563 (1973).
179. A. N. Bashkatov, E. A. Genina, V. I. Kochubey,M. M. Stolnitz, T. A. Bashkatova, O. V. Novikova,A.Yu. Peshkova, V. V. Tuchin, \Optical propertiesof melanin in the skin and skin-like phantoms,"Proc. SPIE 4162, 219�226 (2000).
180. F. P. Bolin, L. E. Preuss, R. C. Taylor, R. J.Ference, \Refractive index of some mammaliantissues using a ¯ber optic cladding method," Appl.Opt. 28, 2297�2303 (1989).
181. S. Cheng, H. Y. Shen, G. Zhang, C. H. Huang, X. J.Huang, \Measurement of the refractive index ofbiotissue at four laser wavelengths," Proc. SPIE4916, 172�176 (2002).
182. H. Li, S. Xie, \Measurement method of therefractive index of biotissue by total internalre°ection," Appl. Opt. 35, 1793�1795 (1996).
183. A. N. Bashkatov, E. A. Genina, V. I. Kochubey,V. V. Tuchin, \Estimation of wavelength depen-dence of refractive index of collagen ¯bers of scleraltissue," Proc. SPIE 4162, 265�268 (2000).
184. A. N. Bashkatov, E. A. Genina, I. V. Korovina,V. I. Kochubey, Yu. P. Sinichkin, V. V. Tuchin,\In vivo and in vitro study of control of rat skinoptical properties by acting of osmotical liquid,"Proc. SPIE 4224, 300�311 (2000).
185. Y. Komai, T. Ushiki, \The three-dimensionalorganization of collagen ¯brils in the human corneaand sclera," Invest. Ophthal. Visual Sci. 32,2244�2258 (1991).
186. A. F. Fercher, \Optical coherence tomography,"J. Biomed. Opt. 1, 157�173 (1996).
187. V. V. Tuchin, \Coherence-domain methods in tis-sue and cell optics," Laser Phys. 8, 807�849(1998).
188. V. V. Tuchin, \Coherent optical techniques for theanalysis of tissue structure and dynamics,"J. Biomed. Opt. 4, 106�124 (1999).
189. A. F. Fercher, W. Drexler, C. K. Hitzenberger,T. Lasser, \Optical coherence tomography —
principles and applications," Rep. Prog. Phys. 66,239�303 (2003).
190. J. G. Fujimoto, M. E. Brezinski, \Optical coher-ence tomography imaging," Chap. 13 in Biomedi-cal Photonics Handbook, Tuan Vo-Dinh, (ed.),CRC Press LLC (2003).
191. W. Drexler, \Ultrahigh-resolution optical coher-ence tomography," J. Biomed. Opt. 9, 47�74(2004).
192. D. Levitz, L. Thrane, M. H. Frosz, P. E. Andersen,C. B. Andersen, J. Valanciunaite, J. Swartling,S. Andersson-Engels, P. R. Hansen, \Determinationof optical scattering properties of highly-scatteringmedia in optical coherence tomography images,"Opt. Express 12, 249�259 (2004).
193. A. Knüttel, M. Boehlau-Godau, \Spatially con-¯ned and temporally resolved refractive index andscattering evaluation in human skin performedwith optical coherence tomography," J. Biomed.Opt. 5, 83�92 (2000).
194. A. Knüttel, S. Bonev, W. Knaak, \New method forevaluation of in vivo scattering and refractive indexproperties obtained with optical coherence tomo-graphy," J. Biomed. Opt. 9, 265�273 (2004).
195. I. V. Turchin, E. A. Sergeeva, L. S. Dolin, V. A.Kamensky, \Estimation of biotissue scatteringproperties from OCT images using a small-angleapproximation of transport theory," Laser Phys.13, 1524�1529 (2003).
196. L. S. Dolin, F. I. Feldchtein, G. V. Gelikonov,V. M. Gelikonov, N. D. Gladkova, R. R. Iksanov,V. A. Kamensky, R. V. Kuranov, A. M. Sergeev,N. M. Shakhova, I. V. Turchin, \Fundamentals ofOCT and clinical applications of endoscopicOCT," Chap. 17, in Coherent-Domain OpticalMethods: Biomedical Diagnostics, Environmentaland Material Science, Vol. 2, V. V. Tuchin (ed.),pp. 211�270, Kluwer Academic Publishers, Boston(2004).
197. W. V. Sorin, D. F. Gray, \Simultaneous thicknessand group index measurements using optical low-coherence refractometry," IEEE Photon. Technol.Lett. 4, 105�107 (1992).
198. G. J. Tearney, M. E. Brezinski, J. F. Southern,B. E. Bouma, M. R. Hee, J. G. Fujimoto,\Determination of the refractive index of highlyscattering human tissue by optical coherencetomography," Opt. Lett. 20, 2258�2260 (1995).
199. X. Wang, C. Zhang, L. Zhang, L. Xue, J. Tian,\Simultaneous refractive index and thicknessmeasurement of biotissue by optical coherencetomography," J. Biomed. Opt. 7, 628�632 (2002).
200. A. V. Zvyagin, K. K. M. B. D. Silva, S. A.Alexandrov, T. R. Hillman, J. J. Armstrong,T. Tsuzuki, D. D. Sampson, \Refractive indextomography of turbid media by bifocal opticalcoherence refractometry," Opt. Exp. 11,3503�3517 (2003).
201. S. A. Alexandrov, A. V. Zvyagin, K. K. M. B. D.Silva, D. D. Sampson, \Bifocal optical coherencerefractometry of turbid media," Opt. Lett. 28,117�119 (2003).
202. H. Ding, J. Q. Lu, K. M. Jacobs, X.-H. Hu,\Determination of refractive indices of porcine skin
Optical Properties of Skin and Subcutaneous Tissues 37
tissues and intralipid at eight wavelengths between325 and 1557 nm," J. Opt. Soc. Am. A 22,1151�1157 (2005).
203. H. Ding, J. Q. Lu, W. A. Wooden, P. J. Kragel,X.-H. Hu, \Refractive indices of human skin tissuesat eight wavelengths and estimated dispersion re-lations between 300 and 1600 nm," Phys. Med.Biol. 51, 1479�1489 (2006).
204. M. Sand, T. Gambichler, G. Moussa, F. G.Bechara, D. Sand, P. Altmeyer, K. Ho®mann,\Evaluation of the epidermal refractive index byoptical coherence tomography," Skin Res. Technol.12, 114�118 (2005).
205. J. Lai, Z. Li, C. Wang, A. He, \Experimentalmeasurement of the refractive index of biologicaltissues by total internal re°ection," Appl. Opt. 44,1845�1849 (2005).
206. L. Lin, H. Li, S. Xie, \Linear method of deter-mining the refractive index of biotissue," Proc.SPIE 3863, 177�181 (1999).
207. A. M. Zysk, S. G. Adie, J. J. Armstrong, M. S.Leigh, A. Paduch, D. D. Sampson, F. T. Nguyen,S. A. Boppart, \Needle-based refractive indexmeasurement using low-coherence interferometry,"Opt. Lett. 32, 385�387 (2007).
208. J. J. J. Dirckx, L. S. Kuypers, W. F. Decraemer,\Refractive index of tissue measured with confocalmicroscopy," J. Biomed. Opt. 10, 044014 (2005).
209. P. Sun, Y. Wang, \Measurements of opticalparameters of phantom solution and bulk animaltissues in vitro at 650 nm," Opt. Laser Technol. 42,1�7 (2010).
38 A. N. Bashkatov, E. A. Genina & V. V. Tuchin