Embed Size (px)
Citation preview

Biophysical Journal Volume 105 August 2013 841–847 841
Optical-Resolution Photoacoustic Microscopy: Auscultation of BiologicalSystems at the Cellular Level
Song Hu†‡ and Lihong V. Wang†*†Optical Imaging Laboratory, Department of Biomedical Engineering, Washington University in St. Louis, St. Louis, Missouri; and ‡Departmentof Biomedical Engineering, University of Virginia, Charlottesville, Virginia
ABSTRACT Photoacoustic microscopy (PAM) offers unprecedented sensitivity to optical absorption and opens a new windowto study biological systems at multiple length- and timescales. In particular, optical-resolution PAM (OR-PAM) has pushed thetechnical envelope to submicron length scales and millisecond timescales. Here, we review the state of the art of OR-PAM inbiophysical research. With properly chosen optical wavelengths, OR-PAM can spectrally differentiate a variety of endogenousand exogenous chromophores, unveiling the anatomical, functional, metabolic, and molecular information of biological systems.Newly uncovered contrast mechanisms of linear dichroism and Forster resonance energy transfer further distinguish OR-PAM.Integrating multiple contrasts and advanced scanning mechanisms has capacitated OR-PAM to comprehensively interrogatebiological systems at the cellular level in real time. Two future directions are discussed, where OR-PAM holds the potentialto translate basic biophysical research into clinical healthcare.
INTRODUCTION
Optical microscopy, capable of identifying cellular and sub-cellular structures based on their unique spectral signatures,has long been a driving force in modern biophysics research.Linear (1) and nonlinear (2) fluorescence microscopy haveserved as technical mainstays for decades. Elastic (3,4)and inelastic (5) scattering microscopy are also well estab-lished. In contrast, the development of in vivo opticalabsorption microscopy lags behind.
The invention of optical-resolution photoacoustic micro-scopy (OR-PAM) has narrowed the gap, by enabling acousticdetection of thermoelastically induced pressure waves frombiomolecules’ absorption of short-pulsed or intensity-modu-lated light (6). Within only a few years, OR-PAM has suc-cessfully demonstrated a wide variety of absorption-basedanatomical (7), functional (8,9), metabolic (10,11), molecu-lar (12), and genetic (13) contrasts, and has found broadapplications in neurology (14), vascular biology (15,16),dermatology (17), ophthalmology (18,19), and tissue engi-neering (20).
Photoacoustic tomography, with unique spatial capability,maintains high spatial resolution across four major lengthscales in biology: organelle, cell, tissue, and organ (Fig. 1A) (21). At the cellular level, optical focusing offers OR-PAM with 2.6-mm lateral resolution, whereas optical diffu-sion limits its imaging depth to 1.2 mm in biological tissues(22). The optically defined lateral resolution can be scaleddown to submicron (500 nm) (23) or even subwavelength(200 nm) (24) to image organelle structures, at the expenseof imaging depth. In contrast, the imaging depth of photoa-coustic microscopy (PAM) can be scaled up to a few milli-
Submitted November 1, 2012, and accepted for publication July 12, 2013.
*Correspondence: [email protected]
Editor: Brian Salzberg.
� 2013 by the Biophysical Society
0006-3495/13/08/0841/7 $2.00
meters with an acoustically defined lateral resolution. Suchan implementation is well known as acoustic-resolutionPAM, which breaks through the optical diffusion limit(25). Although the lateral resolution can be scaled betweenthe optical and acoustic regimes, the axial resolution (typi-cally 15 mm) is codetermined acoustically by the band-widths of both the received photoacoustic signal and theultrasonic detector.
Instrumentation
In a typical OR-PAM design (Fig. 1 B), the diffraction-limited optical focus is achieved by a microscope objective.To spatially separate the coaxially aligned optical excitationand acoustic detection, an optical-acoustic beam combinerwith a glass-oil interface is positioned beneath the objective.A decent match in optical refractive index at the inter-face ensures optical transparency, whereas a significantmismatch in acoustic impedance provides acoustic reflec-tion. To improve the sensitivity of acoustic detection, aconcave acoustic lens is ground into the rhomboid prismof the beam combiner. Although confocally aligned withthe optical focus, the acoustic focus (~50 mm in diameter)is 20 times coarser than its optical counterpart due to themuch longer acoustic wavelength. A portion of the gener-ated spherical acoustic wave is converted into a planewave by the acoustic lens and received by an unfocusedultrasonic transducer after being reflected twice at the in-clined surfaces of the rhomboid prism. The second acousticreflection is crucial to achieve high detection sensitivity,because it regains the longitudinal wave that was convertedinto the shear wave at the solid-oil interface (22,26,27). Acorrection lens is attached to the right-angle prism of thebeam combiner to compensate for the optical aberrationsalong the light path.
http://dx.doi.org/10.1016/j.bpj.2013.07.017
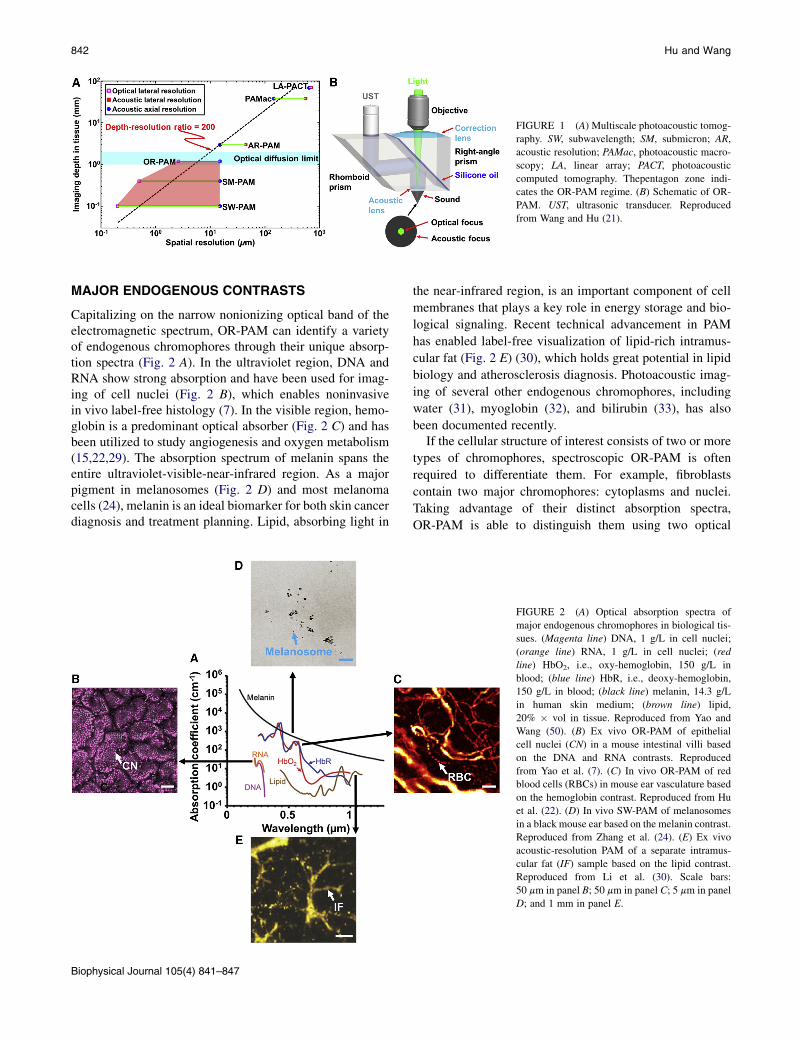
FIGURE 1 (A) Multiscale photoacoustic tomog-
raphy. SW, subwavelength; SM, submicron; AR,
acoustic resolution; PAMac, photoacoustic macro-
scopy; LA, linear array; PACT, photoacoustic
computed tomography. Thepentagon zone indi-
cates the OR-PAM regime. (B) Schematic of OR-
PAM. UST, ultrasonic transducer. Reproduced
from Wang and Hu (21).
842 Hu and Wang
MAJOR ENDOGENOUS CONTRASTS
Capitalizing on the narrow nonionizing optical band of theelectromagnetic spectrum, OR-PAM can identify a varietyof endogenous chromophores through their unique absorp-tion spectra (Fig. 2 A). In the ultraviolet region, DNA andRNA show strong absorption and have been used for imag-ing of cell nuclei (Fig. 2 B), which enables noninvasivein vivo label-free histology (7). In the visible region, hemo-globin is a predominant optical absorber (Fig. 2 C) and hasbeen utilized to study angiogenesis and oxygen metabolism(15,22,29). The absorption spectrum of melanin spans theentire ultraviolet-visible-near-infrared region. As a majorpigment in melanosomes (Fig. 2 D) and most melanomacells (24), melanin is an ideal biomarker for both skin cancerdiagnosis and treatment planning. Lipid, absorbing light in
Biophysical Journal 105(4) 841–847
the near-infrared region, is an important component of cell
membranes that plays a key role in energy storage and bio-
logical signaling. Recent technical advancement in PAM
has enabled label-free visualization of lipid-rich intramus-
cular fat (Fig. 2 E) (30), which holds great potential in lipid
biology and atherosclerosis diagnosis. Photoacoustic imag-
ing of several other endogenous chromophores, including
water (31), myoglobin (32), and bilirubin (33), has also
been documented recently.If the cellular structure of interest consists of two or more
types of chromophores, spectroscopic OR-PAM is often
required to differentiate them. For example, fibroblasts
contain two major chromophores: cytoplasms and nuclei.
Taking advantage of their distinct absorption spectra,
OR-PAM is able to distinguish them using two optical
FIGURE 2 (A) Optical absorption spectra of
major endogenous chromophores in biological tis-
sues. (Magenta line) DNA, 1 g/L in cell nuclei;
(orange line) RNA, 1 g/L in cell nuclei; (red
line) HbO2, i.e., oxy-hemoglobin, 150 g/L in
blood; (blue line) HbR, i.e., deoxy-hemoglobin,
150 g/L in blood; (black line) melanin, 14.3 g/L
in human skin medium; (brown line) lipid,
20% � vol in tissue. Reproduced from Yao and
Wang (50). (B) Ex vivo OR-PAM of epithelial
cell nuclei (CN) in a mouse intestinal villi based
on the DNA and RNA contrasts. Reproduced
from Yao et al. (7). (C) In vivo OR-PAM of red
blood cells (RBCs) in mouse ear vasculature based
on the hemoglobin contrast. Reproduced from Hu
et al. (22). (D) In vivo SW-PAM of melanosomes
in a black mouse ear based on the melanin contrast.
Reproduced from Zhang et al. (24). (E) Ex vivo
acoustic-resolution PAM of a separate intramus-
cular fat (IF) sample based on the lipid contrast.
Reproduced from Li et al. (30). Scale bars:
50 mm in panel B; 50 mm in panel C; 5 mm in panel
D; and 1 mm in panel E.

OR-PAM of Biological Systems at Cellular Level 843
wavelengths: 422 nm for cytoplasms (Fig. 3 A) and250 nm for nuclei (Fig. 3 B) (34). The superimposed label-freeOR-PAMimage of fibroblast (Fig. 3C)matches perfectlythe fluorescence image acquired after staining (Fig. 3 D).
If the absorption spectra of the chromophores of interestoverlap significantly, spectral decomposition is required. Acommon example is to differentiate oxy-hemoglobin(HbO2) and deoxy-hemoglobin (HbR) for the quantificationof hemoglobin oxygen saturation (sO2).
To decompose the experimentally measured bloodabsorption spectrum, we relate the photoacoustic amplitudeof blood (F) to the concentrations of HbO2 and HbR([HbO2] and [HbR]) as
FðliÞfmaðliÞ ,FðliÞ ¼ fεHbRðliÞ , ½HbR�þ εHbO2
ðliÞ , ½HbO2�g ,FðliÞ;(1)
where li is the optical wavelength; ma and F are the bloodabsorption coefficient and optical fluence, respectively;
FIGURE 3 Label-free OR-PAM of fixed but unstained fibroblasts at (A)
422 nm and (B) 250 nm. (C) A superimposed image of panels A and B. (D)
Fluorescence microscopy of the same sample with mitochondria and nuclei
stained in different colors. Scale bar in panel A is 20 mm and applies to all
panels. PA, photoacoustic. Reproduced from Zhang et al. (34).
sO2 ¼ Fðl1Þ , εHbRðl2ÞFðl1Þ , ½εHbRðl2Þ � εHbO2
ðl2Þ�
and εHbO2and εHbR are the molar extinction coefficients of
HbO2 and HbR, respectively (35). By assuming that F iswavelength-independent, which is a valid approximationwithin the optical diffusion limit in the absence of strongintervening absorption, we can compute [HbO2] and[HbR] in relative values based on two independent measure-ments acquired at two wavelengths (l1 and l2):
½HbO2� ¼ K ,Fðl1Þ , εHbRðl2Þ � Fðl2Þ , εHbRðl1Þ
εHbO2ðl1Þ , εHbRðl2Þ � εHbO2
ðl2Þ , εHbRðl1Þ;(2)
and
½HbR� ¼ K ,Fðl1Þ , εHbRðl2Þ � Fðl2Þ , εHbRðl1Þ
εHbRðl1Þ , εHbO2ðl2Þ � εHbRðl2Þ , εHbO2
ðl1Þ;(3)
where K is a constant prefactor.Consequently, the sO2 can be computed as
�Fðl2Þ , εHbRðl1Þ�Fðl2Þ , ½εHbRðl1Þ � εHbO2
ðl1Þ�: (4)
NEW CONTRASTS
Dichroism
Dichroism, or polarization-dependent optical absorption,has been reported recently as a new contrast mechanismfor molecular OR-PAM (36). There are three strong motiva-tions to target dichroism:
First, dichroism is a unique molecular signature that pro-vides an ideal specificity.
Second, the polarization-dependent optical absorptionenables differential detection, which can eliminatenondichroic background and enhance sensitivity.
Third, and a more specific motivation, is that amyloidplaque, a hallmark of amyloid-associated neurodegen-erative diseases, shows linear dichroism when labeledwith Congo Red (37).
As a demonstration, OR-PAM examined a brain sectionfrom an APP/PS1 Alzheimer’s mouse with weak Congo-Red staining (targeting amyloid plaques) and strongNeutral-Red staining (targeting the Golgi apparatus in cellsand Nissl granules in neurons, both of which are nondi-chroic) (Fig. 4, A and B). In both images acquired withtwo orthogonally polarized optical excitations, the plaquesignal was obscured by the overwhelming Neutral Red-stained background (Fig. 4, C and D). Strikingly, whereas
Biophysical Journal 105(4) 841–847
FIGURE 4 Dichroism OR-PAM of amyloid pla-
ques in a brain section from an APP/PS1 mouse.
(A) Optical microscopic photo of the brain section
double-stained with Congo-Red (CR) and Neutral-
Red (NR). (B) Close-up of the boxed area in panel
A, showing the CR-stained amyloid plaque and the
NR-stained background cells. (C and D) OR-PAM
images acquired with each of the two orthogonally
polarized optical irradiations. (E and F) Sum-
mation and subtraction of panels C and D,
respectively. The differential detection in panel F
eliminates the NR-stained nondichroic background
and highlights the dichroic contrast of the
CR-stained amyloid plaque. Scale bar in panel F
is 100 mm and applies to all panels. PA, photoa-
coustic.
844 Hu and Wang
summation of the two images (Fig. 4 E) does not reveal newcontrast, subtraction completely removed the nondichroicbackground and highlighted the quadruple-shaped dichro-ism feature of the amyloid plaque (Fig. 4 F).
Previously, conventional OR-PAM demonstrated intra-vital amyloid plaque imaging through a cranial window(12). However, such a window may adversely influencethe behavior of underlying brain tissues and bias researchoutcomes (38). Reflection-mode dichroism OR-PAM, withenhanced sensitivity and specificity, may be capable of visu-alizing individual amyloid plaques through intact skulls andcreate a powerful in vivo screen for anti-amyloid drugs.
Forster resonance energy transfer
The Forster resonance energy transfer (FRET) effect, encod-ing the distance information between molecules (typically1–10 nm), has been a valuable tool in biophysical studiesof protein interactions and conformational changes (39).OR-PAM has been adopted recently to extend the penetra-tion of high-resolution FRET imaging (40). Unlike conven-tional FRET microscopy, which relies on the transition offluorescence energy from donor to acceptor, FRET OR-PAM measures the heat production during the nonradiativedipole-dipole coupling. Therefore, if a nonfluorescentquencher is selected as the acceptor, the FRET energy willbe converted into acoustic waves through heat generationand subsequent thermoelastic expansion.
To demonstrate the superior imaging depth of FRET OR-PAM, seven tubes with different concentrations of fluores-cent donor Rhodamine 6G (R6G) and nonfluorescentacceptor 1,30diethyl-4,20quinolyoxacarbocyanide iodide(DQOCI) were imaged through freshly harvested mouseskin (Fig. 5 A). The strong optical scattering of the skinseverely degrades the resolution of the fluorescence FRETimage and overwhelms the quenching effect of the donor(Fig. 5 B). In contrast, OR-PAM clearly resolves all seven
Biophysical Journal 105(4) 841–847
tubes (Fig. 5 C) and provides sufficient signal/noise forthe quantification of FRET efficiency (40). Further, thecross-sectional (B-scan) FRET OR-PAM image validatesan extended imaging depth of ~1 mm (Fig. 5 D).
PHOTOACOUSTIC FLOWOXIGRAPHY: A NEWFRONTIER OF OR-PAM
Integrating the fine length- and timescales, OR-PAMopens the door to understanding the fundamental mecha-nism of oxygen metabolism in biological systems. Photoa-coustic flowoxigraphy, a new OR-PAM implementation,has demonstrated real-time multiparameter quantifica-tion of oxygen release from single red blood cells (RBCs)in vivo (29).
Near video-rate (20 Hz) dual-wavelength B-scan moni-toring of a mouse-brain capillary in vivo clearly showsthat the hemoglobin in a representative RBC is deoxygen-ated by 3% over a 32-mm travel distance (Fig. 6 A). Takingadvantage of the ultra-short-wavelength switching time(20 ms), fast scanning speed, and high spatial resolution,multiple hemodynamic parameters—including the concen-tration of total hemoglobin (HbT), sO2, sO2 reduction perunit length (VsO2), and flow speed (vf)—can be simulta-neously quantified at the single-RBC level (Fig. 6 B).Further, the rate of single-RBC oxygen release (rO2) canbe defined and computed in relative values as
rO2fHbT , ðsO2in � sO2outÞ
t¼ HbT ,VsO2 , vf ; (5)
where sO2in and sO2out are the sO2 values of the RBC whenentering and exiting the region of interest, respectively.
Photoacoustic flowoxigraphy experimentally shows thatrO2 is proportional to the total amount of oxygen releasedby the RBC (VsO2 multiplied by the pathlength), butinversely proportional to its dwell time in the field of view
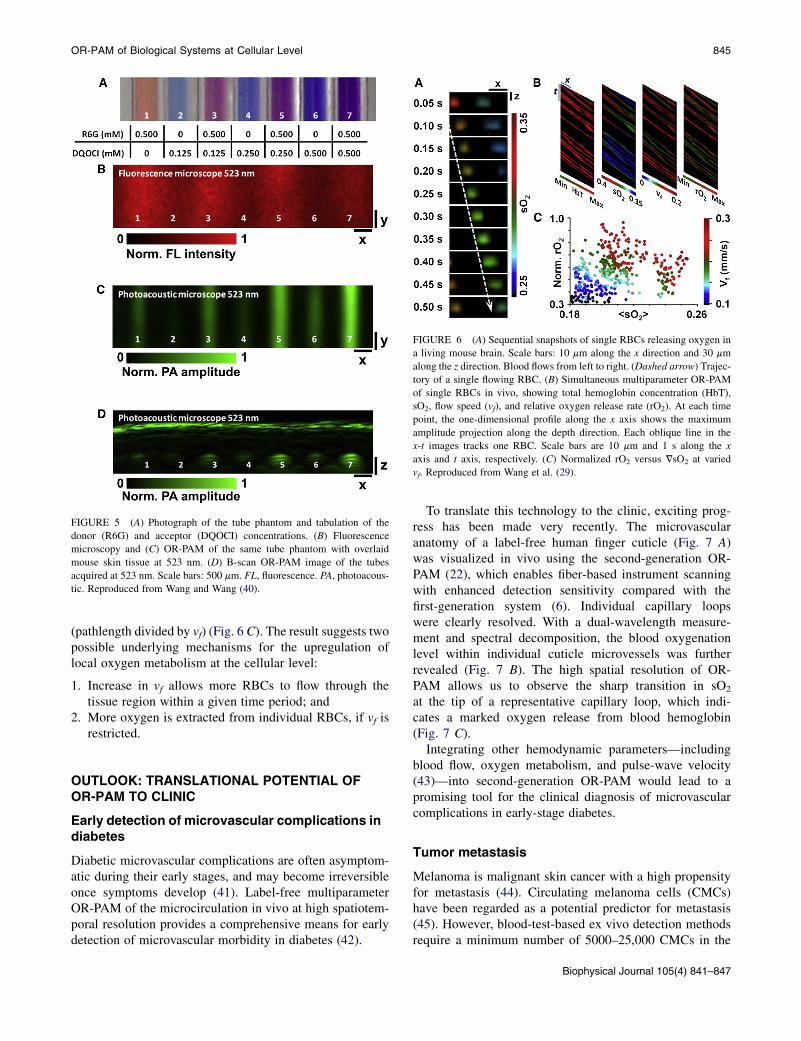
FIGURE 6 (A) Sequential snapshots of single RBCs releasing oxygen in
a living mouse brain. Scale bars: 10 mm along the x direction and 30 mm
along the z direction. Blood flows from left to right. (Dashed arrow) Trajec-
tory of a single flowing RBC. (B) Simultaneous multiparameter OR-PAM
of single RBCs in vivo, showing total hemoglobin concentration (HbT),
sO2, flow speed (vf), and relative oxygen release rate (rO2). At each time
point, the one-dimensional profile along the x axis shows the maximum
amplitude projection along the depth direction. Each oblique line in the
x-t images tracks one RBC. Scale bars are 10 mm and 1 s along the x
axis and t axis, respectively. (C) Normalized rO2 versus VsO2 at varied
vf. Reproduced from Wang et al. (29).
FIGURE 5 (A) Photograph of the tube phantom and tabulation of the
donor (R6G) and acceptor (DQOCI) concentrations. (B) Fluorescence
microscopy and (C) OR-PAM of the same tube phantom with overlaid
mouse skin tissue at 523 nm. (D) B-scan OR-PAM image of the tubes
acquired at 523 nm. Scale bars: 500 mm. FL, fluorescence. PA, photoacous-
tic. Reproduced from Wang and Wang (40).
OR-PAM of Biological Systems at Cellular Level 845
(pathlength divided by vf) (Fig. 6 C). The result suggests twopossible underlying mechanisms for the upregulation oflocal oxygen metabolism at the cellular level:
1. Increase in vf allows more RBCs to flow through thetissue region within a given time period; and
2. More oxygen is extracted from individual RBCs, if vf isrestricted.
OUTLOOK: TRANSLATIONAL POTENTIAL OFOR-PAM TO CLINIC
Early detection of microvascular complications indiabetes
Diabetic microvascular complications are often asymptom-atic during their early stages, and may become irreversibleonce symptoms develop (41). Label-free multiparameterOR-PAM of the microcirculation in vivo at high spatiotem-poral resolution provides a comprehensive means for earlydetection of microvascular morbidity in diabetes (42).
To translate this technology to the clinic, exciting prog-ress has been made very recently. The microvascularanatomy of a label-free human finger cuticle (Fig. 7 A)was visualized in vivo using the second-generation OR-PAM (22), which enables fiber-based instrument scanningwith enhanced detection sensitivity compared with thefirst-generation system (6). Individual capillary loopswere clearly resolved. With a dual-wavelength measure-ment and spectral decomposition, the blood oxygenationlevel within individual cuticle microvessels was furtherrevealed (Fig. 7 B). The high spatial resolution of OR-PAM allows us to observe the sharp transition in sO2
at the tip of a representative capillary loop, which indi-cates a marked oxygen release from blood hemoglobin(Fig. 7 C).
Integrating other hemodynamic parameters—includingblood flow, oxygen metabolism, and pulse-wave velocity(43)—into second-generation OR-PAM would lead to apromising tool for the clinical diagnosis of microvascularcomplications in early-stage diabetes.
Tumor metastasis
Melanoma is malignant skin cancer with a high propensityfor metastasis (44). Circulating melanoma cells (CMCs)have been regarded as a potential predictor for metastasis(45). However, blood-test-based ex vivo detection methodsrequire a minimum number of 5000–25,000 CMCs in the
Biophysical Journal 105(4) 841–847
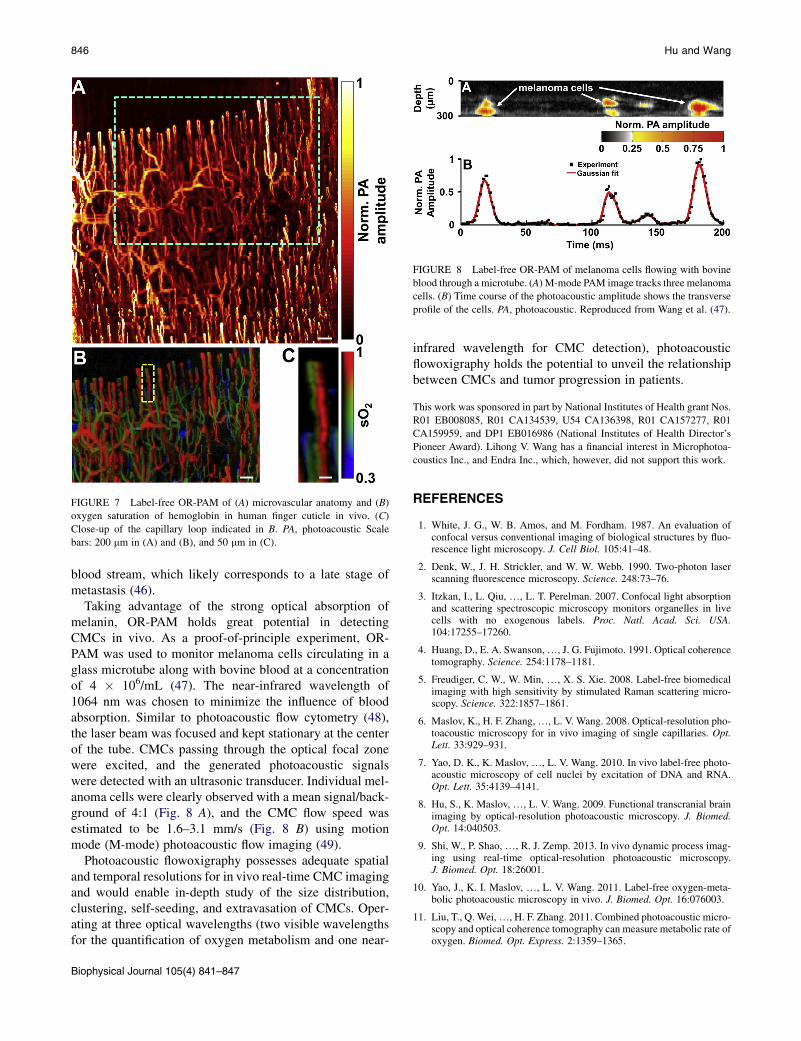
FIGURE 7 Label-free OR-PAM of (A) microvascular anatomy and (B)
oxygen saturation of hemoglobin in human finger cuticle in vivo. (C)
Close-up of the capillary loop indicated in B. PA, photoacoustic Scale
bars: 200 mm in (A) and (B), and 50 mm in (C).
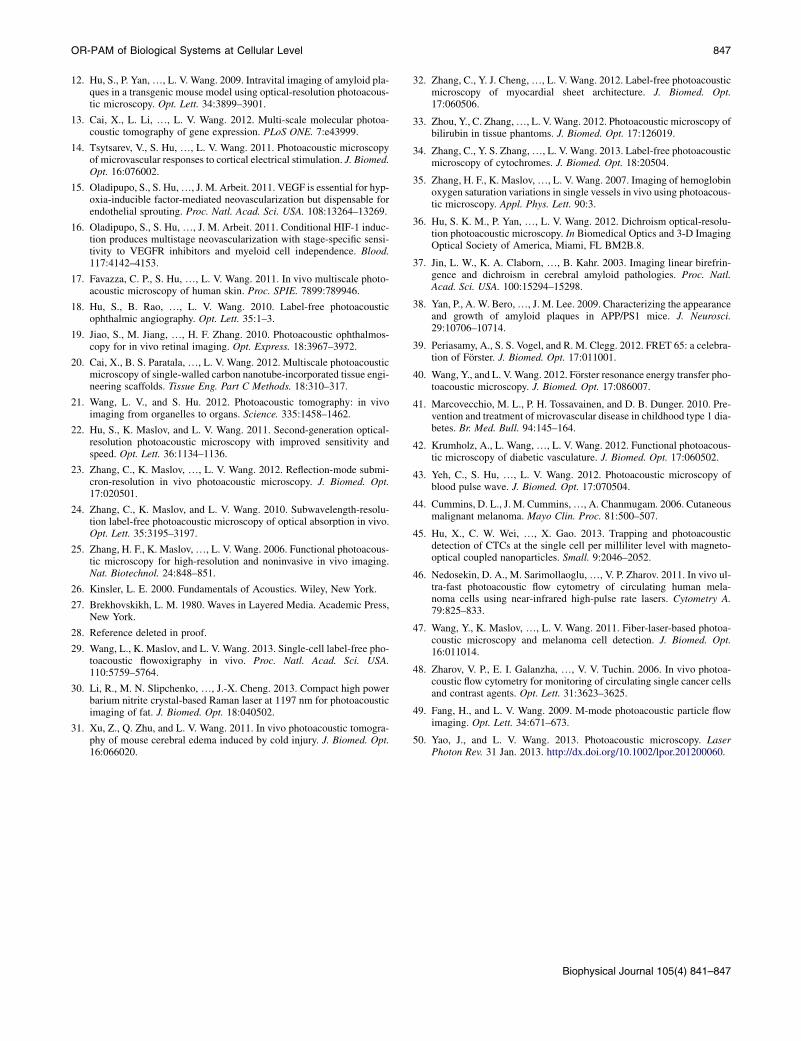
FIGURE 8 Label-free OR-PAM of melanoma cells flowing with bovine
blood through a microtube. (A) M-mode PAM image tracks three melanoma
cells. (B) Time course of the photoacoustic amplitude shows the transverse
profile of the cells. PA, photoacoustic. Reproduced from Wang et al. (47).
846 Hu and Wang
blood stream, which likely corresponds to a late stage ofmetastasis (46).
Taking advantage of the strong optical absorption ofmelanin, OR-PAM holds great potential in detectingCMCs in vivo. As a proof-of-principle experiment, OR-PAM was used to monitor melanoma cells circulating in aglass microtube along with bovine blood at a concentrationof 4 � 106/mL (47). The near-infrared wavelength of1064 nm was chosen to minimize the influence of bloodabsorption. Similar to photoacoustic flow cytometry (48),the laser beam was focused and kept stationary at the centerof the tube. CMCs passing through the optical focal zonewere excited, and the generated photoacoustic signalswere detected with an ultrasonic transducer. Individual mel-anoma cells were clearly observed with a mean signal/back-ground of 4:1 (Fig. 8 A), and the CMC flow speed wasestimated to be 1.6–3.1 mm/s (Fig. 8 B) using motionmode (M-mode) photoacoustic flow imaging (49).
Photoacoustic flowoxigraphy possesses adequate spatialand temporal resolutions for in vivo real-time CMC imagingand would enable in-depth study of the size distribution,clustering, self-seeding, and extravasation of CMCs. Oper-ating at three optical wavelengths (two visible wavelengthsfor the quantification of oxygen metabolism and one near-
Biophysical Journal 105(4) 841–847
infrared wavelength for CMC detection), photoacousticflowoxigraphy holds the potential to unveil the relationshipbetween CMCs and tumor progression in patients.
This work was sponsored in part by National Institutes of Health grant Nos.
R01 EB008085, R01 CA134539, U54 CA136398, R01 CA157277, R01
CA159959, and DP1 EB016986 (National Institutes of Health Director’s
Pioneer Award). Lihong V. Wang has a financial interest in Microphotoa-
coustics Inc., and Endra Inc., which, however, did not support this work.
REFERENCES
1. White, J. G., W. B. Amos, and M. Fordham. 1987. An evaluation ofconfocal versus conventional imaging of biological structures by fluo-rescence light microscopy. J. Cell Biol. 105:41–48.
2. Denk, W., J. H. Strickler, and W. W. Webb. 1990. Two-photon laserscanning fluorescence microscopy. Science. 248:73–76.
3. Itzkan, I., L. Qiu, ., L. T. Perelman. 2007. Confocal light absorptionand scattering spectroscopic microscopy monitors organelles in livecells with no exogenous labels. Proc. Natl. Acad. Sci. USA.104:17255–17260.
4. Huang, D., E. A. Swanson,., J. G. Fujimoto. 1991. Optical coherencetomography. Science. 254:1178–1181.
5. Freudiger, C. W., W. Min, ., X. S. Xie. 2008. Label-free biomedicalimaging with high sensitivity by stimulated Raman scattering micro-scopy. Science. 322:1857–1861.
6. Maslov, K., H. F. Zhang,., L. V. Wang. 2008. Optical-resolution pho-toacoustic microscopy for in vivo imaging of single capillaries. Opt.Lett. 33:929–931.
7. Yao, D. K., K. Maslov, ., L. V. Wang. 2010. In vivo label-free photo-acoustic microscopy of cell nuclei by excitation of DNA and RNA.Opt. Lett. 35:4139–4141.
8. Hu, S., K. Maslov, ., L. V. Wang. 2009. Functional transcranial brainimaging by optical-resolution photoacoustic microscopy. J. Biomed.Opt. 14:040503.
9. Shi, W., P. Shao, ., R. J. Zemp. 2013. In vivo dynamic process imag-ing using real-time optical-resolution photoacoustic microscopy.J. Biomed. Opt. 18:26001.
10. Yao, J., K. I. Maslov, ., L. V. Wang. 2011. Label-free oxygen-meta-bolic photoacoustic microscopy in vivo. J. Biomed. Opt. 16:076003.
11. Liu, T., Q. Wei,., H. F. Zhang. 2011. Combined photoacoustic micro-scopy and optical coherence tomography can measure metabolic rate ofoxygen. Biomed. Opt. Express. 2:1359–1365.
OR-PAM of Biological Systems at Cellular Level 847
12. Hu, S., P. Yan,., L. V. Wang. 2009. Intravital imaging of amyloid pla-ques in a transgenic mouse model using optical-resolution photoacous-tic microscopy. Opt. Lett. 34:3899–3901.
13. Cai, X., L. Li, ., L. V. Wang. 2012. Multi-scale molecular photoa-coustic tomography of gene expression. PLoS ONE. 7:e43999.
14. Tsytsarev, V., S. Hu, ., L. V. Wang. 2011. Photoacoustic microscopyof microvascular responses to cortical electrical stimulation. J. Biomed.Opt. 16:076002.
15. Oladipupo, S., S. Hu,., J. M. Arbeit. 2011. VEGF is essential for hyp-oxia-inducible factor-mediated neovascularization but dispensable forendothelial sprouting. Proc. Natl. Acad. Sci. USA. 108:13264–13269.
16. Oladipupo, S., S. Hu,., J. M. Arbeit. 2011. Conditional HIF-1 induc-tion produces multistage neovascularization with stage-specific sensi-tivity to VEGFR inhibitors and myeloid cell independence. Blood.117:4142–4153.
17. Favazza, C. P., S. Hu, ., L. V. Wang. 2011. In vivo multiscale photo-acoustic microscopy of human skin. Proc. SPIE. 7899:789946.
18. Hu, S., B. Rao, ., L. V. Wang. 2010. Label-free photoacousticophthalmic angiography. Opt. Lett. 35:1–3.
19. Jiao, S., M. Jiang, ., H. F. Zhang. 2010. Photoacoustic ophthalmos-copy for in vivo retinal imaging. Opt. Express. 18:3967–3972.
20. Cai, X., B. S. Paratala,., L. V. Wang. 2012. Multiscale photoacousticmicroscopy of single-walled carbon nanotube-incorporated tissue engi-neering scaffolds. Tissue Eng. Part C Methods. 18:310–317.
21. Wang, L. V., and S. Hu. 2012. Photoacoustic tomography: in vivoimaging from organelles to organs. Science. 335:1458–1462.
22. Hu, S., K. Maslov, and L. V. Wang. 2011. Second-generation optical-resolution photoacoustic microscopy with improved sensitivity andspeed. Opt. Lett. 36:1134–1136.
23. Zhang, C., K. Maslov, ., L. V. Wang. 2012. Reflection-mode submi-cron-resolution in vivo photoacoustic microscopy. J. Biomed. Opt.17:020501.
24. Zhang, C., K. Maslov, and L. V. Wang. 2010. Subwavelength-resolu-tion label-free photoacoustic microscopy of optical absorption in vivo.Opt. Lett. 35:3195–3197.
25. Zhang, H. F., K. Maslov,., L. V. Wang. 2006. Functional photoacous-tic microscopy for high-resolution and noninvasive in vivo imaging.Nat. Biotechnol. 24:848–851.
26. Kinsler, L. E. 2000. Fundamentals of Acoustics. Wiley, New York.
27. Brekhovskikh, L. M. 1980. Waves in Layered Media. Academic Press,New York.
28. Reference deleted in proof.
29. Wang, L., K. Maslov, and L. V. Wang. 2013. Single-cell label-free pho-toacoustic flowoxigraphy in vivo. Proc. Natl. Acad. Sci. USA.110:5759–5764.
30. Li, R., M. N. Slipchenko, ., J.-X. Cheng. 2013. Compact high powerbarium nitrite crystal-based Raman laser at 1197 nm for photoacousticimaging of fat. J. Biomed. Opt. 18:040502.
31. Xu, Z., Q. Zhu, and L. V. Wang. 2011. In vivo photoacoustic tomogra-phy of mouse cerebral edema induced by cold injury. J. Biomed. Opt.16:066020.
32. Zhang, C., Y. J. Cheng,., L. V. Wang. 2012. Label-free photoacousticmicroscopy of myocardial sheet architecture. J. Biomed. Opt.17:060506.
33. Zhou, Y., C. Zhang,., L. V. Wang. 2012. Photoacoustic microscopy ofbilirubin in tissue phantoms. J. Biomed. Opt. 17:126019.
34. Zhang, C., Y. S. Zhang,., L. V. Wang. 2013. Label-free photoacousticmicroscopy of cytochromes. J. Biomed. Opt. 18:20504.
35. Zhang, H. F., K. Maslov,., L. V. Wang. 2007. Imaging of hemoglobinoxygen saturation variations in single vessels in vivo using photoacous-tic microscopy. Appl. Phys. Lett. 90:3.
36. Hu, S. K. M., P. Yan, ., L. V. Wang. 2012. Dichroism optical-resolu-tion photoacoustic microscopy. In Biomedical Optics and 3-D ImagingOptical Society of America, Miami, FL BM2B.8.
37. Jin, L. W., K. A. Claborn, ., B. Kahr. 2003. Imaging linear birefrin-gence and dichroism in cerebral amyloid pathologies. Proc. Natl.Acad. Sci. USA. 100:15294–15298.
38. Yan, P., A. W. Bero,., J. M. Lee. 2009. Characterizing the appearanceand growth of amyloid plaques in APP/PS1 mice. J. Neurosci.29:10706–10714.
39. Periasamy, A., S. S. Vogel, and R. M. Clegg. 2012. FRET 65: a celebra-tion of Forster. J. Biomed. Opt. 17:011001.
40. Wang, Y., and L. V. Wang. 2012. Forster resonance energy transfer pho-toacoustic microscopy. J. Biomed. Opt. 17:086007.
41. Marcovecchio, M. L., P. H. Tossavainen, and D. B. Dunger. 2010. Pre-vention and treatment of microvascular disease in childhood type 1 dia-betes. Br. Med. Bull. 94:145–164.
42. Krumholz, A., L. Wang,., L. V. Wang. 2012. Functional photoacous-tic microscopy of diabetic vasculature. J. Biomed. Opt. 17:060502.
43. Yeh, C., S. Hu, ., L. V. Wang. 2012. Photoacoustic microscopy ofblood pulse wave. J. Biomed. Opt. 17:070504.
44. Cummins, D. L., J. M. Cummins,., A. Chanmugam. 2006. Cutaneousmalignant melanoma. Mayo Clin. Proc. 81:500–507.
45. Hu, X., C. W. Wei, ., X. Gao. 2013. Trapping and photoacousticdetection of CTCs at the single cell per milliliter level with magneto-optical coupled nanoparticles. Small. 9:2046–2052.
46. Nedosekin, D. A., M. Sarimollaoglu,., V. P. Zharov. 2011. In vivo ul-tra-fast photoacoustic flow cytometry of circulating human mela-noma cells using near-infrared high-pulse rate lasers. Cytometry A.79:825–833.
47. Wang, Y., K. Maslov, ., L. V. Wang. 2011. Fiber-laser-based photoa-coustic microscopy and melanoma cell detection. J. Biomed. Opt.16:011014.
48. Zharov, V. P., E. I. Galanzha, ., V. V. Tuchin. 2006. In vivo photoa-coustic flow cytometry for monitoring of circulating single cancer cellsand contrast agents. Opt. Lett. 31:3623–3625.
49. Fang, H., and L. V. Wang. 2009. M-mode photoacoustic particle flowimaging. Opt. Lett. 34:671–673.
50. Yao, J., and L. V. Wang. 2013. Photoacoustic microscopy. LaserPhoton Rev. 31 Jan. 2013. http://dx.doi.org/10.1002/lpor.201200060.
Biophysical Journal 105(4) 841–847