Embed Size (px)
Citation preview
Optical Studies of type IIb supernova SN 2011dh
Devendra Sahu Indian Instt. Of Astrophysics
Bangalore, India
G.C. Anupama, Nand Kumar
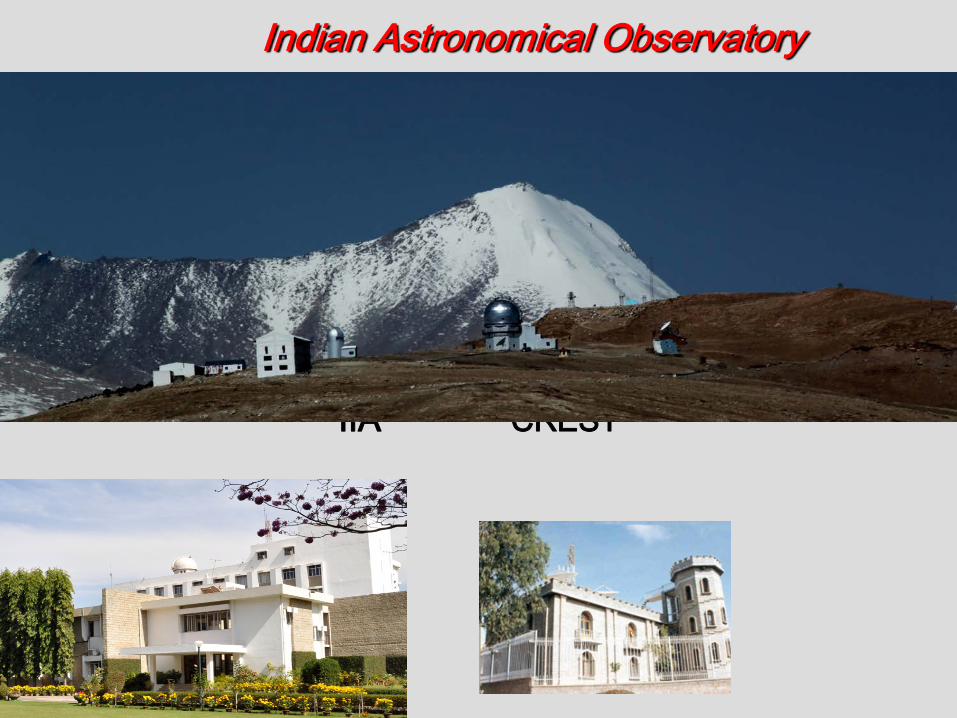
Indian Astronomical Observatory
IIA CREST
SN 2011dh Discovery - June 01.89 in the galaxy M51, Detection on May 31.89 Non detection on May 30.1 PTF – detected on June 1.19 (PTF11eon) Non detection on May 31.275 Classification - Spectrum taken on June 03
young type II SN (Silverman et al., Yamanaka et al. 2011).
Arcavi et al. (2011)- possibly IIb Emergence of HeI features in the
IR spectra - consistent with IIb.
Follow up studies Radio – detected 3 days past discovery (CARMA) Radio evolution - VLBI and EVLA X-ray – detected by Swift XRT 3 days after
explosion – followed with Swift and Chandra. Multi-wavelength study (Soderberg et al. 2012) Optical follow up for first 50 days (Maund et al.) Photometric data for ~ 300 days, preliminary light curve
modeling (Tsvetkov et al. 2012).
Progenitor - HST/ACS – a luminous star at the SN location. Colour mid F-type supergiant but with higher luminosity and more extended radius.
Yellow supergiant MZAMS = 13± 3 Mꙩ (Maund et al.) MZAMS = 17 - 19 Mꙩ (Van Dyk et al.) Soderberg et al. - a compact star progenitor Bersten et al. - large progenitor with radius ~ 200 Rꙩ – consistent with the
yellow super giant detected in the pre-explosion image.
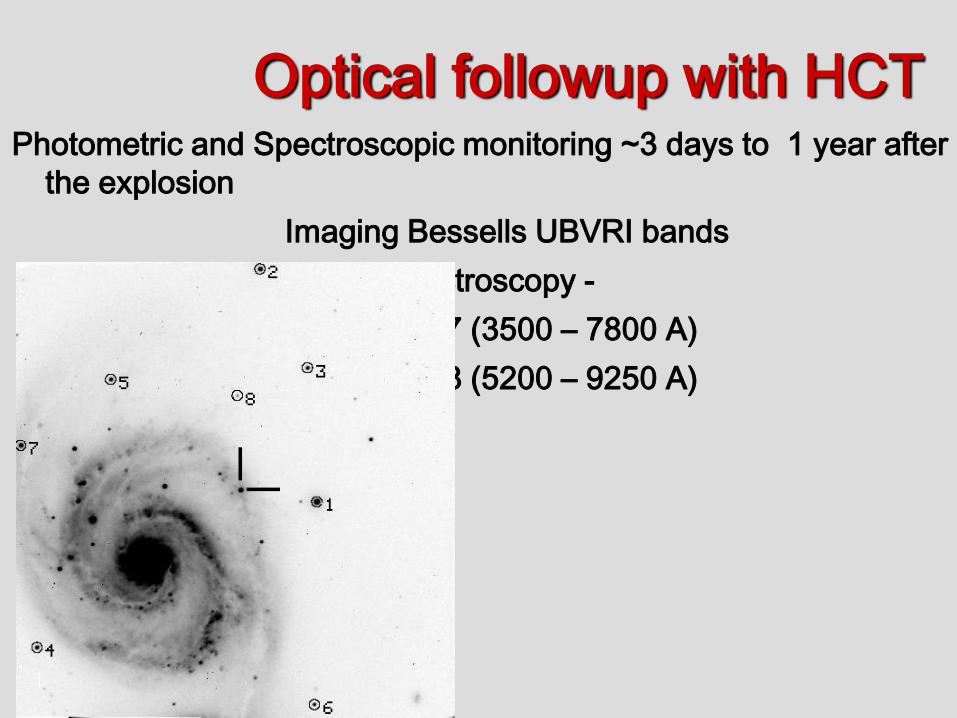
Optical followup with HCT Photometric and Spectroscopic monitoring ~3 days to 1 year after
the explosion Imaging Bessells UBVRI bands Spectroscopy - Gr#7 (3500 – 7800 A) Gr#8 (5200 – 9250 A)
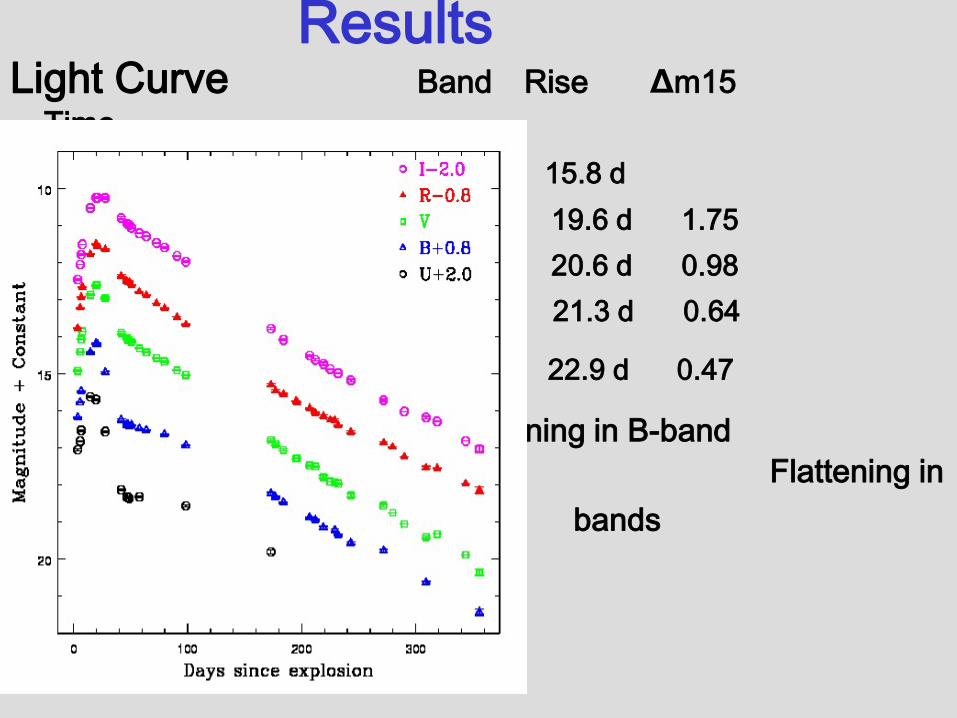
Results Light Curve Band Rise ∆m15
Time U 15.8 d B 19.6 d 1.75 V 20.6 d 0.98 R 21.3 d 0.64
I 22.9 d 0.47 Steepening in B-band
late phase LC, Flattening in the R & I bands
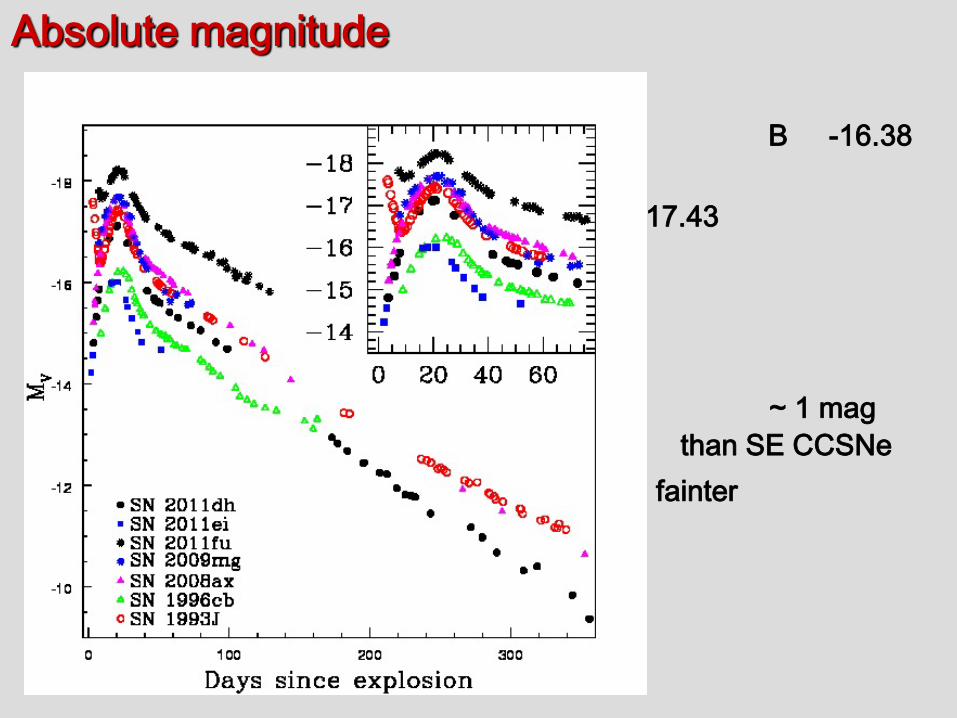
Absolute magnitude
U -16.18 B -16.38 V -17.12
R -17.43 I -17.47
MV = -17.12±0.18 ~ 1 mag fainter than SE CCSNe
~ 0.3 mag fainter than IIb sample
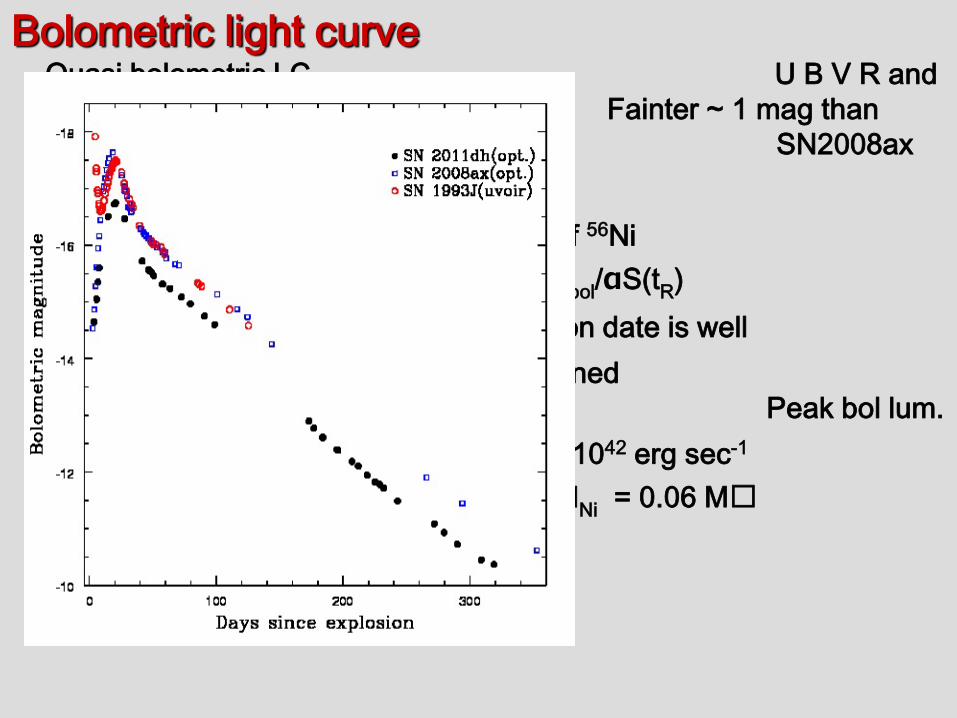
Bolometric light curve Quasi bolometric LC U B V R and I mag. Fainter ~ 1 mag than SN1993J and SN2008ax
Mass of 56Ni MNi = Lbol/αS(tR) Explosion date is well constrained
Rise time 19.6 days Peak bol lum. 1.267 x 1042 erg sec-1
MNi = 0.06 Mꙩ
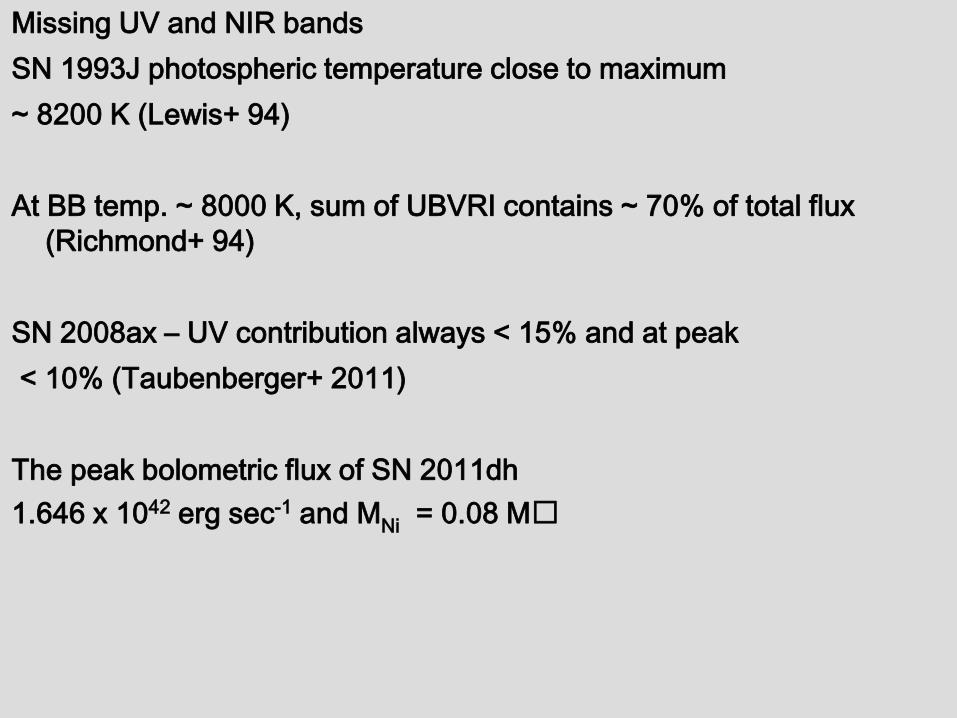
Missing UV and NIR bands SN 1993J photospheric temperature close to maximum ~ 8200 K (Lewis+ 94) At BB temp. ~ 8000 K, sum of UBVRI contains ~ 70% of total flux
(Richmond+ 94) SN 2008ax – UV contribution always < 15% and at peak < 10% (Taubenberger+ 2011) The peak bolometric flux of SN 2011dh 1.646 x 1042 erg sec-1 and MNi = 0.08 Mꙩ
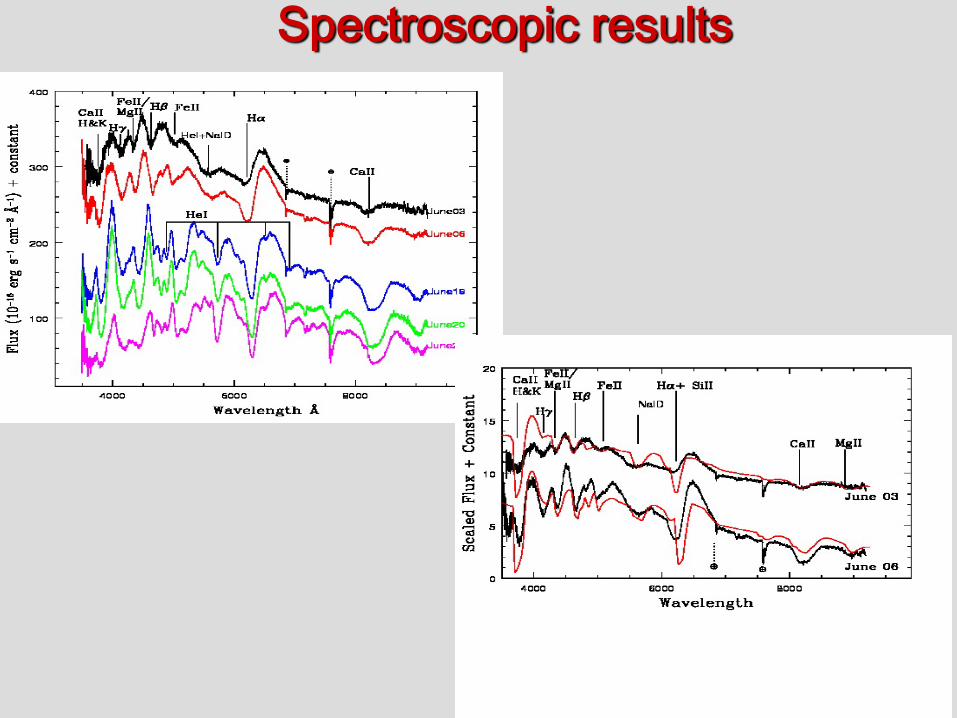
Spectroscopic results
TBB = 7500 K Vph = 12000 km/sec
Vmin = 15000 km/sec
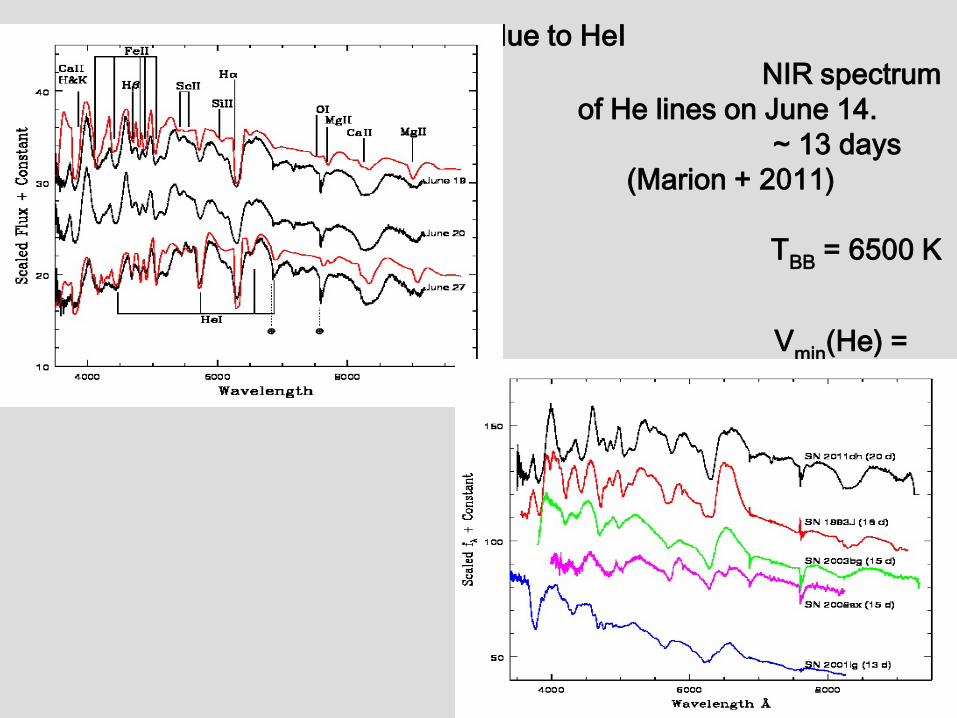
Lines due to HeI
prominent NIR spectrum – detection of He lines on June 14. Emergence of HeI lines ~ 13 days after explosion (Marion + 2011) SN 2008ax ~ 11 days (Taubenberger+ 2011) TBB = 6500 K
Vph = 7000 km/sec Vmin(H) = 10500 km/sec Vmin(He) =
7500 km/sec
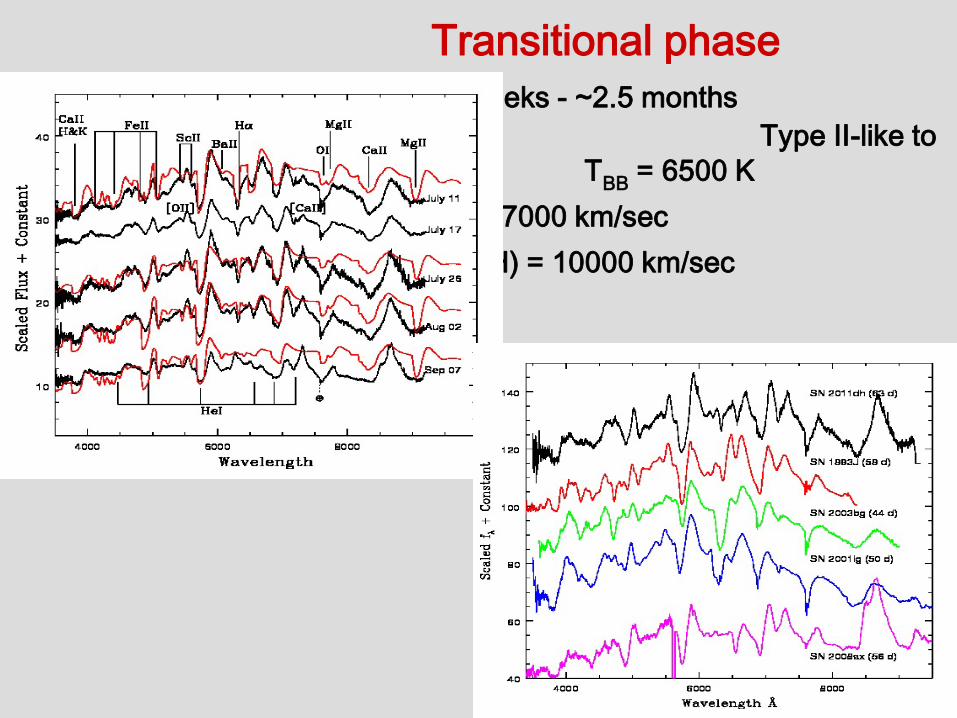
Transitional phase ~3 weeks - ~2.5 months
Metamorphosis from Type II-like to Ib-like spec TBB = 6500 K
Vph = 7000 km/sec Vmin(H) = 10000 km/sec
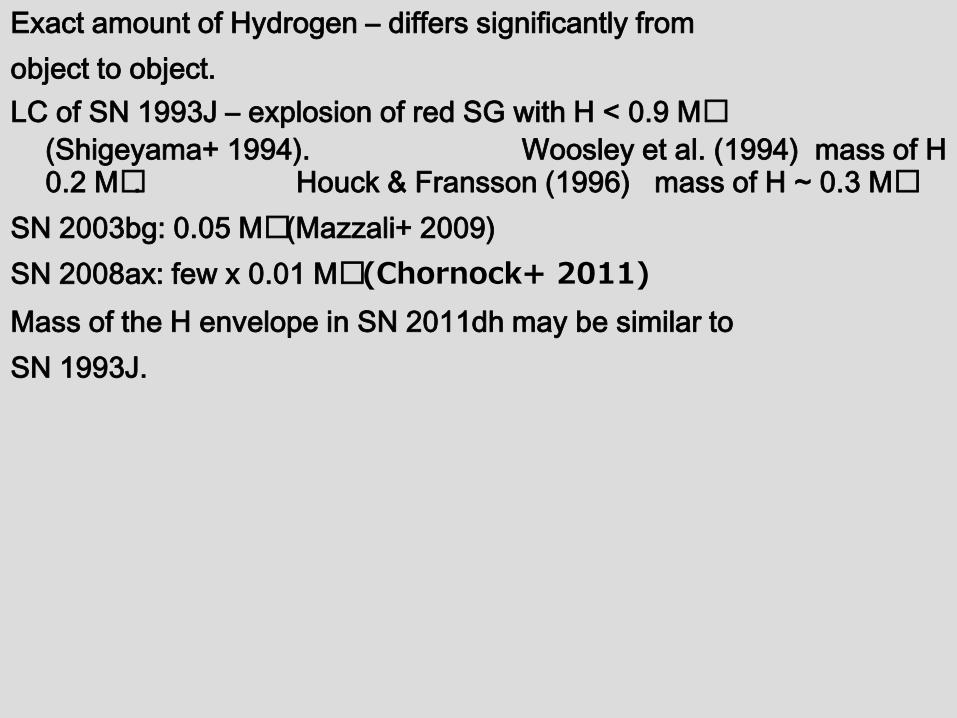
Exact amount of Hydrogen – differs significantly from object to object. LC of SN 1993J – explosion of red SG with H < 0.9 Mꙩ
(Shigeyama+ 1994). Woosley et al. (1994) mass of H 0.2 Mꙩ. Houck & Fransson (1996) mass of H ~ 0.3 Mꙩ
SN 2003bg: 0.05 Mꙩ (Mazzali+ 2009) SN 2008ax: few x 0.01 Mꙩ (Chornock+ 2011) Mass of the H envelope in SN 2011dh may be similar to SN 1993J.
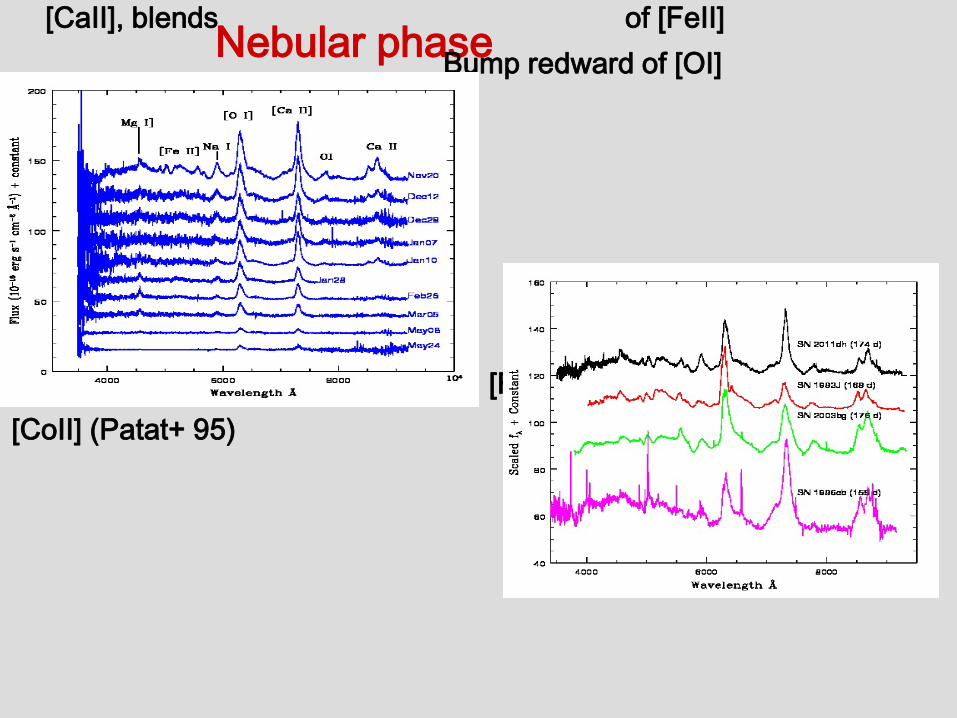
Nebular phase
[CaII], blends of [FeII]
Bump redward of [OI] [CaII]/[OI] ratio SN 1996cb ~ 2.0 SN 1993J ~ 0.2 SN 2003bg ~ 0.5 SN 2011dh ~ 0.8 Observed bump may be due to FeII, [FeII] & possible [CoII] (Patat+ 95)
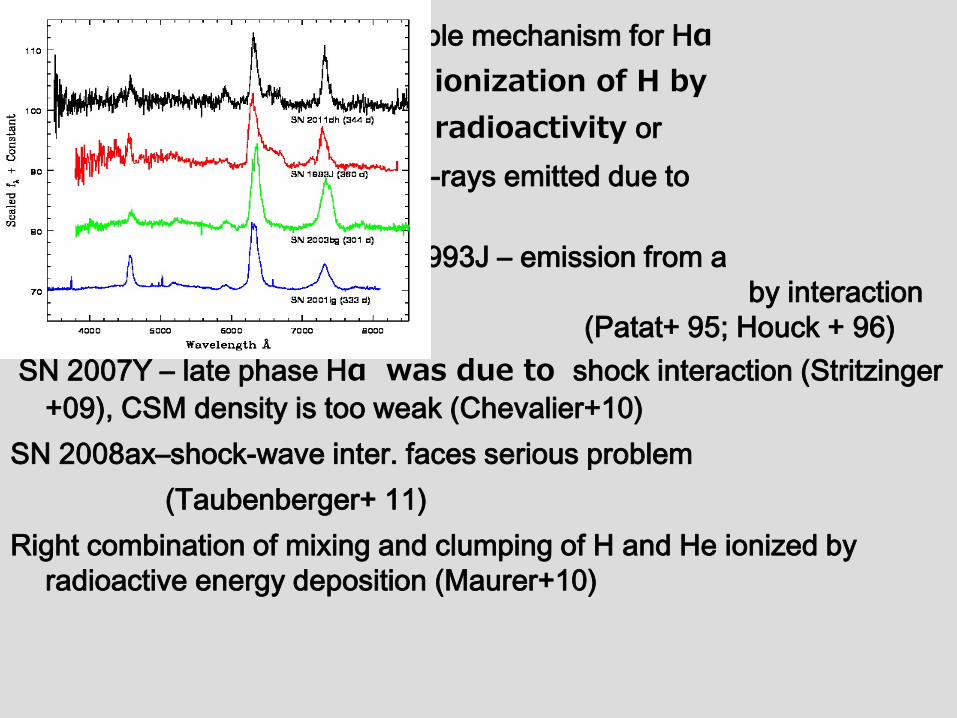
Possible mechanism for Hα ionization of H by radioactivity or By X-rays emitted due to
ejecta-wind interaction SN 1993J – emission from a
shell of H, possibly excited by interaction with dense CSM (Patat+ 95; Houck + 96)
SN 2007Y – late phase Hα was due to shock interaction (Stritzinger +09), CSM density is too weak (Chevalier+10)
SN 2008ax–shock-wave inter. faces serious problem (Taubenberger+ 11) Right combination of mixing and clumping of H and He ionized by
radioactive energy deposition (Maurer+10)
SN 2011dh – detected radio in early stage. Radio monitoring in late phase, time averaged expansion vel. of the
forward shock ~ 21000 km/sec. (Bietenholz + 2012) X-ray emission – interaction of blast wave with its surrounding CSM
(Campana & Immler 2012). Presence of CSM, high expansion velocity of forward shock – shock
wave interaction may be the most plausible mechanism for late phase Hα emission
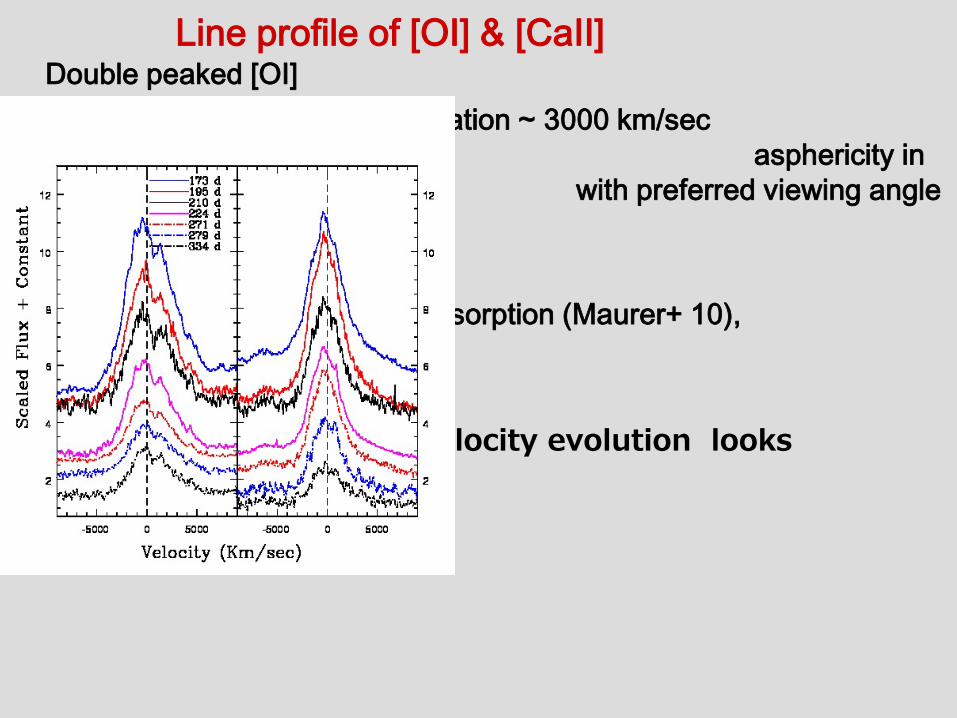
Line profile of [OI] & [CaII] Double peaked [OI]
Separation ~ 3000 km/sec interpreted as due to asphericity in the explosion, with preferred viewing angle (Maeda et al 2008)
Hα absorption (Maurer+ 10),
if located at 12000 km/sec. Hα velocity evolution looks
consistent
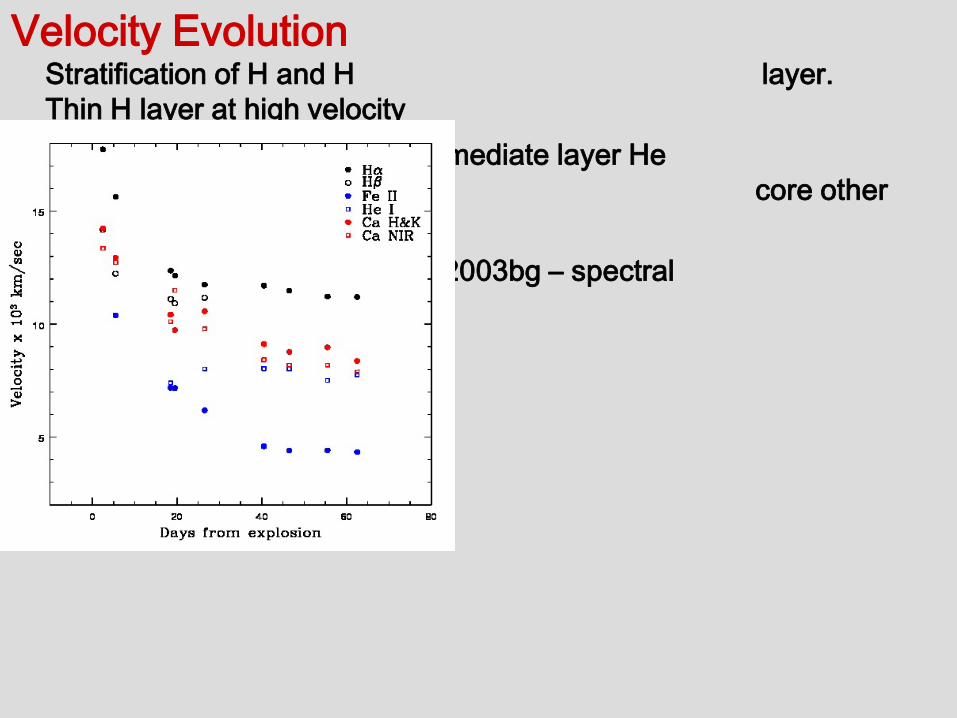
Velocity Evolution Stratification of H and H layer. Thin H layer at high velocity
Intermediate layer He Innermost high density core other heavy species.
SN 2003bg – spectral modelling (Mazzali+ 2009)
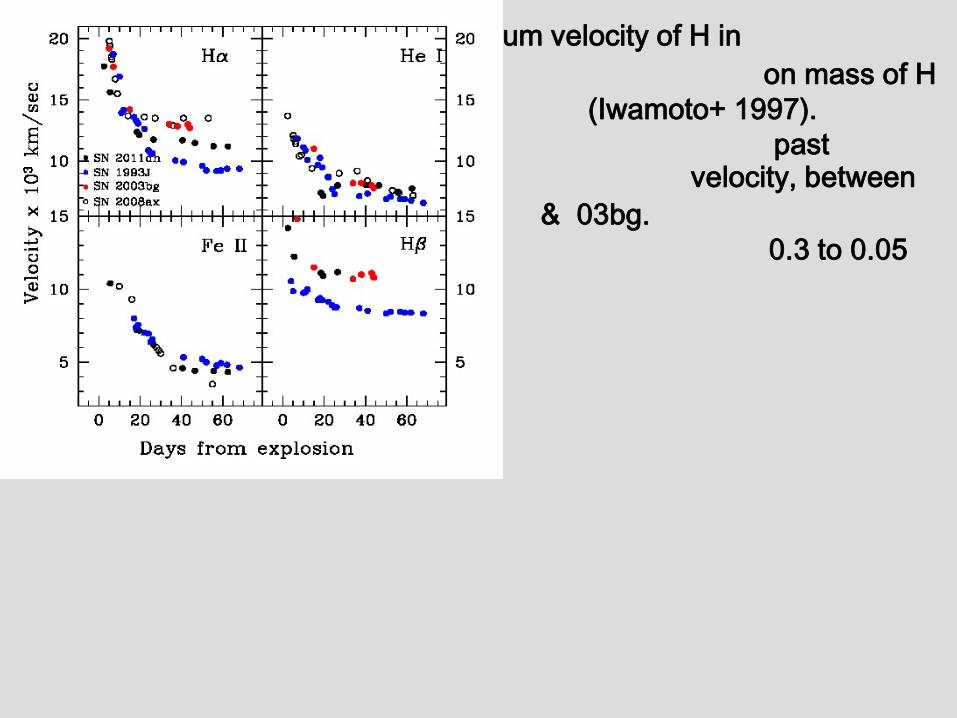
Minimum velocity of H in IIb SNe mainly depends on mass of H envelope (Iwamoto+ 1997). SN 2011dh – 20 days past explosion Hα velocity, between SN93J & 03bg. Mass of H envelope 0.3 to 0.05 M_sun.
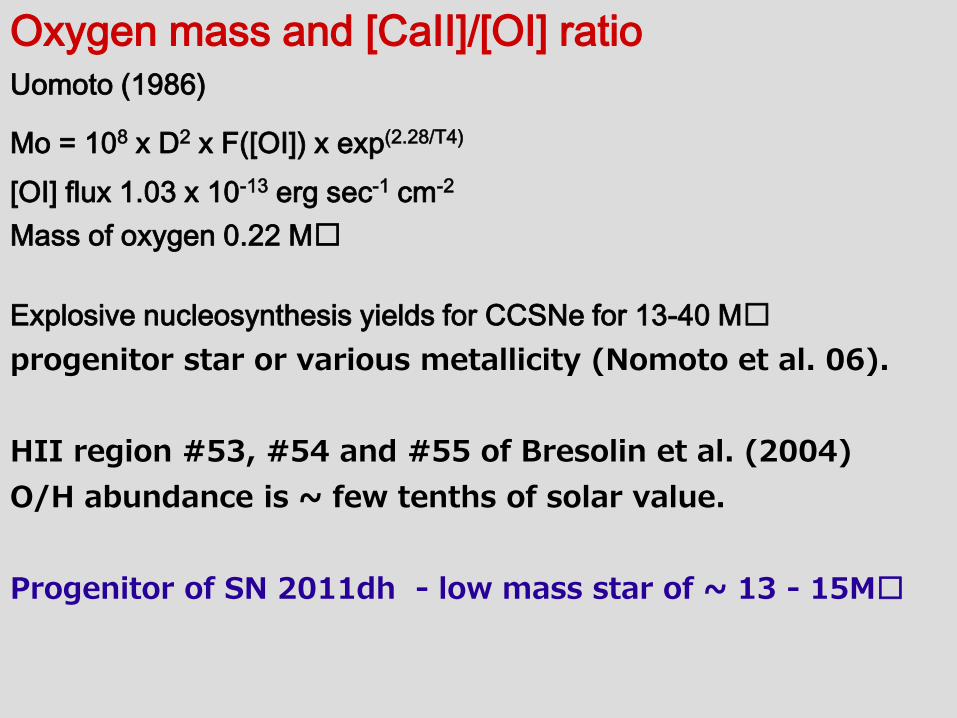
Oxygen mass and [CaII]/[OI] ratio Uomoto (1986)
Mo = 108 x D2 x F([OI]) x exp(2.28/T4) [OI] flux 1.03 x 10⁻¹³ erg sec-1 cm-2
Mass of oxygen 0.22 Mꙩ
Explosive nucleosynthesis yields for CCSNe for 13-40 Mꙩ progenitor star or various metallicity (Nomoto et al. 06). HII region #53, #54 and #55 of Bresolin et al. (2004) O/H abundance is ~ few tenths of solar value. Progenitor of SN 2011dh - low mass star of ~ 13 - 15Mꙩ
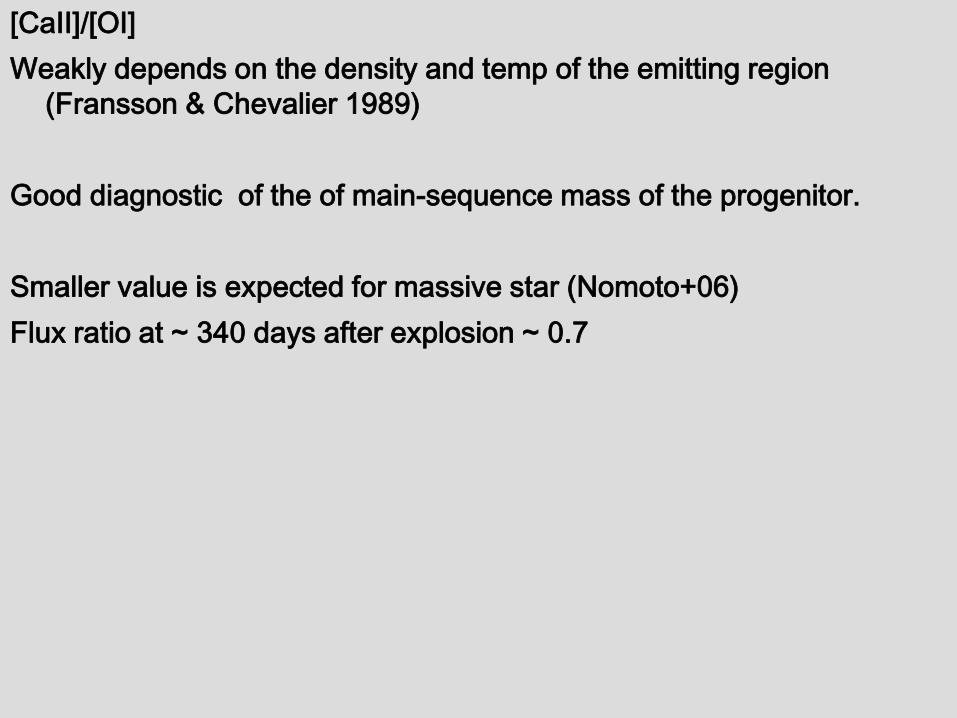
[CaII]/[OI] Weakly depends on the density and temp of the emitting region
(Fransson & Chevalier 1989) Good diagnostic of the of main-sequence mass of the progenitor. Smaller value is expected for massive star (Nomoto+06) Flux ratio at ~ 340 days after explosion ~ 0.7
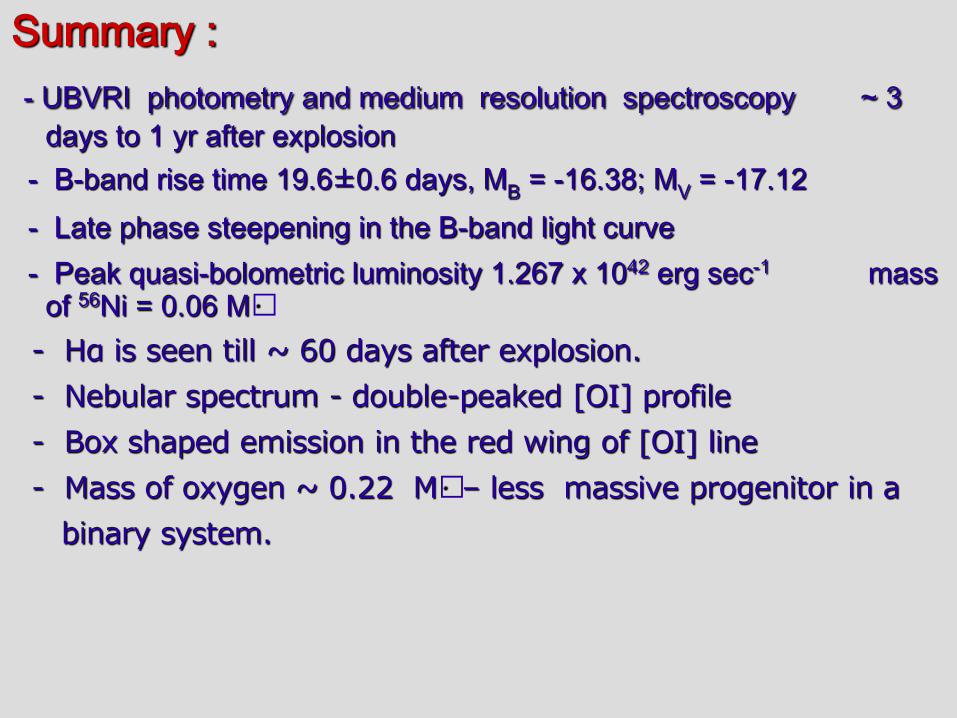
Summary : - UBVRI photometry and medium resolution spectroscopy ~ 3
days to 1 yr after explosion - B-band rise time 19.6±0.6 days, MB = -16.38; MV = -17.12 - Late phase steepening in the B-band light curve - Peak quasi-bolometric luminosity 1.267 x 1042 erg sec-1 mass
of 56Ni = 0.06 Mꙩ - Hα is seen till ~ 60 days after explosion. - Nebular spectrum - double-peaked [OI] profile - Box shaped emission in the red wing of [OI] line - Mass of oxygen ~ 0.22 Mꙩ – less massive progenitor in a binary system.

Thank you


![Progenitor constraints on the Type Ia supernova SN 2014J ... · Progenitor constraints on the Type Ia supernova SN 2014J from Hubble Space Telescope H and [OIII] observations Or Graur1;2?yand](https://img.pdfslide.net/doc/110x75/5e17dfd6f1c2460c5945b5d7/progenitor-constraints-on-the-type-ia-supernova-sn-2014j-progenitor-constraints.jpg)