Embed Size (px)
Citation preview
THE INTERNATIONAL SOCIETY FOR OPTICS AND PHOTONICS
www.SPIECareerCenter.org

THE 2016 OPTICS & PHOTONICS GLOBAL SALARY REPORT IS SPONSORED BY SPIE CAREER CENTER
The International Society for Optics and Photonics SPIE INTERNATIONAL HEADQUARTERS PO Box 10 Bellingham, WA 98227-0010 USA Tel: +1 360 676 3290 / Fax: +1 360 647 1445 [email protected] / www.SPIE.org
SPIE EUROPE OFFICES 2 Alexandra Gate Ffordd Pengam, Cardiff, CF24 2SA UK Tel: +44 29 2089 4747 / Fax: +44 29 2089 4750 [email protected] / www.SPIE.org
FOR QUESTIONS, COMMENTS, OR SUGGESTIONS, CONTACT REPORT AUTHOR ADAM RESNICK AT :[email protected]
Copyright © 2016 Society of Photo-Optical Instrumentation Engineers (SPIE)
All rights reserved. No part of this publication may be reproduced or distributed in any form or by any means without written permission of the publisher.
2016 OPTICS & PHOTONICS
GLOBAL SALARY REPORT•
www.SPIECareerCenter.org

Key Findings • The median salary for full-time employees is $62,443, down slightly from $64,000 last year.1
Salaries are very widely dispersed, primarily driven by country economic conditions and organization type.
• Salaries paid in Chinese yuan declined 1% over the last year, following a gain of 33% from 2012 through 2015. Earnings in Japanese yen and British pounds were up, while U.S. dollar and euro salaries were flat.
• Entry-level pay for PhDs is highest in the United States, where employees with 1-2 years of experience earn a median salary of $73,000. Germany, the United Kingdom, and South Korea follow, with respective salaries of $58,701, $44,031, and $41,400.
• The highest-paid discipline is aerospace, with a median income of $102,300.
• Median salaries are 38% higher overall for men than for women, though gaps are much smaller early-career. 69% of women feel that they are paid fairly, versus 76% of men.
• Survey respondents are highly satisfied with their jobs overall: 96% enjoy their work, 95% find their work meaningful, and 93% feel that their work is respected by their peers.
• 33% of workers in higher-income Asian countries work 50 or more hours per week. 17% of Chinese (PRC) and Japanese workers report working 55 or more hours per week, the largest percentage of any countries.
• Respect from co-workers and opportunity for advancement are the most important elements of an excellent workplace.
• Lack of advancement opportunities and not enough time with family are the workplace challenges most frequently faced by respondents.
DISTRIBUTION OF SALARIES
1
DISTRIBUTION OF SALARIES
$1,000,000$100,000$10,000$1,000
400
300
200
100
0
Mean = $76,700Median = $62,443Standard Deviation = $76,860n = 4744Log scale

BackgroundSPIE distributed the sixth annual Optics and Photonics Global Salary Survey in January 2016. The survey is the largest of its kind in the global optics and photonics community, providing data on the full breadth of employment and compensation patterns across regions, disciplines, and types of organizations.
SPIE sent survey invitations via email to its global database. Nearly 7000 valid responses represent 105 countries2 and a wide range of disciplines. This year’s report adds extensive breakdowns of salaries by career stage, allowing readers to compare their pay to comparable workers in their countries or regions. The report includes data on students for the first time, including the degrees they are pursuing, their fields of study, and their views on the ideal workplace.
Unless otherwise noted, all salary data presented in this report is based on results from full-time workers. For a complete list of participant countries and other details on survey methodology, please see Methodology and Footnotes on page 21.
2
SURVEY RESPONSES BY REGION
30%37%
4%
2%
3% 23%
1%
6793 valid responses• 4744 full-time employees
• 237 part-time employees
• 1812 students

Country OverviewThe countries in the survey represent a broad range of incomes, work habits, and perception of fair pay. Workers in United States, Switzerland, and Israel enjoy the highest median salaries.
Country Median Salary Work 55 or more hours per week
“I am paid fairly compared to others at
my organization”
United States (n=1593) $112,000 10% 79%
Switzerland (n=56) $110,351 2% 87%
Israel (n=56) $85,822 11% 87%
Australia (n=49) $79,830 6% 89%
Netherlands (n=83) $78,268 4% 77%
Japan (n=198) $74,509 17% 69%
Germany (n=360) $70,659 7% 82%
Sweden (n=49) $66,273 4% 79%
Belgium (n=50) $59,788 4% 75%
United Kingdom (n=187) $59,630 7% 72%
Canada (n=87) $58,773 7% 75%
Singapore (n=37) $58,514 11% 73%
South Korea (n=95) $57,960 8% 71%
France (n=169) $45,656 8% 69%
Italy (n=212) $44,569 8% 60%
Spain (n=137) $42,395 4% 60%
Portugal (n=30) $40,221 3% 61%
South Africa (n=30) $38,310 0% 70%
Taiwan (n=64) $35,608 14% 66%
Turkey (n=31) $31,584 10% 77%
Brazil (n=39) $30,461 0% 53%
Mexico (n=47) $27,111 11% 75%
Czech Republic (n=40) $22,395 5% 71%
Malaysia (n=25) $19,173 12% 78%
Peoples Republic of China (n=263) $18,239 17% 73%
Poland (n=44) $17,799 11% 79%
India (n=99) $11,772 14% 70%
Romania (n=34) $10,547 3% 76%
Russia (n=155) $7,369 12% 76%
Ukraine (n=28) $2,740 7% 81%
Table includes all countries with a sample size of 25 or more full-time workers.
MEDIAN SALARY, HIGH WORKLOAD, AND FAIRNESS OF PAY BY COUNTRY
The Peoples Republic of China and Japan top the list of the heaviest workloads, with 17% of respondents reporting that they work 55 or more hours per week. When asked about equitable pay, 89% of Australians report that they are paid fairly compared to their colleagues.
In comparison to broader populations within surveyed countries, the optics and photonics community fares quite well. For example, the median earnings of German survey participants is $70,659 versus the average for the general population of Germans at $48,479. In Poland, survey participants earn $17,799 versus $14,162 for the country.3
3
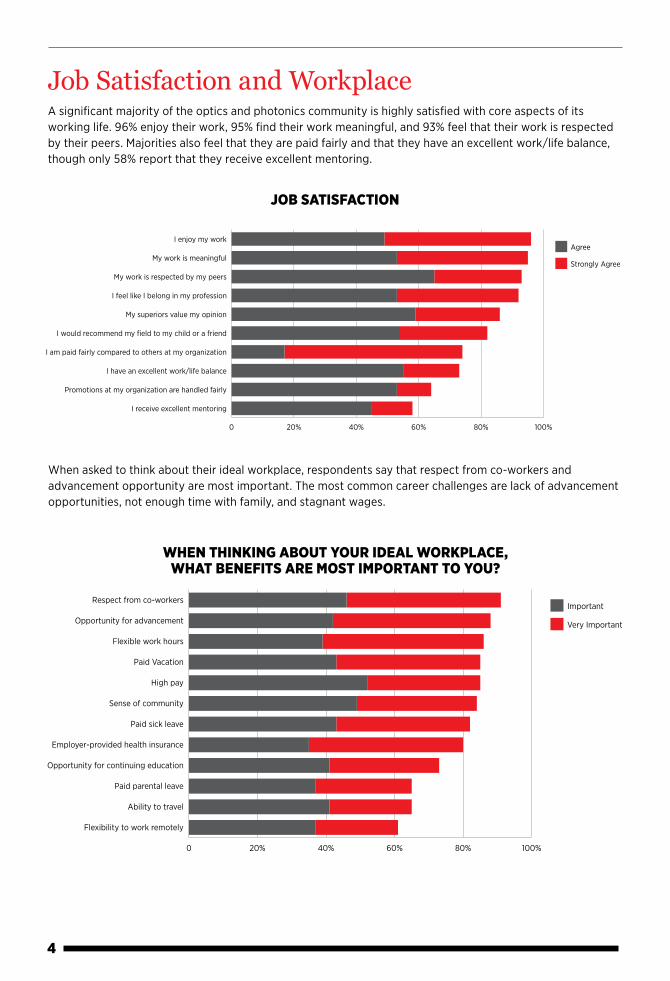
Job Satisfaction and Workplace A significant majority of the optics and photonics community is highly satisfied with core aspects of its working life. 96% enjoy their work, 95% find their work meaningful, and 93% feel that their work is respected by their peers. Majorities also feel that they are paid fairly and that they have an excellent work/life balance, though only 58% report that they receive excellent mentoring.
JOB SATISFACTION
WHEN THINKING ABOUT YOUR IDEAL WORKPLACE, WHAT BENEFITS ARE MOST IMPORTANT TO YOU?
0 20% 40% 60% 80% 100%
I receive excellent mentoring
Promotions at my organization are handled fairly
I have an excellent work/life balance
I am paid fairly compared to others at my organization
I would recommend my field to my child or a friend
My superiors value my opinion
I feel like I belong in my profession
My work is respected by my peers
My work is meaningful
I enjoy my workAgree
Strongly Agree
JOB SATISFACTION
0 20% 40% 60% 80% 100%
Flexibility to work remotely
Ability to travel
Paid parental leave
Opportunity for continuing education
Employer-provided health insurance
Paid sick leave
Sense of community
High pay
Paid Vacation
Flexible work hours
Opportunity for advancement
Respect from co-workers
WHEN THINKING ABOUT YOUR IDEAL WORKPLACE, WHAT BENEFITS ARE MOST IMPORTANT TO YOU?
Important
Very Important
When asked to think about their ideal workplace, respondents say that respect from co-workers and advancement opportunity are most important. The most common career challenges are lack of advancement opportunities, not enough time with family, and stagnant wages.
4

HOW OFTEN HAVE YOU FACED THE FOLLOWING CHALLENGES DURING YOUR CAREER?
0 10% 20% 30% 40% 50% 60% 70% 80%
Unwelcome personal attention
The work is too di�cult
Dislike for my coworkers
Too much travel
Not enough flexibility to schedule work hours
Dislike my boss
Not enough flexibility to telecommute
Losing interest in my work
Negative workplace culture
Too much overtime/too many hours
Stagnant wages
Not enough time with family
Lack of advancement opportunitiesSometimes
Frequently
HOW OFTEN HAVE YOU FACED THE FOLLOWING CHALLENGES DURING YOUR CAREER?
5
“Exciting. Never boring. Have very seldom done the same job twice.”
“Being an optical engineer is almost an ideal career choice. Other engineer professions are jealous, I think.”

Wage GrowthWages grew for two out of five of the largest currency groups, with median salaries paid in Japanese yen and British pounds increasing 4% and 2%, respectively. United States dollar and euro salaries were flat, while salaries paid in Chinese yuan declined 1% over the last year, following a gain of 33% from 2012 through 2015.4 These results mirror general economic conditions in these countries—a slowdown in China, and modest growth in the higher-income markets.
CHANGE IN MEDIAN SALARIES 2012–16, LARGEST CURRENCY GROUPS
Pay for PhDs, the largest subset of survey respondents, is highest in the United States at all career stages. South Korea stands out with the highest salaries in Asia at early career stages, while Germany is the highest-paying European country in this sample.
2012 = 100
90
120
150Japanese yen
British pound
Chinese yuan
Euro
United States dollar
20162015201420132012
Currencies with sample sizes of 180 or greater are displayed.
CHANGE IN MEDIAN SALARIES 2012-2016
1-2 years 3-5 years 5-10 years 11-15 years 16-20 years 21-25 years 26-30 years More than 30 years
United States $73,000 $90,000 $104,000 $122,500 $140,137 $150,000 $156,000 $154,000
Germany $58,701 $58,157 $61,962 $76,094 $86,964 $89,682 $94,030 $108,706
United Kingdom $44,013 $50,118 $54,661 $65,309 $74,906* $85,186 $99,384 $91,575
South Korea $41,400 $73,692 $55,890 $57,960* $82,800* $82,800*
Japan $34,100* $49,104 $59,675 $72,463* $77,578 $85,250 $85,250* $102,300
France $35,329 $40,221 $45,113 $55,983 $59,788* $59,788* $83,703
Italy $26,361* $29,894 $38,047 $46,743 $51,635 $50,602 $59,788* $72,833
Spain $32,612 $35,873 $48,917 $50,548 $47,830* $76,094
Peoples Republic of China
$13,679 $16,339 $15,199 $22,798 $24,318 $30,398 $28,878
Russia $6,263* $5,158 $9,211 $7,369 $27,632* $6,141 $8,842
n=1755. Minimum cell sample size is 5 respondents, with an asterisk indicating sample size of 5-9.
MEDIAN SALARY BY TOTAL YEARS EMPLOYED FOR RESPONDENTS WITH PHD, SELECTED COUNTRIES
6
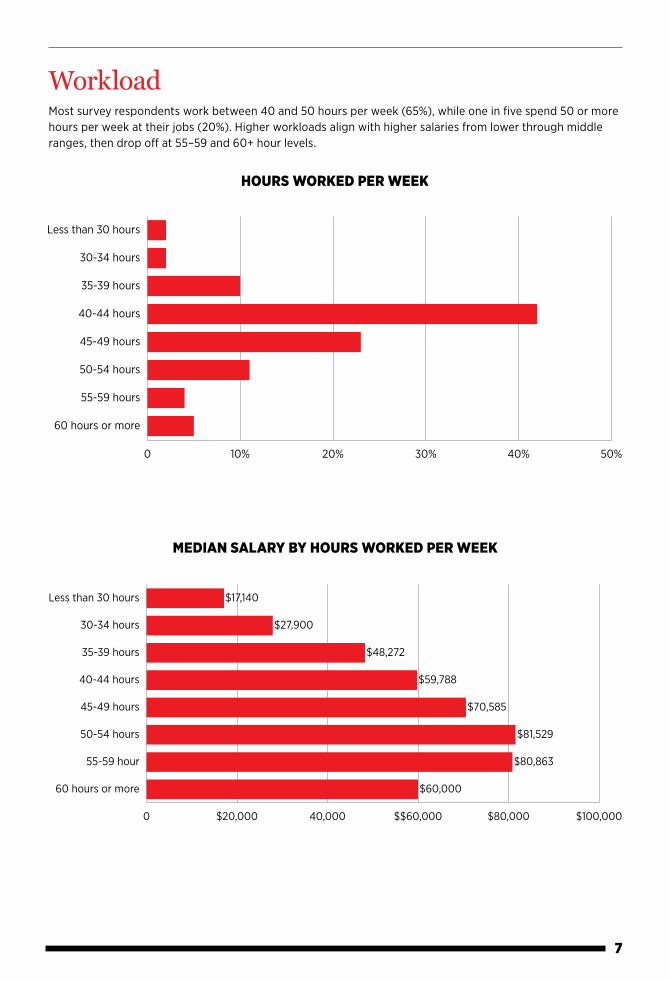
Workload Most survey respondents work between 40 and 50 hours per week (65%), while one in five spend 50 or more hours per week at their jobs (20%). Higher workloads align with higher salaries from lower through middle ranges, then drop off at 55–59 and 60+ hour levels.
HOURS WORKED PER WEEK
MEDIAN SALARY BY HOURS WORKED PER WEEK
0 10% 20% 30% 40% 50%
60 hours or more
55-59 hours
50-54 hours
45-49 hours
40-44 hours
35-39 hours
30-34 hours
Less than 30 hours
HOURS WORKED PER WEEK
0 $20,000 40,000 $$60,000 $80,000 $100,000
60 hours or more
55-59 hour
50-54 hours
45-49 hours
40-44 hours
35-39 hours
30-34 hours
Less than 30 hours
$60,000
$80,863
$81,529
$70,585
$59,788
$48,272
$27,900
$17,140
MEDIAN SALARY BY HOURS WORKED PER WEEK
7

PERCENTAGE OF RESPONDENTS WORKING 50 HOURS OR MORE PER WEEK
Respondents from higher-income Asian countries spend the most time in their offices and labs, with 33% working 50 hours or more per week and only 5% working less than 40 hours per week.
0 5% 10% 15% 20% 25% 30% 35%
Africa
Latin America and the Caribbean
Oceania
Europe, lower income
Europe, higher income
North America
Asia, lower income
Middle East
Asia, higher income
PERCENTAGE OF RESPONDENTS WORKING 50 HOURS OR MORE PER WEEK
8
Networking or referral through personal contact 21%
Online job advertisement 18%
I was recruited 18%
I contacted the employer directly (no job was advertised) 12%
University career o�ce 8%
Printed job advertisement (newspaper or journal) 7%
Other 4%
Professional association 4%
In-person job fair 3%
Public/government placement agency 2%
Alumni network 2%
Private placement agency 1%
HOW DID YOU FIND YOUR ORIGINAL POSITION AT YOUR PRESENT EMPLOYER?
HOW DID YOU FIND YOUR ORIGINAL POSITION AT YOUR PRESENT EMPLOYER?

RegionNorth America and Oceania stand out as the regions with the highest salaries, with median earnings well above other areas.6 North American median incomes are 80% greater than higher-income Asian countries and more than double higher-income European countries. A large portion of regional income gaps is explained by the level of economic development of countries within each area.7
MEDIAN SALARY BY REGION
0 $20,000 $40,000 $60,000 $80,000 $100,000 $120,000
Europe, lower income (n=95)
Asia, lower income (n=432)
Africa (n=64)
Latin America and the Caribbean (n=128)
Middle East (n=139)
Europe, higher income (n=1731)
Asia, higher income (n=394)
Oceania (n=56)
North America (n=1680)
MEDIAN SALARY BY REGION
$5,520
$15,199
$21,855
$28,803
$51,652
$53,622
$60,954
$75,740
$110,000
9
“I found a ‘home’ when I got into this field. I am good at this and I have advanced further than almost everybody that I know.”

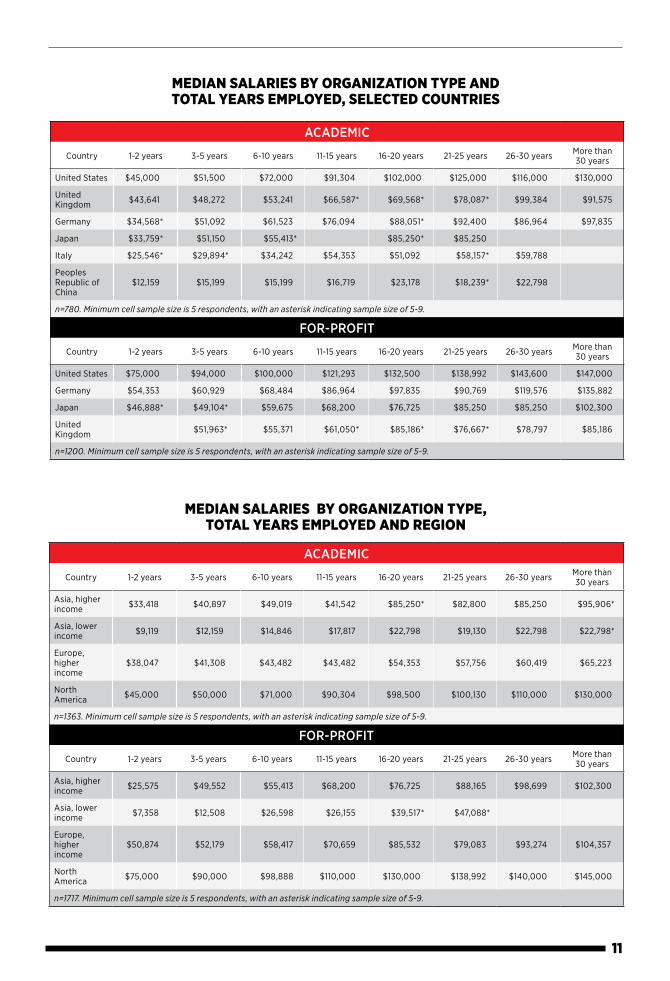
A similar pattern holds at each career stage across a variety of countries and regions—employees at for-profit organizations earn more than their colleagues in academia at every career stage.
Employer Type Median salaries at for-profit companies are well above those in academic sectors, while civilian government employees receive the highest compensation.8 The advantage of for-profits over academia holds in all geographic regions with the exception of Oceania.
MEDIAN SALARY BY EMPLOYER TYPE
Region For-profit Government/Military Academic
North America $120,000 $115,000 $85,000
Europe, higher income
$70,659 $40,221 $48,272
Asia, higher income $68,200 $57,960 $51,150
Middle East $66,608 $31,584 $27,315
Oceania $62,476 $81,565 $74,277
Africa $37,577 $30,529 $15,312
Latin America and the Caribbean
$31,821 $30,461 $27,111
Europe, lower income
$21,160 $5,273 $5,520
Asia, lower income $18,239 $15,199 $15,199
MEDIAN SALARY BY REGION: FOR-PROFIT, GOVERNMENT/MILTARY, AND ACADEMIC EMPLOYERS
10
0 $20,000 $40,000 $60,000 $80,000 $100,000
Government laboratory or research institute (n=826)
University or college (n=1437)
Other research institute (n=94)
Private laboratory or research institute (n=77)
Other (n=48)
Not-for-profit organization (n=105)
Military or defense (n=108)
Self-employed or consultant (n=49)
Company or corporation (n=1936)
Civilian government (n=59)
$42,609
$44,000
$49,459
$54,353
$64,000
$76,094
$76,381
$86,964
$86,964
$100,000
MEDIAN SALARY BY EMPLOYER TYPE
11
MEDIAN SALARIES BY ORGANIZATION TYPE AND TOTAL YEARS EMPLOYED, SELECTED COUNTRIES
MEDIAN SALARIES BY ORGANIZATION TYPE, TOTAL YEARS EMPLOYED AND REGION
ACADEMIC
Country 1-2 years 3-5 years 6-10 years 11-15 years 16-20 years 21-25 years 26-30 years More than 30 years
United States $45,000 $51,500 $72,000 $91,304 $102,000 $125,000 $116,000 $130,000
United Kingdom $43,641 $48,272 $53,241 $66,587* $69,568* $78,087* $99,384 $91,575
Germany $34,568* $51,092 $61,523 $76,094 $88,051* $92,400 $86,964 $97,835
Japan $33,759* $51,150 $55,413* $85,250* $85,250
Italy $25,546* $29,894* $34,242 $54,353 $51,092 $58,157* $59,788
Peoples Republic of China
$12,159 $15,199 $15,199 $16,719 $23,178 $18,239* $22,798
n=780. Minimum cell sample size is 5 respondents, with an asterisk indicating sample size of 5-9.
FOR-PROFIT
Country 1-2 years 3-5 years 6-10 years 11-15 years 16-20 years 21-25 years 26-30 years More than 30 years
United States $75,000 $94,000 $100,000 $121,293 $132,500 $138,992 $143,600 $147,000
Germany $54,353 $60,929 $68,484 $86,964 $97,835 $90,769 $119,576 $135,882
Japan $46,888* $49,104* $59,675 $68,200 $76,725 $85,250 $85,250 $102,300
United Kingdom $51,963* $55,371 $61,050* $85,186* $76,667* $78,797 $85,186
n=1200. Minimum cell sample size is 5 respondents, with an asterisk indicating sample size of 5-9.
ACADEMIC
Country 1-2 years 3-5 years 6-10 years 11-15 years 16-20 years 21-25 years 26-30 years More than 30 years
Asia, higher income $33,418 $40,897 $49,019 $41,542 $85,250* $82,800 $85,250 $95,906*
Asia, lower income $9,119 $12,159 $14,846 $17,817 $22,798 $19,130 $22,798 $22,798*
Europe, higher income
$38,047 $41,308 $43,482 $43,482 $54,353 $57,756 $60,419 $65,223
North America $45,000 $50,000 $71,000 $90,304 $98,500 $100,130 $110,000 $130,000
n=1363. Minimum cell sample size is 5 respondents, with an asterisk indicating sample size of 5-9.
FOR-PROFIT
Country 1-2 years 3-5 years 6-10 years 11-15 years 16-20 years 21-25 years 26-30 years More than 30 years
Asia, higher income $25,575 $49,552 $55,413 $68,200 $76,725 $88,165 $98,699 $102,300
Asia, lower income $7,358 $12,508 $26,598 $26,155 $39,517* $47,088*
Europe, higher income
$50,874 $52,179 $58,417 $70,659 $85,532 $79,083 $93,274 $104,357
North America $75,000 $90,000 $98,888 $110,000 $130,000 $138,992 $140,000 $145,000
n=1717. Minimum cell sample size is 5 respondents, with an asterisk indicating sample size of 5-9.

MEDIAN SALARY BY PRIMARY DISCIPLINE
Discipline Aerospace and illumination disciplines enjoy the highest median earnings, at $102,300 and $89,682, respectively. Civil/environmental falls at the opposite end of the spectrum, with a median salary of $37,260.
The two most important factors driving salary gaps across disciplines are employment sector and country income level. The highest-paying disciplines have much higher representation at for-profit companies: The top three disciplines by pay (aerospace, illumination, and semiconductor) have 401 people at for-profits versus 96 in government/military and 75 working in academia.
12
0 $20,000 $40,000 $60,000 $80,000 $100,000 $120,000
Civil or environmental (n=35)
Computer science, software, or information technology (n=238)
Physics (n=354)
Remote sensing (n=226)
Photonics (n=406)
Electrical or electronics (n=219)
Nanotechnology (n=133)
Materials (n=160)
Mechanical (n=62)
Astronomy or astrophysics (n=270)
Biomedical, medical, biology, biophysics, or biotechnology (n=387)
Optical design (n=140)
Other (n=197)
Lasers (n=352)
Optical systems (n=417)
Interdisciplinary engineering or research (n=173)
Chemical (n=73)
Manufacturing (n=202)
Systems engineering or research (n=128)
Semiconductor (n=308)
Illumination (n=36)
Aerospace (n=223)
$37,260
$43,054
$48,917
$49,034
$50,002
$51,000
$51,092
$54,353
$55,176
$59,998
$63,000
$67,199
$67,200
$68,884
$70,000
$70,659
$70,659
$74,425
$76,094
$85,564
$89,682
$102,300
MEDIAN SALARY BY PRIMARY DISCIPLINE
“Applied optics as a career focus has been really good to me. I have brought a large number of products to market. The work has always been interesting, even when the products did not take off, but the ones that did were very rewarding.”

Country income level has a similar impact on median salaries of optics and photonics disciplines. In the highest paid category, aerospace, 205 out of 229 workers are located in higher-income countries.
MEDIAN SALARY BY DISCIPLINE:
FOR-PROFIT, GOVERNMENT/MILITARY, AND ACADEMIC EMPLOYERS
Discipline For-profitGovernment/
MilitaryAcademic
Aerospace $113,614 $92,000 $86,964
Remote sensing $105,000 $33,699 $31,505
Semiconductor $100,009 $54,353 $53,841
Physics $98,917 $43,482 $48,000
Systems engineering or research
$98,000 $57,936 $71,300
Biomedical, medical, biology, biophysics, or biotechnology
$97,704 $54,353 $49,000
Interdisciplinary engineering or research
$96,000 $62,694 $54,353
Other $90,000 $62,216 $55,000
Illumination $89,682
Civil or environmental $89,500 $34,936 $27,176
Materials $87,625 $49,680 $43,482
Photonics $86,964 $39,134 $43,105
Optical systems $86,107 $57,153 $32,640
Lasers $85,939 $50,005 $48,917
Nanotechnology $85,250 $45,656 $43,430
Chemical $79,532 $79,000 $48,000
Manufacturing $75,995 $62,494 $57,614
Mechanical $75,134 $48,401 $41,000
Optical design $73,293 $57,614 $34,568
Electrical or electronics $68,614 $48,157 $39,356
Computer science, software, or information technology
$68,342 $30,961 $33,120
Astronomy or astrophysics
$55,440 $51,092 $70,988
13

Gender Women make up 17% of the respondents to the survey, roughly mirroring their representation in SPIE membership and at SPIE meetings. Women earn less than men overall, with respective median salaries of $66,240 and $48,000.
The largest wage differences are associated with higher-income Asian and Middle Eastern countries, employment at not-for-profit organizations, and employment of 26-30 years. Wage gaps persist in most demographic subsets of the data, though gaps are lowest in early career stages, non-existent in lower-income Asian countries, and reversed in lower-income Europe.
MEDIAN SALARY BY GENDER AND REGION
MEDIAN SALARY BY GENDER AND EMPLOYER TYPE
0 $20,000 $40,000 $60,000 $80,000 $100,000 $120,000
Europe, lower income
Asia, lower income
Oceania
Europe, higher income
Latin America & Caribbean
North America
Africa
Middle East
Asia, higher incomeWomen
Men
MEDIAN SALARY BY GENDER AND REGION
0 $30,000 $60,000 $90,000 $120,000 $150,000
Civilian government
Military or defense
University or college
Private laboratory or research institute
Government laboratory or research institute
Company or corporation
Not-for-profit organizationWomen
Men
MEDIAN SALARY BY GENDER AND EMPLOYER TYPE
14

MEDIAN SALARY BY GENDER AND YEARS EMPLOYED
0 $20,000 $40,000 $60,000 $80,000 $100,000 $120,000
More than 30 years
26-30 years
21-25 years
16-20 years
11-15 years
5-10 years
3-5 years
1-2 yearsWomen
Men
n=705 women, 3544 men
MEDIAN SALARY BY GENDER AND YEARS EMPLOYED
15
“I chose this path because I have the freedom to choose, and this is where I want to be right now.”
– Female respondent “I feel strongly regarding equal pay for equal work– unfortunately this is rarely the case in our fields of work for women.”
-Male respondent

Other Factors Other factors that influence salary include job level, years employed, and job role. Top organizational leaders enjoy the highest salaries, while research assistants9 anchor the bottom of the range.
MEDIAN SALARY BY JOB LEVEL
0 $50,000 $100,000 $150,000 $200,000
Research assistant (n=227)
Assistant professor (n=245)
Instructor or adjunct professor (n=59)
Associate professor (n=326)
Technician, operator, or lab tech (n=184)
Fellow (n=100)
Postdoc (n=380)
Other (n=244)
Full professor (n=422)
Sta� (n=666)
Academic dean or provost (n=19)
Supervisor or manager (n=506)
Lead or senior level (n=943)
C-level or senior executive (n=101)
Director (n=227)
Vice-president (n=58)
$22,828
$34,116
$34,786
$38,047
$38,748
$39,267
$42,000
$57,219
$58,850
$71,873
$82,830
$86,964
$86,964
$120,000
$130,447
$157,077
MEDIAN SALARY BY JOB LEVEL
MEDIAN SALARY BY JOB LEVEL, SELECTED COUNTRIES
Postdoc Assistant professor
Associate professor
Full professor
Technician, operator, or
lab techStaff Lead or
senior levelSupervisor or manager Director
United States $49,646 $86,000 $102,500 $147,000 $64,500 $94,000 $130,000 $123,000 $160,000
United Kingdom $48,272 $65,244* $70,278* $104,523 $48,272 $67,397 $58,920 $85,186*
Germany $54,353 $86,964 $52,179 $70,659 $81,529 $86,964 $130,447
Japan $34,100 $53,281 $70,758 $85,250 $38,363 $59,675 $76,725 $85,250 $102,300*
Italy $27,176 $44,026 $55,440 $84,247 $32,068 $38,047 $53,191 $58,157 $130,447*
South Korea $33,120 $33,120* $82,800* $37,260* $50,094 $69,552 $59,202
Spain $31,796 $41,852* $47,830 $55,688 $32,612* $40,493 $42,395 $44,026
Peoples Republic of China
$22,798 $15,199 $16,871 $23,558 $7,599* $16,719 $30,398 $30,398* $38,757*
n=2566. Minimum cell sample size is 5 respondents, with an asterisk indicating sample size of 5-9.
16

MEDIAN SALARY BY JOB ROLE
0 $30,000 $60,000 $90,000 $120,000 $150,000
Writer or editor (n=9)
College professor, teacher, or other educator (n=610)
Basic research or science (n=727)
Technical or lab (n=132)
Applied research (n=938)
Medical doctor or clinician (n=22)
Administrative (n=74)
Marketing (n=68)
Purchasing (n=21)
Other (n=95)
Production or manufacturing (n=99)
Recruiting, human resources, or training (n=11)
Engineering or design (n=900)
Application or product development (n=284)
Project or program management (n=209)
Consultant (n=50)
Sales (n=130)
Business development (n=85)
Executive or leadership (n=269)
$38,363
$43,854
$45,000
$46,000
$54,353
$54,893
$56,778
$60,000
$62,731
$63,000
$66,724
$68,000
$76,094
$76,470
$78,000
$84,402
$90,000
$100,009
$127,875
MEDIAN SALARY BY JOB ROLE
17
“Being a researcher is not easy, even if you love your job. The problem is the low salary and the possibility of a lack of funding in the future. Advantages are the opportunity to travel, free schedule, understanding boss, kind and good people in the team.”

DEGREE BEING PURSUED
PRIMARY TOPIC STUDIED
StudentsThe majority of student respondents are pursuing PhDs, with photonics and electrical/electronics representing 25% of the topics studied. Students cite opportunity for advancement as the most important aspect of their ideal first job. The largest gender divide concerns paid parental leave, with 59% of men citing it as important or very important, versus 76% of women. Respect from co-workers falls in the middle of the pack for students, at 84%, but is the most important element of the workplace for full-time employees, at 91%.
0 10% 20% 30% 40% 50% 60%
MD or similar medical doctor degree
Master's of Business Administration (MBA or equivalent)
Associate's degree
High school diploma
Technical degree or certificate
Other
Bachelor's degree
Master's degree (MA, MS, or equivalent)
PhD, doctorate, or equivalent
DEGREE BEING PURSUED
n = 172358%
28%
1%
1%
0.6%
0.2%
0.2%
0.4%
0 3% 6% 9% 12% 15%
Illumination
Aerospace
Manufacturing
Systems engineering or research
Civil or environmental
Interdisciplinary
Chemical or chemistry
Optical design
Semiconductor
Materials
Mechanical
Astronomy or astrophysics
Lasers
Nanotechnology
Remote sensing
Other
Optical systems
Computer science, software, or information technology
Biomedical, medical, biology, biophysics, or biotechnology
Physics
Electrical or electronics
Photonics
0.5%
1%
1%
1%
1%
2%
2%
2%
3%
3%
3%
3%
5%
5%
5%
6%
7%
7%
10%
10%
11%
14%
PRIMARY TOPIC STUDIED
n = 1965
18

WHEN THINKING ABOUT YOUR IDEAL FIRST JOB AFTER EARNING YOUR DEGREE, WHAT BENEFITS ARE MOST IMPORTANT TO YOU?
19
“Working in physical optics allows for extremely rewarding careers, full of interesting technical challenges, with a very broad array of opportunities being generated at ever increasing pace.”
0 20% 40% 60% 80% 100%
Flexibility to work remotely
Paid parental leave
Ability to travel
Paid vacation
Paid sick leave
Flexible work hours
Respect from co-workers
Opportunity for continuing education
High pay
Sense of community
Employer-provided health insurance
Opportunity for advancement
WHEN THINKING ABOUT YOUR IDEAL FIRST JOB AFTER EARNING YOUR DEGREE, WHAT BENEFITS ARE MOST IMPORTANT TO YOU?
Important
Very Important

www.spiecareercenter.org
Contact Lacey Barnett: +1 360 685 5551, [email protected]
LAND THE PERFECT JOB IN OPTICS AND PHOTONICS
Find targeted engineering and technical jobs,
post your CV/resume online, set-up job alerts, access career-related
articles and more, all for free.
GETA
JOB

Methodology and Footnotes In January 2016 SPIE sent email survey invitations to a large subset of its global customer database. Response was voluntary and open. An iPad raffle and early access to this report were offered as incentives to encourage participation. Surveys were completed online using SurveyGizmo’s enterprise survey tool. Results were filtered to yield 6793 valid responses. Responses from employed respondents lacking salary data were removed, as were duplicates and responses from retirees. Microsoft Excel and SPSS were utilized to create summary statistics and related disaggregations.
ENDNOTES: 1. U.S. dollars are used throughout. Local currencies were converted using January 2016 market exchange rates. Salary
figures include total yearly compensation, both base pay and bonuses. Full-time employees are those who indicated working 35 or more hours per week. Unless otherwise noted, all data on pay is drawn from full-time employees.
2. This list includes valid responses from full-time, part-time, and student respondents. United States (1901), Peoples Republic of China (536), Germany (472), India (267), Italy (255), Japan and United Kingdom (251), France (244), Russia (230), Spain (178), South Korea (167), Canada (125), Taiwan (109), Netherlands (105), Mexico (84), Switzerland (76), Israel (73), Belgium (71), Poland (69), Australia (67), Brazil (66), Sweden (64), Turkey (62), Czech Republic (51), Colombia, Singapore, and Ukraine (47), Romania (45), Portugal (41), Malaysia and South Africa (39), Greece (36), Algeria (33), Austria (31), Finland and Pakistan (29), Denmark and Egypt (27), Ireland (26), Chile (24), Hungary (20), Lithuania (19), Saudi Arabia (18), Hong Kong SAR and Indonesia (16), Belarus, Iran, Slovenia, Bulgaria, Latvia, and New Zealand (12), Argentina and Slovakia (11), Thailand and Tunisia (10), Iraq, Morocco, Philippines, Estonia, Serbia, and United Arab Emirates (8), Norway and Vietnam (7), Armenia and Nigeria (6), Bangladesh, Cameroon, Jordan, Kazakhstan, Kenya, and Moldova (5), Venezuela (4), Croatia, Cyprus, Georgia, Lebanon, and Peru (3), Azerbaijan, Ecuador, Ethiopia, Ghana, Kuwait, Kyrgyzstan, Macau SAR, Nepal, Oman, Qatar, Sri Lanka, Sudan, and Zimbabwe (2), Botswana, Djibouti, Iceland, Libya, Luxembourg, Macedonia, Malta, Mongolia, Montenegro, Palestine State, Rwanda, Senegal, Tanzania, Uzbekistan, and Zambia (1).
3. Data for broader populations within countries are average annual wages per full-time and full-year equivalent employees in the total economy, 2014 USD exchange rates and constant prices, from https://stats.oecd.org/Index.aspx?DataSetCode=AV_AN_WAGE. Retrieved 3 February 2016.
4. Yearly growth was computed by comparing same-currency results for each year.
5. Several tables in this report contain cells with lower sample sizes than have been included in previous reports. These small sample sizes allow for greatly-increased specificity in reporting. The assumption is that readers will parse the data in light of the small samples, while appreciating the enhanced level of detail.
6. Oceania is comprised of Australia and New Zealand. North America is comprised of the United States and Canada. Mexico is included in the Latin America and Caribbean category.
7. Europe and Asia are composed of countries spanning a wide range of income levels, even when subdivided into higher- and lower-income groups. For example, the European higher-income category includes the Czech Republic and Norway, at $18,970 and $103,050 per capita Gross National Income (GNI), respectively.
Higher- and lower-income subcategories are based on the World Bank’s threshold for high income countries, $12,736 per capita GNI. This threshold is used throughout this report when referring to “higher-income” and “lower-income” countries.
For data on per capita GNI, see http://data.worldbank.org/indicator/NY.GNP.PCAP.CD/countries. For World Bank country income categories, see http://data.worldbank.org/about/country-classifications
8. The category “for-profit” is composed of company/corporation, self-employed/consultant, and open text “other” entries that indicate for-profit affiliation. “Academic” is composed of university/college, private lab or research institute, other research institute, and open text “other” entries that indicate academic organizations. “Government/military” is composed of government lab or research institute, civilian government, and military/defense.
9. Research assistants appearing in the job level table were filtered to exclude research assistantships tied to academic programs. These respondents indicated that they were not enrolled as students or were students with career-track jobs in optics and photonics outside of the academic institution where they were enrolled.
21

www.SPIECareerCenter.org
THE 2015 OPTICS & PHOTONICS GLOBAL SALARY REPORT IS SPONSORED BY SPIE CAREER CENTER
SPIE is the international society for optics and photonicsCONNECTING MINDS. ADVANCING LIGHT.
ABOUT SPIE SPIE is the international society for optics and photonics, an educational not-for-profit organization founded in 1955 to advance light-based science and technology. The Society serves nearly 264,000 constituents from approximately 166 countries, offering conferences and their published proceedings, continuing education, books, journals, and the SPIE Digital Library in support of interdisciplinary information exchange, professional networking, and patent precedent. SPIE provided more than $5.2 million in support of education and outreach programs in 2015.
For more information, visit www.SPIE.org
2016
Glo
bal
Sal
ary
Rep
ort