Embed Size (px)
Citation preview
Optics of Marine Particles
Lecture 2
Scripps Institution of Oceanography
University of California San Diego
Email: [email protected]
Dariusz Stramski
IOCCG Summer Lecture Series
22 July - 2 August 2014, Villefranche-sur-Mer, France
• Plankton microorganisms
• Biogenic detrital particles
• Mineral particles
• Colloidal particles
• Air bubbles
Suspended Particulate Matter
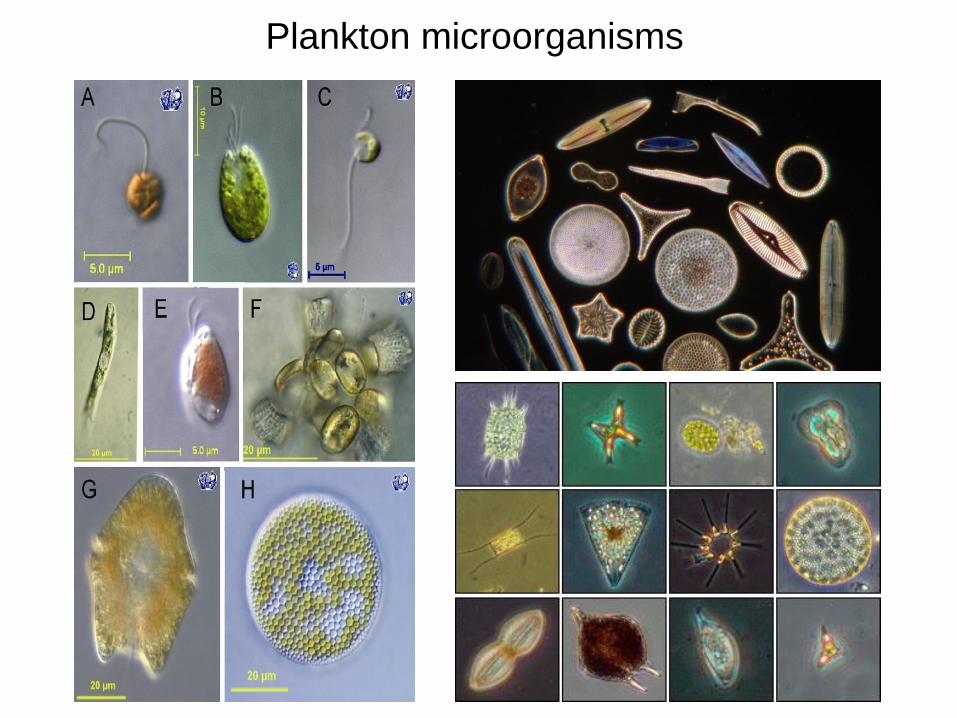
Plankton microorganisms
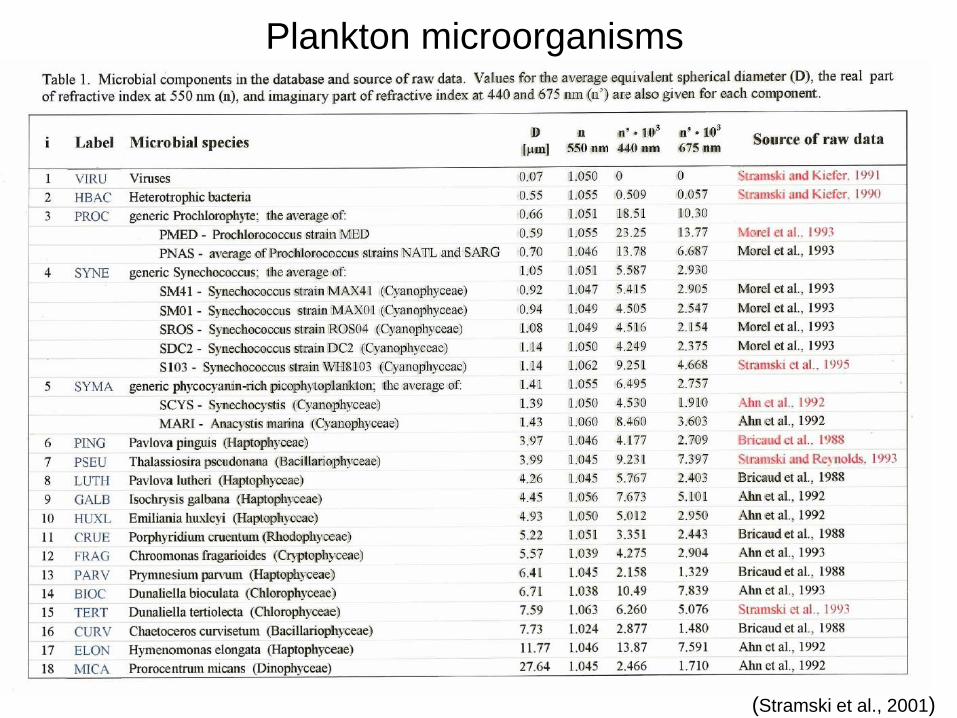
(Stramski et al., 2001)
Plankton microorganisms
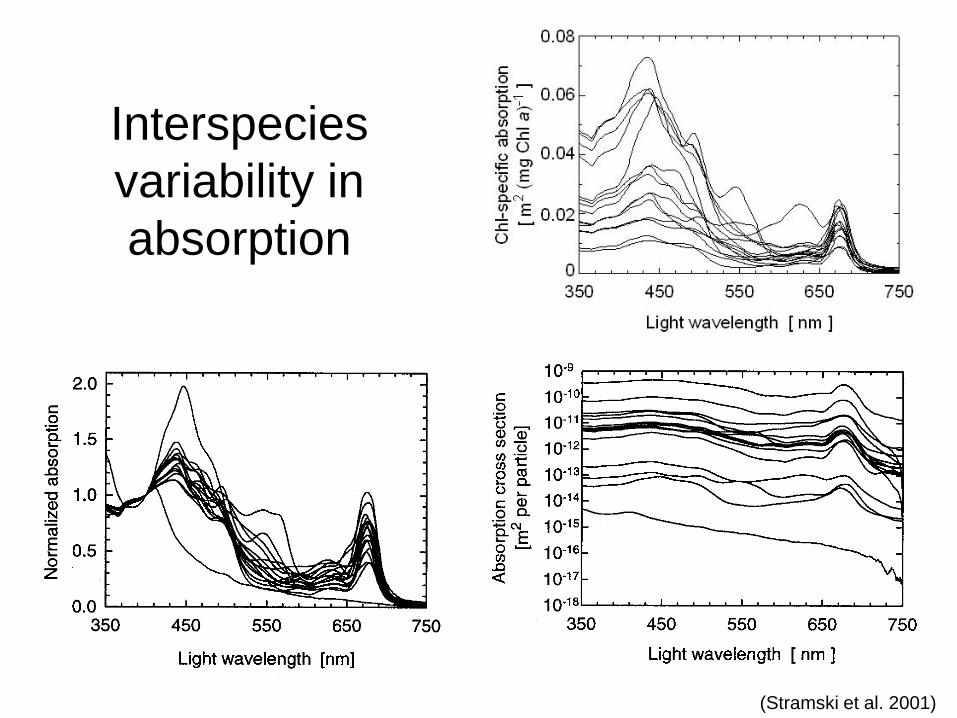
Interspecies
variability in
absorption
(Stramski et al. 2001)
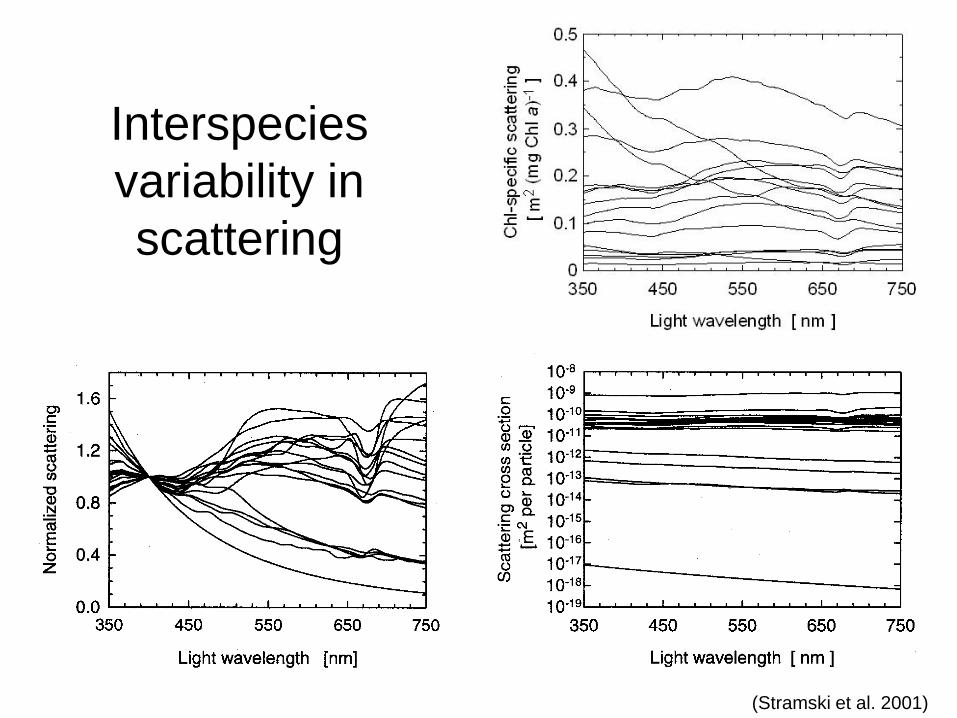
(Stramski et al. 2001)
Interspecies
variability in
scattering
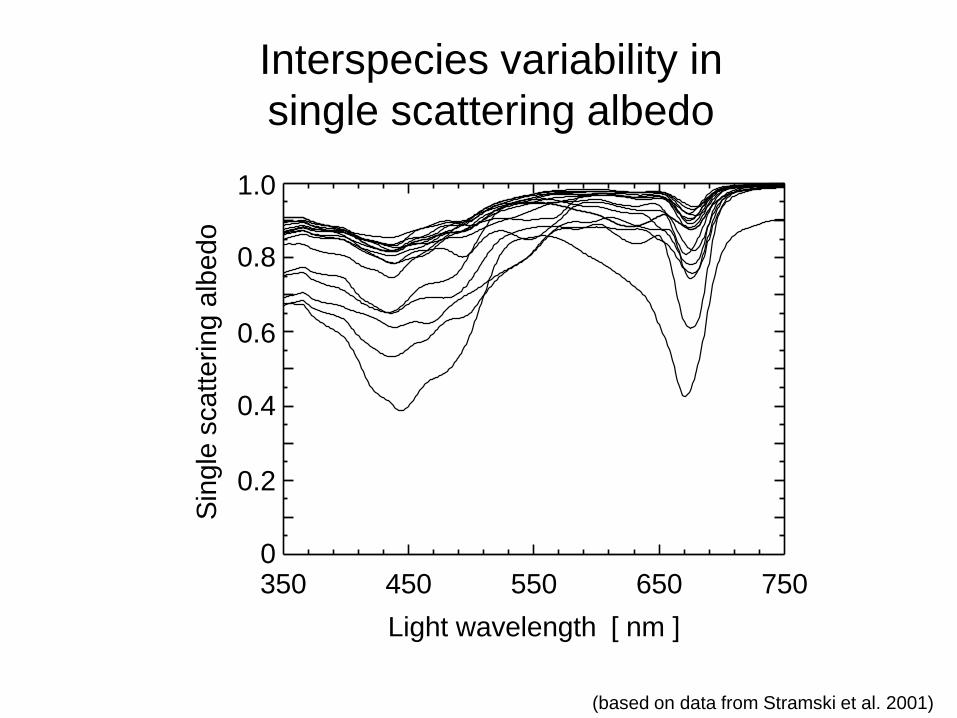
Interspecies variability in
single scattering albedo
(based on data from Stramski et al. 2001)
Light wavelength [ nm ]
350 450 550 650 750
Sin
gle
scatteri
ng a
lbedo
1.0
0.8
0.6
0.4
0.2
0
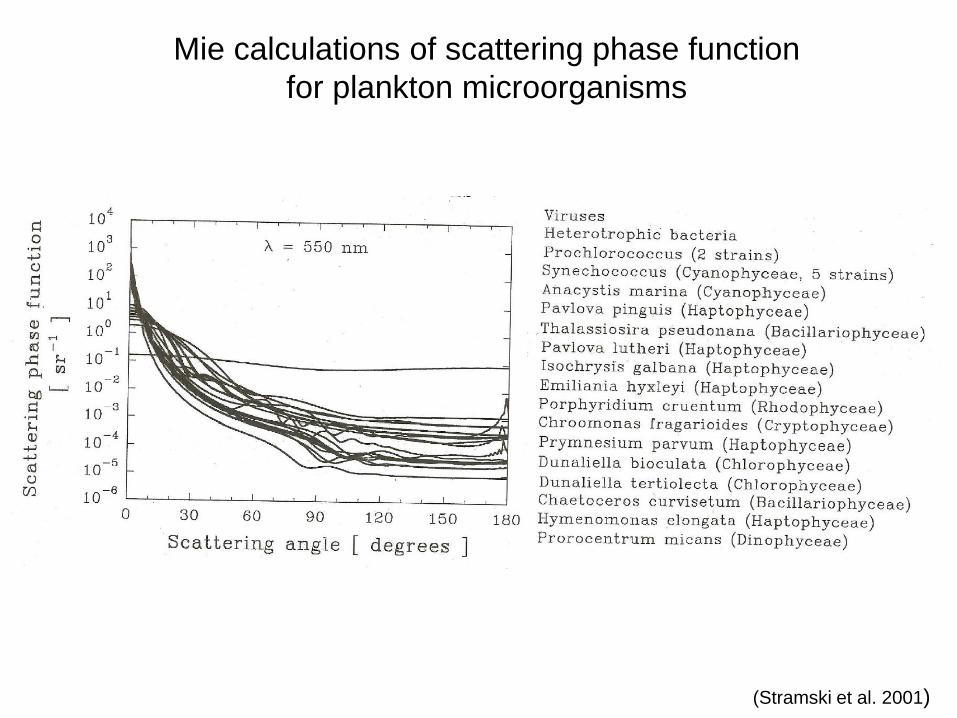
Mie calculations of scattering phase function
for plankton microorganisms
(Stramski et al. 2001)
(Stramski et al. 2001)
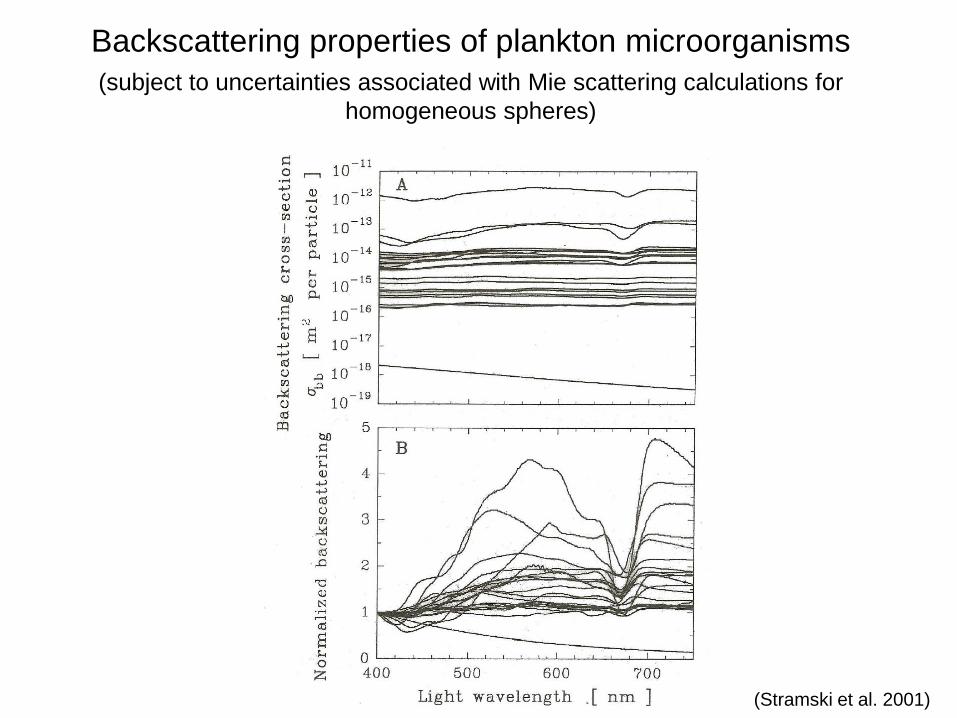
Backscattering properties of plankton microorganisms
(subject to uncertainties associated with Mie scattering calculations for
homogeneous spheres)
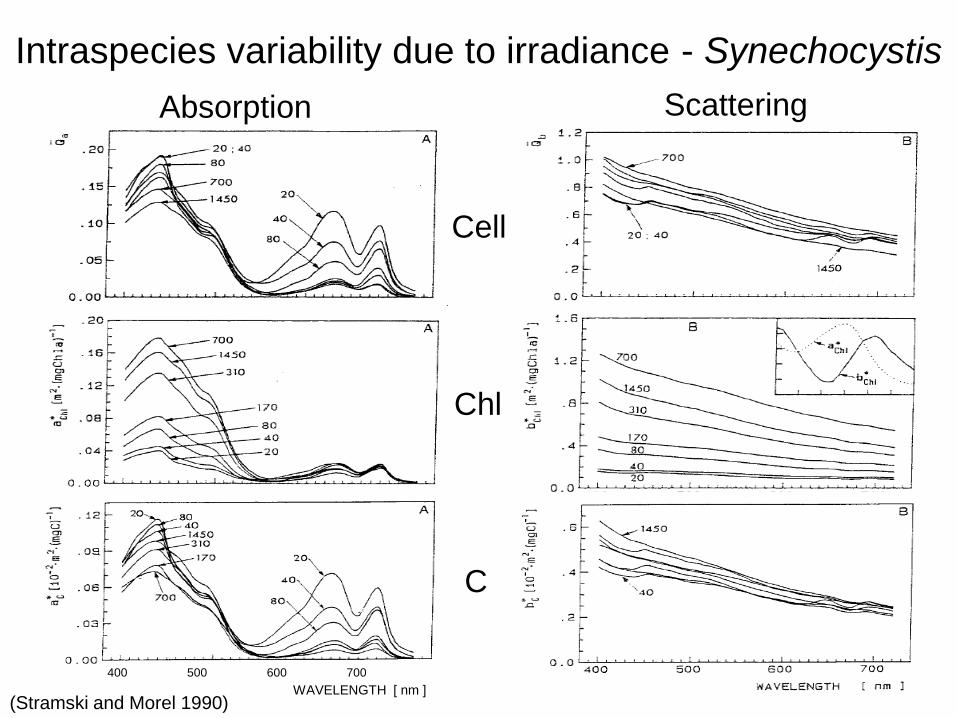
Intraspecies variability due to irradiance - Synechocystis
(Stramski and Morel 1990)
Absorption
Cell
Chl
C
400 500 600 700
WAVELENGTH [ nm ]
Scattering
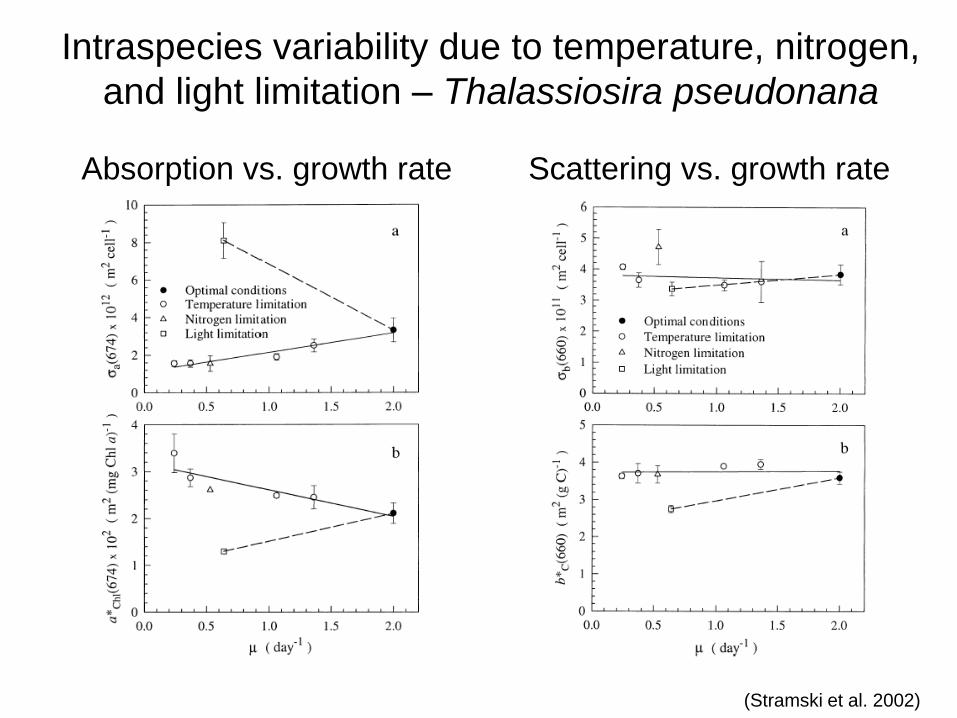
Intraspecies variability due to temperature, nitrogen,
and light limitation – Thalassiosira pseudonana
(Stramski et al. 2002)
Absorption vs. growth rate Scattering vs. growth rate
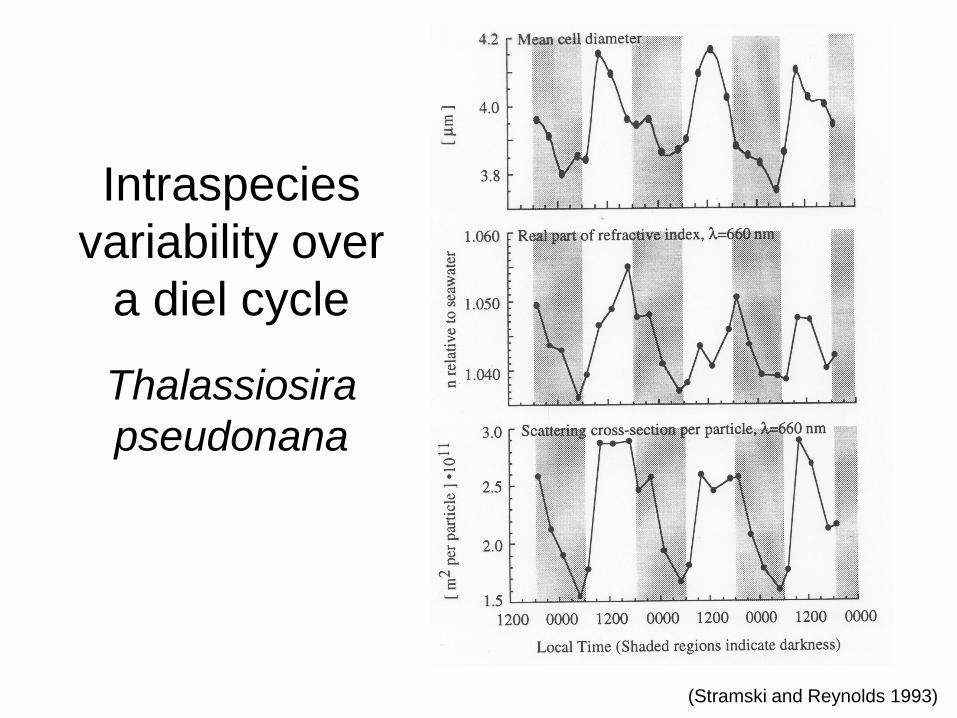
Intraspecies
variability over
a diel cycle
Thalassiosira
pseudonana
(Stramski and Reynolds 1993)
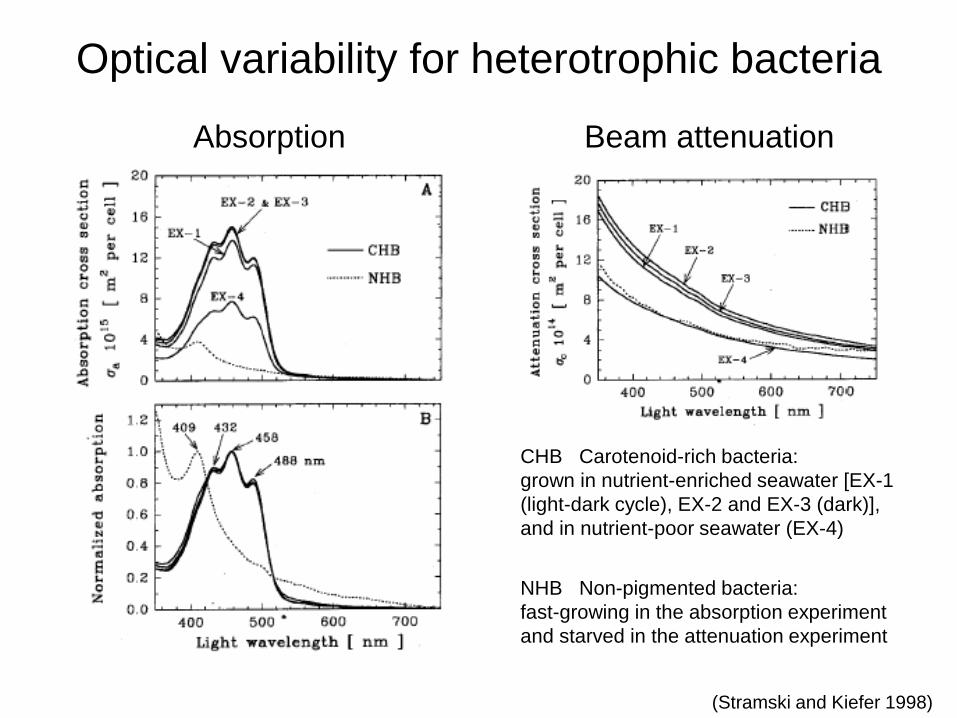
Optical variability for heterotrophic bacteria
Absorption
(Stramski and Kiefer 1998)
Beam attenuation
CHB Carotenoid-rich bacteria:
grown in nutrient-enriched seawater [EX-1
(light-dark cycle), EX-2 and EX-3 (dark)],
and in nutrient-poor seawater (EX-4)
NHB Non-pigmented bacteria:
fast-growing in the absorption experiment
and starved in the attenuation experiment
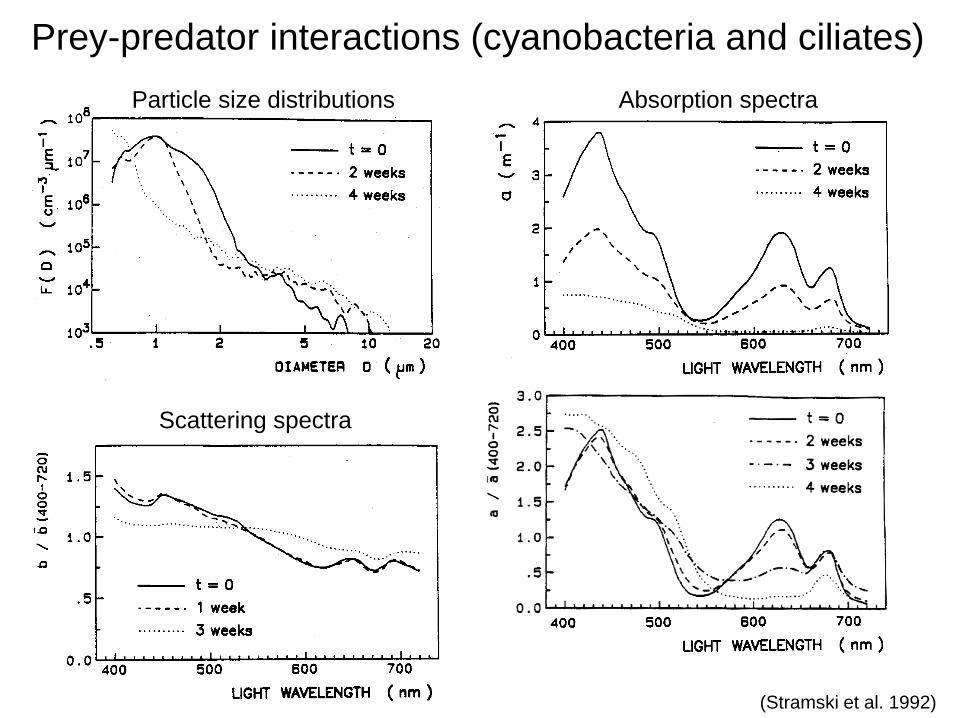
Prey-predator interactions (cyanobacteria and ciliates)
(Stramski et al. 1992)
Absorption spectra Particle size distributions
Scattering spectra
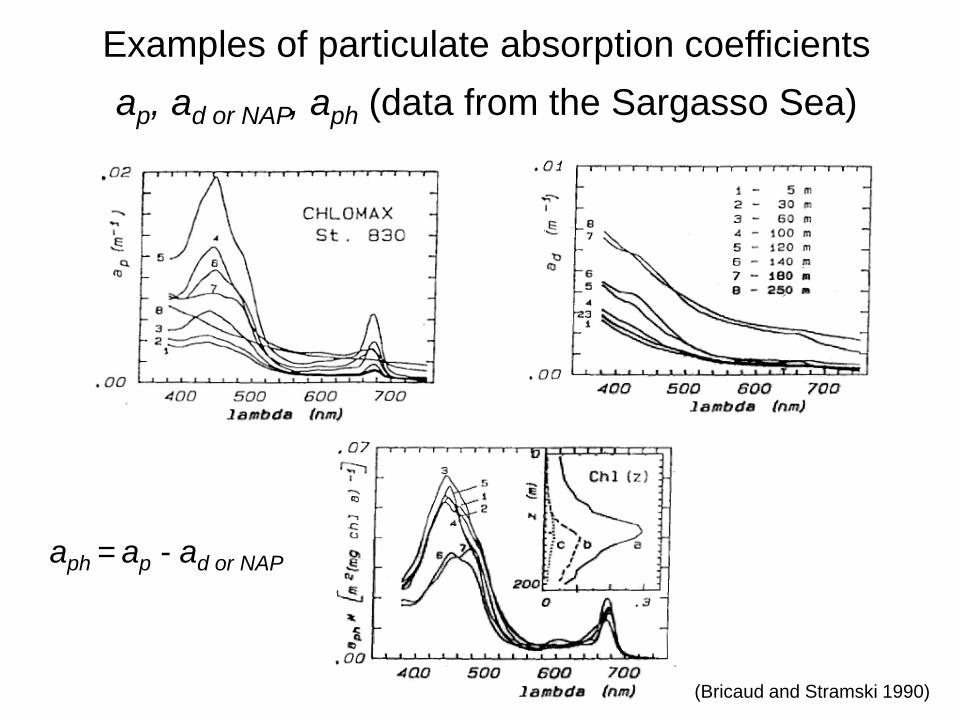
Examples of particulate absorption coefficients
ap, ad or NAP, aph (data from the Sargasso Sea)
(Bricaud and Stramski 1990)
aph = ap - ad or NAP
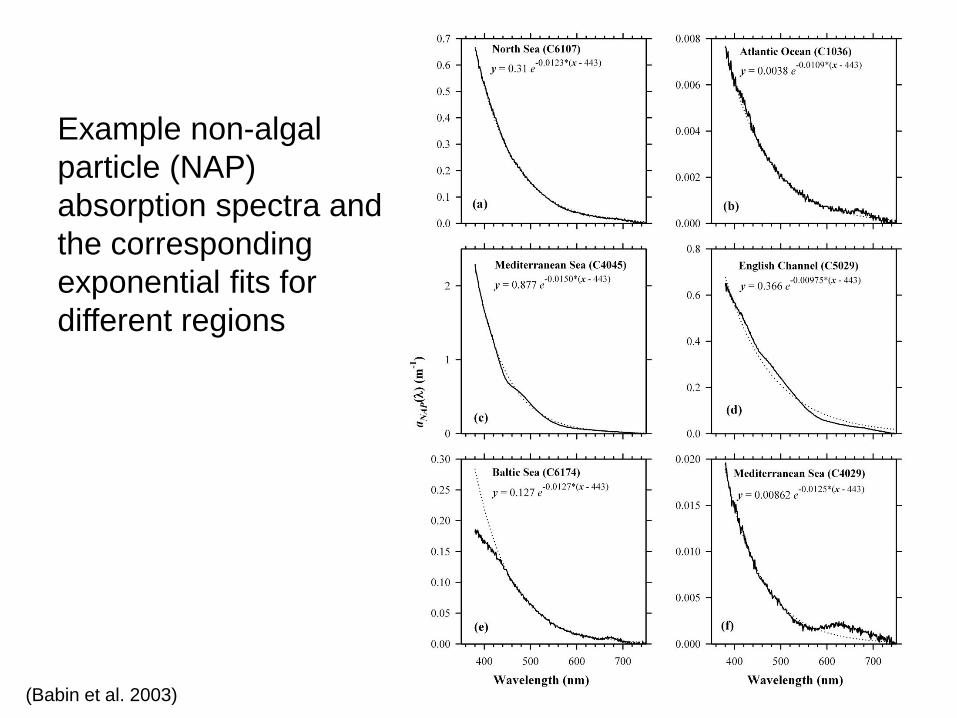
(Babin et al. 2003)
Example non-algal
particle (NAP)
absorption spectra and
the corresponding
exponential fits for
different regions
(Babin et al. 2003)
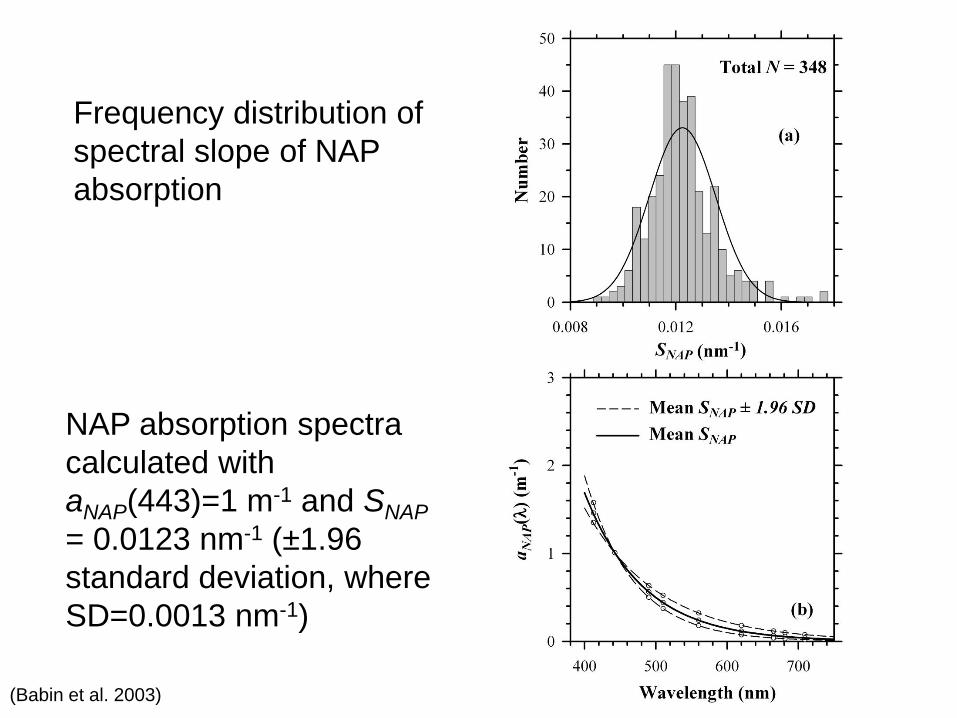
Frequency distribution of
spectral slope of NAP
absorption
NAP absorption spectra
calculated with
aNAP(443)=1 m-1 and SNAP
= 0.0123 nm-1 (±1.96
standard deviation, where
SD=0.0013 nm-1)
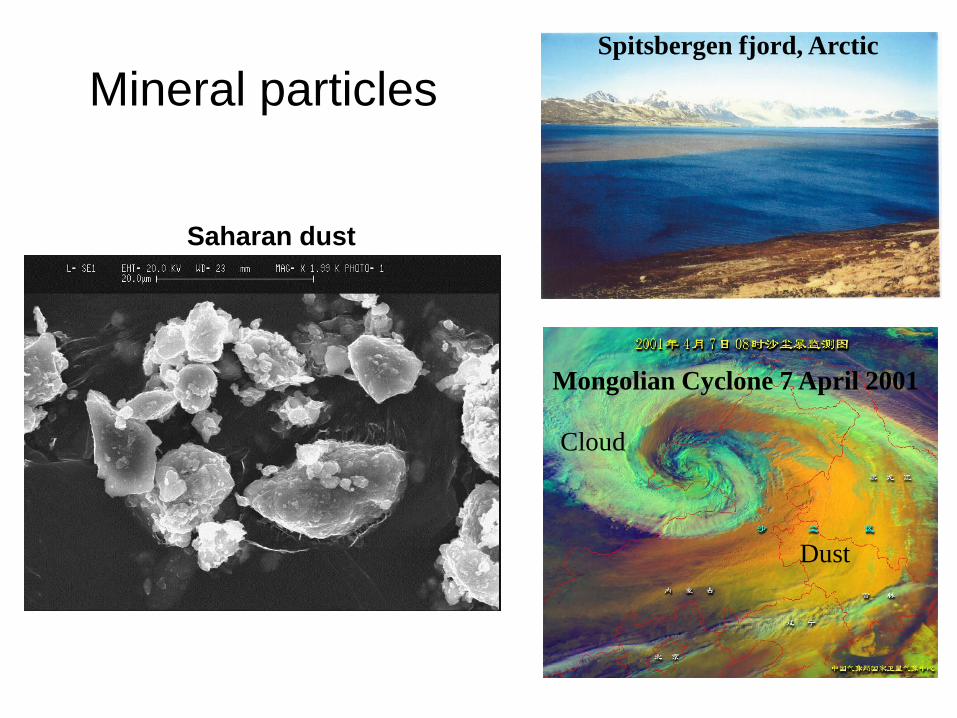
Mineral particles
Mongolian Cyclone 7 April 2001
Saharan dust
Cloud
Dust
Spitsbergen fjord, Arctic
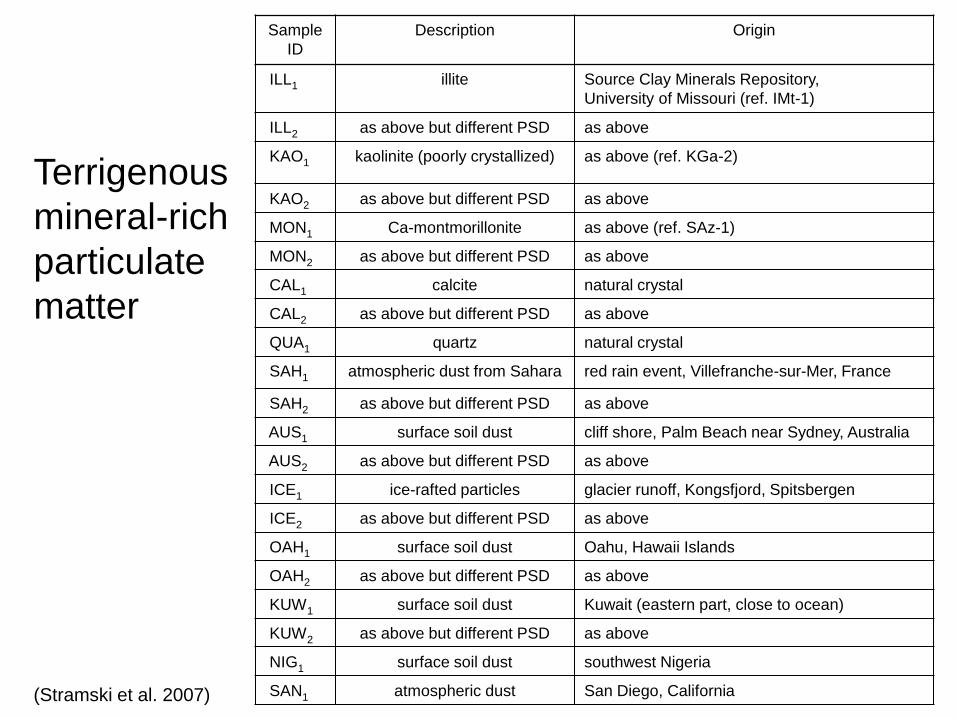
Sample
ID
Description Origin
ILL1 illite Source Clay Minerals Repository,
University of Missouri (ref. IMt-1)
ILL2 as above but different PSD as above
KAO1 kaolinite (poorly crystallized) as above (ref. KGa-2)
KAO2 as above but different PSD as above
MON1 Ca-montmorillonite as above (ref. SAz-1)
MON2 as above but different PSD as above
CAL1 calcite natural crystal
CAL2 as above but different PSD as above
QUA1 quartz natural crystal
SAH1 atmospheric dust from Sahara red rain event, Villefranche-sur-Mer, France
SAH2 as above but different PSD as above
AUS1 surface soil dust cliff shore, Palm Beach near Sydney, Australia
AUS2 as above but different PSD as above
ICE1 ice-rafted particles glacier runoff, Kongsfjord, Spitsbergen
ICE2 as above but different PSD as above
OAH1 surface soil dust Oahu, Hawaii Islands
OAH2 as above but different PSD as above
KUW1 surface soil dust Kuwait (eastern part, close to ocean)
KUW2 as above but different PSD as above
NIG1 surface soil dust southwest Nigeria
SAN1 atmospheric dust San Diego, California
Terrigenous
mineral-rich
particulate
matter
(Stramski et al. 2007)
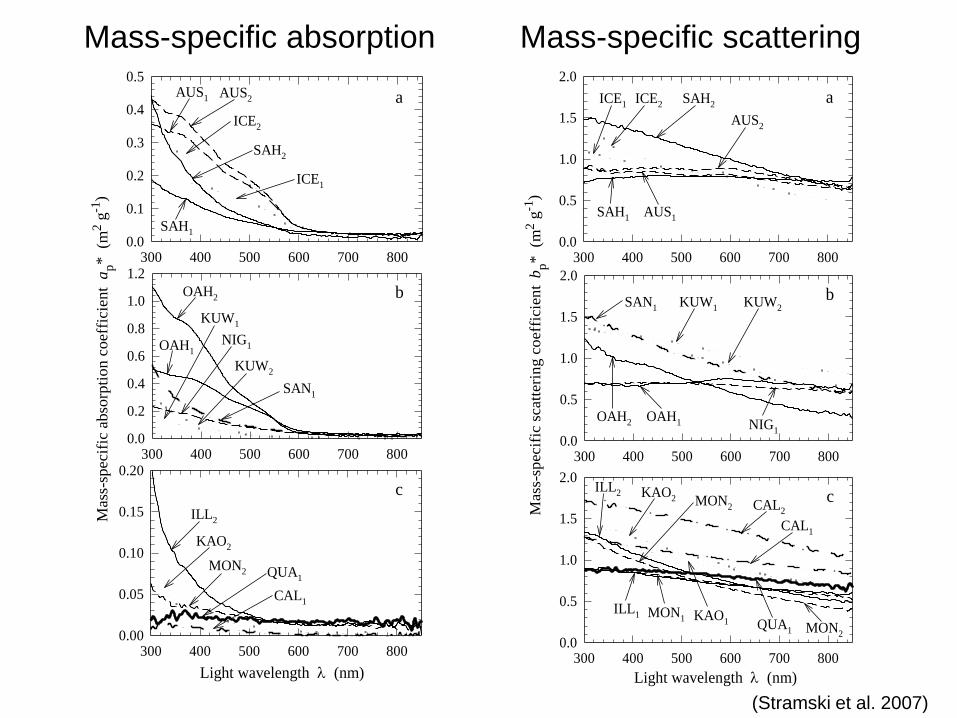
Mass-specific absorption
300 400 500 600 700 800
Mass
-sp
ecif
ic a
bso
rpti
on
co
eff
icie
nt
ap*
(m
2 g
-1)
0.0
0.1
0.2
0.3
0.4
0.5
300 400 500 600 700 8000.00
0.05
0.10
0.15
0.20
a
c
300 400 500 600 700 8000.0
0.2
0.4
0.6
0.8
1.0
1.2
b
AUS2
AUS1
OAH1
OAH2
KUW1
KUW2
SAH1
SAH2
ICE1
ICE2
CAL1
KAO2
ILL2
QUA1
MON2
Light wavelength (nm)
NIG1
SAN1
300 400 500 600 700 800
Mass
-sp
ecif
ic s
catt
eri
ng c
oeff
icie
nt
bp*
(m
2 g
-1)
0.0
0.5
1.0
1.5
2.0
300 400 500 600 700 8000.0
0.5
1.0
1.5
2.0
a
c
300 400 500 600 700 8000.0
0.5
1.0
1.5
2.0
b
AUS2
AUS1
OAH1OAH2
KUW1 KUW2
SAH1
SAH2ICE1 ICE2
CAL1
KAO1
ILL2
QUA1
MON2
Light wavelength (nm)
NIG1
SAN1
MON1
KAO2
ILL1
CAL2
MON2
Mass-specific scattering
(Stramski et al. 2007)
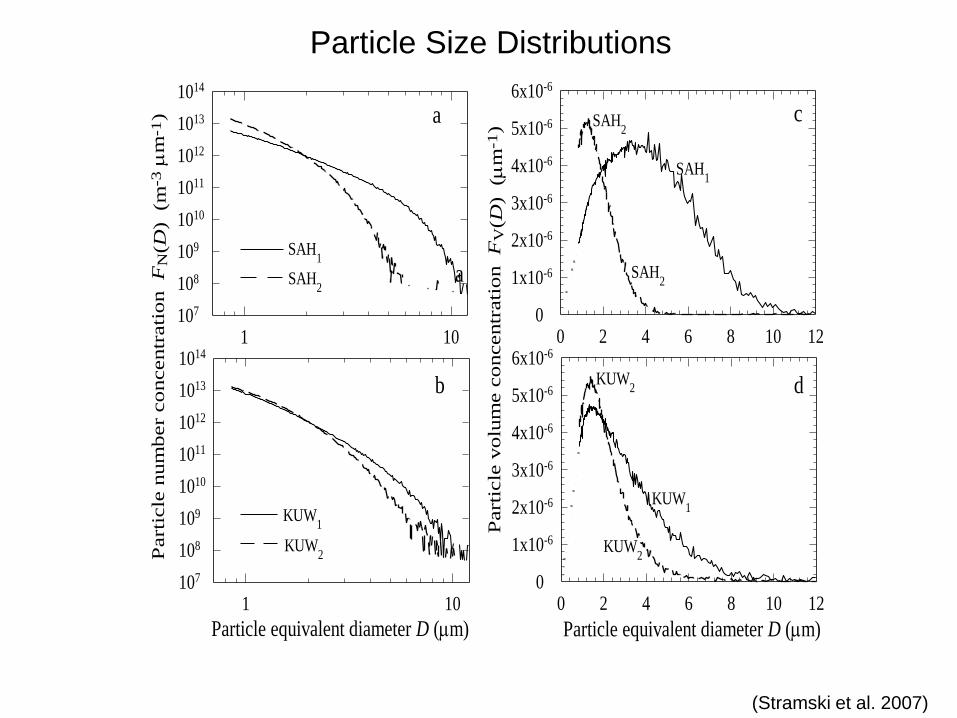
Particle Size Distributions
1 10
Part
icle
num
ber
concentr
ati
on F
N(D
) (
m-3
m
-1)
107
108
109
1010
1011
1012
1013
1014
1 10107
108
109
1010
1011
1012
1013
1014
Particle equivalent diameter D (m)
a
b
0 2 4 6 8 10 12
Part
icle
volu
me c
oncentr
ati
on F
V(D
) (
m-1
)
0
1x10⁻⁶
2x10⁻⁶
3x10⁻⁶
4x10⁻⁶
5x10⁻⁶
6x10⁻⁶
SAH1
SAH2
0 2 4 6 8 10 120
1x10⁻⁶
2x10⁻⁶
3x10⁻⁶
4x10⁻⁶
5x10⁻⁶
6x10⁻⁶
KUW1
KUW2
Particle equivalent diameter D (m)
c
dKUW2
SAH2SAH
2
SAH1
KUW1
KUW2
a
(Stramski et al. 2007)
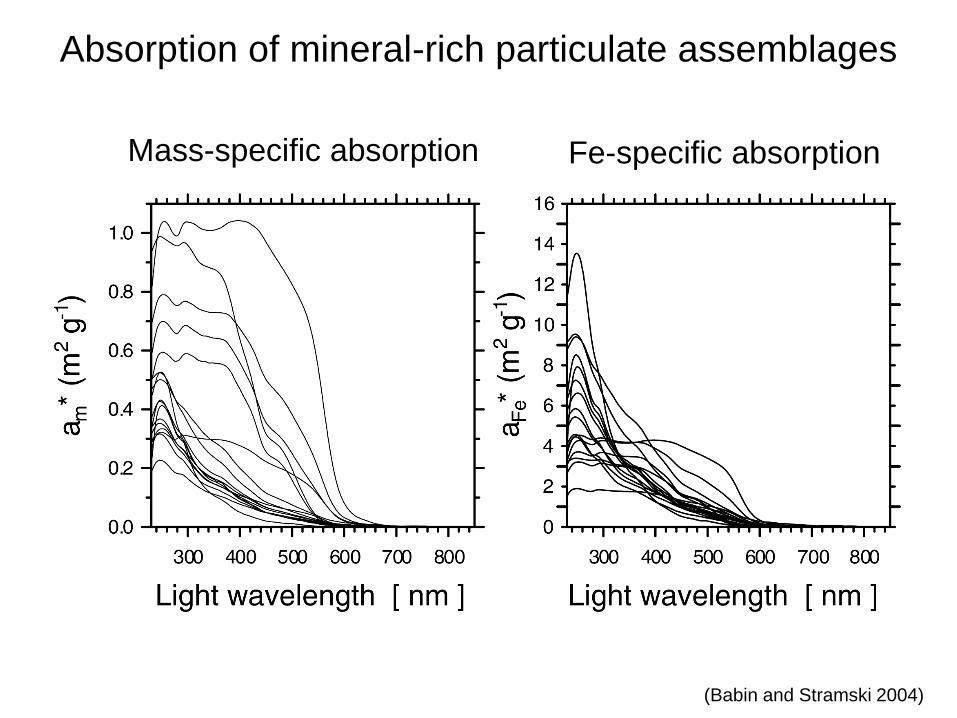
Mass-specific absorption Fe-specific absorption
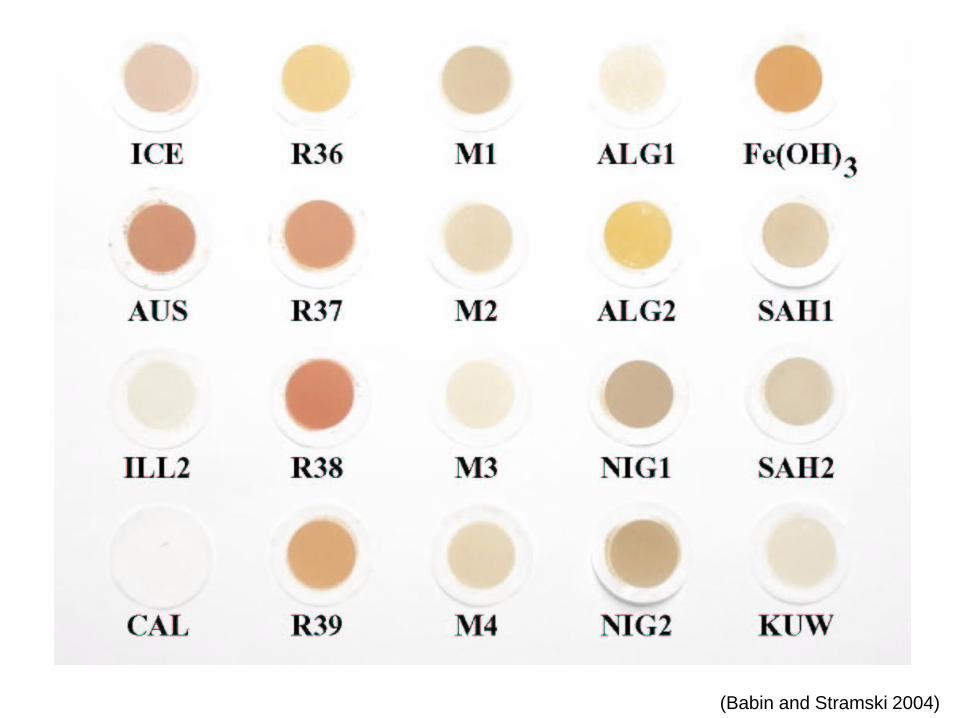
(Babin and Stramski 2004)
Absorption of mineral-rich particulate assemblages
(Babin and Stramski 2004)
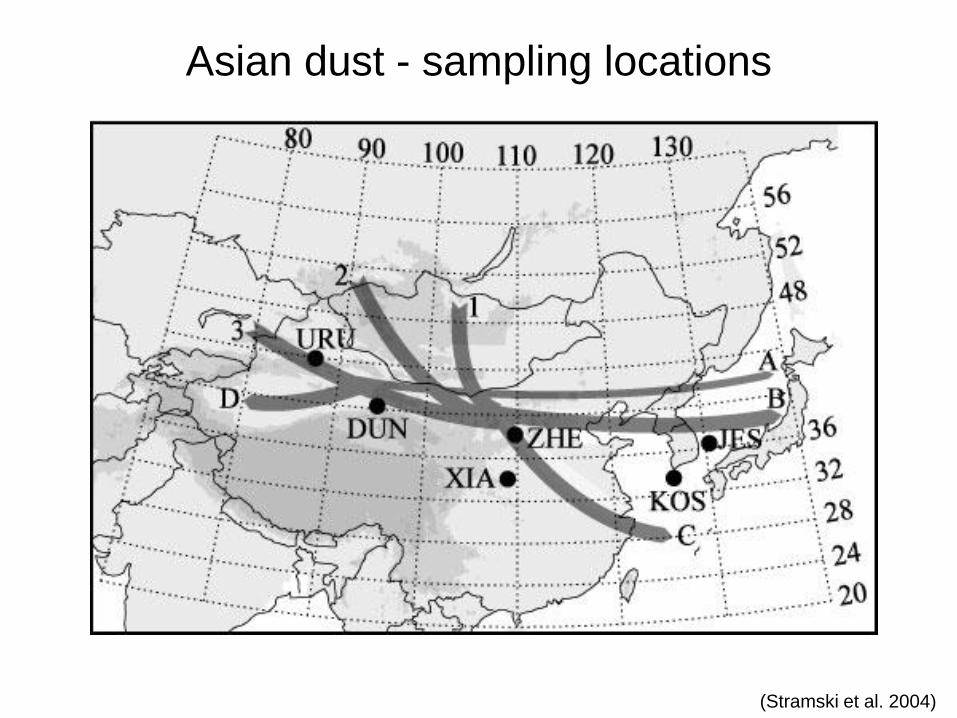
Asian dust - sampling locations
(Stramski et al. 2004)
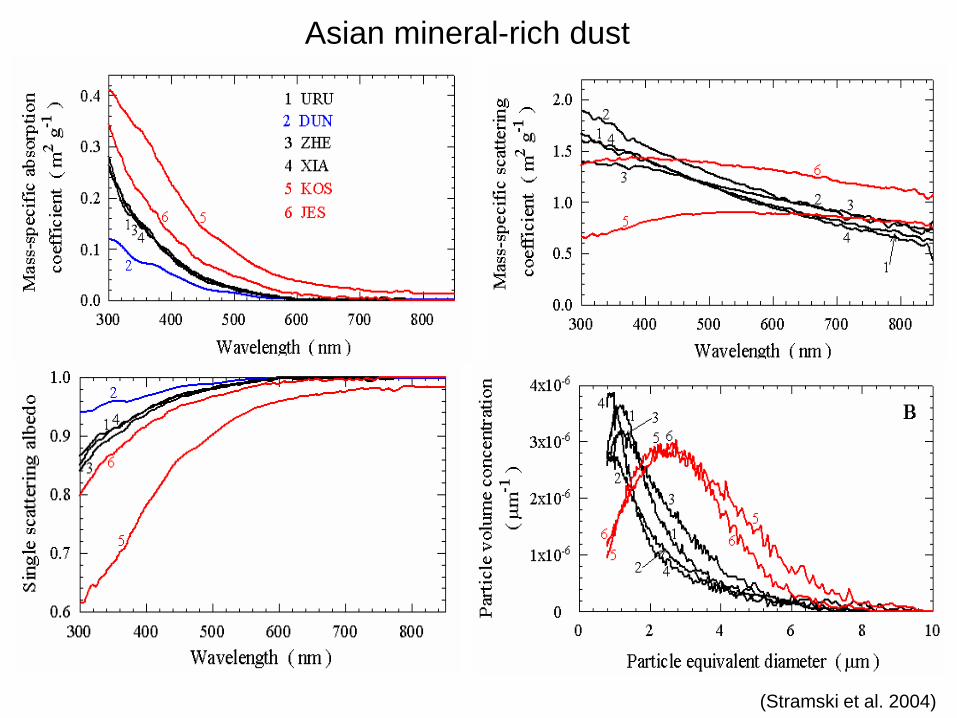
(Stramski et al. 2004)
Asian mineral-rich dust
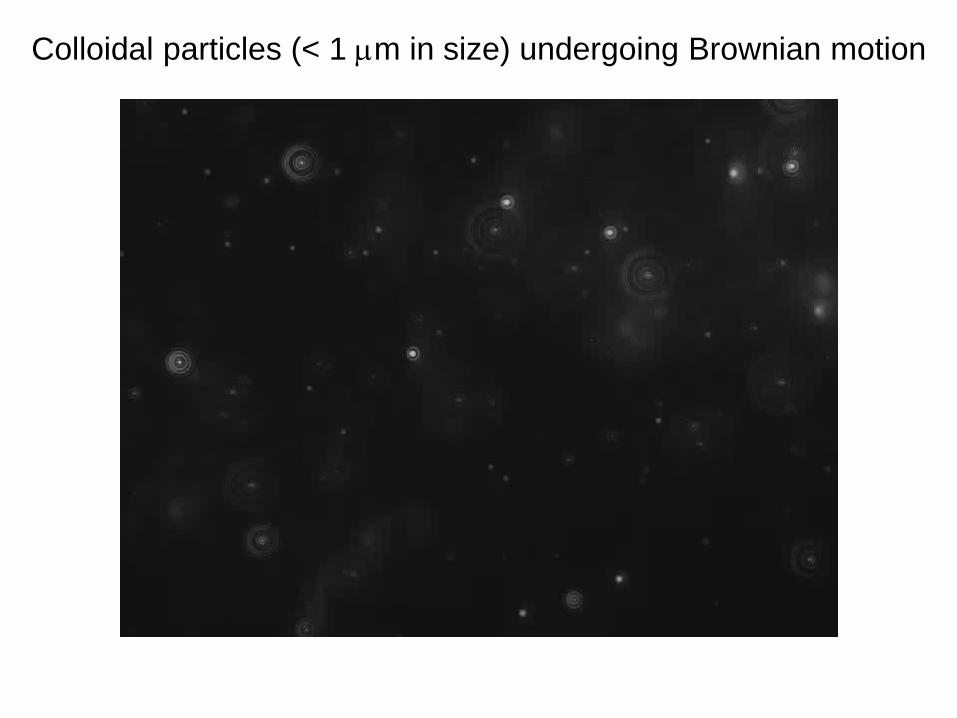
Colloidal particles (< 1 m in size) undergoing Brownian motion
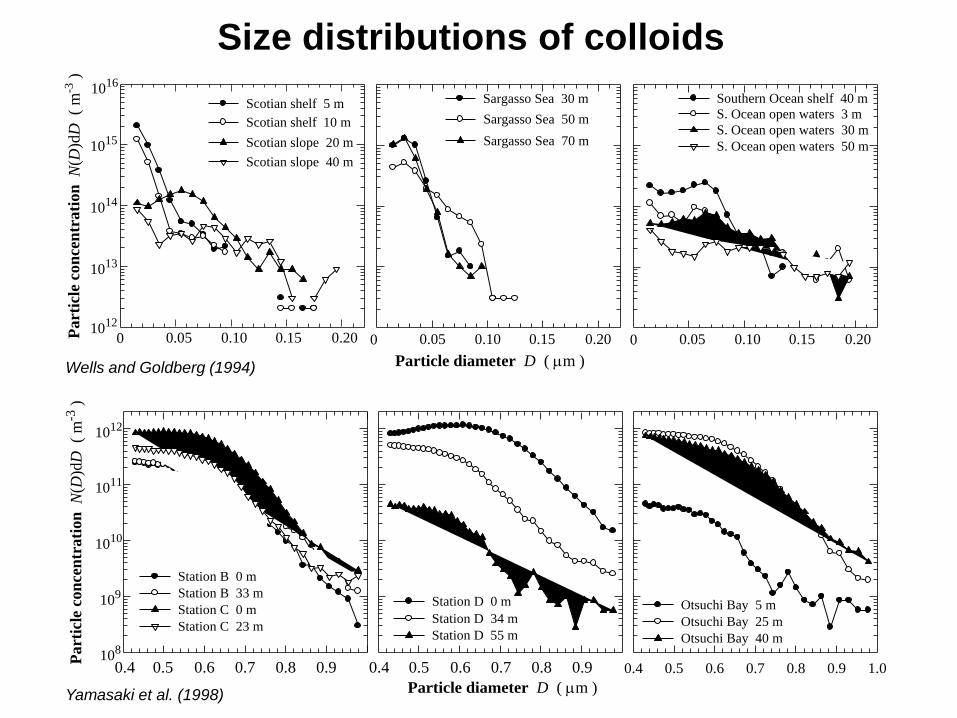
Size distributions of colloids
Particle diameter D ( m )
Pa
rtic
le c
on
cen
tra
tio
n N
(D)d
D
( m
-3 )
0 0.05 0.10 0.15 0.20 0 0.05 0.10 0.15 0.20 0 0.05 0.10 0.15 0.20
Sargasso Sea 30 m
Sargasso Sea 50 m
Sargasso Sea 70 m
Southern Ocean shelf 40 m
S. Ocean open waters 3 m
S. Ocean open waters 30 m
S. Ocean open waters 50 m
Scotian shelf 5 m
Scotian shelf 10 m
Scotian slope 20 m
Scotian slope 40 m
1016
1015
1014
1013
1012
Wells and Goldberg (1994)
Pa
rtic
le c
on
cen
tra
tio
n N
(D)d
D
( m
-3 )
Particle diameter D ( m )
0.4 0.5 0.6 0.7 0.8 0.9 1.0
Station B 0 m
Station B 33 m
Station C 0 m
Station C 23 m
Otsuchi Bay 5 m
Otsuchi Bay 25 m
Otsuchi Bay 40 m
Station D 0 m
Station D 34 m
Station D 55 m
1012
1011
1010
109
108
0.4 0.5 0.6 0.7 0.8 0.9 0.4 0.5 0.6 0.7 0.8 0.9
Yamasaki et al. (1998)
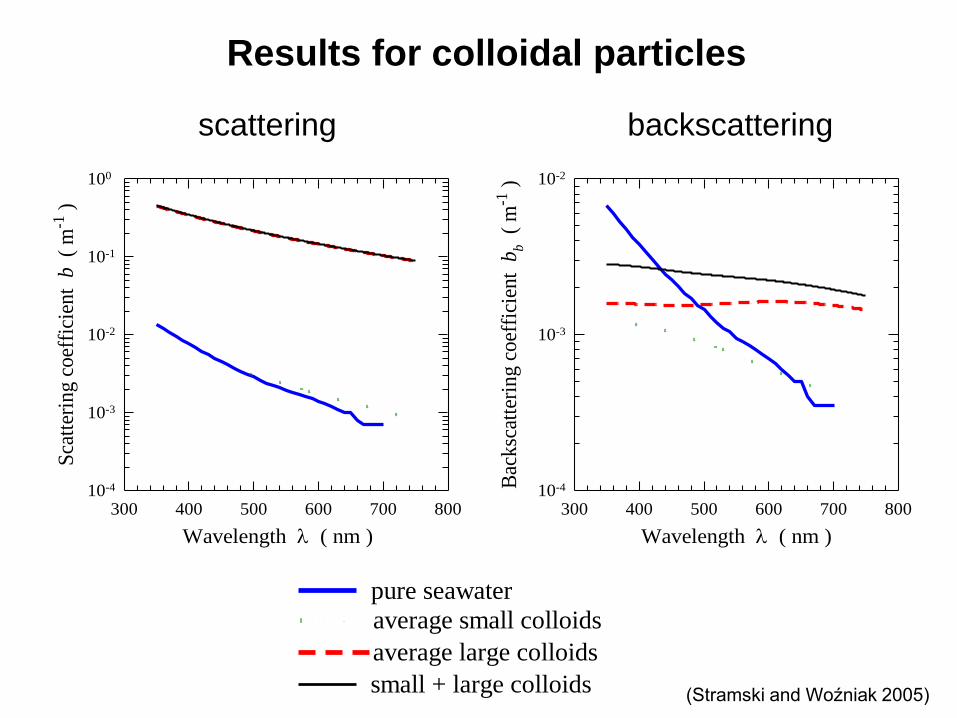
Results for colloidal particles
300 400 500 600 700 800
Sca
tter
ing c
oef
fici
ent
b
( m
-1 )
10-4
10-3
10-2
10-1
100
Wavelength ( nm )
300 400 500 600 700 800B
acksc
atte
ring c
oef
fici
ent
bb
( m
-1 )
10-4
10-3
10-2
pure seawater
average small colloids
small + large colloids
average large colloids
Wavelength ( nm )
scattering backscattering
300 400 500 600 700 800
Sca
tter
ing c
oef
fici
ent
b (
m-1
)
10-4
10-3
10-2
10-1
100
Wavelength ( nm )
300 400 500 600 700 800B
acksc
atte
ring c
oef
fici
ent
bb (
m-1
)10-4
10-3
10-2
pure seawater
average small colloids
small + large colloids
average large colloids
Wavelength ( nm )
(Stramski and Woźniak 2005)
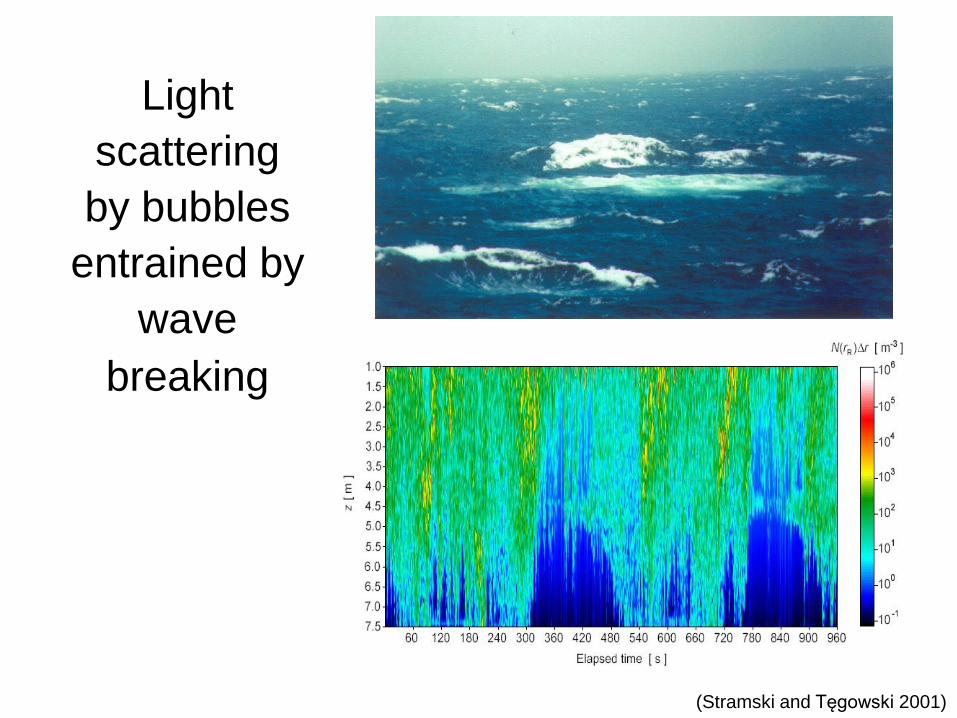
Light
scattering
by bubbles
entrained by
wave
breaking
(Stramski and Tęgowski 2001)
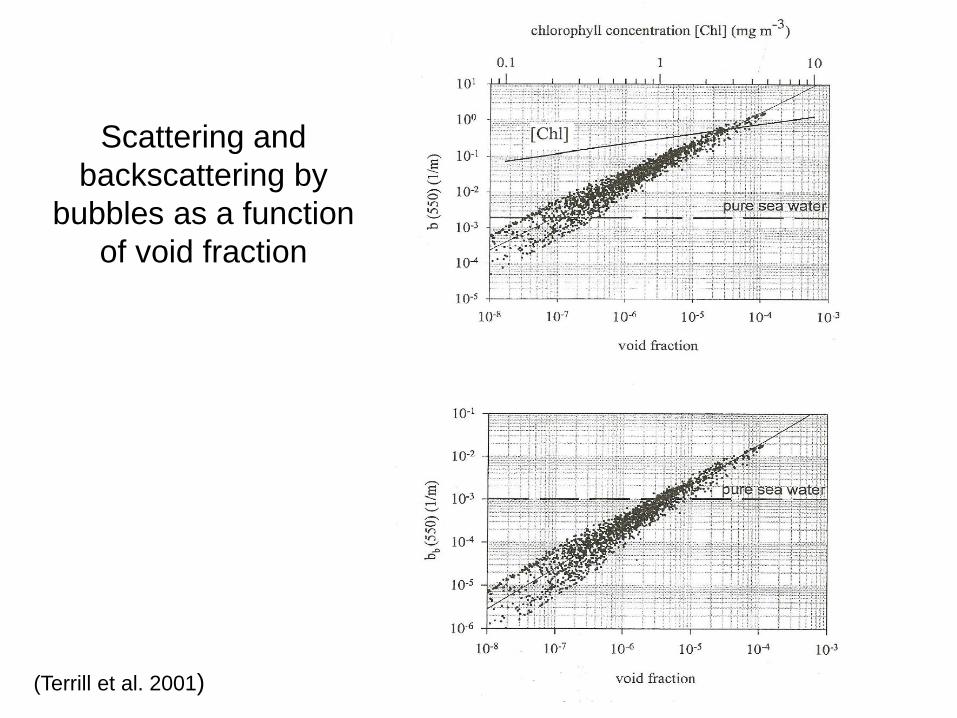
Scattering and
backscattering by
bubbles as a function
of void fraction
(Terrill et al. 2001)
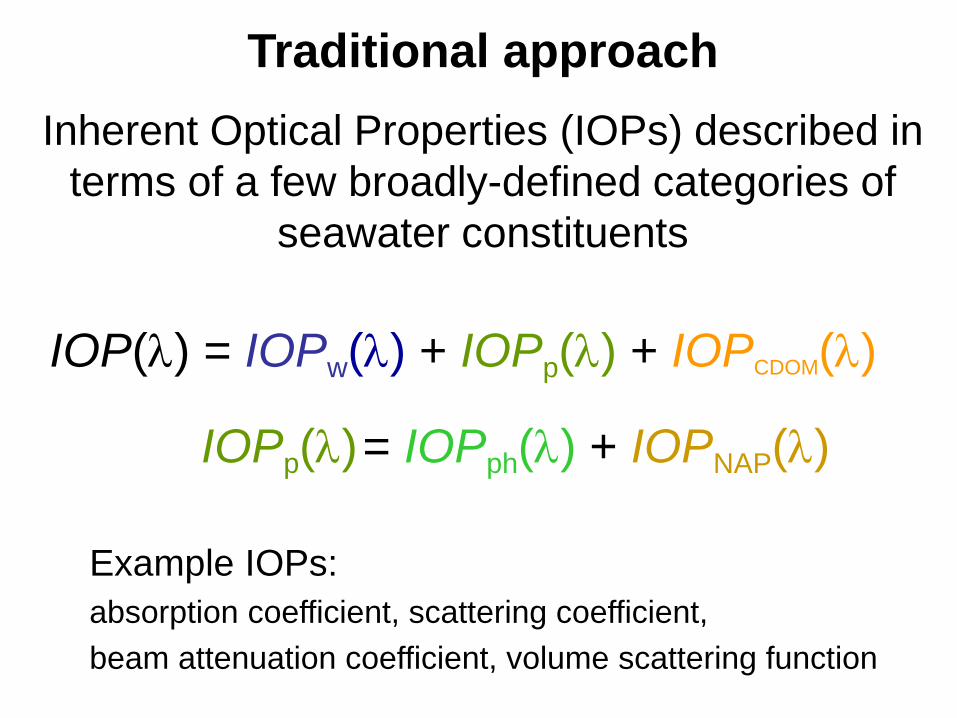
IOPp() = IOPph() + IOPNAP()
IOP() = IOPw() + IOPp() + IOPCDOM()
Traditional approach
Inherent Optical Properties (IOPs) described in
terms of a few broadly-defined categories of
seawater constituents
Example IOPs:
absorption coefficient, scattering coefficient,
beam attenuation coefficient, volume scattering function
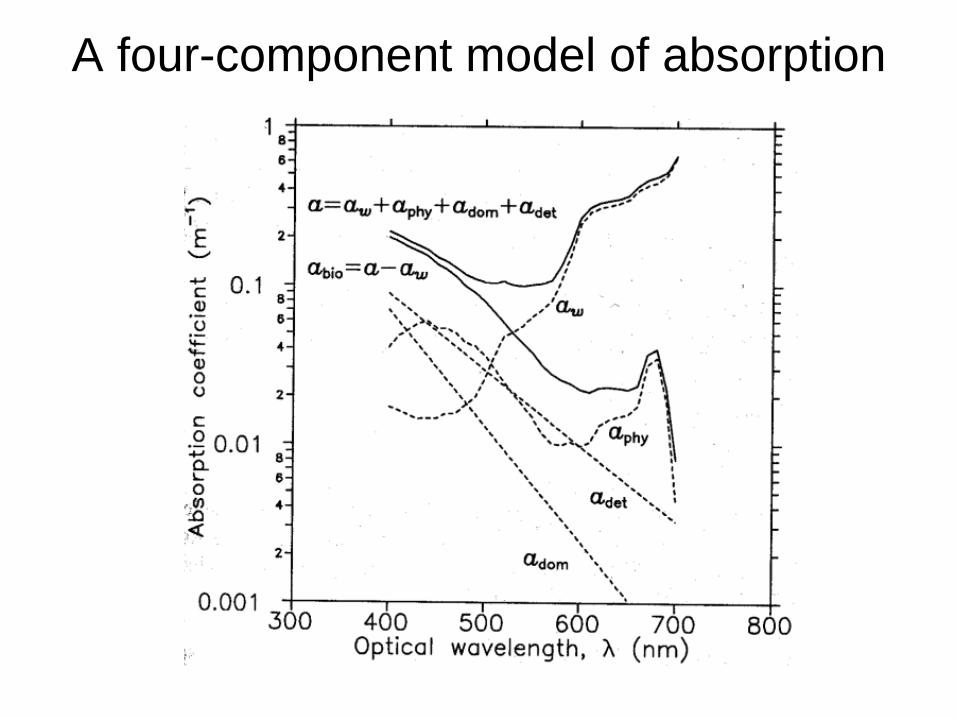
A four-component model of absorption
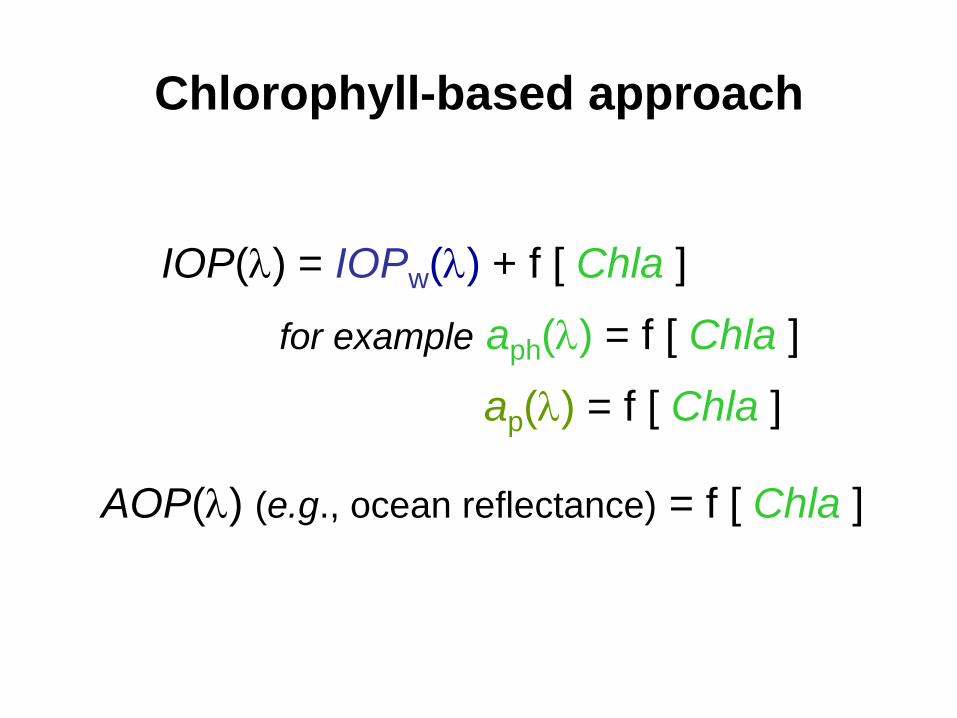
Chlorophyll-based approach
IOP() = IOPw() + f [ Chla ]
for example aph() = f [ Chla ]
ap() = f [ Chla ]
AOP() (e.g., ocean reflectance) = f [ Chla ]
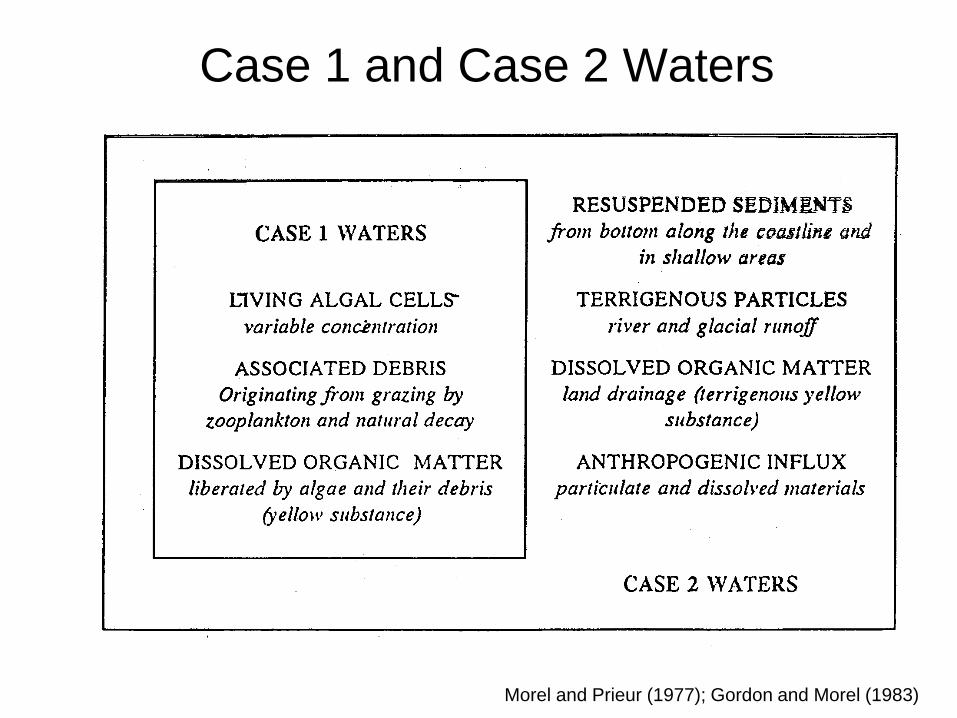
Case 1 and Case 2 Waters
Morel and Prieur (1977); Gordon and Morel (1983)
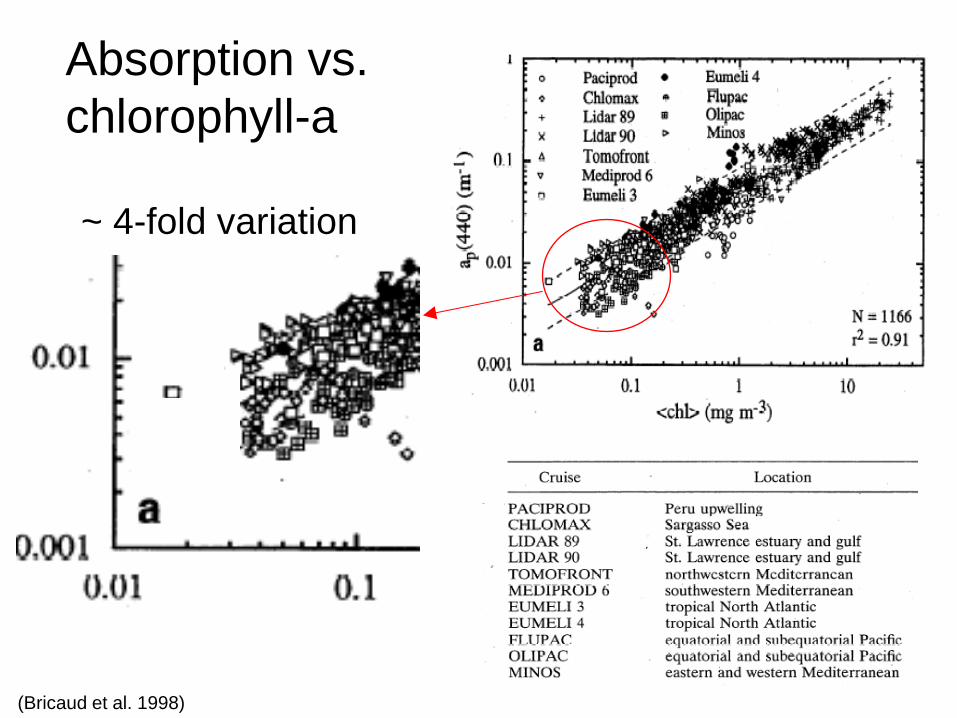
(Bricaud et al. 1998)
Absorption vs.
chlorophyll-a
~ 4-fold variation
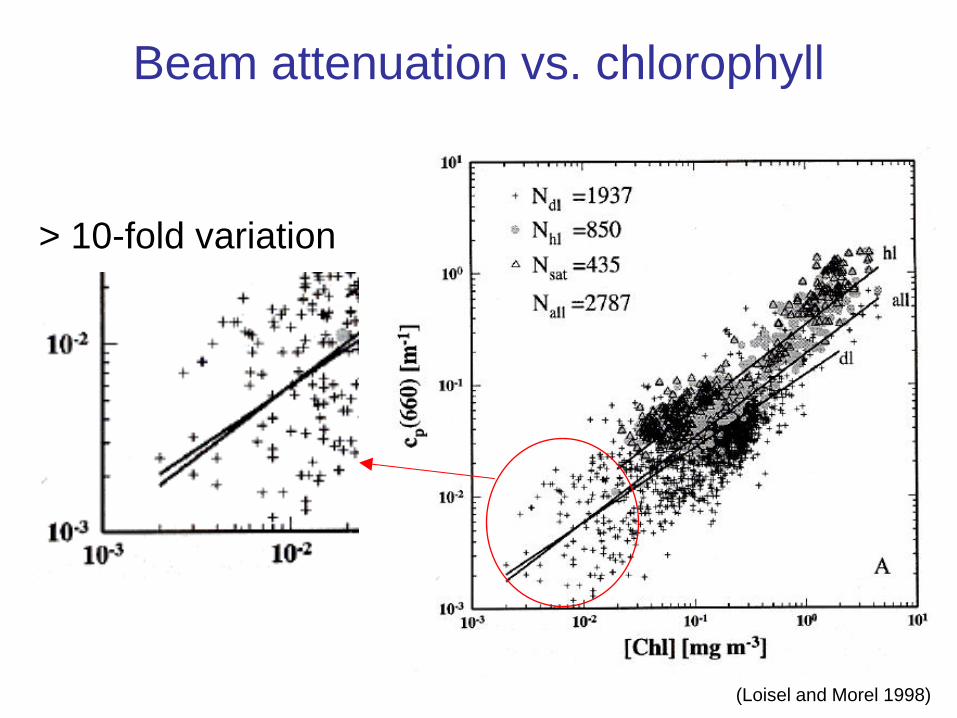
Beam attenuation vs. chlorophyll
(Loisel and Morel 1998)
> 10-fold variation
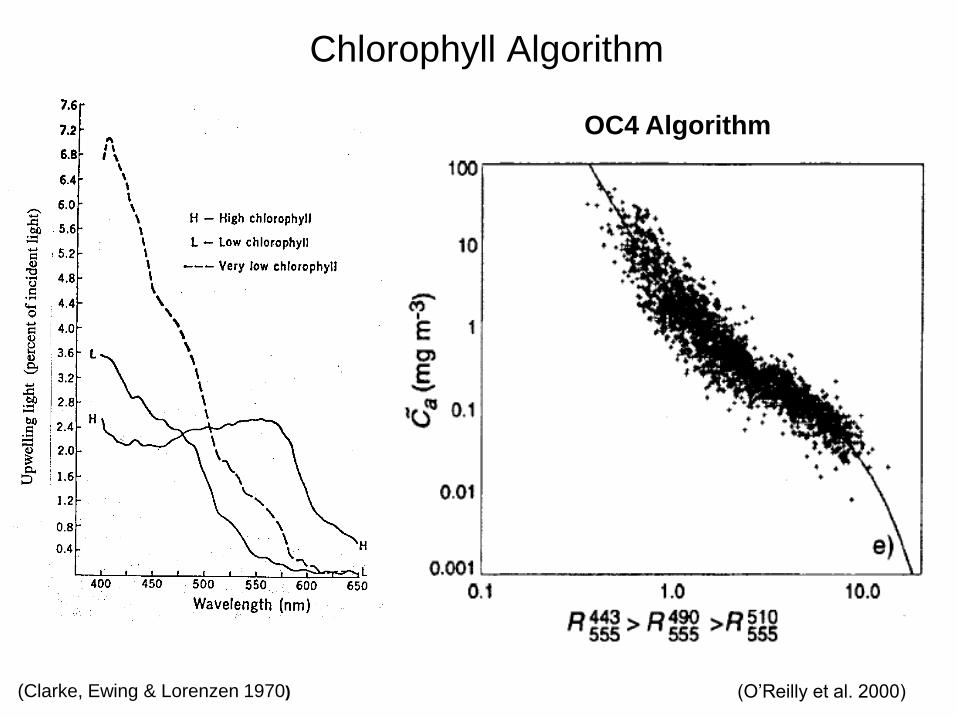
Chlorophyll Algorithm
OC4 Algorithm
(Clarke, Ewing & Lorenzen 1970) (O’Reilly et al. 2000)
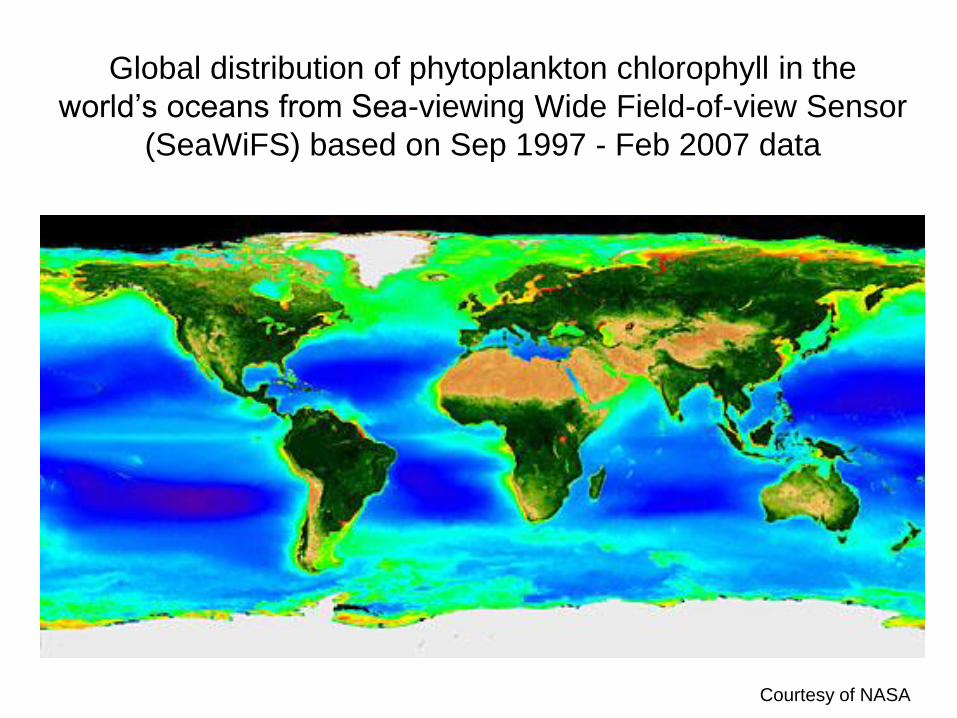
Global distribution of phytoplankton chlorophyll in the
world’s oceans from Sea-viewing Wide Field-of-view Sensor
(SeaWiFS) based on Sep 1997 - Feb 2007 data
Courtesy of NASA
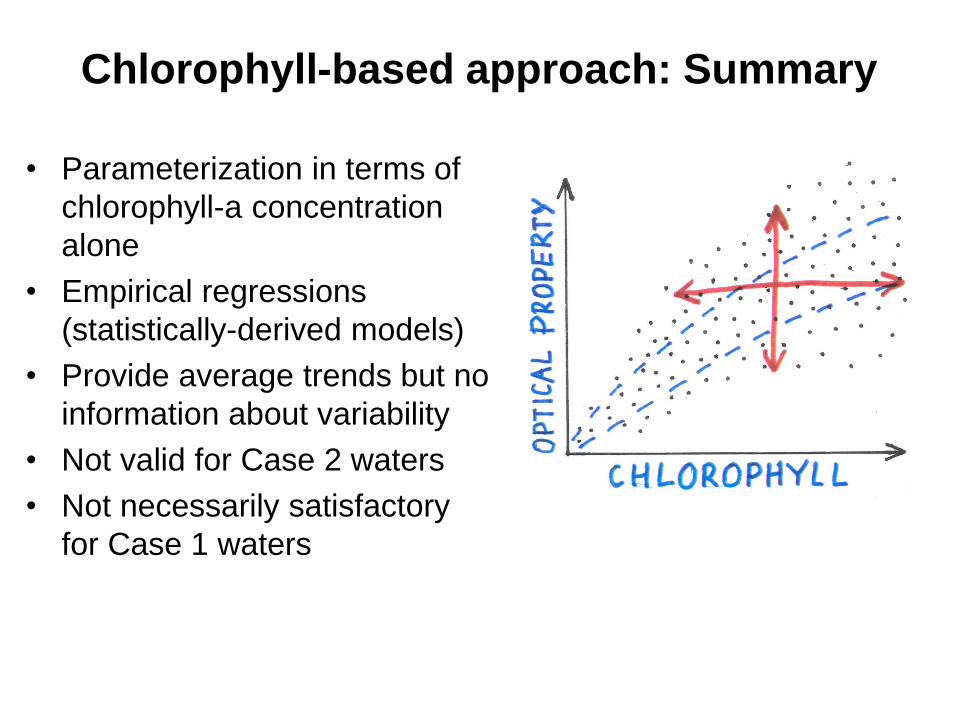
• Parameterization in terms of
chlorophyll-a concentration
alone
• Empirical regressions
(statistically-derived models)
• Provide average trends but no
information about variability
• Not valid for Case 2 waters
• Not necessarily satisfactory
for Case 1 waters
Chlorophyll-based approach: Summary
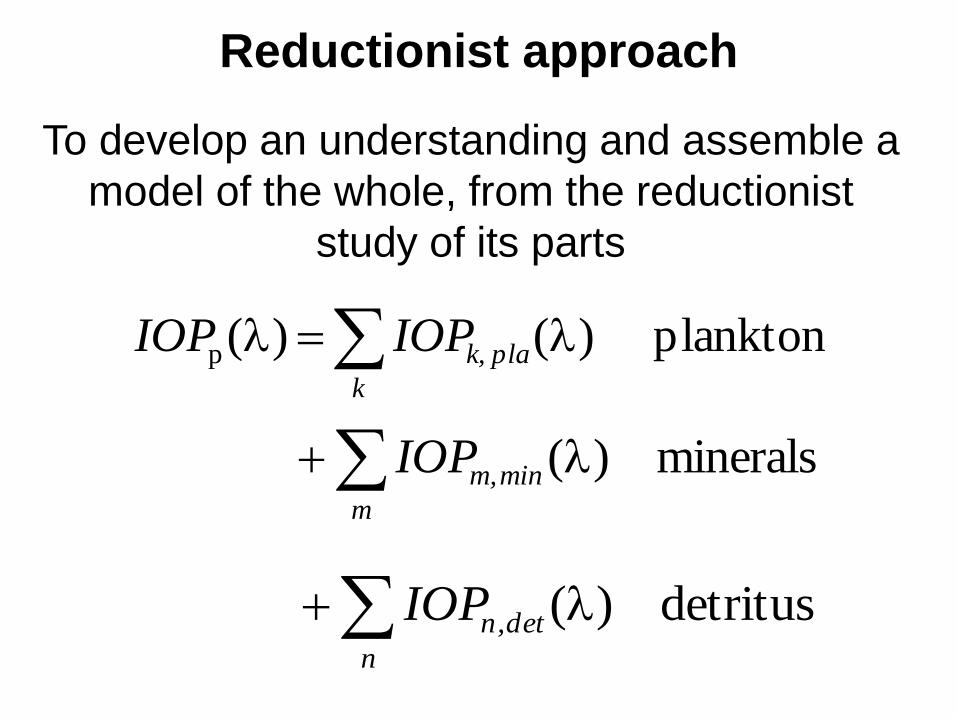
Reductionist approach
m
min m,IOP minerals)(
k
pla k,IOPIOP plankton )( )(p
n
det n,IOP detritus)(
To develop an understanding and assemble a
model of the whole, from the reductionist
study of its parts
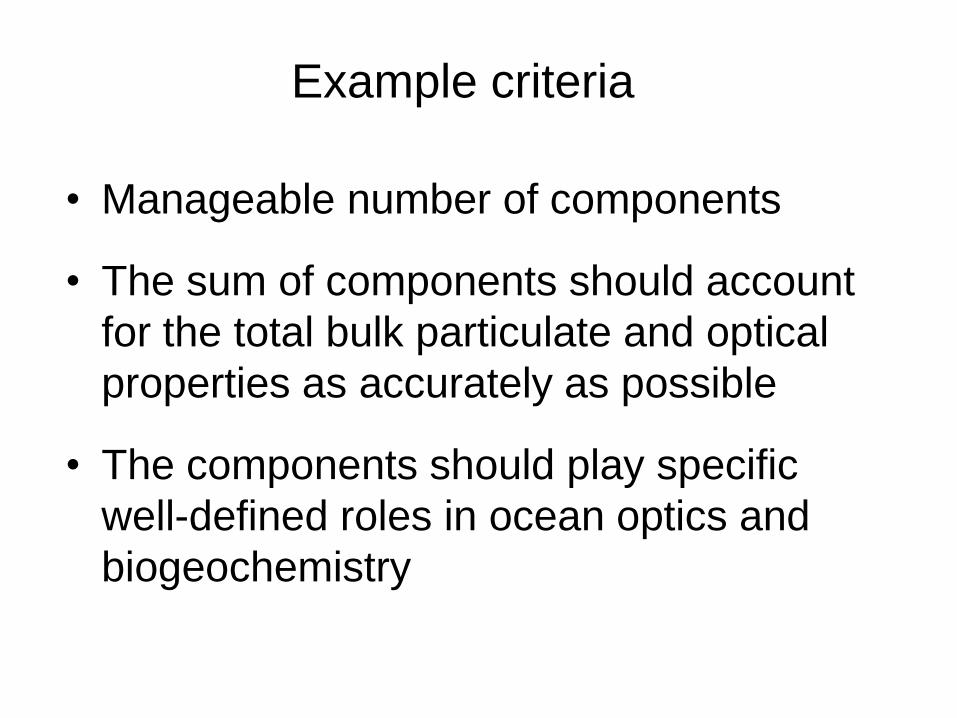
Example criteria
• Manageable number of components
• The sum of components should account
for the total bulk particulate and optical
properties as accurately as possible
• The components should play specific
well-defined roles in ocean optics and
biogeochemistry
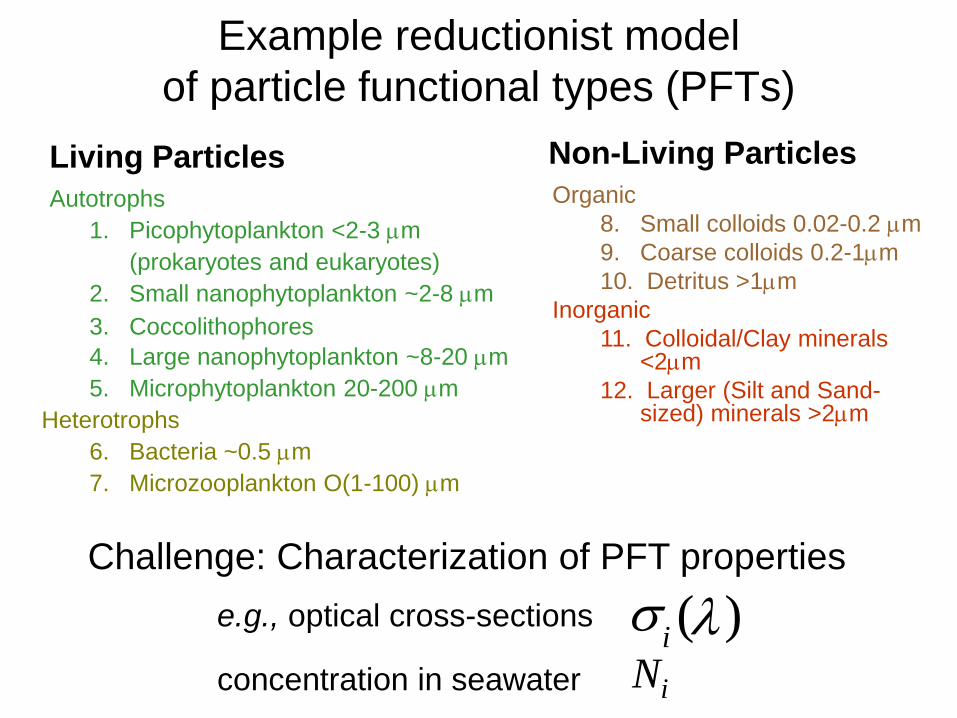
Example reductionist model
of particle functional types (PFTs)
Living Particles
Autotrophs
1. Picophytoplankton <2-3 m
(prokaryotes and eukaryotes)
2. Small nanophytoplankton ~2-8 m
3. Coccolithophores
4. Large nanophytoplankton ~8-20 m
5. Microphytoplankton 20-200 m
Heterotrophs
6. Bacteria ~0.5 m
7. Microzooplankton O(1-100) m
Non-Living Particles
Organic
8. Small colloids 0.02-0.2 m
9. Coarse colloids 0.2-1m
10. Detritus >1m
Inorganic
11. Colloidal/Clay minerals <2m
12. Larger (Silt and Sand-sized) minerals >2m
Challenge: Characterization of PFT properties
s i
) ( e.g., optical cross-sections
concentration in seawater Ni
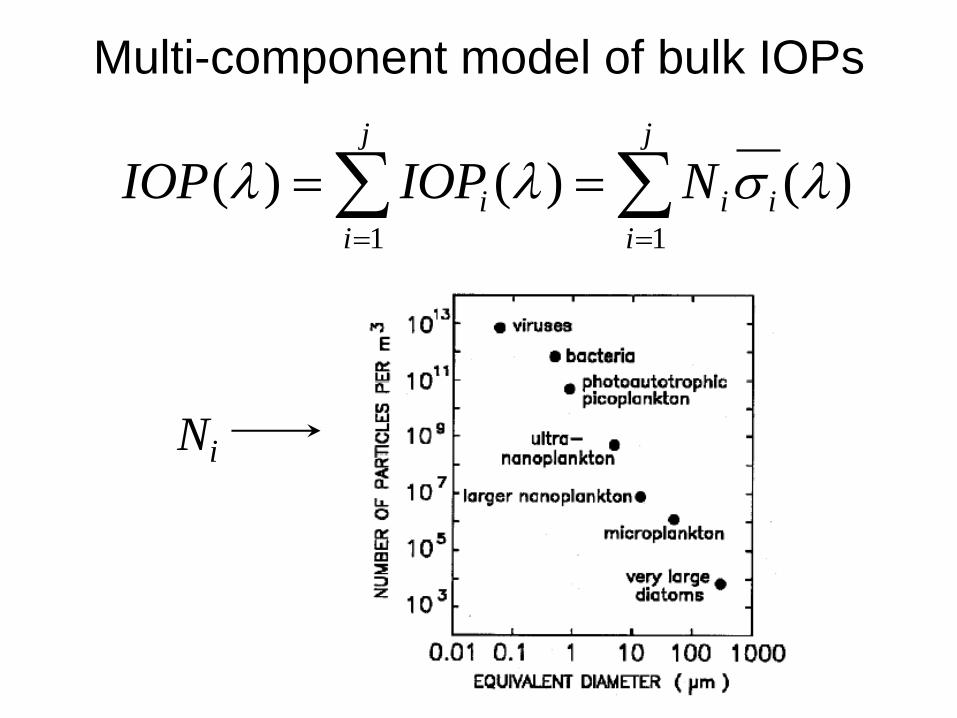
Multi-component model of bulk IOPs
)()()(11
s i
j
i
i
j
i
i NIOPIOP
Ni
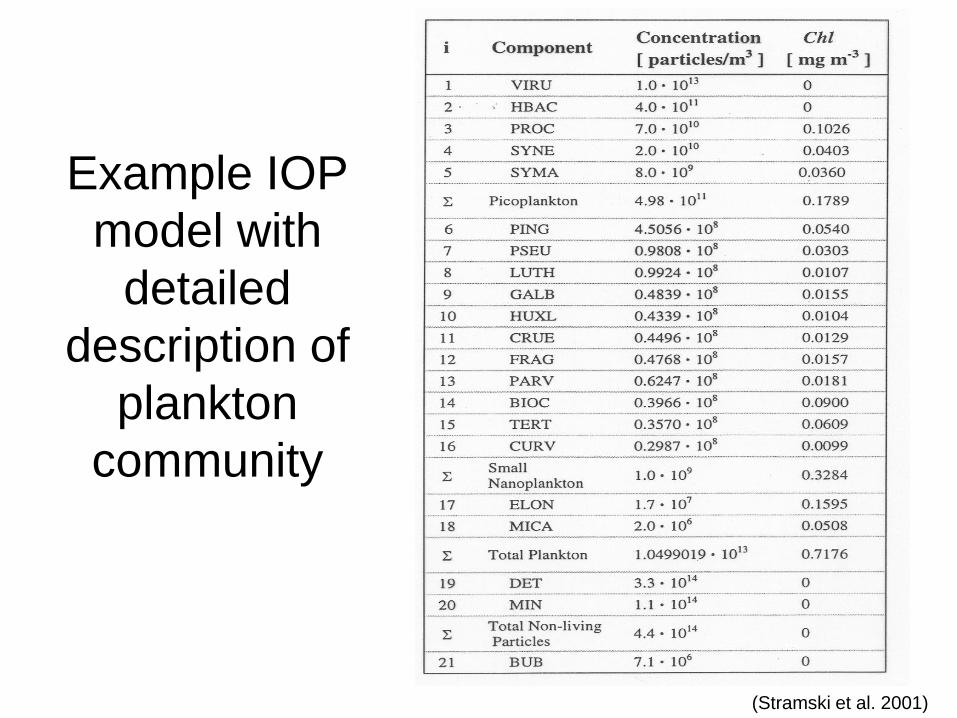
Example IOP
model with
detailed
description of
plankton
community
(Stramski et al. 2001)
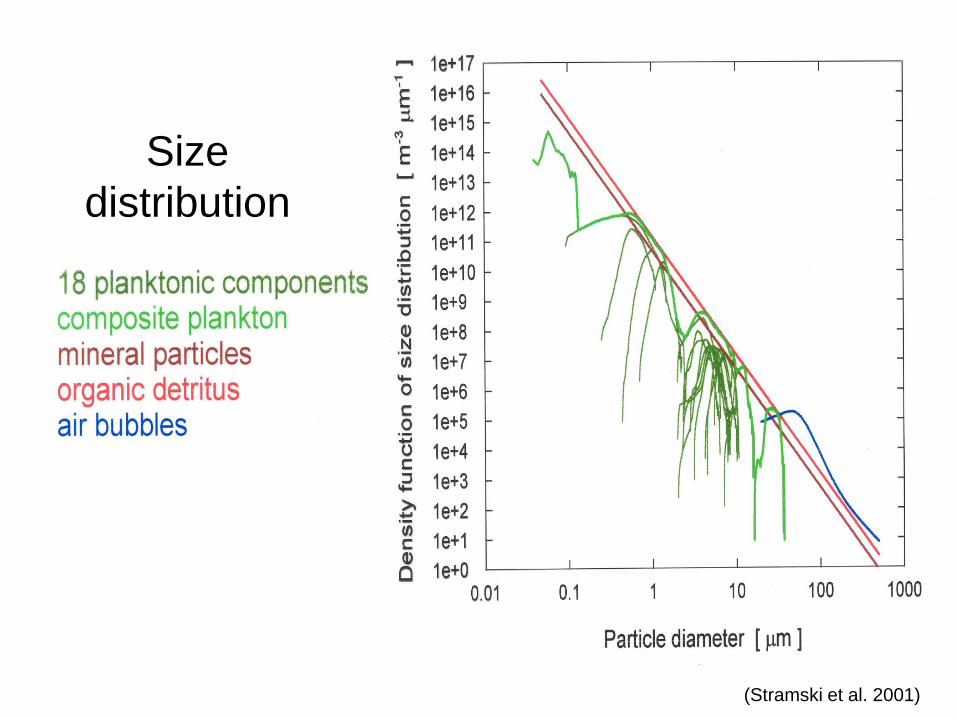
Size
distribution
(Stramski et al. 2001)
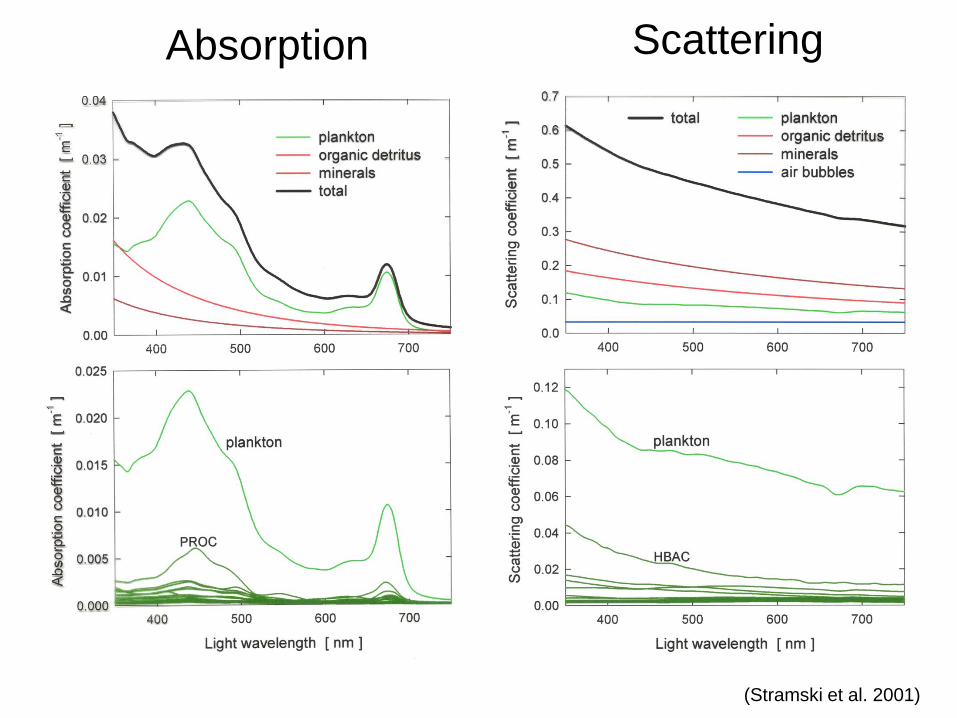
Absorption Scattering
(Stramski et al. 2001)
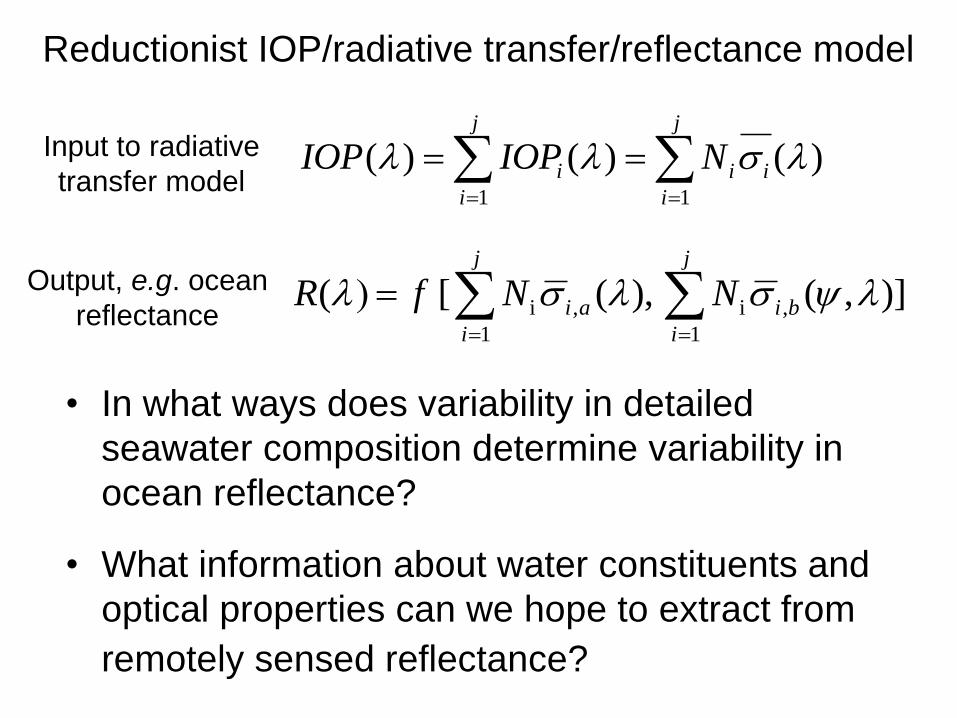
Reductionist IOP/radiative transfer/reflectance model
)()()(11
s i
j
i
i
j
i
i NIOPIOP
• In what ways does variability in detailed
seawater composition determine variability in
ocean reflectance?
• What information about water constituents and
optical properties can we hope to extract from
remotely sensed reflectance?
j
i
bi
j
i
ai NNfR1
,i
1
,i )],(,)([( ss
Input to radiative
transfer model
Output, e.g. ocean
reflectance
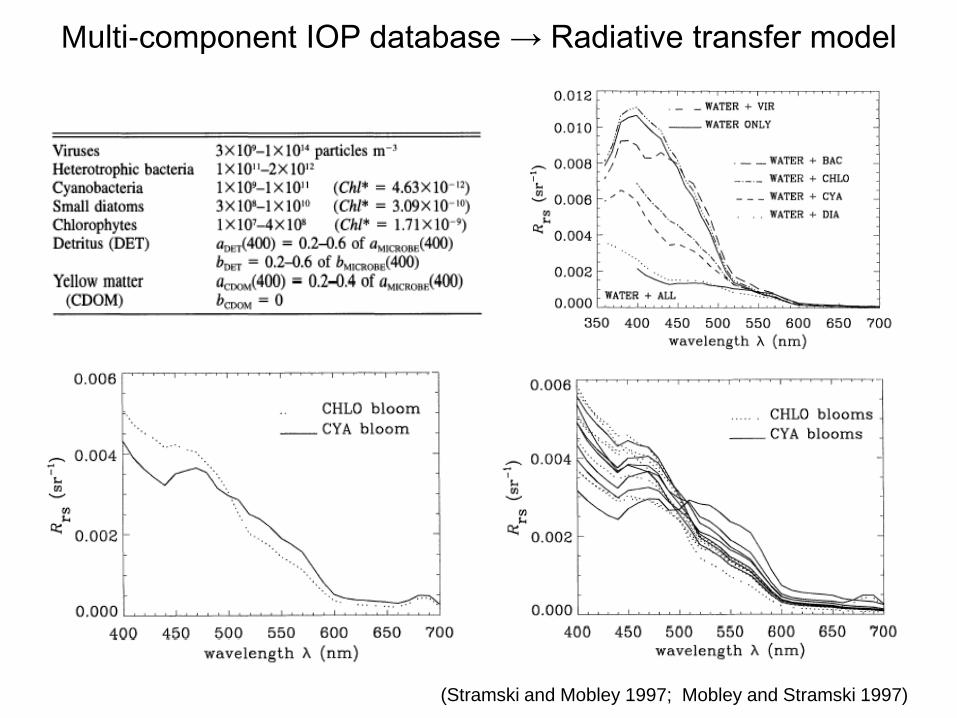
Multi-component IOP database → Radiative transfer model
(Stramski and Mobley 1997; Mobley and Stramski 1997)
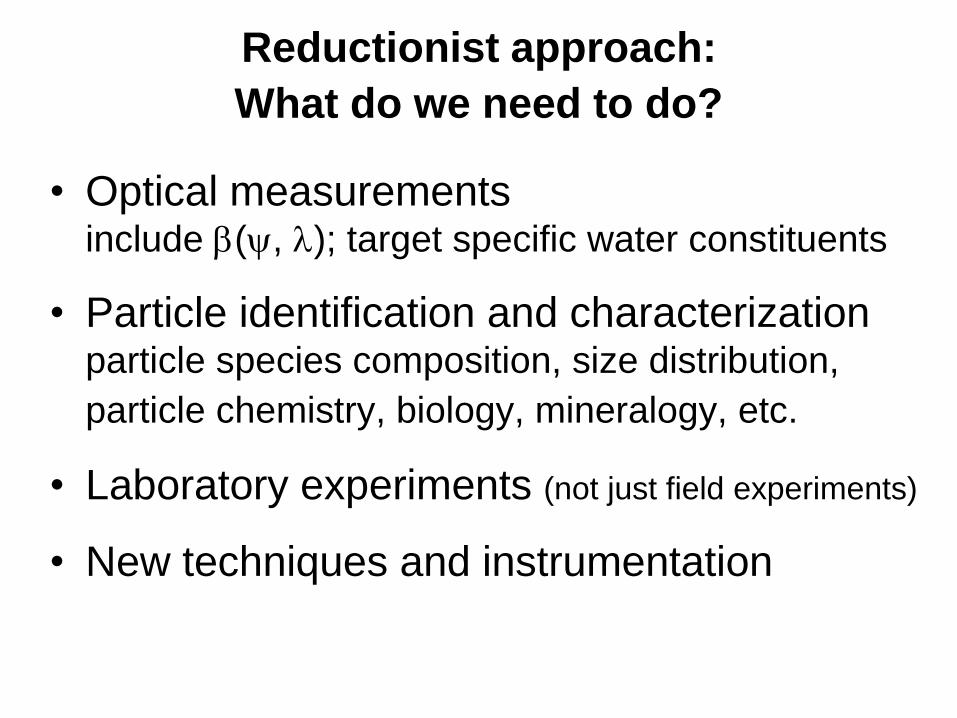
• Optical measurements include b(, ); target specific water constituents
• Particle identification and characterization particle species composition, size distribution,
particle chemistry, biology, mineralogy, etc.
• Laboratory experiments (not just field experiments)
• New techniques and instrumentation
What do we need to do?
Reductionist approach:
“The reductionist worldview has to be
accepted as it is, not because we like it,
but because that is the way the world
works”
Steven Weinberg 1979 Nobel Prize in Physics
The complexity of seawater as an optical
medium should not deter us from pursuing the
proper course in future research