Embed Size (px)
Citation preview
Optimal allocation of multi-type FACTS devices in power systemsbased on power flow entropy
Canbing LI (&), Liwu XIAO, Yijia CAO,
Qianlong ZHU, Baling FANG, Yi TAN,
Long ZENG
Abstract Flexible AC transmission systems (FACTS)
devices can effectively optimize the distribution of power
flow. Power flow entropy can be applied as a measure of
load distribution. In this paper, a method is proposed to
optimize the distribution of power flow with the coordi-
nation of multi-type FACTS devices and establishes the
corresponding mathematical models. The modified group
searcher optimization (GSO) algorithm is proposed, in
which the angle search is combined with chaotic search
model to avoid jumping into local optimization. Compared
with the different optimal allocation of multi-FACTS
devices, the optimal allocation of multi-FACTS devices is
achieved under the economic constraints. The locations
obtained by this method can achieve the purpose of bal-
ancing power flow and enhancing the system perfor-
mances. The simulations are demonstrated in an IEEE
118-bus power system with two classical types of FACTS,
namely static var compensator (SVC) and thyristor con-
trolled series Compensator (TCSC). The simulation results
show that the proposed method is feasible and effective.
Keywords Chaotic search model, Flexible AC
transmission system (FACTS), Group searcher
optimization (GSO), Power flow entropy
1 Introduction
Flexible AC transmission systems (FACTS) devices can
make power system more controllable and safe [1]. They can
improve the stability of the system and the power trans-
mission capacity and improve the distribution of power flow
and reduce the transmission loss through changing the
parameters of power transmission system [2–4].
Presently, based on different objective functions, there
are many researches on allocation and operations of FACTS
with different algorithms, such as genetic algorithm (GA),
particle swarm optimization (PSO) or bacterial swarming
algorithm (BSA) [5]. Reference [6] studied on minimum
singular value index and sensitivity of FACTS controllers to
select the optimized location to improve the power trans-
mission capacity. Respectively, the objective functions of
minimization of real power loss in transmission lines and
voltage deviation at load buses were proposed to identify
parameters and locations of FACTS [7, 8]. Considering the
vulnerability and network security indices, reference [9]
presented a method to improve network security margin by
optimizing locations of FACTS devices. In order to elimi-
nate or alleviate the line overloads, reference [10] presented
the method based on the contingency severity index (CSI)
described by a real power flow performance index (PI) to
determine placement of multi-FACTS devices, and the
optimized parameters of FACTS devices could be obtained
using GA. Considering the capability characteristics of the
SVC and TCPAR, reference [11] analyzed their impacts on
composite power system reliability by using evaluation
method (EM). To minimize the real power losses and
improve voltage profile, a novel bacterial swarming algo-
rithm (BSA) was proposed to select the optimal locations
and control parameters of multi-type FACTS devices [12].
Considering different scenarios and using harmony search
algorithm (HSA) and GA for placement of multi-FACTS
CrossCheck date: 22 May 2014
Received: 10 July 2013 / Accepted: 15 May 2014
� The Author(s) 2014. This article is published with open access at
Springerlink.com
C. LI, L. XIAO, Y. CAO, Q. ZHU, B. FANG, Y. TAN, L. ZENG,
College of Electrical and Information Engineering, Hunan
University, Changsha 410082, China
(&) e-mail: [email protected]
123
J. Mod. Power Syst. Clean Energy
DOI 10.1007/s40565-014-0059-x
devices, reference [13] verified that FACTS devices could
improve the power system stability margins, maximum
voltage stability margin and reduce losses in the network.
The objective functions of maximum system load ability of
power system and minimum investment cost were achieved
by using GA and PSO, which solved the optimal location and
parameter settings of multiple TCSCs problem [14].
Respectively, the effects of FACTS on improving the system
load ability and enhancing the TTC value by using GA and
evolutionary programming (EP) had been discussed [15, 16].
However, among the above documents, there are few
researches related to the aspect of the distribution of power
flow.
Based on the entropy theory, a novel concept of power
flow entropy has been proposed to measure the distribution
of power flow [17]. The smaller the value of power flow
entropy is, the more orderly and equal the distribution of
power flow will be. The previous studies indicate that
homogeneous distribution of power flow, which can
improve the security of the system, helps to reduce the
probability of cascading failures and large blackouts due to
chain reaction in power grids [17–21].
In this paper, the proposed method is for the coordina-
tion of multi-type FACTS devices based on power flow
entropy. Through the modified GSO algorithm, the optimal
locations and control parameters of multi-type FACTS
devices are selected and yield efficiency in equalization of
distribution of power flow. The proposed method is applied
in an IEEE 118-bus power system.
2 FACTS’ model and objective function
2.1 The steady state models of FACTS devices
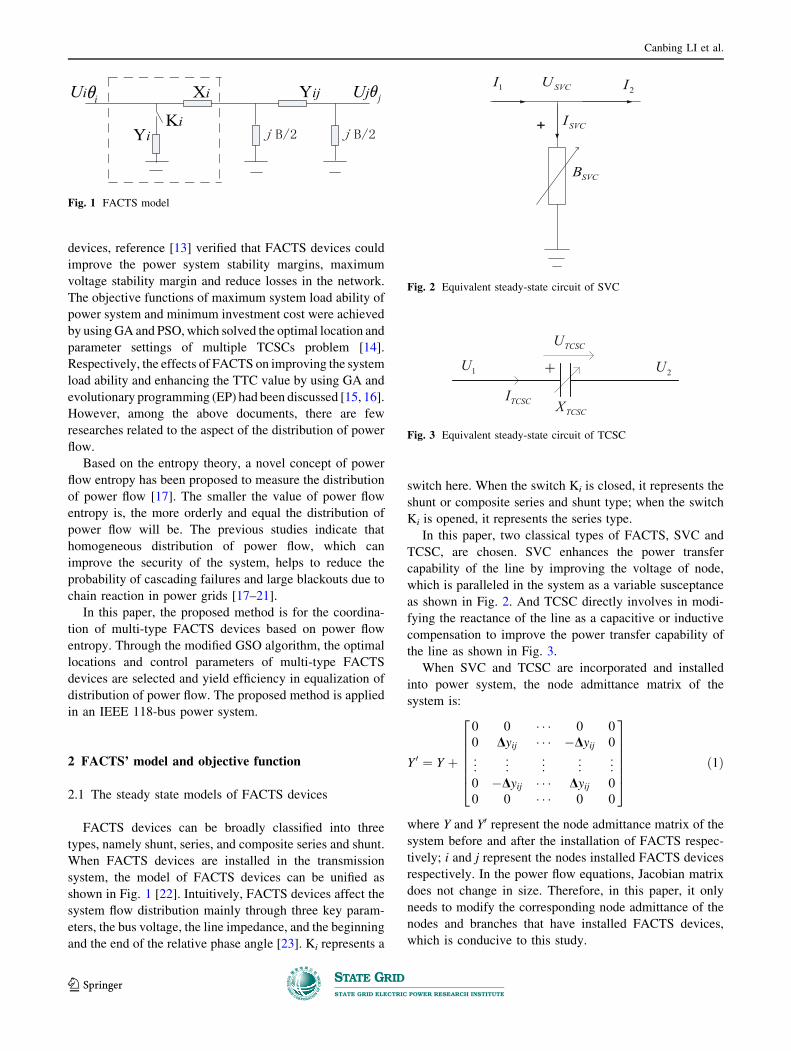
FACTS devices can be broadly classified into three
types, namely shunt, series, and composite series and shunt.
When FACTS devices are installed in the transmission
system, the model of FACTS devices can be unified as
shown in Fig. 1 [22]. Intuitively, FACTS devices affect the
system flow distribution mainly through three key param-
eters, the bus voltage, the line impedance, and the beginning
and the end of the relative phase angle [23]. Ki represents a
switch here. When the switch Ki is closed, it represents the
shunt or composite series and shunt type; when the switch
Ki is opened, it represents the series type.
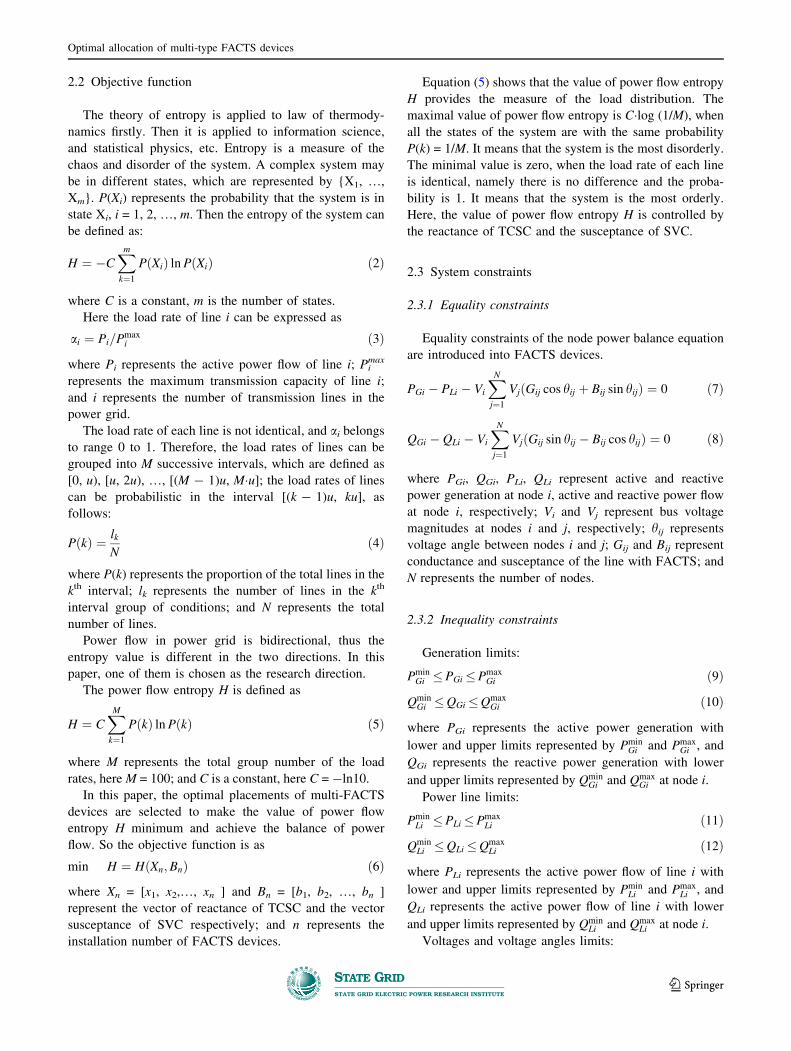
In this paper, two classical types of FACTS, SVC and
TCSC, are chosen. SVC enhances the power transfer
capability of the line by improving the voltage of node,
which is paralleled in the system as a variable susceptance
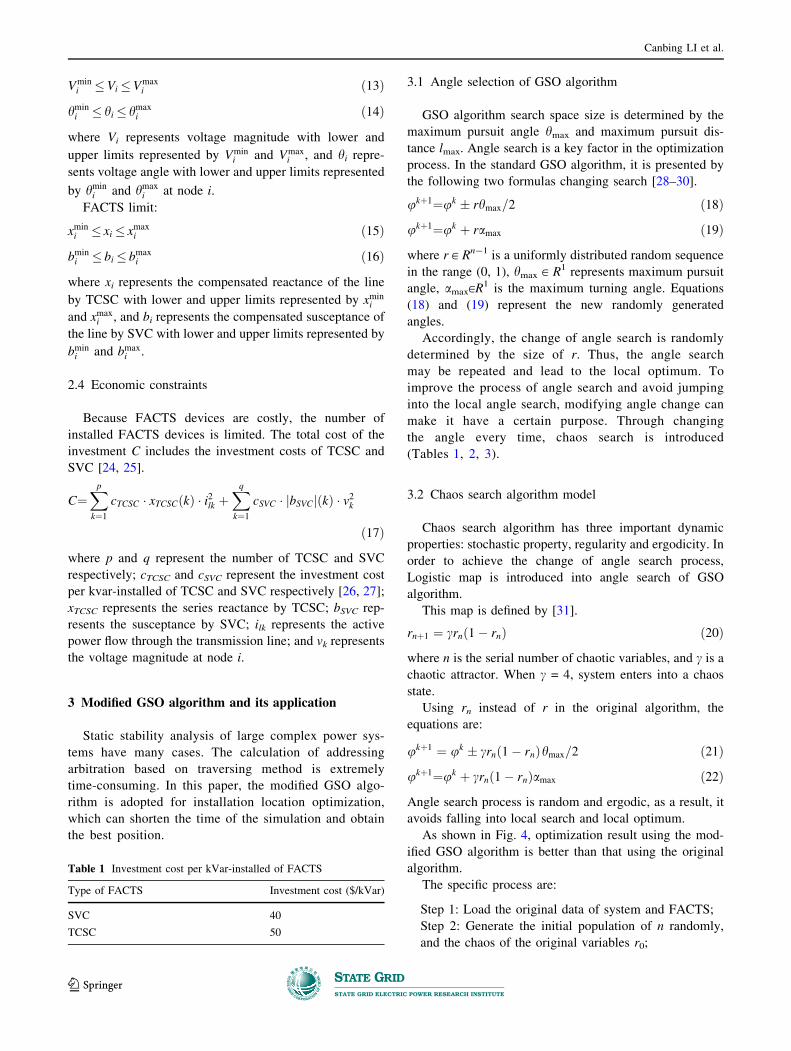
as shown in Fig. 2. And TCSC directly involves in modi-
fying the reactance of the line as a capacitive or inductive
compensation to improve the power transfer capability of
the line as shown in Fig. 3.
When SVC and TCSC are incorporated and installed
into power system, the node admittance matrix of the
system is:
Y 0 ¼ Y þ
0 0 � � � 0 0
0 Dyij � � � �Dyij 0
..
. ... ..
. ... ..
.
0 �Dyij � � � Dyij 0
0 0 � � � 0 0
2666664
3777775
ð1Þ
where Y and Y0 represent the node admittance matrix of the
system before and after the installation of FACTS respec-
tively; i and j represent the nodes installed FACTS devices
respectively. In the power flow equations, Jacobian matrix
does not change in size. Therefore, in this paper, it only
needs to modify the corresponding node admittance of the
nodes and branches that have installed FACTS devices,
which is conducive to this study.
Fig. 1 FACTS model
Fig. 2 Equivalent steady-state circuit of SVC
Fig. 3 Equivalent steady-state circuit of TCSC
Canbing LI et al.
123
2.2 Objective function
The theory of entropy is applied to law of thermody-
namics firstly. Then it is applied to information science,
and statistical physics, etc. Entropy is a measure of the
chaos and disorder of the system. A complex system may
be in different states, which are represented by {X1, …,
Xm}. P(Xi) represents the probability that the system is in
state Xi, i = 1, 2, …, m. Then the entropy of the system can
be defined as:
H ¼ �CXm
k¼1
PðXiÞ ln PðXiÞ ð2Þ
where C is a constant, m is the number of states.
Here the load rate of line i can be expressed as
ai ¼ Pi=Pmaxi ð3Þ
where Pi represents the active power flow of line i; Pimax
represents the maximum transmission capacity of line i;
and i represents the number of transmission lines in the
power grid.
The load rate of each line is not identical, and ai belongs
to range 0 to 1. Therefore, the load rates of lines can be
grouped into M successive intervals, which are defined as
[0, u), [u, 2u), …, [(M - 1)u, M�u]; the load rates of lines
can be probabilistic in the interval [(k - 1)u, ku], as
follows:
PðkÞ ¼ lk
Nð4Þ
where P(k) represents the proportion of the total lines in the
kth interval; lk represents the number of lines in the kth
interval group of conditions; and N represents the total
number of lines.
Power flow in power grid is bidirectional, thus the
entropy value is different in the two directions. In this
paper, one of them is chosen as the research direction.
The power flow entropy H is defined as
H ¼ CXMk¼1
PðkÞ ln PðkÞ ð5Þ
where M represents the total group number of the load
rates, here M = 100; and C is a constant, here C = -ln10.
In this paper, the optimal placements of multi-FACTS
devices are selected to make the value of power flow
entropy H minimum and achieve the balance of power
flow. So the objective function is as
min H ¼ HðXn;BnÞ ð6Þ
where Xn = [x1, x2,…, xn ] and Bn = [b1, b2, …, bn ]
represent the vector of reactance of TCSC and the vector
susceptance of SVC respectively; and n represents the
installation number of FACTS devices.
Equation (5) shows that the value of power flow entropy
H provides the measure of the load distribution. The
maximal value of power flow entropy is C�log (1/M), when
all the states of the system are with the same probability
P(k) = 1/M. It means that the system is the most disorderly.
The minimal value is zero, when the load rate of each line
is identical, namely there is no difference and the proba-
bility is 1. It means that the system is the most orderly.
Here, the value of power flow entropy H is controlled by
the reactance of TCSC and the susceptance of SVC.
2.3 System constraints
2.3.1 Equality constraints
Equality constraints of the node power balance equation
are introduced into FACTS devices.
PGi � PLi � Vi
XN
j¼1
VjðGij cos hij þ Bij sin hijÞ ¼ 0 ð7Þ
QGi � QLi � Vi
XN
j¼1
VjðGij sin hij � Bij cos hijÞ ¼ 0 ð8Þ
where PGi, QGi, PLi, QLi represent active and reactive
power generation at node i, active and reactive power flow
at node i, respectively; Vi and Vj represent bus voltage
magnitudes at nodes i and j, respectively; hij represents
voltage angle between nodes i and j; Gij and Bij represent
conductance and susceptance of the line with FACTS; and
N represents the number of nodes.
2.3.2 Inequality constraints
Generation limits:
PminGi �PGi�Pmax
Gi ð9Þ
QminGi �QGi�Qmax
Gi ð10Þ
where PGi represents the active power generation with
lower and upper limits represented by PminGi and Pmax
Gi , and
QGi represents the reactive power generation with lower
and upper limits represented by QminGi and Qmax
Gi at node i.
Power line limits:
PminLi �PLi�Pmax
Li ð11Þ
QminLi �QLi�Qmax
Li ð12Þ
where PLi represents the active power flow of line i with
lower and upper limits represented by PminLi and Pmax
Li , and
QLi represents the active power flow of line i with lower
and upper limits represented by QminLi and Qmax
Li at node i.
Voltages and voltage angles limits:
Optimal allocation of multi-type FACTS devices
123
Vmini �Vi�Vmax
i ð13Þ
hmini � hi� hmax
i ð14Þ
where Vi represents voltage magnitude with lower and
upper limits represented by Vmini and Vmax
i , and hi repre-
sents voltage angle with lower and upper limits represented
by hmini and hmax
i at node i.
FACTS limit:
xmini � xi� xmax
i ð15Þ
bmini � bi� bmax
i ð16Þ
where xi represents the compensated reactance of the line
by TCSC with lower and upper limits represented by xmini
and xmaxi , and bi represents the compensated susceptance of
the line by SVC with lower and upper limits represented by
bmini and bmax
i .
2.4 Economic constraints
Because FACTS devices are costly, the number of
installed FACTS devices is limited. The total cost of the
investment C includes the investment costs of TCSC and
SVC [24, 25].
C¼Xp
k¼1
cTCSC � xTCSCðkÞ � i2lk þXq
k¼1
cSVC � bSVCj jðkÞ � v2k
ð17Þ
where p and q represent the number of TCSC and SVC
respectively; cTCSC and cSVC represent the investment cost
per kvar-installed of TCSC and SVC respectively [26, 27];
xTCSC represents the series reactance by TCSC; bSVC rep-
resents the susceptance by SVC; ilk represents the active
power flow through the transmission line; and vk represents
the voltage magnitude at node i.
3 Modified GSO algorithm and its application
Static stability analysis of large complex power sys-
tems have many cases. The calculation of addressing
arbitration based on traversing method is extremely
time-consuming. In this paper, the modified GSO algo-
rithm is adopted for installation location optimization,
which can shorten the time of the simulation and obtain
the best position.
3.1 Angle selection of GSO algorithm
GSO algorithm search space size is determined by the
maximum pursuit angle hmax and maximum pursuit dis-
tance lmax. Angle search is a key factor in the optimization
process. In the standard GSO algorithm, it is presented by
the following two formulas changing search [28–30].
ukþ1¼uk � rhmax=2 ð18Þ
ukþ1¼uk þ ramax ð19Þ
where r [ Rn-1 is a uniformly distributed random sequence
in the range (0, 1), hmax [ R1 represents maximum pursuit
angle, amax[R1 is the maximum turning angle. Equations
(18) and (19) represent the new randomly generated
angles.
Accordingly, the change of angle search is randomly
determined by the size of r. Thus, the angle search
may be repeated and lead to the local optimum. To
improve the process of angle search and avoid jumping
into the local angle search, modifying angle change can
make it have a certain purpose. Through changing
the angle every time, chaos search is introduced
(Tables 1, 2, 3).
3.2 Chaos search algorithm model
Chaos search algorithm has three important dynamic
properties: stochastic property, regularity and ergodicity. In
order to achieve the change of angle search process,
Logistic map is introduced into angle search of GSO
algorithm.
This map is defined by [31].
rnþ1 ¼ crnð1� rnÞ ð20Þ
where n is the serial number of chaotic variables, and c is a
chaotic attractor. When c = 4, system enters into a chaos
state.
Using rn instead of r in the original algorithm, the
equations are:
ukþ1 ¼ uk � crn 1� rnð Þhmax=2 ð21Þ
ukþ1¼uk þ crn 1� rnð Þamax ð22Þ
Angle search process is random and ergodic, as a result, it
avoids falling into local search and local optimum.
As shown in Fig. 4, optimization result using the mod-
ified GSO algorithm is better than that using the original
algorithm.
The specific process are:
Step 1: Load the original data of system and FACTS;
Step 2: Generate the initial population of n randomly,
and the chaos of the original variables r0;
Table 1 Investment cost per kVar-installed of FACTS
Type of FACTS Investment cost ($/kVar)
SVC 40
TCSC 50
Canbing LI et al.
123
Step 3: Power flow calculation and data processing.
Calculate the objective function value, and select a
minimum of objective function as producer in the initial
populations. 80 % of the members of the initial popu-
lation are looked as scroungers, and the rest of the
members are looked as rangers;
Step 4: Update the placements of producer, scrounger
and ranger, and calculate the objective function value
correspondingly using the modified GSO algorithm;
Step 5: If the objective function value is smaller than the
objective function value of the initial producer, the new
producer replaces the original producer, and the initial
producer is merged with scrounger or ranger, continuing
to update;
Step 6: Judge the termination condition. If the termina-
tion condition (maximum number of iterations) is
satisfied, the algorithm is terminated; if not, repeat Step
3 and Step 5;
Step 7: Terminate the algorithm, and output the final
optimal producer.
4 Case study
To verify the proposed method, the IEEE 118-bus test
system is taken into account to select the locations and
parameters of multi-FACTS in this paper. This network
consists of 54 generator buses and 186 branches [32, 33]. In
the modified GSO algorithm, there are 50 initial popula-
tions, and the maximum number of iterations is 100.
For the purpose of objective optimization, the number of
FACTS, line load rate, line flow, and the loss of network
are compared. The value of power flow entropy is 9.5208
as the initial accumulator value before installation of
FACTS. In this paper, TCSC and SVC were tested
respectively.
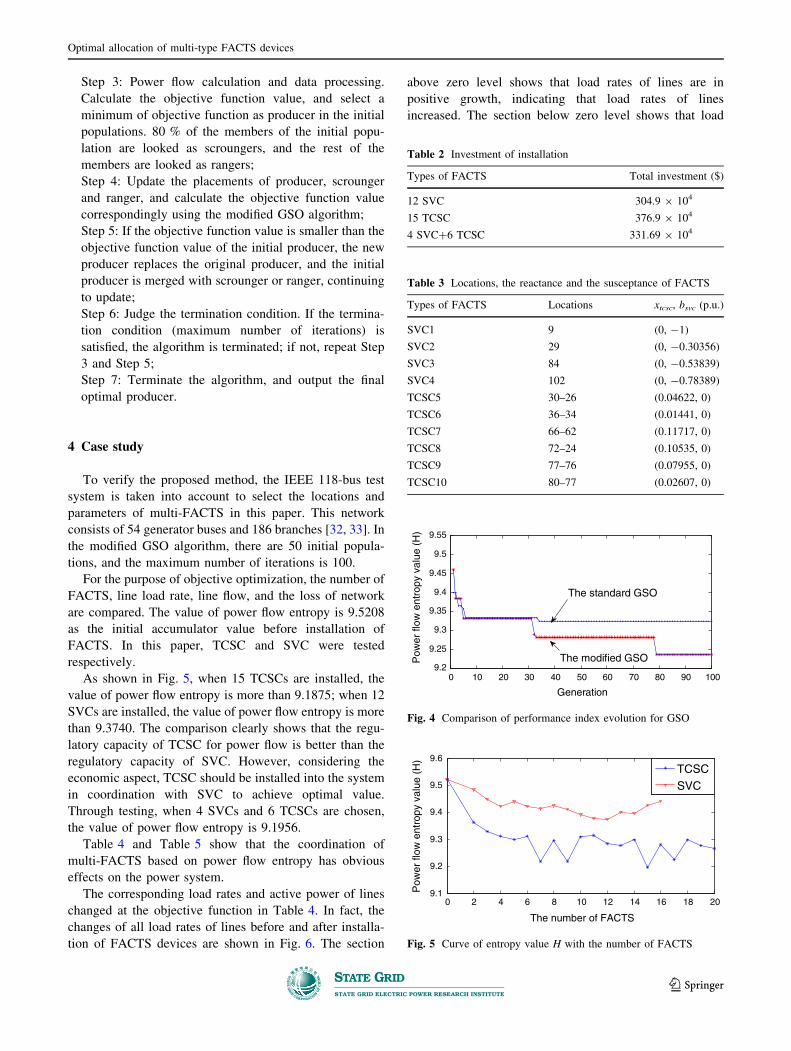
As shown in Fig. 5, when 15 TCSCs are installed, the
value of power flow entropy is more than 9.1875; when 12
SVCs are installed, the value of power flow entropy is more
than 9.3740. The comparison clearly shows that the regu-
latory capacity of TCSC for power flow is better than the
regulatory capacity of SVC. However, considering the
economic aspect, TCSC should be installed into the system
in coordination with SVC to achieve optimal value.
Through testing, when 4 SVCs and 6 TCSCs are chosen,
the value of power flow entropy is 9.1956.
Table 4 and Table 5 show that the coordination of
multi-FACTS based on power flow entropy has obvious
effects on the power system.
The corresponding load rates and active power of lines
changed at the objective function in Table 4. In fact, the
changes of all load rates of lines before and after installa-
tion of FACTS devices are shown in Fig. 6. The section
above zero level shows that load rates of lines are in
positive growth, indicating that load rates of lines
increased. The section below zero level shows that load
0 2 4 6 8 10 12 14 16 18 209.1
9.2
9.3
9.4
9.5
9.6
The number of FACTS
Pow
er fl
ow e
ntro
py v
alue
(H
)
TCSCSVC
Fig. 5 Curve of entropy value H with the number of FACTS
0 10 20 30 40 50 60 70 80 90 1009.2
9.25
9.3
9.35
9.4
9.45
9.5
9.55
Generation
Pow
er fl
ow e
ntro
py v
alue
(H
)
The standard GSO
The modified GSO
Fig. 4 Comparison of performance index evolution for GSO
Table 2 Investment of installation
Types of FACTS Total investment ($)
12 SVC 304.9 9 104
15 TCSC 376.9 9 104
4 SVC?6 TCSC 331.69 9 104
Table 3 Locations, the reactance and the susceptance of FACTS
Types of FACTS Locations xtcsc, bsvc (p.u.)
SVC1 9 (0, -1)
SVC2 29 (0, -0.30356)
SVC3 84 (0, -0.53839)
SVC4 102 (0, -0.78389)
TCSC5 30–26 (0.04622, 0)
TCSC6 36–34 (0.01441, 0)
TCSC7 66–62 (0.11717, 0)
TCSC8 72–24 (0.10535, 0)
TCSC9 77–76 (0.07955, 0)
TCSC10 80–77 (0.02607, 0)
Optimal allocation of multi-type FACTS devices
123
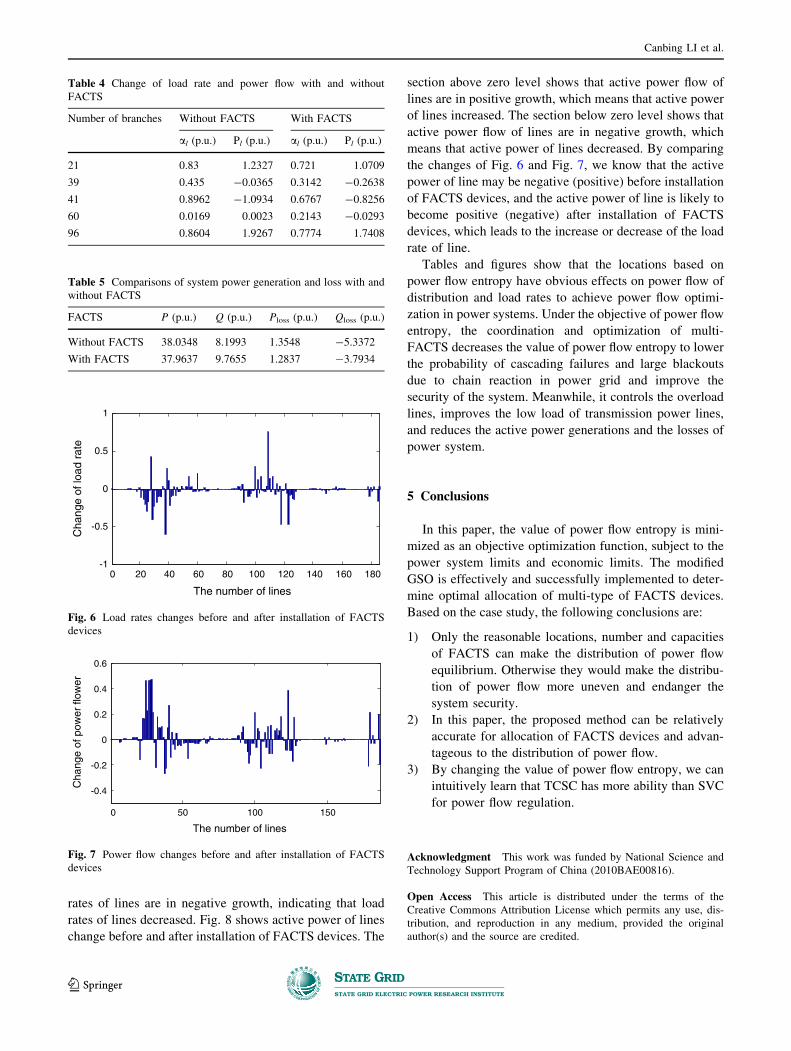
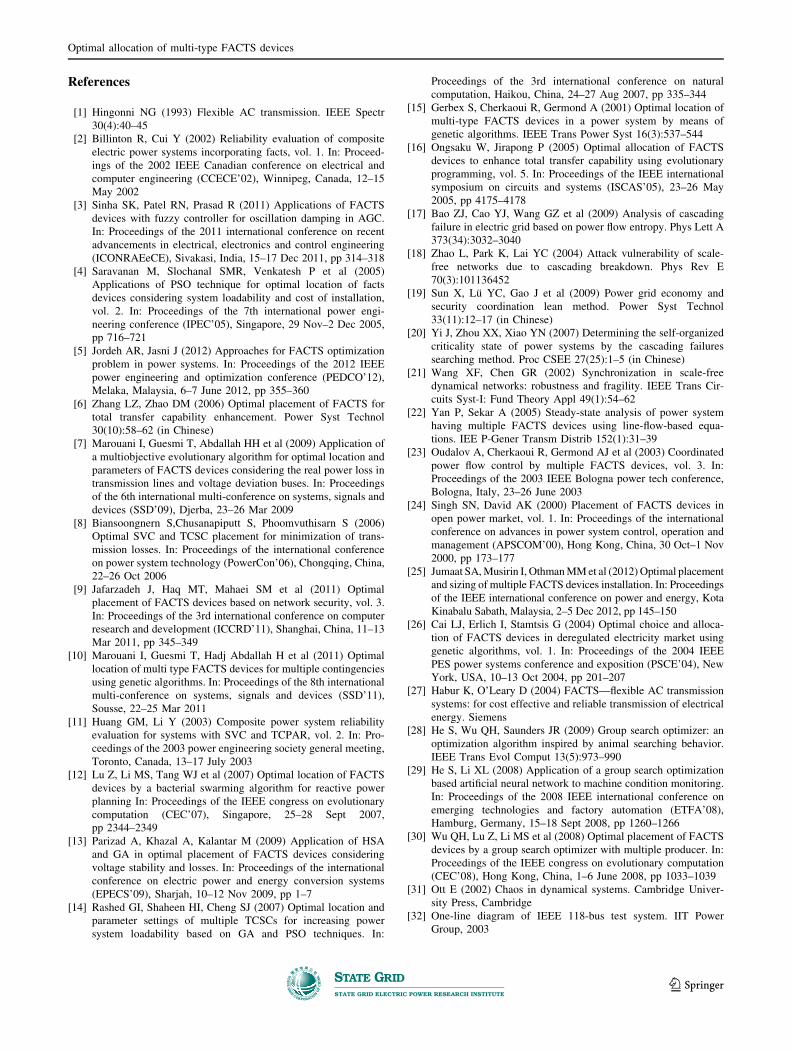
rates of lines are in negative growth, indicating that load
rates of lines decreased. Fig. 8 shows active power of lines
change before and after installation of FACTS devices. The
section above zero level shows that active power flow of
lines are in positive growth, which means that active power
of lines increased. The section below zero level shows that
active power flow of lines are in negative growth, which
means that active power of lines decreased. By comparing
the changes of Fig. 6 and Fig. 7, we know that the active
power of line may be negative (positive) before installation
of FACTS devices, and the active power of line is likely to
become positive (negative) after installation of FACTS
devices, which leads to the increase or decrease of the load
rate of line.
Tables and figures show that the locations based on
power flow entropy have obvious effects on power flow of
distribution and load rates to achieve power flow optimi-
zation in power systems. Under the objective of power flow
entropy, the coordination and optimization of multi-
FACTS decreases the value of power flow entropy to lower
the probability of cascading failures and large blackouts
due to chain reaction in power grid and improve the
security of the system. Meanwhile, it controls the overload
lines, improves the low load of transmission power lines,
and reduces the active power generations and the losses of
power system.
5 Conclusions
In this paper, the value of power flow entropy is mini-
mized as an objective optimization function, subject to the
power system limits and economic limits. The modified
GSO is effectively and successfully implemented to deter-
mine optimal allocation of multi-type of FACTS devices.
Based on the case study, the following conclusions are:
1) Only the reasonable locations, number and capacities
of FACTS can make the distribution of power flow
equilibrium. Otherwise they would make the distribu-
tion of power flow more uneven and endanger the
system security.
2) In this paper, the proposed method can be relatively
accurate for allocation of FACTS devices and advan-
tageous to the distribution of power flow.
3) By changing the value of power flow entropy, we can
intuitively learn that TCSC has more ability than SVC
for power flow regulation.
Acknowledgment This work was funded by National Science and
Technology Support Program of China (2010BAE00816).
Open Access This article is distributed under the terms of the
Creative Commons Attribution License which permits any use, dis-
tribution, and reproduction in any medium, provided the original
author(s) and the source are credited.
Table 4 Change of load rate and power flow with and without
FACTS
Number of branches Without FACTS With FACTS
al (p.u.) Pl (p.u.) al (p.u.) Pl (p.u.)
21 0.83 1.2327 0.721 1.0709
39 0.435 -0.0365 0.3142 -0.2638
41 0.8962 -1.0934 0.6767 -0.8256
60 0.0169 0.0023 0.2143 -0.0293
96 0.8604 1.9267 0.7774 1.7408
Table 5 Comparisons of system power generation and loss with and
without FACTS
FACTS P (p.u.) Q (p.u.) Ploss (p.u.) Qloss (p.u.)
Without FACTS 38.0348 8.1993 1.3548 -5.3372
With FACTS 37.9637 9.7655 1.2837 -3.7934
20 40 60 80 100 120 140 160 180-1
-0.5
0
0.5
1
The number of lines
Cha
nge
of lo
ad r
ate
0
Fig. 6 Load rates changes before and after installation of FACTS
devices
50 100 150
-0.4
-0.2
0
0.2
0.4
0.6
The number of lines
Cha
nge
of p
ower
flow
er
0
Fig. 7 Power flow changes before and after installation of FACTS
devices
Canbing LI et al.
123
References
[1] Hingonni NG (1993) Flexible AC transmission. IEEE Spectr
30(4):40–45
[2] Billinton R, Cui Y (2002) Reliability evaluation of composite
electric power systems incorporating facts, vol. 1. In: Proceed-
ings of the 2002 IEEE Canadian conference on electrical and
computer engineering (CCECE’02), Winnipeg, Canada, 12–15
May 2002
[3] Sinha SK, Patel RN, Prasad R (2011) Applications of FACTS
devices with fuzzy controller for oscillation damping in AGC.
In: Proceedings of the 2011 international conference on recent
advancements in electrical, electronics and control engineering
(ICONRAEeCE), Sivakasi, India, 15–17 Dec 2011, pp 314–318
[4] Saravanan M, Slochanal SMR, Venkatesh P et al (2005)
Applications of PSO technique for optimal location of facts
devices considering system loadability and cost of installation,
vol. 2. In: Proceedings of the 7th international power engi-
neering conference (IPEC’05), Singapore, 29 Nov–2 Dec 2005,
pp 716–721
[5] Jordeh AR, Jasni J (2012) Approaches for FACTS optimization
problem in power systems. In: Proceedings of the 2012 IEEE
power engineering and optimization conference (PEDCO’12),
Melaka, Malaysia, 6–7 June 2012, pp 355–360
[6] Zhang LZ, Zhao DM (2006) Optimal placement of FACTS for
total transfer capability enhancement. Power Syst Technol
30(10):58–62 (in Chinese)
[7] Marouani I, Guesmi T, Abdallah HH et al (2009) Application of
a multiobjective evolutionary algorithm for optimal location and
parameters of FACTS devices considering the real power loss in
transmission lines and voltage deviation buses. In: Proceedings
of the 6th international multi-conference on systems, signals and
devices (SSD’09), Djerba, 23–26 Mar 2009
[8] Biansoongnern S,Chusanapiputt S, Phoomvuthisarn S (2006)
Optimal SVC and TCSC placement for minimization of trans-
mission losses. In: Proceedings of the international conference
on power system technology (PowerCon’06), Chongqing, China,
22–26 Oct 2006
[9] Jafarzadeh J, Haq MT, Mahaei SM et al (2011) Optimal
placement of FACTS devices based on network security, vol. 3.
In: Proceedings of the 3rd international conference on computer
research and development (ICCRD’11), Shanghai, China, 11–13
Mar 2011, pp 345–349
[10] Marouani I, Guesmi T, Hadj Abdallah H et al (2011) Optimal
location of multi type FACTS devices for multiple contingencies
using genetic algorithms. In: Proceedings of the 8th international
multi-conference on systems, signals and devices (SSD’11),
Sousse, 22–25 Mar 2011
[11] Huang GM, Li Y (2003) Composite power system reliability
evaluation for systems with SVC and TCPAR, vol. 2. In: Pro-
ceedings of the 2003 power engineering society general meeting,
Toronto, Canada, 13–17 July 2003
[12] Lu Z, Li MS, Tang WJ et al (2007) Optimal location of FACTS
devices by a bacterial swarming algorithm for reactive power
planning In: Proceedings of the IEEE congress on evolutionary
computation (CEC’07), Singapore, 25–28 Sept 2007,
pp 2344–2349
[13] Parizad A, Khazal A, Kalantar M (2009) Application of HSA
and GA in optimal placement of FACTS devices considering
voltage stability and losses. In: Proceedings of the international
conference on electric power and energy conversion systems
(EPECS’09), Sharjah, 10–12 Nov 2009, pp 1–7
[14] Rashed GI, Shaheen HI, Cheng SJ (2007) Optimal location and
parameter settings of multiple TCSCs for increasing power
system loadability based on GA and PSO techniques. In:
Proceedings of the 3rd international conference on natural
computation, Haikou, China, 24–27 Aug 2007, pp 335–344
[15] Gerbex S, Cherkaoui R, Germond A (2001) Optimal location of
multi-type FACTS devices in a power system by means of
genetic algorithms. IEEE Trans Power Syst 16(3):537–544
[16] Ongsaku W, Jirapong P (2005) Optimal allocation of FACTS
devices to enhance total transfer capability using evolutionary
programming, vol. 5. In: Proceedings of the IEEE international
symposium on circuits and systems (ISCAS’05), 23–26 May
2005, pp 4175–4178
[17] Bao ZJ, Cao YJ, Wang GZ et al (2009) Analysis of cascading
failure in electric grid based on power flow entropy. Phys Lett A
373(34):3032–3040
[18] Zhao L, Park K, Lai YC (2004) Attack vulnerability of scale-
free networks due to cascading breakdown. Phys Rev E
70(3):101136452
[19] Sun X, Lu YC, Gao J et al (2009) Power grid economy and
security coordination lean method. Power Syst Technol
33(11):12–17 (in Chinese)
[20] Yi J, Zhou XX, Xiao YN (2007) Determining the self-organized
criticality state of power systems by the cascading failures
searching method. Proc CSEE 27(25):1–5 (in Chinese)
[21] Wang XF, Chen GR (2002) Synchronization in scale-free
dynamical networks: robustness and fragility. IEEE Trans Cir-
cuits Syst-I: Fund Theory Appl 49(1):54–62
[22] Yan P, Sekar A (2005) Steady-state analysis of power system
having multiple FACTS devices using line-flow-based equa-
tions. IEE P-Gener Transm Distrib 152(1):31–39
[23] Oudalov A, Cherkaoui R, Germond AJ et al (2003) Coordinated
power flow control by multiple FACTS devices, vol. 3. In:
Proceedings of the 2003 IEEE Bologna power tech conference,
Bologna, Italy, 23–26 June 2003
[24] Singh SN, David AK (2000) Placement of FACTS devices in
open power market, vol. 1. In: Proceedings of the international
conference on advances in power system control, operation and
management (APSCOM’00), Hong Kong, China, 30 Oct–1 Nov
2000, pp 173–177
[25] Jumaat SA, Musirin I, Othman MM et al (2012) Optimal placement
and sizing of multiple FACTS devices installation. In: Proceedings
of the IEEE international conference on power and energy, Kota
Kinabalu Sabath, Malaysia, 2–5 Dec 2012, pp 145–150
[26] Cai LJ, Erlich I, Stamtsis G (2004) Optimal choice and alloca-
tion of FACTS devices in deregulated electricity market using
genetic algorithms, vol. 1. In: Proceedings of the 2004 IEEE
PES power systems conference and exposition (PSCE’04), New
York, USA, 10–13 Oct 2004, pp 201–207
[27] Habur K, O’Leary D (2004) FACTS—flexible AC transmission
systems: for cost effective and reliable transmission of electrical
energy. Siemens
[28] He S, Wu QH, Saunders JR (2009) Group search optimizer: an
optimization algorithm inspired by animal searching behavior.
IEEE Trans Evol Comput 13(5):973–990
[29] He S, Li XL (2008) Application of a group search optimization
based artificial neural network to machine condition monitoring.
In: Proceedings of the 2008 IEEE international conference on
emerging technologies and factory automation (ETFA’08),
Hamburg, Germany, 15–18 Sept 2008, pp 1260–1266
[30] Wu QH, Lu Z, Li MS et al (2008) Optimal placement of FACTS
devices by a group search optimizer with multiple producer. In:
Proceedings of the IEEE congress on evolutionary computation
(CEC’08), Hong Kong, China, 1–6 June 2008, pp 1033–1039
[31] Ott E (2002) Chaos in dynamical systems. Cambridge Univer-
sity Press, Cambridge
[32] One-line diagram of IEEE 118-bus test system. IIT Power
Group, 2003
Optimal allocation of multi-type FACTS devices
123

[33] Esmin AAA, Lambert-Torres G (2012) Application of particle
swarm optimization to optimal power system. Int J Innov
Comput Inf Control 8(3A):1705–1716
Canbing LI received B.Eng and PhD degree in Electrical Engineer-
ing from Tsinghua University in 2001 and 2006 respectively.
Currently, he is an associate professor of Hunan University. His
research interests include smart grid and energy sustainability.
Liwu XIAO received the B.Eng degrees from Shandong Agricultural
University in 2012. Now he is pursuing his master degree in Hunan
University. His research interest is intelligent algorithm and its
applications to power system optimal operation.
Yijia CAO received PhD degree from Huazhong University of
Science and Technology in 1994. He became a special-term professor
of the ‘‘Cheung Kong Scholars Program’’ in Zhejiang University in
2001. Since March 2008, he has been serving as Vice President of
Hunan University. His research interests include power system
cascading failure, power system information technology, computa-
tional intelligence and its applications to smart grid optimal operation.
Qianlong ZHU received the B.Eng and M. Eng degree from Hunan
University in 2011 and 2013 respectively. His research interests
include intelligent algorithm and its applications to power system
optimal operation.
Baling FANG received M.B.A. in business administration from Jilin
University in 2011. Now, he is pursuing his PhD degree in Hunan
University. His research interests in power system, cloud computing
and intelligent computing.
Yi TAN received the B.Eng degrees from South China University of
Technology in 2009. Now, he is pursuing his PhD degree in Hunan
University. His research interests include computational intelligence
and its applications to smart grid optimal operation.
Long ZENG received the B. Eng and M. Eng degree from Changsha
University of Science & Technology, Changsha, China in 2009 and
2013 respectively. Now, he is pursuing PhD degree in Hunan
University. His research interests include power system dispatching.
Canbing LI et al.
123