Embed Size (px)
Citation preview

ORIGINAL PAPER
Optimal Cut-Off Values of Anthropometric Markersto Predict Hypertension in North Indian Population
Shilpi Gupta • Satwanti Kapoor
Published online: 21 August 2011
� Springer Science+Business Media, LLC 2011
Abstract The aim of the study was to determine the cut-
offs of anthropometric markers for detecting hypertension in
an endogamous North Indian population. A cross-sectional
study was carried out to collect data from 578 adult Aggarwal
Baniya subjects (271 men and 307 women, mean age:
43.4 ± 5.3 and 38.7 ± 4.9 respectively) using multistage,
stratified sampling method. Individual body weight, height,
waist circumference (WC), hip circumference, blood pres-
sure were assessed. Receiver operating characteristic (ROC)
analysis was used to find out the optimal cut-off values of
various anthropometric markers to predict hypertension. The
likelihood ratios for having hypertension in subjects with
various cut-off values were calculated. Logistic regression
analysis was used to examine the independent relationship
between the anthropometric markers and odds of having
hypertension. The BMI cut-off to predict hypertension was
22.8 kg/m2 in men and 28.8 kg/m2 in women. The optimal
WC cut-offs varied from 91–92 cm in both men and women.
The WHR cut-off was about 0.90 in men and 0.78 in women
respectively, and the optimal WHtR cut-off was 0.56 in men
and 0.43 in women. The cut-off levels for BMI, WC and
WHtR corresponded to the inflexion points in the likelihood
ratio graphs. The area under curve (AUC) and odds ratios
showed that the risk of having hypertension was highest with
respect to increased BMI and that BMI is the best predictor of
having hypertension. The cut-off points for detecting car-
diovascular risk factors among our population are lower
than the criteria by the World Health Organization. Although
these results may not be readily applied to the rest of the
Indian populations due to the multiethnic composition, they
point to the necessity of similar studies with large random-
ized samples to find the cut-off levels for chronic conditions
in different populations.
Keywords Obesity � ROC � Anthropometric markers �Hypertension � Indian population
Introduction
The association of adiposity with cardiovascular risk fac-
tors is well established. However classified, the burden of
major risk factors is substantially greater in overweight
than in lean individuals. Epidemiological studies focusing
on persons of European descent have verified that obesity
standards based on BMI by WHO [1] are, indeed, associ-
ated with incremental risk for cardiovascular events and
all-cause death [2, 3]. However it has been found that
cardiovascular and metabolic risk in Asians occur at a
lower BMI than in Europeans. There is increasing evidence
of a high prevalence of type 2 diabetes mellitus and ele-
vated cardiovascular risk in certain Asian countries, despite
an average BMI in these countries that is\25 kg/m2 [4, 5].
McNeely et al. [6] found that for Asian-Americans, the
prevalence of diabetes mellitus after adjustment for BMI
was 60% higher than in their European counterpart.
To address the issue that the international cut off points
may not accurately reflect risk in non-European popula-
tions, the panel recommended ranges of BMI for deter-
mining potential public health and clinical action, which
countries may pursue through the use of scientifically
sound approaches to make decisions about the definition of
obesity related risk in their own population [7]. Although
based on the revised standards, Indian have been
S. Gupta � S. Kapoor (&)
Department of Anthropology, Obesity Research Unit,
Physiological Anthropology Laboratory, University of Delhi,
New Delhi, India
e-mail: [email protected]
123
J Community Health (2012) 37:441–447
DOI 10.1007/s10900-011-9461-8

categorized under the high vulnerability group. Besides,
these revised standards of BMI are based on the data
obtained in Korea and Hongkong who are of Mongoloid
origin and that group constitutes a sizeable fraction of
Indian population residing in North-East. This has gener-
ated debate about the appropriateness of ethnic-specific
cut-off points for defining obesity [8]. Besides population
of mongoloid features we have many ethnic groups in India
exhibiting varied physical features and physical types,
therefore, it is not advisable to blindly accept this BMI
scheme without testing to avoid further complications.
In this study, we examined four anthropometric markers
(BMI, WC, WHR, WHtR) with hypertension and used
receiver operating characteristic (ROC) analysis to assess
the optimal cut-off values of these anthropometric markers
for overweight or obese in an endogamous population of
North India.
Materials and Methods
Data for the present study was collected on 578 adult
Aggarwal Baniya subjects (271 men, 307 women) aged
30 years upwards using multistage, stratified sampling
method.
Target Population
Baniyas is an endogamous caste group which is divided
into three sub groups based on language difference. These
languages are Hindi, Marwari and Punjabi. However, they
are not identified as Punjabi Baniyas, Malwari Baniyas or
Hindi Baniyas. They are the trading community which
mostly have sedentary lifestyle. Their food habits also
involve lots of oily eatables which dispose them to many
cardiovascular health risk. They are divided into 18 gotras.
They generally practice caste endogamy and gotra exog-
amy. Marriage is monogamous.
Data Collection
Participants were interviewed through structured proforma.
Anthropometric measurements including height, weight,
skinfold thickness, waist and hip circumference and blood
pressure measurements were obtained using standardized
procedures. Various indices of obesity such as body mass
index (BMI), waist hip ratio (WHR), waist to height ratio
(WHtR) was further calculated.
Body weight was measured by using spring balance to
the nearest 500 gm, stature with the help of Martin’s
Anthropometer to the nearest mm. Waist circumference
and hip circumference were measured with a non stretch-
able steel tape measure to the nearest 0.1 cm. Measure-
ments were conducted by trained personnel and all
instruments were calibrated once weekly. Blood pressure
was measured using manual (mercury) sphygmomanome-
ter. The subject was asked to sit relaxed on a chair with her
or his arm supported comfortably at the vertical level. The
pressure cuff was applied closely to the upper arm, the cuff
was rapidly inflated until the artery was completely
occluded. The stethoscope was the placed lightly over the
brachial artery, and the mercury column was allowed to fall
at the rate of 2 mmHg per second. The Systolic blood
pressure was determined by the appearance of Korotkoff
sound. After recording the systolic blood pressure the
mercury column was allowed to fall further till the sound
ceased to be tapping in quality, become fully muffled and
finally disappeared. The level where it disappeared was
taken as diastolic blood pressure. Three reading were taken
for each measurement and there mean was taken as the
final reading.
The protocol for the study was reviewed and approved
by Ethical Committees in the Department of Anthropology,
Faculty of Sciences of the University of Delhi, India.
Statistical Analysis
Data was analyzed using the computer software SPSS
version 15.0 for windows (SPSS Inc., Chicago, USA).
Results have been described by summary statistics such as
mean and standard deviation. Receiver operating charac-
teristic (ROC) analysis was used to compare the predictive
validity, and to determine their optimal cut-off values
[9–11]. Area under the curve (AUC) was also measured to
determine the diagnostic power of a test, and to describe
the probability that a test would correctly identify subjects
with the disorder. Optimal cut-off values were measured by
calculating the sensitivity and specificity of the anthropo-
metric measurements at various cut-off points. Odds ratios
were calculated as the ratios of having hypertension by the
proposed cut-off points.
The likelihood ratio (LR) was calculated to estimate the
odds of having hypertension in subjects with various cut-
off values of the anthropometric indexes [12]. LR is
defined as sensitivity/(1-specificity). The sensitivity and
specificity of having chronic conditions at various anthro-
pometric cut-off values were calculated using the adjusted
population classified with reference to each cutoff level and
hence the corresponding LR was derived. Since LR refers
to actual test results before disease status is known, it is
more immediately useful to clinicians than sensitivity and
specificity [12].
442 J Community Health (2012) 37:441–447
123

Results
The means and standard deviations of various anthropo-
metric markers are presented in Table 1. A high prevalence
of obesity in this community is evident in the gender
specific mean BMI values (men, 26.1 kg/m2; women,
29.4 kg/m2). Although the women were 3 BMI units hea-
vier than the men, the systolic blood pressure (SBP) and
diastolic blood pressure (DBP) values were significantly
higher among men. As expected, women had significantly
larger hip circumferences compared with men whereas
waist circumference was higher in men.
ROC curve analysis of various anthropometric markers
with hypertension are summarized in Table 2. The results
of the AUC analysis were significantly different from what
was expected by chance (P \ 0.05). Among the markers of
obesity, BMI showed the highest AUC in both men and
women. The values for AUC tented to be higher in men
than in women. The AUCs for BMI was-0.72 in men, 0.62
in women; for WC-0.71 in men, 0.55 in women; for WHR-
0.64 in men, 0.45 in women and for WHtR-0.69 in men,
0.60 in women. The cut-off points of the variables to detect
the risk factors were determined as the point of intersection
of the curves for sensitivity and specificity. The optimal
BMI cut-off values for predicting hypertension was
22.8 kg/m2 in men and 28.8 kg/m2 in women. The optimal
WC cut-off values was 92.0 cm in men and 91.3 cm in
women. The optimal cut-off values of WHR that correctly
identified the highest numbers of subjects with or without
hypertension was 0.90 in men and 0.78 in women whereas
the optimal WHtR cut-off values was 0.56 in men and 0.43
in women.
Figures 1 and 2 shows the likelihood ratios of having
hypertension in subjects with different values for these four
anthropometric indexes. The cut-off levels for BMI, WC
and WHtR corresponded to the inflexion points in the
Table 1 Basic Characteristics of the subjects
Variables Men Women
N = 271 N = 307
Age (years) 43.4 ± 5.3 38.7 ± 4.9
Weight (kg) 72.8 ± 13.12 68.1 ± 11.47
Height (cm) 166.7 ± 5.81 152.1 ± 5.51
Hip circumference (cm) 98.1 ± 8.42 107.2 ± 10.90
Waist circumference (cm) 98.3 ± 11.82 92.0 ± 10.51
Body Mass Index (BMI) 26.1 ± 4.28 29.4 ± 4.77
Waist to Hip Ratio (WHR) 1.0 ± 0.07 0.86 ± 0.07
Waist to Height Ratio (WHtR) 0.59 ± 0.07 0.60 ± 0.07
Systolic blood pressure (SBP) 128.1 ± 14.0 119.6 ± 13.8
Diastolic blood pressure (DBP) 88.5 ± 11.1 82.9 ± 9.1
Table 2 The areas under ROC
curve (AUC), optimal cut-off
values, sensitivities and
specificities of anthropometric
markers associated with
hypertension
Anthropometric
markers
AUC 95%
CI
Cut-off point
(kg/m2)
Sensitivity
(%)
Specificity
(%)
Positive
PV
Negative
PV
Men
BMI
Optimal 0.72 (0.61,0.84) 22.8 82.5 77.8 96.8 35.6
WHO 30.0 20.0 88.0 94.1 12.6
WC
Optimal 0.71 (0.60,0.82) 92.0 77.8 77.8 96.5 30.0
WHO 102.0 41.0 77.0 93.8 14.2
WHR
Optimal 0.64 (0.52,0.77) 0.90 94.5 48.1 91.6 9.1
WHO 1.0 51.6 48.0 88.9 11.0
WHtR 0.69 (0.57,0.81) 0.56 75.6 77.8 93.8 28.1
Women
BMI
Optimal 0.62 (0.55,0.70) 28.8 64.4 68.6 84.1 42.8
WHO 30.0 46.0 72.0 81.2 35.2
WC
Optimal 0.55 (0.48,0.62) 91.3 57.2 61.6 79.4 35.8
WHO 88.0 68.0 37.0 73.6 31.1
WHR
Optimal 0.45 (0.37,0.53) 0.78 95.0 15.1 73.5 47.6
WHO 0.85 49.0 41.0 66.2 24.2
WHtR 0.60 (0.53,0.67) 0.43 98.6 0.0 72.1 0.0
J Community Health (2012) 37:441–447 443
123

likelihood ratio graphs. There was a significant increase in
the risks for hypertension beyond the cut-off points for all
anthropometric markers except WHR in both genders.
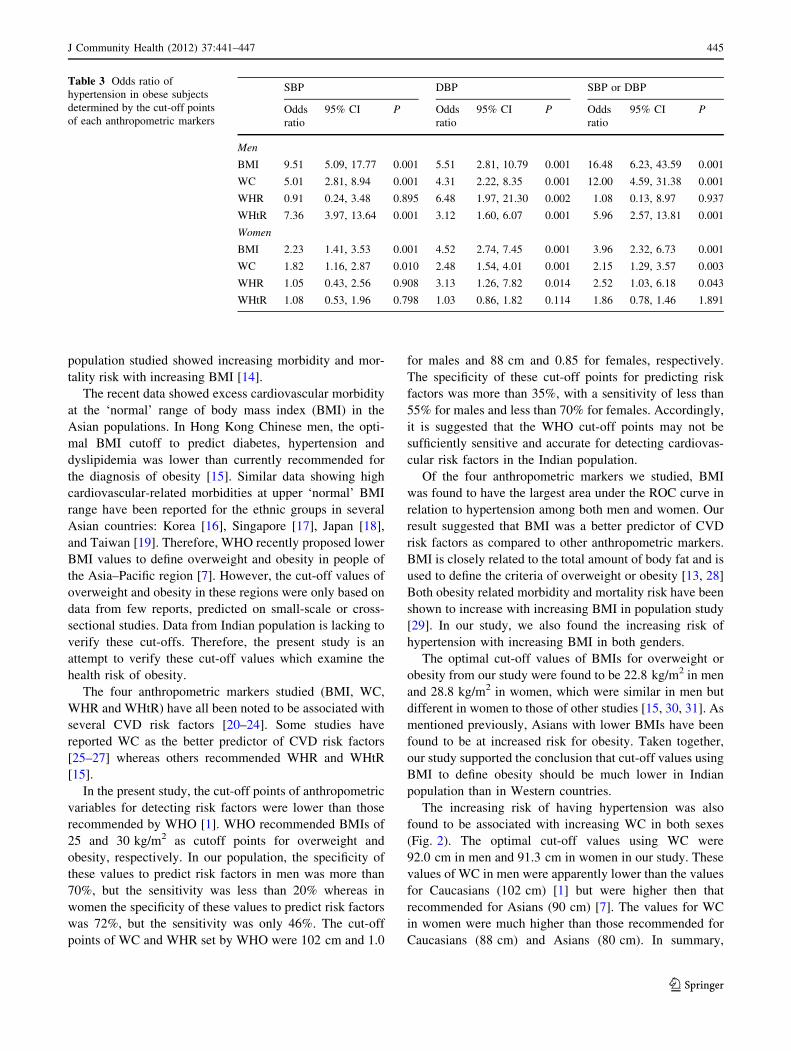
Logistic regression analysis was performed to see if the
determined cut-off points of various markers of obesity,
that is BMI, WC, WHR and WHtR independently reflected
the increased risk of having hypertension (Table 3). For
systolic blood pressure, odds ratio for BMI, WC and WHtR
were significant in men whereas in women, odds ratio for
BMI and WC were significant. For diastolic blood pressure,
odds ratio for all anthropometric markers were statistically
significant except for WHtR in women. In men, the odds of
higher systolic blood pressure (SBP) or diastolic blood
pressure (DBP) was significantly more in those who had
BMI, WC or WHtR in risk category whereas in women it
was significant for all markers except for WHtR.
Discussion
Obesity is an independent risk factor for cardiovascular
disease (CVD) and it is known to be associated with other
risk factors such as hypertension, dyslipidaemia and dia-
betes mellitus. Body mass index is known to be closely
related to the total amount of body fat and is widely used to
define the criteria for overweight or obesity [13]. Many
BMI
0
1
2
3
4
20 21 22 23 24 25 26 27 28 29 30 31
WHR
0
1
2
3
4
1.0510.950.9
WC
0
1
2
3
4
100908070
WHtR
0
1
2
3
4
0.650.60.550.5
Fig. 1 Likelihood ratio of
having hypertension at various
BMI, WC, WHR and WHtRcut-offs in men
BMI
0
1
2
3
4
32 33 34 35
WC
0
0.5
1
1.5
2
WHR
0
0.4
0.8
1.2
1.6
10.90.80.7
WHtR
0
1
2
3
4
0.4 0.45 0.5 0.55 0.6 0.65 0.7
21 22 23 24 25 26 27 28 29 30 31 10090807020
Fig. 2 Likelihood ratio of
having hypertension at various
BMI, WC, WHR and WHtRcut-offs in women
444 J Community Health (2012) 37:441–447
123
population studied showed increasing morbidity and mor-
tality risk with increasing BMI [14].
The recent data showed excess cardiovascular morbidity
at the ‘normal’ range of body mass index (BMI) in the
Asian populations. In Hong Kong Chinese men, the opti-
mal BMI cutoff to predict diabetes, hypertension and
dyslipidemia was lower than currently recommended for
the diagnosis of obesity [15]. Similar data showing high
cardiovascular-related morbidities at upper ‘normal’ BMI
range have been reported for the ethnic groups in several
Asian countries: Korea [16], Singapore [17], Japan [18],
and Taiwan [19]. Therefore, WHO recently proposed lower
BMI values to define overweight and obesity in people of
the Asia–Pacific region [7]. However, the cut-off values of
overweight and obesity in these regions were only based on
data from few reports, predicted on small-scale or cross-
sectional studies. Data from Indian population is lacking to
verify these cut-offs. Therefore, the present study is an
attempt to verify these cut-off values which examine the
health risk of obesity.
The four anthropometric markers studied (BMI, WC,
WHR and WHtR) have all been noted to be associated with
several CVD risk factors [20–24]. Some studies have
reported WC as the better predictor of CVD risk factors
[25–27] whereas others recommended WHR and WHtR
[15].
In the present study, the cut-off points of anthropometric
variables for detecting risk factors were lower than those
recommended by WHO [1]. WHO recommended BMIs of
25 and 30 kg/m2 as cutoff points for overweight and
obesity, respectively. In our population, the specificity of
these values to predict risk factors in men was more than
70%, but the sensitivity was less than 20% whereas in
women the specificity of these values to predict risk factors
was 72%, but the sensitivity was only 46%. The cut-off
points of WC and WHR set by WHO were 102 cm and 1.0
for males and 88 cm and 0.85 for females, respectively.
The specificity of these cut-off points for predicting risk
factors was more than 35%, with a sensitivity of less than
55% for males and less than 70% for females. Accordingly,
it is suggested that the WHO cut-off points may not be
sufficiently sensitive and accurate for detecting cardiovas-
cular risk factors in the Indian population.
Of the four anthropometric markers we studied, BMI
was found to have the largest area under the ROC curve in
relation to hypertension among both men and women. Our
result suggested that BMI was a better predictor of CVD
risk factors as compared to other anthropometric markers.
BMI is closely related to the total amount of body fat and is
used to define the criteria of overweight or obesity [13, 28]
Both obesity related morbidity and mortality risk have been
shown to increase with increasing BMI in population study
[29]. In our study, we also found the increasing risk of
hypertension with increasing BMI in both genders.
The optimal cut-off values of BMIs for overweight or
obesity from our study were found to be 22.8 kg/m2 in men
and 28.8 kg/m2 in women, which were similar in men but
different in women to those of other studies [15, 30, 31]. As
mentioned previously, Asians with lower BMIs have been
found to be at increased risk for obesity. Taken together,
our study supported the conclusion that cut-off values using
BMI to define obesity should be much lower in Indian
population than in Western countries.
The increasing risk of having hypertension was also
found to be associated with increasing WC in both sexes
(Fig. 2). The optimal cut-off values using WC were
92.0 cm in men and 91.3 cm in women in our study. These
values of WC in men were apparently lower than the values
for Caucasians (102 cm) [1] but were higher then that
recommended for Asians (90 cm) [7]. The values for WC
in women were much higher than those recommended for
Caucasians (88 cm) and Asians (80 cm). In summary,
Table 3 Odds ratio of
hypertension in obese subjects
determined by the cut-off points
of each anthropometric markers
SBP DBP SBP or DBP
Odds
ratio
95% CI P Odds
ratio
95% CI P Odds
ratio
95% CI P
Men
BMI 9.51 5.09, 17.77 0.001 5.51 2.81, 10.79 0.001 16.48 6.23, 43.59 0.001
WC 5.01 2.81, 8.94 0.001 4.31 2.22, 8.35 0.001 12.00 4.59, 31.38 0.001
WHR 0.91 0.24, 3.48 0.895 6.48 1.97, 21.30 0.002 1.08 0.13, 8.97 0.937
WHtR 7.36 3.97, 13.64 0.001 3.12 1.60, 6.07 0.001 5.96 2.57, 13.81 0.001
Women
BMI 2.23 1.41, 3.53 0.001 4.52 2.74, 7.45 0.001 3.96 2.32, 6.73 0.001
WC 1.82 1.16, 2.87 0.010 2.48 1.54, 4.01 0.001 2.15 1.29, 3.57 0.003
WHR 1.05 0.43, 2.56 0.908 3.13 1.26, 7.82 0.014 2.52 1.03, 6.18 0.043
WHtR 1.08 0.53, 1.96 0.798 1.03 0.86, 1.82 0.114 1.86 0.78, 1.46 1.891
J Community Health (2012) 37:441–447 445
123

further studies are needed to find out the appropriate cut-off
values for overweight and obesity in the Asia–Pacific
region. Similarly, the cut-off points for WHR and WHtR in
the present study were also found lower than those rec-
ommended by WHO. Further, higher cut-off points of all
anthropometric markers for men compared with women
indicate sex-specific relations between obesity and car-
diovascular risk factors as observed by other researcher
also [32–34].
In conclusion, the cut-off points of anthropometric
markers (except for WC) for detecting cardiovascular risk
factors in the Indian population were lower than the WHO
criteria. Though these cut-off values for men were in good
accordance with those reported for Asians, they were much
higher for women indicating need for further research in
ascertaining the cut-off values for Asian population.
Although these results may not be readily applied to the
rest of the Indian populations, they point to the necessity for
similar studies with large randomized samples to find the
cut-off levels for chronic conditions in different populations.
Acknowledgments The financial assistance to SG from Indian
Council of Medical Research (ICMR) is gratefully acknowledged. We
extend our gratitude to all our participant without whom cooperation
this data could not have been known. We also acknowledge the
support of Department of Anthropology, University of Delhi, India
for providing us the infrastructure for conducting our study.
Conflict of interest No conflict of interest was declared.
References
1. World Health Organization. (1998). Obesity: Preventing and
managing the global epidemic. Report of a WHO consultation of
obesity, 3–5 June. WHO: Geneva.
2. Calle, E. E., Thun, M. J., Petrelli, J. M., Rodriguez, C., & Heath,
C. W. (1999). Body-mass index and mortality in a prospective
cohort of US adults. New England Journal of Medicine, 341,
1097–1105.
3. Mora, S., Yanek, L. R., Moy, T. F., Fallin, M. D., Becker, L. C.,
& Becker, D. M. (2005). Interaction of body-mass index and
Framingham risk score in predicting incident coronary disease in
families. Circulation, 111, 1871–1876.
4. WHO Expert Consultation. (2004). Appropriate body-mass Index
for Asian populations and its implications for policy and inter-
vention strategies. Lancet, 363, 157–163.
5. Deurenberg-Yap, M., & Deurenberg, P. (2003). Is a reevaluation
of WHO body mass index cut-off values need? The case of
Asians in Singapore. Nutrition Reviews, 61, S80–S87.
6. McNeely, M. J., & Boyko, E. J. (2004). Type 2 diabetes preva-
lence in Asian Americans. Diabetes Care, 27, 66–69.
7. WHO/IASO/IOTF. (2000). The Asia-Pacific perspective: Rede-fining obesity and its treatment. Melbourne: Health Communi-
cations Australia.
8. Steven, J. (2003). Ethnic-specific cut-points for obesity vs
country-specific guidelines for action. International Journal ofObesity and Related Metabolic Disorders, 27, 287–288.
9. Swets, J. A. (1973). The relative operating characteristics in
psychology. Science, 182, 990–1000.
10. Metz, C. E. (1978). Basic principles of ROC analysis. Seminarsin Nuclears Medicine, 8, 283–298.
11. Van der Schouw, Y. T., Verbeek, A. L. M., & Ruijs, J. H. J.
(1992). ROC curves for the initial assessment of new diagnostic
tests. Family Practice, 9, 506–511.
12. Simel, D. L., Samsa, G. P., & Matchar, D. B. (1991). Likelihood
ratios with confidence: Sample size estimation for diagnostic test
studies. Journal of Clinical Epidemiology, 44, 763–770.
13. Gallagher, D., Visser, M., Sepulveda, D., Pierson, R. N., Harris,
T., & Hemysfield, S. B. (1996). How useful is body mass index
for comparison of body fatness across age, sex and ethnic groups?
American Journal of Epidemiology, 143, 228–239.
14. Kopelman, P. G. (2000). Obesity as a medical problem. Nature,404, 635–643.
15. Ko, G. T. C., Chan, J. C. N., Cockram, C. S., & Woo, J. (1999).
Prediction of hypertension, diabetes, dyslipidemia or albuminuria
using simple anthropometric indexes in Hong Kong Chinese.
International Journal of Obesity and Related Metabolic Disor-ders, 23, 1136–1142.
16. Moon, O. R., Kim, N. S., Jang, S. M., Yoon, T. H., & Kim, S. O.
(2002). The relationship between body mass index and the
prevalence of obesity-related diseases based on 1995 National
Health Interview Survey in Korea. Obesity Review, 3, 191–196.
17. Deurenberg-Yap, M., Chew, S. K., Lin, V. F., Tan, B. Y., van
Staveren, W. A., & Deurenberg, P. (2001). Relationships between
indices of obesity and its comorbidities in multi-ethnic Singapore.
International Journal of Obesity and Related Metabolic Disor-ders, 25, 1554–1562.
18. Ito, H., Nakasuga, K., Ohshima, A., Maruyama, T., Kaji, Y.,
Harada, M., et al. (2003). Detection of cardiovascular risk factors
by indices of obesity obtained from anthropometry and dual-
energy X-ray absorptiometry in Japanese individuals. Interna-tional Journal of Obesity and Related Metabolic Disorders, 27,
232–237.
19. Lin, W. Y., Lee, L. T., Chen, C. Y., Lo, H., Hsia, H. H., Liu, I. L.,
et al. (2002). Optimal cut-off values for obesity: Using simple
anthropometric indices to predict cardiovascular risk factors in
Taiwan. International Journal of Obesity and Related MetabolicDisorders, 26, 1232–1238.
20. Kannel, W. B. (2000). Risk stratification in hypertension: New
insight from the Framingham study. American Journal ofHypertension, 13, 3S–10S.
21. Dı0az, M. E. (2002). Hypertension and obesity. Journal of HumanHypertension, 16, S18–S22.
22. Dalton, M., Cameron, A. J., Zimmet, P. Z., et al. (2003). Waist
circumference, waist–hip ratio and body mass index and their
correlation with cardiovascular disease risk factors in Australian
adults. Journal of Internal Medicine, 254, 555–563.
23. Ferguson, T. S., Younger, N. O., Tulloch-Reid, M. K., et al.
(2008). Prevalence of prehypertension and its relationship to risk
factors for cardiovascular disease in Jamaica: Analysis from a
cross-sectional survey. BMC Cardiovascular Disorders, 8, 20.
24. Gupta, S., & Kapoor, S. (2010). Sex differences in blood pressure
levels and its association With obesity indices: Who is at greater
risk. Ethnicity and Disease, 2010(20), 370–375.
25. Rissanen, P., Hamalainen, P., Vanninen, E., Tenhunen-Eskelinen,
M., & Uusitupa, M. (1997). Relationship of metabolic variables
to abdominal adiposity measures by different anthropometric
measurements and dual-energy X-ray absorptiometry in obese
middle-aged women. International Journal of Obesity andRelated Metabolic Disorders, 21, 367–371.
26. Han, T. S., Van Leer, E. M., Seidell, J. C., & Lean, M. E. J.
(1995). Waist circumference action levels in the identification of
446 J Community Health (2012) 37:441–447
123

cardiovascular risk factors: Prevalence study in a random sample.
British Medical Journal, 311, 1401–1405.
27. Lean, M. E. J., Han, T. S., & Morrison, C. E. (1995). Waist
circumference as a measure for indicating need for weight
management. British Medical Journal, 311, 158–161.
28. Deurenberg, P., Yap, M., & Van Staveren, W. A. (1988). Body
mass index and percent body fat: A meta-analysis among dif-
ferent ethnic groups. International Journal of Obesity and Rela-ted Metabolic Disorders, 22, 1164–1171.
29. Pi-Sunyer, X. (1991). Health implications of obesity. AmericanJournal of Clinical Nutrition, 53, 1595s–1603s.
30. Zaher, Z. M., Zambari, R., Pheng, C. S., et al. (2009). Optimal
cut-off levels to define obesity: Body mass index and waist cir-
cumference, and their relationship to cardiovascular disease,
dyslipidaemia, hypertension and diabetes in Malaysia. AsiaPacific Journal of Clinical Nutrition, 18, 209–216.
31. Nguyen, T. T., Adair, L. S., Suchindran, C. M., He, K., & Popkin,
B. M. (2009). The association between body mass index and
hypertension is different between East and Southeast Asians.
American Journal of Clinical Nutrition, 89, 1905–1912.
32. Rosenfalck, A. M., Almdal, T., Gotfredsen, A., & Hilsted, J.
(1996). Body composition in normal subjects: Relation to lipid
and glucose variables. International Journal of Obesity andRelated Metabolic Disorders, 20, 1006–1013.
33. Ko, G. T. C., Chan, J. C. N., Woo, J., et al. (1997). Simple
anthropometric indexes and cardiovascular risk factors in Chi-
nese. International Journal of Obesity and Related MetabolicDisorders, 21, 995–1001.
34. Wu, C. H., Yao, W. J., Lu, F. H., Wu, J. S., & Chang, C. J.
(1998). Relationship between glycosylated hemoglobin, blood
pressure, serum lipid profiles and body fat distribution in healthy
Chinese. Atherosclerosis, 137, 157–165.
J Community Health (2012) 37:441–447 447
123