Embed Size (px)
Citation preview

R.J. Braun, “Optimal Design and Operation of Solid Oxide Fuel Cell Systems for Distributed Generation,” Research
Papers of the Link Foundation Fellows, Vol. 1, B.J. Thompson, editor, University of Rochester Press, Rochester, New York (2001).
Optimal Design and Operation of Solid Oxide
Fuel Cell Systems for Distributed Generation
ROBERT J. BRAUN
Solar Energy Laboratory Department of Mechanical Engineering
University of Wisconsin-Madison Madison, Wisconsin 53706
Research Advisors: Dr. Sandy Klein and Dr. Douglas T. Reindl
Robert J. Braun 40
ABSTRACT*
Optimal design and operation strategies for commercial- (200 kW) and small- (2 kW) scale solid oxide fuel cell power generators are analyzed. Results of the optimal design and simulation studies are divided into two parts. In part I, selection of optimal fuel cell operating parameters for design of a commercial scale electric-only application are presented. The performance parameters studied are fuel utilization, operating cell voltage, and operating temperature. For a given cell area specific resistance, these parameters will dictate the power density and operating efficiency of the fuel cell stack module. The choice of the relevant performance parameters may maximize electric power or electric efficiency. Consideration is also given to the fuel cell operating envelope, which must be designed to accommodate off-design point operation for load-following situations. The results of part I indicate that optimal cell voltage occurs at 0.7 volts, 89% fuel utilization, and a cell operating temperature of 800°C. Sensitivity analyses to both economic and operating performance parameters are also discussed. In part II, the design methods from the commercial scale analysis are applied to a 2 kW residential fuel cell power generator with cogeneration in the form of domestic hot water. An annual simulation of the residential SOFC power cogenerator was carried out. Results indicate an annual cogeneration efficiency of 84% and a ten-year simple payback are possible. However, the value added by making use of the fuel cell waste heat for domestic hot water heating may be limited since the economic payback is reduced by only one year over an electric-only fuel cell configuration. The serving of electric and hot water loads by the fuel cell system was facilitated by a 2-tank hot water storage system that enabled continuous heat recovery irrespective of thermal load. The low fuel cell electric capacity factor of 46% indicates that a fuel cell size of 2 kW, for the home in this analysis, may be too large.
*From R.J. Braun, “Optimal Design and Operation of Solid Oxide Fuel Cell Systems for Distributed Generation,” Research Papers of the Link Foundation Fellows, Vol. 1, B.J. Thompson, editor, University of Rochester Press, Rochester, New York (2001).

Optimal Design and Operation of Solid Oxide Fuel Cell Systems 41
INTRODUCTION
Background and Motivation
Electrochemical fuel cells have the potential to convert fuel directly to electricity and heat at efficiencies greater than any single conventional energy conversion technology. Their modular nature coupled with their ability to generate electricity in a clean and efficient fashion make them suitable for a wide variety of applications and markets. There are six different types of fuel cells that have received varying degrees of development attention. Presently, the 80°C proton exchange membrane (PEM) and the 700-1000°C solid oxide fuel cell (SOFC) have been identified as the likely fuel cell technologies that will capture the most significant market share [1,2]. As fuel cells are targeted for early commercialization in the residential (1-10 kW) and commercial (25-250 kW) end-use markets, system studies in these areas are of particular interest.
The advent of maturing fuel cell technologies represents an opportunity to achieve significant improvements in energy conversion efficiencies at many scales; thereby, simultaneously extending our finite resources and reducing “harmful” energy-related emissions to levels well below that of anticipated regulatory standards. Due to their modular nature, fuel cells have the potential to widely penetrate energy end-use market sectors. If fuel cells are applied at a large scale, substantial reductions in both national emissions and fuel consumption may be realized. Although fuel cells-themselves have been studied extensively, primarily from materials and electrochemical viewpoints, a considerable gap exists in the area of application techniques to maximize benefits of fuel cell units for both electrical energy generation and thermal energy utilization. With fuel cell commercialization just a few years away, much effort is still being expended at developing component level hardware, such as fuel cell stacks and fuel reformers, while relatively little work is being performed in systems-level research. In order to realize the high-energy conversion efficiencies offered by fuel cell devices, it is crucial that methodologies for system-level optimal design be developed to achieve the maximum overall system efficiency and cost effectiveness.
Objectives
The basic components of a typical fuel cell power plant consist of a fuel processor, fuel cell power module, power conditioning equipment for dc-to-ac inversion, and process gas heat exchangers. Depending on the operating temperature, fuel cells produce varying grades of waste heat that can be recovered for process heating, gas compression requirements, or exported for cogeneration (or trigeneration) purposes. The utilizability of this waste heat can significantly impact system efficiency, economics, and environmental emissions.

Robert J. Braun 42
It has often been stated that the characteristically high thermal-to-electric ratio of the SOFC makes them attractive for providing the thermal requirements of various end-use applications. The high-grade waste heat produced in a solid oxide fuel cell can be utilized for space heating, process steam, and/or domestic hot water demands. The type of heat recovery depends on the application requirements and the resulting cogenerative efficiency will depend on the design. A significant issue surrounding the use of fuel cells (and their efficiency) in residential applications, is their ability to meet the highly non-coincident electric and thermal loads in either grid-connected or stand alone configurations. That is, in either base load operation or electric load-following conditions, electricity and/or heat may be available when it is not needed or vice-versa. Additionally, either higher or lower fuel efficiency and different proportions of electric and thermal output is derived from the fuel cell system depending on where the fuel cell stack is operated on its voltage-current characteristic. As a result, both the system design point and off-design point operating characteristics are dependent on (i) selection of optimal fuel cell design and operating point, (ii) heat recovery design, (iii) electric and thermal load management, and to a lesser degree (iv) the performance characteristics of auxiliary hardware, such as inverters, pumps, compressors, controls, and external reformers (if any).
The successful design of fuel cell systems requires proper selection of cell stack operating conditions. Studies focusing on optimal operating point selection are emerging [3,4,5]. The operating point of the fuel cell expressed in terms of performance variables, such as fuel utilization, operating voltage, cell temperature, and area specific resistance, will dictate the power density and operating efficiency of the stack module. In turn, establishment of these performance parameters enables a determination of capital, fuel, and electricity costs for a given utility requirement. The choice of the relevant performance parameters may maximize electric power or electric efficiency. In addition to operating point selection for optimal design point operation, the fuel cell operating envelope must be designed to accommodate off-design point operation for load-following situations.
The objectives of the research can be summarized as (i) establish the optimal operating point for the purposes of system design through minimization of the system life cycle costs expressed as “cost-of-electricity” (COE), (ii) establish the sensitivity of economic and cell performance parameters on operating point selection, and (iii) simulate an SOFC cogenerator in a residential application to gauge performance and to offer additional optimal design strategies. The studies are performed for an advanced planar solid oxide fuel cell system employing indirect internal reforming and anode gas recirculation.
This paper is divided into two parts. In part I, optimal operating point studies on a commercial scale electric-only application are presented (cf. Braun et al., [6]). Sensitivity analyses to both economic and operating performance parameters are also
Optimal Design and Operation of Solid Oxide Fuel Cell Systems 43
discussed. In part II, the methods of the commercial scale analysis are applied to a smaller, residential fuel cell power generator with cogeneration in the form of domestic hot water. The performance of the residential power system is parameterized and employed for annual simulations.
PART I SYSTEM DESCRIPTION
200 kWe Base Case System Design
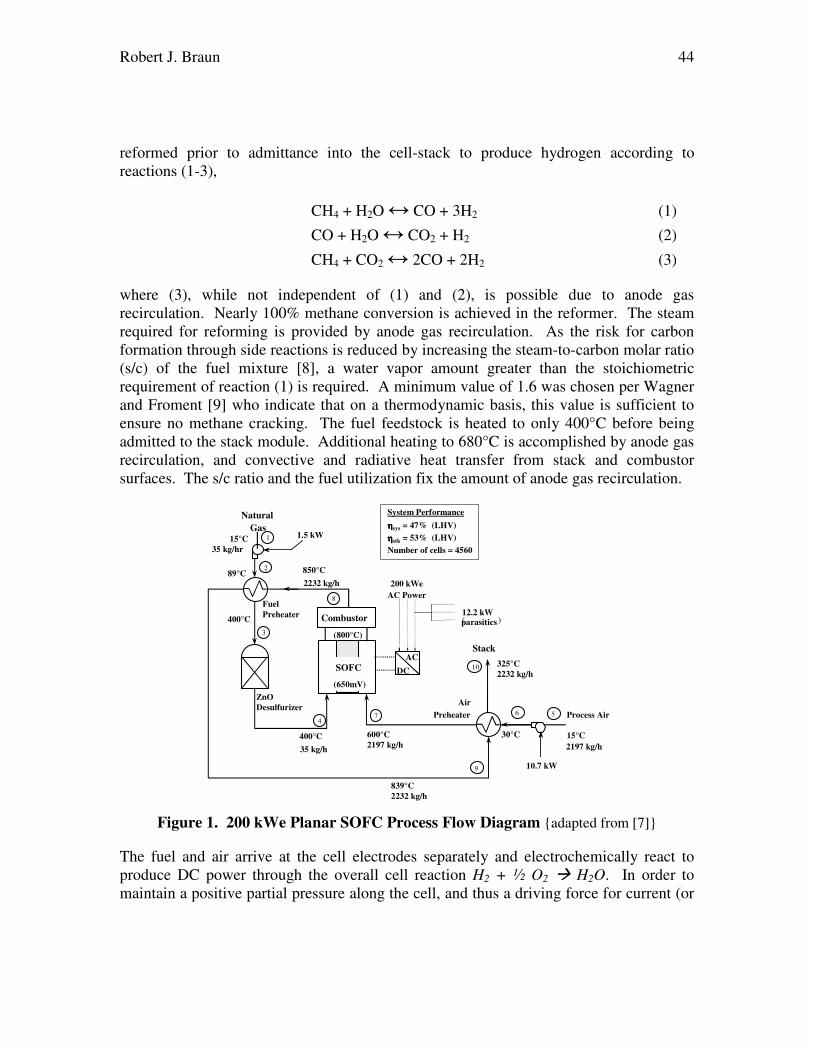
A 200 kWe natural gas-fueled planar solid oxide fuel cell system providing electrical power only was chosen for the operating point studies. A non-optimized reference design of the system with a nominal fuel cell operating temperature of 800°C is shown in Figure 1. Salient features of the basic system design include the use of thermally integrated indirect internal reforming, anode gas recirculation, two stage air and fuel preheat, reactant blowers, inverter, and a natural gas desulfurizer. The system under study is an advanced design in that heat removal from the stack is not strictly dependent on cathode air flow. The thermally integrated indirect internal reformer acts as an additional heat sink, thereby reducing cooling air requirements. The power module enclosure houses the fuel cell stack, fuel ejector, preheater, and reformer, and air preheater. A conceptual diagram of the stack processes is illustrated in Figure 2.
Natural gas enters the plant at station 1 and is pressurized to 2.13 bar. After preheat, the fuel enters the desulfurizer where sulfur levels are reduced below 0.1 ppm [7]. The desulfurized fuel enters the stack module at station 4. Air enters the plant at station 5 (420% theoretical) and is pressurized to 1.14 bars before entering the preheater. Air preheat to 600°C is accomplished through a cross-flow plate fin type heat exchanger with an effectiveness of 0.70. Inside the stack, the fuel is mixed and heated with a portion of the depleted anode gas such that the resultant fuel mixture has a steam-to-methane molar ratio of 1.6:1. After reforming, the hydrogen-rich gas stream enters the anode gas manifold and is electrochemically converted with a fuel utilization of 85%, producing 226 kW of DC power which is inverted to AC with an efficiency of 94%. The net system electric efficiency is 47%. About half of the depleted fuel (by mass) that exits the anode compartment is catalytically combusted with the partially depleted cathode gas stream. Air entering the stack is distributed around the enclosure such that it is further heated from 600°C to 680°C before entering the cathode compartment. A temperature rise of 100°C occurs across the stack. After combustion, the product gases exit the stack at 850°C (station 8). The combustion gases provide the thermal energy for preheat of the process fuel and air streams before exiting the plant at 325°C.
Fuel Cell Stack
Direct electrochemical oxidation of methane is theoretically possible, but its use for near-term solid oxide cells employing zirconia-based electrolytes is not realistic. Methane is
Robert J. Braun 44
reformed prior to admittance into the cell-stack to produce hydrogen according to reactions (1-3),
CH4 + H2O ↔ CO + 3H2 (1)
CO + H2O ↔ CO2 + H2 (2)
CH4 + CO2 ↔ 2CO + 2H2 (3)
where (3), while not independent of (1) and (2), is possible due to anode gas recirculation. Nearly 100% methane conversion is achieved in the reformer. The steam required for reforming is provided by anode gas recirculation. As the risk for carbon formation through side reactions is reduced by increasing the steam-to-carbon molar ratio (s/c) of the fuel mixture [8], a water vapor amount greater than the stoichiometric requirement of reaction (1) is required. A minimum value of 1.6 was chosen per Wagner and Froment [9] who indicate that on a thermodynamic basis, this value is sufficient to ensure no methane cracking. The fuel feedstock is heated to only 400°C before being admitted to the stack module. Additional heating to 680°C is accomplished by anode gas recirculation, and convective and radiative heat transfer from stack and combustor surfaces. The s/c ratio and the fuel utilization fix the amount of anode gas recirculation.
SOFC
Combustor
ZnO
Desulfurizer Air
Preheater Process Air
Stack
Fuel
Preheater
Natural
Gas 1
2
3
8
4 7
DC
AC
9
10
5 6
600°C
2197 kg/h 400°C
35 kg/h
850°C
2232 kg/h
System Performance
ηηηη sys = 47% (LHV)
ηηηη stk = 53% (LHV)
Number of cells = 4560
15°C
35 kg/hr
200 kWe
AC Power
89°C
400°C
(800°C)
(650mV)
325°C
2232 kg/h
839°C
2232 kg/h
15°C
2197 kg/h
30°C
12.2 kW ( parasitics )
1.5 kW
10.7 kW
Figure 1. 200 kWe Planar SOFC Process Flow Diagram adapted from [7]
The fuel and air arrive at the cell electrodes separately and electrochemically react to produce DC power through the overall cell reaction H2 + ½ O2 H2O. In order to maintain a positive partial pressure along the cell, and thus a driving force for current (or

Optimal Design and Operation of Solid Oxide Fuel Cell Systems 45
charge transfer), not all the fuel can be consumed at an electrode. The amount of fuel utilization* affects the operating voltage and consequently, the system efficiency. Determination of optimal fuel utilization for the system is taken up shortly. After electrode reactions, depleted products are mixed and oxidized in the afterburner where complete combustion is assumed.
Balance-of-Plant
The natural gas used in this analysis was comprised of a mixture of 95% methane and 5% carbon dioxide that contains some low-level sulfur which must be stripped via a catalytic desulfurization process. As the heat and mass changes across the desulfurizer unit are small relative to the bulk flow of fuel, modeling the reactor is not required. However, a relatively large pressure drop of 0.5 bar is incurred across the reactor [7] and in the subsequent analysis, consideration is given to pressure drop changes due to fluctuations in fuel flow requirements through the reactor unit.
QCC2Recirculated Anode Exhaust
FuelFuel Mixing
&
Preheat
4
c
a
Air
Combustion Chamber
b
f
d
g
8
QCC1
DC Power
Products
ANODE
CATHODE
SOFCSOFC
QFC
800°C
7
Air Preheat
e
400°C35 kg/h
680°C175 kg/h
780°C140 kg/h
600°C2197 kg/h
780°C278 kg/h
850°C2232 kg/h
630°C 680°C
21 kWt
3 kWt
34 kWt
226 kWe
780°C2093 kg/h
6 kWt
Fuel Cell Power Module
Reformer
QCC2Recirculated Anode Exhaust
FuelFuel Mixing
&
Preheat
44
cc
aa
Air
Combustion Chamber
bb
ff
dd
gg
88
QCC1
DC Power
Products
ANODE
CATHODE
SOFCSOFC
QFC
800°C
77
Air Preheat
ee
400°C35 kg/h
680°C175 kg/h
780°C140 kg/h
600°C2197 kg/h
780°C278 kg/h
850°C2232 kg/h
630°C 680°C
21 kWt
3 kWt
34 kWt
226 kWe
780°C2093 kg/h
6 kWt
Fuel Cell Power Module
Reformer
Figure 2. Conceptual Fuel Cell Stack Process Diagram adapted from [10]
Air-cooled solid oxide fuel cells typically operate with excess air several times above stoichiometric requirements due to the need for maintaining a small temperature rise (< 100°C) across the fuel cell stack. Bossel [11] reports theoretical air† requirements
* Fuel utilization is defined as the number of moles of hydrogen consumed divided by the molar amount of hydrogen supplied to the cell (including the hydrogen produced via reaction (2)). † Theoretical air is defined here as the amount of air necessary to oxidize the system fuel gas input.
Robert J. Braun 46
ranging between 300-1000% for SOFC systems. Typical values of 300-600% can be found in the literature [7,12,13,14]. A pinch temperature difference of 20°C was set between the solid cell material and the depleted reaction products. The maximum combustion products temperature leaving the stack module is constrained to 850°C by adjustment of the air flow to enable use of lower cost materials in the downstream fuel and air gas heaters. The temperature rise across the cell stack is set at 100°C and the temperature rise from reactant inlet (stations a and f) to combustion outlet is 170°C.
METHODOLOGY AND APPROACH
Simulation Program
A program to determine all the state point variables in the thermodynamic flowsheets detailed in Figures 1 and 2 was written using EES [15], a general purpose equation solver. Mass and energy balances were written for each component in the system. Performance characteristics, such as cell voltage-current curves, blower and compressor efficiencies, and heat exchanger effectivenesses were included in the analyses. Thermodynamic properties were computed using correlations provided by EES and the resultant system of nonlinear equations is then solved in the same program.
Performance Characteristics
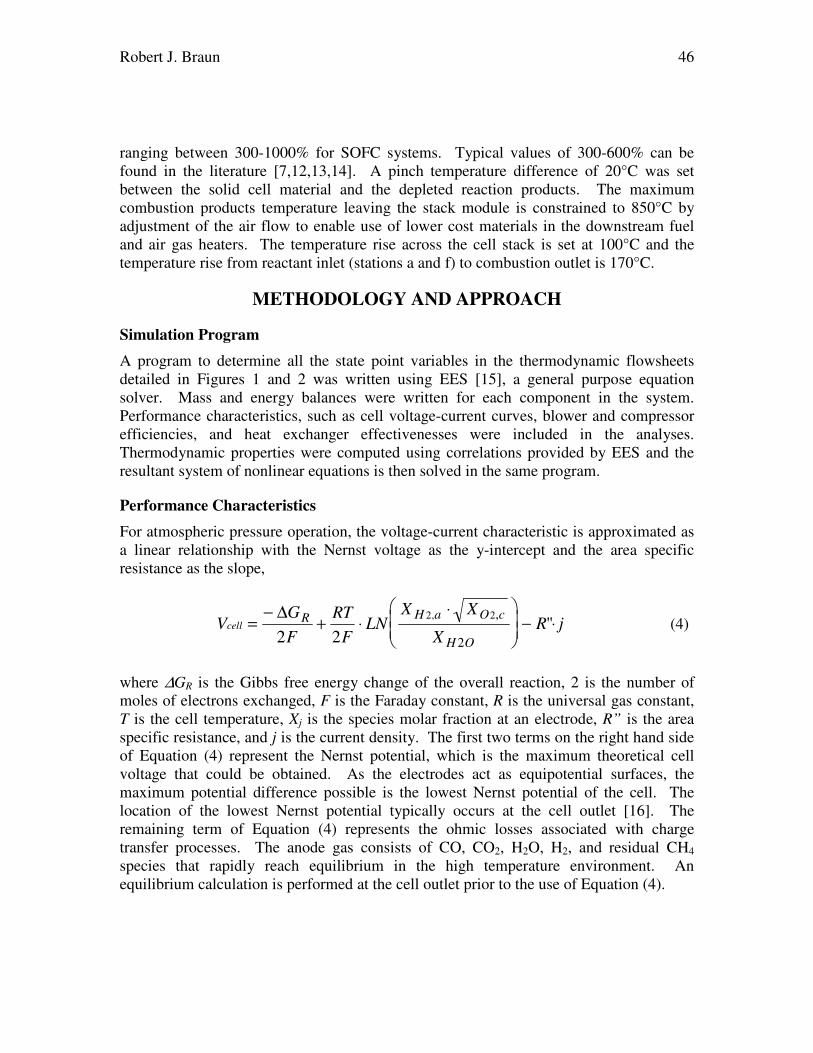
For atmospheric pressure operation, the voltage-current characteristic is approximated as a linear relationship with the Nernst voltage as the y-intercept and the area specific resistance as the slope,
VG
F
RT
FLN
X X
XR jcell
R H a O c
H O
=−
+ ⋅⋅
− ⋅
∆
2 2
2 2
2
, ," (4)
where ∆GR is the Gibbs free energy change of the overall reaction, 2 is the number of moles of electrons exchanged, F is the Faraday constant, R is the universal gas constant, T is the cell temperature, Xj is the species molar fraction at an electrode, R” is the area specific resistance, and j is the current density. The first two terms on the right hand side of Equation (4) represent the Nernst potential, which is the maximum theoretical cell voltage that could be obtained. As the electrodes act as equipotential surfaces, the maximum potential difference possible is the lowest Nernst potential of the cell. The location of the lowest Nernst potential typically occurs at the cell outlet [16]. The remaining term of Equation (4) represents the ohmic losses associated with charge transfer processes. The anode gas consists of CO, CO2, H2O, H2, and residual CH4 species that rapidly reach equilibrium in the high temperature environment. An equilibrium calculation is performed at the cell outlet prior to the use of Equation (4).

Optimal Design and Operation of Solid Oxide Fuel Cell Systems 47
The slope of the V-I characteristic is representative of the cell area specific resistance (ASR), which is temperature sensitive. Various sources for characterizing the temperature dependence of the ASR exist in the literature (cf. Ghosh et al., [17] and Minh [18]). The temperature dependence given by Chen et al., [3] is employed in the life cycle cost estimations of this analysis.
Lundberg [7] showed stack heat loss as a function of capacity to range from 1.0 to 3.5% of the fuel lower heating value for a tubular SOFC stack design. The stack heat loss parameter for this study is 1.5% of the system fuel energy input (LHV basis). Fuel cell stack and system efficiency are defined as,
fuelfuel,in
stkLHVN ⋅
=&
OutPower DCη and
fuelfuel,in
sysLHVN ⋅
=&
OutPower ACNet η (5)
Table 1 details the important system hardware specifications employed, including that of the base case, range of parameter variation, and fixed variables.
Economic Considerations
For on-site distributed power generation, transmission and distribution costs do not factor into the cost of electricity. Annual operation and maintenance is estimated at 1% of the system capital cost. SOFC stacks are assumed to have an operational life of 5 years with a salvage value of 1/3 the original investment. The plant life is assumed to be 20 years with a capacity factor of 0.8. Fuel cost, unless noted otherwise, is $4/MMBtu. The cost of capital is 8% and the return on investment is 12% (before taxes), yielding a discount rate of 20%. The stack manufacturing costs given by Chen et al., [3] are employed in this analysis and are based on 200 MW/yr production levels. The SOFC costs are dependent on the materials employed and the cell component thicknesses. The economy of the cell
stack is based on the use of Ni/Zr cermet anode (100 µm thick), yttria-stabilized zirconia
electrolyte (5 µm), strontium-doped lanthanum manganite cathode (100 µm), and either 1mm stainless steel (700-800°C), high alloy metal (900°C), or La Chromite (1000°C) for the interconnect depending on operating temperature. Cell electroactive area is 225 cm2.
The balance-of-plant costs are adapted from Chen et al., [3], Lundberg [7], and Hsu [19]. Scaling of capital costs for the parametric optimization studies used the cost scaling techniques detailed in Boehm [20]. Cost scaling exponents were selected from Boehm, Perry et al., [21], and Peters et al., [22] and cost sensitivity analyses.
The variables considered in the operating point study include operating temperature, cell voltage, and fuel utilization. In addition to a technical study of operating variables, the sensitivity of minimum life cycle costs to economic parameters, such as fuel and cell stack cost are also presented.

Robert J. Braun 48
Table 1. Reference System Values and Parameter Ranges Under Study
Parameter Ref. Value
Range Studied
Cell Temp. (°C) 800 700-1000
Cell Press. (atm) ~1 Fixed
Cell voltage (mV) 650 500-850
Power Output (kWe)* 200 may vary*
ASR (Ω cm2) .663 .278–1.01
Fuel Utilization (%) 85 60-95
Air Stoichs, S 4.2 2-6
S/C Ratio 1.6 Fixed
Cell stack ∆T (°C) 100 < 100
Module ∆T (°C) 250 200-450
Module Outlet Temp. 850 < 850
Fuel Compressor Effic.(polytropic)
70% Fixed
Air Blower Effic.(static)
65% Fixed
Fuel Preheater Effectiveness
.415 Fixed
Air Preheater Effectiveness
0.70 variable
Inverter Efficiency 94% Fixed
Table 2. System Capital Cost Data
Component Unit Cost1
($/kWe)
Cost Exponent
Cell hardware2 $492/m2 N/a
Inverter / controls
200 0
Air Preheater 106 0.75
Air Blower 43 1.0
Fuel Processing3 90 0.6
Aux. Hardware4 160 0
1 1999 US$
2 800°C cost shown. Cell costs are a increasing function of operating temperature.
3 Includes desulfurizer and catalyst, fuel preheat, and ejector.
4 Includes startup burner and boiler, controls and instrumentation.

Optimal Design and Operation of Solid Oxide Fuel Cell Systems 49
OPERATING POINT ANALYSES
Two paths of study are available for the system analyses. The first path is one that fixes cell stack size (i.e., number of cells) and examines cost and performance changes due to variation of system operating parameters, such as operating cell voltage, fuel utilization, and power module inlet air temperature. The second path fixes power output while varying operating parameters. Both options require a cell performance characteristic and a general system process design (e.g., see Figure 1). Both options will also lead to the same optimum since the influence of cost-of-electricity is relatively independent of size. Riensche et al. [4] examined the first approach in some detail for a non-optimized planar SOFC system. In this study, only a brief examination of fixed stack size is presented before moving on to the method of fixed power output.
Fixed Stack Size
The cell performance is shown for 800°C operation and a fuel utilization of 85% in Figure 3. The effect of varying operating cell voltage on the cost-of-electricity and system electric efficiency is shown in Figure 4. At 650 mV operation, the reference COE is 6.3¢/kWh. The unit system capital cost* associated with an average 650mV cell voltage is 1100 $/kWe. As the operating voltage is increased (increasing fuel conversion efficiency), the cell-stack costs begin to increase at a rate greater than operating costs because lower current densities result and therefore larger cell areas are required. Continued increases in fuel efficiency cannot pay for increases in capital costs, which are dominated by the fuel cell stack, and the selling price of electricity must then be raised to compensate. The minimum cost occurs at a cell voltage of 700 mV with a corresponding system efficiency of 52%. The effect of fuel utilization on COE also exhibits an optimum characteristic near a utilization of 90% as shown in Figure 5. Increasing fuel utilization results in increasing capital costs due to the reduced average current density; but this effect is offset by decreasing fuel costs.
The model developed for a variation in the fuel utilization parameter shows some sensitivity to fuel reforming calculation methodology. In a first approach, the results of which Figure 5 illustrate, the conversion of methane and carbon monoxide via Equations (1) and (2) is assumed to be 100% (in the presence of recirculated gases). Use of this method suggests a slight over-prediction of maximum theoretical voltage and optimal fuel utilization. In a second method, the equilibrium composition of the reformate is calculated prior to entry into the anode. This approach indicates that optimal fuel utilization is lower than that depicted in Figure 5. The location of optimal cell voltage and cell temperature are unaffected by the choice of methodology.
* The unit system capital cost does not include installation, transportation (freight-on-board), or contingency fees.

Robert J. Braun 50
Figure 3. Cell Characteristic Figure 4. Variation of Cell Voltage
The impact of lowering the excess air requirement, by increasing the allowable temperature rise across the fuel cell power module (from station 7 to 8 of Figure 1), on the COE is reduced by the thermal management scheme of the internally reforming stack design. A 50°C decrease in inlet air temperature causes a reduction of only 17% in cooling air requirements and thus, only a small decline in COE. This result is shown in Figure 6 as a function of COE normalized to the reference design case of 6.3¢/kWh. Assuming that a 50°C decrease in inlet air temperature is permissible, moving to the optimal parameters suggested by Figures 5 and 6 (700mV, Uf=89%) results in a decrease of nearly 5% in COE and an increase in system efficiency from 47% to 55%. Power output, however, is reduced by 22%.
Figure 5. Variation of Fuel Utilized Figure 6. Variation of Inlet Temp.

Optimal Design and Operation of Solid Oxide Fuel Cell Systems 51
Fixed Power Output Analysis
In this analysis, a fixed power output of 200 kWe is specified and the variation of operating cell temperature, fuel utilization, cell voltage, and power module inlet air temperature are examined. The objective of the study is to determine optimal operating voltage, temperature, and fuel utilization for the system process design detailed in Figures 1 and 2. Implicit in this analysis is that the stack V-I curve is not affected by changes in the number of cells in the stack. Constraints on the system are the same as listed in Table 1. As before, optimal operating parameters were selected on the basis of minimum cost-of-electricity. However, due to uncertainty in cost estimates, the COE results are normalized to the reference design COE of 6.3¢/kWh.
Figure 7 shows the minimum COE as a function of both fuel utilization and gas temperature rise across the power module for 200 kWe power output and a cell operating temperature of 800°C. In this figure, the optimal operating cell voltage is determined at each specified value of fuel utilization. The optimal fuel utilization is 90% (at a cell voltage of 670 mV) with a system efficiency of nearly 53%. The cost-of-electricity registered only 3% below the reference design case. Additionally, to accomplish a 200 kWe power output at the optimal parameters, the required number of cells increased by 17%. The effect of lowering the excess air required, by decreasing the inlet air temperature to the stack power module by 50°C, reduces the COE to 5% below the reference design.
Figure 7. Variation of Fuel Utilized Figure 8. Optimal Cell Temperature for Fixed Power
The effect of operating cell temperature on COE and system efficiency is shown in Figure 8. The optimal cell voltage and fuel utilization at each cell operating temperature were employed. As cell temperature is reduced from 1000° to 800°C, interconnect material costs are reduced as ceramic materials may be replaced with stainless steel. However, while stack costs are reduced by a factor of 2.3, the area specific resistance
Robert J. Braun 52
increases by the same factor over this temperature range. Below 800°C, no stack cost savings are realized and performance continues to decrease, thus yielding the extrema shown in Figure 8. A similar result has been obtained by Chen et al., [3].
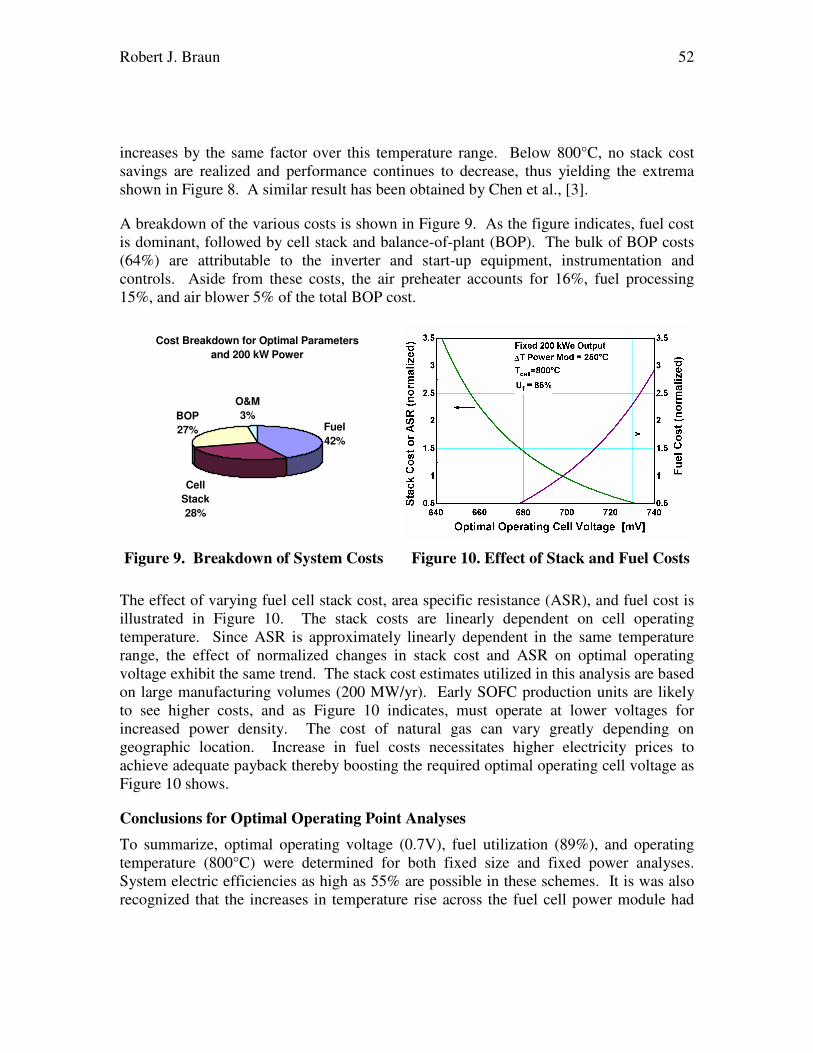
A breakdown of the various costs is shown in Figure 9. As the figure indicates, fuel cost is dominant, followed by cell stack and balance-of-plant (BOP). The bulk of BOP costs (64%) are attributable to the inverter and start-up equipment, instrumentation and controls. Aside from these costs, the air preheater accounts for 16%, fuel processing 15%, and air blower 5% of the total BOP cost.
Cost Breakdown for Optimal Parameters
and 200 kW Power
Fuel
42%
BOP
27%
O&M
3%
Cell
Stack
28%
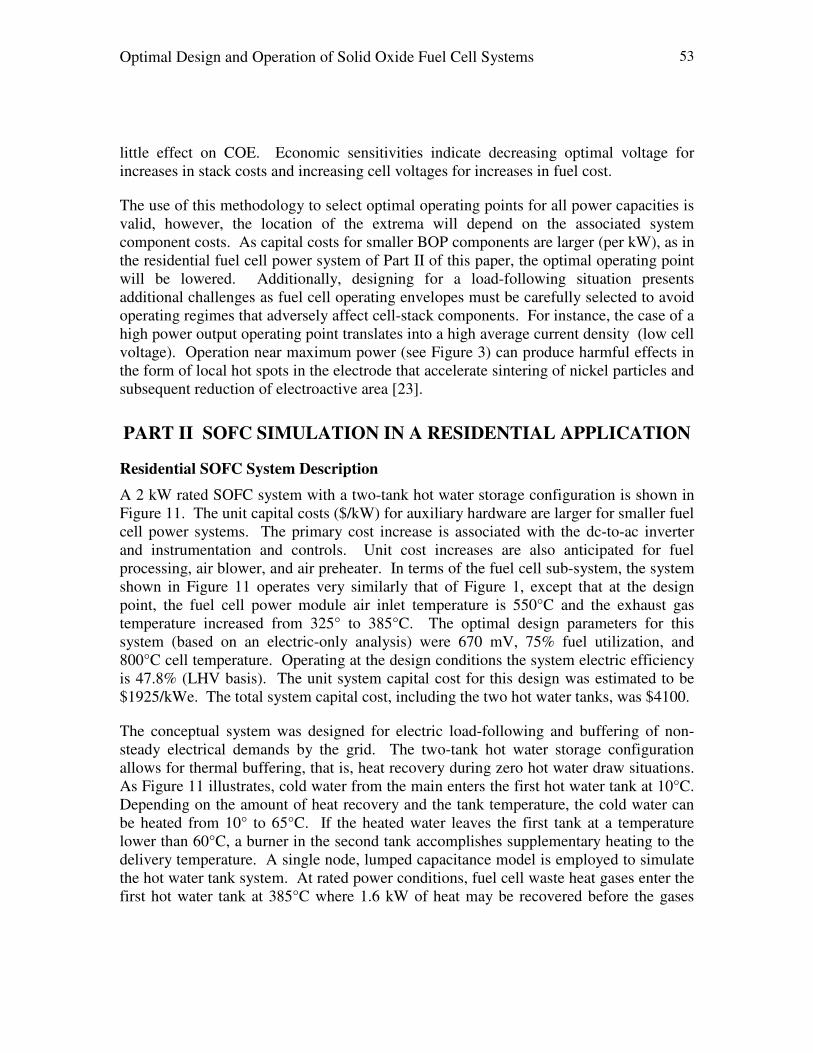
Figure 9. Breakdown of System Costs Figure 10. Effect of Stack and Fuel Costs
The effect of varying fuel cell stack cost, area specific resistance (ASR), and fuel cost is illustrated in Figure 10. The stack costs are linearly dependent on cell operating temperature. Since ASR is approximately linearly dependent in the same temperature range, the effect of normalized changes in stack cost and ASR on optimal operating voltage exhibit the same trend. The stack cost estimates utilized in this analysis are based on large manufacturing volumes (200 MW/yr). Early SOFC production units are likely to see higher costs, and as Figure 10 indicates, must operate at lower voltages for increased power density. The cost of natural gas can vary greatly depending on geographic location. Increase in fuel costs necessitates higher electricity prices to achieve adequate payback thereby boosting the required optimal operating cell voltage as Figure 10 shows.
Conclusions for Optimal Operating Point Analyses
To summarize, optimal operating voltage (0.7V), fuel utilization (89%), and operating temperature (800°C) were determined for both fixed size and fixed power analyses. System electric efficiencies as high as 55% are possible in these schemes. It is was also recognized that the increases in temperature rise across the fuel cell power module had
Optimal Design and Operation of Solid Oxide Fuel Cell Systems 53
little effect on COE. Economic sensitivities indicate decreasing optimal voltage for increases in stack costs and increasing cell voltages for increases in fuel cost.
The use of this methodology to select optimal operating points for all power capacities is valid, however, the location of the extrema will depend on the associated system component costs. As capital costs for smaller BOP components are larger (per kW), as in the residential fuel cell power system of Part II of this paper, the optimal operating point will be lowered. Additionally, designing for a load-following situation presents additional challenges as fuel cell operating envelopes must be carefully selected to avoid operating regimes that adversely affect cell-stack components. For instance, the case of a high power output operating point translates into a high average current density (low cell voltage). Operation near maximum power (see Figure 3) can produce harmful effects in the form of local hot spots in the electrode that accelerate sintering of nickel particles and subsequent reduction of electroactive area [23].
PART II SOFC SIMULATION IN A RESIDENTIAL APPLICATION
Residential SOFC System Description
A 2 kW rated SOFC system with a two-tank hot water storage configuration is shown in Figure 11. The unit capital costs ($/kW) for auxiliary hardware are larger for smaller fuel cell power systems. The primary cost increase is associated with the dc-to-ac inverter and instrumentation and controls. Unit cost increases are also anticipated for fuel processing, air blower, and air preheater. In terms of the fuel cell sub-system, the system shown in Figure 11 operates very similarly that of Figure 1, except that at the design point, the fuel cell power module air inlet temperature is 550°C and the exhaust gas temperature increased from 325° to 385°C. The optimal design parameters for this system (based on an electric-only analysis) were 670 mV, 75% fuel utilization, and 800°C cell temperature. Operating at the design conditions the system electric efficiency is 47.8% (LHV basis). The unit system capital cost for this design was estimated to be $1925/kWe. The total system capital cost, including the two hot water tanks, was $4100.
The conceptual system was designed for electric load-following and buffering of non-steady electrical demands by the grid. The two-tank hot water storage configuration allows for thermal buffering, that is, heat recovery during zero hot water draw situations. As Figure 11 illustrates, cold water from the main enters the first hot water tank at 10°C. Depending on the amount of heat recovery and the tank temperature, the cold water can be heated from 10° to 65°C. If the heated water leaves the first tank at a temperature lower than 60°C, a burner in the second tank accomplishes supplementary heating to the delivery temperature. A single node, lumped capacitance model is employed to simulate the hot water tank system. At rated power conditions, fuel cell waste heat gases enter the first hot water tank at 385°C where 1.6 kW of heat may be recovered before the gases

Robert J. Braun 54
exhaust the system at about 95°C (station 11). The corresponding thermal-to-electric power ratio is 0.8:1.
Operating Strategies
Electric load data for a winter day was obtained from GRI [24], and hot water heating data from Mutch [25]. Space heating and cooling data was generated for a 242 m2 (2,500 ft2) home located in Madison, WI using a TRNSYS [26] Type56 model and typical meteorological year (TMY) weather data. The resultant electric, hot water, space heating, and cooling loads on “typical” winter and summer days are shown in Figure 12. In winter, the maximum electric load is approximately 1.5 kWe. The load data are represented by integrated hourly averages and therefore do not depict the shorter time scale peak power demands of 10 kW or more that characterize residential electricity consumption [27]. It is also noteworthy that the space heating thermal requirement can often be ten times greater than the electrical load. From this it can be seen that the use of residential fuel cell power systems to serve space-heating loads appears difficult to achieve without other system concepts. In contrast, the domestic hot water demand illustrates a better match between the magnitudes of thermal and electric loads.
Supplemental
Fuel
T(t)
Desulfurizer
Air
Preheater
Process Air
Fuel
Preheater
Natural Gas
8
DC
AC
6 5
7
9 10
1
2
3
4
Net AC Power
2 kWe
Parasitics
Exhaust
11
2-Tank Hot Water System
Hot Water
Main
SOFC SOFC
Power Power
ModuleModule
385°C
95°C
Supplemental
Fuel
T(t)
Desulfurizer
Air
Preheater
Process Air
Fuel
Preheater
Natural Gas
88
DC
AC
DC
AC
66 55
77
99 1010
11
22
33
44
Net AC Power
2 kWe
Parasitics
Exhaust
1111
2-Tank Hot Water System
Hot Water
Main
SOFC SOFC
Power Power
ModuleModule
385°C
95°C
Figure 11 Residential SOFC System with Thermal Storage

Optimal Design and Operation of Solid Oxide Fuel Cell Systems 55
Figure 12 Winter and Summer Residential Load Profiles
On a “typical” summer day, the electric load increases due to vapor compression power requirements of air-conditioning systems. The peak power demand generally occurs in the afternoon hours and in this analysis, may range from 1.5-3.5 kW. Figure 12 indicates that although the coincidence of the electric and thermal loads is not well matched, electrical and thermal storage opportunities exist.
The fuel cell electric and thermal load-following performance for the winter and summer days is shown in Figure 13. The solid oxide fuel cell system was designed to handle a 4-to-1 electric turndown. Thus, for loads below 0.5 kW, the fuel cell was forced to shutdown. Shutdown periods last between three and four hours, and occur in the early morning hours. During times of high electric demand and low water draws, the first hot water storage tank was sized to ensure that tank temperatures would not exceed 90°C. Mixing cold water from the main could conceivably lower tank temperatures to accommodate the delivery temperature of 60°C. The main advantage of the 2-tank hot water configuration is that it effectively enables continuous heat recovery irrespective of the load as evidenced by the thermal load profile for the July day shown in Figure 13.
Annual Simulation Results
The utility electricity price for this analysis was 7 ¢/kWh and the natural gas price was $4/MMBtu. Annual simulation of the fuel cell system without any maintenance shut down shows the annual fuel cell system cogeneration efficiency (LHV basis) to be 84.3%. Over the course of the year, the SOFC met 91% of the total house electric energy requirement. On the thermal side, the fuel cell system was able to provide for 54% of the total annual domestic hot water energy requirements.

Robert J. Braun 56
Figure 13 Fuel Cell Operating Profiles
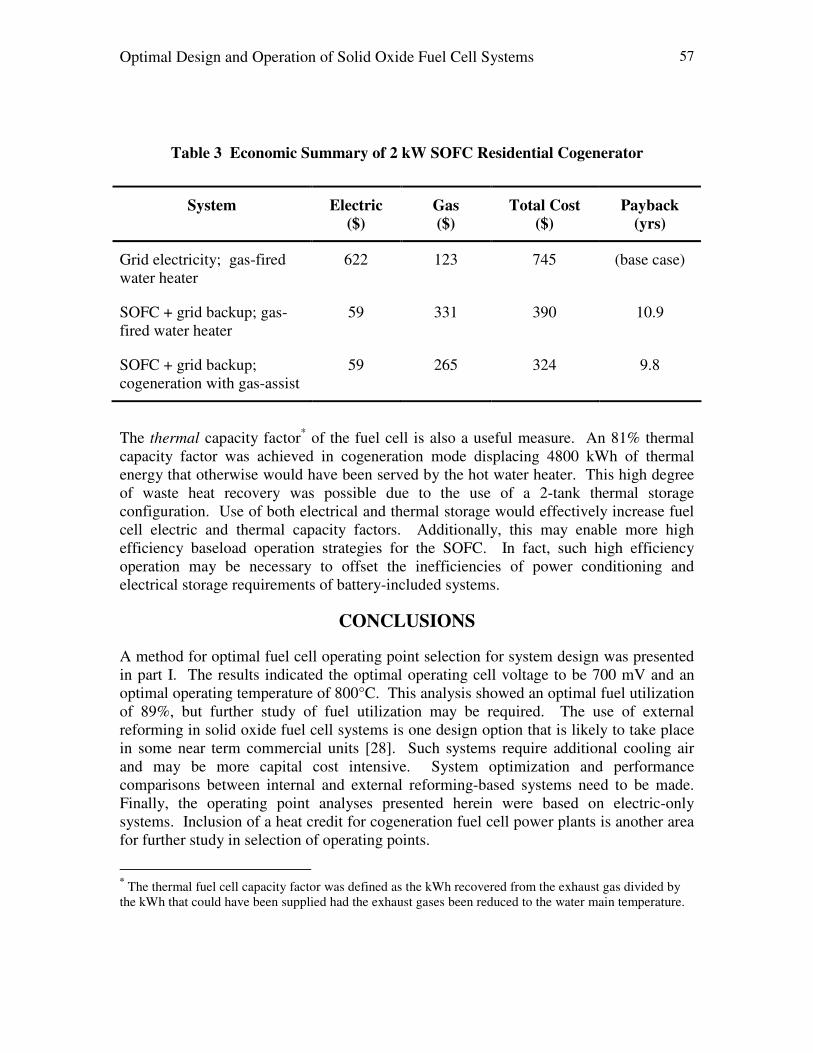
Table 3 summarizes the economic performance of the 2 kWe SOFC residential power system against the base case of utility provided electricity and gas. From a simple energy usage viewpoint (i.e., no fixed transmission and distribution costs), the use of the residential SOFC resulted in electric utility savings of $563, a 90% reduction. However, in the case where no heat was recuperated, the gas utility requirement increased 169% from $123 to $331 due to SOFC fuel consumption. A simple payback of nearly 11 years would result from an electric only operation. With cogeneration in the form of domestic hot water, the utility savings could be increased by nearly 20% over the electric-only system achieving a 9.8 year payback. However, these savings are relatively small since the economic payback is reduced by only one year over an electric-only fuel cell configuration.
The electric capacity factor* of the fuel cell is an important performance parameter as it measures the total annual operating usage of the high capital cost component. The larger the capacity factor, the better the fuel cell payback economics appear. The electric capacity factor performance of the fuel cell indicates that a 2 kW size solid oxide fuel cell may be too large as only 46% of its annual electrical energy production capacity was utilized. Employing a smaller fuel cell system of 1 kW could conceivably double the electric capacity factor to 92%. Other methods to increase the fuel cell electric capacity factor include the use of lead acid batteries, heat pumping, and where possible, selling electricity back to the grid for “net metering.”
* The annual fuel cell electric capacity factor was defined as the kWh supplied by the fuel cell divided by the maximum kWh it could have supplied (e.g, 2 kW * 8,760 hours.)
Optimal Design and Operation of Solid Oxide Fuel Cell Systems 57
Table 3 Economic Summary of 2 kW SOFC Residential Cogenerator
System Electric ($)
Gas ($)
Total Cost ($)
Payback (yrs)
Grid electricity; gas-fired water heater
622 123 745 (base case)
SOFC + grid backup; gas-fired water heater
59 331 390 10.9
SOFC + grid backup; cogeneration with gas-assist
59 265 324 9.8
The thermal capacity factor* of the fuel cell is also a useful measure. An 81% thermal capacity factor was achieved in cogeneration mode displacing 4800 kWh of thermal energy that otherwise would have been served by the hot water heater. This high degree of waste heat recovery was possible due to the use of a 2-tank thermal storage configuration. Use of both electrical and thermal storage would effectively increase fuel cell electric and thermal capacity factors. Additionally, this may enable more high efficiency baseload operation strategies for the SOFC. In fact, such high efficiency operation may be necessary to offset the inefficiencies of power conditioning and electrical storage requirements of battery-included systems.
CONCLUSIONS
A method for optimal fuel cell operating point selection for system design was presented in part I. The results indicated the optimal operating cell voltage to be 700 mV and an optimal operating temperature of 800°C. This analysis showed an optimal fuel utilization of 89%, but further study of fuel utilization may be required. The use of external reforming in solid oxide fuel cell systems is one design option that is likely to take place in some near term commercial units [28]. Such systems require additional cooling air and may be more capital cost intensive. System optimization and performance comparisons between internal and external reforming-based systems need to be made. Finally, the operating point analyses presented herein were based on electric-only systems. Inclusion of a heat credit for cogeneration fuel cell power plants is another area for further study in selection of operating points.
* The thermal fuel cell capacity factor was defined as the kWh recovered from the exhaust gas divided by
the kWh that could have been supplied had the exhaust gases been reduced to the water main temperature.

Robert J. Braun 58
A simulation of a 2 kW residential SOFC power generator was carried out. Results indicated an annual cogeneration efficiency of 84% and a ten-year simple payback was possible. However, the value added by making use of the fuel cell waste heat for domestic hot water heating may be limited since the economic payback is reduced by only one year. The meeting of electric and hot water loads by the fuel cell system was accommodated by a 2-tank hot water storage system. The low electric capacity factor of 46% indicates that a 2 kW rating for the home in this analysis may be too large. Electrical storage, heat pumping, and net metering are a conceivable options to boost electric capacity factor, however, optimal operating and control methodologies must be devised to maximize efficiency and economic performance.
ACKNOWLEDGEMENTS
The author would like to thank Professors Sandy Klein and Doug Reindl for their guidance, unswerving support, and many helpful discussions. I would also like to thank Professors William Beckman and John Mitchell for their useful suggestions. Finally, I must express my sincere appreciation to the Link Energy Foundation and the Energy Center of Wisconsin for providing financial support.
REFERENCES
1. R.J. Braun, S.A. Klein, D.T. Reindl, “Review of State-of-the-Art Fuel Cell
Technologies for Distributed Generation,” Report 193-2 prepared for the Energy Center of Wisconsin, January (2000).
2. P. Schafer, “Commercial Sector Solid Oxide Fuel Cell Business Assessment,” Electric Power Research Institute, TR-106645, August (1996).
3. T. Chen, J.D Wright, K. Krist, Proc. Of Fifth International Symposium on Solid Oxide
Fuel Cells (SOFC-V), PV97-18, Germany (1997). 4. E. Riensche, U. Stimming, G. Unverzagt, J. Power Sources, 73 (2), (1998) pp. 251-
256. 5. A. Khandkar, J. Hartvigsen, S. Elangovan, "A Techno-Economic Model for SOFC
Power Systems," to be published in Solid State Ionics. 6. R.J. Braun, S.A. Klein, and D.T. Reindl, Proc. of the 4th European SOFC Forum,
Lucerne, Switzerland, July (2000), pp. 459-468. 7. W.L. Lundberg, "Solid Oxide Fuel Cell Cogeneration System Conceptual Design,"
Final Report, GRI-89/0162, Gas Research Institute, Chicago, IL, July (1989). 8. J.R. Rostrup-Nielsen, Cat. Sci. and Tech., 5, Springer-Verlag, New York (1984), p. 83. 9. E.S. Wagner and G.F. Froment, Hydrocarbon Processing, July (1992), pp.69-77. 10. R.A. Gaggioli, and S. D. Moody, Proc. of the 1st European SOFC Forum, Lucerne,
Switzerland, (1994), pp.129-151.
Optimal Design and Operation of Solid Oxide Fuel Cell Systems 59
11. U.G. Bossel, "Solid Oxide Fuel Cells Data Book, Facts & Figures," International
Energy Agency SOFC Task Report, Swiss Federal Office of Energy, Berne, CH (1992).
12. J.H. Hirschenhofer, D.B. Stauffer, and R.R. Engleman, “Fuel Cells, A Handbook,” 4th Edition, prepared for the U.S. Department of Energy, November (1998).
13. J.J. Hartvigsen and A.C. Khandkar, "Thermally Integrated Reformer for Solid Oxide Fuel Cells," U.S. Patent No. 5,366,819, Washington, D.C., November (1994).
14. S.C. Singhal, Proc. of the Fifth International Symposium on Solid Oxide Fuel Cells (SOFC-V), PV97-18, Germany, The Electrochemical Society (1997).
15. Engineering Equation Software (EES), F-Chart Software, Middleton, WI. 16. A.J. Appleby, “Characteristics of Fuel Cell Systems,” in Fuel Cell Systems, Edited by
L.J. Blomen and M.N. Mugerwa, Plenum Press, New York (1993). 17. D. Ghosh et al., Proc. Of the Sixth International Symposium on Solid Oxide Fuel
Cells (SOFC-VI), Honolulu, HI, The Electrochemical Society, (1999). 18. N. Minh, 1994 Fuel Cell Seminar, Program and Abstracts, San Diego, CA, (1994),
pp. 577-580. 19. Michael Hsu, “Advanced Planar SOFC Development,” Electric Power Research
Institute TR-107116, October (1996). 20. R.F. Boehm, Design Analysis of Thermal Systems, John Wiley & Sons, New York
(1987). 21. Perry’s Chemical Engineer's Handbook, 7th Edition, McGraw-Hill, Inc., New York
(1997). 22. M.S. Peters and K.D. Timmerhaus, Plant Design and Economics for Chemical
Engineers, 3rd Edition, McGraw-Hill, Inc., New York (1980). 23. S. Linderoth and M. Mogensen, “Improving Durability of SOFC Stacks,” Proc. Of
the 4th
European SOFC Forum, Lucerne, Switzerland, July (2000). 24. K.Krist and J. Wright, “SOFC Residential Cogeneration,” 1999 Joint DOE/EPRI/GRI
Fuel Cell Technology Review Conference, Chicago, IL, August (1999). 25. J.J. Mutch “Residential Water Heating, Fuel Consumption, Economics, and Public
Policy,” RAND Report R1498, (1974). 26. S.A. Klein, W.A. Beckman, and J.A. Duffie, TRNSYS—A Transient System
Simulation Program, Solar Energy Laboratory, Madison, WI, (1999). 27. Peter Bos, “Commercializing fuel cells: managing risks,” J. Power Sources, 61
(1996) pp. 21-31. 28. A. Khandkar et al., Fuel Cell Seminar Abstracts, Palm Springs, CA, November,
(1998) pp.465-468.