Embed Size (px)
Citation preview

OPTIMAL DESIGN OF EMERGENCY
DEPARTMENT UNDER MASS DISASTER
By
Eng. Ahmed Mohammed Ali Ibrahim Abou-Alam
Systems and Biomedical Engineering Department
Faculty of Engineering, Cairo University
A Thesis Submitted to the
Faculty of Engineering at Cairo University
in Partial Fulfillment of the
Requirements for the Degree of
MASTER OF SCIENCE
in
Systems and Biomedical Engineering
FACULTY OF ENGINEERING, CAIRO UNIVERSITY
GIZA, EGYPT
September 2012
OPTIMAL DESIGN OF EMERGENCY
DEPARTMENT UNDER MASS DISASTER
By
Eng. Ahmed Mohammed Ali Ibrahim Abou-Alam
Systems and Biomedical Engineering Department
Faculty of Engineering, Cairo University
A Thesis Submitted to the
Faculty of Engineering at Cairo University
in Partial Fulfillment of the
Requirements for the Degree of
MASTER OF SCIENCE
in
Systems and Biomedical Engineering
Under the Supervision of
Prof. Dr. Bassel Tawfiq
Thesis Advisor
Systems and Biomedical Engineering Department,
Faculty of Engineering, Cairo University, EGYPT
Dr. Bassem Ouda
Thesis Advisor
Systems and Biomedical Engineering Department,
Faculty of Engineering, Cairo University, EGYPT
FACULTY OF ENGINEERING, CAIRO UNIVERSITY
GIZA, EGYPT
September 2012

OPTIMAL DESIGN OF EMERGENCY
DEPARTMENT UNDER MASS DISASTER
By
Eng. Ahmed Mohammed Ali Ibrahim Abou-Alam
Systems and Biomedical Engineering Department
Faculty of Engineering, Cairo University
A Thesis Submitted to the
Faculty of Engineering at Cairo University
in Partial Fulfillment of the
Requirements for the Degree of
MASTER OF SCIENCE
in
Systems and Biomedical Engineering
Approved by the Examining Committee:
Prof. Dr. Bassel Tawfiq, Thesis Advisor
Ass. Prof. Dr. Hossam El-Deen Abou-bakr, Member
Ass. Prof. Dr. Manal Abul-Wahed, Member
FACULTY OF ENGINEERING, CAIRO UNIVERSITY
GIZA, EGYPT
September 2012
i
TABLE OF CONTENTS
List of Tables…………………………...………………………………………………….....vi
List of Figures………………………..……………………………………………………...vii
ACKNOWLEDGEMENT……….……………..…………………………………………....ix
ABSTRACT……….……………..…………………………………………………………....1
1. INTRODUCTION………………………………………………………………………..2
1.1 Disasters…………………………………………………………………………..…...2
1.2 Overview on Emergency Department…………………………………………………4
1.3 Emergency Department Patients Classification……………………………………….6
1.4 The Patients’ Journey………………………………………………………………….6
1.5 Problem Definition…………………………………………………………………....8
1.6 Thesis Objective ……………………………………………………………….........13
1.7 Thesis Organization……………………………………………………………….....14
2. BACKGROUND: Emergency Department Facilities ………………………….…….15
2.1 Specific Functional and Design Requirements………………………………………15
2.1.1 Entrances…………………………………………………………………….15
2.1.2 Reception Area ……………………………………………………………..15
2.1.3 Waiting Facilities for Patients and their Families…………………………...18
2.1.4 Triage Area………………………………………………………………….19
2.1.5 Assessment Area / Consultation / Examination / Fast Track Area………….20
2.1.6 Treatment Area ……………………………………………………………..21
2.1.6.1 Acute Treatment Area ………………………………………………….22
2.1.6.2 Isolation Rooms………………………………………………………...23
2.1.6.3 Plaster Room……………………………………………………………23
2.1.6.4 Procedure Room………………………………………………………...24
2.1.6.5 Multi-Functional Treatment Rooms…………………………………….24
2.1.6.6 Head and Neck Treatment Room……………………………………….25
2.1.6.7 Gynecology / Genitourinary Treatment Room…………………………25
2.1.6.8 Staff Station……………………………………………………………..25
2.1.7 Resuscitation Area…………………………………………………………..25
2.1.8 Clinical Decision Unit / Observation Unit……………………………..……27
2.1.9 Decontamination Area………………………………………………………28
2.1.10 Diagnostic Area……………………………………………………………..28
2.1.10.1 Laboratory…………………………………………………………….28
2.1.10.2 Dirty Utility Room…………………………………………………….29
2.1.10.3 Medical Imaging………………………………………………………29
2.1.11 Clinical Support Facilities…………………………………………………..30
2.1.11.1 Clean Utility Room……………………………………………………30
2.1.11.2 Equipment and Supplies Store………………………………………..30
2.1.11.3 Disaster Equipment Store……………………………………………..31
2.1.11.4 Ready Use Medical Gas Cylinder Store………………………………31
2.1.11.5 Ambulance Equipment Store………………………………………….31
2.1.11.6 Housekeeper’s Room………………………………………………….31
2.1.11.7 Disposal Hold…………………………………………………………31
2.1.11.8 Battery / Uninterrupted Power Supply Room…………………………32
2.1.11.9 Switch-cupboard………………………………………………………32
ii
2.1.11.10 Pharmacy / Medication Room ……………………………………….32
2.1.12 Security……………………………………………………………………...32
2.1.13 Staff Support Facilities ……………………………………………………..34
2.1.13.1 Rest and Recreation Facilities………………………………………...34
2.1.13.2 Changing Rooms and Associated Facilities…………………………..35
2.1.13.3 Tutorial Room / Education and Training Facilities…………………...35
2.1.13.4 Administration Area / Office Accommodation……………………….36
3. LITERATURE REVIEW………………………………………………………………38
3.1 Guiding Principles for Pre-hospital Medical Care Disaster………………………….39
3.1.1 Medical Care at the Disaster Site……………………………………………39
3.1.2 Aerial Ambulances………………………………………………………….40
3.1.3 Triage………………………………………………………………………..40
3.1.4 Tagging……………………………………………………………………...41
3.1.5 Triage Area …………………………………………………………………41
3.1.6 Mobilization Area…………………………………………………………...42
3.1.7 Mobile Units……………………………………………………….………..42
3.1.8 Medical Supplies……………………………………………………………42
3.1.9 Conclusion and Limitation………………………………………………….43
3.2 Reducing Emergency Department Overcrowding Using Patient Buffer Concepts….43
3.2.1 Conceptual Model…………………………………………………………...44
3.2.2 Response Variables………………………………………………………….46
3.2.3 Buffer Concept I: Holding Area…………………………………………….47
3.2.4 Buffer Concept II: ED-Discharge Lounge…………………………………..48
3.2.5 Buffer Concept III: Observation Unit……………………………………….49
3.2.6 Buffer Concept IV: Combination of Holding Area and ED-Discharge
Lounge………………………………………………………………………51
3.2.7 Buffer Concept V: Combination of Holding Area, ED-Discharge Lounge, and
Observation Unit…………………………………………………………….51
3.2.8 Which buffer to implement?...........................................................................52
3.2.9 Conclusion and Limitation………………………………………………….54
3.3 Large Capacity Ambulances…………………………………………………………54
3.4 Facility layout Planning Algorithms………………………………………………....57
3.5 Discrete Event Simulation…………………………………………………………...61
3.6 Thesis Proposed Solution…………………………………………………………….65
4. METHODOLOGY and RESULTS……………………………………………………67
Part One: Emergency Department Design Using Facility Layout Planning Algorithms....67
4.1 Facility Layout Planning Algorithms………………………………………………..67
4.1.1 The facilities layout problem…………………………..……………………68
4.1.2 Mainframe based Computer Assisted Techniques………………………….69
4.1.3 CORELAP Algorithm………………………………………………………72
4.1.4 CORELAP Algorithm Flowchart…………………………………………...77
4.1.5 Example on CORELAP……………………………………………………..78
4.2 Result One : Application of CORELAP on Case Study…..…………………………86
4.2.1 Schedules of Accommodation………………………………………..……..87
4.2.2 Layout Design…………………………………………………………….…94
4.2.3 Functional Layout Relationship Diagram………………………………….121
iii
Part Two: Emergency Department Design Optimization Using Discrete Event
Simulation………………………………………………………………………………..122
4.3 Discrete Event Simulation………………………………………………………….122
4.3.1 Objective…………………………………………………………………...123
4.3.2 Scope of Work……………………………………………………………..123
4.3.3 Plan of Work……………………………………………………………….123
4.3.4 Framework…………………………………………………………………124
4.4 Result Two: Application Simulation software on a Case Study……………………130
5. Conclusion and Future Work…………………………………………………………147
5.1 Conclusion………………………………………………………………………….147
5.2 Limitations………………………………………………………………………….148
5.3 Future Work and Recommended Research………………………………………...148
References…………………………………………………………………………………..149
Appendix A: The General Functional and Design Considerations in Emergency
Department………………………………………………………………………………....A-1
1. General Functional and Design Considerations………………………………………...A-1
1.1 Planning Team……………………………………………………………………...A-1
1.2 Considerations at the Initial Planning Stage………………………………………..A-1
1.3 Upgrading or Adaptations of Existing Buildings…………………………..............A-1
1.4 Emergency Department Location Considerations………………………………….A-2
1.5 Privacy and Dignity of Patients…………………………………………………….A-3
1.6 Disabled People…………………………………………………………………….A-3
1.7 Infection Control……………………………………………………………………A-3
1.8 Decontamination……………………………………………………………………A-4
1.9 Major Incidents……………………………………………………………..............A-4
1.10 Design Considerations……………………………………………………………A-5
1.11 Art in Hospitals……………………………………………………………...........A-5
1.12 Natural and Artificial Lighting……………………………………………...........A-6
1.13 Death of a Patient in Emergency Care……………………………………………A-6
1.14 Communications………………………………………………………………….A-6
1.15 Fire Alarms……………………………………………………………………….A-8
1.16 Finishes……………………………………………………………………...........A-8
Appendix B: Engineering Services in Emergency Department………………………....B-1
1. Engineering Services………………………………………………………………........B-1
1.1 Environmental Requirements………………………………………………………B-1
1.2 Activity Database …………………………………………………………………..B-1
1.3 Fire Safety…………………………………………………………………..............B-1
1.4 Location of Electrical Outlets, Medical Gas Outlets and Medical Supply
Units…………………………………………………………………………...……B-2
1.5 Noise and Speech Privacy…………………………………………………………..B-2
1.6 Mechanical Services………………………………………………………..............B-2
1.6.1 Heating……………………………………………………………………..B-2
1.6.2 Ventilation…………………………………………………………………B-3
1.6.3 Hot, Cold and Drinking Water Services…………………………………...B-5
1.6.4 Piped Medical Gases……………………………………………………….B-6
1.6.5 Pneumatic Air Tube Transport Systems…………………………………...B-6
1.7 Electrical Services…………………………………………………………………..B-6

iv
1.7.1 Electrical Installation………………………………………………………B-6
1.7.2 Electrical Interference……………………………………………………...B-7
1.7.3 Lighting…………………………………………………………………….B-7
1.7.4 Emergency Electrical Supplies…………………………………………….B-8
1.7.5 Security, Alarm and Communication Systems…………………………….B-8
1.7.6 Data and Equipment Links………………………………………………...B-9
1.7.7 Closed-Circuit Television (CCTV)……………………………………….B-10
1.7.8 Wall Clocks………………………………………………………………B-10
1.7.9 Music and Television……………………………………………………..B-10
1.7.10 Lightning Protection……………………………………………………...B-10
1.8 Internal Drainage………………………………………………………………….B-10
v
LIST OF TABLES
Table (1.1) The Australasian Triage Scale……………………………….……………………6
Table (3.1) Detailed results of all response variables studies in Patients Buffers……............53
Table (4.1) Computer-Aided Layout Algorithms…………………………………………….72
Table (4.2) Features of Selected Layout Algorithms……………...………………………….72
Table (4.3) TCR table of example 1………………………………………………………….78
Table (4.4) The general differences between ALDEP and CORELAP……………………....87
Table (4.5) Schedules of different Accommodations in ED………………………………….90
Table (4.6) Closeness ratings relationships…………………………………………………..95
Table (4.7) Table of TCR for case study……………………………………………………..95
Table (4.8) Waiting and interaction times from 0800-0800 in Area 1, 2 and 3…………..…133
Table (4.9) Original and simulated Waiting Time in case study…………………………....135
Table (4.10) Waiting Time Approximation in case study…………………………………..137
Table (4.11) Combinations of different capacities and its corresponding waiting times…...140
LIST OF EQUATIONS
Equation 1: Total Closeness Rating………………………………………………………......69
Equation 2: Placing Rating…………………………………………………………………...76
Equation 3: Weighted Sum model…………………………………………………………..143
Equation 4: Average Summation method…………………………………………………...144
Equation 5: Improvement Percentage……………………………………………………….145
vi
LIST OF FIGURES
Figure 1.1 Disaster Threshold……………………………………………………………….…3
Figure 1.2 Modes of Arrival of Patients….................................................................................7
Figure 1.3 Ambulatory patient journey…………………………………………………...……9
Figure 1.4 Ambulance patient journey………………………………………………………..10
Figure 1.5 Example of overcrowding situation ………………………………………………11
Figure 1.6 Overcrowding possible causes……………………………………………………12
Figure 1.7 Overcrowding Consequences……………………………………………………..13
Figure 2.1 Example of Entrance to Emergency Department…………………………………16
Figure 2.2 Example of Waiting area………………………...……………….……………….19
Figure 2.3 Example of Sub waiting area……………………………….……………………..20
Figure 3.1 Tagging methods………………………………………………………………….41
Figure 3.2 Mobilization Areas………………………………………………………………..42
Figure 3.3 Kolb’s Conceptual Model………………………………………………………....45
Figure 3.4 Kolb’s Computerized Model……………………………………………….……..46
Figure 3.5 Scheme of Buffer Concept I in the patient flow………………………….……….47
Figure 3.6 Scheme of Buffer Concept II in the patient flow………………………….……...48
Figure 3.7 Scheme of Buffer Concept III in the patient flow………………………….……..50
Figure 3.8 Scheme of Buffer Concept IV in the patient flow………………………….……..51
Figure 3.9 Scheme of Buffer Concept V in the patient flow…………………………………52
Figure 3.10 Large-Capacity Ambulance Variant C…………………………………………..55
Figure 3.11 Large-Capacity Ambulance from Inside…………………………………….......55
Figure 3.12 Operating Theatre Lights, Clinical Equipment and Observation Bays in the large
capacity ambulance …………………………………………………………………………..56
Figure 3.13 The difference between descriptive and predictive referring to emergency
department…………………………………………………………………………………….62
Figure 3.14 Advantage of Simulation Modeling……………………………………………..63
Figure 3.15 Thesis Proposed Solution…………………………………..................................66
Figure 4.1 Example on CORELAP construction……………………………………………..70
Figure 4.2 ALDEP Location Strategy…………………………………………………….......70
Figure 4.3 Example of relationship full matrix for CORELAP algorithm ………………......73
Figure 4.4 Example of relationship half matrix for CORELAP algorithm…………………...74
Figure 4.5 Space neighbors…………………………………………………………………...76
Figure 4.6 CORELAP Algorithm Flowchart…........................................................................77
Figure 4.7 Relationship chart for Example 1…………………………………………………78
Figure 4.8 Closeness relationships between space 6 and spaces 5 & 4………………………79
Figure 4.9 Closeness relationship between space 6 and space 4……………………………..79
Figure 4.10 Closeness relationship between space 5 and space 2……………………………80
Figure 4.11 Closeness relationship between space 2 and space 3……………………………80
Figure 4.12 Locations neighbors to space 6…………………..………………………………81
Figure 4.13 Closeness relationship between space 6 and space 5……………………………81
Figure 4.14 Locations neighbors to spaces 6&5……………………………………………...82
Figure 4.15 Closeness relationship between (4&6) and (4&5)……………………………….82
Figure 4.16 Location neighbors to spaces 6&5&4…………………………………………...83
Figure 4.17 Closeness relationship between (2&6), (2&5) and (2&4)……………………….83
Figure 4.18 Location neighbors to spaces 6&5&4&2………………………………………..84
vii
Figure 4.19 Closeness relationship between (3&6), (3&5), (3&4) and (3&2)……………….84
Figure 4.20 Location neighbors to spaces 6&5&4&3&2…………………………………….85
Figure 4.21 Closeness relationship between (1&6), (1&5), (1&4), (1&3) and (1&2)……….85
Figure 4.22 Final relationship diagram of example 1………………………………………...86
Figure 4.23 Relationship chart for ED layout design in case study...………………………...94
Figure 4.24 Exclude the closeness relationship between spaces 3 & 1………………………96
Figure 4.25 Exclude the closeness relationship between spaces 3 & 7………………………97
Figure 4.26 Exclude the closeness relationship between spaces 3 & 6………………………98
Figure 4.27 Exclude the closeness relationship between spaces (3&5) and (3&2)…………..99
Figure 4.28 Exclude the closeness relationship between spaces (6&10)……………………100
Figure 4.29 Exclude the closeness relationship between spaces (3&8)……………………..101
Figure 4.30 Exclude the closeness relationship between spaces (1&4)……………………..102
Figure 4.31 Exclude the closeness relationship between spaces (1&12)……………………103
Figure 4.32 Exclude the closeness relationship between spaces (5&11)……………………104
Figure 4.33 Location of triage area in the layout of case study……………………………..106
Figure 4.34 Location of Entrance/Reception area in the layout of case study……………...107
Figure 4.35 Location of Resuscitation area in the layout of case study…………………….108
Figure 4.36 Location of Treatment area in the layout of case study………………………...109
Figure 4.37 Location of Buffer area in the layout of case study…………………………….110
Figure 4.38 Location of Waiting area in the layout of case study…………………………..111
Figure 4.39 Location of Clinical support facilities in the layout of case study……………..113
Figure 4.40 Location of Decontamination area in the layout of case study………………...114
Figure 4.41 Location of Assessment area in the layout of case study………………………115
Figure 4.42 Location of Security room in the layout of case study…………………………117
Figure 4.43 Location of Staff support facilities in the layout of case study………………...118
Figure 4.44 Location of Diagnostic area in the layout of case study………………………..120
Figure 4.45 ED Functional Relationship diagram…………………………………………..121
Figure 4.46 Predictive simulation framework………………………………………………125
Figure 4.47 Basics of Simulation Modeling ……………………………………………......128
Figure 4.48 Creating the Recourse in Simulation Modeling (Patient arrival flow)………....129
Figure 4.49 Create the activities of the process in Simulation Modeling …………………..129
Figure 4.50 Entities Routing step in Simulation Modeling ……………………………...…130
Figure 4.51 The diagram identifies the process of case study ……………………………...132
Figure 4.52 The Simulation Model of MDH ED……………………………………………134
Figure 4.53 The percentage of patients entering each area versus waiting time……………136
Figure 4.54 Combinations of capacity versus waiting time……………………………........141
Figure 4.55 Improved MDH ED Layout Design Using Simulation Software………………145
Figure 4.56 Queue waiting time improvement before entering area 1 and area 2…………..146
viii
ACKNOWLEDGEMENT
I would like to take this opportunity to thank all those who have contributed
directly or indirectly to this thesis.
First and foremost my big thanks go to my supervisor Prof. Dr. Bassel
Tawfiq, who gave me the opportunity to pursue the research. I appreciated his
guidance, encouragement and the helpful discussions. The work presented here
would certainly not have been accomplished without his influence and support.
From my supervisor, I have learned a great deal about problem solving and
presentation of the results of my research work.
Thanks to the supervisor Dr. Bassem Ouda for his extensive comments on
the thesis proposal and for being truly helpful during all the stages and phases
of this study.
I would also like to express my deep thanks to Eng. Ahmed Algohary for his
tireless help at the time it was needed most and for his important discussions.
Last but not least, I would also like to thank Eng. Neven, Eng.Ne’mat, and
all of the CASBEC people, especially Eng. Yassin and Eng. M.Assem for thier
generous support.
1
ABSTRACT
Motivation: Disability of emergency department (ED) to provide high qualitymedical treatment to a huge number of victims in disaster situation leads tohigh mortality rate is the main motivation for this study. Such an increase in thenumber of patients creates overcrowding, forcing the patient to have to waitlong times for treatment. Prolonged patient waiting times lead to death,permanent disability, or long treatment duration.
In recent years, there have been numerous publications proposing solutionsfor ED overcrowding published by recognized professional organizations. In1995, the world health organization (WHO) issued a publication illustrates theguiding principles for triage in the disaster site. National Health Service (NHS)and Australasian College for Emergency Medicine (ACEM) providedguidelines in complete constituent spaces of the emergency department, in2003 and 2007 in order. In 2008, Erik M. W. Kolb and others presented a newconstruction called “Patients Buffer” which is more efficiently organizedwaiting periods for patients in the ED during overcrowding. The main objectiveof this study is making an ED design reduces the overcrowding as possible.
This study has two targets; the first is to construct an ED design in a flexiblemanner commensurate with the possibilities of the hospital, reducesovercrowding and achieves the speed of movement within the ED duringdisaster. This is by using Computerized Relationship Layout Planning(CORELAP) Algorithm which maximizes closeness between ED spaces andeach other to reach the design for the maximum optimality. The second is toimprove the performance of an existing design. Using simulation software tohelp demonstrate, predict, and measure system strategies for efficient andoptimized performance. Simulation software improves the ED performance byanalyzing the impact of new ideas, rules, and strategies before implementationon live entities, without causing disruptions in ED service and without cost ofexperimentation.
The results are tow layouts; the first shows a new construction layout designfor ED in a manner conducive to overcoming the overcrowding consequencesas possible, and the second is improved layout decreases the patient’s waitingtime to receive treatment by 82%. Finally, we are not claiming that this is thebest design for ED, but we can consider it as a step on the road towards betterED design.
2
Chapter One
INTRODUCTION
1.1. Disasters
There is a range of impacts a community can experience that increase inseverity along a continuous scale. As the seriousness increases these mishapsbecome emergencies that involve more people, as victims and as responders.Finding the threshold between emergencies and disasters depends on the abilityof the community to deal with the event.
Every community has some coping resources to deal with accidents andemergencies. Coping resources are the individual and community skills,materials, equipment or services that can be used to meet the demands createdby an incident.
The health care sector forms an important part of coping resources, from theself-administered treatments available at a pharmacy or a walk-in clinic,through the emergency medical services and hospital emergency departments,to the special care provided by other tertiary healthcare services [1].
Other coping resources can include municipal departments, emergencyservices, private companies, volunteers and other formal or informal sources.However, these resources may be very limited and not capable of meeting allthe demands created by a larger scale hazard impact.
Disasters occur when an impact exceeds the community’s normal copingresources. Disasters require communities to take extraordinary measures toapply resources effectively and to gain access to additional resources to preventor limit further damage.
The way of understanding disasters can also mean that the same event, forinstance the same depth of snowfall, may be a disaster for one community butnot for another, better prepared community [1].
3
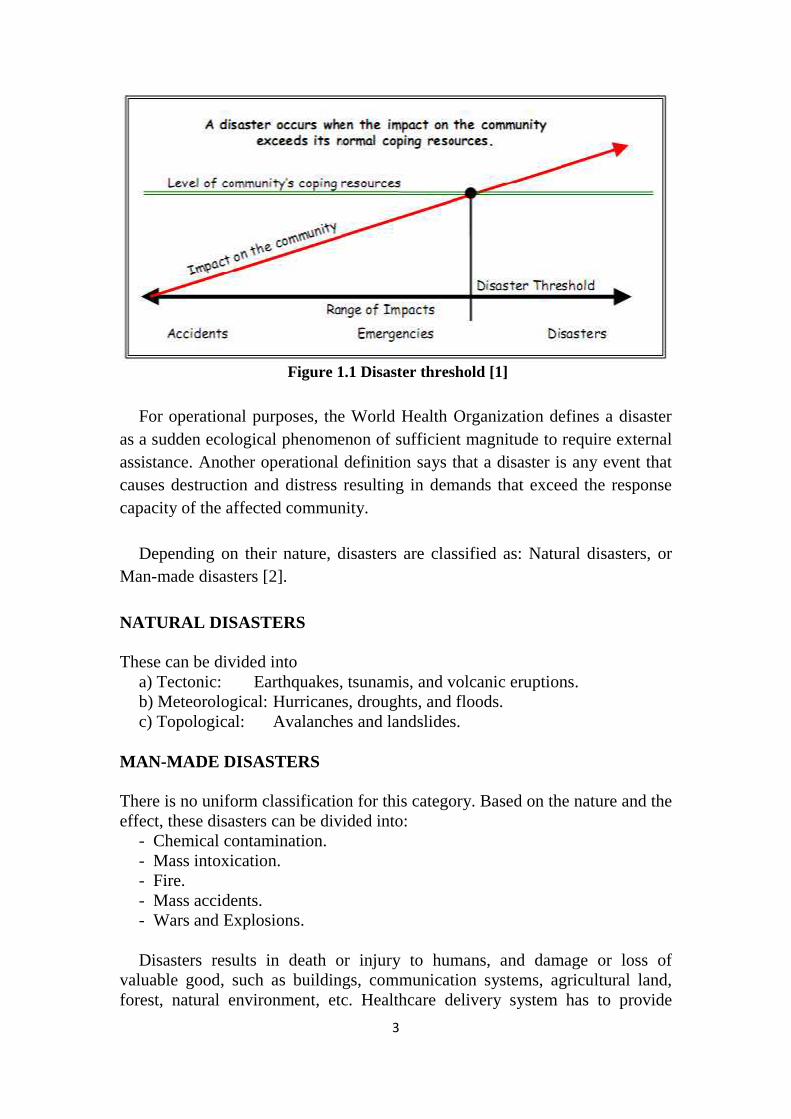
Figure 1.1 Disaster threshold [1]
For operational purposes, the World Health Organization defines a disasteras a sudden ecological phenomenon of sufficient magnitude to require externalassistance. Another operational definition says that a disaster is any event thatcauses destruction and distress resulting in demands that exceed the responsecapacity of the affected community.
Depending on their nature, disasters are classified as: Natural disasters, orMan-made disasters [2].
NATURAL DISASTERS
These can be divided intoa) Tectonic: Earthquakes, tsunamis, and volcanic eruptions.b) Meteorological: Hurricanes, droughts, and floods.c) Topological: Avalanches and landslides.
MAN-MADE DISASTERS
There is no uniform classification for this category. Based on the nature and theeffect, these disasters can be divided into:
- Chemical contamination.- Mass intoxication.- Fire.- Mass accidents.- Wars and Explosions.
Disasters results in death or injury to humans, and damage or loss ofvaluable good, such as buildings, communication systems, agricultural land,forest, natural environment, etc. Healthcare delivery system has to provide
4
medical facilities to a large number of patients [2]. Health Sector managementplays an important role in reducing mortalities.
Whilst there is natural overlapping in the different types of health care, thedistinctions between Primary, Secondary and Tertiary Health Care are veryimportant to properly understand the role and necessity for health servicesprovider. Where there are detectable breakdowns in health service delivery,failure to grasp the importance of each level of health care can usually be seenas the causative factor [3].
Primary health care, a basic level of health care that includes programsdirected at the promotion of health, early diagnosis of disease or disability, andprevention of disease. Primary health care is provided in an ambulatory facilityto limited numbers of people, often those living in a particular geographic area.It includes continuing health care, as provided by a family nurse practitioner[4].
Secondary health care, an intermediate level of health care that includesdiagnosis and treatment, performed in a hospital having specialized equipmentand laboratory facilities [5]. Secondary care is the service provided by medicalspecialists who generally do not have first contact with patients [6].
Tertiary health care, a specialized, highly technical level of health care thatincludes diagnosis and treatment of disease and disability, specialized intensivecare units, advanced diagnostic support services and highly specializedpersonnel are usually characteristic of tertiary health care. It offers highlycentralized care to the population of a large region [7]. It is usually on referralfrom primary or secondary medical care personnel [8]. Tertiary health caresector includes emergency departments.
A disaster situation for a healthcare facility occurs when the need formedical treatment overwhelms the actual treatment capacity. A disastersituation may also be defined as the point of using normal standard operatingprocedures is useless [9].
1.2. Overview on Emergency Department
Healthcare is a rapidly developing industry that faces many challenges. Themain issue in the healthcare is characterized by patient waiting time inemergency department. An Emergency Department (ED), also known asAccident & Emergency (A&E), Emergency Room (ER), Emergency Ward(EW), or Casualty Department is a medical treatment facility, specializing inacute care of patients who present without prior appointment, either by theirown means or by ambulance. The ED is one of the few systems where seconds
5
can be critical to the patient’s life. The ED operates around the clock andreceives different number of patients with various symptoms and degrees ofseverity.
ED is a vital element for any hospital, providing a wide variety of medicalservices around the clock. Typically, an ED is designed to provide high qualitymedical treatment, with the immediate availability of critical resources to thepatients in need of urgent care. However, it has been observed that patientsoften rely on the ED for minor health problems [10].
Hospital Emergency Department (ED) offer a wide variety of medical careincluding prompt attention to critically ill patients, delivering rapid care for lessurgent patients, and the treatment of injuries from trauma incidents. Theprimary role of the ED is the treatment of patients who are critically ill orinjured. However, the ED provides care to a significant number of non-criticalpatients often due to the lack of capacity for their care in other parts of hospital.The ED also serves as the referral site for other providers to evaluate andstabilize patients and admit them, when necessary [10].
The ED is a core clinical unit of a hospital, its function is to receive, triage,stabilize and provide emergency management to patients who present with awide variety of critical, urgent and semi urgent conditions whether self orotherwise referred. The ED also provides for the reception and management ofdisaster patients as part of its role within the disaster plan of each region.
In addition to clinical areas, emergency departments require facilities for thefollowing essential functions:
• Teaching• Research• Administration• Staff amenities
Hospital-based emergency departments (EDs) have evolved during therecent years to provide not only acute emergency care but also safety net carefor indigent patients, public health surveillance, disaster preparedness,observation and procedural care, and in many cases, primary health care.Despite these expanding services, ED resources, including the overall numberof ED facilities, beds within those facilities, and funding, have not increasedcommensurately. As a result, ED overcrowding is occurred.
6
ED overcrowding is a common medical care issue in the countries. One ofmajor causes of ED overcrowding are holding patients waiting in the ED forinpatient unit admission where they block critical ED resources [12]. Acuteillness and traumatic injuries happen at any time; often an ED is the onlysource of emergency medical care. Unfortunately, many EDs around the worldare crowded on a daily basis. Sometimes an ED stay can last up to eight hoursbecause of ED crowding. This problem has been recognized since the early1990s.
Overcrowding has dramatic consequences, although an ambulance with apatient is indeed near a particular hospital, it may have to be diverted to ahospital far away, because the initial ED was full. This is called “diversionstatus” of the overcrowded hospital. Frequently, hospitals in an area go ondiversion status simultaneously. This leads to higher mortality rates for thosediverted patients [12].
1.3. Emergency Department Patients Classification
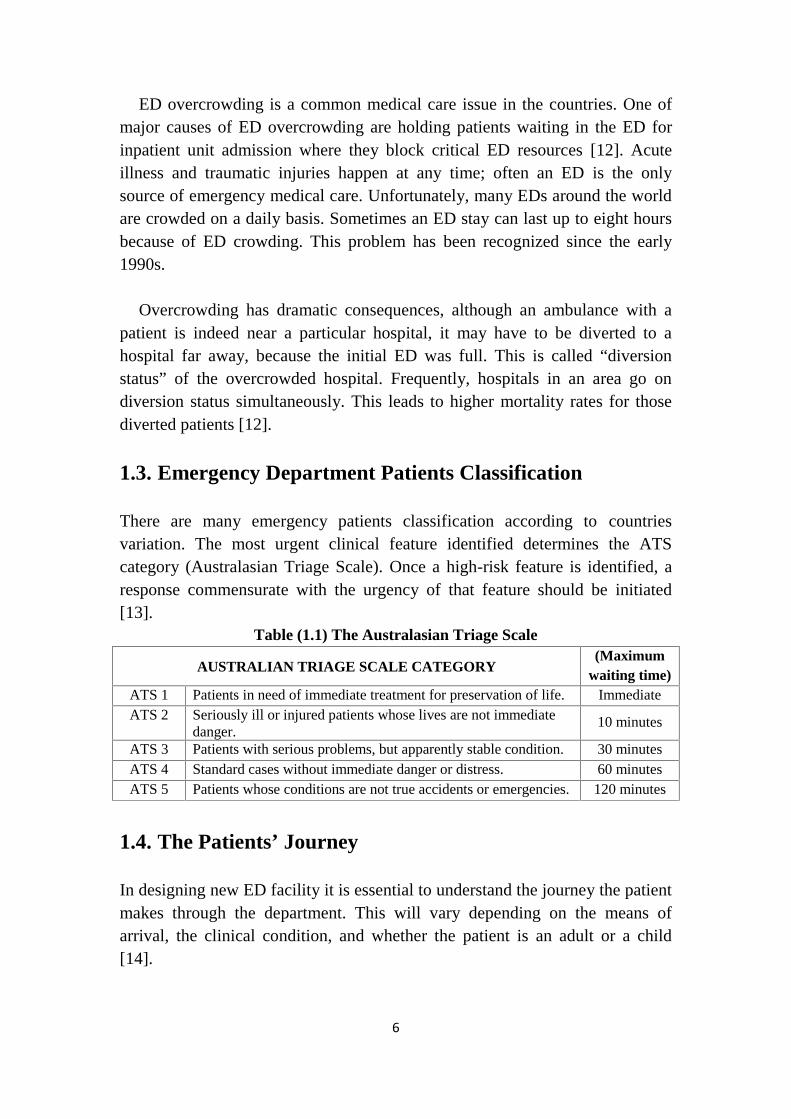
There are many emergency patients classification according to countriesvariation. The most urgent clinical feature identified determines the ATScategory (Australasian Triage Scale). Once a high-risk feature is identified, aresponse commensurate with the urgency of that feature should be initiated[13].
Table (1.1) The Australasian Triage Scale
AUSTRALIAN TRIAGE SCALE CATEGORY(Maximum
waiting time)ATS 1 Patients in need of immediate treatment for preservation of life. ImmediateATS 2 Seriously ill or injured patients whose lives are not immediate
danger.10 minutes
ATS 3 Patients with serious problems, but apparently stable condition. 30 minutesATS 4 Standard cases without immediate danger or distress. 60 minutesATS 5 Patients whose conditions are not true accidents or emergencies. 120 minutes
1.4. The Patients’ Journey
In designing new ED facility it is essential to understand the journey the patientmakes through the department. This will vary depending on the means ofarrival, the clinical condition, and whether the patient is an adult or a child[14].
7
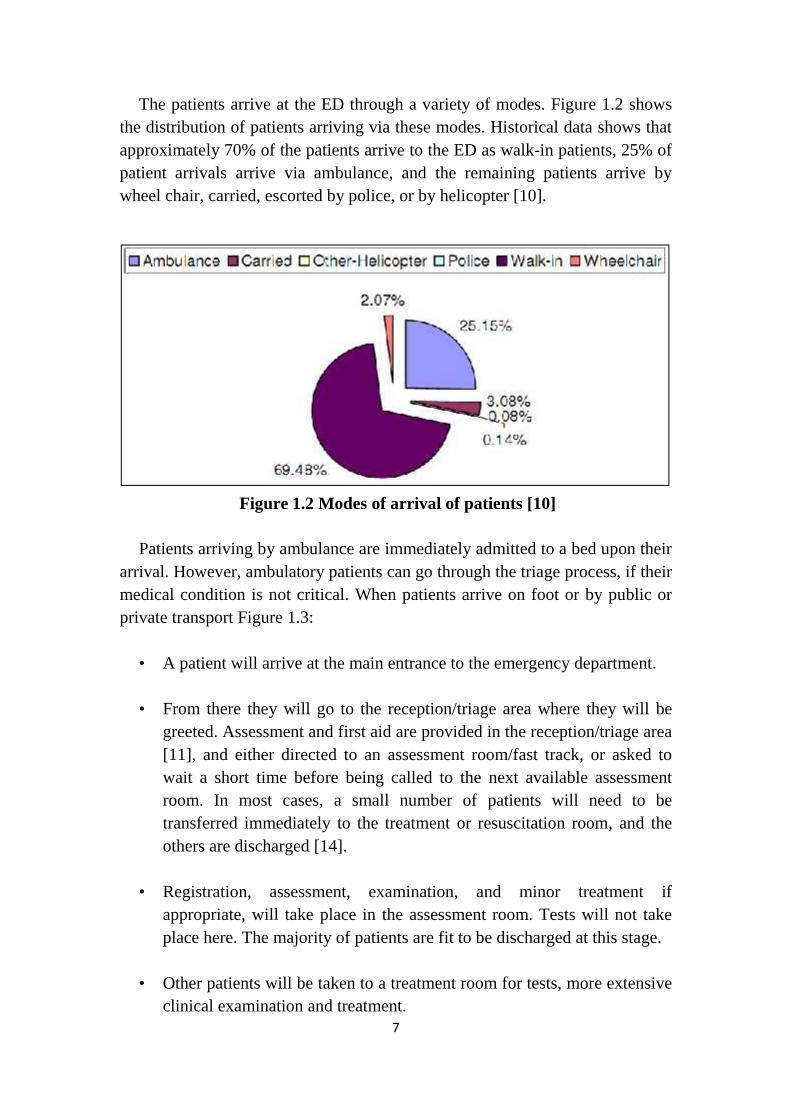
The patients arrive at the ED through a variety of modes. Figure 1.2 showsthe distribution of patients arriving via these modes. Historical data shows thatapproximately 70% of the patients arrive to the ED as walk-in patients, 25% ofpatient arrivals arrive via ambulance, and the remaining patients arrive bywheel chair, carried, escorted by police, or by helicopter [10].
Figure 1.2 Modes of arrival of patients [10]
Patients arriving by ambulance are immediately admitted to a bed upon theirarrival. However, ambulatory patients can go through the triage process, if theirmedical condition is not critical. When patients arrive on foot or by public orprivate transport Figure 1.3:
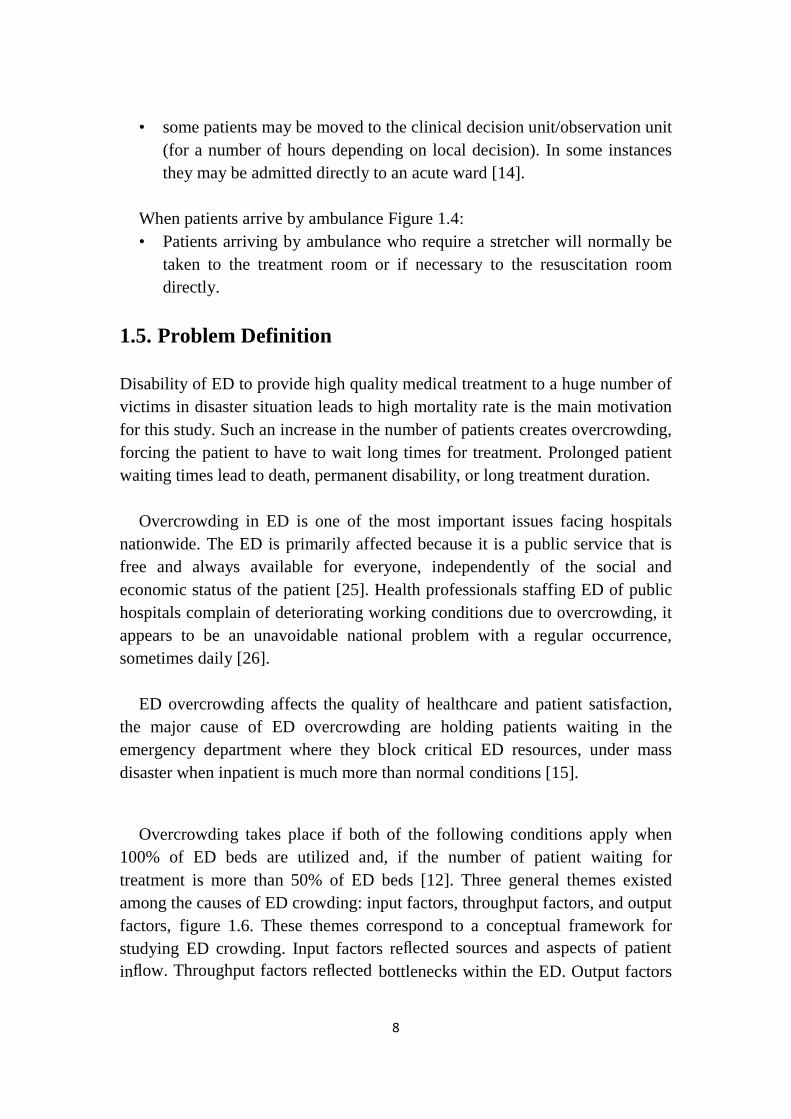
• A patient will arrive at the main entrance to the emergency department.
• From there they will go to the reception/triage area where they will begreeted. Assessment and first aid are provided in the reception/triage area[11], and either directed to an assessment room/fast track, or asked towait a short time before being called to the next available assessmentroom. In most cases, a small number of patients will need to betransferred immediately to the treatment or resuscitation room, and theothers are discharged [14].
• Registration, assessment, examination, and minor treatment ifappropriate, will take place in the assessment room. Tests will not takeplace here. The majority of patients are fit to be discharged at this stage.
• Other patients will be taken to a treatment room for tests, more extensiveclinical examination and treatment.
8
• some patients may be moved to the clinical decision unit/observation unit(for a number of hours depending on local decision). In some instancesthey may be admitted directly to an acute ward [14].
When patients arrive by ambulance Figure 1.4:• Patients arriving by ambulance who require a stretcher will normally be
taken to the treatment room or if necessary to the resuscitation roomdirectly.
1.5. Problem Definition
Disability of ED to provide high quality medical treatment to a huge number ofvictims in disaster situation leads to high mortality rate is the main motivationfor this study. Such an increase in the number of patients creates overcrowding,forcing the patient to have to wait long times for treatment. Prolonged patientwaiting times lead to death, permanent disability, or long treatment duration.
Overcrowding in ED is one of the most important issues facing hospitalsnationwide. The ED is primarily affected because it is a public service that isfree and always available for everyone, independently of the social andeconomic status of the patient [25]. Health professionals staffing ED of publichospitals complain of deteriorating working conditions due to overcrowding, itappears to be an unavoidable national problem with a regular occurrence,sometimes daily [26].
ED overcrowding affects the quality of healthcare and patient satisfaction,the major cause of ED overcrowding are holding patients waiting in theemergency department where they block critical ED resources, under massdisaster when inpatient is much more than normal conditions [15].
Overcrowding takes place if both of the following conditions apply when100% of ED beds are utilized and, if the number of patient waiting fortreatment is more than 50% of ED beds [12]. Three general themes existedamong the causes of ED crowding: input factors, throughput factors, and outputfactors, figure 1.6. These themes correspond to a conceptual framework forstudying ED crowding. Input factors reflected sources and aspects of patientinflow. Throughput factors reflected bottlenecks within the ED. Output factors
9
reflected bottlenecks in other parts of the health care system that might affectthe ED.
Figure 1.3 Ambulatory patient journey [14]