Embed Size (px)
Citation preview

Optimal Disclosure and Operational Risk: Evidence from
Hedge Fund Registration
Stephen Brown, William Goetzmann, Bing Liang, Christopher Schwarz1
First Draft: May 11, 2006, Current Draft: January 8, 2007
Abstract
Required disclosure is a regulatory tool intended to allow market participants to assess manager risks without constraining manager actions. We use the recent controversial and ultimately unsuccessful SEC attempt to increase hedge fund disclosure to examine the value of disclosure to investors. By examining SEC mandated disclosures filed by a large number of hedge funds in February 2006, we are able to construct a measure of operational risk distinct from market risk. Leverage and ownership structures as of December 2005 suggest that lenders and hedge fund equity investors were already aware of hedge fund operational risk characteristics. However, operational risk has no effect on the flow-performance relationship, suggesting that investors either lack this information, or they do not regard it as material. These findings suggest that any consideration of disclosure requirements should take into account the endogenous production of information within the industry, and the marginal benefit of required disclosure on different investment clienteles. JEL Classification: G2, K2 Keywords: Hedge funds, operational risk, SEC filing, Form ADV
1 Stephen Brown is the David S. Loeb Professor of Finance at New York University Stern School of Business, William Goetzmann is the Edwin J. Beinecke Professor of Finance and Management, Yale School of Management, Bing Liang is Associate Professor of Finance, Isenberg School of Management, University of Massachusetts. Christopher Schwarz is a doctoral candidate in Finance, University of Massachusetts. We acknowledge the very extensive comments of the editor and referee, and thank Yong Chen, Mila Getmansky, Tom Fraser, and seminar participants at Babson College, Erasmus University, Hong Kong University of Science and Technology, Lancaster University, London Business School, National Sun Yat-Sen University, the New York Stock Exchange, the 2006 European Finance Association Meetings, Singapore Management University, the University of Massachusetts at Amherst, the University of North Carolina, the University of Vienna, and the CISDM 2006 Annual Conference for useful comments. This research was supported in part by a grant from INQUIRE UK. Please direct all email correspondence to [email protected].

Optimal Disclosure and Operational Risk: Evidence from
Hedge Fund Registration
First Draft: May 11, 2006, Current Draft: January 8, 2007
Abstract
Required disclosure is a regulatory tool intended to allow market participants to assess manager risks without constraining manager actions. We use the recent controversial and ultimately unsuccessful SEC attempt to increase hedge fund disclosure to examine the value of disclosure to investors. By examining SEC mandated disclosures filed by a large number of hedge funds in February 2006, we are able to construct a measure of operational risk distinct from market risk. Leverage and ownership structures as of December 2005 suggest that lenders and hedge fund equity investors were already aware of hedge fund operational risk characteristics. However, operational risk has no effect on the flow-performance relationship, suggesting that investors either lack this information, or they do not regard it as material. These findings suggest that any consideration of disclosure requirements should take into account the endogenous production of information within the industry, and the marginal benefit of required disclosure on different investment clienteles. JEL Classification: G2, K2 Keywords: Hedge funds, operational risk, SEC filing, Form ADV

1
I. Introduction Required disclosure is an important regulatory tool intended to allow market
participants to assess manager risks without unnecessarily constraining manager actions.
This trade-off between transparency and freedom of activity is particularly relevant for
hedge funds, which rely often rely on proprietary models and positions. As the scale and
influence of hedge funds in the global financial marketplace has grown over the past
decade, and fiduciary U.S. institutions such as pensions funds and endowments have
turned to them for enhanced returns, regulators have increasingly sought ways to protect
investor interests without limiting manager strategies.2 One approach has been to require
registration and mandate disclosure of information about the enterprise and its personnel,
as opposed to information about portfolio positions and activities. In the ongoing
dialogue over the pros and cons of hedge fund activity, the U.S. Securities and Exchange
Commission (SEC) in particular has tried to walk a fine line between allowing the
invisible hand of the market establish the level and type of disclosure demanded of
investment managers, while at the same time seeking to require a minimum framework of
transparency with respect to operational risk. The debate over hedge fund registration and
disclosure requirements highlights the critical role of regulators in financial markets. The
U.S. hedge fund industry originally developed as a result of regulatory exemptions for
investment managers who served a limited number of sophisticated clients.
A recent attempt to bring them within the purview of SEC regulation affords an
opportunity to test whether mandated disclosure—at least for one sector of the investment
industry—has value as a public good or is simply costly and redundant. In this paper we
2 According to Lipper TASS Inc., hedge fund assets under management have doubled over the last five years to over $1 trillion in December 2005.

2
test the potential value and materiality of operational risk and conflict of interest
variables disclosed by a large number of hedge funds in February 2006. We find that
operational risk indicators are conditionally correlated to conflict of interest variables,
indicating a potential value of disclosing such conflicts to investors. Operational risk
factors are also correlated to lower leverage and concentrated ownership, suggesting that
the 2006 disclosure requirements may have been redundant for lenders and equity
investors in hedge funds. In contrast, operational risk factors had no ex-post effect on the
flow-performance relationship, suggesting that investors either lack this information, or
they do not regard it as material.
The results of our analysis thus provide a framework for the cost-benefit analysis
of regulatory disclosure. Our findings suggests that any consideration of disclosure
requirements should take into account the endogenous production of information within
the industry, and the marginal benefit of required disclosure on different investment
clienteles.
A. Background
On December 2, 2004, the SEC adopted a new rule and rule amendments under
the Investment Advisers Act of 1940 that would require hedge fund managers to register
as investment advisers by February 1, 2006. Prior to the new requirements, only a small
number of managers, generally of large hedge funds, were required to be registered as
investment advisers with the SEC. To comply with the new requirements, hedge fund
managers were required to file Form ADV with the SEC and to comply with a variety of
additional regulatory requirements. Form ADV is a regulatory filing that is required of all

3
types of fund managers, including hedge fund managers, mutual fund managers, and
separate account managers, who fall under the definition of "investment adviser" in the
Investment Advisers Act. However, on June 23, 2006, the U.S. Court of Appeals for the
District of Columbia Circuit vacated the rule changes that had required many newly-
registered hedge fund managers to register as investment advisers under the Investment
Advisers Act. After the rule changes were vacated, far fewer hedge fund managers are
now required to be registered as investment advisors.
As a result, the February 2006 ADV filings by a large number of hedge fund
managers present a rare opportunity to examine the fundamental question of whether
such disclosure is necessary or warranted. Prior to February 2006, some hedge fund
managers, particularly managers of large funds, had been registered, however the
February 2006 filings made a much larger and less biased sample available. The Form
ADVs for this larger sample contain a wealth of information, previously unavailable for
many managers, about fund characteristics such as potential conflicts of interest and past
legal and regulatory problems. Both of these relate directly to the stated purpose of the
disclosure which is “deterrence of fraud,” “keeping unfit persons from using hedge funds
to perpetrate fraud,” and “adoption of compliance controls,” or more generally the
avoidance of operational risk.3
By relating the Form ADV disclosures to fund characteristics, we are able to
obtain a quantifiable measure of operational risk that is distinct from market risk. We can
then examine whether in fact the Form ADV filing requirement provides material
information to investors seeking to mitigate this measure of operational risk. The
3 These quotations and further discussion can be found in the SEC proposed rules http://www.sec.gov/rules/final/ia-2333.htm

4
alternative hypothesis is that the marketplace has already effectively disseminated this
information through other means, ranging from networks of informal contacts, to fee-
based due-diligence research services or through investing in funds of hedge fund
intermediaries who perform the due diligence on the investor’s behalf. In other words, are
Form ADV filings simply redundant and expensive, or do they provide valuable,
otherwise inaccessible information to participants in the market for hedge fund services,
thus helping them avoid investing in potentially fraudulent firms?
This analysis provides an interesting insight into the mechanics of the information
disclosure hypothesis, which suggests that the market in other contexts rewards those
firms that voluntarily submit to SEC disclosure requirements.4 Consistent with this
argument, we find evidence that the information in the form has the potential to add value
to the investor decision-making process. Hedge funds operated by managers filing Form
ADV in 2006 had better past performance and had more assets than those operated by
managers who did not file either because they were technically exempt from the filing
requirement, or because they simply chose not to file. This result suggests that filing
alone may be a potential signal of quality.5 In addition, we find a strong positive
association between potential conflicts identified in the Form ADV filing and past legal
and regulatory problems. Finally, through a canonical correlation analysis, we are able to
establish a link between potential conflicts identified in Form ADV filings and
4 This model has been developed to explain the premium awarded to foreign firms that choose to register in the United States and submit themselves to stringent SEC disclosure requirements (see Cantale, 1996; Doidge, Karolyi & Stulz, 2004; Fuerst, 1998; and Moel, 1999) 5 Interestingly enough, we could not find a filing in February for Amaranth Advisors LLC, which failed in September. We could not find the exemption under which they failed to file. This might be a case where failure to file would have been highly informative to the investors in funds managed by Amaranth.

5
operational risk characteristics in the Lipper TASS, Inc. (TASS) database. This allows us
to establish a time series of operational risk for each fund in that database.
To examine whether Form ADV disclosure provides material information for
investors concerned about operational risk, we use both hedge fund capital structure and
the time-series of investment flows. We hypothesize that equity and debt investors in
hedge funds are able to distinguish among funds with differing potential for operational
risk given the pre-ADV information available from research services and available
databases. Consistent with this theory, we find that funds with past legal and regulatory
problems have a more concentrated management structure and less average leverage than
their “non-problem” counterparts. This suggests that some market participants, such as
equity fund investors and prime brokers extending credit, are able to distinguish problem
from non-problem funds.
We next test the proposition that the fund investors themselves are able to
distinguish problem from non-problem funds. To do so, we use the well-known flow-
performance relationship. All things being equal, the information redundancy hypothesis
implies that problem funds with good performance should experience lower net inflows
than non-problem funds with good performance. We find no evidence that this is so.
Taken together, these results suggest that the evidence relating to the information
disclosure hypothesis is mixed. Financial institutions and well informed investors may
already have the information contained in the Form ADV filing through the normal
process of due diligence. Individual investors, however, may not have access to this
information. This supports the argument that hedge fund disclosure may help level the
informational playing field. On the other hand, we cannot exclude the possibility that

6
these investors have access to this information and choose not to act on it. The bottom
line is that mandatory disclosure of operational risk factors has the potential to benefit
smaller investors, but, to the extent it shifts the due diligence costs (and compliance risk)
from the existing information providers to the hedge funds themselves, it may or may not
benefit larger investors.
Although the role of regulation in the investment industry is our primary focus,
the empirical analysis also yields other interesting results. The premise of mandated
information disclosure is that it helps to mitigate the fundamental problem of agency. We
find evidence that agency issues are potentially important determinants of hedge fund
performance and hedge fund capital structure.
The rest of the paper is organized as follows. Section II describes the ADV filing
and reviews literature on operational risk. Section III describes the data from the SEC and
TASS. Section IV presents the testing hypothesis and the empirical results. Finally,
Section V concludes with a summary of our major findings.
II. Form ADV, Operational Risk and Related Research
The 2004 SEC investment adviser rule amendments referred to above required,
among other things, that any hedge fund manager based in the United States with more
than 14 clients, assets of at least $25 million and a lockup period less than two years,6 as
well as any internationally based fund with at least 14 U.S. based investors, file Form
ADV7 with the SEC. Form ADV is the same form used by all investment advisers. It
6 The two-year lockup period provision was included for the purpose of excluding venture capital and private-equity firm managers from the filing requirement; however, hedge fund managers have been lengthening their lockups to two years to avoid the filing requirement. See http://www.businessweek.com/magazine/content/04_52/b3914039_mz011.htm. 7 http://www.sec.gov/rules/final/ia-2333.htm.

7
contains information about potential conflicts of interest, both internal and external, any
past regulatory or legal problems of both the hedge fund management company and any
of its related advisors and a wealth of specific ownership data. Prior to the 2004 rule
changes, a smaller set of managers, mostly of large hedge funds, were required to be
registered as investment advisers with the SEC.8 These rule changes were strongly
opposed by hedge fund managers, who argued that filling in the 35-page form was
unnecessarily costly and burdensome.9
Although onerous, Form ADV requests information potentially highly relevant to
assessing the operational risk of the investment manager. The International Association
of Financial Engineers defines operational risk as “losses caused by problems with
people, processes, technology, or external events.”10 More specifically, these include the
risks of failure in the internal operational, control and accounting systems, failure of the
compliance and internal audit systems and failure of personnel oversight systems—i.e.,
employee fraud and misconduct. For example, losses due to rogue traders (e.g., Barings,
National Australia Bank and Allied Irish Bank11) and failures due to management fraud
(e.g., Enron), and reputational injury such as the 2004 mutual fund timing scandal (e.g.,
8 These limited hedge fund filings have already been used by academic researchers; Brunnermeier and Nagel (2004) use these filings to analyze the actions of hedge funds during the technology bubble. 9 According the Phil Goldstein, the hedge fund manager who successfully challenged the requirement in court, Form ADV “asked for everything from ‘your last small-pox vaccination to every dirty joke you got on E-mail’”(Wall Street Journal June 28, 2006). Though this may be something of an exaggeration, the SEC estimated in advance of the rule changes that registration would cost around $45,000, and this does not account for the requirement to hire compliance officers, who command between $200,000 and $750,000 (Wall Street Journal June 8, 2005), not counting the cost of purchasing software to better monitor trading, establishing policies governing their practices and filing required forms with the SEC. This cost would disproportionately affect smaller funds. 10 INTERNATIONAL ASSOCIATION OF FINANCIAL ENGINEERS, Report of the Operational Risk Committee: Evaluating Operational Risk Controls, CONCLUSIONS AND FINDINGS ON THE TOPIC OF: “How should firms determine the effectiveness of their operational risk controls?”, November 2001, www.iafe.org. 11 The management failures associated with the rogue trading losses at National Australia Bank are well documented (APRA, 2004; PWC 2004). Allied Irish Bank experienced a loss of almost $700 million due to trading losses by one trader. See http://en.wikipedia.org/wiki/AIB_Group.
8
Putnam) can all be thought of as operational risk events. These are distinct from market
risk such as, for example, Long Term Capital Management’s failure due to credit
exposure. Market risks are presumably measurable using quantitative risk models while
operational risk has no direct numerical proxy. The challenge is to quantify this factor.
Practitioner studies reveal that half of all hedge fund failures occur through operational
risk events rather than taking excessive market risk (and losing).12
Operational risk assessment often relies upon intangible variables. Assessing
personnel risk is perhaps the most difficult. Historical behavior and current opportunity
are both potentially important inputs that enter into this assessment. Past manager
behavior may include previous fiduciary decisions, as well as previous legal and
regulatory actions taken against the manager, and any other variable that might be
correlated to the propensity to make future illegal or unethical decisions in one’s own
interests at the expense of a client, partner or lender. Such tendencies are, of course,
partly manageable within an organization through internal control and external
compliance procedures, however the risk of individual fraud is likely to increase with
opportunity. In particular, as potential conflicts of interests between manager and investor
increase, operational risk increases as well, holding control and compliance constant.
Thus, although the questions in Form ADV might seem unduly personal and burdensome
to some, they reflect the fact that measurement and assessment of operational risk,
particularly risk centered on human intent and tendencies to act unethically or illegally, is
12 See, for example, http://capco.com/alternative_investment.html. However, this observation needs to be qualified. A firm in financial distress due to unfortunate investment outcomes might be more likely to cut corners on compliance and experience an operational risk event. We thank Michael Triguboff for this observation.

9
difficult.13 In particular, Form ADV requires disclosure of past criminal charges against
management personnel, including the nature, severity and disposition of past charges. It
also requires disclosure of past regulatory actions taken against the firm or its personnel,
including the regulatory body and the nature of the sanction. It also requires disclosure of
past civil judicial action, past bond action and past arbitration relating to the firm. While
none of these variables in isolation capture personnel-related operational risk, together
they presumably provide evidence of past adverse behavior by the firm or by those the
firm currently employs.
Another key set of variables we study in this paper helps to address conflicts of
interest. This issue has been the subject of considerable research in the setting of
investment banking. Dugar and Nathan (1995) and Michaely and Womack (1999) among
others have examined how investment banking conflicts affect stock analyst
recommendations. They find clients of analysts are more likely to receive positive
coverage. In contrast, Lin and McNichols (1998) find no difference between the
recommendations of analysis when comparing the client and non-client groups. Gompers
and Lerner (1997) find little evidence of conflict of interest in the venture capital
industry; the investment bank’s affiliation to the public offering has no negative impact
on the initial offering’s performance.
A number of variables relating to potential conflicts of interest are required by
Form ADV. In particular, the form asks whether any employee or entity controlled by the
13 Despite being difficult to quantitatively assess, there is ample evidence that operational risk is considered important in the financial marketplace. Fontnouvelle et al. (2003a, 2003b) find that operational losses for banks are large and significant. In fact, the authors find the capital charge for operational risk is often larger than the charge for market risk. Lewis and Lantsman (2005) study the use of unauthorized trading insurance. They find banks and insurance companies value unauthorized trading differently, which has caused a slow adoption of this operational risk insurance product.

10
firm is affiliated with another type of financial institution such as a broker-dealer, mutual
fund or limited partnership. It asks about participation in clients’ transactions, including
proprietary interest in transactions, sales interest in transactions, brokerage discretion,
and custody of client assets. In each of these cases, the potential exists for the manager to
influence client decisions, or make decisions on the client’s behalf that benefit the
manager at the expense of the client.
Another set of variables we examine in this paper relates to the ownership and
governance structure of the hedge fund. Most of the current research on this relationship
focuses on the mutual fund industry, where such information is readily accessible.
Cremers et al. (2005) find that mutual funds with high director share ownership perform
better. Ding and Wermers (2006) find that the ratio of independent directors on mutual
fund boards predicts out-of-sample performance. Khorana and Servaes (2006) find that
out-of-sample performance is correlated with managerial ownership. Although there is
widespread belief in the hedge fund industry that the size of the managerial stake in the
fund is a potential proxy for good governance, such information is not generally available
from hedge fund information vendors and no academic study to our knowledge has been
able to empirically examine this issue. Form ADV requires detailed information both
about direct ownership of the firm and indirect ownership of the firm.
III. Data
We obtain data for this study from two sources. The first is the TASS database
from various time periods. We use the February, 2006 TASS data to match management
companies with the SEC Form ADV filings. The TASS database contains information on

11
4,019 live hedge funds and 2,491 defunct hedge funds, along with their management
companies. Data on individual hedge funds include their returns, assets (in most cases),
lock up period, subscription and redemption periods, indication of a high water mark and
other characteristic data. TASS files also include the management company name and
address. In addition to the February, 2006 TASS dataset, we also use eight previous
TASS datasets. These nine datasets together cover the 1998-2006 period, and allow us to
capture the changes of fund characteristic data over time.
The second major source of data is the SEC investment adviser website.14 Each
Form ADV contains information on an investment adviser. The filing consists of 12 items
and also includes at least three schedules.15 Items 1 through 6 contain descriptive
information on the firm, including its address, structure, number of employees in various
positions and a breakdown of investor types. Items 7 and 8 look at potential conflicts of
interest of the firm. Item 9 examines the custody of various assets while Item 10 looks at
the control persons of the firm. Item 12 provides information to allow the SEC to
examine the effect of the regulation on small businesses.
Item 11 is of particular interest as it identifies any “problems” its management or
related advisory affiliates have, including felonies, investment related misdemeanors or
any agency, SEC, CFTC, or self-regulatory issues. If the firm answers yes to any of the
questions on Item 11, it must also file a Disclosure Reporting Page (DRP), which
expands on the problem identified in Item 11.16 Schedule A includes the direct owners
and executive officers of the firm, Schedule B lists the indirect owners of the firm and
14 See http://www.adviserinfo.sec.gov/IAPD/Content/IapdMain/iapd_SiteMap.aspx, the SEC investment advisor website. 15 There are additional forms if the company has a “problem” as defined later in the paper or if the company also filed with a state agency. 16 In some cases, the amount of information included on the DRP form was limited.
12
Schedule D includes a list of other business locations, other locations of records,
previously non-listed control persons and a list of the limited partnerships in which the
firm participates (see appendix for details).
Form ADV data were downloaded directly from the SEC website and imported
automatically into a useable dataset.17 To identify Form ADV belonging to hedge fund
companies, a two-phase search was implemented. Using the management company
information in TASS, we first searched for the management company listed for each
fund.18 If that search was unsuccessful, we then searched for any unique names that
appeared in the fund’s name. In a majority of cases, the company was identified using
just the management company information.19 Note that since the requirement to register
began on February 1, 2006, our searches only encompassed the live database. To insure
matches, one fund listed in the TASS dataset had to be matched to a fund listed on Form
ADV.20
We identified 879 management companies out of 1,697 listed in TASS, or 51.8%
of the TASS database. These management companies represent 2,299 (57.2%) of the
4,019 live funds in the live TASS database. The unmatched TASS funds include funds
with less than the $25 million in assets (22% of unmatched funds), funds with lockups
17 Data were downloaded in March and April 2006. It is important to note the ADVs are dynamic in that the SEC will update the information on the investment advisor website as soon as new information is available. Thus, the data downloaded in the future will not match exactly the data used in this study. 18 A few of the funds also listed an investment advisor with a different name than the management company. We also included these companies in our search if the management company was not located. 19 We did not explicitly keep track of this breakdown, but estimate that fewer than 15% of all matches were made using the fund name. 20 Some of the ADV filings did not list any funds. In these cases, the name and address of the ADV was used to verify a match.

13
longer than two years (2%), and foreign companies with fewer than 14 U.S. investors
(73%).21
<Insert Table I about here>
Table I provides descriptive statistics for both the matched and live TASS
databases as well as their differences. While the returns and standard deviations of the
matched dataset differ slightly, the Sharpe Ratios of registered funds are significantly
higher than those of the overall TASS dataset. Skewness and kurtosis are also
insignificantly different; however, the autocorrelation of matched funds is significantly
higher, perhaps indicating more illiquid portfolios.22 The average size of the matched
funds, as well as the average minimum investment amount, is also not significantly
different between the matched and total TASS samples.
Several other variables show differences, however. Three liquidity measures—
lockup period, subscription frequency period and redemption frequency period—are all
significantly longer for the matched funds, which may be due to more of the matched
funds being onshore, as onshore funds have more share restrictions. The average high
water mark level is higher for the matched database. Management fees are slightly but
significantly lower for the matched fund sample while incentive fees are significantly
higher. These differences suggest that filing funds are of higher quality than non-filing
funds.
21 As of the beginning of April 2006, we were unable to match around 100 management companies in TASS with U.S. addresses and over $25 million in assets. There are a variety of reasons for these companies not to be registered, including a lockup period change, a reduction in assets or an error in the TASS database. 22 See, for example, Getmansky, Lo and Makarov (2004).

14
IV. Tests and Results
A. Defining “Problem” Funds
In order to examine the relationship between conflict of interest variables and
legal and regulatory problems, we first need to define funds as “problem” funds and
“non-problem” funds. These are reported in Table II.
<Insert Table II about here>
Problem funds are those whose management companies answered yes to any of
the questions on Item 11 in Form ADV while non-problem funds answered no to all
questions on Item 11. Problems covered on Item 11 of the Form ADV include any past
felony or financial related misdemeanor changes or convictions. The form also includes
questions concerning any SEC, CFTC, federal or state agency or other regulatory
disciplinary action as well as civil lawsuits. Of the 2,299 funds in our sample, 368 have
management firms that answered yes to at least one question on Item 11, or
approximately 16.0% of our sample.23 The percentage of funds with problems is not
being driven by only a few management companies; of the 879 management companies,
126 companies, or 14.3%, answered affirmatively to a question on Item 11.
This incidence rate may seem high, but it is actually comparable to the entire
ADV sample. Using all Form ADV data from the SEC website compiled by a third party
company, we were able to determine the problem rate for the entire Form ADV
23 These results were also run excluding fund-of-funds as their structure is different than hedge funds. There are no material differences between those results and the reported results.

15
universe.24 Out of 10,295 ADV registrations, 1,526 indicated some type of problem. This
is 14.8% of all Form ADVs, which is almost identical to the 14.3% of our hedge fund
sample. This is a potentially useful perspective on the relative operational risks in the
hedge fund industry compared to the larger investment management universe—it
supports the contention by the hedge fund industry that its operational problems are no
greater than in other investment management businesses. One possible caveat to this
conclusion is that management companies with associated mutual funds might have a
longer history of regularity scrutiny, which might lead to a higher incidence of violations
and lawsuits. To examine that hypothesis we removed all funds with managers that have
associated mutual fund companies and recalculated Table II. The results were
unchanged.25
Panel A of Table II examines the performance differences and fund characteristics
between problem and non-problem funds. There is no significant difference in terms of
standard deviation or autocorrelation of returns, however both the mean return and the
Sharpe Ratio are significantly lower for funds with a problem.26 This performance
differential in raw returns is somewhat mitigated when returns are adjusted for TASS
style averages.27 Once we trim outliers from the data, the performance differential is no
longer significant at traditional confidence levels. With regard to size, problem funds are,
24 These data were compiled by the company on March 17th, 2006. 25 Liang (2003) indicates that small funds are more likely to suffer auditing problems. The sample here doesn’t contain funds with less than $25 million in assets. Hence, 14.3% could be an underestimate for hedge funds. 26 In unreported results, we removed the first 18 months of returns to control for backfill bias. While the removal of a large number of observations (about 25%) did decrease the power somewhat, the results are in agreement with those reported here and are still significant. This applies both at the overall level and also in the year-to-year context. 27 There is no systematic pattern in the problem fund group that concentrates on one particular style. The numbers adjusted by the style average: Problem funds: Excess Sharpe Ratio = -0.045; Excess average monthly return = -0.049. Non-Problem Funds: Excess Sharpe Ratio = 0.008; Excess average monthly return = 0.010. p-value: Excess Sharpe Ratio = 0.03, Excess average monthly return = 0.14.

16
on average, larger, but the difference is not significant. Problem funds are significantly
older, and their average incentive fee is lower than non-problem funds. High water marks
are also significantly lower for problem funds.
Panel B focuses on external relationships that represent potential conflicts of
interest.28 It reports the frequencies for questions such as whether the manager has a
related broker/dealer, investment company, investment adviser commodities broker, bank
or insurance company, or is the sponsor of an LLP. The frequency with which problem
funds answered yes to these questions is universally higher than for non-problem funds.
For example, while 73.9% of problem funds have a related Investment Adviser, only
41.6% of non-problem funds have the same issue. A similar dispersion exists for whether
the firm has a related investment company—50.3% versus 15.8% for problem and non-
problem funds, respectively. Note all the differences are significant at the 1% level.
Panel C focuses on internal potential conflicts of interest. The variable
AgencyCrossTrans for example, asks whether a broker-dealer buys and sells broker
clients’ securities to advisory clients. Only 2.3% of non-problem funds have this potential
conflict of interest while over 30% of problem funds do. Recommending securities to
clients in which a related party has some ownership interest (RecSecYouOwn) also has a
large difference, with 25% more problem funds exhibiting this conflict. As in Panel B, all
of the differences between problem and non-problem funds are statistically significant at
the 1% level. The striking result of Panels B and C is the strong relationship between
legal and regulatory problems and various measures of internal and external conflicts of
interest. OtherResearch for example is a conflict variable in that it represents services
obtained from a broker-dealer that the fund uses for its transactions. It is strongly 28 There is a high correlation between all of the conflicts of interest variables.

17
significant. It suggests that the potential for conflicts of interest can lead to operational
risk events, as measured by legal and regulatory problems. This may be due to an actual
higher incidence of fraudulent activity by managers of problem funds, or alternatively, it
could be due to the fact that the simple presence of apparent conflicts of interest attracts
more regulatory scrutiny and litigation.
Panel D examines the ownership and capital structure differences between the two
groups. The first part of the panel provides information about the equity ownership of the
firm. Problem funds have a higher number of direct and controlling owners.29
Interestingly, the number of direct owners in the form of non-individual domestic entities
(DirectDomestic) is higher for problem funds than it is for non-problem funds. This
implies that problem firms are more likely to be structured as a venture or partnership
with another institution. It also has the effect of allowing owners to hide their names from
the ownership list, although it does not exempt them from reporting. Finally, the 75%
ownership variable, which is the percentage of owners who own 75% of the company, is
larger for problem funds. Theoretical results suggest that fear of expropriation—one
source of operational risk—will make the management more concentrated rather than less
concentrated.30 These results are confirmed in our data. Problem funds tend to have more
concentrated management. There tends to be one large owner rather than a group of
smaller owners.
29 The definition of a controlling owner is set by the SEC. This is not a flag set by the company itself. 30 See, for example, Morgan (2004), who argues that individuals anticipating an unfair distribution mechanism in the case that the partnership dissolves may be reluctant to enter into the partnership in the first place. This would imply concentration of management when agency costs are extreme. This is an issue particularly in emerging economies. See Almeida and Wolfenzon (2006) and Harvey, Lins and Roper (2004).

18
Panel D also provides information about the debt of the firm. It is well established
that external financing is more problematic where agency costs are extreme. Indeed,
Harvey, Lins and Roper (2004) argue that external debt has an important role to play as a
governance mechanism in such circumstances. It is therefore not surprising to find that
problem firms have lower leverage and less margin than non-problem firms. We
investigate this relationship in more detail below.
Given that an affirmative answer on Item 11 could reflect anything from
involvement in a civil suit to conviction of a felony, it is useful to examine whether the
type of offense makes a difference. Are the differences between problem and non-
problem funds driven by one specific type of violation? To address this question, we
classify the responses on Item 11 into four groups. Group 1 includes managers who
responded affirmatively to being charged or convicted of a felony or a finance-related
misdemeanor. Group 2 includes managers who have had their rights to trade revoked at
some time in the past. Group 3 includes managers with some form of regulatory
violation, including a falsification or fabrication. Group 4 includes managers involved in
a civil suit. These classifications are non-exclusionary; one manager may show up in all
four categories. For the sake of brevity, the results of this analysis are not presented in
table form, however they clearly indicate that the differences between problem and non-
problem funds are not driven by a single category of violation.31
<Insert Table III about here>
31 One potential selection bias in the sample of Form ADV filers is that manages might have been sued simply because their funds had low returns. To examine this, we tested whether the returns to firms in the fourth category (i.e., civil lawsuits) had significantly lower returns than the overall group of problem funds. They did not.

19
The frequency of association between affirmative responses to Item 11 on Form
ADV and affirmative responses to potential conflicts is interesting, but this correlation is
not a direct test of the determinants of problem versus non-problem funds. For example,
one important issue in Table II is that the differences between problem and non-problem
funds may be driven by differences in style or fund type. For instance, perhaps funds-of-
funds attract more regulatory scrutiny, or have a different capital structure simply
because their business is different than that of direct managers. Table III reports the
results of a probit estimation, with the dependent variable being one if the fund is a
problem fund and zero if the fund is a non-problem fund. All models in the estimation
include style dummies (unreported) to control for style differences. Model 1 includes
only the manager and fund characteristic variables. Size is not significant, but the lack of
a high water mark and lower incentive fees are related to a fund having a problem. The
association between past problems and lower incentive fees is interesting in the context
of the redundancy hypothesis because it might indicate that the market rationally
incorporates the information about the fund’s past problems and requires compensation
for future operational risk in the form of lower fees. This relationship is not driven by the
fact that funds-of-funds have lower fees. One of the style categories used for control
purposes in the probit is the fund-of-fund classification.
Model 2 adds the first operational risk variable. The relationship variable is 1 if
the fund has one of the external relationship conflicts of interest listed in Table II, and
zero otherwise. RecSecYouOwn is 1 if the fund recommends securities in which a related
party has an ownership interest, BuySellYourOwn is 1 if the company buys and sells

20
between itself and clients and OtherResearch is 1 if the fund uses external research from
the same broker that executes its trades. The coefficients on all of these variables are
large, positive and statistically significant, indicating a positive relationship between
potential conflicts of interest and legal or regulatory problems.
Model 3 adds two ownership variables to the model and exchanges the
AgencyCrossTrans variable for the BuySellYourOwn variable. AgencyCrossTrans is 1 if
the fund performs agency cross transactions. These two variables are highly correlated,
and unreported results indicate the AgencyCrossTrans variable dominates the
BuySellYourOwn variable. 75% ownership is the percentage of direct owners who own at
least 75% of the company. If there is only one owner, the percentage is 100%, versus 0%
for a company with no large owner. DirectDomestic is the number of domestic entities
listed as direct owners.
The AgencyCrossTrans variable is highly significant and positive, which again
indicates internal conflicts of interest are related to fund problems. The two ownership
variables are also positive and significant. Funds with concentrated management are more
likely to be problem funds, and funds with more domestic corporations listed as owners
are more likely to be problem funds. In the context of the redundancy hypothesis, this
suggests that it may be difficult to find large equity partners to take a significant stake if
you have a checkered legal and regulatory past.32 This finding is potentially useful in
future studies of ownership structure and investment performance, because it implies that
the capital structure of investment partnerships is likely to be endogenously determined,
32 See, for example, Morgan (2004). The problem of the fair division of an ongoing concern is one of the oldest problems in finance. Sylla (2003) quotes a translation of Huygens’ “On Reckoning in Games and Luck,” The quote is an apt one for hedge funds: “Since Gaming is becoming a Trade, I think it fit the Adventurers should be upon the Square.”

21
not only by the technology it employs and the markets in which it trades, but also with
respect to the exposure of the firm to operational risk.
One question one might have regarding the results in the table is whether they are
affected by survival bias. Previous literature has documented a significant failure rate and
survivorship bias in hedge fund returns (see Fung and Hsieh (2000, 2002), and Liang
(2000)). Because the filing requirement for Form ADV and the most recent data from
TASS are from the same time, only live funds filed ADVs. To overcome this limitation,
we supplemented our original dataset with the TASS dataset from February 2005 in the
hope that some funds filed early or voluntarily. We examine which funds from the Live
database in February, 2005 moved to the Defunct database in our original dataset from
February, 2006. After excluding funds with no management information in either dataset,
we found 126 funds that died over the nearly one-year period. While the sample size is
small with only 46 matched funds from TASS (8 problem and 38 non-problem), and
significance levels are thus lower, the results for this select sample of defunct funds were
substantially the same as for the broader sample.33 For robustness, we also performed the
same tests on other sub-samples. We estimated the probit on each of the four sub-
categories of problems identified above. These gave weaker but quantitatively similar
results. We removed managers with a large number of funds to verify that the results are
not driven by a few large managers. They are not. We also removed managers with
affiliated mutual fund companies to see if this had an impact on the results. For this
sample, most of the documented relationships between conflicts and problems in Table
33 We performed a number of additional robustness checks. First, we considered whether more recent legal and regulatory problems were more relevant than older ones. We found this to be the case; the correlation between conflicts of interest and legal and regulatory problems was lower for funds with problems that occurred before 2002. We checked to see if extreme returns were driving results by Winsorizing the top and bottom 1% of returns. Results again were unaffected.

22
III were quantitatively unaffected, although the differences in ownership structure are
attenuated, as expected.
B. Leverage and Operational Risk
One test of the redundancy hypothesis is whether financial institutions such as
prime brokers are able to distinguish between funds with higher and lower operational
risk. To examine this, we explored differences in the leverage of problem and non-
problem funds. In Table II, we noted a significantly different frequency in the reported
use of leverage by problem and non-problem funds. This zero-one variable does not take
into account the degree of leverage, however, nor does it control for fund style. Given the
wide disparity in the market risk of different hedge fund styles, this control is crucial. In
particular, funds-of-funds are less likely to employ leverage, and more likely to be
problem funds.
<Insert Table IV about here>
Table IV reports the results of several tests of the relationship between fund
leverage and measures of operational risk. Panel A reports tests for mean differences in
three leverage measures between problem and non-problem funds. The first [Leveraged]
uses a zero-one variable reported by TASS as the measure of leverage. The second [Avg.
Leverage] is the average fund leverage reported by TASS. The third [Maximum
Leverage] is the maximum leverage of the fund reported by TASS. The test is applied to
all funds in the matched sample, then to a sub-set which excludes funds-of-funds, and

23
finally to a set for which the top 5% in terms of leverage are winsorized. Notice that the
difference in the zero-one leverage variable is largely explained by funds-of-funds. Once
these are excluded from the analysis, the leveraged variable is insignificant, but
differences in average leverage and maximum leverage are both significant at traditional
confidence levels. Winsorizing at the 5% level of leverage shows that the significance is
not driven by outliers.34
Panel B of Table IV reports two multi-variate regressions using different
specifications for operational risk. For each year, we use TASS data to construct an
operational risk measure (z-score).35 This independent variable is calculated using the raw
coefficients from the previous canonical analysis. This procedure is described in more
detail later in the paper (see subsection D). We then perform cross-sectional regressions
to predict leverage, controlling for style differences. Thus, the operational risk score is a
function of contemporaneously observable data, rather than of retrospective 2006 ADV-
disclosed data. The dependent variable in each regression is the average fund leverage.
Both the average leverage and operational risk z-score are updated each year using each
fund’s new values.36 Unreported style dummies, as defined by TASS, and style dummies
using a clustering-based style classification procedure are included to control for style
differences.37 The inclusion of style dummies controls for the average leverage of each
34 These results are not driven by one category. Out of ten style categories, problem funds have lower leverage in seven, approximately the same leverage in two and higher leverage in only one. See Table V. 35 Altman (1968) creates the z-score model to study credit scoring. 36 Prior to 2001, the data from TASS in the average leverage field was not standardized. Data was reported in a variety of specifications and formats. Thus, we were only able to run the analysis for five years. 37 The style classification developed in Brown and Goetzmann (1997) and applied to hedge funds in Brown and Goetzmann (2003) is likely to err on the conservative side by attributing more leverage effects to style than economically justified. To the extent that higher leveraged funds within a style move more together, this classification will potentially group them as an independent cohort. The advantage is that this approach relies on returns and thus is not biased by any systematic misreporting of style.

24
hedge fund style. Thus, for example, if fixed income funds typically used more leverage
than merger arbitrage funds, this would be captured by the style dummies.
The results in Panel B of Table IV clearly show that problem funds and funds
with high operational risk scores constructed from database variables observable at the
time are correlated to differences in leverage. Further, these differences in leverage are
not due to fund style differences, defined in various ways. Although the way that style is
defined (either self-reported or classified by a clustering algorithm) makes a difference in
overall explanatory power, both approaches yield significant coefficients on risk. Table V
shows how leverage differs by fund style. The consistency of the differences in average
leverage across different fund styles is striking. Only one category (equity market
neutral) has significantly higher average leverage for problem funds than for non-
problem funds. In all other categories except for global macro (with less than one percent
problem cases) the average leverage of problem funds is lower.
<Insert Table V about here>
C. Returns and Operational Risk
Up to this point, we have documented strong cross-sectional relationships among
variables disclosed in Form ADV by hedge funds, and have modeled the likelihood of
legal and regulatory problems as a function of incentives, conflict of interest variables
and ownership structure. These tell us little so far about the actual returns to investment.
Table VI reports the result of a regression in which the monthly fund return is the
dependent variable, and the set of explanatory variables includes those identified in the

25
probit as determinants of legal or regulatory problems. As with the probit model, style
dummies are included to control for style differences. Returns are the average monthly
return of the fund over its entire life. Variables that have been previously found to be
related to returns are also used for control purposes; fund size (logassets), the standard
deviation of fund returns (stdev), and onshore (1 if the fund is based in the U.S., and zero
otherwise) are used as controls and a base specification in Model 1. Fund returns are
positively related to all of these variables. Model 2 adds management and fund quality
variables as well as the relationship variable.38
<Insert Table VI about here>
We see that the relationship variable, which is indicative of a potential external
conflict of interest, is negative and significant at the one percent level. These conflict
relationships are related to a 0.085 percent loss of return per month, or just over 1 percent
per year. The last model adds ownership variables while continuing to use the same set of
control variables. The relationship variable, as in Model 2, is negative and significant.
The inclusion of ownership characteristics slightly decreases the coefficient to 0.064
percent per month, or 0.77 percent per year. Since our analysis suggests that ownership
may reflect rational expectations of operational risk, this reduction in significance is not
surprising.
The addition of a domestic entity as a direct owner reduces returns by 0.07
percent per month, or just under one percent per year. Finally, the more concentrated a
38Since find that legal and regulatory problems are associated with leverage, we added average leverage to the regressions. The effect is insignificant and does not affect any results. We do not report these results in Tables VI and VII.

26
fund’s management, the lower the returns. Both of these variables may indicate a lack of
management oversight, an additional layer of protection in case of fraud or the attempt of
management to hide the background of certain owners. Overall, operational risk, as
measured by conflicts of interest and management structure, has a negative affect on
investor returns.
One strong argument to justify the use of related entities for transactions and
internal conflicts is that these provide a means to reduce costs. Although affiliates and
multiple managerial responsibilities for clients may represent potential conflicts of
interest, when used by ethical managers with good operational risk controls, they may
alternatively represent a benefit to investors. Past tests of this proposition have provided
inconsistent results on the question whether conflicts of interest affect financial
performance positively or negatively. Our sample affords an opportunity to further
explore this issue. If the hypothesis of related entities and overlapping services providing
positive benefits in the hands of good managers is correct, we would expect to find
significant differences between problem and non-problem funds with respect to the effect
of conflicts of interest on performance. To examine this, we split the data into problem
and non-problem groups and re-run the model similar to Model 3 in Table VI. As before,
style dummies are included to control for style differences and returns are the average
returns over the life of the fund. The results for the combined model are reported for ease
of comparison, and appear in Table VII.39
39 To examine whether the reported results were an artifact of periods, styles or length of return history, we also considered style mean adjusted returns and a variety of dummies controlling for both style and seasoning, as well as for individual year effects. The (unreported) results from this analysis were almost identical to the results reported in Tables VI and VII.

27
<Insert Table VII about here>
When comparing the results of problem funds to non-problem funds, we perform
a Chow test to determine if the parameter estimates from the two models are the same.
The p-value of the Chow test was less than 0.01, indicating the returns of these two
groups react significantly differently to these variables. Both the relationship variable and
the internal conflict variable are significantly different for problem versus non-problem
funds. The sign on both of these conflict variables is consistent with the hypothesis that
conflicts have the potential to benefit investor returns as well as the potential to harm
them.
Agency theory also makes predictions about the effect of ownership concentration
on performance. Here, a simple linear model may be insufficient to capture predicted
effects. Having a large shareholder with a significant stake in a publicly traded firm
provides benefits to smaller shareholders due to coat-tail effects. However, if the
shareholder is big enough, he or she is able to enjoy all the benefits of control.40 Since
hedge funds are not organized like public corporations, predictions about the sign of the
coefficient on ownership concentration are not clear. We might conjecture that having a
single controlling owner leaves fewer checks on adverse behavior by other owners. On
the other hand, reputational effects might cause such a major stakeholder to act in
shareholders’ best interests. As with the literature of the ownership structure of public
40 For example, Morck, Shleifer and Vishny (1988), Holderness, Krosner and Sheehan (1999) and McConnell and Servaes (1990) find evidence of a non-linear relationship between percentage of insider ownership and Tobin’s Q. Firm ownership structure is of course determined endogenously. Himmelberg, Hubbard and Palia (1999) and Demsetz and Villalonga (2001) test for ownership effects on performance and find none, a result consistent with endogenous capital structure determination. The latter provides a useful summary of related studies.

28
corporations, the ownership structure is, at least to some extent, endogenously
determined. As we found above, endogenous factors influencing capital choice are likely
to extend to the past regulatory and legal problems of the owner, as well as the markets
traded and the technology developed by the firm.
In Table VII, both problem and non-problem funds react the same way to the
existence of an owner with more than 75 percent of firm equity, although the coefficient
is only statistically significant for non-problem funds. Concentrated ownership is related
to lower returns for both samples. The direct domestic corporate variable is significantly
negative for non-problem funds, but is not significant for problem funds. By sorting on
the problem funds, we have already presumably proxied on fund management quality,
and thus, this particular variable loses its ability to predict returns with a sample of
mostly poor quality funds.41
Taken together, these results provide some evidence that potential conflicts are
not universally bad. They support the theory that related entities and overlapping services
have the potential to provide benefits to clients. In other words, lack of constraints may
be used either for good or ill, depending upon the quality and ethics of the manager. The
results further suggest that a simple model of the effects of potential conflicts of interest
41 The problem versus non-problem distention is at the fund advisor level. Therefore, it is possible that not all of the funds for one particular management company are in the problem group. This should not systematically bias our results going forward. However, we also examine two sub-sets of our data to control for this issue. The first sub-set is management companies with five or fewer funds in TASS, and the second is management companies with three or fewer funds. The funds in these management companies would most likely have higher correlations in terms of personnel, and hence, it is more likely all funds would be problem funds. The results are consistent with those reported in the text, although the significance levels drop as a substantial portion of our sample is removed.

29
may be insufficient, and that interaction of these conflicts with legal and regulatory
problems makes a difference.42
D. Observable Proxies for Operational Risk
The results in Tables VI and VII indicate ADV proxies for operational risk are
negatively related to historical returns. They thus represent an important possible
forecasting variable for investors. Although these variables were not reported in publicly
available databases prior to 2006, other variables were. Information such as fund style,
size, age, types of investments and so forth could be obtained from leading data vendors
such as TASS. In this section, we examine the potential for constructing an instrument for
operational risk using these observed variables. This allows us to retrospectively examine
the performance of “problem” funds. In addition, given the most recent court decision
regarding SEC requirements for hedge fund managers to file Form ADV as part of the
registration process, the instrument based on TASS or other databases may be a useful
additional tool going forward with which to assess operational risk. Although many funds
now have the option to de-register, it remains to be seen how many, and what sort of
funds choose to do so. Finally, the observable instrument allows us to examine the extent
to which past publicly available information alone might have been able to capture
operational risk.
To construct the instrument, we use a matched dataset to perform a canonical
correlation analysis using the Form ADV disclosures in 2006 together with TASS
42 In unreported results, we remove the first 18 months of returns to control for backfill bias. The results are in agreement with those reported here. The only change is for the internal conflict, for which the results are no longer significant. However, the signs are consistent with the reported results.

30
variables that have been observed over a number of years.43 We first identify TASS
variables that prior research has shown to be associated with the probability of fund
failure. We then define a linear combination of these variables that maximally correlate
with the cross-section of Form ADV disclosures in February 2006 that match to the
TASS sample. Finally, we use this linear combination to proxy for unobserved Form
ADV information in the years prior to February 2006 using a time-series of TASS fund
characteristics.
<Insert Table VIII about here>
Panel A of Table VIII reports the results of the canonical analysis. Average
monthly returns from the previous year, monthly standard deviation from the previous
year, size at the beginning of the period, fund age and whether or not the fund reports
assets are included in the analysis, as they have been previously related to fund death
(Liang, 2000; Brown, Goetzmann & Park, 2001; Getmansky, 2005). The reported asset
variable is a binary variable with a value of one if the fund reports assets and zero if it
does not. Other characteristic data from TASS, which relate to fund quality, are also
included.
The correlation between the rotation of the TASS and rotation of the Form ADV
variables is 0.41 and is significant at one percent. Hence the TASS variables, while not a
perfect proxy, do have some correlation with a rotation of the Form ADV variables. Also
reported in Panel A are the correlation between the TASS variables and their canonical
43 This canonical correlation procedure was first proposed by Hotelling (1936). A good textbook treatment can be found in Press (1972). For another finance application, see Brown et al. (2002).

31
representation and the correlation between Form ADV variables and their canonical
representation. The Form ADV variables are almost all positively correlated with the
canonical variable, indicating that a higher value has more operational risk.44 Higher
returns, standard deviation and incentive fee are all negatively correlated with the TASS
canonical variable, indicating these are negatively correlated with operational risk. Thus,
the canonical correlation suggests that even though the ADV variables were not publicly
available in the past, the information they capture about operational risk had at least some
observable correlates.
Using the raw coefficients from the canonical analysis, we are able to examine the
historical relationship between returns and an operational risk proxy. Instead of assuming
the TASS characteristic data were static over time, we utilize nine different TASS
datasets45 over a period of nine years to use the most accurate characteristic data related
to each fund at each time period. We use returns from the most recent TASS dataset
however, as they are the most complete and accurate.46
From 1994 to 2005, we compute the canonical coefficient each year using the raw
coefficients from our original analysis on the matched sample. This variable will be
related to the operational risk of the fund as defined by Form ADV. We then regress this
operational risk variable on fund returns and include unreported style dummies to control
for style differences.47 As with the leverage analysis, both TASS and cluster-based style
44 The magnitudes of these correlations are moderate, however. 45 We have a TASS dataset each year from 1998-2006. We use the 1998 dataset for 1994-1997. 46 This procedure would also eliminate much of the backfill bias. If the fund was not included in the TASS dataset for a particular year, the fund was removed from the analysis even if there are now returns for that particular year in the latest return file. 47 Alternative specifications of the canonical analysis were performed, including adjusted returns. These alternative specifications did not change the relationship between operational risk and returns.

32
dummies are used. We begin in 1994 as TASS began keeping defunct funds in their
dataset that year. Panel B of Table VIII reports the results of this analysis.
Over the entire twelve-year history, both specifications result in a negative,
significant z-score coefficient. Hence, just as was found in our limited one-year cross-
sectional sample for 2006, operational risk is negatively related to fund returns. Of the
twelve years, the operational risk variable is negatively related to returns in ten of the
years. The two years in which the variable is positive are 1998, which was an extremely
difficult year for hedge funds due to the Russian debt crisis and the near collapse of the
LTCM, and 2000, when the technology bubble burst. They are also years of great
attrition of hedge funds, which would eliminate ex-post some of the riskiest funds in the
sample—a selection bias that is known to induce a spurious ex-post cross-sectional
relationship between risk and return (see (Fung and Hsieh (2002, 2000), and Liang
(2000)).
These results suggest that while it may be difficult to construct a perfect proxy for
Form ADV conflict variables going forward, in the absence of such filings, there may
still be some capacity to forecast differences in future hedge fund returns based on
observable characteristics. An important caveat is, of course, that return differentials are
not adjusted for market risk.
E. Investor Flows and Operational Risk
In the analysis thus far, we have found evidence that the operational risk variables
in Form ADV filings by hedge fund managers are potentially relevant to expectations
about returns. At the same time, we have also found evidence that equity investors and

33
lenders to problem funds are able to differentiate them from non-problem funds. Problem
funds are more likely to have less average and maximum leverage, and are more likely to
have an owner with an ownership stake greater than 75 percent. These results are
consistent with the redundancy hypothesis, i.e., that, absent Form ADV filings,
information exists that would allow major debt and equity investors to separate funds
along the dimension of operation risk. Our canonical correlation analysis shows one such
separating mechanism that relies upon existing (albeit costly) hedge fund databases. In
this section, we ask whether individual investors are able to differentiate between
problem and non-problem funds absent the Form ADV filing information. We have
already found some evidence consistent with this ability. Problem funds have lower
incentive fees, perhaps because they have to compensate for reputational issues. A more
powerful test of the redundancy hypothesis, however, is to check whether investor flows
respond equally to good performance by problem and non-problem funds.
<Insert Table IX about here>
Table IX reports the results of a flow-performance regression applied separately
to problem and non-problem funds.48 Yearly flow is defined as the percentage change in
assets in a given year, net of asset returns and assuming end of year investment. This is
regressed on the rank for the fund within style, separated into three segments to allow for
High, Middle and Low performance.49 This separation is due to considerable previous
48 See, for example, Sirri and Tufano (1998), or Chevalier and Ellison (1999), who apply this to mutual funds. Agarwal et al. (2006) and Ding et al. (2006) apply this to hedge funds. 49 The results are robust for this specification of performance. We re-ran the analysis splitting the ranks into 4 and 5 groups without any appreciable difference in the results reported in Table IX.

34
evidence in the mutual fund sector that the flow-performance relationship is stronger for
higher-ranked funds. Next we include the operational risk score constructed using the
canonical correlation analysis, and a set of interaction terms taking the product of the
operational risk score with the rank. Note that there is no apparent or significant
difference between the flow-performance and the operational risk score, nor is there a
consistent pattern in the interaction terms. Operational risk factors do not appear to
influence fund flow. The fact that investors do not take these factors into account was the
motivation behind the SEC rule change that mandated disclosure of information material
to a determination of operational risk.
V. Conclusion
The hedge fund industry has enjoyed tremendous growth over the past several
years. This growth led to an in-depth review of hedge fund activities by the SEC, and in
2004, resulted in new rules and rule amendments being adopted that greatly expanded the
number of hedge fund managers required to register with the SEC as investment advisers
and file Form ADV. The SEC argued that Form ADV disclosure was necessary to
provide material information to hedge fund investors concerned about operational risk.
These rule changes were resisted by the hedge fund industry, which argued that the Form
ADV filing requirement was unnecessarily burdensome given that the information
disclosed could be obtained in other ways. Shortly after the first filing date in February
2006, the Federal Courts struck down this filing requirement.

35
By matching every Form ADV filed in February 2006 to the TASS hedge fund
database, we are able to show that these disclosures do indeed contain information that
can be used to measure operational risk. Legal, regulatory and other problems are highly
associated with measures of conflict of interest reported on those forms. However, is this
information material to investors? To answer this question, we examine the hypothesis
that the disclosures provided redundant information to equity investors, lenders and share
investors in hedge funds.
We tested the redundancy hypothesis in several ways. We examined differences
in ownership structure and found that problem funds had a higher likelihood of an owner
with a stake greater than 75 percent, and more indirect ownership. This is consistent with
problem funds having less access to equity capital. We next examined differences in
leverage. Controlling for the effects of style and the issues of retrospective definition of
operational risk, we found strong evidence that problem funds and funds with higher
operational risk tended to have lower average leverage. Since the ownership structures
and degree of leverage predate Form ADV disclosure, we conclude that this disclosure is
not material to well informed capital market participants.
Finally, we test whether hedge fund investors are able to distinguish between
problem and non-problem funds. In contrast to the earlier findings, operational risk
indicators have no influence on the well-documented flow-performance relationship. This
suggests that Form ADV disclosures contain information not generally available to
investors. While registration is not costless, an argument can be made that the
information disclosed is indeed material to investors and that mandatory disclosure would
level the informational playing field. However, mandatory disclosure in February 2006

36
did not help the investors at Amaranth Advisors LLC, the well known hedge fund that
collapsed in September 2006.50 This fund does not appear to have filed Form ADV in
February. Given that Amaranth was not exempt from the filing requirement, failure to file
should have been highly informative. We cannot exclude the possibility that the high net
worth individuals and institutions continued to invest in Amaranth despite knowing all
that there was to know about this company. In other words, disclosure might meet the
stated purpose of providing information that allows investors to avoid operational risk.
However, it might not be material information if investors, having access to this
information, choose not to act upon it.
50 The Wall Street Journal, September 29, 2006.

37
References
Agarwal, V., and N Naik, 2000, “On Taking the Alternative Route: Risks, Rewards and Performance Persistence of Hedge Funds,” Journal of Alternative Investments, 2(4), 6-23. Agarwal, V., Daniel, N. and N. Naik, 2006, “Flows, Performance, and Managerial Incentives in the Hedge Fund Industry,” Working Paper, London Business School. Altman, E., 1968, “Financial Ratios, Discriminate Analysis and the Prediction of Corporate Bankruptcy,” Journal of Finance, 23(4), 589-609. Almeida, H. and D. Wolfenzen, 2006, “A Theory of Pyramidal Ownership and Family Business Groups,” Journal of Finance, forthcoming. Australian Prudential Regulatory Authority (APRA), 2004 Report into Irregular Currency Options Trading at the National Australia Bank 23 March 2004. Aragon, G. O., 2004, “Share Restrictions and Asset Pricing: Evidence from the Hedge Fund Industry,” Journal of Financial Economics, forthcoming. Brown, S. J., and Goetzmann, W. N., 1997, “Mutual Fund Styles,” Journal of Financial Economics, 43(3), 373-399. Brown, S J., Goetzmann, W. N., and R. G. Ibbotson, 1999, “Offshore Hedge Funds: Survival and Performance 1989-1995,” Journal of Business, 72(1), 91-117. Brown, S J., Goetzmann, W. N., and J. Park, 2001, “Careers and Survival: Competition and Risk in the Hedge Fund and CTA Industry,” Journal of Finance, 56(5), 1869-1886. Brown, S J., and W.N. Goetzmann, 1997, “Mutual Fund Styles,” Journal of Financial Economics, 43(3), 373-399. Brown, S. J., Goetzmann, W.N., Hiraki, T., Shiraishi, N. and M. Watanabe, 2002, "Investor Sentiment in Japanese and U.S. Daily Mutual Fund Flows," Working Paper, Yale School Management (http://ssrn.com/abstract=302829). Brown, S. J., and W. N. Goetzmann, 2003, “Hedge Funds with Style,” The Journal of Portfolio Management, 29(2), 101-112. Brunnermeier, M. K. and S. Nagel, 2004, “Hedge Funds and the Technology Bubble,” Journal of Finance, 59(5), 2013-2040. Cantale, S., 1996. “The Choice of a Foreign Market as a Signal,” INSEAD Working Paper.

38
Chan, L., Karceski, J., and J. Labonishok, 2003, “Analysts’ Conflict of Interest and Biases in Earnings Forecasts,” Working Paper, University of Illinois and University of Florida. Chevalier, J. and G. Ellison, 1999, “Are Some Mutual Fund Managers Better than Others? Cross-Sectional Patterns in Behavior and Performance,” The Journal of Finance 54(3), 875. Cremers, K. J. M., Nair, V., 2005, “Governance Mechanisms and Equity Prices,” The Journal of Finance, 60(6), 2859-2875. Cremers, K.J. M., J. Driessen, P. Maenhout, D. Weinbaum, 2005, “Does Skin in the Game Matter? Director Incentives and Governance in the Mutual Fund Industry,” Working Paper, Yale School of Management. Demsetz, H. and B. Villalonga, 2001, “Ownership Structure and Corporate Performance,” Journal of Corporate Finance, 7, 209–233. Ding B. and R. Wermers, 2005, “Mutual Fund Performance and Governance Structure: The Role of Portfolio Managers and Boards of Directors,” Working Paper, SUNY at Albany and University of Maryland. Ding, B., M. Getmansky, B. Liang, and R. Wermers, 2006, “Market Volatility, Investor Flows, and the Structure of Hedge Fund Markets,” Working Paper, University of Massachusetts. Doidge, C., Karolyi, G, and R. Stulz, 2004, “Why are Foreign Firms Listed in the U.S. Worth More?” Journal of Financial Economics, 71(2), 205-238. Dugar, A., and S. Nathan, 1995, “The Effects of Investment Banking Relationships on Financial Analysts’ Earnings Forecasts and Investment Recommendations,” Contemporary Accounting Research, Fall 1995, 131-160. Fama, E. and J. MacBeth, 1973, “Risk, Return, and Equilibrium: Empirical Tests,” Journal of Political Economy, 81, 607-636. Fontnouvelle, P., DeJesus-Rueff, V., Jordan J., and E. Rosengren, 2003a, “Using Loss Data to Quantify Operational Risk,” Working Paper, Federal Reserve Bank of Boston. Fontnouvelle, P., DeJesus-Rueff, V., Jordan J., and E. Rosengren, 2003b, “Capital and Risk: New Evidence on Implications of Large Operational Losses,” Working Paper, Federal Reserve Bank of Boston. Fuerst, O., 1998, “A Theoretical Analysis of the Investor Protection Regulations Argument for Global Listing of Stocks,” Working Paper, Yale School of Management.

39
Fung, W. and D. Hsieh, 2002, “Benchmarks of Hedge Fund Performance: Information Content and Measurement Biases,” Financial Analysts Journal, 58, 22-34. Fung, W. and D. Hsieh, 2000, “Performance Characteristics of Hedge Funds and CTA Funds: Natural Versus Spurious Biases,” Journal of Financial and Quantitative Analysis, 35, 291-307. Getmansky, M., 2005, “The Life Cycle of Hedge Funds: Fund Flows, Size and Performance,” Working Paper, University of Massachusetts. Getmansky, M., Lo, A. W., and I. Makarov, 2004, “An Econometric Model of Serial Correlation and Illiquidity in Hedge Fund Returns,” Journal of Financial Economics, 74(3), 529-609. Goetzmann, W. N., Ingersoll, J. E., and S.A. Ross, 2003, “High-water Marks and Hedge fund Management Contracts,” Journal of Finance, 58(4), 1685-1717. Gompers, P. and J. Lerner, 1997, “Conflict of Interest and Reputation in the Issuance of Public Securities: Evidence from Venture Capital,” Working Paper, Harvard University and National Bureau of Economic Research. Harvey, C., Lins, K., and A. Roper, 2004, "The Effect of Capital Structure When Expected Agency Costs Are Extreme," Journal of Financial Economics, 74, 3-30. Himmelberg, C., Hubbard, R.G., Palia, D., 1999, “Understanding the Determinants of Managerial Ownership and the Link Between Ownership and Performance,” Journal of Financial Economics, 53, 353–384. Holderness, C., Kroszner, R., Sheehan, D., 1999, “Were the Good Old Days that Good? Evolution of Managerial Stock Ownership and Corporate Governance since the Great Depression,” Journal of Finance, 54, 435–469. Hotelling, H. 1936, “Relations between Two Sets of Variables,” Biometrica, 28, 321-377. Khorana, A., H. Servaes, 2004, “Conflicts of Interest and Competition in the Mutual Fund Industry,” Working Paper, London Business School. Lantsman, Y and C. Lewis, 2005, “What is a Fair Price to Transfer the Risk of Unauthorized Trading? A Case Study on Pricing Operational Risk,” Working Paper, The Hartford Financial Services Group and Fitch Risk Management, Inc. Liang, B., 2000, “Hedge Funds: The Living and the Dead,” Journal of Financial and Quantitative Analysis, 35(3), 309-326. Liang, B., 2003, “The Accuracy of Hedge Fund Returns,” Journal of Portfolio Management, 29(3), 111-122.

40
Lin, H. and M. McNichols, 1998, “Underwriting Relationships, Analysts’ Earnings Forecasts and Investment Recommendations,” Journal of Accounting and Economics, 25 (February), 101-128. McConnell, J. and Servaes, H., 1990, “Additional Evidence on Equity Ownership and Corporate Value,” Journal of Financial Economics, 27, 595–612. Michaely, R., and K. L. Womack, 1999, "Conflicts of Interest and the Credibility of Underwriter Analyst Recommendations," Review of Financial Studies, 12(4), 653-686. Moel, A., 1999, “The Role of Information Disclosure on Stock Market Listing Decisions: The Case of Foreign Firms Listing in the U.S.,” Working paper, Harvard Business School. Morck, R., Shleifer, A., Vishny, R., 1988, “Management Ownership and Market Valuation: An Empirical Analysis,” Journal of Financial Economics, 20, 293–315. Morgan, John, 2004, “Dissolving a Partnership (Un) Fairly,” Economic Theory, 23, 909–923. Press, S. J., 1972, Applied Multivariate Analysis. New York: Holt, Rinehart and Winston, Inc. PriceWaterhouseCoopers (PwC), 2004, “Investigation into Foreign Exchange Losses at the National Australia Bank), 12 March 2004. (http://www.nabgroup.com/vgnmedia/downld/pwcreport.pdf) Sirri, Erik and Peter Tufano, 1998, “Costly Search and Mutual Fund Flows,” The Journal of Finance, 53(5), 1589-1622. Sylla, E., 2003, “Business Ethics, Commercial Mathematics, and the Origins of Mathematical Probability,” History of Political Economy 35, 309-337.

41
Table I: Descriptive Statistics of TASS Data
This table presents descriptive statistics for funds whose management companies filed Form ADV and are reported on the TASS database as of 31 December 2005. The cross-section sample mean and median of these descriptive statistics are compared with those of the entire live TASS database as of the same date, together with the difference in sample means and a measure of the significance of the difference. Return is the average return over the life of the fund. Autocorrelation is the 1st order autocorrelation of the fund’s returns. Mfee is the management fee, reported in percent. Ifee is the incentive fee, reported in percent. Min. Invt. is the minimum investment of the fund and Assets are the assets of the fund in millions of dollars Leverage, Margin and High Water Mark are one if the fund uses leverage, uses margin or has a high water mark, respectively. Lockup Period is measured in months. Sub. Freq. is the subscription frequency measured in days and Red. Freq. is the redemption frequency also measured in days.
Matched Funds All TASS Live Funds N Mean Median Std. Dev. N Mean Median Std. Dev. Diff p-value
Return 2282 0.96 0.83 0.79 3998 0.93 0.79 0.88 0.03 0.22 Std. Dev. 2279 2.71 1.99 2.27 3992 2.78 2.06 2.38 -0.07 0.11 Skewness 2270 0.01 -0.05 1.14 3975 0.01 -0.06 1.11 0.00 0.87 Kurtosis 2261 2.62 1.02 6.59 3958 2.57 0.97 6.21 0.05 0.81 Autocorrelation 2240 0.14 0.14 0.20 3919 0.12 0.13 0.20 0.02 0.00** Sharpe Ratio 2279 0.39 0.30 0.72 3992 0.34 0.28 0.59 0.05 0.01* Mfee 2298 1.38 1.50 0.51 4019 1.44 1.50 0.58 -0.06 0.00** Ifee 2298 17.13 20.00 6.18 4019 16.27 20.00 6.87 0.86 0.00** Min. Invt. 2295 1.23 0.50 8.01 4012 3.84 0.40 112.93 -2.61 0.15 Assets 1989 186.64 55.00 427.16 3503 181.11 48.00 439.36 5.53 0.65 Leverage 2298 0.56 1.00 0.50 4019 0.56 1.00 0.50 0.00 0.51 Margin 1733 0.46 0.00 0.50 2938 0.44 0.00 0.50 0.02 0.18 High water Mark 2298 0.80 1.00 0.40 4019 0.76 1.00 0.43 0.04 0.00** Lockup Period 2298 4.36 0.00 6.63 4019 3.55 0.00 7.00 0.81 0.00** Sub. Freq. 2279 36.02 30.00 25.40 3972 34.43 30.00 25.22 1.59 0.01* Red. Freq. 2284 83.00 90.00 85.88 4001 69.21 30.00 75.76 13.79 0.00** **, * significant at one and five percent respectively

42
Table II: Comparison of “Problem” and “Non-Problem” Funds
This table reports cross-sectional means, medians and the difference in means of descriptive statistics for both “Problem” and “Non-Problem” funds in our population of hedge funds filing Form ADV. “Problem” funds are any TASS fund whose management company answered “Yes” to any of the questions on Item 11 of Form ADV. “Non-Problem” funds are all other TASS funds that filed Form ADV. Panel A reports results for performance statistics. Avg Return, Std Dev, 1st Order AC and Sharpe Ratio are the average return of the fund, the standard deviation, the first order autocorrelation and Sharpe Ratio of the fund over its life. Panel B reports results for external conflicts of interest, while Panel C breaks down internal conflict data. Broker/Dealer is 1 if the fund has a related broker/dealer. Investment Comp is 1 if the fund has a related investment company. Investment Adviser, Commodities Broker, Bank, Insurance and Sponsor of LLP are 1 if the fund is related to one of these companies respectively. BuySellYourOwn is 1 if the company buys and sells between itself and clients. BuySellYourselfClients is 1 if a related party buys and sells securities also recommended to the fund. RecSecYouOwn is 1 if the fund recommends securities in which a related party has an ownership interest. AgencyCrossTrans is 1 if the fund performs agency cross transactions. RecUnderwriter is 1 if a related party recommends securities to clients for which they are the underwriter. RecSalesInterest is 1 if a related party recommends securities with a sales interest. OtherResearch is 1 if the fund uses external research. Panels D and E look at fund/manager characteristics and governance/ownership variables, respectively. High Water Mark, Leveraged and Margin are 1 if the fund has a high water mark, uses leverage or uses margin. Direct Owners represents the number of direct owners. Controlling is the number of controlling owners. 75% ownership is the percentage of owners who own at least 75% of the fund. Domestic Direct Corp gives the number of domestic corporations listed as direct owners. Indirect Owners represents the number of indirect owners.
Panel A: Performance Statistics and Fund/Manager Characteristics “Problem” Funds “Non-Problem” Funds N Mean Median N Mean Median Diff p-value Avg Return 365 0.89 0.80 1915 0.98 0.84 -0.09 0.05* Std Dev 363 2.58 1.76 1914 2.73 2.08 -0.15 0.22 1st order AC 358 0.14 0.15 1880 0.14 0.14 0.00 0.92 Sharpe Ratio 363 0.34 0.29 1914 0.40 0.30 -0.06 0.02* AUM ($mm) 334 217.32 59.18 1653 179.96 54.00 37.36 0.20 Age (Years) 367 5.60 4.50 1929 4.96 3.83 0.64 0.01** Min Investment ($mm) 367 0.96 0.50 1926 1.28 0.50 -0.32 0.33 Management Fee (%) 367 1.37 1.50 1929 1.38 1.50 -0.01 0.71 Incentive Fee (%) 367 15.25 20.00 1929 17.49 20.00 -2.24 0.00** High Water Mark 367 0.69 1.00 1929 0.82 1.00 -0.13 0.00** Lockup Period (months) 367 4.00 0.00 1929 4.43 0.00 -0.43 0.21
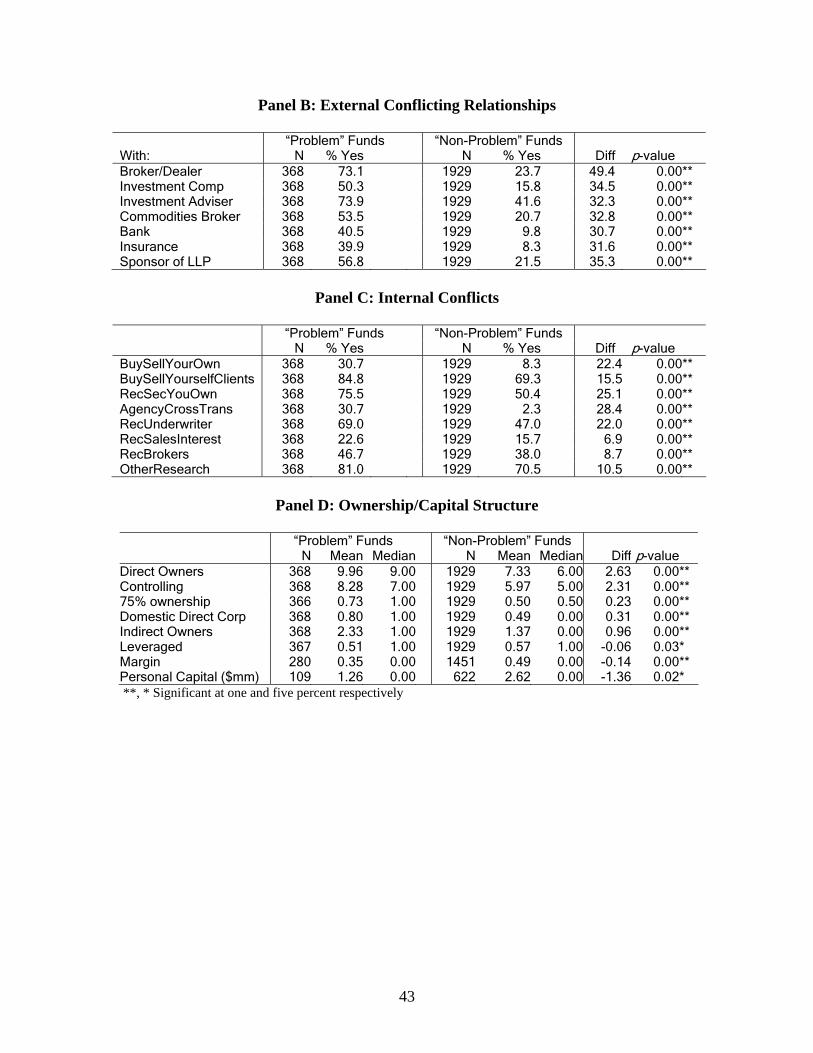
43
Panel B: External Conflicting Relationships
“Problem” Funds “Non-Problem” Funds With: N % Yes N % Yes Diff p-valueBroker/Dealer 368 73.1 1929 23.7 49.4 0.00** Investment Comp 368 50.3 1929 15.8 34.5 0.00** Investment Adviser 368 73.9 1929 41.6 32.3 0.00** Commodities Broker 368 53.5 1929 20.7 32.8 0.00** Bank 368 40.5 1929 9.8 30.7 0.00** Insurance 368 39.9 1929 8.3 31.6 0.00** Sponsor of LLP 368 56.8 1929 21.5 35.3 0.00**
Panel C: Internal Conflicts
“Problem” Funds “Non-Problem” Funds N % Yes N % Yes Diff p-valueBuySellYourOwn 368 30.7 1929 8.3 22.4 0.00** BuySellYourselfClients 368 84.8 1929 69.3 15.5 0.00** RecSecYouOwn 368 75.5 1929 50.4 25.1 0.00** AgencyCrossTrans 368 30.7 1929 2.3 28.4 0.00** RecUnderwriter 368 69.0 1929 47.0 22.0 0.00** RecSalesInterest 368 22.6 1929 15.7 6.9 0.00** RecBrokers 368 46.7 1929 38.0 8.7 0.00** OtherResearch 368 81.0 1929 70.5 10.5 0.00**
Panel D: Ownership/Capital Structure
“Problem” Funds “Non-Problem” Funds N Mean Median N Mean Median Diff p-value Direct Owners 368 9.96 9.00 1929 7.33 6.00 2.63 0.00** Controlling 368 8.28 7.00 1929 5.97 5.00 2.31 0.00** 75% ownership 366 0.73 1.00 1929 0.50 0.50 0.23 0.00** Domestic Direct Corp 368 0.80 1.00 1929 0.49 0.00 0.31 0.00** Indirect Owners 368 2.33 1.00 1929 1.37 0.00 0.96 0.00** Leveraged 367 0.51 1.00 1929 0.57 1.00 -0.06 0.03* Margin 280 0.35 0.00 1451 0.49 0.00 -0.14 0.00** Personal Capital ($mm) 109 1.26 0.00 622 2.62 0.00 -1.36 0.02* **, * Significant at one and five percent respectively

44
Table III: Probit Model Analysis on the “Problem” Variable Probit results are reported in this table. The dependent variable in all models is 1 if the fund has a “problem,” and zero if the fund does not have a “problem.” The model is modeled such that the results aim to fit the “problem” set of data (i.e., 1). Log(Assets) is the log of the assets under management in dollars. High Water Mark is 1 if the fund has a high water mark. Mean Return is the average return over the life of the fund. Incentive Fee is the fund’s incentive fee in percent. Relationship is 1 if the fund has any external conflict of interest listed in Table II. AgencyCrossTrans is 1 if the fund performs agency cross transactions. RecSecYouOwn is 1 if the fund recommends securities in which a related party has an ownership interest. BuySellYourOwn is 1 if the company buys and sells between itself and clients. OtherResearch is 1 if the fund uses external research. 75% ownership is the percentage of direct owners who own at least 75% of the company. Direct Domestic is the number of domestic corporations listed as direct owners. Unreported style dummies were included to control for style differences. Model 1 Model 2 Model 3
coefficient Chi-Sq coefficient Chi-Sq coefficient Chi-Sq
Log(Assets) 0.014 0.49 -0.022 1.08 -0.007 0.00
High Water Mark -0.199 5.36* -0.114 1.49 -0.149 2.31
Mean Return 0.059 1.23
Incentive Fee -0.037 21.44** -0.038 20.29** -0.036 16.82**
Relationship 0.759 66.17** 0.652 44.44**
AgencyCrossTrans 1.400 121.65**
RecSecYouOwn 0.345 17.70** 0.374 19.32**
BuySellYourOwn 0.695 49.38**
OtherResearch 0.294 8.43** 0.226 4.53*
75% ownership 0.551 38.15**
Direct Domestic 0.134 9.60***
Pseudo R-squared 3.89% 16.59% 25.30%
Num Obs 1986 1986 1969
**, * Significant at one and five percent respectively

45
Table IV: Problems, Operational Risk and Leverage Table IV reports the results of several tests of the relationship between fund leverage and measures of operational risk. Panel A reports tests for mean differences in three leverage measures between problem and non-problem funds. The three measures are Leveraged which is a zero-one variable reported by TASS. The second [Avg. Leverage] is the average fund leverage reported by TASS. The third [Maximum Leverage] is the maximum leverage of the fund reported by TASS. The test is applied to all funds in the match sample, then to a sub-set that excludes funds-of-funds and finally to a set for which the top 5% in terms of leverage are dropped from the sample. Panel B reports two multi-variate regressions using different specifications for operational risk. The dependent variable in each regression is the average leverage of each fund as reported by TASS. The independent variable is calculated using the raw coefficients from the previous canonical analysis. Both the average leverage and operational risk z-score are updated each year using each fund’s new values. Unreported style dummies, as defined by TASS, and style dummies using the Brown-Goetzmann style classification procedure are included to control for style differences.
Panel A: Uni-variate Tests All Funds in Matched Sample “Problem” Funds “Non-Problem” Funds
N Mean N Mean Diff p-value Leveraged 367 0.51 1929 0.57 -0.06 0.03** Avg. Leverage 280 52.20 1451 85.31 -33.11 0.00** Maximum Leverage 280 96.82 1451 140.68 -43.86 0.00** Only Hedge Funds “Problem” Funds “Non-Problem” Funds N Mean N Mean Leveraged 271 0.61 1535 0.61 0.00 0.87 Avg. Leverage 225 63.73 1201 95.57 -31.84 0.01** Maximum Leverage 225 118.27 1201 158.80 -40.53 0.04* All Funds in Matched Sample - Winsorized Top 5% “Problem” Funds “Non-Problem” Funds N Mean N Mean Avg. Leverage 280 43.34 1451 65.15 -21.81 0.00** Maximum Leverage 280 81.46 1451 108.33 -26.87 0.00**
Panel B: Canonical Risk Measure Predicting Leverage
Year TASS style Dummies B-G Style Dummies coefficient t-value coefficient t-value
2005 -18.48 -4.17** -6.42 -6.83**
2004 -29.12 -5.92** -35.08 -8.26**
2003 -25.33 -4.90** -33.52 -7.23**
2002 -18.45 -3.50** -27.52 -5.81**
2001 -22.87 -4.17** -28.07 -5.48**
Average -22.85 -11.15** -26.12 -5.08**
Avg. Adj. R-sq. 13.79% 2.66% Avg. Obs. 2279 2279 **, * Significant at one and five percent respectively

46
Table V: Fund Distribution and Leverage by Style
This table reports the breakdown of matches and leverage by style. The first two columns report the percentage of funds in each style for both the entire matched ADV sample and the problem group. The third column reports the average leverage for problem funds in each style while the last column reports the average leverage for non-problem funds in each style. Category Matched Problem Problem Avg. Non-Problem Avg. Convertible Arbitrage 4.22% 7.07% 118.04 170.24Dedicated Short 0.70% 0.00% n/a 72.22Emerging Markets 4.22% 2.99% 0.00 18.60Equity Neutral 6.26% 5.71% 185.31 61.18Event Driven 11.92% 13.59% 51.30 51.37Fixed Inc. Arbitrage 6.05% 3.26% 287.50 415.89Fund of Funds 21.31% 26.09% 6.47 36.04Global Macro 3.57% 0.81% 140.00 134.24Long-Short Equity 34.71% 32.61% 23.85 44.91Managed Futures 3.48% 4.08% 19.34 91.01Multi-Strategy 3.52% 3.53% 40.00 120.70

47
Table VI: Conflicts, Ownership and Fund Returns This table reports regression results with a fund’s monthly mean return as the dependent variable. Log(Assets) is the log of the assets under management in dollars. Std Dev is the standard deviation of a fund’s returns over the life of the fund. Onshore is 1 if the fund is based in the United States. Incentive fee is the fund’s incentive fee in percent. High Water Mark is 1 if the fund has a high water mark. Relationship is 1 if the fund has any external conflicts of interest. Direct Domestic is the number of domestic corporations listed as direct owners. 75% ownership is the percentage of direct owners who own at least 75% of the company. Unreported style dummies were included to control for style differences. Model 1 Model 2 Model 3
coefficient t-value coefficient t-value coefficient t-value
Log(Assets) 0.092 11.50** 0.094 11.80** 0.094 11.78**
Std Dev 0.166 24.26** 0.166 24.19** 0.166 24.27**
Onshore 0.082 2.86** 0.073 2.47* 0.080 2.77**
Lockup Period 0.003 1.32
Incentive Fee 0.004 1.13
High Water Mark 0.061 1.63 0.079 2.27*
Relationship -0.085 -2.85*** -0.064 -2.13*
Direct Domestic -0.070 -4.36**
75% ownership -0.098 -3.23**
Adjusted R-squared 35.27% 35.74% 36.53%
Num Obs 1973 1973 1969
**, * Significant at one and five percent respectively

48
Table VII: Conflicts, Ownership and Returns: Problem vs. Non-Problem Funds This table reports results with “Problem” funds and “Non-Problem” treated separately. As in Table 5, the fund’s mean return is the dependent variable. Log(Assets) is the log of the assets under management in dollars. Std Dev is the standard deviation of a fund’s returns over the life of the fund. Onshore is 1 if the fund is based in the United States. Incentive Fee is the fund’s incentive fee in percent. High Water Mark is 1 if the fund has a high water mark. Relationship is 1 if the fund has any external conflicts of interest. Direct Domestic is the number of domestic corporations listed as direct owners. 75% ownership is the percentage of direct owners who own at least 75% of the company. Unreported style dummies were included to control for style differences. Also unreported is a specification with average leverage in place of Fund Age. Average Leverage was insignificantly related to returns in any of the three samples. “Problem” Funds “Non-Problem”
Funds Combined
coefficient t-value coefficient t-value coefficient t-value
Log(Assets) 0.106 4.81** 0.103 11.53** 0.106 12.77**
Fund Age (Years) -0.027 -2.89** -0.019 -4.23** -0.020 -5.10**
Std Dev 0.162 8.23** 0.179 23.40** 0.176 24.72**
Onshore 0.059 0.84 0.115 3.62** 0.105 3.61**
Incentive Fee -0.005 -0.67 0.007 1.70 0.004 1.04
High Water Mark -0.030 -0.33 -0.008 -0.18 -0.007 -0.17
Relationship -0.655 -5.53** -0.030 -0.91 -0.072 -2.34*
Internal Conflict -0.044 -0.60 0.101 2.58** 0.051 1.50
Direct Domestic 0.011 0.22 -0.078 -4.62** -0.070 -4.35**
75% ownership -0.142 -1.57 -0.087 -2.63** -0.099 -3.23**
Chow test p-value <0.01
Adjusted R-squared 38.46% 38.69% 37.34%
Num Obs 330 1639 1969
**, * Significant at one and five percent respectively

49
Table VIII: Canonical and Time-Series Analysis of TASS and ADV Data This table reports the results of a canonical analysis relating operational risk ADV data to the observable TASS data. Panel A reported the results of the canonical analysis using 2,279 matched funds. Panel B reports regression results from 1994 to 2005 using 9 different TASS datasets. The dependent variable is the yearly return of each. The independent variable is calculated using the raw coefficients from the canonical analysis. This value is updated each year using each fund’s new values. Previous Returns are the average monthly returns from the previous year and Previous Std. Dev. is the monthly standard deviation from the previous year. Age and Size are the values from the end of the previous period. Other characteristic data are from the same period as the analysis. Reports Assets is a binary variable with a value of one if the fund reports assets and zero if it does not. Unreported style dummies were included in Panel B.
Panel A: Canonical Correlation Results TASS Variables ADV Variables Previous Returns -0.27** AgencyCrossTrans 0.06* Previous Std. Dev. -0.35** RelBrokerDealer 0.28** Fund Age -0.07** RelInvestComp 0.24** Log of Assets 0.13** RelInvAdviser 0.24** Reports Assets 0.12** RelCommod 0.44** Incentive Fee -0.88** RelBank 0.38** Margin -0.29** RelInsur 0.44** Audited -0.19** RelPartSponser 0.30** Personal Capital -0.29** BuySellYourOwn 0.08* Onshore -0.05** BuySellYourselfClient -0.08** Open to Inv. 0.08 RecSecYouOwn 0.33** Accepts Managed Accts -0.13** RecUnderwriter 0.26** RecSalesInterest 0.28** RecBrokers -0.33** OtherResearch -0.70** Correlation Between 75% ownership 0.15** TASS and ADV Panels 0.42*** DirectDomestic 0.31**
Panel B: Regression Results - Operational Risk Coefficient TASS Style Dummies B-G Style Dummies Year Coefficient t-value coefficient t-value 1994 -2.55% -3.25** -1.63% -2.53* 1995 -1.12% -1.22 -0.98% -1.26 1996 -2.05% -2.66** -1.02% -1.62 1997 -4.63% -6.07** -3.34% -5.70** 1998 2.61% 3.11** 0.56% 0.86 1999 -5.10% -1.95 -2.33% -1.24 2000 2.76% 3.28** 0.07% 0.12 2001 -1.85% -3.38** -0.94% -2.50* 2002 -3.32% -7.31** -2.07% -6.69** 2003 -6.53% -5.90** -3.39% -4.14** 2004 -2.01% -6.00** -0.25% -1.05 2005 -1.23% -3.39** -0.15% -2.44* Average Value -2.09% -2.61* -1.30% -3.53** Avg. Adjusted R-squared 9.32% 36.77% Average Observations 1,338 1,338 **, * Significant at one and five percent respectively

50
Table IX: Operational Risk and Flow Analysis
Table VIII reports flow results using data from 1994-2005. Flows are computed annually using the following formula:
t t-1 tt
t-1
(Assets - Assets *Return )Flow = Assets
Assets and returns are computed in the fund’s native currency to avoid exchange rate affects. Low Rank, Mid Rank and High Rank are computed as Min(Rankt-1,0), Min(Rankt-1 – Low Rank, 0) and Min(Rankt-1 – Mid Rank – Low Rank, 0), respectively, where Rankt-1 is the percentile level of the previous year’s performance in the fund’s TASS style. Std. Dev. is the previous year’s monthly standard deviation. Flows to Category are the average flow to that fund’s particular style in year t. Log Assets is the log of the previous end of period’s assets and Management Fees is the current management fee level. Operational Risk Z-score is computed each year per the previous specification. Model A includes the operational risk z-score only, whereas Model B also includes three interaction terms. Both models are run using the Fama and MacBeth (1973) framework. Model 1 Model 2
coefficient t-value coefficient t-value
Low Rank 0.596 5.15** 0.634 6.16**
Mid Rank 0.977 6.01** 0.981 6.29**
High Rank 0.905 6.11** 0.886 4.71**
Std. Dev. of monthly returns -0.022 -5.44** -0.023 -6.12**
Flows to Category 0.685 8.44** 0.686 8.32**
Log Assets -0.117 -6.66** -0.118 -6.73**
Management Fees -0.045 -3.71** -0.044 -3.53**
Operational Risk Z-score -0.010 -1.58 0.025 1.00
Low Rank/Z-score interaction -0.019 -0.15
Mid Rank/Z-score interaction -0.202 -1.93
High Rank/Z-score interaction 0.085 0.69
Adjusted R-squared 14.00% 14.16%
Number of Observations 966 966
**, * Significant at one and five percent respectively

51
Appendix: Variable Definitions
Variable Name Num Question on ADV RelBrokerDealer 746 7.A.1 You have a related person that is a broker-
dealer, municipal securities dealer, or government securities broker or dealer
RelInvestComp 489 7.A.2 You have a related person that is an investment company (including mutual funds)
RelInvAdviser 1074 7.A.3 You have a related person that is an other investment adviser (including financial planners)
RelCommod 597 7.A.4 You have a related person that is a futures commission merchant, commodity pool operator, or commodity trading adviser
RelBank 338 7.A.5 You have a related person that is a banking or thrift institution
RelAcct 73 7.A.6 You have a related person that is an accountant or accounting firm
Rellawyer 122 7.A.7 You have a related person that is a lawyer or law firm
RelInsur 327 7.A.8 You have a related person that is an insurance company or agency
RelPension 96 7.A.9 You have a related person that is a pension consultant
RelRealEst 150 7.A.10 You have a related person that is a real estate broker or dealer
RelPartSponsor 643 7.A.11 You have a related person that is a sponsor or syndicator of limited partnerships
BuySellYourOwn 274 8.A.1 Do you or any related person buy securities for yourself from advisory clients, or sell securities you own to advisory clients (principal transactions)?
BuySellYourselfClients 1649 8.A.2 Do you or any related person buy or sell for yourself securities (other than shares of mutual funds) that you also recommend to advisory clients?
RecSecYouOwn 1251 8.A.3 Do you or any related person recommend securities (or other investment products) to advisory clients in which you or any related person has some other proprietary (ownership) interest (other than those mentioned in Items 8.A(1) or (2))?
AgencyCrossTrans 157 8.B.1 Do you or any related person as a broker-dealer or registered representative of a broker-dealer, execute securities trades for brokerage customers in which advisory client securities are sold to or bought from the brokerage customer (agency cross transactions)?
RecUnderwriter 1161 8.B.2 Do you or any related person recommend purchase of securities to advisory clients for which you or any related person serves as

52
underwriter, general or managing partner, or purchaser representative?
RecSalesInterest 385 8.B.3 Do you or any related person recommend purchase or sale of securities to advisory clients for which you or any related person has any other sales interest (other than the receipt of sales commissions as a broker or registered representative of a broker-dealer)?
RecBrokers 905 8.D Do you or any related person recommend brokers or dealers to clients?
OtherResearch 1638 8.E Do you or any related person receive research or other products or services other than execution from a broker-dealer or a third party in connection with client securities transactions?
ReferalComp 1689 8.F Do you or any related person, directly or indirectly, compensate any person for client referrals?
ConvictedFelony 6 11.A.1 In the past ten years, have you or any advisory affiliate been convicted of or plead guilty or nolo contendere ("no contest") in a domestic, foreign, or military court to any felony?
ChargedFelony 8 11.A.2 In the past ten years, have you or any advisory affiliate been charged with any felony?
ConvictedInvMisd 1 11.B.1 In the past ten years, have you or any advisory affiliate been convicted of or plead guilty or nolo contendere ("no contest") in a domestic, foreign, or military court to a misdemeanor involving: investments or an investment-related business, or any fraud, false statements, or omissions, wrongful taking of property, bribery, perjury, forgery, counterfeiting, extortion, or a conspiracy to commit any of these offenses?
ChargedInvMisd 0 11.B.2 In the past ten years, have you or any advisory affiliate been charged with a misdemeanor listed in 11.B(1)? (Question above)
SECFalseStat 25 11.C.1 Has the SEC or the Commodity Futures Trading Commission (CFTC) ever found you or any advisory affiliate to have made a false statement or omission
SECViolation 66 11.C.2 Has the SEC or the Commodity Futures Trading Commission (CFTC) ever found you or any advisory affiliate to have been involved in a violation of SEC or CFTC regulations or statutes?
SECCausedDenyAuth 2 11.C.3 Has the SEC or the Commodity Futures Trading Commission (CFTC) ever found you or any advisory affiliate to have been a cause of an investment-related business having its

53
authorization to do business denied, suspended, revoked, or restricted?
SECOrderAgainst 40 11.C.4 Has the SEC or the Commodity Futures Trading Commission (CFTC) ever entered an order against you or any advisory affiliate in connection with investment-related activity?
SECCivilMoneyPenalty 66 11.C.5 Has the SEC or the Commodity Futures Trading Commission (CFTC) ever imposed a civil money penalty on you or any advisory affiliate, or ordered you or any advisory affiliate to cease and desist from any activity?
AgencyFalseStat 38 11.D.1 Has any other federal regulatory agency, any state regulatory agency, or any foreign financial regulatory authority ever found you or any advisory affiliate to have made a false statement or omission, or been dishonest, unfair, or unethical?
AgencyViolation 170 11.D.2 Has any other federal regulatory agency, any state regulatory agency, or any foreign financial regulatory authority ever found you or any advisory affiliate to have been involved in a violation of investment-related regulations or statutes?
AgencyCausedDenyAuth
7 11.D.3 Has any other federal regulatory agency, any state regulatory agency, or any foreign financial regulatory authority ever found you or any advisory affiliate to have been a cause of an investment-related business having its authorization to do business denied, suspended, revoked, or restricted?
AgencyOrderAgainst 162 11.D.4 Has any other federal regulatory agency, any state regulatory agency, or any foreign financial regulatory authority in the past ten years, entered an order against you or any advisory affiliate in connection with an investment-related activity?
AgencyRevokeLicense 12 11.D.5 Has any other federal regulatory agency, any state regulatory agency, or any foreign financial regulatory authority ever denied, suspended, or revoked your or any advisory affiliate's registration or license, or otherwise prevented you or any advisory affiliate, by order, from associating with an investment-related business or restricted your or any advisory affiliate's activity?
SelfFalseStat 10 11.E.1 Has any self-regulatory organization or commodities exchange ever found you or any advisory affiliate to have made a false statement or omission?
SelfViolation 98 11.E.2 Has any self-regulatory organization or commodities exchange ever found you or any advisory affiliate to have been involved in a violation of its rules (other than a violation

54
designated as a "minor rule violation" under a plan approved by the SEC)?
SelfCausedDenyAuth 11 11.E.3 Has any self-regulatory organization or commodities exchange ever found you or any advisory affiliate to have been the cause of an investment-related business having its authorization to do business denied, suspended, revoked, or restricted?
SelfRevokeLicense 27 11.E.4 Has any self-regulatory organization or commodities exchange ever disciplined you or any advisory affiliate by expelling or suspending you or the advisory affiliate from membership, barring or suspending you or the advisory affiliate from association with other members, or otherwise restricting your or the advisory affiliate's activities?
OtherProfRevoked 0 11.F Has an authorization to act as an attorney, accountant, or federal contractor granted to you or any advisory affiliate ever been revoked or suspended?
Ongoing 58 11.G Are you or any advisory affiliate now the subject of any regulatory proceeding that could result in a "yes" answer to any part of Item 11.C., 11.D., or 11.E.?
CourtEnjoined 17 11.H.1A Has any domestic or foreign court in the past ten years, enjoined you or any advisory affiliate in connection with any investment-related activity?
CourtViolation 31 11.H.1B Has any domestic or foreign court ever found that you or any advisory affiliate were involved in a violation of investment-related statutes or regulations?
CourtDismissed 5 11.H.1C Has any domestic or foreign court ever dismissed, pursuant to a settlement agreement, an investment-related civil action brought against you or any advisory affiliate by a state or foreign financial regulatory authority?
CountOngoing 76 11.H.2 Are you or any advisory affiliate now the subject of any civil proceeding that could result in a "yes" answer to any part of Item 11.H(1)?