Embed Size (px)
Citation preview
This article was downloaded by: [University of York]On: 18 October 2014, At: 08:11Publisher: Taylor & FrancisInforma Ltd Registered in England and Wales Registered Number: 1072954 Registeredoffice: Mortimer House, 37-41 Mortimer Street, London W1T 3JH, UK
Journal of Statistics and ManagementSystemsPublication details, including instructions for authors andsubscription information:http://www.tandfonline.com/loi/tsms20
Optimal human resource allocationmodel: A case study of Taiwan fireserviceChun-Hsiung Lan a , Liang-Lun Chuang a & Yung-Fang Chen ba Graduate Institute of Management Sciences, Nanhua University ,Dalin, Chiayi , 62248 , Taiwan, R.O.C.b Department of Geography, Environment and Disaster Management ,Coventry University , Coventry , CV1 5LW , U.K.Published online: 14 Jun 2013.
To cite this article: Chun-Hsiung Lan , Liang-Lun Chuang & Yung-Fang Chen (2011) Optimal humanresource allocation model: A case study of Taiwan fire service, Journal of Statistics and ManagementSystems, 14:1, 187-216, DOI: 10.1080/09720510.2011.10701550
To link to this article: http://dx.doi.org/10.1080/09720510.2011.10701550
PLEASE SCROLL DOWN FOR ARTICLE
Taylor & Francis makes every effort to ensure the accuracy of all the information (the“Content”) contained in the publications on our platform. However, Taylor & Francis,our agents, and our licensors make no representations or warranties whatsoever as tothe accuracy, completeness, or suitability for any purpose of the Content. Any opinionsand views expressed in this publication are the opinions and views of the authors,and are not the views of or endorsed by Taylor & Francis. The accuracy of the Contentshould not be relied upon and should be independently verified with primary sourcesof information. Taylor and Francis shall not be liable for any losses, actions, claims,proceedings, demands, costs, expenses, damages, and other liabilities whatsoever orhowsoever caused arising directly or indirectly in connection with, in relation to or arisingout of the use of the Content.
This article may be used for research, teaching, and private study purposes. Anysubstantial or systematic reproduction, redistribution, reselling, loan, sub-licensing,systematic supply, or distribution in any form to anyone is expressly forbidden. Terms &

Conditions of access and use can be found at http://www.tandfonline.com/page/terms-and-conditions
Dow
nloa
ded
by [
Uni
vers
ity o
f Y
ork]
at 0
8:11
18
Oct
ober
201
4
*E-mail: [email protected]
Optimal human resource allocation model: A case study of Taiwan fi re service
Chun-Hsiung Lan*
Liang-Lun Chuang
Graduate Institute of Management SciencesNanhua UniversityDalin, Chiayi 62248Taiwan, R.O.C.
Yung-Fang Chen
Department of GeographyEnvironment and Disaster ManagementCoventry UniversityCoventry, CV1 5LWU.K.
AbstractA lack of government fund results in great diff erent ratios of a fi refi ghter to the popula-
tion in major cities in Taiwan. The research proposes to develop an optimal human resource
allocation model to strike the balance between the fi re workforce and responsibilities in
emergency responses. The DEA method is used to evaluate the organizational performance
and determine the production eff iciency of the fi re services in Taiwan. Next, the Omit Re-
source Approach is used to determine eff iciency improvement and resource adjustment to
the fi re department. Last, the research uses the Total Eff iciency-Based Scale Approach to
suggest an ideal human resource allocation model.
Keywords: data envelopment analysis (DEA), omit resource approach (ORA), performance evalua-tion, total eff iciency-based scale approach (TEBSA), resource allocation, fi re department.
1. Introduction
There are three major missions of fi re department, the fi re preven-
tion, the disaster rescue, and the emergency medical service relating to
the people’s lives, and the execution performance of the above-mentioned
Journal of Statistics & Management SystemsVol. 14 (2011), No. 1, pp. 187–216
© Taru Publications
Dow
nloa
ded
by [
Uni
vers
ity o
f Y
ork]
at 0
8:11
18
Oct
ober
201
4
188 C. H. LAN, L. L. CHUANG, AND Y. F. CHEN
missions is one of the indicators on political aff airs [1]. In Taiwan, the fast
growth of economic, the high utilization of lands, the massive centraliza-
tion of population and the establishment of vary factories causing the fi re
missions become more and more arduous and higher danger during the
recent thirty years, that is, overload would make fi refi ghters tiredness
and it also aff ect the organizational performance. In addition, the current
method to allocate fi re manpower is determined by the number of fi re
engines, the number of fi re engines is determined based on the popula-
tion of administrative areas. The current Taiwan fi re aff airs belong to its
associate local government, the fi re service items and standard operation
procedure are all consistent in Taiwan area, but the allocate of the fi re re-
source for each fi re bureau is diff erent due to the diff erent fi nancial con-
ditions in each local government. The new fi re manpower is assigned by
the central government consistently and there is no consistent standard
to be followed. Comparing to other major cities worldwide, the average
fi re manpower per population of 10,000 in Taiwan, 3.92, is signifi cantly
lower than others, it reveals that the job load of fi re manpower in Taiwan
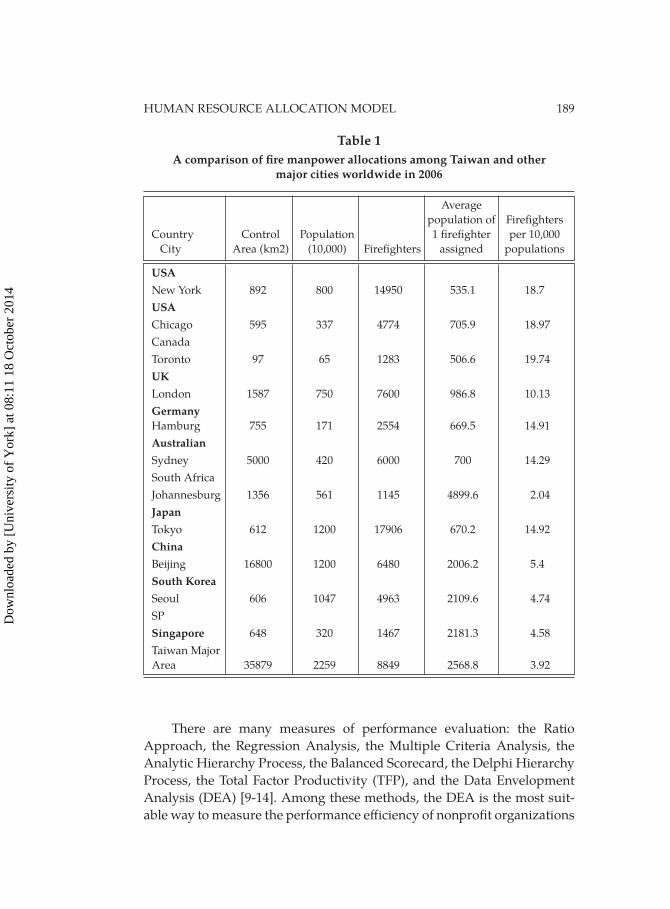
is signifi cant heavy. Table 1 indicates the comparison of fi re manpower
among Taiwan and other major cities worldwide [1-2].
Based upon the economic viewpoint, a better and reasonable fi re
manpower allocation approach is mainly focused on to fi nd out a critical
point on the relationship among the fi re manpower, the disaster rescues,
and the emergency medical services to avoid the waste of social cost by too
much manpower and facilities input, as well as keep suff icient fi re man-
power and facilities for providing the basic safety assurance. Therefore,
facing the increasing disaster rescue cases, the constrained governmental
budget, and the lower level of fi re manpower in Taiwan, how to reasonable
allocate fi re manpower to minimize the gap of other advanced countries
is an important lesson.
In 1978, Hatry pointed out that eff iciency; eff ectiveness and pro-
ductivity are three major parts of performance [3]. Fortuin (1988) placed
the organizational goal in two categories: eff iciency and eff ectiveness [4].
The eff iciency is defi ned as the ratio between input and output [5], and the
eff ectiveness is defi ned as the achieving level of the expected production
output by a production system [6-7]. In fact, eff iciency and eff ectiveness
represent diff erent levels of performance, and there is no guarantee that
both of them can be achieved simultaneously. However, an eff icient orga-
nization must handle both of them well, and use the most eff icient way to
pursue maximum eff ectiveness [8].
Dow
nloa
ded
by [
Uni
vers
ity o
f Y
ork]
at 0
8:11
18
Oct
ober
201
4
HUMAN RESOURCE ALLOCATION MODEL 189
There are many measures of performance evaluation: the Ratio
Approach, the Regression Analysis, the Multiple Criteria Analysis, the
Analytic Hierarchy Process, the Balanced Scorecard, the Delphi Hierarchy
Process, the Total Factor Productivity (TFP), and the Data Envelopment
Analysis (DEA) [9-14]. Among these methods, the DEA is the most suit-
able way to measure the performance eff iciency of nonprofi t organizations
Table 1A comparison of fi re manpower allocations among Taiwan and other
major cities worldwide in 2006
Average
population of Firefi ghters
Country Control Population 1 fi refi ghter per 10,000
City Area (km2) (10,000) Firefi ghters assigned populations
USANew York 892 800 14950 535.1 18.7
USAChicago 595 337 4774 705.9 18.97
Canada
Toronto 97 65 1283 506.6 19.74
UKLondon 1587 750 7600 986.8 10.13
Germany
Hamburg 755 171 2554 669.5 14.91
AustralianSydney 5000 420 6000 700 14.29
South Africa
Johannesburg 1356 561 1145 4899.6 2.04
JapanTokyo 612 1200 17906 670.2 14.92
ChinaBeijing 16800 1200 6480 2006.2 5.4
South KoreaSeoul 606 1047 4963 2109.6 4.74
SP
Singapore 648 320 1467 2181.3 4.58
Taiwan Major
Area 35879 2259 8849 2568.8 3.92
Dow
nloa
ded
by [
Uni
vers
ity o
f Y
ork]
at 0
8:11
18
Oct
ober
201
4
190 C. H. LAN, L. L. CHUANG, AND Y. F. CHEN
because of its multi-indication character. The performance eff iciencies of
fi re organizations have to be reasonably measured by multiple inputs and
outputs, and the function relationship between inputs and outputs are un-
known in advance [15]. In this research, DEA is selected as the measuring
method of performance eff iciencies for fi re organizations because of its
characteristic of multi-indication, and thus the relative eff iciency of each
fi re bureau can be determined by comparing the quantitative data of in-
puts and outputs [16].
The Data Envelopment Analysis (DEA) was proposed from Charnes,
Cooper and Rhodes in 1978. Originally, the DEA is applied to measure
the performance eff iciency of the public or nonprofi t organization [17],
but later is applied to many benefi cial organizations. The model of DEA
is shown by the ratio of output/input and has the same meaning of the
so-called TFP [18]. The DEA is based on the concepts of Pareto Optimal-
ity and Frontier to calculate the relative eff iciencies of the whole decision
making units (DMUs) in order to determine their performances, especially
for the similar decision making units [19-20]. In fact, the DEA uses the
separated programming via the fractional programming and then trans-
fers the process to linear programming in order to fi nd out the values of
the relative eff iciencies for the whole decision making units (DMUs) and
to determine the ineff icient DMUs [17]. This study is trying to measure the
relative eff iciency for each fi re bureau under the double duties of disas-
ter prevention and the security of peoples’ life and property. Besides, not
only can the DEA strengthen the justice on the judgment of performance
eff iciency for each fi re organization and provide an excellent referenced
guideline for the resource allocation of each fi re organization [21], but it
also can off er the new thinking to measure the performance eff iciencies of
fi re organizations.
American “Municipal Fire Service Workbook” points out that to eval-
uate the fi re prevention, the rescue eff iciency, and the performance of the
fi re bureau is to provide a method to evaluate the fi re mission execution
and help the municipal administrators or chief executives of fi re depart-
ments to estimate their own fi re system [22]. There are 25 fi re bureaus
in the Taiwan in every county and city administrative area including
remote/separate area. This research excludes three fi re bureaus in the
remote/separate areas; therefore, only 22 fi re bureaus are left. This study
aims to assess the performance eff iciencies of fi re bureaus by using
22 fi re bureaus of Taiwan as an example. Based upon Taiwan’s policy,
the manpower of the fi re bureau is arranged relative to the population
and the size of the area [23]. According to the Fire Engine, Equipment
Dow
nloa
ded
by [
Uni
vers
ity o
f Y
ork]
at 0
8:11
18
Oct
ober
201
4
HUMAN RESOURCE ALLOCATION MODEL 191
and Manpower Allocation Standards for the Municipality, County and
City [24], if the population is over 50,000, the number of fi re engines is
determined by one engine per 10,000; if the population is between 30,000
and 50,000, the number of fi re engines is determined by one engine per
15,000; if the population is below 30,000, two fi re engines are assigned to
this area. And thus, the manpower of each fi re bureau is determined in
accordance with the number of fi re engines. Every county and city have
to follow this regulation to input its proper manpower and equipment.
The current allocation of fi re protection resources merely considers the
location and its associated response time [25-27]. The resource allocation
for each fi re bureau has no rules to be followed, and the current alloca-
tion depends on the resource distributor; the diff ering characteristics of
the city and country, the governmental budget subsidiaries and the scale
of fi re branch are not considered. Therefore, the current method often
causes a biased assessment of performances. This study tries to consider
the aspects of control area, loadings on fi re duties and government bud-
get in order to establish a reasonable method to assess the performances
of fi re bureaus.
A Two-Staged Design Approach is adopted in The DEA is con-
ducted in the fi rst-stage of this study. The second stage, according to the
future estimated trend of output to select a proper strategy. If the output
trend is steady or decreasing, the suggested strategy is Omit Resource
Approach (ORA), where the solutions of ORA are recommended from
the contribution index of each input item [28]; however, considering the
resource elimination only functions as a temporary solution. In fact, to
establish a reasonable resource allocation standard is the total solution.
This paper tries to propose a better resource allocation approach, Total
Eff iciency-Based Scale Approach- TEBSA. TEBSA not only performs a
reasonable and better allocation scale to help the decision makers, but
also provides a referenced guideline for executing the decision-making
process.
2. Selections of model, input and output items
This study mainly investigates the performance eff iciency for each
fi re bureau; the production function of each DMU is not assumed, and
thus DEA can be chosen as the assessing measure of performance eff i-
ciency. In fact, the DEA includes two diff erent models: CCR (Charnes,
Cooper and Rhodes) model and BCC (Banker, Charnes and Cooper) model
[17; 19]. Both of them have two options-input orientation and output
Dow
nloa
ded
by [
Uni
vers
ity o
f Y
ork]
at 0
8:11
18
Oct
ober
201
4
192 C. H. LAN, L. L. CHUANG, AND Y. F. CHEN
orientation. Because a fi re bureau tries to minimize its input usage of
resources to maintain current performance, this study adopts the input-
oriented model of CCR model to conduct the eff iciency analysis for each
fi re bureau. In 1989, Golan and Roll thought that the selection of input
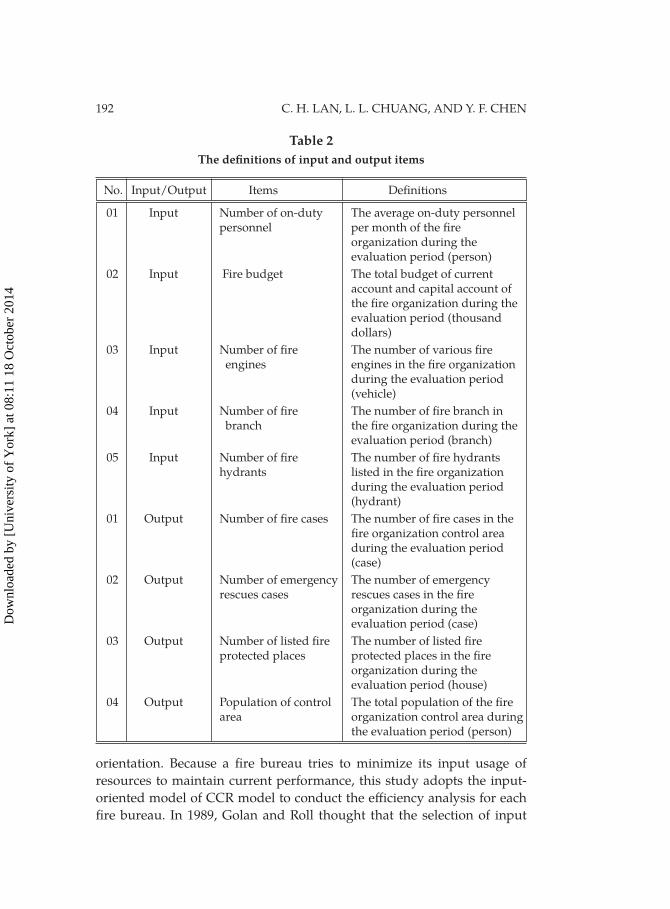
Table 2The defi nitions of input and output items
No. Input/Output Items Defi nitions
01 Input Number of on-duty The average on-duty personnel personnel per month of the fi re
organization during the evaluation period (person)
02 Input Fire budget The total budget of current account and capital account of the fi re organization during the evaluation period (thousand dollars)
03 Input Number of fi re The number of various fi re engines engines in the fi re organization
during the evaluation period (vehicle)
04 Input Number of fi re The number of fi re branch in branch the fi re organization during the
evaluation period (branch)
05 Input Number of fi re The number of fi re hydrants hydrants listed in the fi re organization
during the evaluation period (hydrant)
01 Output Number of fi re cases The number of fi re cases in the fi re organization control area during the evaluation period (case)
02 Output Number of emergency The number of emergency rescues cases rescues cases in the fi re
organization during the evaluation period (case)
03 Output Number of listed fi re The number of listed fi re protected places protected places in the fi re
organization during the evaluation period (house)
04 Output Population of control The total population of the fi re area organization control area during
the evaluation period (person)
Dow
nloa
ded
by [
Uni
vers
ity o
f Y
ork]
at 0
8:11
18
Oct
ober
201
4
HUMAN RESOURCE ALLOCATION MODEL 193
and output items was very important while executing DEA [29]. Generally
speaking, the determination of the input and output items for the DEA
model should be paid more attention. So, the common way to determine
the input and output items is to interview with organization off icers and
then to analyze the organization and management objectives, literature
reviews, and experiences [30].
Therefore, fi ve input items (the number of on-duty personnel, the
fi re budget, the number of fi re engines, the number of fi re branch and
the number of fi re hydrants) and four output items (the number of fi re
cases, the number of emergency rescues cases, the number of listed fi re
protected places and the population of control area) were selected as vari-
ables in this article for assessing the eff iciency. The number of on-duty
personnel, the number of fi re engines, and the number of fi re hydrants
are regarded as the fi re protection resources in a fi re bureau [31]. Besides,
the fi re budget and the number of fi re branch are regarded as the factors
for estimating the response time of the fi re bureau. The defi nition of each
variable is given in Table 2, and the input and output values for each
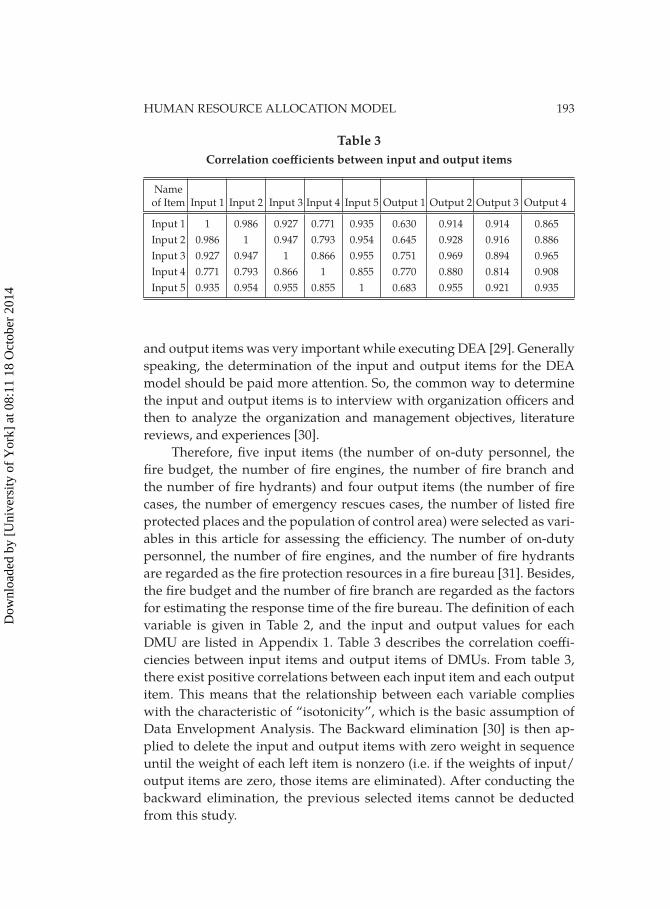
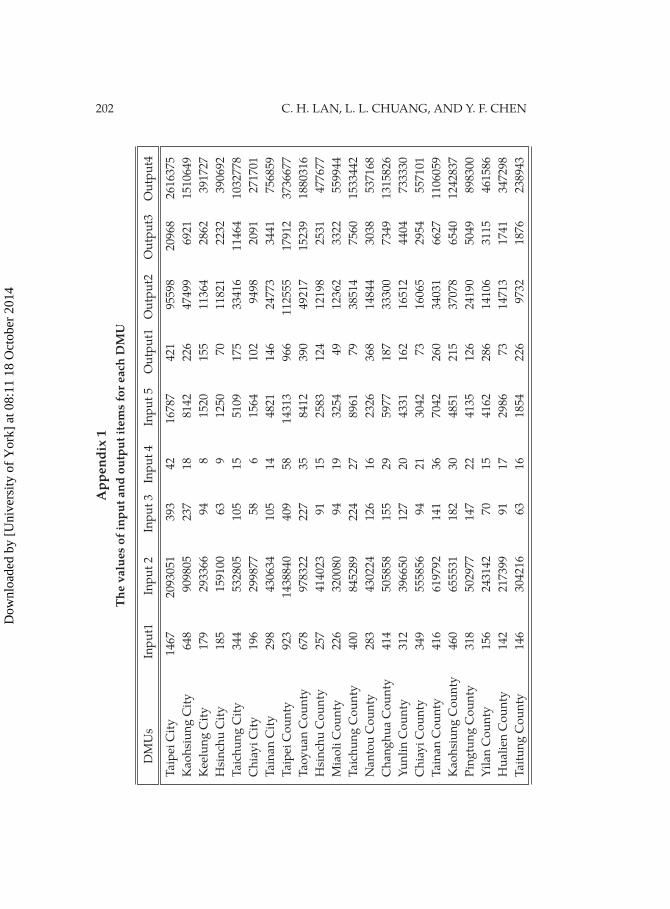
DMU are listed in Appendix 1. Table 3 describes the correlation coeff i-
ciencies between input items and output items of DMUs. From table 3,
there exist positive correlations between each input item and each output
item. This means that the relationship between each variable complies
with the characteristic of “isotonicity”, which is the basic assumption of
Data Envelopment Analysis. The Backward elimination [30] is then ap-
plied to delete the input and output items with zero weight in sequence
until the weight of each left item is nonzero (i.e. if the weights of input/
output items are zero, those items are eliminated). After conducting the
backward elimination, the previous selected items cannot be deducted
from this study.
Table 3Correlation coeff icients between input and output items
Name
of Item Input 1 Input 2 Input 3 Input 4 Input 5 Output 1 Output 2 Output 3 Output 4
Input 1 1 0.986 0.927 0.771 0.935 0.630 0.914 0.914 0.865
Input 2 0.986 1 0.947 0.793 0.954 0.645 0.928 0.916 0.886
Input 3 0.927 0.947 1 0.866 0.955 0.751 0.969 0.894 0.965
Input 4 0.771 0.793 0.866 1 0.855 0.770 0.880 0.814 0.908
Input 5 0.935 0.954 0.955 0.855 1 0.683 0.955 0.921 0.935
Dow
nloa
ded
by [
Uni
vers
ity o
f Y
ork]
at 0
8:11
18
Oct
ober
201
4
194 C. H. LAN, L. L. CHUANG, AND Y. F. CHEN
3. Empirical analysis
The Frontier software was applied to investigate 22 Fire Bureaus in
Taiwan by using the input and output data in 2007 to perform the eff iciency
analysis and potential improvement analysis. The eff iciency analysis is de-
scribed below.
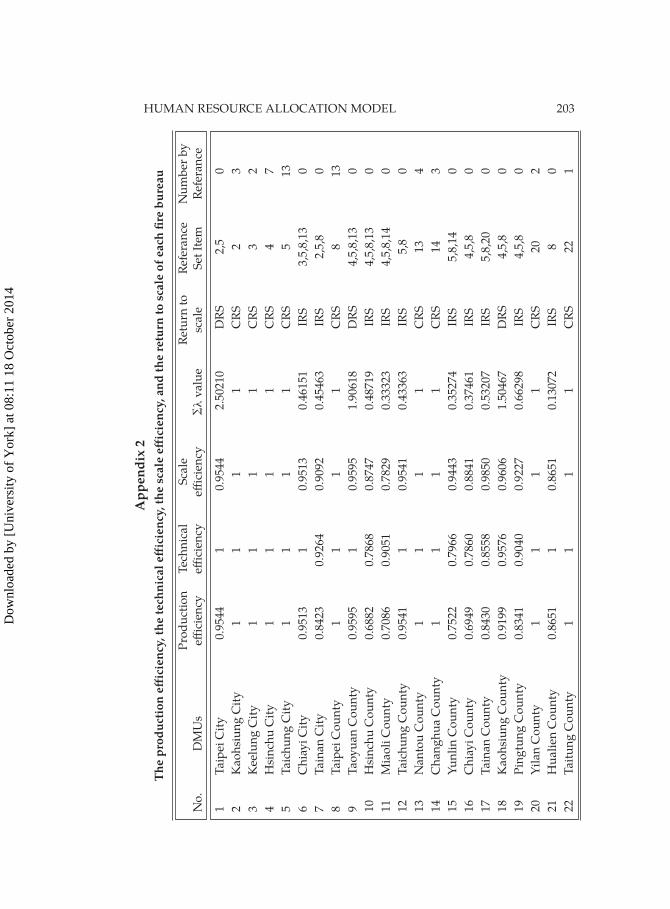
The production eff iciency includes the technical eff iciency and the
scale eff iciency, and thus the production eff iciency, the technical eff iciency,
the scale eff iciency and the return to scale of each fi re bureau in Taiwan
are listed in Appendix 2. For example, the production eff iciency of Yunlin
County fi re bureau is 0.7522, its technical eff iciency is 0.7966 and its scale
eff iciency is 0.9443. It reveals that the production ineff iciency of Yunlin
County fi re bureau mainly comes from its technical factor because its
technical eff iciency (0.7966) is smaller than the scale eff iciency (0.9443).
The entire analysis results of DEA for those 22 fi re bureaus in Taiwan are
described as follows.
The production eff iciencies of 9 fi re bureaus among 22 fi re bureaus
are equal to one, there are 14 fi re bureaus whose technical eff iciencies are
equal to one, the scale eff iciencies of 9 fi re bureaus among 22 fi re bureaus
are equal to one, and there are three fi re bureaus which have been cat-
egorized into the decreasing return to scale (DRS). Those three DRS fi re
bureaus are recommended to decrease their scale for eff iciency improve-
ment. In addition, nine fi re bureaus are in the category of constant return
to scale (CRS); it means that these 9 fi re bureaus have already reached the
optimal production scale. The 10 fi re bureaus left are in the category of
increasing return to scale (IRS) meaning that those 10 IRS branches are
recommended to amplify their scales for eff iciency improvement. The de-
tailed information of DRS, CRS and IRS for those 22 fi re bureaus is listed
in Appendix 2.
4. The resource scale strategy – Total Eff iciency-Based Scale Approach (TEBSA)
By the potentially improved goal and improved level of fi re bureaus in
each county and city, there is no need to input resources to the relative in-
eff icient units because these units need to appropriately reduce resources
more than to add. From the empirical analysis, the average eff iciency of
the entire fi re bureaus is 0.9076 and it means that there are about 10%
of the input resources being ineff ective. The reason of causing production
ineff iciency is from the average technical eff iciency, 0.9508 and the average
scale eff iciency is 0.9522. Lan et al. (2007) proposed the Omit Resource
Dow
nloa
ded
by [
Uni
vers
ity o
f Y
ork]
at 0
8:11
18
Oct
ober
201
4

HUMAN RESOURCE ALLOCATION MODEL 195
Approach (ORA) to reduce resources according to the DEA report data
when the future output trend is steady or decreasing [32]. This approach
can be applied as a way for improving the production ineff iciency if the
future output tendency is steady or decreasing. In addition, when the
reduction is conducted, which input resource should the administrators
accurately and reasonably reduce fi rst? Based on the contribution index
data analysis of the DEA report, the administrators should start from the
resource with a greater contribution index because the output value of
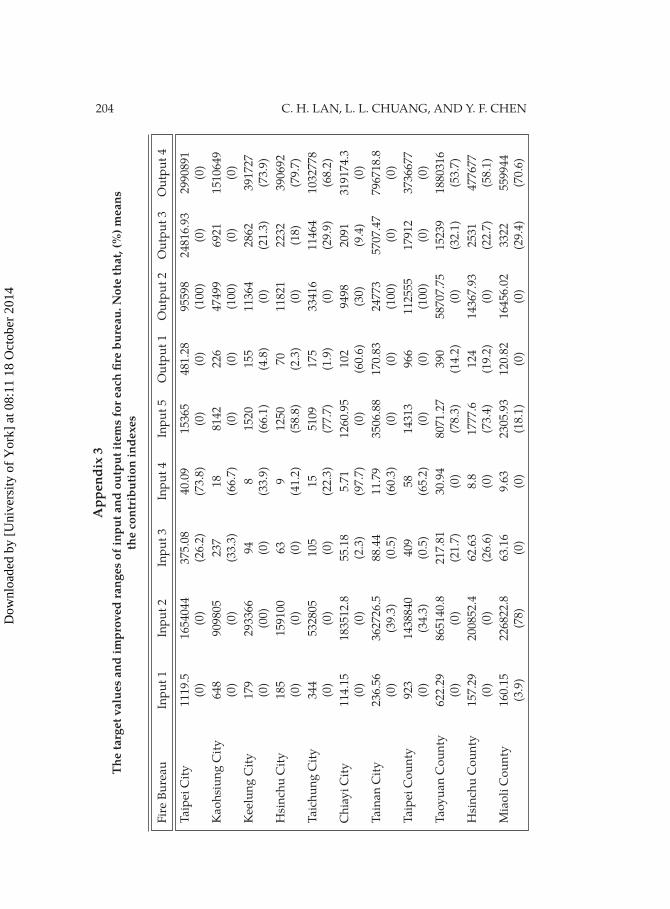
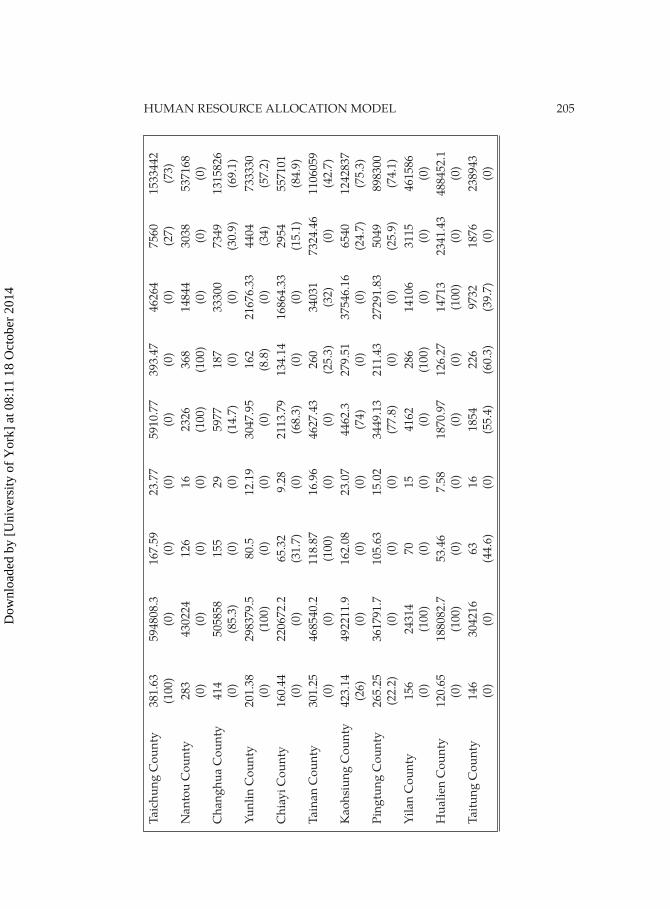
each fi re bureau cannot change arbitrarily. Now, we take Miaoli county as
an example, its existing input values, “the number of on-duty personnel,
the fi re budget, the number of fi re engines, the number of fi re branches
and the number of fi re hydrants” are 226, 320080, 94, 19, and 3254 sepa-
rately, the computed contribution indexes of input items are 3.9%, 78%, 0,
0, and 18.1%, and the objective values of each input resource are 160.15,
226822.8, 63.16, 9.63, and 2305.93. Based on the ORA to start the eff iciency
improvement, the Miaoli County fi re bureau should improve its “fi re
budget” from the input aspect fi rst to reach its objective value, 226822.8,
because the improved contribution index of this item is 78%; secondly,
“the number of fi re hydrants” for reaching its objective value, 2305.93 with
a improved contribution index, 18.1% which is next to the contribution of
“fi re budget”. The objective values of each fi re organization and contribu-
tion indexes of various variables are listed in Appendix 3.
In addition, ORA strategy is to properly balance the uneven work
loading of the relative ineff icient units if the administrators can reduce
the input resources of those units when the future output trend is steady
or decreasing. In fact, it often not assigned the required manpower in the
yearly budget of the county and city fi re bureaus, because some reasons as
the governmental budget, the inattentive fi re manpower and the fi re miss-
ing getting more and more arduous. In order to resolve how reasonably
and accurately adjust the current resources to the more satisfi ed scale, this
study presents the Total Eff iciency-Based Scale Approach (TEBSA) to off er
a referenced guideline for the resource distributors of fi re organization
when the resource allocation planning executes.
The empirical analysis shows that 59.1% of total fi re bureaus are pro-
duction ineff iciency, and causing the ineff iciency of fi re bureaus is from
the technical ineff iciency in 37.4% and the scale ineff iciency in 59.1%. This
means if the administrators want to enhance the eff iciencies of the entire
fi re bureaus, they must start with the scale allocation and omni-directional
eff iciency improvement of the fi re bureaus. The TEBSA of the research is
to balance the work loading between the relatively eff icient bureaus and
Dow
nloa
ded
by [
Uni
vers
ity o
f Y
ork]
at 0
8:11
18
Oct
ober
201
4

196 C. H. LAN, L. L. CHUANG, AND Y. F. CHEN
other fi re bureaus. If the administrators can increase input resources of
the relative eff icient bureaus, then they can eff ectively reduce the work-
load of these units. Practically, the outputs of fi re bureaus, such as rescue
services and fi re protected places, are increasing year by year; therefore,
the local government inevitably must increase the fi re manpower to serve
the general public. How should the administrators reasonably and accu-
rately distribute resources to bureaus which really need? According to
this, the proposed TEBSA strategy is properly to off er a reasonable and
quantitative reference guideline for the fi re resource distributors when the
fi re manpower allocation executes. The executing steps of TEBSA are de-
scribed as following.
At fi rst, list the entire DMUs according to their performance eff iciency
from the highest to the lowest one to form the initial data set. Defi ne the
smallest allocation unit as 1 fi refi ghter in the resource allocation and set
the upper-and-lower bound of the index value at this stage. The principle
of setting the upper-and-lower bound is adopting the maximum and mini-
mum values respectively of the original average population proportion for
one fi refi ghter assigned by the current DMUs. Now, take the upper bound
of the index value as the index value of the initial input.
Step 1. Set the input index value as the benchmark, and if the value of
the original average population proportion of DMUs for one
fi refi ghter assigned are over the benchmark and they are also
categorized as eff icient DMUs; then these DMUs are defi ned as
the current candidate units of manpower input. For these cur-
rent candidate units, decrease the value of the average popu-
lation proportion to the index value of current input and the
value of the average population proportion in the rest non-can-
didate units stays the same. Continue this step until reaching
the lower bound of the index value, and in the meantime, the
index value that maximizing the total eff iciencies will be found
and become the suggested solution at this stage. Then, accord-
ing to results of the suggested solution, re-list the initial data
sets for the next stage from all eff icient and ineff icient units
evaluated and move into the next stage.
Step 2. Re-calculate the eff iciency value of all units to become the new
candidate eff icient DMUs and compute the total performance
of all units under the current conditions. Adjust index value
downward by the ratio of 500 people and compute the new
Dow
nloa
ded
by [
Uni
vers
ity o
f Y
ork]
at 0
8:11
18
Oct
ober
201
4
HUMAN RESOURCE ALLOCATION MODEL 197
performance eff iciency value of each DMU based on the new
index value, and then return to step 1.
Step 3. At stage two, taking the suggested solution, the index value of
stage one as the starting point for computation, then repeating
step 1 and 2. At step 2, adjusting the index value downward
and upward range to be ±100 people until the index values
have been searched in stage one. Meanwhile, fi nding the index
value that can maximize the total eff iciencies and set it as the
suggested solution of this stage, then based on this solution,
re-computing the initial data set for the next stage from all ef-
fi cient and ineff icient units.
Step 4. At stage three, taking the suggested solution of stage two as
the starting point for computation, then repeating step 1 and
2. At step 2, adjusting the index value downward and up-
ward range to be ±10 people until the index values have been
searched in stage two. Meanwhile, fi nd the index value that
can maximized the total eff iciencies and set it as the suggested
solution of this stage, then based on this solution, re-compute
the initial data set for the next stage from all eff icient and inef-
fi cient units.
Step 5. At stage four, taking the suggested solution of stage three as
the starting point for computation, then repeating step 1 and
2. At step 2, adjusting the index value downward and up-
ward range to be ±1 person until the index values have been
searched in stage three. Meanwhile, fi nd the index value that
can maximize the total eff iciencies and set it as the suggested
solution of this stage. The solution here is also the fi nal solu-
tion of TEBSA.
5. Explanations of resource scale strategy
The population of Taiwan is getting continuously positive growth,
and according to Bryan (1979), when the population is growing, the cost
lost of fi re cases, related costs of fi re control and total system will increase
as well [33]. Therefore, every fi re bureau of Taiwan needs to supplement
resources. Taking the supplementation of fi re manpower as an example,
how can the entire fi re bureaus of Taiwan in 2007 minimize the dispar-
ity of every major city worldwide by the average population proportion
Dow
nloa
ded
by [
Uni
vers
ity o
f Y
ork]
at 0
8:11
18
Oct
ober
201
4
198 C. H. LAN, L. L. CHUANG, AND Y. F. CHEN
with one fi refi ghter assigned? Also, under diff erent average population
proportion with one fi refi ghter assigned by each county and city, how
much average population proportion does each county and city fi re bu-
reau need to assign one fi refi ghter and how can the fi re bureaus reach
the best total eff iciency and the reasonable allocation scale? According
to DEA analysis report and TEBSA, the detailed description is shown as
below.
At fi rst, orderly list of the entire DMUs according to their performance
eff iciency from the highest to the lowest one to the sources form the ini-
tial data set and defi ne the smallest allocation unit as one fi refi ghter. The
total numbers of current fi refi ghters nationwide are 8,797 under a ratio of
1:2569 for the total national population. In the four counties and cities as
Taichung City, Taipei County, Taichung County and Changhua County
among the current 22 DMUs, their original average population propor-
tions are over 3,000 people with a fi re manpower assigned, and the total
populations of these four counties and cities are 7,618,723 which occupy
about 30% of the total Taiwan population. The research uses the average
population proportion about 1:3000 to calculate fi rstly and the purpose
is going to examine the fi re resource ratio as 1:2569 for the current total
fi refi ghters to the total population nationwide where it is appropriate
or not.
The research begins with setting a benchmark by the proportion
value, index value, of 3,000 people with one fi refi ghter assigned. If the
original average population proportion of each county and city with
a fi refi ghter assigned is over this index value, and also these DMUs
are evaluated as candidate units of the current manpower input and
the value of the average population proportion in the rest non-candi-
date units remains the same. The fi refi ghters of the candidate units in
the current manpower input are assigned by the ratio as 1:3000 and if
the numbers of fi refi ghters is an integer after the calculation, then we
directly uses this integer, otherwise, we round the value into an integer.
At this moment, re-calculate the performance eff iciencies of DMUs’ with
the newly inputted fi refi ghter numbers to determine the candidate units
of the manpower input at the next stage, then by an arithmetic popula-
tion proportion with 500 people, orderly decreasing the proportion until
lower than the minimum bound, i.e. starting from 2500, 2000, and 1500,
and determine the suggested index value with the maximum total ef-
fi ciency of the fi rst stage. At this stage, the research uses the population
proportion 1:2,000 as the allocation basis, where this proportion contrib-
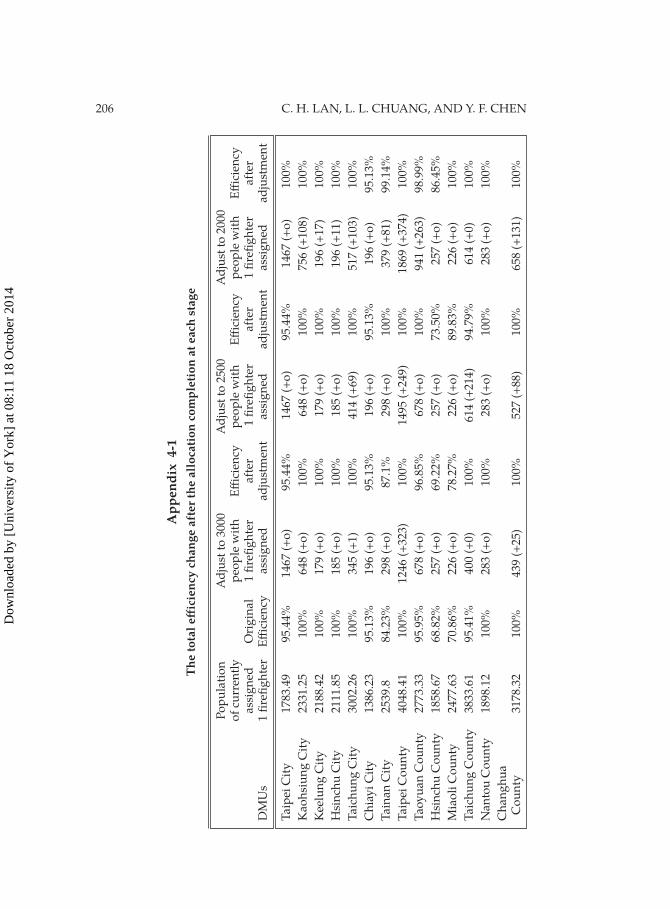
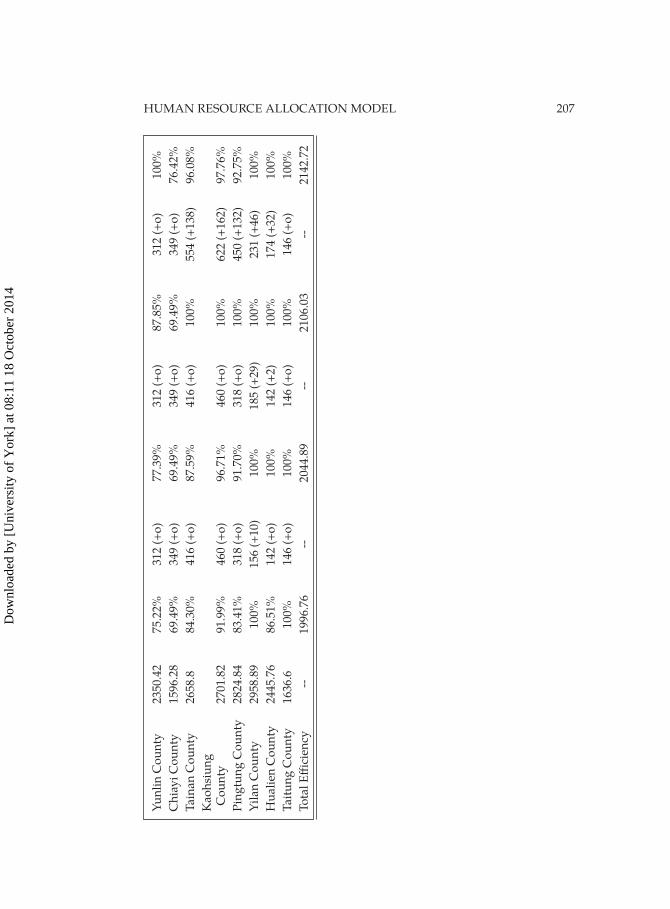
uted the maximal total eff iciency of 2142.72. In addition, the research
Dow
nloa
ded
by [
Uni
vers
ity o
f Y
ork]
at 0
8:11
18
Oct
ober
201
4
HUMAN RESOURCE ALLOCATION MODEL 199
uses the population proportion 1:1500 as the allocation basis where this
proportion contributed the next maximal total eff iciency of 2133.61.
Moreover, the research uses the population proportion 1:2500 as the al-
location basis, where this proportion contributed the third maximal total
eff iciency of 2106.03. Thus, the search range is reduced to between 1,500
and 2,500 at the next stage.
In stage one, the maximal total eff iciency is achieved by a population
proportion 1:2000 and set this proportion as benchmark index value in this
stage. By this benchmark index value, DMUs which are categorized as re-
lated eff icient units and their original average population proportions are
over the benchmark index value and regarded as the candidate units to
add the manpower, then we adjusted the above-mentioned benchmark in-
dex vale by ±100 people, i.e. (2100, 1900); (2200, 1800); (2300, 1700); (2400,
1600), in order to get the total eff iciency vale of each index value within
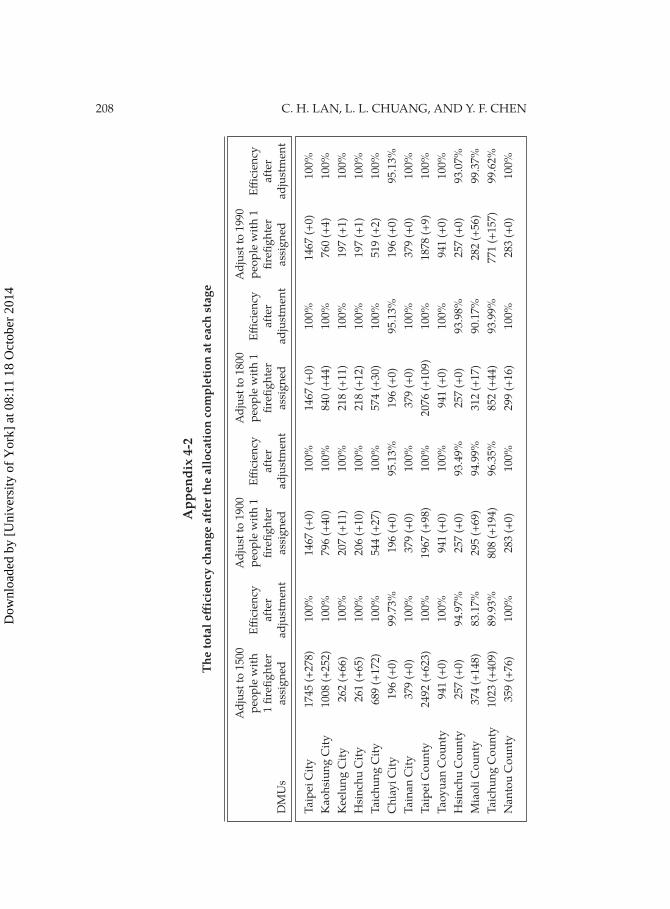
the range (1500~2500). At this stage, the research uses the population
proportion 1:1900 as the allocation basis which contributed the maximal
total eff iciency of 2155.25. In addition, the population proportion 1:1800
as the allocation basis which contributed the next maximal total eff iciency
of 2145.08. Moreover, the total eff iciency of 2142.72 by population propor-
tion 1:2000, shown in the fi rst stage functions as the third maximal total
eff iciency. Thus, the search range is reduced to between 1,800 and 2,000 at
the next stage.
The maximal total eff iciency is achieved by a population proportion
1:1900 in the previous stage and set this proportion as benchmark in-
dex value in this stage. Based upon this benchmark index value, DMUs
which are categorized as relative eff icient units and their original average
population proportions are over the benchmark index value and they are
regarded as the candidate units to add the manpower. Then we adjust the
above-mentioned benchmark index vale by ±10 people, i.e. (1910, 1890);
(1920, 1880); (1930, 1870); (1940, 1860); (1950, 1850); (1960, 1840); (1970,
1830); (1980, 1820); (1990, 1810), in order to get the total eff iciency vale of
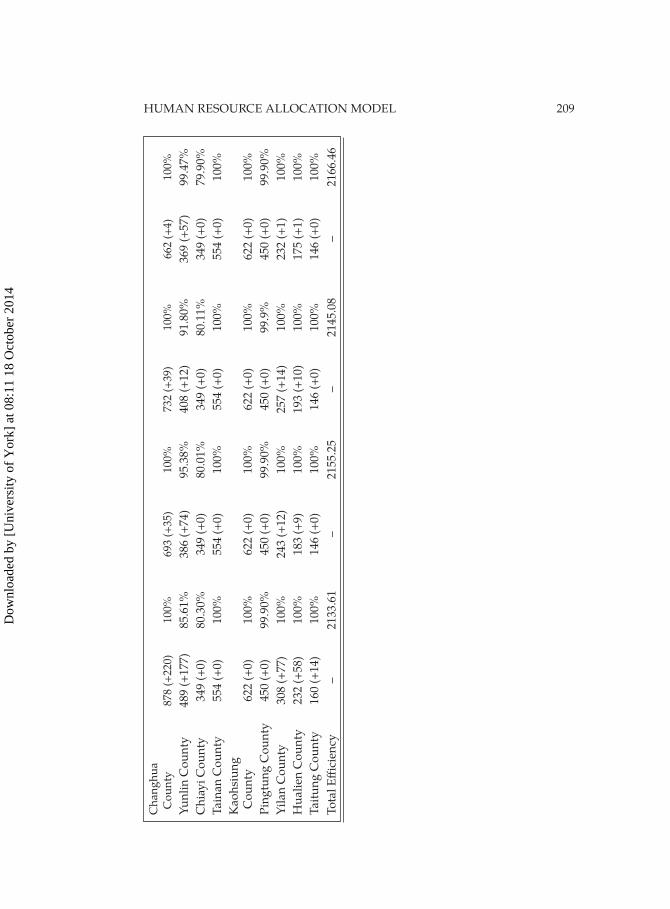
each index value within the range (1800~2000). At this stage, the research
uses the population proportion 1:1990 as the allocation basis which con-
tributed the maximal total eff iciency of 2166.46. In addition, the popula-
tion proportion 1:1980 as the allocation basis which contributed the next
maximal total eff iciency of 2165.28. Thus, the fi nal search range is reduced
to between 1,980 and 2,000 at the next stage.
The maximal total eff iciency is achieved by a population proportion
1:1990 in the previous stage and set this proportion as benchmark index
value in this stage. Based upon this benchmark index value, DMUs which
Dow
nloa
ded
by [
Uni
vers
ity o
f Y
ork]
at 0
8:11
18
Oct
ober
201
4
200 C. H. LAN, L. L. CHUANG, AND Y. F. CHEN
are categorized as relative eff icient units and their original average popu-
lation proportions are over the benchmark index value are regarded as
the candidate units to add the manpower, and then we adjust the above-
mentioned benchmark index vale by ±1 people, i.e. (1991, 1989); (1992,
1988); (1993, 1987); (1994, 1986); (1995, 1985); (1996, 1984); (1997, 1983);
(1998, 1982); (1999, 1981), in order to get the total eff iciency vale of each in-
dex value within the range (1980~2000). At this stage, the population pro-
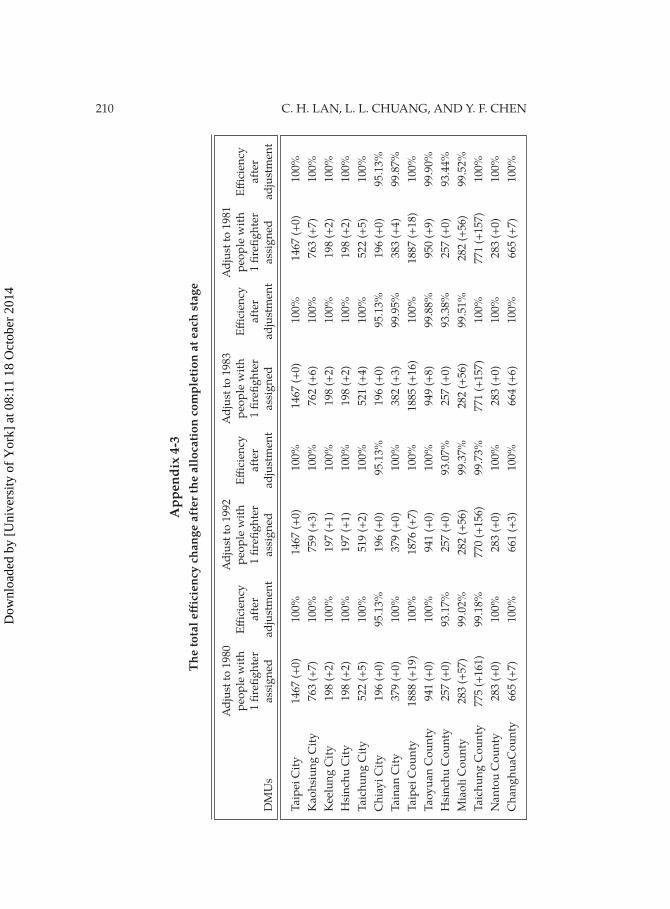
portion 1:1981 contributes the maximal entire total eff iciency of 2167.72.
Therefore, the suggested population proportion 1:1981 is determined by
applying the proposed TEBSA and the detailed information are shown in
Appendix 4.
While a DMU owns the smaller output of production, the input of
its manpower should be less. On the other hand, when a DMU owns
the higher output of production, the input of its manpower should be
larger in order to properly handle the arduous and complicate fi re duties.
According to the above discussion on the computational results, the pop-
ulation proportion to one fi refi ghter assigned (1:1981) is the suggested
proportion for handling the current situation in Taiwan. The proportion
has a discrepancy of 2936 fi refi ghters, as compared to the current num-
ber of fi refi ghters nationwide, and is larger than the number of currently
permitted fi refi ghters, which is 1779. As shown, the discrepancy of man-
power support has reached the budgeted quota according to the exist-
ing laws and regulations, and it satisfi es the manpower demand forecast
and the supplements of the manpower quota. To achieve the equilibrium
of the total productivity and completion of the fi refi ghting purpose, the
actual demand for nationwide fi re organization is computed as 11733
fi refi ghters, and suggested population proportion (1:1981) can make
the ration of 10000 persons from 3.92 to 5.2, and closes the gap as com-
pared with other countries. This study made adjustment on the future
manpower allocation based on the eff iciency rate obtained from output
variables, and conducted 5-year medium to long term manpower allo-
cation, budget planning, and procurement of fi re engines based on the
scale discrepancy. It also provided adjustment on the reasonable work-
ing hours for fi refi ghters after the manpower compensation is completed.
The method could be used as a reference to improve the eff iciency of fi re
bureau when the manpower allocation plan is conducted. The manpower
under the current governmental organization, the estimated manpower
of the government, current manpower, and the suggested manpower are
as shown in Appendix 5.
Dow
nloa
ded
by [
Uni
vers
ity o
f Y
ork]
at 0
8:11
18
Oct
ober
201
4
HUMAN RESOURCE ALLOCATION MODEL 201
6. Conclusions and suggestions
Performance evaluation has become one of the key topics in
management sciences both in public and private organizations, as better
performance is a guarantee of good management [34]. In order to achieve
organizational goals and/or mission statements, improve organizational
eff iciency, and increase motivation, performance evaluation has become
one of the key strategies. If the resources were not allocated reasonably, it
would infl uence the eff ectiveness, eff iciency and productivity within the
organization. The proposed TEBSA will be able to solve the diff icult and
complicated problems encountered in the organization.
Regarding the resource strategy, it is suggested that decision makers
use ORA and TEBSA to allocate resources when the future output trend
is considered. ORA and TEBSA provide decision makers with the guide-
lines for resource adjustment, based on the performance from the DMUs.
When there is a decreasing or steady output trend in the future, the ORA
strategy suggests that those relatively ineff icient DMUs should reduce the
input resources, so resource allocation can be improved. In contrast, when
the future output trend is estimated to be rising, decision makers are re-
quired to increase resources. The proposed TEBSA strategy assists deci-
sion makers to perform a reasonable resource allocation and maximize
overall eff iciencies in eff icient DMUs.
Due to the nature that the fi re service is responsible for the pub-
lic safety, the scale of fi re resources should be taken into consideration
critically. If the input resources of relatively ineff icient departments are
reduced sharply over a short period, public safety will be impacted. Due
to the sharply increasing population rate in Taiwan, there will be heavier
workload for fi re service; decision makers should consider the appropri-
ate scale of fi re resource for each fi re department while performing the
ORA strategy. The proposed performance-based and quantitative fi re
resource allocation method - TEBSA strategy - will play an important role
in the allocation of future fi re protection resources. TEBSA strategy pro-
vides the fi re services a guideline to utilize and allocate their constrained
resources more eff ectively in their jurisdictions. Under the limited fi re
manpower and equipment, the TEBSA strategy helps improve the ef-
fectiveness of emergency response and social resources; it also reduces
the waste of social resources. It is suggested that the fi re departments use
the DEA model, ORA and TEBSA approaches to perform a reasonable
resource allocation. It is proposed that similar methods to be applied to
future comparative studies.
Dow
nloa
ded
by [
Uni
vers
ity o
f Y
ork]
at 0
8:11
18
Oct
ober
201
4
202 C. H. LAN, L. L. CHUANG, AND Y. F. CHENA
ppen
dix
1Th
e va
lues
of i
nput
and
out
put i
tem
s fo
r eac
h D
MU
DM
Us
Inp
ut1
In
pu
t 2
Inp
ut
3
Inp
ut
4
Inp
ut
5
Ou
tpu
t1
Ou
tpu
t2
Ou
tpu
t3
Ou
tpu
t4
Taip
ei C
ity
1467
2093051
393
42
16787
421
95598
20968
2616375
Kao
hsi
un
g C
ity
648
909805
237
18
8142
226
47499
6921
1510649
Kee
lun
g C
ity
179
293366
94
8
1520
155
11364
2862
391727
Hsi
nch
u C
ity
185
159100
63
9
1250
70
11821
2232
390692
Taic
hu
ng
Cit
y
344
532805
105
15
5109
175
33416
11464
1032778
Ch
iay
i C
ity
196
299877
58
6
1564
102
9498
2091
271701
Tain
an
Cit
y
298
430634
105
14
4821
146
24773
3441
756859
Taip
ei C
ou
nty
923
1438840
409
58
14313
966
112555
17912
3736677
Tao
yu
an
Co
un
ty
678
978322
227
35
8412
390
49217
15239
1880316
Hsi
nch
u C
ou
nty
257
414023
91
15
2583
124
12198
2531
477677
Mia
oli
Co
un
ty
226
320080
94
19
3254
49
12362
3322
559944
Taic
hu
ng
Co
un
ty
400
845289
224
27
8961
79
38514
7560
1533442
Nan
tou
Co
un
ty
283
430224
126
16
2326
368
14844
3038
537168
Ch
an
gh
ua C
ou
nty
414
505858
155
29
5977
187
33300
7349
1315826
Yu
nli
n C
ou
nty
312
396650
127
20
4331
162
16512
4404
733330
Ch
iay
i C
ou
nty
349
555856
94
21
3042
73
16065
2954
557101
Tain
an
Co
un
ty
416
619792
141
36
7042
260
34031
6627
1106059
Kao
hsi
un
g C
ou
nty
460
655531
182
30
4851
215
37078
6540
1242837
Pin
gtu
ng
Co
un
ty
318
502977
147
22
4135
126
24190
5049
898300
Yil
an
Co
un
ty
156
243142
70
15
4162
286
14106
3115
461586
Hu
ali
en C
ou
nty
142
217399
91
17
2986
73
14713
1741
347298
Tait
un
g C
ou
nty
146
304216
63
16
1854
226
9732
1876
238943
Dow
nloa
ded
by [
Uni
vers
ity o
f Y
ork]
at 0
8:11
18
Oct
ober
201
4
HUMAN RESOURCE ALLOCATION MODEL 203
App
endi
x 2
The
prod
uctio
n eff
ici
ency
, the
tech
nica
l eff
icie
ncy,
the
scal
e eff
ici
ency
, and
the
retu
rn to
sca
le o
f eac
h fi r
e bu
reau
Pro
du
ctio
n
Tec
hn
ical
Sca
le
R
etu
rn t
o
Ref
eran
ce
Nu
mb
er b
yN
o.
DM
Us
eff i
cien
cy
eff i
cien
cy
eff i
cien
cy
Σλ
valu
e sc
ale
S
et I
tem
R
efer
an
ce
1
Taip
ei C
ity
0.9
544
1
0.9
544
2.5
0210
DR
S
2,5
0
2
Kao
hsi
un
g C
ity
1
1
1
1
CR
S
2
3
3
Kee
lun
g C
ity
1
1
1
1
CR
S
3
2
4
Hsi
nch
u C
ity
1
1
1
1
CR
S
4
7
5
Taic
hu
ng
Cit
y
1
1
1
1
CR
S
5
13
6
Ch
iay
i C
ity
0.9
513
1
0.9
513
0.4
6151
IRS
3,5
,8,1
3
0
7
Tain
an
Cit
y
0.8
423
0.9
264
0.9
092
0.4
5463
IRS
2,5
,8
0
8
Taip
ei C
ou
nty
1
1
1
1
CR
S
8
13
9
Tao
yu
an
Co
un
ty
0.9
595
1
0.9
595
1.9
0618
DR
S
4,5
,8,1
3
0
10
Hsi
nch
u C
ou
nty
0.6
882
0.7
868
0.8
747
0.4
8719
IRS
4,5
,8,1
3
0
11
Mia
oli
Co
un
ty
0.7
086
0.9
051
0.7
829
0.3
3323
IRS
4,5
,8,1
4
0
12
Taic
hu
ng
Co
un
ty
0.9
541
1
0.9
541
0.4
3363
IRS
5,8
0
13
Nan
tou
Co
un
ty
1
1
1
1
CR
S
13
4
14
Ch
an
gh
ua C
ou
nty
1
1
1
1
CR
S
14
3
15
Yu
nli
n C
ou
nty
0.7
522
0.7
966
0.9
443
0.3
5274
IRS
5,8
,14
0
16
Ch
iay
i C
ou
nty
0.6
949
0.7
860
0.8
841
0.3
7461
IRS
4,5
,8
0
17
Tain
an
Co
un
ty
0.8
430
0.8
558
0.9
850
0.5
3207
IRS
5,8
,20
0
18
Kao
hsi
un
g C
ou
nty
0.9
199
0.9
576
0.9
606
1.5
0467
DR
S
4,5
,8
0
19
Pin
gtu
ng
Co
un
ty
0.8
341
0.9
040
0.9
227
0.6
6298
IRS
4,5
,8
0
20
Yil
an
Co
un
ty
1
1
1
1
CR
S
20
2
21
Hu
ali
en C
ou
nty
0.8
651
1
0.8
651
0.1
3072
IRS
8
0
22
Tait
un
g C
ou
nty
1
1
1
1
CR
S
22
1
Dow
nloa
ded
by [
Uni
vers
ity o
f Y
ork]
at 0
8:11
18
Oct
ober
201
4
204 C. H. LAN, L. L. CHUANG, AND Y. F. CHENA
ppen
dix
3Th
e ta
rget
val
ues
and
impr
oved
rang
es o
f inp
ut a
nd o
utpu
t ite
ms
for e
ach
fi re
bure
au. N
ote
that
, (%
) mea
ns
the
cont
ribu
tion
inde
xes
Fir
e B
ure
au
In
pu
t 1
Inp
ut
2
Inp
ut
3
Inp
ut
4
Inp
ut
5
Ou
tpu
t 1
Ou
tpu
t 2
Ou
tpu
t 3
Ou
tpu
t 4
Taip
ei C
ity
1119.5
1654044
375.0
8
40.0
9
15365
481.2
8
95598
24816
.93
2990891
(0
) (0
) (2
6.2
) (7
3.8
) (0
) (0
) (1
00)
(0)
(0)
Kao
hsi
un
g C
ity
648
909805
237
18
8142
226
47499
6921
1510649
(0
) (0
) (3
3.3
) (6
6.7
) (0
) (0
) (1
00)
(0)
(0)
Kee
lun
g C
ity
179
293366
94
8
1520
155
11364
2862
391727
(0
) (0
0)
(0)
(33.9
) (6
6.1
) (4
.8)
(0)
(21.3
) (7
3.9
)
Hsi
nch
u C
ity
185
159100
63
9
1250
70
11821
2232
390692
(0
) (0
) (0
) (4
1.2
)
(58.8
) (2
.3)
(0)
(18)
(79.7
)
Taic
hu
ng
Cit
y
344
532805
105
15
5109
175
33416
11464
1032778
(0
) (0
) (0
) (2
2.3
) (7
7.7
) (1
.9)
(0)
(29.9
) (6
8.2
)
Ch
iay
i C
ity
114.1
5
183512.8
55.1
8
5.7
1
1260.9
5
102
9498
2091
319174.3
(0
) (0
) (2
.3)
(97.7
) (0
) (6
0.6
) (3
0)
(9.4
) (0
)
Tain
an
Cit
y
236.5
6
362726.5
88.4
4
11.7
9
3506.8
8
170.8
3
24773
5707.4
7
796718.8
(0
) (3
9.3
) (0
.5)
(60.3
) (0
) (0
) (1
00)
(0)
(0)
Taip
ei C
ou
nty
923
1438840
409
58
14313
966
112555
17912
3736677
(0
) (3
4.3
) (0
.5)
(65.2
) (0
) (0
) (1
00)
(0)
(0)
Tao
yu
an
Co
un
ty
622.2
9
865140.8
217.8
1
30.9
4
8071.2
7
390
58707.7
5
15239
1880316
(0
) (0
) (2
1.7
) (0
) (7
8.3
) (1
4.2
) (0
) (3
2.1
) (5
3.7
)
Hsi
nch
u C
ou
nty
157.2
9
200852.4
62.6
3
8.8
1777.6
124
14367.9
3
2531
477677
(0
) (0
) (2
6.6
) (0
) (7
3.4
) (1
9.2
) (0
) (2
2.7
) (5
8.1
)
Mia
oli
Co
un
ty
160.1
5
226822.8
63.1
6
9.6
3
2305.9
3
120.8
2
16456.0
2
3322
559944
(3
.9)
(78)
(0)
(0)
(18.1
) (0
) (0
) (2
9.4
) (7
0.6
)
Dow
nloa
ded
by [
Uni
vers
ity o
f Y
ork]
at 0
8:11
18
Oct
ober
201
4
HUMAN RESOURCE ALLOCATION MODEL 205
Taic
hu
ng
Co
un
ty
381.6
3
594808.3
167.5
9
23.7
7
5910.7
7
393.4
7
46264
7560
1533442
(1
00)
(0)
(0)
(0)
(0)
(0)
(0)
(27)
(73)
Nan
tou
Co
un
ty
283
430224
126
16
2326
368
14844
3038
537168
(0
) (0
) (0
) (0
) (1
00)
(100)
(0)
(0)
(0)
Ch
an
gh
ua C
ou
nty
414
505858
155
29
5977
187
33300
7349
1315826
(0
) (8
5.3
) (0
) (0
) (1
4.7
) (0
) (0
) (3
0.9
) (6
9.1
)
Yu
nli
n C
ou
nty
201.3
8
298379.5
80.5
12.1
9
3047.9
5
162
21676.3
3
4404
733330
(0
) (1
00)
(0)
(0)
(0)
(8.8
) (0
) (3
4)
(57.2
)
Ch
iay
i C
ou
nty
160.4
4
220672.2
65.3
2
9.2
8
2113.7
9
134.1
4
16864.3
3
2954
557101
(0
) (0
) (3
1.7
) (0
) (6
8.3
) (0
) (0
) (1
5.1
) (8
4.9
)
Tain
an
Co
un
ty
301.2
5
468540.2
118.8
7
16.9
6
4627.4
3
260
34031
7324.4
6
1106059
(0
) (0
) (1
00)
(0)
(0)
(25.3
) (3
2)
(0)
(42.7
)
Kao
hsi
un
g C
ou
nty
423.1
4
492211.9
162.0
8
23.0
7
4462.3
279.5
1
37546.1
6
6540
1242837
(2
6)
(0)
(0)
(0)
(74)
(0)
(0)
(24.7
) (7
5.3
)
Pin
gtu
ng
Co
un
ty
265.2
5
361791.7
105.6
3
15.0
2
3449.1
3
211.4
3
27291.8
3
5049
898300
(2
2.2
) (0
) (0
) (0
) (7
7.8
) (0
) (0
) (2
5.9
) (7
4.1
)
Yil
an
Co
un
ty
156
24314
70
15
4162
286
14106
3115
461586
(0
) (1
00)
(0)
(0)
(0)
(100)
(0)
(0)
(0)
Hu
ali
en C
ou
nty
120.6
5
188082.7
53.4
6
7.5
8
1870.9
7
126.2
7
14713
2341.4
3
488452.1
(0
) (1
00)
(0)
(0)
(0)
(0)
(100)
(0)
(0)
Tait
un
g C
ou
nty
146
304216
63
16
1854
226
9732
1876
238943
(0
) (0
) (4
4.6
) (0
) (5
5.4
) (6
0.3
) (3
9.7
) (0
) (0
)
Dow
nloa
ded
by [
Uni
vers
ity o
f Y
ork]
at 0
8:11
18
Oct
ober
201
4
206 C. H. LAN, L. L. CHUANG, AND Y. F. CHEN
App
endi
x 4
-1Th
e to
tal e
ff ic
ienc
y ch
ange
aft
er th
e al
loca
tion
com
plet
ion
at e
ach
stag
e
P
op
ula
tio
n
A
dju
st t
o 3
000
A
dju
st t
o 2
500
A
dju
st t
o 2
000
o
f cu
rren
tly
peo
ple
wit
h
Eff
icie
ncy
p
eop
le w
ith
E
ff ic
ien
cy
peo
ple
wit
h
Eff
icie
ncy
ass
ign
ed
Ori
gin
al
1 fi
refi
gh
ter
aft
er
1 fi
refi
gh
ter
aft
er
1 fi
refi
gh
ter
aft
erD
MU
s 1 fi
refi
gh
ter
Eff
icie
ncy
ass
ign
ed
ad
just
men
t ass
ign
ed
ad
just
men
t ass
ign
ed
ad
just
men
t
Taip
ei C
ity
1783.4
9
95.4
4%
14
67 (
+o
) 95.4
4%
1467 (
+o
) 95.4
4%
1467 (
+o
) 100%
Kao
hsi
un
g C
ity
2331.2
5
100%
648 (
+o
) 100%
648 (
+o
) 100%
756 (
+108)
100%
Kee
lun
g C
ity
2188.4
2
100%
17
9 (
+o
) 100%
179 (
+o
) 100%
196 (
+17)
100%
Hsi
nch
u C
ity
2111.8
5
100%
185 (
+o
) 100%
185 (
+o
) 100%
196 (
+11)
100%
Taic
hu
ng
Cit
y
3002.2
6
100%
345 (
+1)
100%
414 (
+69)
100%
517 (
+103)
100%
Ch
iay
i C
ity
1386.2
3
95.1
3%
196 (
+o
) 95.1
3%
196 (
+o
) 95.1
3%
196 (
+o
) 95.1
3%
Tain
an
Cit
y
2539.8
84.2
3%
298 (
+o
) 87.1
%
298 (
+o
) 100%
379 (
+81)
99.1
4%
Taip
ei C
ou
nty
4048.4
1
100%
1246 (
+323)
100%
1495 (
+249)
100%
1869 (
+37
4)
100%
Tao
yu
an
Co
un
ty
2773.3
3
95.9
5%
678 (
+o
) 96.8
5%
678 (
+o
) 100%
941 (
+263)
98.9
9%
Hsi
nch
u C
ou
nty
1858.6
7
68.8
2%
257 (
+o
) 69.2
2%
257 (
+o
) 73.5
0%
257 (
+o
) 86.4
5%
Mia
oli
Co
un
ty
2477.6
3
70.8
6%
226 (
+o
) 78.2
7%
226 (
+o
) 89.8
3%
226 (
+o
) 100%
Taic
hu
ng
Co
un
ty
3833.6
1
95.4
1%
400 (
+0)
100%
614 (
+214)
94.7
9%
614 (
+0)
100%
Nan
tou
Co
un
ty
1898.1
2
100%
283 (
+o
) 100%
283 (
+o
) 100%
283 (
+o
) 100%
Ch
an
gh
ua
C
ou
nty
3178.3
2
100%
439 (
+25)
100%
527 (
+88)
100%
658 (
+131)
100%
Dow
nloa
ded
by [
Uni
vers
ity o
f Y
ork]
at 0
8:11
18
Oct
ober
201
4
HUMAN RESOURCE ALLOCATION MODEL 207
Yu
nli
n C
ou
nty
2350.4
2
75.2
2%
312 (
+o
) 77.3
9%
312 (
+o
) 87.8
5%
312 (
+o
) 100%
Ch
iay
i C
ou
nty
1596.2
8
69.4
9%
349 (
+o
) 69.4
9%
349 (
+o
) 69.4
9%
349 (
+o
) 76.4
2%
Tain
an
Co
un
ty
2658.8
84.3
0%
416 (
+o
) 87.5
9%
416 (
+o
) 100%
554 (
+138)
96.0
8%
Kao
hsi
un
g
C
ou
nty
2701.8
2
91.9
9%
460 (
+o
) 96.7
1%
460 (
+o
) 100%
622 (
+162)
97.7
6%
Pin
gtu
ng
Co
un
ty
2824.8
4
83.4
1%
318 (
+o
) 91.7
0%
318 (
+o
) 100%
450 (
+132)
92.7
5%
Yil
an
Co
un
ty
2958.8
9
100%
156 (
+10)
100%
185 (
+29)
100%
231 (
+46)
100%
Hu
ali
en C
ou
nty
2445.7
6
86.5
1%
142 (
+o
) 100%
142 (
+2)
100%
174 (
+32)
100%
Tait
un
g C
ou
nty
1636.6
100%
146 (
+o
) 100%
146 (
+o
) 100%
146 (
+o
) 100%
To
tal
Eff
icie
ncy
--
1996.7
6
--
2044.8
9
--
2106.0
3
--
2142.7
2
Dow
nloa
ded
by [
Uni
vers
ity o
f Y
ork]
at 0
8:11
18
Oct
ober
201
4
208 C. H. LAN, L. L. CHUANG, AND Y. F. CHEN
App
endi
x 4-
2Th
e to
tal e
ff ic
ienc
y ch
ange
aft
er th
e al
loca
tion
com
plet
ion
at e
ach
stag
e
A
dju
st t
o 1
500
A
dju
st t
o 1
900
A
dju
st t
o 1
800
A
dju
st t
o 1
990
p
eop
le w
ith
E
ff ic
ien
cy
peo
ple
wit
h 1
E
ff ic
ien
cy
peo
ple
wit
h 1
E
ff ic
ien
cy
peo
ple
wit
h 1
E
ff ic
ien
cy
1 fi
refi
gh
ter
aft
er
fi re
fi g
hte
r aft
er
fi re
fi g
hte
r aft
er
fi re
fi g
hte
r aft
er
DM
Us
ass
ign
ed
ad
just
men
t ass
ign
ed
ad
just
men
t ass
ign
ed
ad
just
men
t ass
ign
ed
ad
just
men
t
Taip
ei C
ity
1745 (
+278)
100%
1467 (
+0)
100%
1467 (
+0)
100%
1467 (
+0)
100%
Kao
hsi
un
g C
ity
1008 (
+252)
100%
796 (
+40)
100%
840 (
+44)
100%
760 (
+4)
100%
Kee
lun
g C
ity
262 (
+66)
100%
207 (
+11)
100%
218 (
+11)
100%
197 (
+1)
100%
Hsi
nch
u C
ity
261 (
+65)
100%
206 (
+10)
100%
218 (
+12)
100%
197 (
+1)
100%
Taic
hu
ng
Cit
y
689 (
+172)
100%
544 (
+27)
100%
574 (
+30)
100%
519 (
+2)
100%
Ch
iay
i C
ity
196 (
+0)
99.7
3%
196 (
+0)
95.1
3%
196 (
+0)
95.1
3%
196 (
+0)
95.1
3%
Tain
an
Cit
y
379 (
+0)
100%
379 (
+0)
100%
379 (
+0)
100%
379 (
+0)
100%
Taip
ei C
ou
nty
2492 (
+623)
100%
1967 (
+98)
100%
2076 (
+109)
100%
1878 (
+9)
100%
Tao
yu
an
Co
un
ty
941 (
+0)
100%
941 (
+0)
100%
941 (
+0)
100%
941 (
+0)
100%
Hsi
nch
u C
ou
nty
257 (
+0)
94.9
7%
257 (
+0)
93.4
9%
257 (
+0)
93.9
8%
257 (
+0)
93.0
7%
Mia
oli
Co
un
ty
374 (
+148)
83.1
7%
295 (
+69)
94.9
9%
312 (
+17)
90.1
7%
282 (
+56)
99.3
7%
Taic
hu
ng
Co
un
ty
1023 (
+409)
89.9
3%
808 (
+194)
96.3
5%
852 (
+44)
93.9
9%
771 (
+157)
99.6
2%
Nan
tou
Co
un
ty
359 (
+76)
100%
283 (
+0)
100%
299 (
+16)
100%
283 (
+0)
100%
Dow
nloa
ded
by [
Uni
vers
ity o
f Y
ork]
at 0
8:11
18
Oct
ober
201
4
HUMAN RESOURCE ALLOCATION MODEL 209
Ch
an
gh
ua
C
ou
nty
878 (
+220)
100%
693 (
+35)
100%
732 (
+39)
100%
662 (
+4)
100%
Yu
nli
n C
ou
nty
489 (
+177)
85.6
1%
386 (
+74)
95.3
8%
408 (
+12)
91.8
0%
369 (
+5
7)
99.4
7%
Ch
iay
i C
ou
nty
349 (
+0)
80.3
0%
349 (
+0)
80.0
1%
349 (
+0)
80.1
1%
349 (
+0)
79.9
0%
Tain
an
Co
un
ty
554 (
+0)
100%
554 (
+0)
100%
554 (
+0)
100%
554 (
+0)
100%
Kao
hsi
un
g
C
ou
nty
622 (
+0)
100%
622 (
+0)
100%
622 (
+0)
100%
622 (
+0)
100%
Pin
gtu
ng
Co
un
ty
450 (
+0)
99.9
0%
450 (
+0)
99.9
0%
450 (
+0)
99.9
%
450 (
+0)
99.9
0%
Yil
an
Co
un
ty
308 (
+77)
100%
243 (
+12)
100%
257 (
+14)
100%
232 (
+1)
100%
Hu
ali
en C
ou
nty
232 (
+58)
100%
183 (
+9)
100%
193 (
+10)
100%
175 (
+1)
100%
Tait
un
g C
ou
nty
160 (
+14)
100%
146 (
+0)
100%
146 (
+0)
100%
146 (
+0)
100%
To
tal
Eff
icie
ncy
–
2133.6
1
–
2155.2
5
–
2145.0
8
–
2166.4
6
Dow
nloa
ded
by [
Uni
vers
ity o
f Y
ork]
at 0
8:11
18
Oct
ober
201
4
210 C. H. LAN, L. L. CHUANG, AND Y. F. CHEN
App
endi
x 4-
3Th
e to
tal e
ff ic
ienc
y ch
ange
aft
er th
e al
loca
tion
com
plet
ion
at e
ach
stag
e
A
dju
st t
o 1
980
A
dju
st t
o 1
992
A
dju
st t
o 1
983
A
dju
st t
o 1
981
p
eop
le w
ith
E
ff ic
ien
cy
peo
ple
wit
h
Eff
icie
ncy
p
eop
le w
ith
E
ff ic
ien
cy
peo
ple
wit
h
Eff
icie
ncy
1 fi
refi
gh
ter
aft
er
1 fi
refi
gh
ter
aft
er
1 fi
refi
gh
ter
aft
er
1 fi
refi
gh
ter
aft
er
DM
Us
ass
ign
ed
ad
just
men
t ass
ign
ed
ad
just
men
t ass
ign
ed
ad
just
men
t ass
ign
ed
ad
just
men
t
Taip
ei C
ity
1467 (
+0)
100%
1467 (
+0)
100%
1467 (
+0)
100%
1467 (
+0)
100%
Kao
hsi
un
g C
ity
763 (
+7)
100%
759 (
+3)
100%
762 (
+6)
100%
763 (
+7)
100%
Kee
lun
g C
ity
198 (
+2)
100%
197 (
+1)
100%
198 (
+2)
100%
198 (
+2)
100%
Hsi
nch
u C
ity
198 (
+2)
100%
197 (
+1)
100%
198 (
+2)
100%
198 (
+2)
100%
Taic
hu
ng
Cit
y
522 (
+5)
100%
519 (
+2)
100%
521 (
+4)
100%
522 (
+5)
100%
Ch
iay
i C
ity
196 (
+0)
95.1
3%
196 (
+0)
95.1
3%
196 (
+0)
95.1
3%
196 (
+0)
95.1
3%
Tain
an
Cit
y
379 (
+0)
100%
379 (
+0)
100%
382 (
+3)
99.9
5%
383 (
+4)
99.8
7%
Taip
ei C
ou
nty
1888 (
+19)
100%
1876 (
+7)
100%
1885 (
+16)
100%
1887 (
+18)
100%
Tao
yu
an
Co
un
ty
941 (
+0)
100%
941 (
+0)
100%
949 (
+8)
99.8
8%
950 (
+9)
99.9
0%
Hsi
nch
u C
ou
nty
257 (
+0)
93.1
7%
257 (
+0)
93.0
7%
257 (
+0)
93.3
8%
257 (
+0)
93.4
4%
Mia
oli
Co
un
ty
283 (
+57)
99.0
2%
282 (
+56)
99.3
7%
282 (
+56)
99.5
1%
282 (
+5
6)
99.5
2%
Taic
hu
ng
Co
un
ty
775 (
+161)
99.1
8%
770 (
+156)
99.7
3%
771 (
+157)
100%
771 (
+157)
100%
Nan
tou
Co
un
ty
283 (
+0)
100%
283 (
+0)
100%
283 (
+0)
100%
283 (
+0)
100%
Ch
an
gh
uaC
ou
nty
665 (
+7)
100%
661 (
+3)
100%
664 (
+6)
100%
665 (
+7)
100%
Dow
nloa
ded
by [
Uni
vers
ity o
f Y
ork]
at 0
8:11
18
Oct
ober
201
4
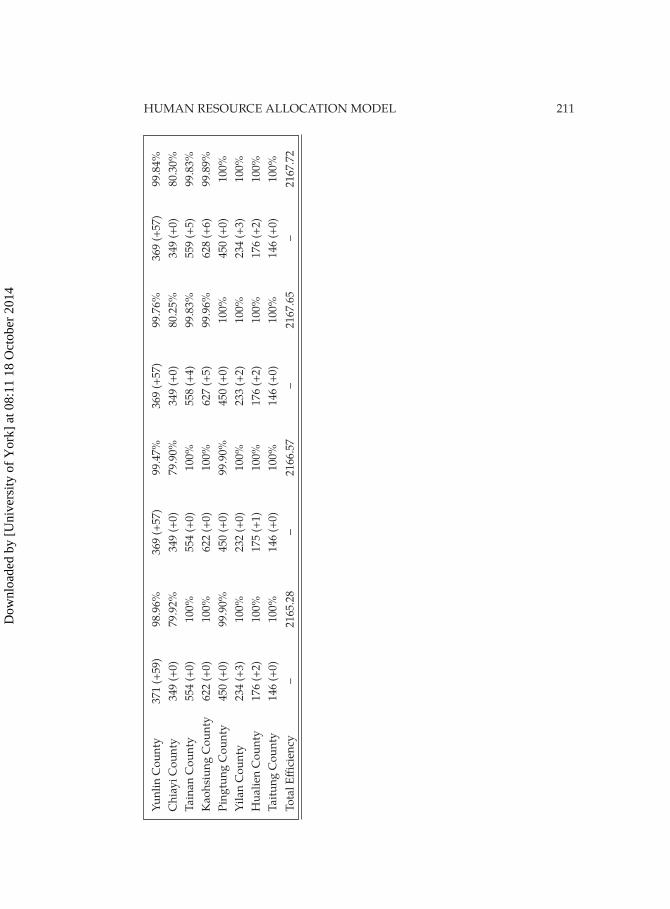
HUMAN RESOURCE ALLOCATION MODEL 211
Yu
nli
n C
ou
nty
371 (
+59)
98.9
6%
369 (
+57)
99.4
7%
369 (
+57)
99.7
6%
369 (
+57)
99.8
4%
Ch
iay
i C
ou
nty
349 (
+0)
79.9
2%
349 (
+0)
79.9
0%
349 (
+0)
80.2
5%
349 (
+0)
80.3
0%
Tain
an
Co
un
ty
554 (
+0)
100%
554 (
+0)
100%
558 (
+4)
99.8
3%
559 (
+5)
99.8
3%
Kao
hsi
un
g C
ou
nty
622 (
+0)
100%
622 (
+0)
100%
627 (
+5)
99.9
6%
628 (
+6)
99.8
9%
Pin
gtu
ng
Co
un
ty
450 (
+0)
99.9
0%
450 (
+0)
99.9
0%
450 (
+0)
100%
450 (
+0)
100%
Yil
an
Co
un
ty
234 (
+3)
100%
232 (
+0)
100%
233 (
+2)
100%
234 (
+3)
100%
Hu
ali
en C
ou
nty
176 (
+2)
100%
175 (
+1)
100%
176 (
+2)
100%
176 (
+2)
100%
Tait
un
g C
ou
nty
146 (
+0)
100%
146 (
+0)
100%
146 (
+0)
100%
146 (
+0)
100%
To
tal
Eff
icie
ncy
–
2165.2
8
–
2166.5
7
–
2167.6
5
–
2167.7
2
Dow
nloa
ded
by [
Uni
vers
ity o
f Y
ork]
at 0
8:11
18
Oct
ober
201
4
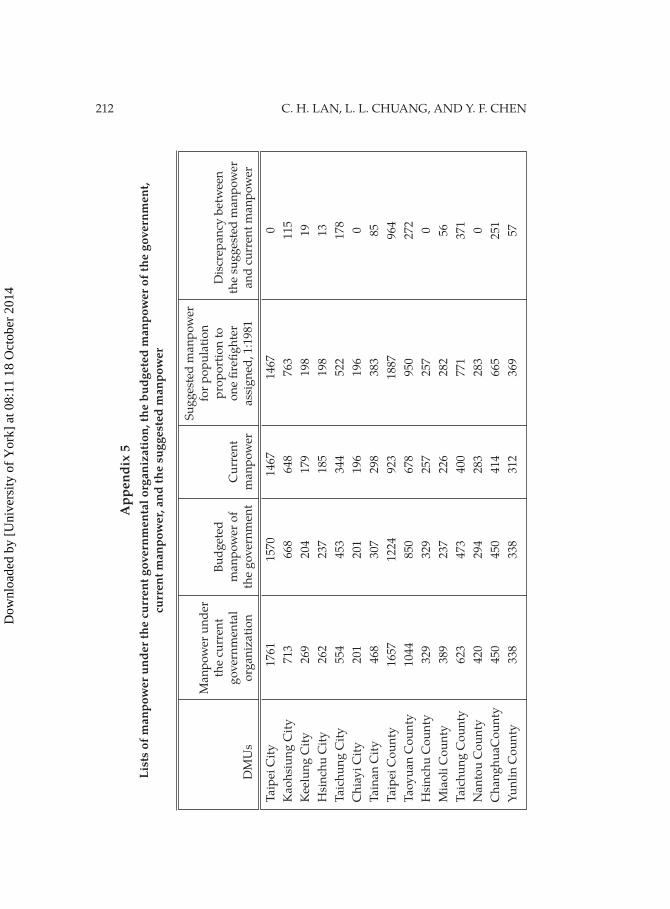
212 C. H. LAN, L. L. CHUANG, AND Y. F. CHEN
App
endi
x 5
List
s of
man
pow
er u
nder
the
curr
ent g
over
nmen
tal o
rgan
izat
ion,
the
budg
eted
man
pow
er o
f the
gov
ernm
ent,
curr
ent m
anpo
wer
, and
the
sugg
este
d m
anpo
wer
Su
gg
este
d m
an
po
wer
Man
po
wer
un
der
fo
r p
op
ula
tio
n
th
e cu
rren
t B
ud
get
ed
p
rop
ort
ion
to
D
iscr
epan
cy b
etw
een
g
ov
ern
men
tal
man
po
wer
of
Cu
rren
t o
ne
fi re
fi g
hte
r
the
sug
ges
ted
man
po
wer
DM
Us
org
an
izati
on
th
e g
ov
ern
men
t m
an
po
wer
ass
ign
ed, 1:1
981
an
d c
urr
ent
man
po
wer
Taip
ei C
ity
1761
1570
1467
1467
0
Kao
hsi
un
g C
ity
713
668
648
763
11
5
Kee
lun
g C
ity
269
204
179
198
19
Hsi
nch
u C
ity
262
237
185
198
13
Taic
hu
ng
Cit
y
554
453
344
522
17
8
Ch
iay
i C
ity
201
201
196
196
0
Tain
an
Cit
y
468
307
298
383
85
Taip
ei C
ou
nty
1657
1224
923
1887
96
4
Tao
yu
an
Co
un
ty
1044
850
678
950
27
2
Hsi
nch
u C
ou
nty
329
329
257
257
0
Mia
oli
Co
un
ty
389
237
226
282
56
Taic
hu
ng
Co
un
ty
623
473
400
771
37
1
Nan
tou
Co
un
ty
420
294
283
283
0
Ch
an
gh
uaC
ou
nty
450
450
414
665
25
1
Yu
nli
n C
ou
nty
338
338
312
369
57
Dow
nloa
ded
by [
Uni
vers
ity o
f Y
ork]
at 0
8:11
18
Oct
ober
201
4
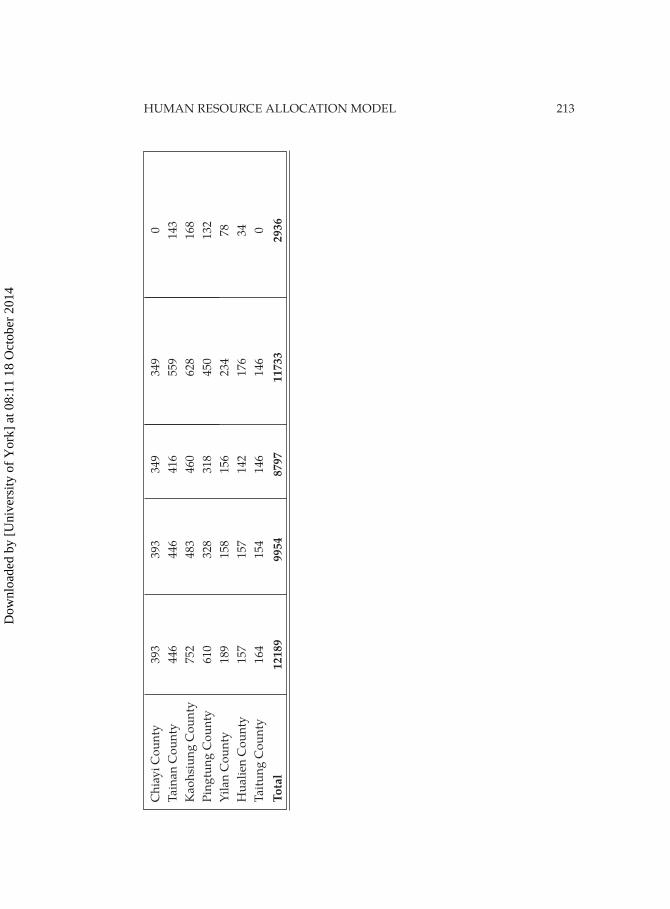
HUMAN RESOURCE ALLOCATION MODEL 213
Ch
iay
i C
ou
nty
393
393
349
349
0
Tain
an
Co
un
ty
446
446
416
559
14
3
Kao
hsi
un
g C
ou
nty
752
483
460
628
16
8
Pin
gtu
ng
Co
un
ty
610
328
318
450
13
2
Yil
an
Co
un
ty
189
158
156
234
78
Hu
ali
en C
ou
nty
157
157
142
176
34
Tait
un
g C
ou
nty
164
154
146
146
0
Tota
l 12
189
9954
87
97
1173
3 29
36
Dow
nloa
ded
by [
Uni
vers
ity o
f Y
ork]
at 0
8:11
18
Oct
ober
201
4
214 C. H. LAN, L. L. CHUANG, AND Y. F. CHEN
References
[1] National Fire Agency (ROC) 2008. The method of recruiting new fi re
fi ghters. Available at: http://www.nfa.gov.tw/uploadfi les/series/
200609072011.doc
[2] Fire Science Association, Optimal Allocation Scale of Manpower for Fire Concerns the Research Development. Japan: Modern Fire Publisher, 2006.
[3] Hatry, H.P., ‘The status of productivity measurement in the public
sector’, Public Administration Review, January-February, Vol. 38 (1),
(1978), pp. 28.
[4] Fortuin, L., ‘Performance Indicators-Why, Where and How’, European Journal of Operational Research, Vol. 34, (1988), pp. 1–9.
[5] Farrell, M. J., ‘The measurement of productivity eff iciency’, Journal of the Royal Statistical Society, Series A, Part 3, Vol. 120, (1957),
pp. 253–281.
[6] Szilagyi, A. D., Jr., Management and Performance, 2nd ed., New Jersey:
Scott, Foreman and Company, 1984.
[7] Robbins, S. P., Organizational Behavior, Concept, Controversies, and Ap-plication, 7th ed., New Jersey: Prentice-Hall, Inc., 1996.
[8] Richman, B. M. and Farmer, R. M., Management and Organizations,
New York: Random House Press, (1975), pp.364.
[9] Clarke, R. L., ‘Evaluating USAF vehicle maintenance productivity
over time: an application of data envelopment analysis’, Decision Sci-ence, Vol. 23 (2), (1992), pp. 376–384.
[10] Studit, E. F., ‘Productivity measurement in industrial operations’. Eu-ropean Journal of Operational Research, Vol. 85, (1995), pp. 435–453.
[11] Griliches, Z. and Regev, H., ‘Firm productivity in Israeli industry’,
Journal of Econometrics, Vol. 65, (1995), pp. 175–203.
[12] Feng, C. M., and Wang, R. T., ‘Performance evaluation for airlines
including the consideration of fi nancial ratios’, Journal of Air Transport Management. Vol. 6, (2000), pp. 133–142.
[13] Kaplan, R. S. and Norton, D. P., ‘The Strategy-Focused Organization:
How Balanced Scorecard Companies Thrive in the New Business En-
vironment’, 1st ed., Boston, MA: Harvard Business School Press, 2001.
[14] Agrell, P. and West, B.M. ‘A caveat on the measurement of produc-
tive eff iciency’, International Journal of Production Economics, Vol. 69,
(2001), pp. 1–14.
Dow
nloa
ded
by [
Uni
vers
ity o
f Y
ork]
at 0
8:11
18
Oct
ober
201
4
HUMAN RESOURCE ALLOCATION MODEL 215
[15] Banker, R.D. and Morey, R.C., ‘Eff iciency Analysis for Exogenously
Fixed Inputs and Outputs’, Operations Research, Vol. 34 (4), (1986),
pp. 513–521.
[16] Insurance Service off ice (1980). Fire Suppression Rating Schedule.
Available at http://www.iso.com/Products/Public-Protection-
Classifi cation-Service/Fire-Suppression-Rating-Schedule-FSRS-manual-
for-PPC-grading.html
[17] Charnes, A., Cooper, W. W. and Rhodes, E., ‘Measuring the eff iciency
of decision making units’, European Journal of Operational Research,
Vol. 2, (1978), pp. 429–444.
[18] Gleason, J. M. and Barnum, D. T., ‘Toward valid measures of public
sector productivity: performance measures in urban transit’, Manage-ment Science, Vol. 28 (4), (1982), pp. 379–386.
[19] Banker R. D., Charnes, A. and Cooper W. W., ‘Some models for esti-
mating technical and scale ineff iciencies in data envelopment analysis’,
Management Science, Vol. 30 (9), (1984), pp. 1078–1092.
[20] Forsund, F. R. and Hjalmarsson, L., ‘Generalised Farell measures of
eff iciency: an application to milk processing in Swedish dairy plants’,
The Economic Journal. Vol. 89, (1979), pp. 294–315.
[21] Athanassopoulos, A. D. ‘Using frontier eff iciency models as a tool
to re-engineer networks of public sector branches: An application to
the Hellenic tobacco Organization’. European Journal of Operational Research, Vol. 154, (2004), pp. 533–547.
[22] National Science Foundation, ‘Municipal Fire Service Workbook’,
USA. Government Printing Off ice, Washington D.C., 1977.
[23] Schaenman, P. S., ‘Measuring Fire Protection Productivity in Local
Government’, National Fire Protection Association, Boston, Massachu-
setts, 1974.
[24] Ministry of Interior (2007) Fire Engine, Equipment and Manpower Allocation Standards for the Municipality, County and City. Available at
http://w2.dbas.taipei.gov.tw/rule/B/B23.pdf.
[25] Hausner, J., Walker, W. and Swersey, A. ‘An analysis of the deploy-
ment of fi re-fi ghting resources in Yonkers’, R-1566/2-HUD/CY, Rand
Institute, New York, New York, October, 1974.
[26] Chaiken, J. M., Ignall, E. J. and Walker, W. E. ‘Fire department deploy-
ment analysis: A public policy analysis case study’, in The Rand Fire Project, New York: North Holland, 1979.
Dow
nloa
ded
by [
Uni
vers
ity o
f Y
ork]
at 0
8:11
18
Oct
ober
201
4
216 C. H. LAN, L. L. CHUANG, AND Y. F. CHEN
[27] Sanli, I. and Al-Tamimi, F., ‘The Spatial Distribution and Resource
Allocation of Fire Safety Service Systems’. Journal of King Saud University 2 Architecture and Planning, (1990), pp. 23–41.
[28] Lan, C-H., Chuang, L-L. and Chang, C-C. ‘An eff iciency-based
approach on human resource management: a case study of Tainan
county fi re branches in Taiwan’, Public Personnel Management: Interna-tional Public Management Association for Human Resources, Vol. 36 (2),
(2007), pp. 143–164.
[29] Golan, B. and Roll, Y., ‘An application procedure for DEA’, OMEGA.
Vol. 17 (3), (1989), pp. 237–250.
[30] Kao, C. ‘Data envelopment analysis in resource allocation: an appli-
cation to forest management’, International Journal of Systems Science,
UK, Vol. 31 (9), (2000), pp. 1059–1066.
[31] Coleman R. J., Granito, J. A. and Hickey, H.E., ‘Managing Fire
Services’, International City/County Management Association, (1979),
pp. 42–43.
[32] Lan, C. H. and Chuang, L. L., ‘Resource allocation strategy of police
organizations: a case study in Taiwan’. Journal Statistics & Management Systems, Vol. 11 (2), (2008), pp. 257–275.
[33] Bryan, J. L., Managing Fire Service. ICMA. US: International city Man-
agement, 1979.
[34] Thompson, J. R. and Lehew, C. ‘Skill-based pay as an organization-
al innovation’, Review of public Personnel Administration, Vol. 20 (1),
(2000), pp. 20–40.
Received January, 2010
Dow
nloa
ded
by [
Uni
vers
ity o
f Y
ork]
at 0
8:11
18
Oct
ober
201
4