Embed Size (px)
Citation preview
International Journal of Engineering Research and Technology.
ISSN 0974-3154 Volume 11, Number 7 (2018), pp. 1025-1036
© International Research Publication House
http://www.irphouse.com
Optimal Placement and Sizing of Grid-Tied SPV for
Power Loss Reduction and Voltage Profile
Improvement
E.G. Oibi 1 Pan African University, Institute for Basic Sciences, Technology and Innovation
(PAUISTI) Hosted at Jomo Kenyatta University of Agriculture and Technology,
Kenya.
G.N. Nyakoe
2 Department of Electrical Engineering,
Jomo Kenyatta University of Agriculture and Technology, Kenya.
C.W. Wekesa 3 Department of Electrical Engineering,
Technical University of Kenya, Kenya.
Abstract
Non-optimal placement and sizing of solar photovoltaic (SPV) system
results in minimal gain from the SPV as a distributed generator. Operation
of SPV at unity power factor (PF) results in supply of active power only
from the SPV whereas reactive power supply is supplied from the feeder
hence line losses due to reactive power flow. In this paper, particle swarm
optimization (PSO) has been used to optimize location, size and PF of SPV
with the aim of minimizing power loss and improving voltage profile. First,
the SPV generator is optimally located and sized at a unity PF and then the
power loss and voltage profile are monitored. Using the optimal SPV
generator, the optimal PF is obtained based on the power loss. Matlab
software is used for simulation, IEEE 33-bus test system and Backward
forward sweep method is used in carrying out power flow. When the SPV
is optimized at unity PF, there is significant power loss reduction and
voltage profile improvement. However, when the SPV is optimized at an
optimal PF, power loss reduction is enhanced and the voltage profile
improves further.
Keywords: Backward forward sweep method, Particle swarm optimization,
Power factor, power flow, Solar photovoltaic.
1026 E.G. Oibi, G.N. Nyakoe, C.W. Wekesa
I. INTRODUCTION
Distributed generation (DG) is production of power close to load centers. DG
integration to the grid has been increasing due to the following reasons: First, most
resources used in DG are renewable energy resources, hence, there is no emission of
greenhouse gases. Second, DG leads to deferral in investment on transmission and
distribution network. Third, DG helps in improving power quality and power system
reliability through reduction of power losses. Fourth, DG helps in diversification of
energy generation. Fifth, DG promotes competition in the electricity market [1]. Some
of the distributed generation technologies are: solar photovoltaic (SPV) systems, wind
turbines, micro-hydro turbines and fuel cells.
SPV as a DG generates power close to the loads and therefore enhances reduction in
distribution losses and improves the voltage profile. However, this is true up to some
level of DG penetration above which, power losses start increasing [2]. Grid-tied SPV
systems are connected to the grid either in the distribution or the transmission level
through the inverter. The inverter converts DC power from solar PV modules to AC
power. The AC power from the inverter can be transferred either to the loads or to the
grid [3].
Integration of SPV to the grid can have positive or negative impacts depending on the
size and location of the solar photovoltaic system [4]. Integration of SPV to the grid has
an impact on the voltage and current profiles, the power factor of the system, power
system reliability, power quality and power system protection. The extent of the impact
of solar PV system on the various issues depends on the location and the penetration
levels of SPV generators [5].
The power system cannot be completely efficient; however, it can be optimally operated
to minimize these losses [6]. SPV generator can be installed at the distribution network
to facilitate in the reduction of distribution losses. The ability of SPV to help in power
loss reduction in power systems is limited by the SPV penetration. To enjoy the benefits
of SPV as a DG, the SPV integration should be optimally located and sized.
Research on optimal placement and sizing of SPV has attracted interest from a number
of researchers. In [7], approximate reasoning was used for optimal location and sizing
of SPV to minimize power loss and maintain the voltage profile. The SPV system was
optimized for active power injection at the node of connection. Authors in [8] proposed
optimal placement and sizing of SPV system to improve efficiency of a rural electricity
power supply using Hybrid Optimization of Multiple Electric Renewables (HOMER)
based technique. Using these techniques, the solar PV was optimally located and sized
to supply active power and therefore help in power loss reduction and voltage profile
improvement. In reference [9], Particle Swarm Optimization (PSO) was employed for
optimal placement of solar PV in the distribution network for power loss reduction. The
solar PV was operated at unity power factor and therefore, providing active power only.
In [10], authors employed binary particle swarm optimization in distribution systems
to determine optimal number and size of solar PV units on a radial distribution system.
The analysis of the system was done using active power injected and power loss per
annum. Refence [11] presents optimal placement and sizing of SPV considering load
Optimal Placement and Sizing of Grid-Tied SPV For Power Loss…. 1027
ability index considering that the SPV injects active power only. Authors in [12] used
GA for optimization of location and size of DG to minimize power loss. All these
researches considered the SPV as an active power generator only.
Further, research on optimal sizing and location of SPV have assumed that the inverter
can only generate active power, therefore, the power factor is assumed to be unity. The
focus has been to identify optimal size and location; however, inverters have the ability
to produce both active and reactive power. In this paper, a method is proposed that
optimizes the power factor of an SPV in addition to the optimal location and sizing
considering that the SPV system generates both active and reactive power through the
help of inverters. The research therefore goes a step further to identify an optimal power
factor for grid-tied SPV in addition to optimal size and location with the aim of reducing
the power loss and improving the voltage profile. The proposed method uses particle
swarm optimization (PSO) technique in the optimization process.
II. RESEARCH METHOD
II.I Problem Formulation
Optimal location and sizing of solar PV systems can lead to reduced power losses and
enhanced voltage profiles in distribution networks. In this paper, a method based on
particle swarm optimization to determine the optimal location, size and power factor of
a grid-tied solar PV generator, is presented.
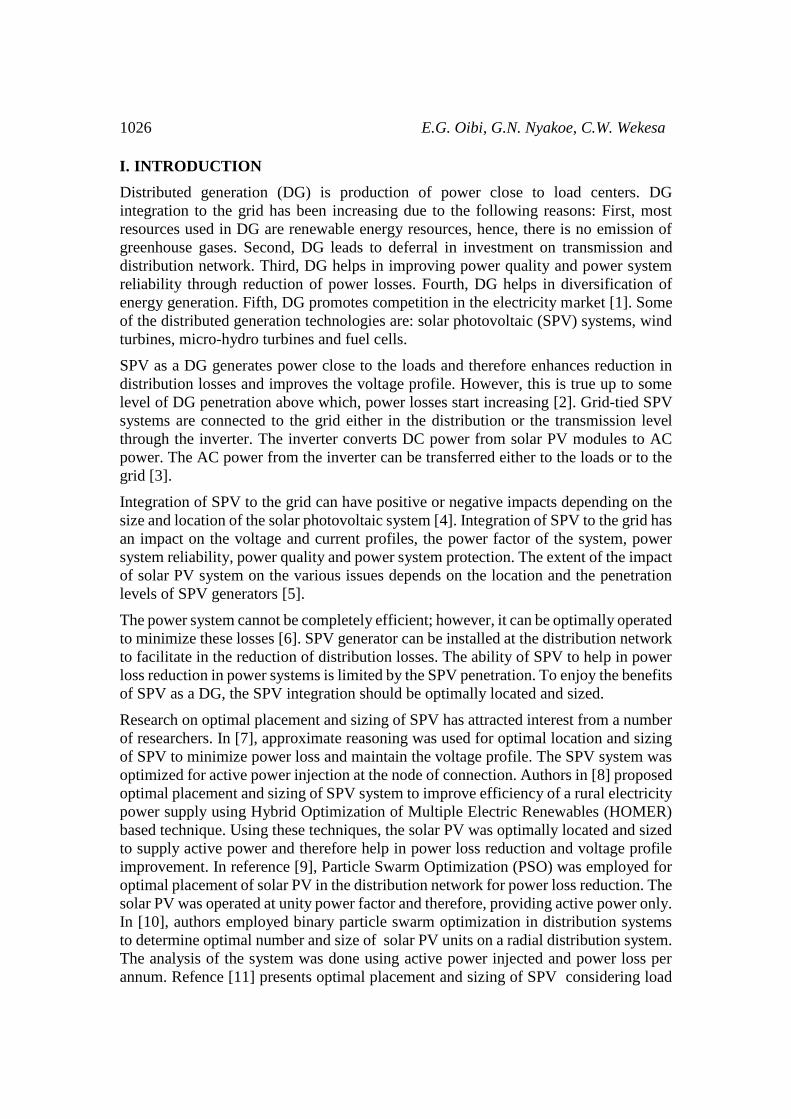
The problem formulation is based on a radial distribution network with one feeder and
n buses as shown in Fig. 1 [13]. In this line diagram, v0 and vn are the sending end and
receiving end bus voltages, and vk is the voltage at bus k, k =1,2,3, …, n.
Fig 1: Single line diagram of a distribution network
k kP + jQ
+1k,kR + jX +1k,k
1k+1 k+P + jQ
1 1L,k+ L,k+P + jQ
0vkv
1kv nv
n nP + jQ
Sending End Receiving End
1028 E.G. Oibi, G.N. Nyakoe, C.W. Wekesa
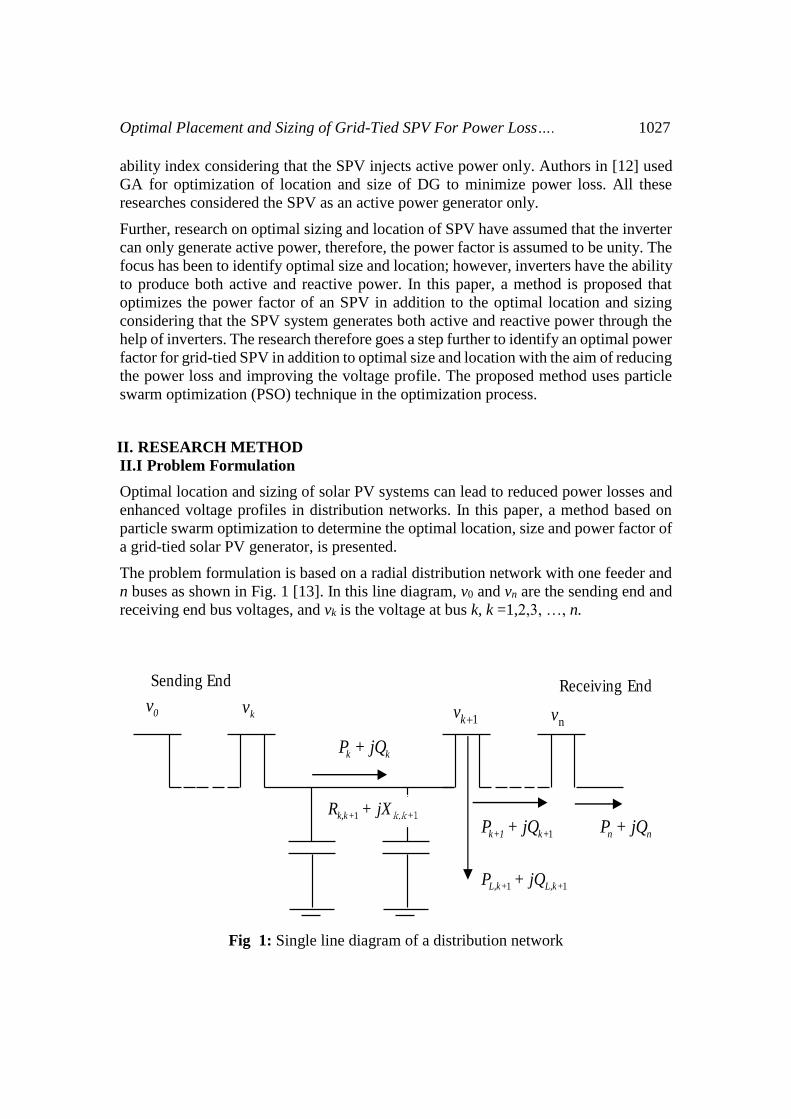
The real and reactive power flowing out of bus k + 1 can respectively be calculated as
per equation 1 and 2.
( +1) 1k+1 k Loss, k,k L,k+P = P - P - P (1)
+1 ( +1) +1k k Loss, k,k L,kQ = Q -Q -Q (2)
where Pk and Qk are active and reactive power flowing out of bus k, respectively. PLoss,
(k, k+1) and QLoss, (k, k+1) are the active and reactive power losses between bus k and bus k
+ 1, and PL, k+1 and QL, k+1 are the real and reactive load power demands at bus k + 1,
respectively. The line losses between bus k and k + 1 are calculated as follows:
2 2
( +1) ( +1) 2
k k
Loss, k, k k,k
k
P +QP = R
V
(3)
2 2
k k
( +1) ( +1) 2
k
Loss, k,k k,k
P +QQ = X
V
(4)
where R(k,k+1) and X(k,k+1) are the resistance and reactance between bus k and bus k+1
respectively. Total active power lines losses PT,Loss and reactive power line losses QT,Loss
are the sum of all lines losses in the system as given by equation 5 and 6 respectively.
2 2
( +1) 2
nk k
T,Loss k,k
k=1 k
P +QP = R
V
(5)
2 2
k kT,Loss (k,k 1) 2
k
n P +QQ = X
Vk=1
(6)
The objective function to be minimized for optimal power losses (denoted by F) is
given by
2 2
( +1) 2
nk k
T,Loss k,k
k=1 k
P +QF = P = R
V
(7)
II.II Particle swarm optimization technique
Particle swarm optimization technique is a metaheuristic algorithm developed by Dr.
Eberhart and Dr. Kennedy in 1995 and it is inspired by social behaviour of animals like
bird flocking or fish schooling [14]. Particles are potential solutions to the problem
being optimized, thus, starting from the randomly distributed particles, the algorithm
tries to improve the solution according to a particular objective function.
PSO works on two principles: communication and learning. The algorithm contains a
population of candidate solutions called a swarm of particles and every particle is a
Optimal Placement and Sizing of Grid-Tied SPV For Power Loss…. 1029
candidate solution to the optimization problem in question. Any particle has a position
in the search space of the optimization problem where the search space is a set of all
possible solutions of the optimization problem. PSO tries to determine the best solution
amongst these possible solutions through exploitation and exploration. Exploration
makes the search algorithm to move towards its global optimum whereas exploitation
makes the search algorithm to move towards a local optimum. To get better results,
there should be balance between exploration and exploitation.
For any particle i, its position at a time step t is denoted by vector xi(t) in the search
space X. Every particle has a velocity denoted by vi (t) over the same space as the
position of the respective particle. Every particle has a memory of its own best
experience called personal best denoted by pi(t). Among the members of the swarm,
there is a common best experience, denoted by g(t) , which is referred to as the global
best [14].
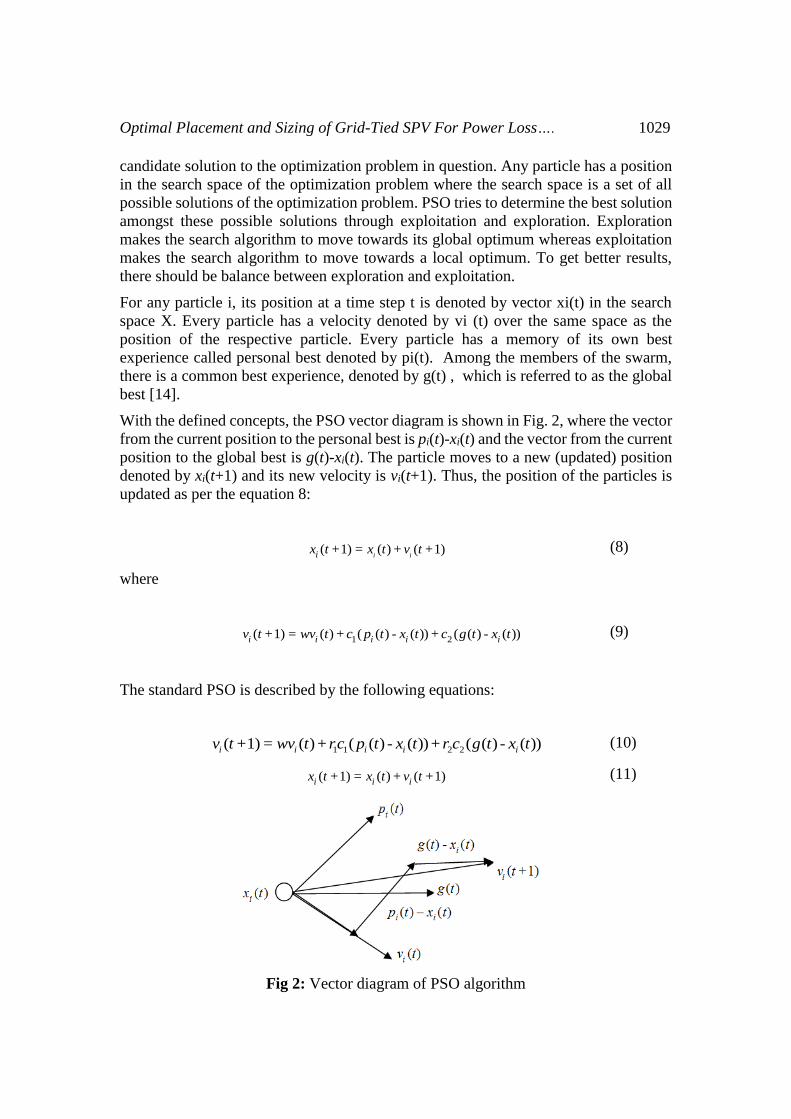
With the defined concepts, the PSO vector diagram is shown in Fig. 2, where the vector
from the current position to the personal best is pi(t)-xi(t) and the vector from the current
position to the global best is g(t)-xi(t). The particle moves to a new (updated) position
denoted by xi(t+1) and its new velocity is vi(t+1). Thus, the position of the particles is
updated as per the equation 8:
( 1) ( ) ( 1)i iix t + = x t +v t + (8)
where
1 2( 1) ( ) ( ( ) ( )) ( ( ) ( ))i i i i iv t + = wv t +c p t - x t +c g t - x t (9)
The standard PSO is described by the following equations:
1 1 2 2( +1) ( ) ( ( ) ( )) ( ( ) ( ))i i i i iv t = wv t +rc p t - x t +r c g t - x t (10)
( +1) ( ) ( +1)i i ix t = x t +v t (11)
Fig 2: Vector diagram of PSO algorithm
1030 E.G. Oibi, G.N. Nyakoe, C.W. Wekesa
where 𝑟1 and 𝑟2 are random values between 0 and 1, and c1 and c2 are acceleration
coefficients, and w is the inertia coefficient.
To improve the performance of the basic PSO, a number of variations have been
developed to improve on its speed of convergence and on the quality of the solution
[14]. In one such variation, known as velocity clamping, exploration is controlled by
using high values of velocity for global exploration and low values of velocity for local
exploration. Another variation is based on altering the inertia weight to create a balance
between exploration and exploitation [15]. Alteration of the inertia weight controls the
momentum of the particles and thus helps in achieving optimum convergence.
II.III Algorithm simulation flow chart
Simulation of the optimization algorithm for the problem formulated in section II.I was
carried out under Matlab environment, executed as per the flowchart shown in Fig 3.
Two types of data for the IEEE 33-bus system, namely, line data and bus data, were
used. Base case load flow was carried out using backward forward sweep and PSO
methods and the bus and average voltages, and active and reactive power losses were
noted. For all buses except bus 1 (slack bus), the optimal size of the solar PV generator
(X) was obtained and the corresponding power loss recorded. The optimal size of SPV
generator at unity power factor and the corresponding optimal bus for SPV integration
are then identified based on recorded data. An optimal power factor was subsequently
obtained by using the optimal combination of real and reactive power using the size of
SPV generator that minimizes power loss at unity power factor.
III. RESULTS AND ANALYSIS
On carrying out load flow for the base case, where the base case refers to the IEEE 33-
bus without SPV integrated to it, the real and reactive power losses were obtained as
210.07 kW and 142.44 kVar, respectively. Using PSO, the optimal location of a single
SPV generator to realize maximum power loss reduction is identified as bus 6 and
optimal size of the SPV at a unity power factor was 2605.82 kW. On integration of this
generator at bus 6 and again performing load flow, the power loss of the test system
reduced to 109.55 kW which is equivalent to 47.85 % power loss reduction. Using the
PSO technique and the 2663.3 kW SPV, the optimal active and reactive power from the
generator were identified as 2151.40 kW and 1470.30 kVar, respectively, and hence the
optimal power factor is 0.826. Operating the optimal SPV generator at a power factor
of 0.826 yielded real power losses at 71.09 kW representing a power loss reduction of
66.16 % on the base case.
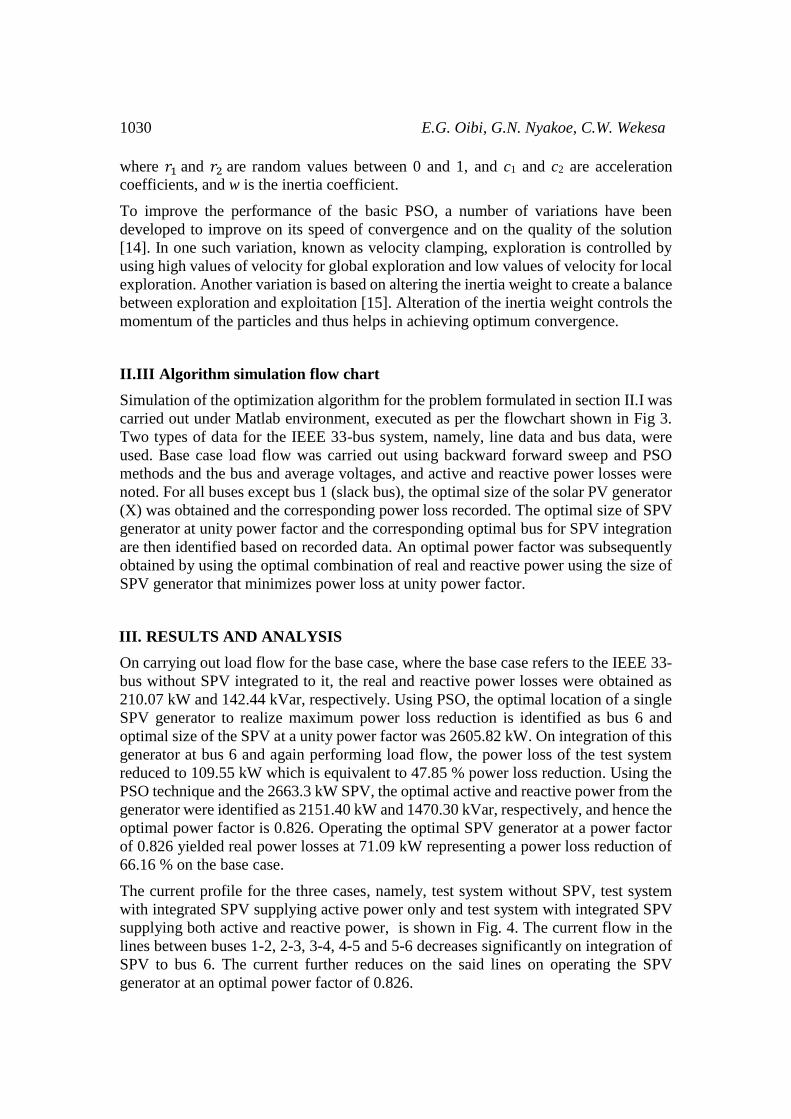
The current profile for the three cases, namely, test system without SPV, test system
with integrated SPV supplying active power only and test system with integrated SPV
supplying both active and reactive power, is shown in Fig. 4. The current flow in the
lines between buses 1-2, 2-3, 3-4, 4-5 and 5-6 decreases significantly on integration of
SPV to bus 6. The current further reduces on the said lines on operating the SPV
generator at an optimal power factor of 0.826.

Optimal Placement and Sizing of Grid-Tied SPV For Power Loss…. 1031
Fig 3: Flow chart for optimization
Receive data from IEEE-33 bus test system (base case)
Start
Power flow analysis (Base Case)P (base loss) =P(generation)-P(loads)
Starting from bus n=2, run PSO Algorithm and obtain size of SPV
that minimizes losses
n<33 Yes
Declare optimal location and size.
No
End
n=n+1
Run PSO algorithm to obtain optimal combination of P& Q, hence power
factor that minimizes losses.
Is voltage criterion satsfied?
Yes
No
1032 E.G. Oibi, G.N. Nyakoe, C.W. Wekesa
Fig 4: IEEE 33-bus current profile
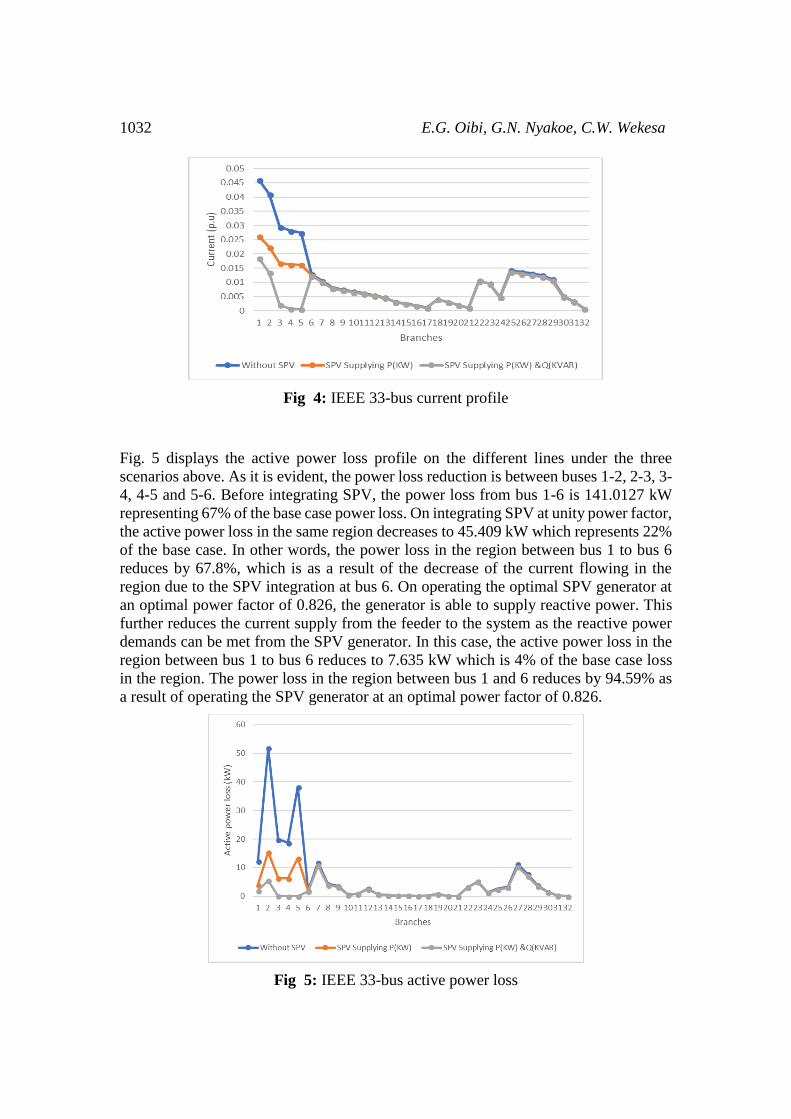
Fig. 5 displays the active power loss profile on the different lines under the three
scenarios above. As it is evident, the power loss reduction is between buses 1-2, 2-3, 3-
4, 4-5 and 5-6. Before integrating SPV, the power loss from bus 1-6 is 141.0127 kW
representing 67% of the base case power loss. On integrating SPV at unity power factor,
the active power loss in the same region decreases to 45.409 kW which represents 22%
of the base case. In other words, the power loss in the region between bus 1 to bus 6
reduces by 67.8%, which is as a result of the decrease of the current flowing in the
region due to the SPV integration at bus 6. On operating the optimal SPV generator at
an optimal power factor of 0.826, the generator is able to supply reactive power. This
further reduces the current supply from the feeder to the system as the reactive power
demands can be met from the SPV generator. In this case, the active power loss in the
region between bus 1 to bus 6 reduces to 7.635 kW which is 4% of the base case loss
in the region. The power loss in the region between bus 1 and 6 reduces by 94.59% as
a result of operating the SPV generator at an optimal power factor of 0.826.
Fig 5: IEEE 33-bus active power loss
Optimal Placement and Sizing of Grid-Tied SPV For Power Loss…. 1033
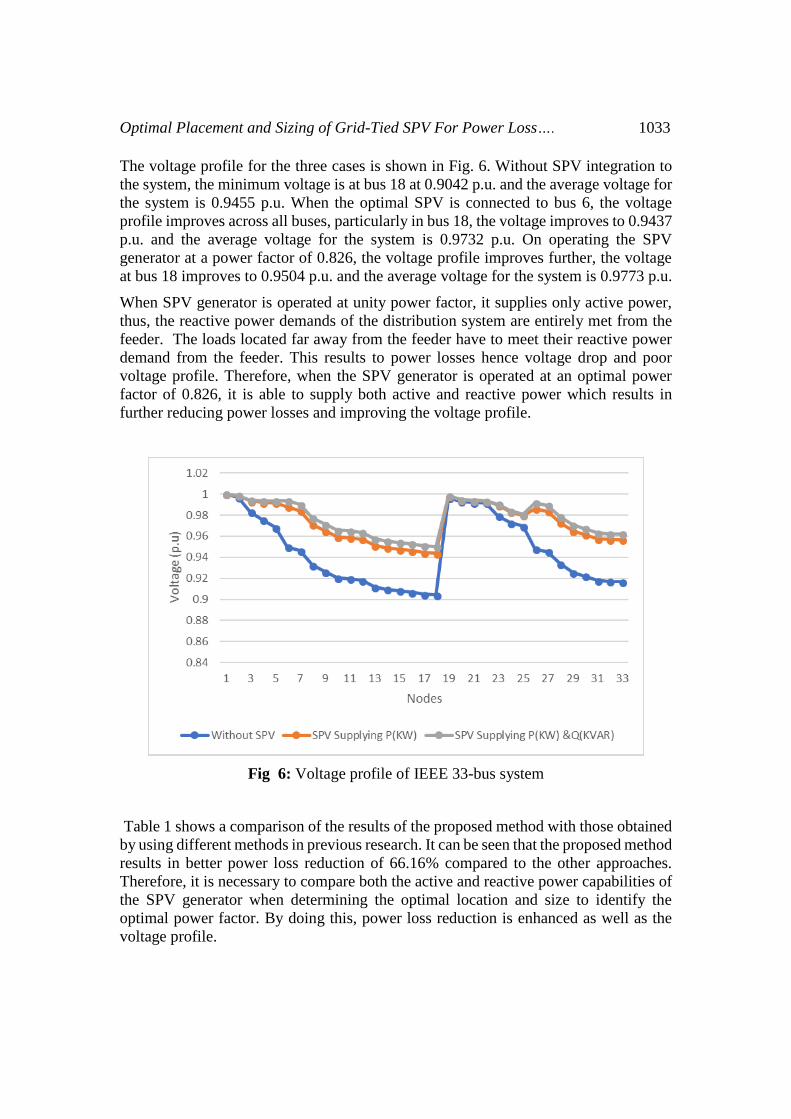
The voltage profile for the three cases is shown in Fig. 6. Without SPV integration to
the system, the minimum voltage is at bus 18 at 0.9042 p.u. and the average voltage for
the system is 0.9455 p.u. When the optimal SPV is connected to bus 6, the voltage
profile improves across all buses, particularly in bus 18, the voltage improves to 0.9437
p.u. and the average voltage for the system is 0.9732 p.u. On operating the SPV
generator at a power factor of 0.826, the voltage profile improves further, the voltage
at bus 18 improves to 0.9504 p.u. and the average voltage for the system is 0.9773 p.u.
When SPV generator is operated at unity power factor, it supplies only active power,
thus, the reactive power demands of the distribution system are entirely met from the
feeder. The loads located far away from the feeder have to meet their reactive power
demand from the feeder. This results to power losses hence voltage drop and poor
voltage profile. Therefore, when the SPV generator is operated at an optimal power
factor of 0.826, it is able to supply both active and reactive power which results in
further reducing power losses and improving the voltage profile.
Fig 6: Voltage profile of IEEE 33-bus system
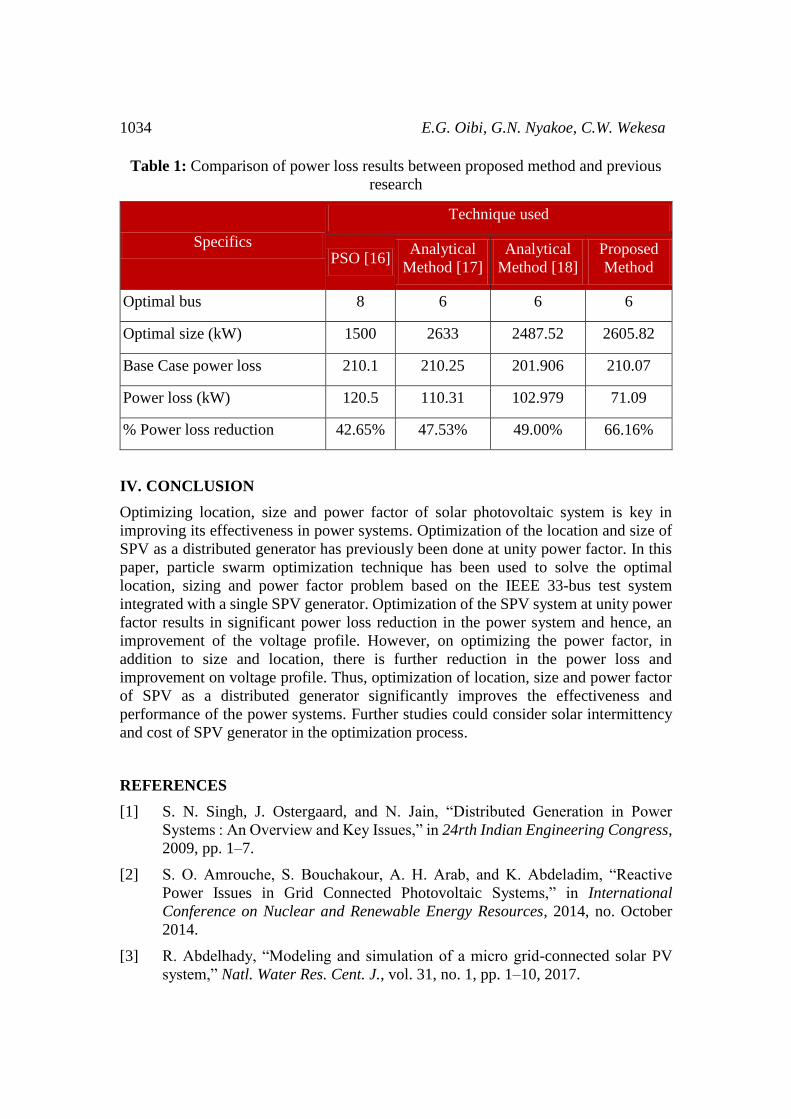
Table 1 shows a comparison of the results of the proposed method with those obtained
by using different methods in previous research. It can be seen that the proposed method
results in better power loss reduction of 66.16% compared to the other approaches.
Therefore, it is necessary to compare both the active and reactive power capabilities of
the SPV generator when determining the optimal location and size to identify the
optimal power factor. By doing this, power loss reduction is enhanced as well as the
voltage profile.
1034 E.G. Oibi, G.N. Nyakoe, C.W. Wekesa
Table 1: Comparison of power loss results between proposed method and previous
research
Specifics
Technique used
PSO [16] Analytical
Method [17]
Analytical
Method [18]
Proposed
Method
Optimal bus 8 6 6 6
Optimal size (kW) 1500 2633 2487.52 2605.82
Base Case power loss 210.1 210.25 201.906 210.07
Power loss (kW) 120.5 110.31 102.979 71.09
% Power loss reduction 42.65% 47.53% 49.00% 66.16%
IV. CONCLUSION
Optimizing location, size and power factor of solar photovoltaic system is key in
improving its effectiveness in power systems. Optimization of the location and size of
SPV as a distributed generator has previously been done at unity power factor. In this
paper, particle swarm optimization technique has been used to solve the optimal
location, sizing and power factor problem based on the IEEE 33-bus test system
integrated with a single SPV generator. Optimization of the SPV system at unity power
factor results in significant power loss reduction in the power system and hence, an
improvement of the voltage profile. However, on optimizing the power factor, in
addition to size and location, there is further reduction in the power loss and
improvement on voltage profile. Thus, optimization of location, size and power factor
of SPV as a distributed generator significantly improves the effectiveness and
performance of the power systems. Further studies could consider solar intermittency
and cost of SPV generator in the optimization process.
REFERENCES
[1] S. N. Singh, J. Ostergaard, and N. Jain, “Distributed Generation in Power
Systems : An Overview and Key Issues,” in 24rth Indian Engineering Congress,
2009, pp. 1–7.
[2] S. O. Amrouche, S. Bouchakour, A. H. Arab, and K. Abdeladim, “Reactive
Power Issues in Grid Connected Photovoltaic Systems,” in International
Conference on Nuclear and Renewable Energy Resources, 2014, no. October
2014.
[3] R. Abdelhady, “Modeling and simulation of a micro grid-connected solar PV
system,” Natl. Water Res. Cent. J., vol. 31, no. 1, pp. 1–10, 2017.
Optimal Placement and Sizing of Grid-Tied SPV For Power Loss…. 1035
[4] D. M. Tobnaghi and R. Vafaei, “The impacts of grid-connected photovoltaic
system on Distribution networks- A review,” ARPN J. Eng. Appl. Sci., vol. 11,
no. 5, pp. 3564–3570, 2016.
[5] J. H. R. Enslin, “Network impacts of high penetration of photovoltaic solar
power systems,” in IEEE PES General Meeting, 2010, pp. 1–5.
[6] M. C. Anumaka, “Analysis of Technical Losses in Electrical Power System (
Nigerian 330Kv Network As a Case Study ),” Int. J. Res. Rev. Appl. Sci., vol. 12,
no. August, pp. 320–327, 2012.
[7] M. Jamil and S. Kirmani, “Optimal allocation of SPV based DG system for loss
reduction and voltage improvement in radial distribution systems using
approximate reasoning,” India Int. Conf. Power Electron. IICPE, 2012.
[8] A. Marneni, A. D. Kulkarni, and T. Ananthapadmanabha, “Loss Reduction and
Voltage Profile Improvement in a Rural Distribution Feeder Using Solar
Photovoltaic Generation and Rural Distribution Feeder Optimization Using
HOMER,” Procedia Technol., vol. 21, pp. 507–513, 2015.
[9] A. Jayavarma and T. Joseph, “Optimal Placement of Solar PV in Distribution
System using Particle Swarm Optimization,” Int. J. Adv. Res. Electr. Electron.
Instrum. Eng., vol. 4, no. 9, pp. 329–337, 2013.
[10] N. Phuangpornpitak and S. Tia, “Optimal Photovoltaic Placement by Self-
organizing Hierarchical Binary Particle Swarm Optimization in Distribution
Systems,” Energy Procedia, vol. 89, pp. 69–77, 2016.
[11] M. Nouri and M. Mokhtari, “Improvement of Loadability in Distribution System
Using Genetic Algorithm,” Adv. Comput. An Int. Journa, vol. 3, no. 3, pp. 1–18,
2012.
[12] T. R. Ayodele, A. S. O. Ogunjuyigbe, and O. O. Akinola, “Optimal location,
sizing, and appropriate technology selection of distributed generators for
minimizing power loss using genetic algorithm,” J. Renew. …, vol. 2015, 2015.
[13] J. A. M. Rupa and S. Ganesh, “Power Flow Analysis for Radial Distribution
System Using Backward / Forward Sweep Method,” Int. J. Electr. Comput. Eng.,
vol. 8, no. 10, pp. 1628–1632, 2014.
[14] S. S. Y. Rini, Dian Palupi, Siti Mariyam Shamsuddin, “Particle Swarm
Optimization : Technique , System and Challenges,” Int. J. Comput. Appl., vol.
14, no. 1, pp. 19–27, 2011.
[15] R. Kumar, U. Agarwal, A. K. Sahu, and R. Anand, “Utility of PSO for power
loss minimization in a Power System Network,” no. 1, pp. 1–6, 2014.
[16] S. M. Dawoud, L. Xiangning, F. M. F. Flaih, and M. I. Okba, “PSO Algorithm
for Optimal Placement of Multiple Spy Based Distributed Generators in
Microgrids,” in 2016 IEEE PES Asia-Pacific Power and Energy Conference -
Xi’an - Chin, 2016, pp. 125–129.

1036 E.G. Oibi, G.N. Nyakoe, C.W. Wekesa
[17] M. Jamil and A. S. Anees, “Optimal sizing and location of SPV ( solar
photovoltaic ) based MLDG ( multiple location distributed generator ) in
distribution system for loss reduction , voltage pro fi le improvement with
economical bene fi ts,” Elsevier, vol. 103, pp. 231–239, 2016.
[18] N. Madjissembaye, L. Thiaw, C. M. Muriithi, and C. W. Wekesa, “Optimal
Siting and Sizing of Single SPV System in Radial Distribution Network for Loss
Reduction Based on Maximum Power Saving Technique,” vol. 6, no. July, pp.
30–36, 2016.