Embed Size (px)
Citation preview

Supporting Informed Decisions
O P T I M A L T H E R A P Y R E P O R T
COMPUSVol 3, Issue 4March 2009
Current Utilization of Blood Glucose Test Strips in Canada
À l’appui des décisions éclairées
This report is prepared by the Canadian Optimal Medication Prescribing and Utilization Service (COMPUS), a service of the Canadian Agency for Drugs and Technologies in Health (CADTH). This report is based on utilization information available at the time of report preparation and has not been reviewed by peers. The information in this report should not be used as a substitute for the application of clinical judgement in respect of the care of a particular patient or other professional judgement in any decision making process nor is it intended to replace professional medical advice. While CADTH has taken care in the preparation of the report to ensure that its contents are accurate, complete and up-to-date, CADTH does not make any guarantee to that effect. CADTH is not responsible for any errors or omissions or injury, loss or damage arising from or as a result of the use (or misuse) of any information contained in or implied by the information in this report. CADTH takes sole responsibility for the final form and content of this report. The statements, conclusions, and views expressed herein do not necessarily represent the view of Health Canada or any provincial or territorial government. Production of this report is made possible through a financial contribution from Health Canada. Copyright © CADTH 2009. This report may be reproduced for non-commercial purposes only and provided appropriate credit is given to CADTH.
ISSN: 1921-698X

External Consultants
COMPUS staff would like to thank the following people for their time, assistance, and expert input throughout the project, including guidance on the approach and methods and constructive feedback on drafts of this report.
Dr. Marshall Dahl, MD PhD FRCPC Clinical Associate Professor, Division of Endocrinology, University of British Columbia
Contributors from COMPUS
Denis Bélanger, BScPhm ACPR Director, COMPUS Topics and Research
Melissa Severn, MISt Information Specialist
Heather Bennett, BPharm PhD Manager, COMPUS Research
Barb Shea, BSP Vice-President, COMPUS
Chris Cameron, BSc DipEng MSc Health Economist
Sumeet R. Singh, BScPhm MSc RPh Officer, Optimal Practice

COMPUS Expert Review Committee Dr. Lisa Dolovich, Chair Research Director and Associate Professor, Department of Family Medicine, McMaster University Ambulatory Care Pharmacotherapy Specialist, St. Joseph’s Healthcare Associate Director, Centre for Evaluation of Medicines
Dr. Mike Evans, Vice-Chair Director, Patient Self-Management and Knowledge Support Centre for Effective Practice, Department of Family and Community Medicine, University of Toronto Director, Health Media Lab, Li Ka Shing Knowledge Institute Staff Physician, Toronto Western Hospital Associate Professor, University of Toronto
Members
Dr. Michael Allen Associate Professor, Director, Evidence-based Programs, Continuing Medical Education, Dalhousie University
Dr. Marilyn Caughlin Family Practitioner
Dr. Scott Klarenbach Assistant Professor, Department of Medicine, Division of Nephrology, University of Alberta Fellow, Institute of Health Economics
Ms. Cathy MacNutt Public Member
Mr. Panos Petrides Public Member
Dr. Adil Virani Director, Pharmacy Services, Fraser Health Authority Associate Professor, Faculty of Pharmaceutical Sciences, University of British Columbia
Specialist Expert Members
Dr. Marshall Dahl Clinical Associate Professor, Division of Endocrinology, University of British Columbia
Dr. Heather Dean Professor of Pediatrics and Child Health Associate Dean (Academic), Faculty of Medicine, Department of Pediatrics, Section of Pediatric Endocrinology and Metabolism, University of Manitoba
Dr. Ann Colbourne Director, Division of General Internal Medicine, University of Alberta
Dr. Ehud Ur Professor of Medicine, University of British Columbia Head, Division of Endocrinology, St. Paul’s Hospital and Vancouver General Hospital

Conflicts of Interest
Dr. Lisa Dolovich was a co-investigator in studies on behaviour change interventions funded by Merck Frosst Canada Ltd., GlaxoSmithKline Inc., Aventis Pharma Ltd., Eli Lilly Canada Inc., and Crystaal Corporation. Dr. Michael Evans has received grant support from AstraZeneca Canada Inc. to offset the cost of Mini-Med School, an educational program for the public. Dr. Scott Klarenbach is a member of a research group funded by an unrestricted grant from Amgen Canada Inc. and Merck Frosst Canada Ltd. to the Alberta Kidney Disease Network. Dr. Ann Colbourne has received honoraria for educational lectures for Novo Nordisk Canada Inc., LifeScan Inc., Sanofi-Aventis Canada Inc., AstraZeneca Canada Inc., Pfizer Canada Inc., and Merck Frosst Canada Ltd. of $5,000 or less. She was involved in a community-based inter-professional collaborative chronic disease management program, funded by AstraZeneca Canada Inc., Pfizer Canada Inc., and Merck Frosst Canada Ltd. Dr. Marshall Dahl has received an honorarium for less than $5,000 from Eli Lilly Canada Inc. for his work related to workshops. He has also received an arms-length grant for a diabetes study in coronary artery patients from GlaxoSmithKline Inc. Dr. Heather Dean has received financial support from Eli Lilly Canada Inc. to attend an investigators’ meeting on growth hormones in 2005. Dr. Ehud Ur has received honoraria for educational lectures, honoraria for organizing conferences, or other honoraria for $5,000 or less from GlaxoSmithKline Inc., Novo Nordisk Canada Inc., Sanofi-Aventis Canada Inc., Merck Frosst Canada Ltd., and Novartis Pharmaceuticals Canada Inc. He has received funding for consultant or advisory services from GlaxoSmithKline Inc. and Novo Nordisk Canada Inc., and has received research grants through the Queen Elizabeth II Foundation (Halifax) from GlaxoSmithKline Inc., Novo Nordisk Canada Inc., and LifeScan Inc.
Current Utilization of Blood Glucose Test Strips in Canada i
ABBREVIATIONS C$ Canadian dollars
CAC COMPUS Advisory Committee
CADTH Canadian Agency for Drugs and Technologies in Health
CCOHTA Canadian Coordinating Office for Health Technology Assessment
CERC COMPUS Expert Review Committee
COMPUS Canadian Optimal Medication Prescribing and Utilization Service
NIHB Non-Insured Health Benefits (Program)
NPDUIS National Prescription Drug Utilization Information System
SMBG self-monitoring of blood glucose

Current Utilization of Blood Glucose Test Strips in Canada ii
TABLE OF CONTENTS ABBREVIATIONS ....................................................................................................................................... i 1 INTRODUCTION .............................................................................................................................. 1
1.1 COMPUS Expert Review Committee................................................................................................. 1 2 THE ISSUE ........................................................................................................................................ 2
2.1 Diabetes Mellitus...................................................................................................................................2 2.1.1 Management of blood glucose levels in diabetes mellitus ...........................................3 2.1.2 Technology description — self-monitoring of blood glucose .......................................3
3 OBJECTIVE........................................................................................................................................ 3 4 PROJECT OVERVIEW .......................................................................................................................4 5 METHODS ........................................................................................................................................ 5
5.1 Data Source .............................................................................................................................................5 5.2 Data Analysis ..........................................................................................................................................5
6 RESULTS .......................................................................................................................................... 6
6.1 Publicly Funded Drug Plans in Canada............................................................................................ 6 6.2 Ontario Drug Benefit Program .......................................................................................................... 6
6.2.1 Blood glucose test strip utilization ..................................................................................... 6 6.2.2 Expenditures on blood glucose test strips ........................................................................ 8
6.3 Privately funded drug plans.............................................................................................................10 6.3.1 Blood glucose test strip utilization ...................................................................................10 6.3.2 Expenditure on blood glucose test strips ........................................................................13
7 DISCUSSION ...................................................................................................................................17 8 CONCLUSION ................................................................................................................................ 18 9 REFERENCES .................................................................................................................................. 18

Current Utilization of Blood Glucose Test Strips in Canada iii
LIST OF TABLES Table 1: Number of Blood Glucose Test Strips Claimed, Total Expenditure, and Average Cost Per Blood Glucose Test Strip for Publicly Funded Drug Plans in Canada in 2006, by Jurisdiction............................................................................................................................................... 6 Table 2: Number of Patients in Ontario Drug Benefit Program Who Had At Least One Claim for Blood Glucose Test Strips in 2006, By Age and Treatment Group .............................................7 Table 3: Number of Patients, Claims, and Blood Glucose Test Strips in a 12-Month Period for Patients in the Ontario Drug Benefit Program Who Had At Least One Claim for Blood Glucose Test Strips in 2006, By Treatment Group..........................................................................7 Table 4: Expenditure on Blood Glucose Test Strips Claimed from the Ontario Drug Benefit Program in a 12-month Period, for Patients Who Had At Least One Claim for Blood Glucose Test Strips in 2006, By Treatment and Age Group ........................................................ 9 Table 5: Number of Patients in Privately Funded Drug Plans Who Had At Least One Claim for Blood Glucose Test Strips in 2006, By Age and Treatment Group .......................................... 10 Table 6: Number of Patients, Claims, and Blood Glucose Test Strips in a 12-Month Period, for Patients in Privately Funded Drug Plans Who Had At Least One Claim for Blood Glucose Test Strips in 2006, By Treatment Group.........................................................................................11 Table 7: Expenditure By Privately Funded Drug Plans Over a 12-Month Period for Patients Who Had At Least One Claim for Blood Glucose Test Strips in 2006, By Jurisdiction and Treatment Group ..................................................................................................................................14 Table 8: Expenditure on Blood Glucose Test Strips Claimed from Privately Funded Drug Plans in Canada in a 12-Month Period, for Patients Who Had At Least One Claim for Blood Glucose Test Strips in 2006, By Treatment and Age Group ...................................................... 15
LIST OF FIGURES Figure 1: Flow chart of COMPUS process ....................................................................................................... 4 Figure 2: Average Number of Blood Glucose Test Strips Claimed Per Patient, Per Day, from the Ontario Drug Benefit Program, for Patients Who Made At Least One Claim for Blood ...... Glucose Test Strips in 2006, By Treatment and Age Group..................................................... 8 Figure 3: Expenditure By the Ontario Drug Benefit Program on Blood Glucose Test Strips ...... Claimed in a 12-Month Period, for Patients Who Had At Least One Claim for Blood .......... Glucose Test Strips in 2006, By Treatment Group ..................................................................... 9 Figure 4: Average Daily Expenditure Per Claimant for Patients Who Had At Least One Ontario ...... Drug Benefits Program Claim for Blood Glucose Test Strips in 2006, By Treatment and Age Group................................................................................................................................... 10 Figure 5: Average Daily Number of Test Strips Claimed Per Patient From Privately Funded Drug Plans in Canada, for Patients Who Had At Least One Claim for Blood Glucose Test Strips in 2006, By Treatment Group and Jurisdiction.......................... 12 Figure 6: Average Number of Blood Glucose Test Strips Claimed Per Patient Per Day, from Privately Funded Drug Plans in Canada, for Patients Who Had At Least One Claim for Blood Glucose Test Strips in 2006, By Treatment and Age Group.................................. 13
Current Utilization of Blood Glucose Test Strips in Canada iv
Figure 7: Expenditure By Privately Funded Drug Plans in Canada, On Blood Glucose Test Strips Claimed in a 12-Month Period, for Patients Who Had At Least One Claim for Blood Glucose Test Strips in 2006, By Treatment Group.........................................................14 Figure 8: Average Expenditure Per Patient Per Day On Blood Glucose Test Strips, By Privately Funded Drug Plans, for Patients Who Had At Least One Claim for Blood Glucose Test Strips in 2006, By Treatment and Age Group.............................................16

Current Utilization of Blood Glucose Test Strips in Canada 1
1 INTRODUCTION In March 2004, the Canadian Optimal Medication Prescribing and Utilization Service (COMPUS) was launched by the Canadian Coordinating Office for Health Technology Assessment (CCOHTA) — now the Canadian Agency for Drugs and Technologies in Health (CADTH) — as a service to federal, provincial, and territorial jurisdictions and other stakeholders. COMPUS is a nationally coordinated program, funded by Health Canada. The goal of COMPUS is to optimize drug-related health outcomes and cost-effective use of drugs by identifying and promoting optimal drug prescribing and use. Where possible, COMPUS builds on existing applicable Canadian and international initiatives and research. COMPUS goals are achieved through three main approaches: • identifying evidence-based optimal therapy in prescribing and use of specific drugs • identifying gaps between evidence-based optimal therapy and clinical practice, then proposing evidence-
based interventions to address these gaps • supporting the implementation of these interventions. Direction and advice are provided to COMPUS through various channels, including the following: • the COMPUS Advisory Committee (CAC): includes representatives from the federal, provincial, and
territorial Health Ministries and related health organizations • the COMPUS Expert Review Committee (CERC): advisory in nature and provides recommendations
related to the identification, evaluation, and promotion of optimal drug prescribing and use in Canada • stakeholder feedback. 1.1 COMPUS Expert Review Committee
The COMPUS Expert Review Committee (CERC) consists of eight Core Members appointed to serve for all topics under consideration during their term of office. As well, three or more Specialist Experts are appointed to provide their expertise in recommending optimal therapy for one or more specific topics. For the insulin analogues and blood glucose test strips, the four endocrinologists/diabetes specialists were appointed as Specialist Experts. Two of the Core Members are Public Members who bring a lay perspective to the committee. The remaining six Core Members hold qualifications as physicians, pharmacists, or health economists, or have other relevant qualifications with expertise in one or more areas such as, but not limited to family practice, internal medicine, institutional or community clinical pharmacy, pharmacoeconomics, clinical epidemiology, drug utilization expertise, methodology, affecting behaviour change (through health professional and/or patient and/or policy interventions), and critical appraisal. The Core Members, including Public Members, are appointed by the CADTH Board of Directors. The mandate of CERC is advisory in nature and consists of providing recommendations and advice to CADTH’s COMPUS Directorate on assigned topics that relate to the identification, evaluation, and promotion of optimal practices in the prescribing and use of drugs across Canada. The overall perspective used by CERC members in producing recommendations is that of public health care policy makers in pursuit of optimizing the health of Canadians within available health care system resources.

Current Utilization of Blood Glucose Test Strips in Canada 2
2 THE ISSUE The COMPUS Advisory Committee (CAC) has identified management of diabetes mellitus as being a priority area for optimal practice initiatives, based on the following criteria: • large deviations from optimal utilization (overuse or underuse) • size of patient populations • impact on health outcomes and cost-effectiveness • potential to effect change • benefit to multiple jurisdictions • measurable outcomes. Within diabetes mellitus management, optimal use of blood glucose test strips in patients with type 1, type 2, and gestational diabetes mellitus was identified by CAC as a priority topic. Despite widespread use, there is controversy regarding the benefits of self-monitoring of blood glucose (SMBG), especially in patients with type 2 diabetes mellitus not using insulin.1-4 Moreover, the optimum frequency of testing has not been defined in any population.5,6 A need exists for the identification of clinical and economic evidence relating to the optimal prescribing and use of SMBG. Costs associated with SMBG are rising due to the increasing prevalence of diabetes in Canada and higher rates of self-monitoring.7 In 2005/2006, the Nova Scotia Seniors’ Pharmacare Program spent $4 million on blood glucose test strips, approximately 60% of which was spent on beneficiaries who were not using insulin agents.8 In Saskatchewan, of the $6.5 million spent on diabetic testing supplies in 2001 (most of it on blood glucose test strips), approximately half was for people who were not using insulin agents.9 Evidence relating to the optimal prescribing and use of SMBG may assist policy decision makers, consumers, and health care providers in making informed decisions for patients with type 1, type 2, and gestational diabetes mellitus. 2.1 Diabetes Mellitus
Diabetes mellitus is a chronic disease characterized by the body’s inability to produce sufficient insulin and/or properly use insulin.10 Type 1 diabetes mellitus occurs in approximately 10% of patients with diabetes, and it results when little or no insulin is produced by the body.11 Type 2 diabetes mellitus is a metabolic disorder caused by varying degrees of insulin resistance; the body usually produces insulin, but is unable to use it properly.11 When inadequately managed, diabetes is likely to result in poor glycemic control.10 Impaired glycemic control, if prolonged, may result in diabetes-related complications (e.g., ischemic heart disease, stroke, blindness, end-stage renal disease, lower limb amputation).12,13 The global prevalence of diabetes is estimated to be 246 million and is projected to increase to 380 million by 2025.14 In 2004/2005, approximately 1.8 million (5.5%) Canadians aged 20 years and older had diagnosed diabetes.15 However, it is estimated that 2.8% of the general adult population has undiagnosed type 2 diabetes mellitus,5 and the true prevalence of diabetes may actually approach 2.0 million.16

Current Utilization of Blood Glucose Test Strips in Canada 3
2.1.1 Management of blood glucose levels in diabetes mellitus
One goal of diabetes mellitus management is to maintain control of blood glucose levels in order to reduce the patient’s risk of developing long-term diabetes-related complications. Lifestyle modifications (i.e., weight control, proper nutrition, and adequate exercise), the use of medications (e.g., insulin and oral antidiabetic drugs), and SMBG are recommended approaches in improving glycemic control.5 This report focuses on the use and frequency of blood glucose testing by patients with diabetes. 2.1.2 Technology description — self-monitoring of blood glucose
The purpose of SMBG is to collect detailed information about glucose levels across various time points each day and take appropriate action should those levels be outside the desired range.7,17 SMBG requires that patients prick their finger with a lancet device to obtain a small blood sample (0.3 μL to 5 μL).7,17 The blood is applied to a reagent strip or blood glucose test strip, and glucose concentration is determined by inserting the blood-laden strip into a reflectance photometer, or an electrochemical sensor.7 Results, based on an automated reading, are available from the photometer within five to 30 seconds.7 The results can be stored in the glucose meter’s electronic memory or recorded in the patient’s logbook. It has been suggested that patients can adjust food intake, physical activity, and pharmacotherapy in response to their blood glucose readings and thus are better able to maintain optimal glycemic control on a day-to-day basis.7,17
3 OBJECTIVE The objective of this report was to explore current utilization patterns of blood glucose test strips in Canada.

Current Utilization of Blood Glucose Test Strips in Canada 4
4 PROJECT OVERVIEW Once a topic is selected, COMPUS undertakes activities related to key areas in the COMPUS procedure. The CAC provides advice and guidance throughout the process, from topic identification, through to feedback and approval of recommendations and supporting interventions. CERC, as described in Section 1.1, provides expert advice and recommendations on the topic area relating to the identification, evaluation, and promotion of optimal prescribing and use of drugs. A broad range of stakeholders are invited to provide feedback at key stages in the COMPUS process. To identify and promote the implementation of evidence-based and cost-effective optimal therapy in the use of blood glucose test strips, COMPUS follows the process outlined in the flow chart to the right (Figure 1). This document provides a detailed report of the methods and results of the utilization analysis (see green highlight in Figure 1) that was performed as part of the blood glucose test strip project.
Figure 1: Flow chart of COMPUS process

Current Utilization of Blood Glucose Test Strips in Canada 5
5 METHODS Administrative claims data from publicly and privately funded drug plans in Canada formed the basis of this retrospective database analysis. Frequency and cost of blood glucose test strips claimed per person, per day, were calculated, as were total utilization and expenditure on blood glucose test strips. 5.1 Data Source
Aggregate-level and claims-level data were provided by Brogan Inc.18 Aggregate-level data were available for the publicly funded drug plans in British Columbia, Saskatchewan, Manitoba, Ontario, Québec, Nova Scotia, Newfoundland and Labrador, and the Non-Insured Health Benefits (NIHB) Program. Claims-level data were available for the Ontario Drug Benefit Program and 67% of privately funded drug plans in Canada18 (Nevzeta Bosnic, Brogan Inc., Ottawa, ON: personal communication, September 8, 2008). The National Prescription Drug Utilization Information System (NPDUIS) was contacted to obtain claims-level data for other publicly funded drug plans in Canada. Among jurisdictions submitting data to NPDUIS, data on diabetes testing supplies were included for publicly-funded drug plans in Nova Scotia, Manitoba, and Saskatchewan. At the time of analysis, units dispensed were not available in the NPDUIS data. Consequently, frequency of blood glucose test strips dispensed per person, per day, could not be calculated.
5.2 Data Analysis
Aggregate-level data, total utilization (i.e., number of blood glucose test strips claimed), expenditures, and average cost per blood glucose test strip claimed were calculated for the period January 1, 2006 to December 31, 2006. For analysis of claims-level data, selection of data for inclusion was a two-step process. First, patients had to have made at least one claim for blood glucose test strips between January 1, 2006 and December 31, 2006. Their most recent claim for blood glucose test strips was identified as their index claim, and data for the 12-month interval following the index claim formed the basis of the analyses. Second, patients had to be active in the database by having at least one claim in the 12-month follow-up period. This ensured that patients did not die or switch drug plans. Data were classified by treatment groups, as follows: • patients using insulin alone • patients using insulin plus oral antidiabetes drug(s) • patients using oral antidiabetes drug(s) alone • patients not using pharmacotherapy for diabetes. The total number of patients, total number of claims for blood glucose test strips, total number of blood glucose test strips claimed, and total expenditure on blood glucose test strips were calculated by treatment group and type of drug plan. As well, the average daily number of blood glucose test strips claimed, and the average daily expenditure per person, were calculated by treatment group and age group (i.e., <15 years, 15 to 24 years, 25 to 44 years, 45 to 64 years, ≥ 65 years).

Current Utilization of Blood Glucose Test Strips in Canada 6
6 RESULTS
6.1 Publicly Funded Drug Plans in Canada
Data on current utilization and expenditure on blood glucose test strips in Canadian public drug plans is presented in Table 1. Annual expenditures in 2006 ranged from C$5.7 million for 6.4 million blood glucose test strips in Newfoundland and Labrador to C$109.4 million for 153.0 million blood glucose test strips in Ontario. The average cost per blood glucose test strip ranged from C$0.72 in Ontario to C$0.89 in Newfoundland and Labrador.
Table 1: Number of Blood Glucose Test Strips Claimed, Total Expenditure, and Average Cost Per Blood Glucose Test Strip for Publicly Funded Drug Plans in Canada in 2006, by Jurisdiction
Jurisdiction Number of Blood Glucose Test Strips Claimed
Expenditure (C$)
Average Cost of Blood Glucose Test Strips
(C$) British Columbia 37,917,214 28,508,780 0.75
Manitoba 14,629,288 11,674,293 0.80
Newfoundland & Labrador 6,389,093 5,712,101 0.89
NIHB 11,390,452 9,627,089 0.85
Nova Scotia 8,562,232 6,312,395 0.74
Ontario 153,018,907 109,411,365 0.72
Québec 80,417,880 66,275,986 0.82
Saskatchewan 12,976,577 10,268,123 0.79
C$=Canadian dollars; NIHB=Non-Insured Health Benefits (Program)
6.2 Ontario Drug Benefit Program
6.2.1 Blood glucose test strip utilization
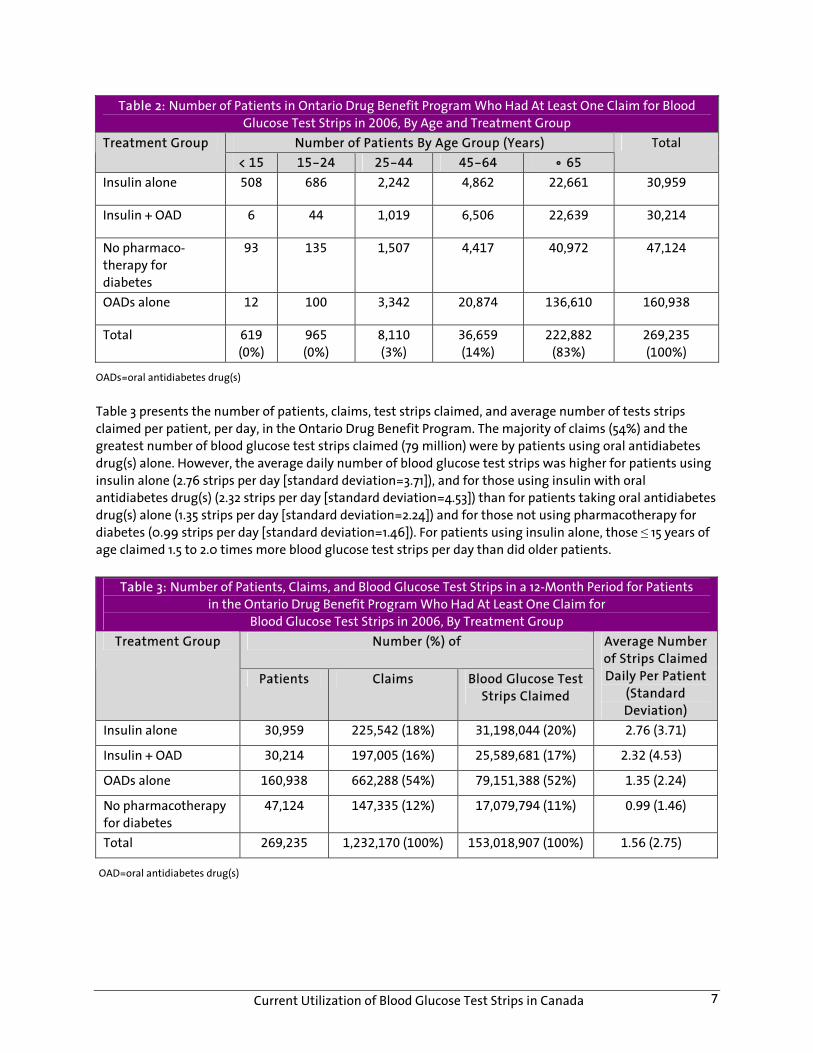
During the twelve-month analysis period, 269,235 Ontario Drug Benefit Program patients made 1.2 million claims for 153 million blood glucose test strips for a total expenditure of C$109.4 million (Table 2). The majority of patients who claimed for blood glucose test strips (83%) were ≥ 65 years of age.
Current Utilization of Blood Glucose Test Strips in Canada 7
Table 2: Number of Patients in Ontario Drug Benefit Program Who Had At Least One Claim for Blood Glucose Test Strips in 2006, By Age and Treatment Group
Number of Patients By Age Group (Years) Treatment Group < 15 15-24 25-44 45-64 • 65
Total
Insulin alone 508 686 2,242 4,862 22,661 30,959
Insulin + OAD 6 44 1,019 6,506 22,639 30,214
No pharmaco-therapy for diabetes
93 135 1,507 4,417 40,972 47,124
OADs alone 12 100 3,342 20,874 136,610 160,938
Total 619
(0%)
965
(0%)
8,110
(3%)
36,659
(14%)
222,882
(83%)
269,235
(100%)
OADs=oral antidiabetes drug(s) Table 3 presents the number of patients, claims, test strips claimed, and average number of tests strips claimed per patient, per day, in the Ontario Drug Benefit Program. The majority of claims (54%) and the greatest number of blood glucose test strips claimed (79 million) were by patients using oral antidiabetes drug(s) alone. However, the average daily number of blood glucose test strips was higher for patients using insulin alone (2.76 strips per day [standard deviation=3.71]), and for those using insulin with oral antidiabetes drug(s) (2.32 strips per day [standard deviation=4.53]) than for patients taking oral antidiabetes drug(s) alone (1.35 strips per day [standard deviation=2.24]) and for those not using pharmacotherapy for diabetes (0.99 strips per day [standard deviation=1.46]). For patients using insulin alone, those ≤ 15 years of age claimed 1.5 to 2.0 times more blood glucose test strips per day than did older patients.
Table 3: Number of Patients, Claims, and Blood Glucose Test Strips in a 12-Month Period for Patients in the Ontario Drug Benefit Program Who Had At Least One Claim for
Blood Glucose Test Strips in 2006, By Treatment Group Number (%) of Treatment Group
Patients Claims Blood Glucose Test Strips Claimed
Average Number of Strips Claimed Daily Per Patient
(Standard Deviation)
Insulin alone 30,959 225,542 (18%) 31,198,044 (20%) 2.76 (3.71)
Insulin + OAD 30,214 197,005 (16%) 25,589,681 (17%) 2.32 (4.53)
OADs alone 160,938 662,288 (54%) 79,151,388 (52%) 1.35 (2.24)
No pharmacotherapy for diabetes
47,124 147,335 (12%) 17,079,794 (11%) 0.99 (1.46)
Total 269,235 1,232,170 (100%) 153,018,907 (100%) 1.56 (2.75)
OAD=oral antidiabetes drug(s)

Current Utilization of Blood Glucose Test Strips in Canada 8
Figure 2: Average Number of Blood Glucose Test Strips Claimed Per Patient, Per Day, from the Ontario Drug Benefit Program, for Patients Who Made At Least One Claim
for Blood Glucose Test Strips in 2006, By Treatment and Age Group
OAD=oral antidiabetes drug; y=years
6.2.2 Expenditures on blood glucose test strips
Of the total C$109.4 million expended by the Ontario Drug Benefits Program on blood glucose test strips, the majority (62%) was for patients who did not make claims for insulin (Figure 3: OAD + No Pharmacotherapy). Of the total number of blood glucose test strips claimed, patients taking oral antidiabetes drug(s) without insulin accounted for 51% (79 million blood glucose test strips), those using insulin only or insulin plus oral antidiabetes drug(s) for 38% (57 million strips), and those not using pharmacotherapy for diabetes for 11% (17 million blood glucose test strips). Table 4 presents expenditure on blood glucose test strips, stratified by age and treatment group. Regarding age, substantially more was expended on blood glucose test strips for the ≥ 65 years age group (C$86 million) than for the 15 to 24 years age group (C$686,000), primarily for patients taking either oral antidiabetes drug(s) or no pharmacotherapy for diabetes (C$57 million dollars or 66%).

Current Utilization of Blood Glucose Test Strips in Canada 9
Figure 3: Expenditure By the Ontario Drug Benefit Program on Blood Glucose Test Strips Claimed in a 12-Month Period, for Patients Who Had At Least One Claim for
Blood Glucose Test Strips in 2006, By Treatment Group
OAD= oral antidiabetes drug
Table 4: Expenditure on Blood Glucose Test Strips Claimed from the Ontario Drug Benefit Program
in a 12-month Period, for Patients Who Had At Least One Claim for Blood Glucose Test Strips in 2006, By Treatment and Age Group
Expenditure (C$) on Blood Glucose Test Strips By Age Group (Years)
Treatment Group
< 15 15-24 25-44 45-64 • 65
Total Expenditure (C$)
Insulin alone 696,829 589,287 1,844,269 3,705,141 15,602,195 22,437,721
OAD + insulin 3,791 29,482 595,896 4,079,787 13,369,947 18,078,903
OADs alone 5,027 33,989 1,224,342 8,578,494 46,755,953 56,597,805
No pharmacotherapy for diabetes
32,820 33,659 389,576 1,357,177 10,483,704 12,296,936
Total 738,467 686,417 4,054,083 17,720,599 86,211,799 109,411,365
C$=Canadian dollars; OAD=oral antidiabetes drug(s) The average daily expenditure for patients taking oral antidiabetes drugs (C$0.96) and those not using pharmacotherapy for diabetes (C$0.71) was lower than for patients using insulin plus oral antidiabetes drugs (C$1.64) and for those using insulin alone (C$1.99). For patients using insulin alone, those ≤ 15 years of age expended .6 to 2.0 times more on test strips per day than did older patients (Figure 4).

Current Utilization of Blood Glucose Test Strips in Canada 10
Figure 4: Average Daily Expenditure Per Claimant for Patients Who Had At Least One Ontario Drug Benefits Program Claim for Blood Glucose Test Strips in 2006, By Treatment and Age Group
OAD= oral antidiabetes drug; y=year
6.3 Privately funded drug plans
6.3.1 Blood glucose test strip utilization
For privately funded drug plans, 203,343 beneficiaries were included in the analysis. During the twelve-month analysis period, there were 892,189 claims for 101.1 million blood glucose test strips for a total expenditure of C$82 million. Of those who claimed for blood glucose test strips, the majority (68%) were 45 to 64 years of age (Table 5).
Table 5: Number of Patients in Privately Funded Drug Plans Who Had At Least One Claim for Blood Glucose Test Strips in 2006, By Age and Treatment Group
Number of Patients (%) By Age Group (Years) Treatment Group
< 15 15-24 25-44 45-64 • 65
Total
Insulin alone 3,421 4,082 12,117 13,939 1,713 35,272
Insulin + OAD 32 146 2,922 15,048 1,999 20,147
OADs alone 18 191 12,993 81,284 11,367 105,853
No pharmacotherapy for diabetes
272 481 9,247 25,015 4,056 39,071
Total 3,743 (2%) 4,900 (2%) 37,279 (19%) 135,286 (68%) 19,135 (10%) 200,343
OAD=oral antidiabetes drug(s)

Current Utilization of Blood Glucose Test Strips in Canada 11
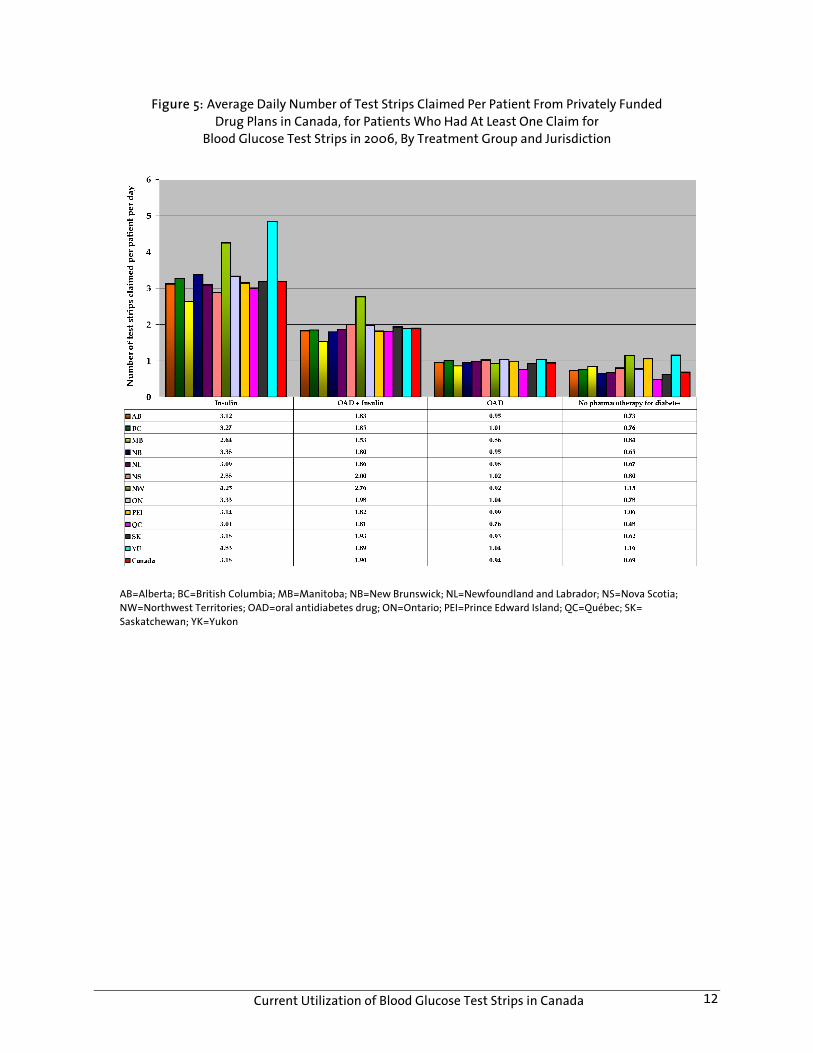
The majority of claims for blood glucose test strips were made by patients using oral antidiabetes drug(s) (53%), and those not using pharmacotherapy for diabetes (19%). Of all patients, 18% were using insulin alone, and 10% were using insulin plus oral antidiabetes drugs (Table 6). Of the total number of strips claimed, the majority (54%) were claimed by patients using insulin alone (40%) and those taking oral antidiabetes drugs plus insulin (14%). Patients using oral antidiabetes drugs without insulin, and those not using diabetes-related pharmacotherapy, accounted for 36% and 10% of the total number of blood glucose test strips claimed, respectively (Table 6). Patients using insulin alone, and those using insulin plus oral antidiabetes drugs, claimed more blood glucose test strips per day (3.18 [standard deviation=2.70], and 1.90 test strips per day [standard deviation=1.48], respectively) than did patients taking oral antidiabetes drugs without insulin (0.94 test strips per day [standard deviation=0.85]) and those not using pharmacotherapy for diabetes (0.69 test strips per day [standard deviation=1.95]) (Table 6). The geographic variation in the average daily per person use of blood glucose test strips is provided in Figure 5. For patients using insulin, those ≤ 15 years of age claimed 1.6 to 2.1 times more blood glucose test strips per day than those in older age groups (Figure 6).
Table 6: Number of Patients, Claims, and Blood Glucose Test Strips in a 12-Month Period, for Patients in Privately Funded Drug Plans Who Had At Least One Claim
for Blood Glucose Test Strips in 2006, By Treatment Group Number (%) Of Treatment Group
Patients Claims Blood Glucose Test Strips Claimed
Average Number of Strips Claimed Daily Per Patient
(Standard Deviation)
Insulin alone 35,272 (18%) 305,413 (18%) 40,977,853 (40%) 3.18 (2.70)
Insulin + OAD 20,147 (10%) 122,075 (10%) 13,962,111 (14%) 1.90 (1.48)
OADs alone 105,853 (53%) 366,086 (53%) 36,362,579 (36%) 0.94 (0.85)
No pharmacotherapy for diabetes
39,071 (19%) 98,615 (19%) 9,774,919 (10%) 0.69 (1.95)
Total 203,343 892,189 (100%) 101,077, 462 (100%) 1.38 (1.85)
OAD=oral antidiabetes drug(s)
Current Utilization of Blood Glucose Test Strips in Canada 12
Figure 5: Average Daily Number of Test Strips Claimed Per Patient From Privately Funded Drug Plans in Canada, for Patients Who Had At Least One Claim for
Blood Glucose Test Strips in 2006, By Treatment Group and Jurisdiction
AB=Alberta; BC=British Columbia; MB=Manitoba; NB=New Brunswick; NL=Newfoundland and Labrador; NS=Nova Scotia; NW=Northwest Territories; OAD=oral antidiabetes drug; ON=Ontario; PEI=Prince Edward Island; QC=Québec; SK= Saskatchewan; YK=Yukon

Current Utilization of Blood Glucose Test Strips in Canada 13
Figure 6: Average Number of Blood Glucose Test Strips Claimed Per Patient Per Day, from Privately Funded Drug Plans in Canada, for Patients Who Had At Least One Claim
for Blood Glucose Test Strips in 2006, By Treatment and Age Group
OAD=oral antidiabetes drug; y=years
6.3.2 Expenditure on blood glucose test strips
Of the C$81.4 million spent by privately funded drug plans on blood glucose test strips during the twelve- month analysis period, approximately C$44 million (54%) was attributable to patients taking insulin, either alone or in combination with oral antidiabetes drugs. Expenditure for patients taking oral antidiabetes drugs without insulin and for those not using pharmacotherapy for diabetes was C$30 million (36%) and C$8 million (10%), respectively (Figure 7). Percentage of total spending attributable to patients using insulin, either alone or with oral antidiabetes drugs, ranged from 53% in British Columbia, Québec, Ontario, and Manitoba to 62% in Alberta. For patients using oral antidiabetes drugs alone, the percentage ranged from 28% in Prince Edward Island to 38% in Québec (Table 7).

Current Utilization of Blood Glucose Test Strips in Canada 14
Figure 7: Expenditure By Privately Funded Drug Plans in Canada, On Blood Glucose Test Strips Claimed in a 12-Month Period, for Patients Who Had At Least One Claim for
Blood Glucose Test Strips in 2006, By Treatment Group
OAD=oral antidiabetes drug(s)
Table 7: Expenditure By Privately Funded Drug Plans Over a 12-Month Period for Patients Who Had At Least One Claim for Blood Glucose Test Strips in 2006, By Jurisdiction and Treatment Group
Insulin Insulin + OAD OAD No Pharmaco-therapy for
Diabetes
Province 12-Month Spending (C$000)
(C$000) % (C$000) % (C$000) % (C$000) % AB 4,784 2,303 48 689 14 1,454 30 338 7
BC 9,619 3,663 38 1,409 15 3,437 36 1,109 12
MB 957 394 41 111 12 350 37 101 11
NB 1,185 517 44 197 17 374 32 98 8
NL 1,195 546 46 129 11 382 32 138 12
NS 2,597 998 38 471 18 875 34 253 10
NW 44 20 46 6 15 13 30 4 9
ON 38,262 15,297 40 5,081 13 14,287 37 3,597 9
PEI 461 206 45 68 15 128 28 59 13
QC 20,522 7,972 39 2,836 14 7,845 38 1,869 9
SK 1,653 745 45 266 16 509 31 134 8
YU 122 57 47 17 14 37 30 11 9
Total 81,401* 32,718* 11,280* 29,691* 7,711*
AB=Alberta; BC=British Columbia; MB=Manitoba; NB=New Brunswick; NL=Newfoundland and Labrador; NS=Nova Scotia; NW= Northwest Territories; OAD=oral antidiabetes drug; ON=Ontario; PEI=Prince Edward Island; QC=Québec; SK=Saskatchewan; YK=Yukon * Some patients in dataset could not be classified by province or territory. Consequently, estimate of 81.4 million is slightly less than value (81.8 million) presented in Figure 7.

Current Utilization of Blood Glucose Test Strips in Canada 15
Expenditure on blood glucose test strips totalled C$4 million for the 15 to 24 years age group, C$48 million for the 44 to 64 years age group, C$48 million in the 45 to 64 years age group, and C$6 million for the ≥ 65 years age group. A greater proportion of claimants in the <15 years age group (98%) were using insulin than in the ≥ 65 years age group (35%) (Table 8).
Table 8: Expenditure on Blood Glucose Test Strips Claimed from Privately Funded Drug Plans in Canada in a 12-Month Period, for Patients Who Had At Least One Claim
for Blood Glucose Test Strips in 2006, By Treatment and Age Group Expenditure (C$) on Blood Glucose Test Strips By Age Group
(Years) Treatment Group
< 15 15-24 25-44 45-64 • 65
Total Expenditure
(C$)
Insulin alone 5,072,556 3,761,371 10,940,573 11,931,618 1,204,635 32,910,753
OAD + insulin 29,380 105,428 1,711,629 8,414,688 1,063,096 11,324,220
OADs alone 4,701 48,964 3,387,559 23,015,281 3,334,521 29,791,027
No pharmacotherapy for diabetes
84,170 74,179 1,663,117 5,103,198 853,812 7,778,477
Total 5,190,807 3,989,942 17,702,878 48,464,785 6,456,064 81,804,476
C$=Canadian dollars; OAD=oral antidiabetes drug(s) Average daily expenditure on blood glucose test strips for patients using insulin alone, and those using insulin plus oral antidiabetes drugs, was C$2.56 and C$1.54, respectively. For patients taking oral antidiabetes drugs without insulin, and those not using pharmacotherapy for diabetes, the average daily cost was C$0.77 and C$0.55 per day, respectively (Figure 8).

Current Utilization of Blood Glucose Test Strips in Canada 16
Figure 8: Average Expenditure Per Patient Per Day On Blood Glucose Test Strips, By Privately Funded Drug Plans, for Patients Who Had At Least One Claim for Blood Glucose Test Strips in 2006, By Treatment and Age Group
OAD=oral antidiabetes drug

Current Utilization of Blood Glucose Test Strips in Canada 17
7 DISCUSSION This study provides a number of insights into blood glucose test strip utilization and expenditure in Canada. For both publicly and privately funded drug plans, the majority of patients who claimed for blood glucose test strips were > 45 years of age, and the majority of claimants were not using insulin for the management of their diabetes. In privately funded drug plans, most claimants were between 45 and 64 years of age, while those in the publicly funded Ontario Drug Benefit Program were ≥ 65 years of age. The slightly lower age in the privately funded drug plans may be attributable to drug coverage in some jurisdictions in Canada for individuals over 65 years of age and the migration of patients to those public plans upon retirement. In the publicly funded Ontario Drug Benefit Program, C$109.4 million was spent on blood glucose test strips, of which C$68.8 million was spent on patients not using insulin therapy. In privately funded drug plans, C$81.8 million was spent on blood glucose test strips, with C$37.5 million expended on patients who are not using insulin. The expenditure among patients who are not using insulin is not surprising when one considers that the prevalence of type 2 diabetes greatly exceeds type 1 diabetes in Canada.11,19,20 In the publicly funded Ontario Drug Benefit Program, 62% of total test strip expenditure was for patients not using insulin. Similar findings21 have been reported in the Nova Scotia Seniors’ Pharmacare Program, where 64% of test strip expenditure was for beneficiaries not using insulin. In contrast, 46% of total expenditure in privately funded drug plans was for patients not using insulin. Differences between publicly and privately funded drug plans may be attributable to a relatively older population enrolled in public plans. The prevalence of type 2 diabetes is much higher among elderly patients11,19,20 and many of these patients are managed without insulin therapy.22 For both publicly funded and privately funded drug plans, patients using insulin ― either alone or in conjunction with oral antidiabetes drugs ― used more blood glucose test strips per day, and incurred higher average daily costs than did patients not using insulin. However, daily utilization and corresponding expenditure differed between the publicly funded Ontario Drug Benefit Program and privately funded drug plans. For patients taking insulin only, daily utilization and expenditure was higher in privately funded drug plans. In contrast, daily utilization and costs were higher in publicly funded drug plans for patients taking oral antidiabetes drugs; insulin, in conjunction with antidiabetes drugs; and for patients not taking pharmacotherapy. Amongst those using insulin in both publicly and privately funded drug plans, patients < 15 years of age used more strips per day than did patients aged 15 to 24. This finding may be due to rigorous testing by parents to ensure ongoing stable glycemic control in children.5,23 As children mature, and underlying physical processes stabilize, parental control may lessen, leading to the decreased use of blood glucose test strips observed among older patients (aged 15 to 24 years).5,23 Available data did not allow for investigation of this assumption. Some limitations of this analysis exist. First, claims level data for publicly funded drug plans were available for the Ontario Drug Benefit Program only. Thus, utilization of blood glucose test strips, and related expenditure, by treatment modality and age-group for other publicly funded drug programs in Canada was not estimable. Second, the data set used for the analysis did not contain diagnostic codes, and classification by type of diabetes was not performed. Third, estimates of blood glucose test strip utilization and expenditure for special drug programs (e.g., the Nova Scotia Diabetes Assistance Program) were not included in the analysis. These special drug programs, however, represent a small proportion of publicly funded drug plans in Canada. Fourth, a small number of patients in the publicly funded Ontario Drug Benefit Program who are taking drugs that

Current Utilization of Blood Glucose Test Strips in Canada 18
are not listed as a benefit may have been assigned to an incorrect treatment group. Finally, our analysis provides information on the average number of blood glucose test strips claimed by beneficiaries, not on actual patterns (e.g., intermittent use) of blood glucose test strip use.
8 CONCLUSION In privately and publicly funded drug plans in Canada, current utilization of blood glucose test strips for SMBG is considerable. Large numbers of patients who use blood glucose test strips do not use insulin in the management of their diabetes. The increasing prevalence of type 2 diabetes may further increase the costs associated with SMBG. Furthermore, although it is suggested that SMBG results in improved health outcomes for people with diabetes,24 the benefit for those with type 2 diabetes not using insulin therapy is less clear.3,25-27 To assist those responsible for decisions regarding the optimal prescribing and use of blood glucose test strips for the management of diabetes, both clinical- and cost-effectiveness evidence on the practice of SMBG is needed.7,28
9 REFERENCES 1. Schütt M, Kern W, Krause U, Busch P, Dapp A, Grziwotz R, et al. Is the frequency of self-monitoring of blood
glucose related to long-term metabolic control? Multicenter analysis including 24,500 patients from 191 centers in Germany and Austria. Exp Clin Endocrinol Diabetes 2006;114(7):384-8.
2. Coster S, Gulliford MC, Seed PT, Powrie JK, Swaminathan R. Monitoring blood glucose control in diabetes mellitus: a systematic review. Health Technol Assess (Winch Eng) [Internet]. 2000;4(12). Available: http://www.hta.nhs.uk/execsumm/summ412.shtml (accessed 2009 Jan 20).
3. Davidson MB. Counterpoint. Self-monitoring of blood glucose in type 2 diabetic patients not receiving insulin: a waste of money [letter]. Diabetes Care [Internet]. 2005;28(6):1531-3. Available: http://care.diabetesjournals.org/cgi/content/full/28/6/1531 (accessed 2009 Jan 20).
4. Davidson MB, Castellanos M, Kain D, Duran P. The effect of self monitoring of blood glucose concentrations on glycated hemoglobin levels in diabetic patients not taking insulin: a blinded, randomized trial. Am J Med 2005;118(4):422-5.
5. Canadian Diabetes Association 2008 clinical practice guidelines for the prevention and management of diabetes in Canada. Can J Diabetes [Internet]. 2008;32(suppl 1):i-S201.Available: http://www.diabetes.ca/for-professionals/resources/2008-cpg/ (accessed 2009 Jan 20).
6. American Diabetes Association. Executive summary: standards of medical care in diabetes - 2008. Diabetes Care [Internet]. 2008;31(Suppl. 1):S5-S11. Available: http://care.diabetesjournals.org/cgi/content/full/31/Supplement_1/S5 (accessed 2009 Jan 20).
7. Consensus statement on self-monitoring in diabetes: Institute of Health Economics, Alberta, Canada, November 14-16, 2006. Int J Technol Assess Health Care 2007;23(1):146-51.
8. Sanyal C, Graham S, Cooke C, Sketris I, Frail DM. Utilization and cost of blood glucose monitoring test strips in the Nova Scotia seniors' pharmacare program, 2005/06: a retrospective database analysis. [Powerpoint presentation]. Halifax (NS): Nova Scotia Department of Health; 2006.
9. Johnson JA, Pohar SL, Secnik K, Yurgin N, Hirji Z. Utilization of diabetes medication and cost of testing supplies in Saskatchewan, 2001. BMC Health Services Research [Internet]. 2006;6:159. Available: http://www.pubmedcentral.nih.gov/picrender.fcgi?artid=1762014&blobtype=pdf (accessed 2008 Jan 29).
10. Diabetes in Canada: facts & figures [Internet]. Ottawa: Public Health Agency of Canada; 2008. Available: http://www.phac-aspc.gc.ca/publicat/2008/ndfs-fnrd-08/ndfs_ff-fnrd_fc-eng.php (accessed 2009 Jan 20).
Current Utilization of Blood Glucose Test Strips in Canada 19
11. Diabetes in Canada [Internet]. 2nd edition. Ottawa: Health Canada; 2002. Available: http://www.phac-aspc.gc.ca/publicat/dic-dac2/pdf/dic-dac2_en.pdf (accessed 2007 Aug 1).
12. UK Prospective Diabetes Study (UKPDS) Group. Intensive blood-glucose control with sulphonylureas or insulin compared with conventional treatment and risk of complications in patients with type 2 diabetes. Lancet 1998;352(9131):837-53.
13. The Diabetes Control and Complications Trial Research Group. The effect of intensive treatment of diabetes on the development and progression of long-term complications in insulin-dependent diabetes mellitus. N Engl J Med 1993;329(14):977-86.
14. The prevalence and costs of diabetes [Internet]. Toronto: Canadian Diabetes Association; 2007. Pub no. 114007 06-295 06/06 Q-50M. Available: http://www.diabetes.ca/Files/prevalence-and-costs.pdf (accessed 2007 Aug 16).
15. Diabetes in Canada: highlights from the National Diabetes Surveillance System 2004-2005 [Internet]. Ottawa: Public Health Agency of Canada; 2008. Available: http://www.phac-aspc.gc.ca/publicat/2008/dicndss-dacsnsd-04-05/pdf/dicndss-04-05-eng.pdf (accessed 2008 Jun 26).
16. Dawson KG, Gomes D, Gerstein H, Blanchard JF, Kahler KH. The economic cost of diabetes in Canada, 1998. Diabetes Care [Internet]. 2002;25(8):1303-7. Available: http://care.diabetesjournals.org/cgi/reprint/25/8/1303.pdf (accessed 2007 Aug 1).
17. Benjamin EM. Self-monitoring of blood glucose: the basics. Clin Diabetes [Internet]. 2002;20(1):45-7. Available: http://clinical.diabetesjournals.org/cgi/reprint/20/1/45 (accessed 2008 Jan 23).
18. Brogan Inc. [Internet]. Ottawa: Brogan Inc.; 2008. Available: http://www.broganinc.com/index.html (accessed 2008 May 23).
19. Wild S, Roglic G, Green A, Sicree R, King H. Global prevalence of diabetes: estimates for the year 2000 and projections for 2030. Diabetes Care 2004;27(5):1047-53.
20. Scanlon P. Incidence and prevalence of diabetes [Internet]. Coventry (UK): Diabetes Specialist Library; 2007. Available: http://www.library.nhs.uk/diabetes/ViewResource.aspx?resID=261624 (accessed 2008 Jun 9).
21. Sanyal C, Graham SD, Cooke C, Sketris I, Frail DM, Flowerdew G. The relationship between type of drug therapy and blood glucose self-monitoring test strips claimed by beneficiaries of the Seniors' Pharmacare Program in Nova Scotia, Canada. BMC Health Services Research [Internet]. 2008;8(111). Available: http://www.biomedcentral.com/content/pdf/1472-6963-8-111.pdf (accessed 2008 May 26).
22. Shah BR, Mamdani M, Kopp A. Drug use in older people with diabetes. In: Diabetes in Ontario: an ICES practice atlas [Internet]. Toronto: Canadian Diabetes Association; 2003. p.51-76. Available: http://www.ices.on.ca/file/DM_Chapter3.pdf (accessed 2007 Aug 6).
23. Evans JM, Newton RW, Ruta DA, MacDonald TM, Stevenson RJ, Morris AD. Frequency of blood glucose monitoring in relation to glycaemic control: observational study with diabetes database. BMJ [Internet]. 1999;319(7202):83-6. Available: http://www.bmj.com/cgi/reprint/319/7202/83 (accessed 2009 Jan 20).
24. Mitchell CG, Simpson SH, Johnson JA. The cost of blood glucose test strips in Saskatchewan, 1996: a retrospective database analysis. Can J Diabetes [Internet]. 2003;27(2):149-53. Available: http://diabetes.ca/files/TestStripsJohnsonJune03.pdf (accessed 2008 Jan 29).
25. Simon J, Gray A, Clarke P, Wade A, Neil A, Farmer A. Cost effectiveness of self monitoring of blood glucose in patients with non-insulin treated type 2 diabetes: economic evaluation of data from the DiGEM trial. BMJ [Internet]. 2008;336(7654):1177-80. Available: http://www.bmj.com/cgi/reprint/336/7654/1177 (accessed 2009 Jan 20).
26. O'Kane MJ, Bunting B, Copeland M, Coates VE. Efficacy of self monitoring of blood glucose in patients with newly diagnosed type 2 diabetes (ESMON study): randomised controlled trial. BMJ 2008;336(7654):1174-7.
27. Farmer A, Waldron-Lynch F, Dinneen S. Self-monitoring of blood glucose did not improve glycaemic control in patients with type 2 diabetes not treated with insulin: Commentary. Evid Based Med 2008;13(1):7.
28. Johnson JA, Edwards AL. Evidence and advocacy: are all things considered? CMAJ 2006;174(13):1856.