Embed Size (px)
Citation preview
OPTIMISATION OF THE ALIGNMENT OF BUSINESS
AND CREDIT FUNCTIONS IN THE PRIVATE BANK
SEGMENT IN A SOUTH AFRICAN BANK
Daniel Chetty
A research project submitted to the Gordon Institute of Business Science,
University of Pretoria, in partial fulfilment of the requirements for the degree of
Master of Business Administration.
14 November 2007
©© UUnniivveerrssiittyy ooff PPrreettoorriiaa
©© UUnniivveerrssiittyy ooff PPrreettoorriiaa
ABSTRACT
Currently the sales and credit departments of Private Banks have divergent
business objectives. The sales department’s primary objective is to sell the
bank’s products and generate revenue through new business acquisition, while
the credit department’s objective is to balance risk and reward by ensuring that
capital is deployed in the most effective manner. In the private bank department
of the bank that was studied, these divergent objectives have led to
inefficiencies in the business processes and have promoted the silo-based
operations, which impact the customer experience negatively. Several
strategies for future implementation were identified in order to optimise the
alignment between the sales and credit functions of the private banking
department of the bank. The strategies were categorised into customer
centricity, relationship pricing, alignment of personal key performance
indicators, addressing of system inefficiencies and exploring various alternate
strategies (e.g. strategies that aim to achieve a better understanding of each
others’ roles and work pressures better; improving communication; aligning their
goals; working towards supporting the success of each department). It was
found that there was a strong alignment of the views of the private bank staff
(credit and sales viewed as a group) towards the future strategies. When the
views of the credit staff were compared with the views of the sales staff, it was
found that there was alignment of the opinions of the two departments on the
futures strategies that could be implemented to allow credit and sales to work
more effectively together.
i

DECLARATION
I declare that this research project is my own work. It is submitted in partial
fulfilment for the degree of Master of Business Administration at the Gordon
Institute of Business Science, University of Pretoria. It has not been submitted
before for any degree or examination in any other University.
Name: Daniel Chetty
Signature:
Date:
ii

ACKNOWLEDGEMENTS
I wish to express my sincere thanks to:
• My wife Amitha Chetty for her support while I completed my MBA.
• My daughter Dhiya Chetty for being an inspiration to me to succeed.
• My supervisor Gavin Price for his guidance.
• Indira Bhagaloo (Director Private Bank) for her assistance in getting a
good response rate to the questionnaire.
• Merl Werbeloff for her assistance with the calculations.
iii

TABLE OF CONTENTS
ABSTRACT ........................................................................................................ I
DECLARATION................................................................................................. II
ACKNOWLEDGEMENTS................................................................................. III
TABLE OF CONTENTS ................................................................................... IV
CHAPTER 1: INTRODUCTION TO THE RESEARCH PROBLEM ................... 1
1.1 Introduction .................................................................................................. 1
1.2 Motivation for research................................................................................. 6
1.3 The Research Problem ................................................................................ 8
1.4 Scope........................................................................................................... 9
CHAPTER 2: LITERATURE REVIEW............................................................. 11
2.1 Customer Centricity.................................................................................... 11
2.2 Relationship Pricing ................................................................................... 15
2.3 Alignment of KPI’s...................................................................................... 20
2.4 System Inefficiencies ................................................................................. 23
2.5 Credit – Sales partnership.......................................................................... 24
2.6 Job levels ................................................................................................... 28
CHAPTER 3: RESEARCH PROPOSITIONS .................................................. 30
CHAPTER 4: RESEARCH METHODOLOGY ................................................. 32
4.1 Defence of methods ................................................................................... 32 4.1.1 Research design .................................................................................. 32 4.1.2 Measurement scales ............................................................................ 33 4.1.3 Analysis techniques ............................................................................. 34
4.2 Process of data analysis ............................................................................ 35 4.3 Sampling methodology............................................................................ 37 4.3.1 Definition of the unit of analysis............................................................ 37
iv
4.3.2 Population ............................................................................................ 37 4.3.3 Sample size.......................................................................................... 39 4.3.4 Sampling method ................................................................................. 40
4.4 Research instrument used ......................................................................... 40
4.5 Procedure of data collection....................................................................... 41
4.6 Limitations of the research ......................................................................... 41
CHAPTER 5: RESULTS.................................................................................. 43
5.1 Proposition 1 .............................................................................................. 43
5.2 Proposition 2 .............................................................................................. 49
5.3 Proposition 3 .............................................................................................. 55
CHAPTER 6: DISCUSSION OF RESULTS..................................................... 59
6.1 Move from product centric to customer centric approach........................... 59 6.1.1 Proposition 1.1 ..................................................................................... 59 6.1.2 Proposition 2.1 ..................................................................................... 59 6.1.3 Alignment of the results to the theory base .......................................... 60
6.2 Goal of relationship pricing......................................................................... 62 6.2.1 Proposition 1.2 ..................................................................................... 62 6.2.2 Proposition 2.2 ..................................................................................... 62 6.2.3 Alignment of the results to the theory base .......................................... 64
6.3 Alignment of personal KPI’s ....................................................................... 65 6.3.1 Proposition 1.3 ..................................................................................... 65 6.3.2 Proposition 2.3 ..................................................................................... 65 6.3.3 Alignment of the results to the theory base .......................................... 66
6.4 Address system inefficiencies .................................................................... 67 6.4.1 Proposition 1.4 ..................................................................................... 67 6.4.2 Proposition 2.4 ..................................................................................... 68 6.4.3 Alignment of the results to the theory base .......................................... 69
6.5 Implement alternate strategies ................................................................... 70 6.5.1 Proposition 1.5 ..................................................................................... 70 6.5.2 Proposition 2.5 ..................................................................................... 70 6.5.3 Alignment of the results to the theory base .......................................... 78
6.3 Job Levels .................................................................................................. 78 6.3.1 Alignment of the results to the theory base .......................................... 79
6.4 Analysis of the open ended questions........................................................ 79
v
CHAPTER 7: CONCLUSION........................................................................... 83
7.1 Move from product centric to customer centric approach........................... 83
7.2 Goal of relationship pricing......................................................................... 84
7.3 Alignment of personal KPI’s ....................................................................... 85
7.4 Address system inefficiencies .................................................................... 85
7.5 Implement alternate strategies ................................................................... 86
7.6 Job Levels .................................................................................................. 89
7.7 Analysis of the open-ended questions ....................................................... 90
8. REFERENCES............................................................................................. 91
9. APPENDIX 1................................................................................................ 97
9.1 Standard Private Banking Credit – Sales Partnership Questionnaire......... 97
10. APPENDIX 2............................................................................................ 100
10.1 Revisions made to the questionnaire ..................................................... 100
vi

LIST OF TABLES
Table 4.1: Private Bank Monthly Pack (July 2007)………………………….. 39
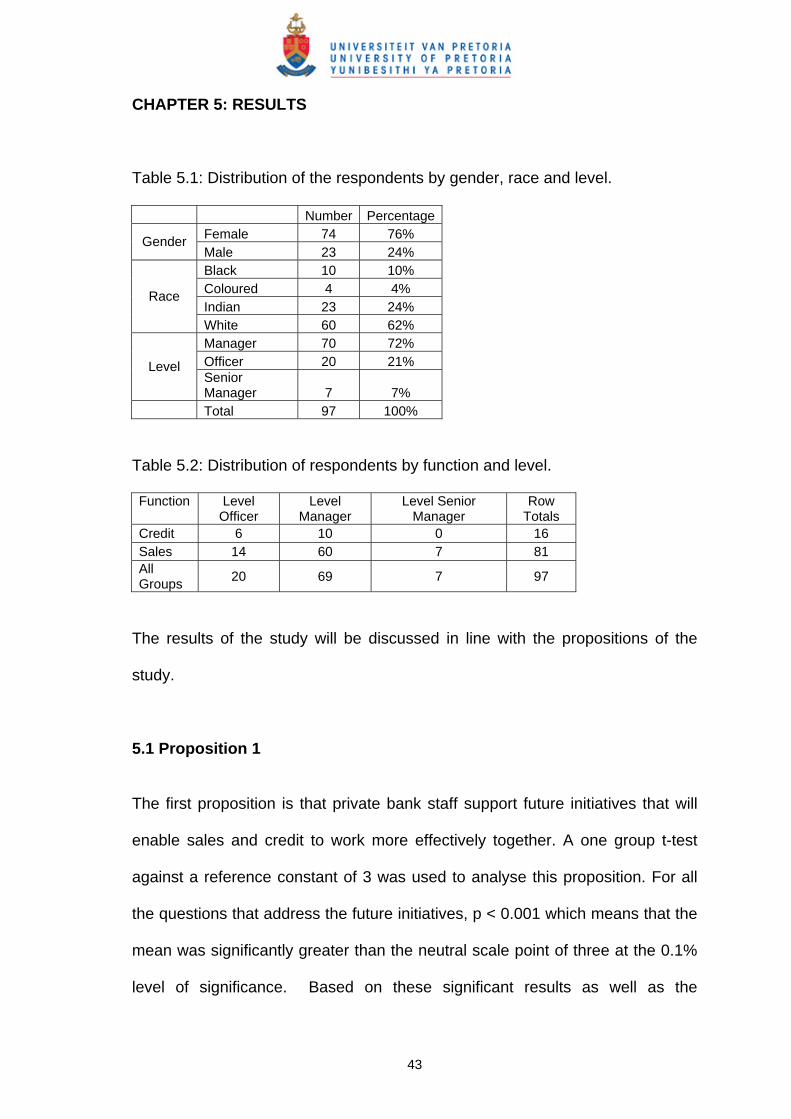
Table 5.1: Distribution of the respondents by gender, race and level……... 43
Table 5.2: Distribution of respondents by function and level……………….. 43
Table 5.3: Descriptive statistics and One group t test against a reference..
constant of 3 for total group (N=98)
45
Table 5.4: Percentage of respondents in the total group according to level
of agreement with each item of the 5 strategic categories (N=98)
48
Table 5.5: Multivariate and univariate level comparisons of mean attitudes
of credit vs. sales staff towards items of the five strategic categories
(N=16 and 81 respectively)
52
Table 5.6: Results of Mann Whitney U test comparing officers to………….
managers among the credit respondents (n1=6 and n2=10 respectively)
56
Table 5.7: Multivariate and univariate level comparisons of mean attitudes
of officers and managers in the sales respondents towards items of the
five strategic categories (n1=14 and n2=67 respectively)
57
Table 5.8: Open ended questions……………………………………………... 58
vii
LIST OF FIGURES Figure 5.1: Percentage of respondents who agree or strongly agree with...
items 1.1 to 1.4 of Proposition 1
46
Figure 5.2: Percentage of respondents who agree or strongly agree with...
items 1.5 of Proposition 1
47
Figure 5.3: Mean responses of the credit and sales staff towards items…..
2.1 to 2.4 of proposition 2
53
Figure 5.4: Mean responses of the credit and sales staff towards items
2.5 of proposition 2
54
viii
CHAPTER 1: INTRODUCTION TO THE RESEARCH PROBLEM
1.1 Introduction
Sorondo (2006) describes JP Morgan Private Bank as the largest private bank
in the USA with $200 billion under management. JP Morgan Private Bank has
relationships with over 40% of the individuals listed on the Forbes 400 richest
Americans. JP Morgan Private Bank has been very successful because they
were able to offer the science – such as investment guidance and balance
sheet advice; along with the art – such as education and strategy. The bank
melded art and science in a series of next generation wealth seminars held in
2005 in Barcelona, Miami and St Tropez with 100 young members of wealthy
families who hold a total of about $140 billion in assets.
Morais (2005, p. 88) described the strategy implemented by the chief executive
Oswald Grubel as the “one bank” strategy. Grubel’s strategy was to produce
above market returns by making the investment bankers, private bankers and
asset managers work together. While doing so, managers cannot blame other
business units for poor performance since they are all in one integrated bank
and share in one another’s successes and failures. After a history of erratic
earnings, investors hope that this is the dawn of a new era at Credit Suisse.
Grubel has promised investors at least $6 billion in net income by 2007, which
indicates his strong belief in the strategy he has implemented. One bank
strategy has resulted in cross selling between the investment and the private
bank.
1
Morais (2005) describes Credit Suisse as the world’s most successful private
bank. Credit Suisse’s private bank accounted for just under half of the group’s
$4.3 billion net profit in 2004. The private bank’s net income is 0.48% of assets
which is well above the 0.3% more typical of other private banks. Credit Suisse
is the world’s third largest wealth manager by assets and has a reputation for
well-timed advice and a flair for creating unusual financial products. Credit
Suisse’s reputation as a product innovator has attracted younger clients who
are more dynamic, sophisticated and market-savvy than the clients at UBS
(Credit Suisse’s major Swiss competitor) and as a result of their wealth creation
initiatives they are more profitable to the bank. A single bank strategy meant
that private bank credit and private bank sales had to align their goals and work
together more effectively towards to the success of Credit Suisse’s private
bank. Credit and sales also worked effectively together to create, approve and
implement the innovative financial products which contributed towards the
success of the bank.
Finweek (2006) describes the private banking market in South Africa as an
evolving market with the goal of ultimately adopting the Swiss model of private
banking (discreet, knowledgeable and dedicated to the financial well-being of
their clients). The three Swiss-model private banks that were established about
five years ago are Absa Private Bank, Ansbacher and Standard Private Bank.
However with only an estimated 20,000 families in that super league, the
traditional Swiss private bank model, aimed at only the highest of high net worth
individuals, proved not to be relevant to South Africa. Furthermore, that handful
2
of high net worth clients were also sought after by some of the world’s top
financial institutions. In that highly competitive market, the South African private
banks had to rethink the local private bank model. The ideal situation is for a
client to have a single relationship manager who would cater for all his financial
requirements (personal, business, investment etc) but owing to the skills
shortage, the South African banks have to compromise on that ideal.
Some South African private banks try to deliver the service via the relationship
manager, who acts as a conduit between the client and the specialists. Rand
Merchant Bank (RMB) private bank has adopted a different private bank model
where the client skips the relationship manager and deals directly with a team of
specialists. The specialist that deals the most with the client would assume the
role of the relationship manager. The advantage this model is that the client
deals with a specialist who is competent and can address the client’s immediate
requirements quickly. The disadvantage is that the client has to deal with
several different people. Jasper Lindeque (head of wealth management at RMB
private bank) cited research published by The VIP Forum, (a publication
contributed to by 68 private banks worldwide) which indicated that the quality of
the advice outweighed the quality of the relationship amongst ultra-high net
worth individuals.
Nedbank Private Bank has adopted the model where the private banker acts as
the fulcrum of the relationship and leverages off the specialist skills of a support
team. Absa Private Bank uses a hybrid model where the primary relationship is
3

held by the private banker who will call in a specialist when the client’s
requirements are complex.
Standard, Absa, Nedbank, RMB and Investec Private Banks have all adopted a
segmentation strategy to private banking. They have broadened their models
from a focus on the top end to include a wider market and one that allows
private banks to segment their offering across a more relevant range of clients.
The risk in the segmentation strategy is that the top end clients may feel that the
service is geared to the lowest common denominator. However the South
African private banks have taken great care to ensure the process is
aspirational, with clients evolving upwards to heightened service levels.
Segmentation in South African private banks is vital due to the differing
requirements of the clients in the various segments.
D’Ambrosio (2000) describes a successful private banking model adopted by
Harris Bank in Chicago. Harris Bank is approximately a century old and has $20
billion under management in its private banking division. In the late nineties the
executives of Harris Bank discerned that most customers’ financial needs are
born out of life-cycle events: for example, job promotions, career changes, a
new baby or retirement. That perception encouraged Harris strategists to
formulate and implement an organisational shift. Teams of asset managers,
planners and traditional lenders were organised around life-cycle events, so that
clients were no longer obliged to move from one department to another within
the bank or from one bank to another to put together the package of services
they required. When clients get promoted or retire, they require a different
4

bundle of services and not just one product. Harris private banking has also
segmented its client base and has established that each segment has its own
unique life cycle change points. As a result, Harris private banking has
developed different models for the different life cycle events in the different
segments.
Ackermann (2006) writes that the PNC Financial Services Group Inc. in
Pittsburgh has increased the assets in its private banking business with new
leadership, a new name, an enhanced sales-oriented culture and more cross
selling. After Robert Q. Reilly took over as the executive vice president of PNC
Wealth Management in July 2005, his unit’s assets under management grew by
$1 billion in the first quarter and the private bank’s revenue increased by 10%
compared with the previous year because of the shift in focus. PNC Private
Bank adopted a co-ordinated channel management approach which increased
the focus on sales and cross selling. PNC Private Bank tripled the business
developed from referrals from the corporate bank, quadrupled business
stemming from the business bank and obtained about three times more
referrals from the branch network. The co-ordinated channel management
approach described above is similar to the “one bank” strategy that Grubel
implemented at Credit Suisse (described above). They are similar in that the
different departments work together to leverage off each other’s skills and client
information to achieve the common goal of customer satisfaction and maximise
the bank’s profitability. The private bank credit resources are a key business
partner to the private bank sales. The alignment of the private bank credit and
5
private bank sales strategies toward the broader objectives of the organisation
is critical to success.
Tyburski (2005, p. 4) notes that “there is a heightened focus on the credit
department helping to increase sales and earnings, rather than just reducing
credit risk”. He identifies the four top challenges facing the credit department in
a financial institution as: communication; sales following or not following
business rules; getting sales to respond to credit concerns; and getting
complete and accurate customer information from salespeople. Tyburski
recommends the following practical steps to optimise the sales-credit
partnership: the alignment of revenue generation and credit risk (bad debt)
goals between the credit and sales departments; sales and credit personnel to
conduct client visits together; and rotation of sales and credit personnel to better
understand each other’s challenges.
1.2 Motivation for research
This research has direct relevance for the broader Retail Banks and Investment
Banks since Private Banks cater for both the retail and investment banking
requirements of high net worth individuals. The improved alignment strategies
between the credit and sales areas can be extended to the retail banks and
investment banks which will indirectly impact their level of client retention and
their bottom line. The National Credit Act was implemented in June 2007. This
act requires banks to be more rigorous in their credit decision-making process
by taking the customer’s view and understanding the customer’s exposure
6
overall, rather than just evaluating whether the customer can afford a specific
product.
Mametse (2007) indicates that since the National Credit Act was implemented,
there has been a decline in the vehicle sales. Wingate-Pearse (2007) indicates
that the National Credit Act has slowed down property sales. Botha (2007)
writes that the increase in the prime lending rates has adversely impacted the
property market. Pickworth (2007) confirms that the South African Banks have
been adversely affected by the National Credit Act. Improving on the alignment
of the business and credit would definitely be a major step towards achieving
customer centricity. Initially these optimised strategies, once implemented in the
Private Bank, should give an edge to the organisation over the competition, but
the competition would soon follow and the end result would be that the
customer would benefit in general and experience an improved and customer-
centric process.
The major South African banks face similar challenges to those described
above. Currently the sales and credit functions have divergent business
objectives. The sales department’s primary objective is to sell the bank’s
products and generate revenue through new business acquisition, while the
credit department’s objective is to balance risk and reward and ensure that
capital is deployed in the most effective manner. These divergent objectives
have led to inefficiencies in the business processes and have promoted the silo-
based operations which impact the customer experience negatively.
7
CRM Magazine (2007) links customer satisfaction to retention. The author
elaborates that providing superior customer experience is the most powerful
way for companies to achieve differentiation. Craig (2006) writes that customer
centricity should not be viewed as a revolutionary new strategy. It is actually a
basic strategy that is overdue and often overlooked in strategy formulation.
Customer centricity is part of a larger movement whereby companies realise
that the “one size fits all” era is long past and in order to maintain their
competitive edge, organisations have to fundamentally change the way they
treat customers.
1.3 The Research Problem
The research problem explores how the alignment between the credit and
business functions of the private banking area in a South African bank can be
optimised. In the previous section different strategies and models for successful
private banking were discussed. The questions below were identified in order to
break down the research problem into the sub-problems:
• What are the strategies that can be implemented to move from a product
-centric to a customer-centric approach?
• Can the goal of relationship pricing be achieved by the credit and sales
functions partnering towards this common goal?
8
• Can credit and sales work together more effectively towards the broader
goals of the firm by aligning their personal key performance indicators?
• Will the alignment of credit and sales functions be improved if the system
inefficiencies that impact on both areas are addressed?
• What are the alternate strategies that may be deployed by the credit and
sales functions in order to improve the alignment between the functions
and have them work together more effectively?
The questions mentioned above were developed into propositions and the
questionnaire was developed based on these sub-problems. This allowed
for further analysis into the different facets of the research problem and
allowed for conclusions to be drawn based on these propositions.
1.4 Scope
This research will be limited to a South African Private Bank which is a division
of the Retail bank. The entire Private Bank credit team is based in Sandton,
Johannesburg. This team is a national credit team and supports the private
bank business across South Africa. The Private Bank business head office is in
Hyde Park, Johannesburg and the Gauteng branch has the highest
concentration of Private Bank staff and Private Bank customers. Hence this
research will be limited to the Gauteng province only. This research will be
limited to the Account Executive/Relationship Manager channel only i.e. the
9

process where a customer interacts with the relationship manager or account
executive and applies for a product where a credit decision is required.
10
CHAPTER 2: LITERATURE REVIEW
2.1 Customer Centricity
Ryals (2007) found that the development and implementation of a customer
relationship management scorecard proved to be an effective tool for managers
to evaluate risks in their customer relationships and to develop risk mitigation
strategies. The scorecard was then used to forecast retention probabilities. This
proved to be an effective tool to create shareholder value.
Lager (2007) writes that in many organisations, professional service
management remains a back office function and is separated from the sales or
front office function. This prevents companies from obtaining an enterprise wide
view of the customer. The author further writes that through the implementation
of revised customer-centric process and technology, the front office and back
office staff can work together in an optimal manner, allowing for a customer -
centric approach.
Bodnar (2007, p. 38) writes that “organisations with a customer centric mantra
will own a distinct market advantage in the coming cycle of a true consumer
driven marketplace.”
Bailor (2007) states that it has become more difficult for retail organisations to
compete on price over the past few years. A growing number of retailers are
realising the importance of creating a seamless multi-channel experience as a
11
vital part of their tool kit for competitive differentiation. Customer-centricity and
experience-based differentiation have taken the centre stage in retail
organisation strategies. As a result the retail organisations are focusing on
creating a more engaging relationship with the customer around the brand and
responding to the needs and desires of the customers. One of the biggest
challenges that multi-channel retail organisations face is aligning customer data
across channels so retail organisations can have a picture of how their
consumers are interacting with them not only in one channel, but across all
channels. Key to this strategy would be the alignment and sharing of customer
data across the channels. South African private banks have adopted this type of
strategy by allocating relationship managers to high net worth individuals so
these high net individuals do not have to go through many different channels to
get different products and as a result have different customer experiences.
Kirby (2007) declares that customer insights and what is important to the
customer should be pivotal in forming the basis for the customer-centric
strategies. In the current context of globalisation and information sharing, it is a
strategic imperative to align your company with the customer requirements and
adapt the marketing, sales and distribution strategies accordingly. Kirby also
describes customers as being convenience motivated and suggests that
customer-focused strategies, as opposed to competitor-focused strategies,
should be deployed to maintain a competitive edge. These, together with a
competitive cost structure, are key ingredients to success. Organisations should
be alert and not ignore their competitors, but the energy, drive and culture of the
organisation should come from customer-focussed strategies for two reasons:
12
first, customer needs change more slowly than a lot of other market factors and
second, close following does not work well in a fast changing environment. By
focussing on customer obsession over competitor obsession, an organisation
can prevent internal agendas from driving decisions as the organisation grows.
In Chain Store Age (2007), it is stated that many retail organisations have
changed their approach from what products do we sell to what will the
customers choose or require? More retailers are investing in behavioural
research to discover opportunities. Customer centricity, including truly
understanding the customers and revolving every business decision around
them, is on aspect of retail organisations that is not changing rapidly. Many
retail organisations are still driven by the complexities of running a business or
pleasing their shareholders and this seems backward in a fast moving industry.
Edelstein (2007) avers that the application of sound, fair and equitable
relationships and consistent communication are what generally separate a
successful customer-centric program from a failed effort. He emphasises that
promises that cannot be kept should not be made and reliability must be one of
the key strengths, since it reinforces the client relationships. Retail
organisations must listen to their customers and encourage feedback.
Communication, attention to process, dedication to sound client care and a solid
understanding of the client’s requirements, are pivotal for a successful long term
relationship. Communication encourages trust and the attainment of the
collective objectives of each client engagement.
13
Teller Vision (2006) reports that the U.S. banking industry has seen a strategic
shift towards customer centricity. More financial institutions are aligning
resources to respond effectively to the needs of the customers while building
mutually profitable relations. This shift has banks participating in a new race: a
customer analytics triathlon. The power of traditional retail bank strategies is
waning. Diversification and acquisition strategies are decreasing, new branch
growth is increasingly expensive, and market share is being eroded by new
entrants. New performance value lies in customer value management, which
involves a triathlon that begins with mastering customer data, moves to
achieving knowledge by extracting insight from the data, and culminates in
realizing wisdom by acting on the insight. To maintain a competitive advantage,
banks need to develop new profitability models based on data gathered at
account level. Such analysis would give insight into the cost to serve each
customer.
Wagner (2007) describes customer-centric organisations as those that make
the needs of individual customers the starting point for planning new products
and services or improving existing ones. While customer centricity has received
attention in marketing literature, the technologies to enable customer centricity
have been ignored in the research and theory development. The key
characteristics that affect customer engagement are described as goal
alignment, value adding processes and technologies that enable customer
centricity.
14
Nelson (2007) writes that the old banking product rules required a strong siloed
business unit and tightly controlled channels to generate revenue. The new
rules rely on demonstrating value within the bank, collaborating to maximise
every customer contact and building customer loyalty. Each of these themes is
incorporated into the idea of enterprise cross-sell concept. Successful product
houses within the banks have adapted to the new rules by breaking down the
silo mentality that focused on individual success at the expense of the whole.
They have become leaders in the banks’ evolution by ensuring that every
customer contact is maximised via the most appropriate channel.
All the authors above have indicated that customer-centric strategies will
provide a competitive edge and through the optimisation of the alignment of
sales and credit functions in the Private Bank, customer-centric strategies will
be promoted and this will result in an improvement to the service offering to the
Private Bank clients.
2.2 Relationship Pricing
Stock (2007) suggests that there is a drive toward a new pricing model to
reward wealthy clients who buy multiple products by discounting fees across the
board. Relationship pricing would benefit advisors who would be able to offer
their wealthy clients better rates for investment products. Three competitive
pricing strategies are described: localised, dynamic and relationship.
15
The localised pricing (which means charging what the local market will bear for
services) is the most straightforward. Dynamic pricing rewards clients for
specific behaviours such as holding their investments for a long period of time.
The services are discounted in the relationship pricing model based on the total
value of the client’s relationship with the bank. The price of the products
decreases (within agreed ranges to each department) as the client becomes
more profitable to the bank. This results in a win-win situation for the client and
the bank. The client pays lower fees and the bank benefits from increased cross
sell profitability and customer retention.
Relationship pricing requires every area of the bank to have a view of how
much the individual client is worth. To do this effectively, complex and
expensive software is required. Relationship pricing also depends on effective
communication between different product departments of the bank, which
means moving away from the silo or product-centric type operation to a more
customer-centric operation. This change represents a significant shift in the
technology, culture and the way banks do business. Due to the challenges
faced in the journey to become customer-centric and to price for the
relationship, banks will start with the high net worth individuals and the
commercial accounts.
This is typically the space or market of the private banking area and that is why
this research is focussed on optimising the partnership between credit and
sales in order to become more customer-centric and obtain a single credit view
of the client. Once the systems and process are implemented to obtain the
16
single credit view, the sales and credit departments will be able to work together
to price for the relationship and to become “dealmakers” by establishing what
other opportunities can be explored for their clients. Client churn is costly and
needs to be constantly monitored and managed.
Landry (2005) states that dynamic relationship pricing is emerging as the
banking industry’s next significant CRM strategy. The banking industry is
heavily commoditized and with service quality rising, is even more difficult to
differentiate. Landry (2005) writes that banking software purchasers will make
relation pricing capability a “must have” selection criterion by 2007. According to
Landry, leading banks will make dynamic relationship pricing a requirement of
future core banking solutions. The corporate and commercial and high net worth
implementation will precede those in mass market consumer buying.
Landry recommends that banks elevate pricing as a critical priority in their future
strategic planning. The credit and sales departments of the private banking area
play a pivotal role in the successful implementation of the dynamic relationship
pricing model. By having a single credit view of the customer the appropriate
risk decisions can be taken into consideration when making the credit decision.
The sales area can also better understand the customer’s needs and structure
facilities / products accordingly.
Goldman (2004) describes some of the potential risks and ineffectiveness of
relationship pricing programs. Clients buy products because of their inherent
value and merit and not because of additional perks they may receive as a
17

result of their increased relationship. Goldman advised that products should be
structured to recognize tenure and past activity. Clients want simplicity in their
financial services and are frustrated with programs with complicated tiers. When
a loan balance translates into eligibility for benefits, clients become alienated
once the loan is paid off and their benefit is gone. Banks should offer programs
that are enhanced over time by starting free and then increasing in value. Points
programs should offer a reward of choice. Relationship pricing models, while
also being profitable for the bank, must be simple for clients and add rewards
with minimal barriers / conditions.
Athanassopoulos (2000) wrote a paper examining customer satisfaction cues in
retail banking services. The study shows that customer segments yielded
statistically different satisfaction scores which verified the managerial value of
customer segmentation practices.
Adams (2007) describes the emergence of relationship pricing as a central
strategy in the banking industry. Vendors believe that this kind of pricing is an
adequate measure to gauge consumers’ real profitability. Most of the
relationship based pricing products use some form of customer analytics and
other customer relationship management-related methodologies to form an
integrated pricing strategy.
Cleveland (2001) asserts that relationship pricing has resulted in lower prices
and improved products and the customer ultimately gets a better deal at BNC
Bank in Arizona. Cleveland believes in risk rating the client’s credit needs and
18
pricing accordingly. If further substantial investments are moved to be managed
by BNC, then further price breaks on the products and services are calculated.
This dynamic pricing model has worked well for BNC Bank and the customers
were very receptive to the model. The biggest challenge in implementing this
strategy was to change the mindset of the bank staff.
Landry (2005) states that to implement a successful relationship pricing
strategy, banks will need a flexible pricing mechanism that can drive appropriate
pricing at the relationship level while attributing revenue back to the products.
Pricing and loyalty programs are still managed at the individual product level,
without consideration for a bank’s customer relationship strategy. Pricing and
financial management are still oriented around products – not around
relationships. Product pricing aims for profitability of a product without regard for
the overall customer relationship or its profitability. The relationship model
elevates customer profitability so that flexible pricing programs can be
structured to attract, retain and grow profitable customer relationships over time.
Loyalty programs should be structured to reward customers for the aggregate of
the business they do with the bank.
Morgan (2001) discusses how relationship pricing improves profitability and
member relationships of a company. At the New England Federal Credit Union,
management developed a full profitability portrait first and then designed the
relationship pricing system based on that analysis, as opposed to overlaying a
relationship pricing model on existing products and services. The target market
19
was segmented and an appropriate relationship pricing model was deployed for
the different segments.
Costanzo (2007) writes that relationship pricing is about treating customers to
preferential deals and it has become a necessity rather than just a customer
bonus. Relationship pricing will be a huge competitive advantage in banking.
The driver of all relationship pricing is increased wallet share. Loyalty programs
are one of the tools banks are using to get more from their customers while at
the same time giving them more.
2.3 Alignment of KPI’s
Walsh (2006, p. 509) states that organisations measure their improvement
efforts through key performance indicators (KPI’s). KPI’s can be decomposed
into key performance outcomes (KPO's) and key performance drivers (KPD's).
The business processes link the KPO’s to KPD’s. KPO’s measure progress
toward corporate objectives and KPD’s provide in-process measurement. Walsh
proposes new tools for linking KPO’s and KPD’s since performance indicators
are essentially a process issue. In order to optimally measure efforts through
KPI’s, a process view rather than a product view is recommended. A process
view would assist to align the KPI’s of the product areas so they are all aligned
to the corporate strategy. This would result in avoidance of “turf protection”.
Bauer (2004) writes that the alignment of KPI’s with the organisation’s vision /
mission / strategies / objectives is the key to realising bottom line impact. The
20
challenge is to develop KPI’s that provide a holistic and balanced view of the
business. There are a variety of metrics so the selection of the most meaningful
metrics is crucial. An individual KPI should be thought of as a balanced metric
that incorporates several alternate dimensions which include business
perspectives (financial, process, and development.), measurement families
(cost, productivity, quality) and measurement categories (direct, additive,
composite). By overlaying these various dimensions, one can create a
framework that succinctly captures the most critical drivers.
Gaskell (2007) declares that the employee’s perception is that the
organisational culture can be traced to the actions of the leader, since the
leaders create the conditions that determine the staff’s ability to work well
together. Gaskell (2007) suggests that it is important to measure progress using
KPI’s which reinforce high performance behaviour through recognition and
rewards programmes. The measurement system should also address the gaps
in performance.
Schiff (2007) describes the importance of understanding the purpose of
business performance management. Business Performance Management
focuses on improving the performance of the organisation. To start any
performance initiative, staff must understand the company’s overall strategy,
and the strategy must be communicated to the line managers. Once this is
established, business performance management can help managers determine
how well the company is executing the strategy, align and focus subordinates
on the key elements and positively reinforce behaviours that help to achieve the
21

company’s strategic goals. Once the strategy is communicated and understood
by the team, KPI’s may be used to demonstrate how well the company is
executing its strategy. Alignment of KPI’s causes all employees to focus on
what is important to the business as opposed to their department and creates
company wide strategic alignment.
Fleming (2005) asserts that six-sigma is useful in the manufacturing context but
not useful for measuring human interactions. He describes Human Sigma as a
method to measure employee performance. Employee attitudes affect customer
attitudes and customer attitudes affect financial performance. Some companies
may need to overhaul their human resource practices. If the Human Sigma
measurements are low, then the company must review its recruitment,
promotion and performance appraisal system.
Glen (2006) suggests that detail measurements of performance based on the
actual work done is useful, but a set of criteria based on the broader vision of
the firm should also be included in the KPI’s. This approach promotes strategic
alignment between the different functional areas.
Mittereder (2005, p. 10) advocates that traditional business intelligence is
changing to pervasive business intelligence which empowers everyone in the
organisation at all levels with analytics, alerts and feedback mechanisms. This
new paradigm has potential benefits and far-reaching cultural implications.
Pervasive business intelligence has the following benefits: it more effectively
leverages the strengths of the entire organisation by giving every employee the
22
power to contribute and to enhance the KPI’s set by management; it increases
the sustainable competitive advantage by helping to transform every employee
into an “organisation of one”; and it improves operational efficiency by
uncovering new best practices and driving those best practices from the bottom
up as well as top down. Pervasive business intelligence represents a powerful
tool for measuring progress against the strategic corporate goals and KPI’s that
have been set by management and communicated throughout the organisation.
Hammer (2007) describes the seven sins of operational performance metrics
and suggests a better way to measure. The sin of vanity involves metrics that
make the managers look good. Provincialism encourages silo focused metrics.
Narcissism matches performance against internal goals rather than customer
needs. Laziness produces miss-the-mark metrics because companies have
jumped to conclusions. Pettiness involves measuring part of an operation
without considering its role in overall performance. Inanity ignores the impact of
metrics on human behaviour. Frivolity allows personalities, hierarchy, and
politics to sidetrack serious focus on strategic issues. Hammer recommends
that these pitfalls should be avoided when developing KPI’s and that KPI’s
should be aligned to the broader objectives of the organisation in order to
mobilise staff towards common or shared goals.
2.4 System Inefficiencies
Sperling (2007) asserts that a successful system implementation should be
rooted firmly in the intersection between economics and technology. All
23
employees compete with the best of breed to maintain their position in the value
chain. The culture of an organisation should adapt to the industry challenges to
ensure a sustainable competitive position. Sperling (2007) also encourages the
partnership approach with all the stakeholders in the value chain. At Private
Banks, the silo type operation has resulted in system inefficiencies which are
product-focussed as opposed to being customer-focussed. The Credit, Sales
and Product areas should work together as partners in order to implement new
systems that are customer-centric, or modify the existing systems to become
more customer-centric. This research explored some of the system
inefficiencies that have resulted in the alignment between the sales and credit
functions being non-optimal. Recommendations were explored in this respect
with the objective of improving the alignment of the sales and credit functions.
2.5 Credit – Sales partnership
Sandin (2007) writes that bankers must be salesmen in a competitive industry.
He identifies six critical ingredients for a successful bank business development
program which include a well-defined management structure, quality customer
and prospect information, participant accountability, credit performance
measurements, sales support and a visible reward system.
An article in the Institutional Investor (2007) describes the successful business
transformation efforts of a Commercial Bank in the areas of personal finance
services through the centralisation of operations and through improving the
alignment between sales, marketing and credit. The management principles of
24
six-sigma were implemented to achieve their goals. There was a focus on new
fee-based products to boost their fee income. The adoption of six-sigma
ensured that the product areas worked closely together with sales and credit
and ensured that all the departments were working toward a common goal.
Tyburski (2005) describes 20 practical strategies to achieve the goal of building
a true credit-sales partnership. Through the implementation of these strategies,
credit and sales personnel will achieve a better understanding of what the other
does and communication will improve.
Credit Management (2004) outlines the findings of a survey conducted by the
Credit Management Research Centre at Leeds University Business School in
association with the Institute of Credit Management in 2003. The results provide
an overview of the credit performance in the UK. The research revealed that
internal credit management teams spend more than 50 percent of their time
chasing late payment and collecting revenues (back-end processes) and only
29 percent of time is devoted to front-end steps such as negotiating payment
terms, checking the customer’s ability to pay and checking orders against
creditworthiness. Through the alignment of credit and sales strategies, credit
can spend a more appropriate amount of time on front end interactions with the
sales staff.
Dawson (2005) defines the quality of the leadership and the commitment of
team members as pivotal to the success of the team. Any weakness within an
organisation can become a competitive disadvantage so the effective
25
functioning of teams is critical. The ability to build relationships and good
communication skills is important in teamwork. Team members with superior
interpersonal intelligence are the most productive since they create the synergy
required to get things done. A successful team must have: a clear mission, the
right competencies and skills, and direct and clear support from leadership. On
a day to day basis, the members of a successful team should recognise their
accomplishments, work together to develop the optimum solution and respect
fellow team members. Dawson describes the S.E.C.R.E.T of success team
dynamics as follows: seek and promote acceptance for all team members,
establish independent goals, create history, realise goals, encourage external
threats, and trust creation by building relationships.
Sumar (2006, p. 5) describes the tactics to form an effective credit and sales
partnership. Proactive credit executives are always looking for ways to improve
communication and teamwork with sales. By credit and sales focusing on a
common mission, the partnership is strengthened. It is important to
acknowledge the different mindsets that drive credit and sales. The goal of
sales is to sell and the goals of credit are to minimise risk, maximise cash flow,
increase profit and minimise bad debt and write-offs. The nature of sales is
urgency and immediacy while the key goals of credit can only be accomplished
through due diligence and establishment of trust with the customer, which
requires time. If sales do not understand and embrace credit’s mission, the
perception that credit is an inhibitor of sales can be created. Tensions between
credit and sales also develop due to a lack of management support, credit’s
failure to educate sales and lack of credit leadership.
26
To overcome the issues described above, Sumar advocates the following:
obtain management support for credit decisions so sales understands that
these are aligned to the company’s overall business strategy; get management
to include credit in strategic planning; get management to include credit in sales
meetings; and position credit as a sales tool by utilising credit decisions to
provide sales with a competitive advantage. Sumar emphasises that credit must
initiate and lead the change of perception by forging a partnership with sales, so
they become seen as “sales invention” and not “sales prevention”. Sales
perception should be changed so they see credit as holding up a yield or
caution sign and not a stop sign.
Diana (2007) advocates that credit managers have a key role to play in the
overall financial success of a company by being involved in setting credit terms
for new and existing markets and products. Credit terms are an integral part of
the company’s overall financial strategy. They have a direct impact on cash flow
and overall sales, which factor into the company’s level of financial vitality and
profitability. Experienced credit managers should also be consulted when
considering acquisitions since the credit manager will be in a good position to
analyse the financial stability of the company. By virtue of the fact that credit
managers manage the valuable asset of accounts receivables, they play a
major role in the financial success of the company and as a result should form a
vital component of any company’s management or executive team.
27
2.6 Job levels
Cummings and Worley (2005) consider the group composition as one of the key
components of group level diagnosis. The composition concerns the
membership of the groups. Membership can differ on a number of dimensions
that have relevance to group behaviour. Experience, education, skills and
abilities can affect how people behave and relate to each other in a group.
Highly skilled and experienced staff would flourish in environments that promote
autonomy, flexibility and innovation at the individual job level. Enriched jobs fit
people with a high level of skills, abilities and knowledge, while simpler more
routine jobs require limited skills and experience and better fit people who place
a low value on opportunities for self-direction and learning.
Cummings and Worley (2005) also describe the goals for more junior and less
experienced staff as being tangible and measurable while managers and team
leaders would focus on more strategic goals. As a result, strategic change
interventions are better understood and supported by more senior and
experienced staff since these strategic change interventions are more likely to
impact on the goals of the more senior staff. Senior staff are also awarded
shares in organisations as a performance reward / incentive. As a result senior
staff are more supportive of change initiatives which will ultimately improve the
firm’s profitability since they share in the rewards via share schemes.
28

Collis and Montgomery (2005) confirm that a sense of ownership builds
managerial commitment. When managers are rewarded based on the
performance of their business unit, their level of motivation will be high.
29
CHAPTER 3: RESEARCH PROPOSITIONS
The research problem explores how the alignment between the credit and
business functions of the private banking area in a South African bank can be
optimised.
Proposition 1: The Private bank staff (credit and sales viewed as a group)
support future initiatives that will enable sales and credit to work more
effectively together, specifically:
1.1 in moving from a product centric to customer centric approach;
1.2 in achieving the goal of relationship pricing;
1.3 in the alignment of the personal KPI’s to the broader strategy of the firm;
1.4 in addressing system inefficiencies; and
1.5 in implementing alternate strategies (e.g. strategies that aim to achieve a
better understanding each other’s roles and work pressures better; improving
communication; aligning their goals; and working towards supporting the
success of each department).
Proposition 2: There is alignment between the views of the Credit staff versus
the views of the Sales staff towards strategies that allowed them to work more
effectively together, specifically:
2.1 in moving from a product centric to customer centric approach;
2.2 in achieving the goal of relationship pricing;
2.3 in the alignment of the personal KPI’s to the broader strategy of the firm;
2.4 in addressing system inefficiencies; and
30
2.5 in implementing alternate strategies (e.g. strategies that aim to achieve a
better understanding of each other’s roles and work pressures ; improving
communication; aligning their goals; and working towards supporting the
success of each department).
Proposition 3: Opinions of the respondents in credit on different levels (officer,
manager/senior manager) will be different. Opinions of the respondents in sales
on different levels (officer, manager/senior manager) will be different. The more
junior staff will be less supportive of the strategies proposed compared to the
more senior staff, specifically:
3.1 in moving from a product-centric to customer-centric approach;
3.2 in achieving the goal of relationship pricing;
3.3 in the alignment of the personal KPI’s to the broader strategy of the firm;
3.4 in addressing system inefficiencies; and
3.5 in implementing alternate strategies (e.g. strategies that aim to achieve a
better understanding of each other’s roles and work pressures better; improving
communication; aligning their goals; and working towards supporting the
success of each department).
31
CHAPTER 4: RESEARCH METHODOLOGY
Lind, Mason and Marchal (2000) and Zikmund (2003) were referenced for this
chapter.
4.1 Defence of methods
The following three sections present the defence of the method used in this
study:
• Research design
• Measurement scales
• Analysis techniques
4.1.1 Research design
The design of this research was considered to be non-experimental survey
research as there were no experimental treatments administered to the
respondents. The nature of survey research was descriptive since the purpose
was to describe the characteristics of an existing phenomenon. Furthermore the
research was cross sectional in nature as all observations were collected at a
single point in time. As such, no causal relations were inferred from the results
and only correlational and descriptive stats and graphs were presented. By
contrast, experimental research involves an intervention which refers to the
exposure of research subjects to something to which they would otherwise not
have been subjected.
32
As in typical survey research, this research was quantitative in nature. In
addition the research included a small qualitative component so that
respondents had the opportunity to make in-depth suggestions on the future
strategies. One of the weaknesses of quantitative research is that the
respondents are not given the opportunity to provide in-depth answers. Open-
ended questions were included to pick up some other suggestions /
recommendations that were not included in the questionnaire since the
questionnaire was not able to cater for every single strategy scenario.
4.1.2 Measurement scales
The type of analysis was largely determined by the level of the measurement
scale. There were four underlying scales of measurement:
Nominal scales: This was the lowest level of measurement. It classified
variables into unordered qualitative categories e.g. the “Race” variable in this
research.
Ordinal scales: The classification into ordered qualitative categories where the
values have a distinct order but their categories are qualitative in that there was
no natural (numerical) distance between their positive values. An example of an
ordinal scale in this research is the Management level variable.
33
Interval scales: In this case the measurement conveys information about the
ordering of magnitude of the measurement and about the distance between the
values. The agree / disagree (5 point Likert) scales used in this research are
strictly speaking ordinal in nature but are often considered as interval scales by
researchers to enable the calculation of means and parametric significance
testing. Hence the scale classification for this research was considered interval
for analysis purposes with supporting tables of frequencies consistent with
ordinal scales.
Ratio: These are measurements where there is equal distance between the
numbers as with interval scales yet it has an absolute zero. No ratio variables
were included in this study.
4.1.3 Analysis techniques
Assuming that the Likert scaled items used in the questionnaire were equal
interval in nature, parametric analyses were carried out. These analyses
included t tests for one group compared to a reference constant, and t tests for
two group comparisons, where sample sizes allowed. In cases where sample
sizes were insufficiently large, non-parametric equivalent tests such as the
Mann Whitney U were computed for group comparisons. Non-parametric tests
use the rank order of the scores rather than the actual scores for their
computation and are thus not biased where the sample size is small.
Furthermore, where sample sizes did not allow for a factorial analysis of
variance, the results of the individual levels of the main effect were considered
34

separately, and parametric or non-parametric group comparisons computed
depending on sample size. In view of the number of items requiring group
comparisons to test the proposition of the research, multivariate comparisons
such as Hotelling's T2 statistics were computed to control for the overall
experiment-wise level of significance, and multiple univariate comparisons
computed only in the presence of significant multivariate comparisons. This
approach prevents the problem of capitalising on chance that could have
occurred had the analysis comprised multiple univariate tests only. All
comparative results were supported by corresponding graphs of means and
frequencies.
4.2 Process of data analysis
In order to evaluate whether respondents were positively disposed to the five
categories of the propositions, directional single group t tests against a
reference constant of 3 were used for the first proposition. As the reference
constant of 3 represents the neutral point on the scale, means significantly
greater than 3 were interpreted as positive attitudes. Throughout the analyses,
for propositions 1.1 to 1.5, the p value was quoted and the most stringent of the
conventional significance levels of 5%, 1% and 0.1% was indicated.
Multivariate tests such as Hotelling’s T2 test were used to test the second
proposition of the alignment of credit and sales respondents. As previously
discussed, the problem of conducting several individual univariate tests was
that each one has a type 1 error associated (typically 5%) and so with multiple T
35
tests, one is capitalising on the chance that some of these will be expected to
yield significantly different results due to random error. A multivariate test such
as Hotelling’s T2 test controls the overall level of significance so that the
probability of a type 1 error over all the tests is controlled at the specified
significant level. Given that the multivariate test was significant, the researcher
then investigated whether each univariate test was significant (p<0.05).
Otherwise the significance of the univariate tests was not examined.
In line with the propositions 2.1 to 2.5, five Hotelling's T2 tests were computed
and for those that were significant, univariate t test results were examined.
There are however two optional t tests that can be used to compare group
means: t tests assuming underlying homogenous group variances, and t tests
assuming underlying heterogeneous group variances. The decision as to which
t test to use was determined by the significance of the F test for variances.
Accordingly, p values < 5% were indicative of significantly different group
variances and thus the t test assuming heterogeneous group variances was
used. In the tabulated results presented, the choice of t test was indicated by
italicising the t test based on heterogeneous variances.
In view of the small number of officers in credit (N=6) the Mann Whitney U test
was computed to compare the rank orders of the attitudes of officers and
managers towards the five categories of the propositions. In the case of the
sales staff, sample size permitted parametric comparisons using Hotelling’s T2
and univariate t tests, using the same process of analysis as described for
proposition 2.
36
The open ended questions were included to pick up some other suggestions /
recommendations that were not included in the questionnaire and the
questionnaire was not able to cater for every single scenario of strategies.
4.3 Sampling methodology
4.3.1 Definition of the unit of analysis
Huysamen (2001) defines the units of analysis as the actual respondents, so
the respondents from the sales and credit functions formed the unit of analysis
in this research.
4.3.2 Population
The population was the Bank’s private bank sales staff across the country and
the private bank credit staff, all of whom are situated in Gauteng. The target
population was the sales staff in Gauteng as these respondents constitute over
half of the national population of sales staff. According to the July 2007 year to
date financials of the Private Bank Monthly Pack (Table 4.1), 98 of the 173
(57%) of the Account Executives (private bankers) are based in Gauteng. The
target population was also the Private Bank Credit staff located in Sandton. The
Private Bank Credit staff in Sandton, Gauteng, constitutes national resources
and do all the credit for the entire country. There are no regional Private Bank
Credit resources.
37
The decision to restrict the sampling to Gauteng was based on logistical,
operational and strategic considerations. From Table 4.1, Gauteng’s actual and
budgeted operating income was 60% of the total. Fifty-nine percent of the
relationships (i.e. between the customer and the account executive), were held
in Gauteng. Clearly, the majority of the Private Banking activity is in Gauteng
hence this research was done in Gauteng only.
The Gauteng Private Bank Account Executives (98 staff) and the Private Bank
Credit staff (18 staff) were invited to participate in this research.
38
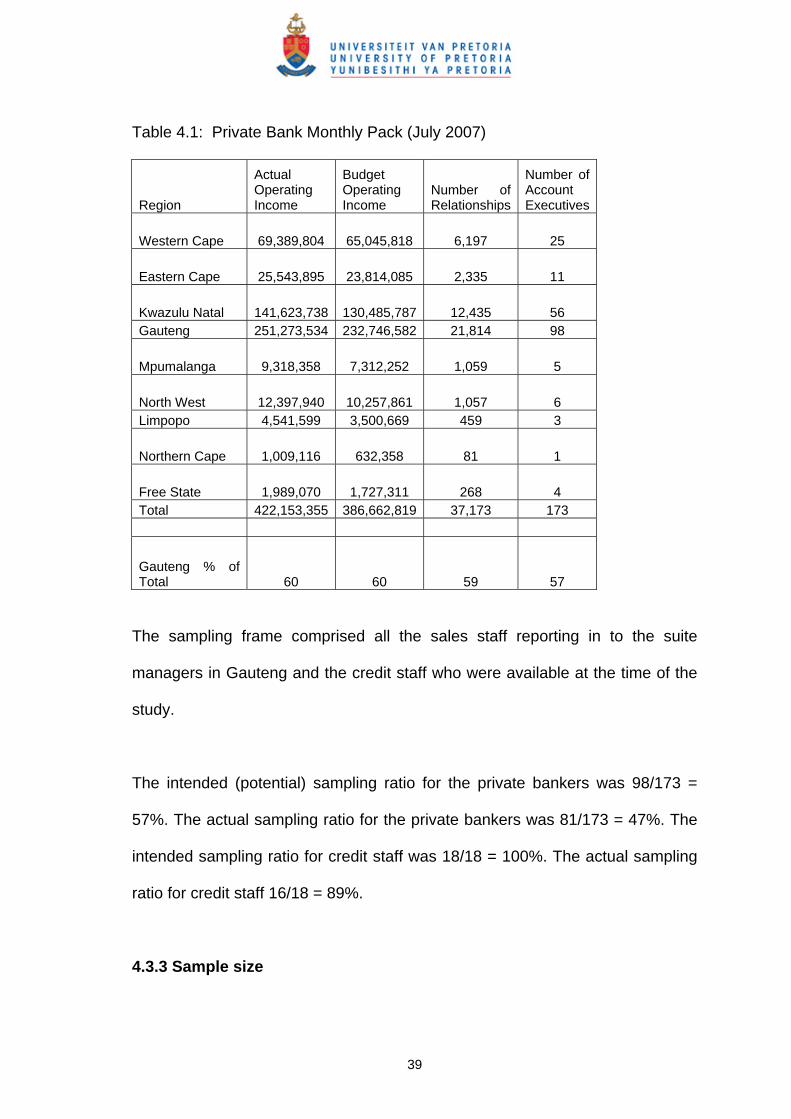
Table 4.1: Private Bank Monthly Pack (July 2007)
Region
Actual Operating Income
Budget Operating Income
Number of Relationships
Number of Account Executives
Western Cape 69,389,804 65,045,818 6,197 25
Eastern Cape 25,543,895 23,814,085 2,335 11
Kwazulu Natal 141,623,738 130,485,787 12,435 56 Gauteng 251,273,534 232,746,582 21,814 98
Mpumalanga 9,318,358 7,312,252 1,059 5
North West 12,397,940 10,257,861 1,057 6 Limpopo 4,541,599 3,500,669 459 3
Northern Cape 1,009,116 632,358 81 1
Free State 1,989,070 1,727,311 268 4 Total 422,153,355 386,662,819 37,173 173
Gauteng % of Total 60 60 59 57
The sampling frame comprised all the sales staff reporting in to the suite
managers in Gauteng and the credit staff who were available at the time of the
study.
The intended (potential) sampling ratio for the private bankers was 98/173 =
57%. The actual sampling ratio for the private bankers was 81/173 = 47%. The
intended sampling ratio for credit staff was 18/18 = 100%. The actual sampling
ratio for credit staff 16/18 = 89%.
4.3.3 Sample size
39
The potential sample size was 116 (98 private bankers and 18 credit staff). The
overall response rate was 84% of which 14% was credit staff and 70% private
bankers.
4.3.4 Sampling method
The sampling method is best described as non-probability purposive sampling.
A questionnaire was sent specifically to all the sales staff in Gauteng and all the
national credit staff with the aim of accessing as many of them as possible.
4.4 Research instrument used
The measurement instrument was a questionnaire. This questionnaire is
attached in Appendix 1. The draft questionnaire was discussed with a senior
manager from the strategy area of the bank and then with a director in the
private banking departing. Some questions were deleted since they did not
provide insights into the propositions. Some questions were reworded in order
to simplify the questions and remove ambiguity. Some questions were
separated into several questions since there were several parts to the questions
and a respondent could agree to the first part but not to the second. Some
questions were deleted because they were only a slight variation of one of the
previous questions and would not add further insights. After two revisions, the
final questionnaire was distributed. Appendix 2, Table 10.1 shows the details of
the revisions made.
40
4.5 Procedure of data collection
The measurement instrument was a questionnaire that was e-mailed to the
suite managers. The suite managers then distributed the questionnaires to their
sales staff and the sales staff printed the questionnaire and manually completed
it and handed it back to the suite managers. The suite managers delivered the
responses to the researcher. The details of the research and the purpose and
intention of the research was communicated to the participants. The Head of
Private Bank Credit e-mailed the questionnaire to his management team and a
similar approach as for sales staff was adopted. By following this approach, the
sales and credit respondents remained anonymous.
4.6 Limitations of the research
Because of the nature of the research, a certain amount of measurement
reactivity may have entered the research. Because some of the questions were
on attitudes and behaviours, the participants may have been tempted to answer
the questions in a way they felt was expected. The use of a 5 point Likert scale
allowed for a neutral response. This also was the least number of response
categories one could have in order to assume an equal interval scale. In the
case of a more sensitive question, this allowed the respondent to answer
without taking a position. This means that the mean will tend towards the
neutral position for these questions and a slightly skewed result may be
obtained. Another limitation of this research is that it is confined to one company
41
and may reflect the culture of the company rather than the views of managers in
general.
The number of years of service variable could have yielded some useful trends
when contrasting the responses of the more experienced staff to the less
experienced staff, but this variable was not included in the questionnaire
because it could have resulted in biased responses. Staff who have been in the
bank for a long time and are still on a junior grade or level would be sensitive to
this issue. This variable could have compromised the anonymity of the
respondents and caused the response rate to drop for fear of identification as
the survey was internal to the bank.
42
CHAPTER 5: RESULTS
Table 5.1: Distribution of the respondents by gender, race and level.
Number PercentageFemale 74 76% Gender Male 23 24% Black 10 10% Coloured 4 4% Indian 23 24%
Race
White 60 62% Manager 70 72% Officer 20 21% Level Senior Manager 7 7%
Total 97 100%
Table 5.2: Distribution of respondents by function and level.
Function Level Officer
Level Manager
Level Senior Manager
Row Totals
Credit 6 10 0 16 Sales 14 60 7 81 All Groups 20 69 7 97
The results of the study will be discussed in line with the propositions of the
study.
5.1 Proposition 1
The first proposition is that private bank staff support future initiatives that will
enable sales and credit to work more effectively together. A one group t-test
against a reference constant of 3 was used to analyse this proposition. For all
the questions that address the future initiatives, p < 0.001 which means that the
mean was significantly greater than the neutral scale point of three at the 0.1%
level of significance. Based on these significant results as well as the
43
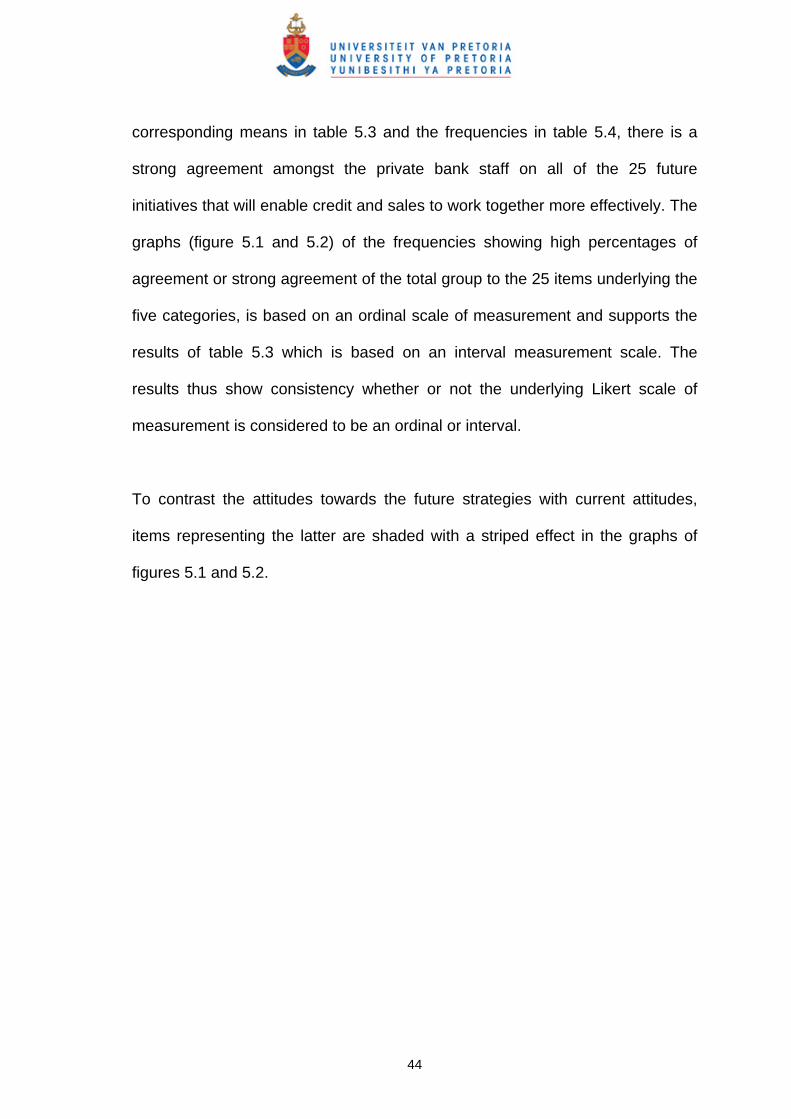
corresponding means in table 5.3 and the frequencies in table 5.4, there is a
strong agreement amongst the private bank staff on all of the 25 future
initiatives that will enable credit and sales to work together more effectively. The
graphs (figure 5.1 and 5.2) of the frequencies showing high percentages of
agreement or strong agreement of the total group to the 25 items underlying the
five categories, is based on an ordinal scale of measurement and supports the
results of table 5.3 which is based on an interval measurement scale. The
results thus show consistency whether or not the underlying Likert scale of
measurement is considered to be an ordinal or interval.
To contrast the attitudes towards the future strategies with current attitudes,
items representing the latter are shaded with a striped effect in the graphs of
figures 5.1 and 5.2.
44
Table 5.3: Descriptive statistics and One group t test against a reference constant of 3 for total group (N=98)
Mean Std.Dv. N Std.Err. Reference Constant
t-value dfp 1-tailed
2CC: single customer view - cross-sell and up-sell 4.53 0.75 98 0.08 3.0 20.23 97 0.0000006KPI: mutual goals - revenue generation 4.19 0.96 98 0.10 3.0 12.32 97 0.0000007KPI: mutual goals - minimising bad debt losses 4.48 0.76 98 0.08 3.0 19.20 97 0.0000008KPI: mutual goals - decreased collection cycles 4.30 0.88 96 0.09 3.0 14.43 95 0.0000009KPI: support the success of each other 4.66 0.61 97 0.06 3.0 26.78 96 0.00000012CSP: visit customers together 3.60 1.26 97 0.13 3.0 4.66 96 0.00000513CSP: discuss the approach - visiting customers 4.01 1.18 96 0.12 3.0 8.37 95 0.00000014CSP: spend a day in the life of the other 4.34 0.86 96 0.09 3.0 15.38 95 0.00000015CSP: monthly meetings together 4.31 0.72 95 0.07 3.0 17.78 94 0.00000016CSP: understand the customers expectations 4.47 0.70 96 0.07 3.0 20.70 95 0.00000017CSP: get the advice of credit before the sales process 3.93 0.96 97 0.10 3.0 9.52 96 0.00000018CSP: include Credit in visits to difficult clients 3.99 1.13 97 0.11 3.0 8.61 96 0.00000019CSP: Credit observe live selling situations 3.81 1.14 97 0.12 3.0 7.04 96 0.00000020CSP: do team-building activities together 4.08 0.95 97 0.10 3.0 11.18 96 0.00000021CSP: product demonstrations to the credit 3.55 1.03 96 0.11 3.0 5.23 95 0.00000122CSP: conduct service demonstrations to credit 3.65 1.04 98 0.10 3.0 6.24 97 0.00000023CSP: resolve customer disputes 4.33 0.78 98 0.08 3.0 16.76 97 0.00000024CSP: agree on a deadline 4.36 0.81 97 0.08 3.0 16.63 96 0.00000025CSP: implement problem solving sessions 4.29 0.81 98 0.08 3.0 15.67 97 0.00000026CSP: recognise Private Bankers 4.41 0.62 98 0.06 3.0 22.37 97 0.00000027CSP: simplify the credit rules and policies 4.32 0.87 97 0.09 3.0 14.89 96 0.00000028CSP: share Credit newsletter 3.87 0.98 98 0.10 3.0 8.76 97 0.00000029CSP: special speaker of the month 3.47 1.03 98 0.10 3.0 4.52 97 0.00000930CSP: communicate over the phone or face to face 3.90 0.90 98 0.09 3.0 9.85 97 0.00000031CSP: regular team meeting 3.99 0.94 98 0.09 3.0 10.47 97 0.000000
45

1.1 Move from a product centric to customer centric approach
0%10%20%30%40%50%60%70%80%90%
100%
1CC: single customer view 2CC: single customer view - cross-selland up-sell
% a
gree
/ str
ongl
y ag
ree
1CC: single customer view 2CC: single customer view - cross-sell and up-sell
1.2 Achieving the goal of relationship pricing
48%
21%16%
0%10%20%30%40%50%60%70%80%90%
100%
3RP: product centric model 4RP: rewards program 5RP: discounted fees
% a
gree
/ str
ongl
y ag
ree
% agree/ strongly agree
1.3 Alignment of the personal KPI’s to the broader strategy of the firm
85% 93% 88%98%
0%20%40%60%80%
100%
6KPI: mutualgoals - revenue
generation
7KPI: mutualgoals -
minimising baddebt losses
8KPI: mutualgoals -
decreasedcollection cycles
9KPI: supportthe success of
each other
% a
gree
/ str
ongl
y ag
ree % agree/ strongly agree
1.4 Address system inefficiencies
29% 35%
0%10%20%30%40%50%60%70%80%90%
100%
10SI: systems-customeromercentricity
11SI: systems-relationship pricing
% a
gree
/ str
ongl
y ag
ree
10SI: systems-customeromer centricity 11SI: systems-relationship pricing
Figure 5.1: Percentage of respondents who agree or strongly agree with items 1.1 to 1.4 of Proposition 1
46
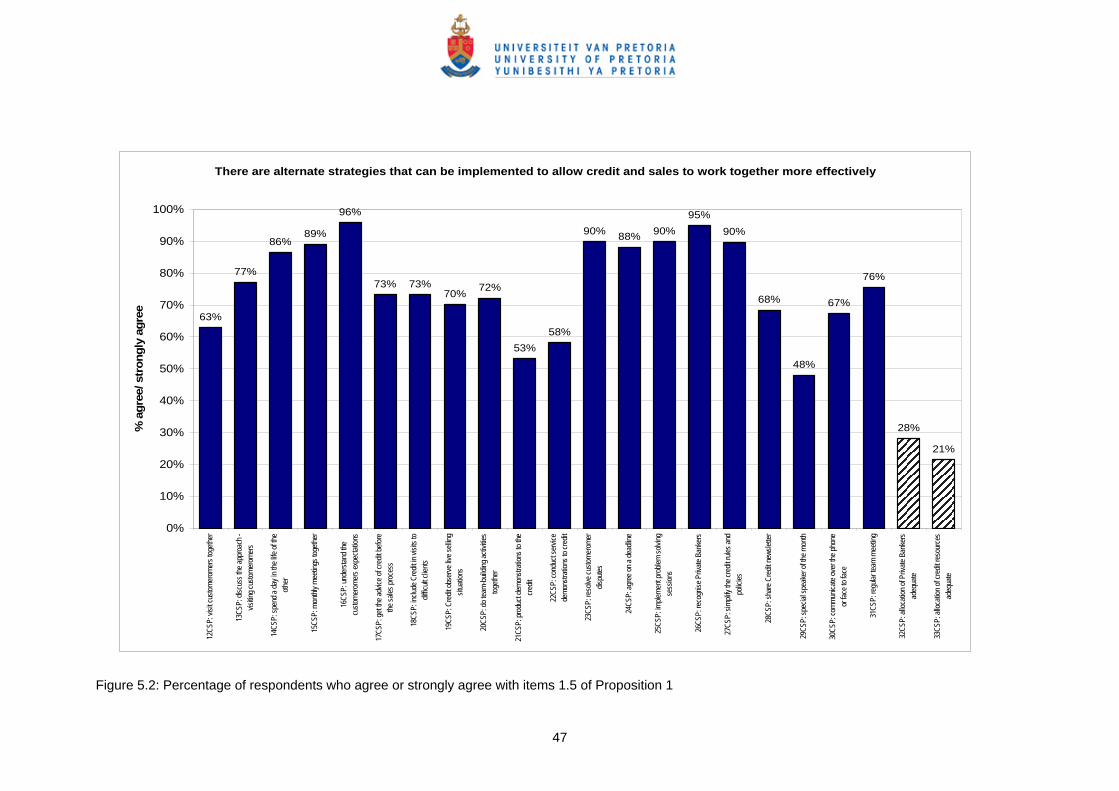
There are alternate strategies that can be implemented to allow credit and sales to work together more effectively
63%
77%
86%89%
96%
73% 73%70% 72%
53%58%
90% 88% 90%95%
90%
68%
48%
67%
76%
28%
21%
0%
10%
20%
30%
40%
50%
60%
70%
80%
90%
100%12
CSP:
visit
custo
mer
omer
s tog
ether
13CS
P: di
scus
s the
appr
oach
-vis
iting c
ustom
erom
ers
14CS
P: sp
end a
day i
n the
life o
f the
other
15CS
P: m
onthl
y mee
tings
toge
ther
16CS
P: un
derst
and t
hecu
stom
erom
ers e
xpec
tation
s
17CS
P: ge
t the a
dvice
of cr
edit b
efore
the sa
les pr
oces
s
18CS
P: in
clude
Cre
dit in
visit
s to
diffic
ult cl
ients
19CS
P: C
redit
obse
rve liv
e sell
ingsit
uatio
ns
20CS
P: do
team
-buil
ding a
ctivit
iestog
ether
21CS
P: pr
oduc
t dem
onstr
ation
s to t
hecre
dit
22CS
P: co
nduc
t ser
vice
demo
nstra
tions
to cr
edit
23CS
P: re
solve
custo
mer
omer
dispu
tes
24CS
P: ag
ree o
n a de
adlin
e
25CS
P: im
plem
ent p
roble
m so
lving
sess
ions
26CS
P: re
cogn
ise P
rivate
Ban
kers
27CS
P: si
mpli
fy the
cred
it rule
s and
polic
ies
28CS
P: sh
are C
redit
news
letter
29CS
P: sp
ecial
spea
ker o
f the m
onth
30CS
P: co
mmun
icate
over
the p
hone
or fa
ce to
face
31CS
P: re
gular
team
mee
ting
32CS
P: al
locati
on of
Priv
ate B
anke
rsad
equa
te
33CS
P: al
locati
on of
cred
it res
ource
sad
equa
te
% a
gree
/ str
ongl
y ag
ree
47
Figure 5.2: Percentage of respondents who agree or strongly agree with items 1.5 of Proposition 1
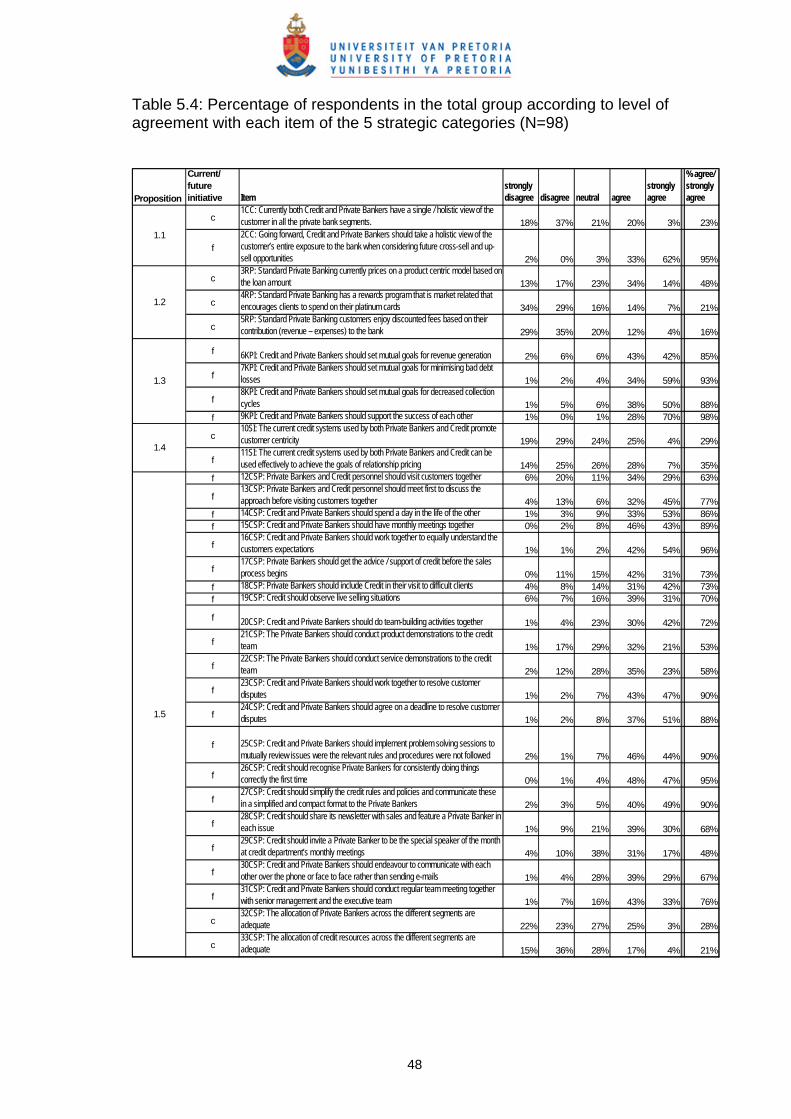
Table 5.4: Percentage of respondents in the total group according to level of agreement with each item of the 5 strategic categories (N=98)
Proposition
Current/ future initiative Item
strongly disagree disagree neutral agree
strongly agree
% agree/ strongly agree
c1CC: Currently both Credit and Private Bankers have a single / holistic view of the customer in all the private bank segments. 18% 37% 21% 20% 3% 23%
f2CC: Going forward, Credit and Private Bankers should take a holistic view of the customer’s entire exposure to the bank when considering future cross-sell and up-sell opportunities 2% 0% 3% 33% 62% 95%
c3RP: Standard Private Banking currently prices on a product centric model based on the loan amount 13% 17% 23% 34% 14% 48%
c4RP: Standard Private Banking has a rewards program that is market related that encourages clients to spend on their platinum cards 34% 29% 16% 14% 7% 21%
c5RP: Standard Private Banking customers enjoy discounted fees based on their contribution (revenue – expenses) to the bank 29% 35% 20% 12% 4% 16%
f 6KPI: Credit and Private Bankers should set mutual goals for revenue generation 2% 6% 6% 43% 42% 85%
f7KPI: Credit and Private Bankers should set mutual goals for minimising bad debt losses 1% 2% 4% 34% 59% 93%
f8KPI: Credit and Private Bankers should set mutual goals for decreased collection cycles 1% 5% 6% 38% 50% 88%
f 9KPI: Credit and Private Bankers should support the success of each other 1% 0% 1% 28% 70% 98%
c10SI: The current credit systems used by both Private Bankers and Credit promote customer centricity 19% 29% 24% 25% 4% 29%
f11SI: The current credit systems used by both Private Bankers and Credit can be used effectively to achieve the goals of relationship pricing 14% 25% 26% 28% 7% 35%
f 12CSP: Private Bankers and Credit personnel should visit customers together 6% 20% 11% 34% 29% 63%
f13CSP: Private Bankers and Credit personnel should meet first to discuss the approach before visiting customers together 4% 13% 6% 32% 45% 77%
f 14CSP: Credit and Private Bankers should spend a day in the life of the other 1% 3% 9% 33% 53% 86%f 15CSP: Credit and Private Bankers should have monthly meetings together 0% 2% 8% 46% 43% 89%
f16CSP: Credit and Private Bankers should work together to equally understand the customers expectations 1% 1% 2% 42% 54% 96%
f17CSP: Private Bankers should get the advice / support of credit before the sales process begins 0% 11% 15% 42% 31% 73%
f 18CSP: Private Bankers should include Credit in their visit to difficult clients 4% 8% 14% 31% 42% 73%f 19CSP: Credit should observe live selling situations 6% 7% 16% 39% 31% 70%
f 20CSP: Credit and Private Bankers should do team-building activities together 1% 4% 23% 30% 42% 72%
f21CSP: The Private Bankers should conduct product demonstrations to the credit team 1% 17% 29% 32% 21% 53%
f22CSP: The Private Bankers should conduct service demonstrations to the credit team 2% 12% 28% 35% 23% 58%
f23CSP: Credit and Private Bankers should work together to resolve customer disputes 1% 2% 7% 43% 47% 90%
f24CSP: Credit and Private Bankers should agree on a deadline to resolve customer disputes 1% 2% 8% 37% 51% 88%
f 25CSP: Credit and Private Bankers should implement problem solving sessions to mutually review issues were the relevant rules and procedures were not followed 2% 1% 7% 46% 44% 90%
f26CSP: Credit should recognise Private Bankers for consistently doing things correctly the first time 0% 1% 4% 48% 47% 95%
f27CSP: Credit should simplify the credit rules and policies and communicate these in a simplified and compact format to the Private Bankers 2% 3% 5% 40% 49% 90%
f28CSP: Credit should share its newsletter with sales and feature a Private Banker in each issue 1% 9% 21% 39% 30% 68%
f29CSP: Credit should invite a Private Banker to be the special speaker of the month at credit department’s monthly meetings 4% 10% 38% 31% 17% 48%
f30CSP: Credit and Private Bankers should endeavour to communicate with each other over the phone or face to face rather than sending e-mails 1% 4% 28% 39% 29% 67%
f31CSP: Credit and Private Bankers should conduct regular team meeting together with senior management and the executive team 1% 7% 16% 43% 33% 76%
c32CSP: The allocation of Private Bankers across the different segments are adequate 22% 23% 27% 25% 3% 28%
c33CSP: The allocation of credit resources across the different segments are adequate 15% 36% 28% 17% 4% 21%
1.5
1.1
1.2
1.3
1.4
48

5.2 Proposition 2
There is alignment between the views of Credit versus Sales staff on strategies
that can be implemented to work together more effectively.
The results of the study support one of the five proposition categories, namely
customer centricity. On (2.1) Hotelling’s T2 = 0.000, p > 0.05 (Table 5.5). At the
multivariate level, there is no significant difference between the overall views of
credit and sales staff towards the items underlying the scale addressing this
sub-proposition.
The Hotelling’s T2 statistics for the multivariate comparisons of the two groups
on the scales addressing the other four sub-propositions was significant at the
0.1% level of significance.
The results of table 5.5 for (2.2) show there is a highly significant difference
between the overall views of credit and sales towards relationship pricing at the
multivariate level (T2 = 5.26E+8, p<0.001). At the univariate level, there is a
highly significant difference in the views of credit and sales staff on 4RP
(Standard Private Banking has a rewards program that is market related that
encourages clients to spend on their platinum cards) and 5RP (Standard Private
Banking customers enjoy discounted fees based on their contribution (revenue
– expenses) to the bank) at the 5% significance level.
49
For (2.3), although there is multivariate significance (T2 = 3.48E+10, p<0.001),
none of the underlying univariate comparisons are significant (p > 0.05)
implying that the univariate comparisons merely contributed to an overall
significant difference. Thus the overall or multivariate differences in the
responses cannot be localised to any of the individual KPI propositions listed.
For (2.4), the significant multivariate comparison (T2=-7.45E+27, p<0.001) is
supported by the significant univariate level comparison (p<0.05) of item 11SI
(The current credit systems used by both Private Bankers and Credit can be
used effectively to achieve the goals of relationship pricing).
For (2.5), the multivariate comparison is once again significant (T2=-26989,
p<0.001). Thirteen of the twenty univariate comparisons are significant three of
which are significant at the 0.1% level of significance, 12 CSP, 22CSP and
27CSP. A further three comparisons are significant at the 1% level (19, 23, 25).
The remaining seven comparisons are significant at the 5% level (13, 14, 18,
21, 24, 26, 28). It should be noted that six of the univariate t tests were based
on heterogeneous underlying group variances as the F test for the variances of
the credit and sales groups were significant (see right-most column of table
5.5). The p values for the test of the comparison of variances were examined.
For (2.2) to (2.5) the direction of the means in the case of the significantly
different univariate comparisons is indicative of the direction of the misalignment
of the two groups. The graphs in figures 5.1 and 5.2 are used to interpret this
direction in Chapter 6. It should be noted that the means of the sales
50

respondents is consistently higher than the corresponding means of the credit
respondents apart from the last two items which reflect the current state of
affairs.
51
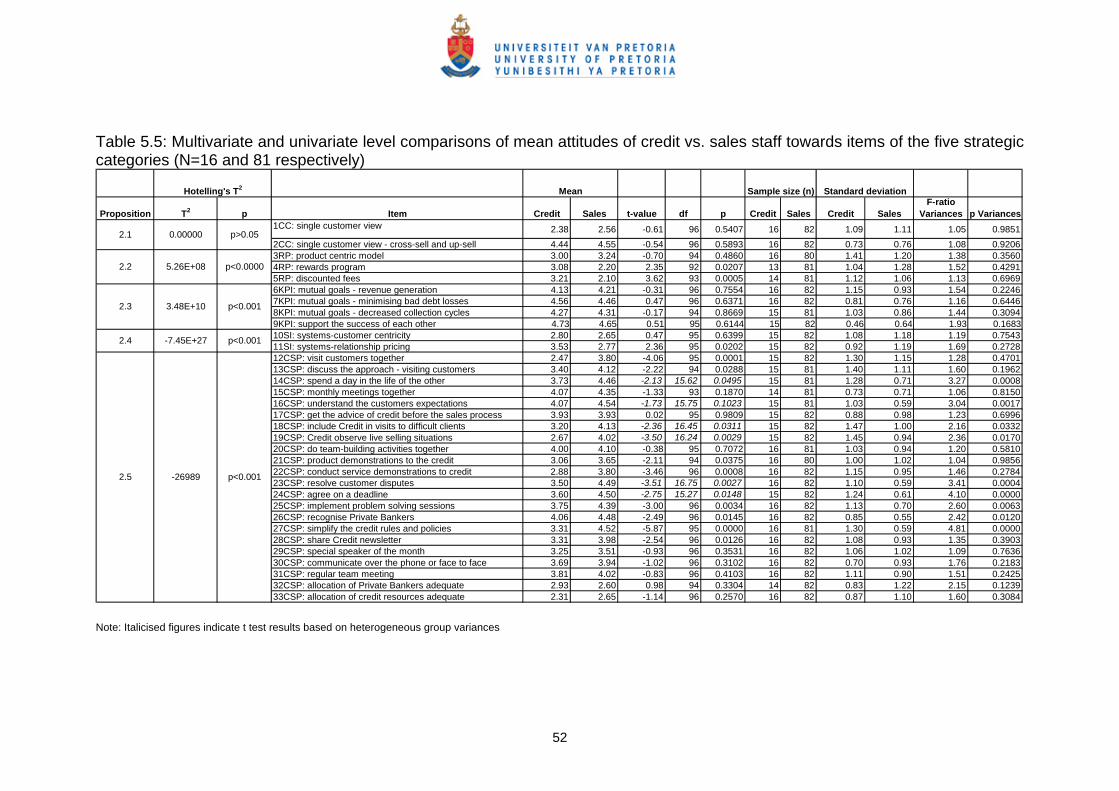
Table 5.5: Multivariate and univariate level comparisons of mean attitudes of credit vs. sales staff towards items of the five strategic categories (N=16 and 81 respectively)
Proposition T2 p Item Credit Sales t-value df p Credit Sales Credit SalesF-ratio
Variances p Variances1CC: single customer view 2.38 2.56 -0.61 96 0.5407 16 82 1.09 1.11 1.05 0.98512CC: single customer view - cross-sell and up-sell 4.44 4.55 -0.54 96 0.5893 16 82 0.73 0.76 1.08 0.92063RP: product centric model 3.00 3.24 -0.70 94 0.4860 16 80 1.41 1.20 1.38 0.35604RP: rewards program 3.08 2.20 2.35 92 0.0207 13 81 1.04 1.28 1.52 0.42915RP: discounted fees 3.21 2.10 3.62 93 0.0005 14 81 1.12 1.06 1.13 0.69696KPI: mutual goals - revenue generation 4.13 4.21 -0.31 96 0.7554 16 82 1.15 0.93 1.54 0.22467KPI: mutual goals - minimising bad debt losses 4.56 4.46 0.47 96 0.6371 16 82 0.81 0.76 1.16 0.64468KPI: mutual goals - decreased collection cycles 4.27 4.31 -0.17 94 0.8669 15 81 1.03 0.86 1.44 0.30949KPI: support the success of each other 4.73 4.65 0.51 95 0.6144 15 82 0.46 0.64 1.93 0.168310SI: systems-customer centricity 2.80 2.65 0.47 95 0.6399 15 82 1.08 1.18 1.19 0.754311SI: systems-relationship pricing 3.53 2.77 2.36 95 0.0202 15 82 0.92 1.19 1.69 0.272812CSP: visit customers together 2.47 3.80 -4.06 95 0.0001 15 82 1.30 1.15 1.28 0.470113CSP: discuss the approach - visiting customers 3.40 4.12 -2.22 94 0.0288 15 81 1.40 1.11 1.60 0.196214CSP: spend a day in the life of the other 3.73 4.46 -2.13 15.62 0.0495 15 81 1.28 0.71 3.27 0.000815CSP: monthly meetings together 4.07 4.35 -1.33 93 0.1870 14 81 0.73 0.71 1.06 0.815016CSP: understand the customers expectations 4.07 4.54 -1.73 15.75 0.1023 15 81 1.03 0.59 3.04 0.001717CSP: get the advice of credit before the sales process 3.93 3.93 0.02 95 0.9809 15 82 0.88 0.98 1.23 0.699618CSP: include Credit in visits to difficult clients 3.20 4.13 -2.36 16.45 0.0311 15 82 1.47 1.00 2.16 0.033219CSP: Credit observe live selling situations 2.67 4.02 -3.50 16.24 0.0029 15 82 1.45 0.94 2.36 0.017020CSP: do team-building activities together 4.00 4.10 -0.38 95 0.7072 16 81 1.03 0.94 1.20 0.581021CSP: product demonstrations to the credit 3.06 3.65 -2.11 94 0.0375 16 80 1.00 1.02 1.04 0.985622CSP: conduct service demonstrations to credit 2.88 3.80 -3.46 96 0.0008 16 82 1.15 0.95 1.46 0.278423CSP: resolve customer disputes 3.50 4.49 -3.51 16.75 0.0027 16 82 1.10 0.59 3.41 0.000424CSP: agree on a deadline 3.60 4.50 -2.75 15.27 0.0148 15 82 1.24 0.61 4.10 0.000025CSP: implement problem solving sessions 3.75 4.39 -3.00 96 0.0034 16 82 1.13 0.70 2.60 0.006326CSP: recognise Private Bankers 4.06 4.48 -2.49 96 0.0145 16 82 0.85 0.55 2.42 0.012027CSP: simplify the credit rules and policies 3.31 4.52 -5.87 95 0.0000 16 81 1.30 0.59 4.81 0.000028CSP: share Credit newsletter 3.31 3.98 -2.54 96 0.0126 16 82 1.08 0.93 1.35 0.390329CSP: special speaker of the month 3.25 3.51 -0.93 96 0.3531 16 82 1.06 1.02 1.09 0.763630CSP: communicate over the phone or face to face 3.69 3.94 -1.02 96 0.3102 16 82 0.70 0.93 1.76 0.218331CSP: regular team meeting 3.81 4.02 -0.83 96 0.4103 16 82 1.11 0.90 1.51 0.242532CSP: allocation of Private Bankers adequate 2.93 2.60 0.98 94 0.3304 14 82 0.83 1.22 2.15 0.123933CSP: allocation of credit resources adequate 2.31 2.65 -1.14 96 0.2570 16 82 0.87 1.10 1.60 0.3084
Sample size (n) Standard deviationHotelling's T2
0.00000 p>0.05
Mean
2.5
5.26E+08 p<0.0000
-26989 p<0.001
p<0.001
2.4 -7.45E+27 p<0.001
2.1
2.2
2.3 3.48E+10
52
Note: Italicised figures indicate t test results based on heterogeneous group variances
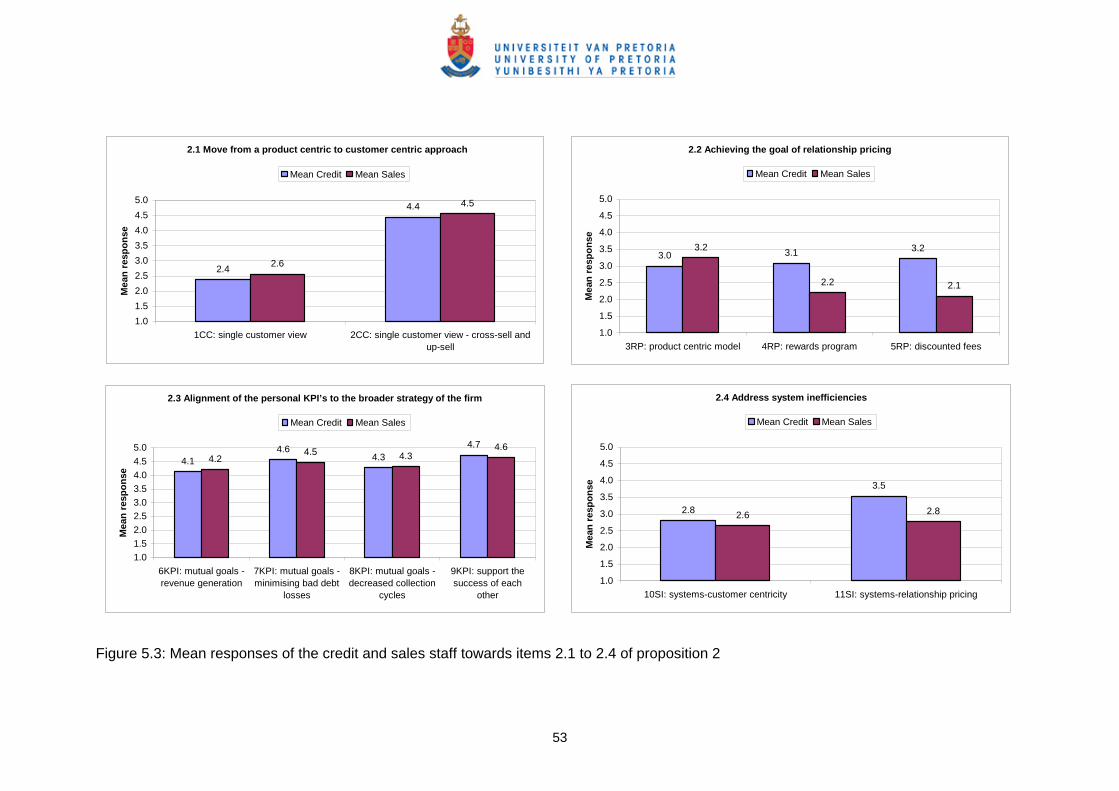
2.1 Move from a product centric to customer centric approach
2.4
4.4
2.6
4.5
1.01.52.02.53.03.54.04.55.0
1CC: single customer view 2CC: single customer view - cross-sell andup-sell
Mea
n re
spon
se
Mean Credit Mean Sales
2.2 Achieving the goal of relationship pricing
3.0 3.1 3.23.2
2.2 2.1
1.0
1.5
2.0
2.5
3.0
3.5
4.0
4.5
5.0
3RP: product centric model 4RP: rewards program 5RP: discounted fees
Mea
n re
spon
se
Mean Credit Mean Sales
2.3 Alignment of the personal KPI’s to the broader strategy of the firm
4.14.6
4.34.7
4.24.5 4.3
4.6
1.01.52.02.53.03.54.04.55.0
6KPI: mutual goals -revenue generation
7KPI: mutual goals -minimising bad debt
losses
8KPI: mutual goals -decreased collection
cycles
9KPI: support thesuccess of each
other
Mea
n re
spon
se
Mean Credit Mean Sales
2.4 Address system inefficiencies
2.8
3.5
2.6 2.8
1.0
1.5
2.0
2.5
3.0
3.5
4.0
4.5
5.0
10SI: systems-customer centricity 11SI: systems-relationship pricingM
ean
resp
onse
Mean Credit Mean Sales
53
Figure 5.3: Mean responses of the credit and sales staff towards items 2.1 to 2.4 of proposition 2
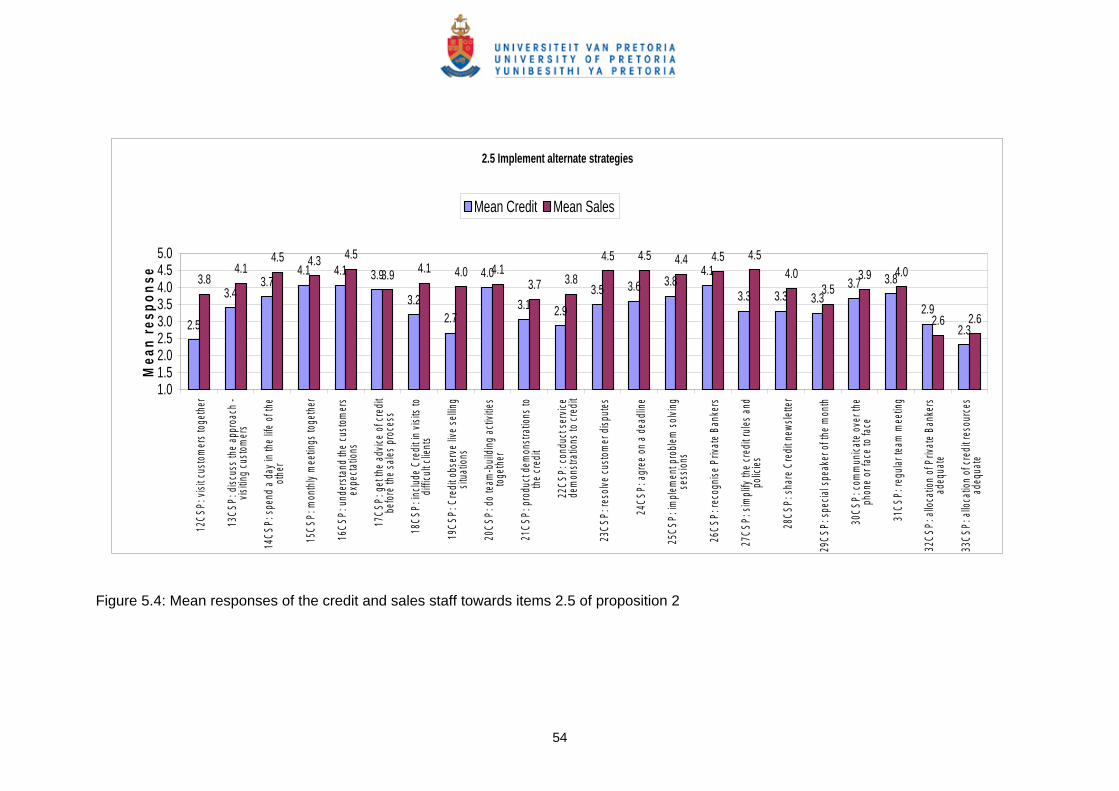
2.5 Implement alternate strategies
2.5
3.43.7
4.1 4.1 3.9
3.22.7
4.0
3.1 2.93.5 3.6 3.8
4.1
3.3 3.3 3.33.7 3.8
2.92.3
3.84.1
4.5 4.3 4.53.9 4.1 4.0 4.1
3.7 3.8
4.5 4.5 4.4 4.5 4.54.0
3.53.9 4.0
2.6 2.6
1.01.52.02.53.03.54.04.55.0
12CS
P: vi
sit cu
stome
rs tog
ether
13CS
P: di
scus
s the
appr
oach
-vis
iting c
ustom
ers
14CS
P: sp
end a
day i
n the
life o
f the
other
15CS
P: m
onthl
y mee
tings
toge
ther
16CS
P: un
derst
and t
he cu
stome
rsex
pecta
tions
17CS
P: ge
t the a
dvice
of cr
edit
befor
e the
sales
proc
ess
18CS
P: in
clude
Cre
dit in
visit
s to
diffic
ult cl
ients
19CS
P: C
redit
obse
rve liv
e sell
ingsit
uatio
ns
20CS
P: do
team
-buil
ding a
ctivit
iestog
ether
21CS
P: pr
oduc
t dem
onstr
ation
s to
the cr
edit
22CS
P: co
nduc
t ser
vice
demo
nstra
tions
to cr
edit
23CS
P: re
solve
custo
mer d
ispute
s
24CS
P: ag
ree o
n a de
adlin
e
25CS
P: im
pleme
nt pr
oblem
solvi
ngse
ssion
s
26CS
P: re
cogn
ise P
rivate
Ban
kers
27CS
P: si
mplify
the c
redit
rules
and
polic
ies
28CS
P: sh
are C
redit
news
letter
29CS
P: sp
ecial
spea
ker o
f the m
onth
30CS
P: co
mmun
icate
over
the
phon
e or f
ace t
o fac
e
31CS
P: re
gular
team
mee
ting
32CS
P: al
locati
on of
Priv
ate B
anke
rsad
equa
te
33CS
P: al
locati
on of
cred
it res
ource
sad
equa
te
Mea
n re
spon
se
Mean Credit Mean Sales
Figure 5.4: Mean responses of the credit and sales staff towards items 2.5 of proposition 2
54
5.3 Proposition 3
For proposition 3 relating to credit the non parametric Mann Whitney U test was
used to compare the attitudes of the 6 officers to the 10 managers. There is no
overall support as the Mann Whitney U test statistics for all the items underlying
the five sub-propositions are not significant except for one item (12CSP) for
which significance shown at the 5% level as seen in Table 5.6.
For proposition 3 relating to sales, the multivariate Hotelling’s T2 test was used
to compare the attitudes of the 14 officers and 67 managers. The results of
Table 5.7 show that none of the multivariate comparisons are significant and
thus the significance of the underlying univariate comparisons is not considered.
55

56
Table 5.6: Results of Mann Whitney U test comparing officers to managers among the credit respondents (n1=6 and n2=10 respectively) Proposition Rank Sum O Rank Sum M U Z p-level Valid N O Valid N M
1CC: single customer view 64.5 71.5 16.5 1.464 0.1431 6 102CC: single customer view - cross-sell and up-sell 51.0 85.0 30.0 0.000 1.0000 6 103RP: product centric model 58.5 77.5 22.5 0.813 0.4159 6 104RP: rewards program 42.5 48.5 20.5 0.071 0.9431 6 75RP: discounted fees 54.0 51.0 15.0 1.162 0.2453 6 86KPI: mutual goals - revenue generation 58.5 77.5 22.5 0.813 0.4159 6 107KPI: mutual goals - minimising bad debt losses 43.5 92.5 22.5 -0.813 0.4159 6 108KPI: mutual goals - decreased collection cycles 43.0 77.0 22.0 -0.589 0.5557 6 99KPI: support the success of each other 45.0 75.0 24.0 -0.354 0.7237 6 910SI: systems-customer centricity 60.5 59.5 14.5 1.473 0.1407 6 911SI: systems-relationship pricing 52.0 68.0 23.0 0.471 0.6374 6 912CSP: visit customers together 65.5 54.5 9.5 2.062 0.0392 6 913CSP: discuss the approach - visiting customers 48.5 71.5 26.5 0.059 0.9530 6 914CSP: spend a day in the life of the other 54.5 65.5 20.5 0.766 0.4437 6 915CSP: monthly meetings together 45.5 59.5 23.5 0.065 0.9485 6 816CSP: understand the customers expectations 41.0 79.0 20.0 -0.825 0.4094 6 917CSP: get the advice of credit before the sales process 48.5 71.5 26.5 0.059 0.9530 6 918CSP: include Credit in visits to difficult clients 55.0 65.0 20.0 0.825 0.4094 6 919CSP: Credit observe live selling situations 50.5 69.5 14.5 1.286 0.1985 5 1020CSP: do team-building activities together 55.0 81.0 26.0 0.434 0.6644 6 1021CSP: product demonstrations to the credit 67.0 69.0 14.0 1.735 0.0827 6 1022CSP: conduct service demonstrations to credit 65.5 70.5 15.5 1.573 0.1158 6 1023CSP: resolve customer disputes 54.5 81.5 26.5 0.380 0.7042 6 1024CSP: agree on a deadline 52.5 67.5 22.5 0.530 0.5959 6 925CSP: implement problem solving sessions 55.0 81.0 26.0 0.434 0.6644 6 1026CSP: recognise Private Bankers 51.5 84.5 29.5 0.054 0.9567 6 1027CSP: simplify the credit rules and policies 73.0 63.0 8.0 2.386 0.0170 6 1028CSP: share Credit newsletter 53.5 82.5 27.5 0.271 0.7863 6 1029CSP: special speaker of the month 50.5 85.5 29.5 -0.054 0.9567 6 1030CSP: communicate over the phone or face to face 56.5 79.5 24.5 0.597 0.5508 6 1031CSP: regular team meeting 52.0 84.0 29.0 0.108 0.9136 6 1032CSP: allocation of Private Bankers adequate 40.0 65.0 19.0 -0.645 0.5186 6 833CSP: allocation of credit resources adequate 56.5 79.5 24.5 0.597 0.5508 6 10
3.5
3.1
3.2
3.3
3.4
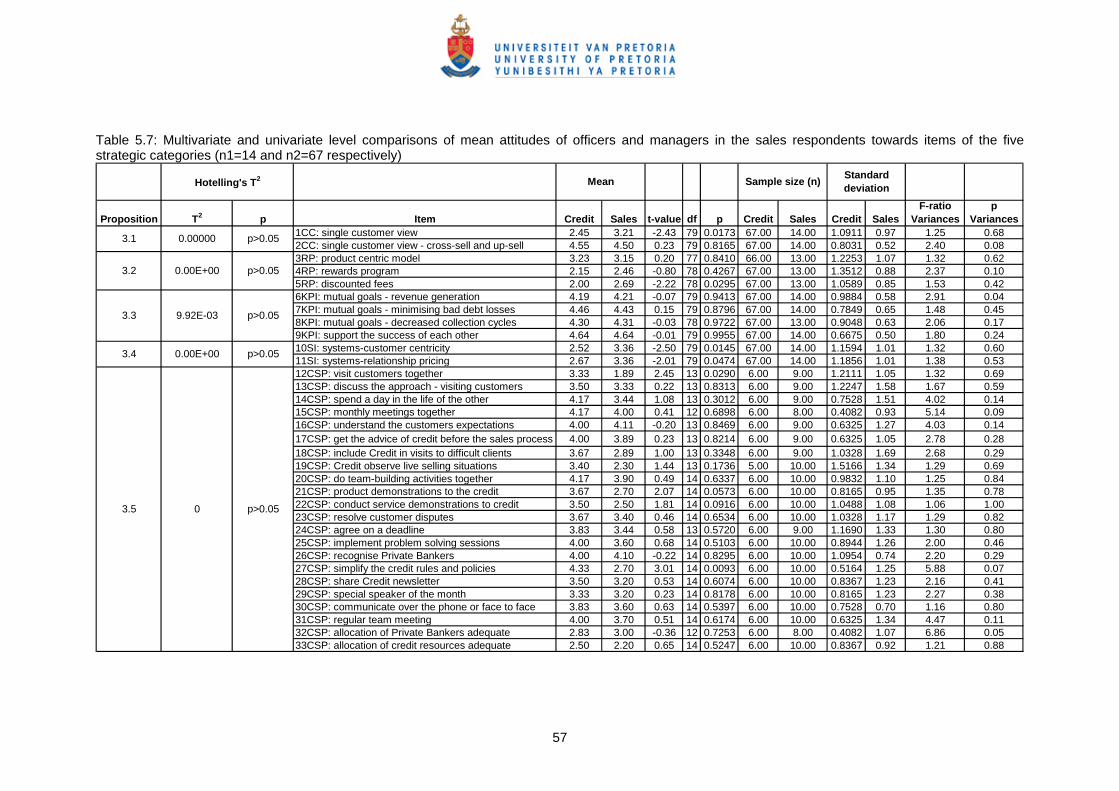
Table 5.7: Multivariate and univariate level comparisons of mean attitudes of officers and managers in the sales respondents towards items of the five strategic categories (n1=14 and n2=67 respectively)
Proposition T2 p Item Credit Sales t-value df p Credit Sales Credit SalesF-ratio
Variancesp
Variances1CC: single customer view 2.45 3.21 -2.43 79 0.0173 67.00 14.00 1.0911 0.97 1.25 0.682CC: single customer view - cross-sell and up-sell 4.55 4.50 0.23 79 0.8165 67.00 14.00 0.8031 0.52 2.40 0.083RP: product centric model 3.23 3.15 0.20 77 0.8410 66.00 13.00 1.2253 1.07 1.32 0.624RP: rewards program 2.15 2.46 -0.80 78 0.4267 67.00 13.00 1.3512 0.88 2.37 0.105RP: discounted fees 2.00 2.69 -2.22 78 0.0295 67.00 13.00 1.0589 0.85 1.53 0.426KPI: mutual goals - revenue generation 4.19 4.21 -0.07 79 0.9413 67.00 14.00 0.9884 0.58 2.91 0.047KPI: mutual goals - minimising bad debt losses 4.46 4.43 0.15 79 0.8796 67.00 14.00 0.7849 0.65 1.48 0.458KPI: mutual goals - decreased collection cycles 4.30 4.31 -0.03 78 0.9722 67.00 13.00 0.9048 0.63 2.06 0.179KPI: support the success of each other 4.64 4.64 -0.01 79 0.9955 67.00 14.00 0.6675 0.50 1.80 0.2410SI: systems-customer centricity 2.52 3.36 -2.50 79 0.0145 67.00 14.00 1.1594 1.01 1.32 0.6011SI: systems-relationship pricing 2.67 3.36 -2.01 79 0.0474 67.00 14.00 1.1856 1.01 1.38 0.5312CSP: visit customers together 3.33 1.89 2.45 13 0.0290 6.00 9.00 1.2111 1.05 1.32 0.6913CSP: discuss the approach - visiting customers 3.50 3.33 0.22 13 0.8313 6.00 9.00 1.2247 1.58 1.67 0.5914CSP: spend a day in the life of the other 4.17 3.44 1.08 13 0.3012 6.00 9.00 0.7528 1.51 4.02 0.1415CSP: monthly meetings together 4.17 4.00 0.41 12 0.6898 6.00 8.00 0.4082 0.93 5.14 0.0916CSP: understand the customers expectations 4.00 4.11 -0.20 13 0.8469 6.00 9.00 0.6325 1.27 4.03 0.1417CSP: get the advice of credit before the sales process 4.00 3.89 0.23 13 0.8214 6.00 9.00 0.6325 1.05 2.78 0.2818CSP: include Credit in visits to difficult clients 3.67 2.89 1.00 13 0.3348 6.00 9.00 1.0328 1.69 2.68 0.2919CSP: Credit observe live selling situations 3.40 2.30 1.44 13 0.1736 5.00 10.00 1.5166 1.34 1.29 0.6920CSP: do team-building activities together 4.17 3.90 0.49 14 0.6337 6.00 10.00 0.9832 1.10 1.25 0.8421CSP: product demonstrations to the credit 3.67 2.70 2.07 14 0.0573 6.00 10.00 0.8165 0.95 1.35 0.7822CSP: conduct service demonstrations to credit 3.50 2.50 1.81 14 0.0916 6.00 10.00 1.0488 1.08 1.06 1.0023CSP: resolve customer disputes 3.67 3.40 0.46 14 0.6534 6.00 10.00 1.0328 1.17 1.29 0.8224CSP: agree on a deadline 3.83 3.44 0.58 13 0.5720 6.00 9.00 1.1690 1.33 1.30 0.8025CSP: implement problem solving sessions 4.00 3.60 0.68 14 0.5103 6.00 10.00 0.8944 1.26 2.00 0.4626CSP: recognise Private Bankers 4.00 4.10 -0.22 14 0.8295 6.00 10.00 1.0954 0.74 2.20 0.2927CSP: simplify the credit rules and policies 4.33 2.70 3.01 14 0.0093 6.00 10.00 0.5164 1.25 5.88 0.0728CSP: share Credit newsletter 3.50 3.20 0.53 14 0.6074 6.00 10.00 0.8367 1.23 2.16 0.4129CSP: special speaker of the month 3.33 3.20 0.23 14 0.8178 6.00 10.00 0.8165 1.23 2.27 0.3830CSP: communicate over the phone or face to face 3.83 3.60 0.63 14 0.5397 6.00 10.00 0.7528 0.70 1.16 0.8031CSP: regular team meeting 4.00 3.70 0.51 14 0.6174 6.00 10.00 0.6325 1.34 4.47 0.1132CSP: allocation of Private Bankers adequate 2.83 3.00 -0.36 12 0.7253 6.00 8.00 0.4082 1.07 6.86 0.0533CSP: allocation of credit resources adequate 2.50 2.20 0.65 14 0.5247 6.00 10.00 0.8367 0.92 1.21 0.88
Mean Sample size (n) Standard deviation
0.00E+00 p>0.05
3.5 0 p>0.05
3.3 9.92E-03 p>0.05
3.4
3.2 0.00E+00 p>0.05
Hotelling's T2
3.1 0.00000 p>0.05
57
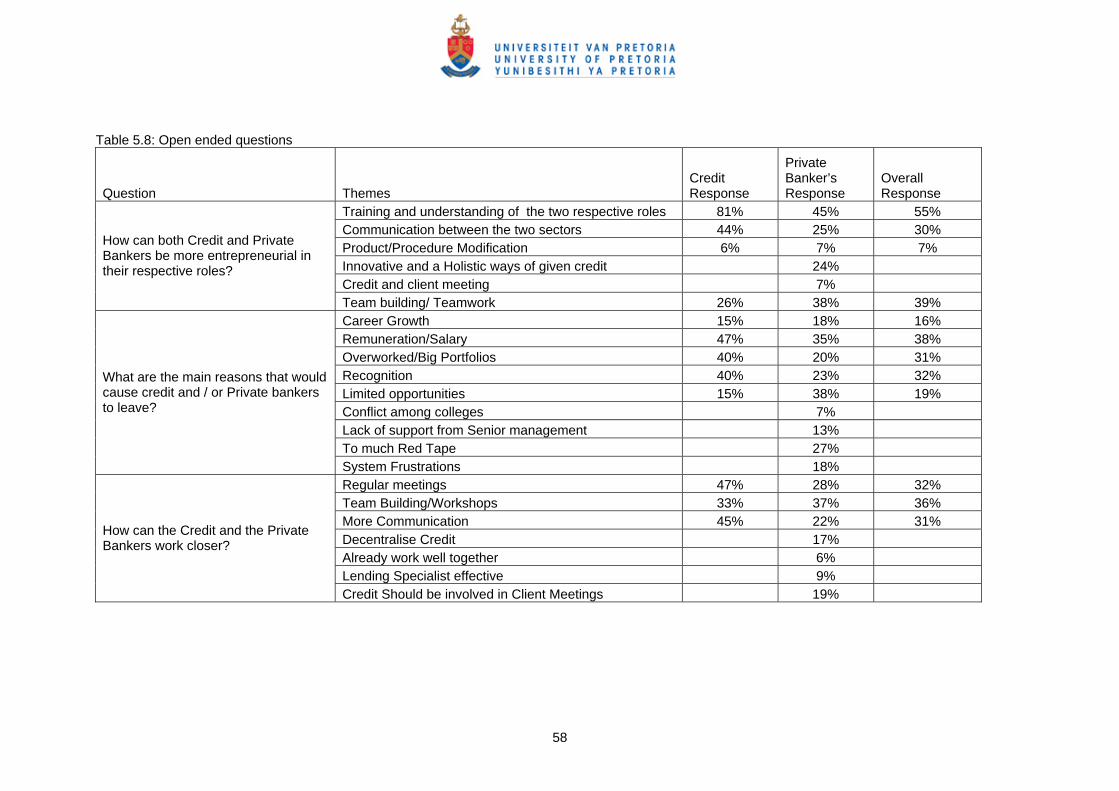
58
Table 5.8: Open ended questions
Question Themes Credit Response
Private Banker’s Response
Overall Response
Training and understanding of the two respective roles 81% 45% 55% Communication between the two sectors 44% 25% 30% Product/Procedure Modification 6% 7% 7% Innovative and a Holistic ways of given credit 24% Credit and client meeting 7%
How can both Credit and Private Bankers be more entrepreneurial in their respective roles?
Team building/ Teamwork 26% 38% 39% Career Growth 15% 18% 16% Remuneration/Salary 47% 35% 38% Overworked/Big Portfolios 40% 20% 31% Recognition 40% 23% 32% Limited opportunities 15% 38% 19% Conflict among colleges 7% Lack of support from Senior management 13% To much Red Tape 27%
What are the main reasons that would cause credit and / or Private bankers to leave?
System Frustrations 18% Regular meetings 47% 28% 32% Team Building/Workshops 33% 37% 36% More Communication 45% 22% 31% Decentralise Credit 17% Already work well together 6% Lending Specialist effective 9%
How can the Credit and the Private Bankers work closer?
Credit Should be involved in Client Meetings 19%
CHAPTER 6: DISCUSSION OF RESULTS
6.1 Move from product centric to customer centric approach
6.1.1 Proposition 1.1
The aim of proposition 1.1 was to explore whether the private bank staff (credit
and sales) would support a move from a product-centric to a customer-centric
approach as a future initiative that will allow sales and credit staff to work more
effectively together. For all the questions that address the future initiatives with
respect to a move from product-centric to customer-centric approach, p < 0.001
which means that the mean was significantly greater than the neutral scale
point of three at the 0.1% level of significance. Based on these significant
results as well as the corresponding means in table 5.3 and the frequencies in
table 5.4, there is a strong agreement amongst the private bank staff on a move
from a product-centric to a customer-centric approach as a future initiative that
will allow sales and credit staff to work more effectively together.
6.1.2 Proposition 2.1
The aim of proposition 2.1 was to explore whether there was alignment between
the views of Credit versus Sales staff on a move from a product-centric to a
customer-centric approach as a future strategy that can be implemented to work
more effectively together. The results of the study support proposition 2.1. On
this proposition, Hotelling's T2 = 0.000, p > 0.05 (Table 5.5). At the multivariate
level, there is no significance difference between the overall views of credit and
59
sales staff towards a move from a product-centric to a customer-centric
approach as a future strategy that can be implemented to improve productivity.
These findings are consistent with the results that support proposition 1.1. This
was expected since it would have been unusual to find that there were
significant differences in the attitudes of sales and credit staff towards a move
from a product-centric to a customer-centric approach as a future strategy, yet
overall as a group representing the private bank, the credit and sales groups
supported the move from product centricity to customer centricity.
6.1.3 Alignment of the results to the theory base
Lager (2007) writes that through the implementation of revised customer-centric
process and technology, the front office and back office staff can work together
in an optimal manner allowing for a customer-centric approach (section 2.1).
Kirby (2007) states that customer-focused strategies as opposed to competitor
focused strategies should be deployed to maintain a competitive edge. The
front office staff in this research was the sales (or private bankers or account
executives) staff and the back office staff were the credit staff. Bodnar (2007, p.
38) asserts that “organisations with a customer centric mantra will own a distinct
market advantage in the coming cycle of a true consumer driven marketplace”.
The implications for the private bank that was researched are of huge
significance since if a strategy that moves from product-centric to customer-
centric is implemented, the private bank will have a distinctive competitive
advantage in the local market.
60

In section 1.1 various highly successful private banks were described. One of
the key findings is that these successful private banks worked together and
leveraged off one another’s skills and client information to achieve the common
goal of customer satisfaction and maximise the bank’s profitability (Ackermann,
2006 and Morais, 2005). The primary goal of a customer-centric strategy is to
achieve customer satisfaction and by doing so maximise the bank’s profitability.
It can thus be deduced that the implementation of customer-centric strategies
will result in customer satisfaction which will positively impact on the bank’s
profitability.
CRM Magazine (2007) links customer satisfaction to retention (section 1.2). The
author elaborates that providing superior customer experiences is the most
powerful way for companies to achieve differentiation. The results indicate that
credit and sales support future initiatives that promote customer centricity, so if
this was implemented at the private bank, the result would be a higher level of
customer satisfaction which would then positively impact on retention.
Craig (2006) writes that customer centricity should not be viewed as a
revolutionary new strategy (section 1.2). It is actually a basic strategy that is
overdue and often overlooked in strategy formulation. Customer centricity is
part of a larger movement whereby companies realise that the “one size fits all”
era is long past and in order to maintain their competitive edge, organisations
have to fundamentally change the way they treat customers. The private bank’s
61
credit and sales staff are supporting a future customer-centric strategy which, if
implemented, will assist the private bank to maintain its competitive edge.
6.2 Goal of relationship pricing 6.2.1 Proposition 1.2
The aim of proposition 1.2 was to explore whether the private bank staff (credit
and sales) as a group, would support achieving the goal of relationship pricing
as a future initiative that will allow sales and credit staff to work more effectively
together. The p value was not tabulated for this category since this category
described the current state. From table 5.4, 48% of the respondents agreed or
strongly agreed that the private bank currently prices on a product-centric model
based on the loan amount and 23% of the respondents were neutral in their
response. In table 5.4, 63% of the respondents disagreed or strongly disagreed
that the private bank had a rewards program that is market related and that
encourages clients to spend on their platinum cards. In table 5.4, 64% of the
respondents disagreed or strongly disagreed that the private bank customers
enjoyed discounted fees based on their contribution to the bank.
Based on the frequencies in table 5.4, there is a disagreement or strong
disagreement amongst the private bank staff on the current status of
relationship pricing.
6.2.2 Proposition 2.2
62
The aim of proposition 2.2 was to explore whether there was alignment between
the views of Credit versus Sales staff on achieving the goal of relationship
pricing as a future strategy that can be implemented so as to work more
effectively together. The results of table 5.5 for proposition 2.2 show there is a
highly significant difference between the overall views of credit and sales
towards relationship pricing at the multivariate level (T2 = 5.26E+8, p<0.001). At
the univariate level, there is a highly significant difference in the views of credit
and sales staff on 4RP (Standard Private Banking has a rewards program that
is market related that encourages clients to spend on their platinum cards) and
5RP (Standard Private Banking customers enjoy discounted fees based on their
contribution (revenue – expenses) to the bank) at the 5% significance level.
The direction of the mean in the case of the significantly different univariate
comparisons is indicative of the direction of the misalignment of the two groups.
The graph in figure 5.3 is used to interpret this direction. The means of the
credit respondents is higher than the corresponding means of the sales
respondents for 4RP and 5RP. The items 4RP and 5RP have a sales slant on
them. One would expect the sales staff to be more knowledgeable about the
rewards programme and the possible discounted fees compared with the credit
staff. The researcher concludes that the sales staff showed lower means
compared with the credit staff because they have a more in-depth
understanding of the status of the rewards programme and the discounted fees
and the level of disagreement was stronger compared with credit. Overall, as a
group, the sales and credit staff disagreed or strongly disagreed with the current
status of relationship pricing. This implies that the goal of relationship pricing
63
may be pursued as a future initiative that will allow sales and credit staff to work
more effectively together.
6.2.3 Alignment of the results to the theory base
Landry (2007) writes that leading banks will make dynamic relationship pricing a
requirement of future core banking solutions (section 2.2). Landry also
recommends that banks elevate relationship pricing as a critical priority in their
future strategic planning. Adams (2007) describes the emergence of
relationship pricing as a central strategy in the banking industry. Morgan (2001)
demonstrates how relationship pricing improves the profitability of the firm. The
results indicate that the goal of relationship pricing may be pursued as a future
initiative. The credit and sales departments of the private banking area play a
pivotal role in the successful implementation of the dynamic relationship pricing
model. Through the credit staff having a single credit view of the customer the
appropriate risk decisions can be taken into consideration when making the
credit decision. The sales area can also better understand the customer’s
needs and structure facilities / products accordingly. As a result the pursuit of
the goal of relationship pricing will allow the private bank’s credit and sales staff
to work more effectively together.
In section 1.1 various highly successful private banks were described. One of
the key findings is that these successful private banks worked together and
leveraged off one another’s skills and client information to achieve the common
goal of customer satisfaction and maximise the bank’s profitability (Ackermann,
64
2006 and Morais, 2005). The goal of a relationship pricing strategy is to achieve
customer satisfaction and by doing so maximise the bank’s profitability. It can
thus be deduced that the implementation of relationship pricing strategies will
result in customer satisfaction which will positively impact on the bank
profitability.
6.3 Alignment of personal KPI’s 6.3.1 Proposition 1.3
The aim of proposition 1.3 was to explore whether the private bank staff (credit
and sales) would support the alignment of the personal KPI’s to the broader
strategy of the firm as a future initiative that will allow sales and credit staff to
work more effectively together. For all the questions that address the future
initiatives with respect to an alignment of personal KPI’s to the broader strategy
of the firm, p < 0.001 which means that the mean was significantly greater than
the neutral scale point of three at the 0.1% level of significance. Based on these
significant results as well as the corresponding means in table 5.3 and the
frequencies in table 5.4, there is a strong agreement amongst the private bank
staff on the alignment of the personal KPI’s to the broader strategy of the firm
as a future initiative that will allow sales and credit staff to work more effectively
together.
6.3.2 Proposition 2.3
65
The aim of proposition 2.3 was to explore whether there was alignment between
the views of Credit versus Sales staff in supporting the alignment of the
personal KPI’s to the broader strategy of the firm as a future strategy that can
be implemented to work more effectively together.
Although there is multivariate significance (T2 = 3.48E+10, p<0.001), none of
the underlying univariate comparisons are significant (p > 0.05) implying that the
univariate comparisons merely contributed to an overall significant difference
(table 5.5). Thus the overall or multivariate differences in the responses cannot
be localised to any of the individual KPI propositions listed. Hence the attitudes
of the sales group compared with the credit group are not significantly different
regarding the alignment of KPI’s as a future initiative. This finding is consistent
with the findings supporting proposition 1.3.
6.3.3 Alignment of the results to the theory base
Walsh (2006, p. 509) writes that the alignment of KPI’s to the corporate strategy
would result in the avoidance of “turf protection” (section 2.3). This means that
the alignment of KPI’s to the corporate strategy would result in the breakdown
of the silo mentality and promote departments working together toward common
goals. Schiff (2007) states that the alignment of KPI’s causes all employees to
focus on what is important to the business as opposed to their own department
and creates company wide strategic alignment. It is of significance that the
private bank staff supports the alignment of KPI’s as a future initiative that will
66

allow them to work more effectively together since the research supports this
finding.
In section 1.1 various highly successful private banks were described. One of
the key findings is that these successful private banks worked together and
leveraged off each other’s skills and client information to achieve the common
goal of customer satisfaction and maximise the bank’s profitability (Ackermann,
2006 and Morais, 2005). The research indicates that the alignment of KPI’s
toward the strategy of the firm promotes staff from different departments to work
together more effectively.
It can thus be deduced that the alignment of KPI’s as a future initiative will allow
credit and sales to work together more effectively, which will result in customer
satisfaction which will positively impact on the bank’s profitability.
6.4 Address system inefficiencies 6.4.1 Proposition 1.4
The aim of proposition 1.4 was to explore whether the private bank staff (credit
and sales) would support the addressing of the system inefficiencies as a future
initiative that will allow sales and credit staff to work more effectively together.
For all the questions that address the future initiatives with respect to
addressing of the system inefficiencies, p < 0.001 which means that the mean
was significantly greater than the neutral scale point of three at the 0.1% level of
67
significance. Based on these significant results as well as the corresponding
means in table 5.3 and the frequencies in table 5.4, there is strong agreement
amongst the private bank staff on the addressing of the system inefficiencies as
a future initiative that will allow sales and credit staff to work more effectively
together.
Proposition 1.4 contained one question about the current state and one about
the future state. Thirty eight percent of the respondents strongly disagreed or
disagreed that the current credit systems used by both credit and sales staff
promote customer centricity, and 24% responded as neutral. Thirty nine percent
of the respondents strongly disagreed or disagreed that the current credit
systems can (in future) be used to achieve the goals of relationship pricing and
26% responded as neutral. Clearly, there is a strong agreement amongst the
private bank staff on the addressing of the system inefficiencies as a future
initiative that will allow sales and credit staff to work more effectively together.
6.4.2 Proposition 2.4
The aim of proposition 2.4 was to explore whether there was alignment between
the views of Credit versus Sales staff in supporting the addressing of the
system inefficiencies as a future strategy that can be implemented so as to work
more effectively together.
The results from table 5.5 indicate that the significant multivariate comparison
(T2=-7.45E+27, p<0.001) is supported by the significant univariate level
68
comparison (p<0.05) of item 11SI (The current credit systems used by both
Private Bankers and Credit can be used effectively to achieve the goals of
relationship pricing).
The direction of the means in the case of the significantly different univariate
comparisons is indicative of the direction of the misalignment of the two groups.
The graph in figure 5.3 is used to interpret this direction. It should be noted that
the mean of the credit respondents is higher than the mean of the sales
respondents. Overall, as a group, there was a strong agreement amongst the
private bank staff on the addressing of the system inefficiencies as a future
initiative that will allow sales and credit staff to work more effectively together.
However the level of agreement was stronger among the credit staff. An action
plan should be implemented to understand why the mean sales staff level of
agreement is lower that the credit staff level of agreement. It is possible that the
credit staff understands how to utilise the current functionality better, to build in
relationship pricing capabilities, or it is possible that the sales staff understand
the system limitations better and that is why the mean level of agreement was
lower when compared with credit staff.
6.4.3 Alignment of the results to the theory base
Sperling (2007) encourages the partnership approach with all the stakeholders
in the value chain for a successful system implementation (section 2.4). At the
private bank, the silo type operation has resulted in system inefficiencies which
are product-focussed as opposed to being customer-focussed. The Credit,
69
Sales and Product areas should work together as partners in order to
implement new systems that are customer-centric or to modify the existing
systems to become more customer-centric.
6.5 Implement alternate strategies 6.5.1 Proposition 1.5
The aim of proposition 1.5 was to explore whether the private bank staff (credit
and sales) would support the implementation of alternate strategies as future
initiatives that will allow sales and credit staff to work more effectively together.
For all the questions that address the future initiatives with respect to the
implementation of alternate strategies, p < 0.001 which means that the mean
was significantly greater than the neutral scale point of three at the 0.1% level of
significance. Based on these significant results as well as the corresponding
means in table 5.3 and the frequencies in table 5.4, there is a strong agreement
amongst the private bank staff on the implementation of alternate strategies as
future initiatives that will allow sales and credit staff to work more effectively
together.
6.5.2 Proposition 2.5
The aim of proposition 2.5 was to explore whether there was alignment between
the views of credit versus sales staff in supporting alternate strategies as future
initiatives that can be implemented for them to work more effectively together.
The results of table 5.5 show that the multivariate comparison is significant
(T2=-26989, p<0.001). Thirteen of the twenty univariate comparisons are
70

significant, three of which are significant at the 0.1% level of significance,
12CSP, 22CSP and 27CSP. A further three comparisons are significant at the
1% level (19CSP, 23CSP, 25CSP). The remaining seven comparisons are
significant at the 5% level (13CSP, 14CSP, 18CSP, 21CSP, 24CSP, 26CSP,
28CSP). It should be noted that six of the univariate t tests were based on
heterogeneous underlying group variances as the F test for the variances of the
credit and sales groups were significant (see right-most column of table 5.5).
The p values for the test of the comparison of variances were examined.
The direction of the means in the case of the significantly different univariate
comparisons is indicative of the direction of the misalignment of the two groups.
The graph in figure 5.4 is used to interpret this. It should be noted that the
means of the sales respondents is consistently higher than the corresponding
means of the credit respondents apart from the last two items which reflect the
current state of affairs.
Although the results support proposition 1.5 (there is a strong agreement
amongst the private bank staff on the implementation of alternate strategies as
future initiatives that will allow sales and credit staff to work more effectively
together) the means of the credit group compared with the means of the sales
group were significantly different on 13 items. Each item is discussed in the
following paragraphs.
12CSP: Private Bankers and Credit personnel should visit customers together
71
From figure 5.4, the mean response of credit was 2.5 while the mean response
of sales was 3.8. Although as a group, both credit and sales departments are
supportive of this strategy, credit is not as strongly agreeable as sales to
accompanying sales staff on customer visits. An action plan should be
implemented to investigate in which instances it would be beneficial for credit
staff to be included in client visits. Logically, it would not be practical to include
credit in all client visits since the credit staff would not have time to then spend
on their credit evaluation activities.
13CSP: Private Bankers and Credit personnel should meet first to discuss the
approach before visiting customers together
From figure 5.4, the mean response of credit was 3.4 while the mean response
of sales was 4.1. Although as a group, both credit and sales departments are
supportive of this strategy, credit is not as strongly agreeable as sales to
meeting with the sales staff to discuss the approach before visiting customers
together. This result is consistent with the result above indicating that credit staff
were not as strongly agreeable as sales staff regarding visiting customers
together. It is evident that the sales staff believe that there is value in meeting
with the credit staff and discussing the deal and the client before visiting the
client together. An action plan should be implemented to investigate in which
instances it would be beneficial for credit to be included in client visits and the
preparatory meeting between sales and credit would be scheduled accordingly.
14CSP: Credit and Private Bankers should spend a day in the life of the other
72
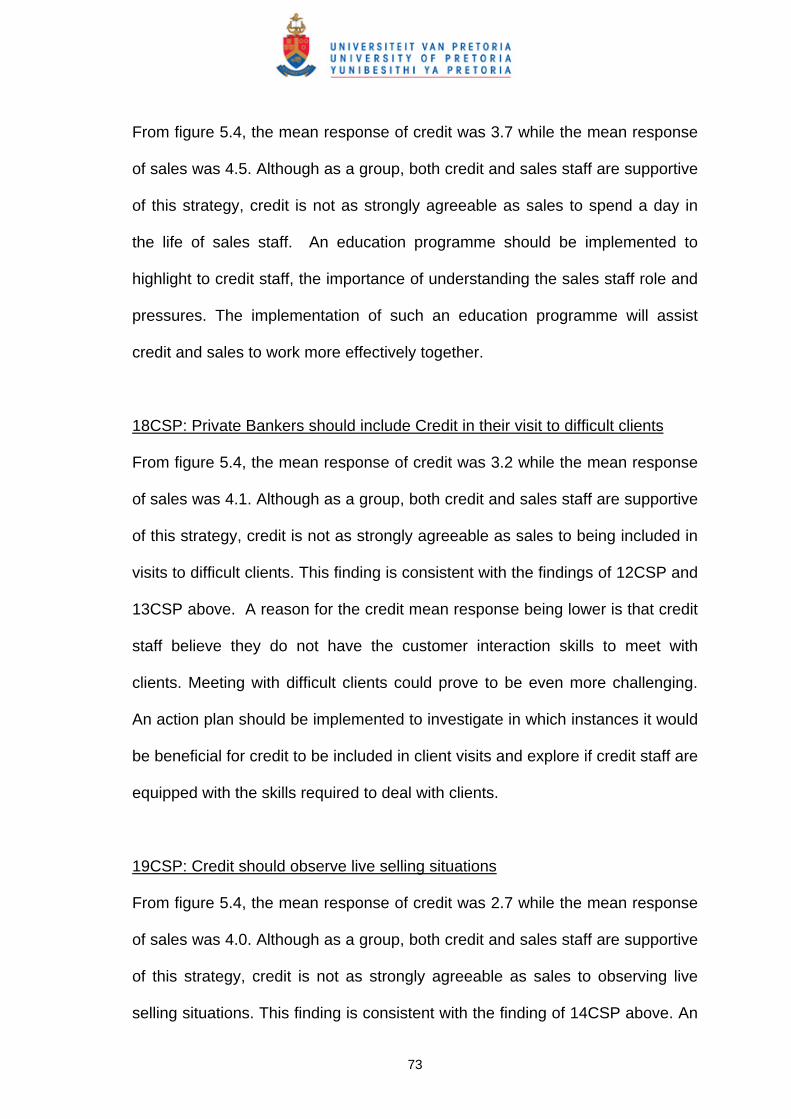
From figure 5.4, the mean response of credit was 3.7 while the mean response
of sales was 4.5. Although as a group, both credit and sales staff are supportive
of this strategy, credit is not as strongly agreeable as sales to spend a day in
the life of sales staff. An education programme should be implemented to
highlight to credit staff, the importance of understanding the sales staff role and
pressures. The implementation of such an education programme will assist
credit and sales to work more effectively together.
18CSP: Private Bankers should include Credit in their visit to difficult clients
From figure 5.4, the mean response of credit was 3.2 while the mean response
of sales was 4.1. Although as a group, both credit and sales staff are supportive
of this strategy, credit is not as strongly agreeable as sales to being included in
visits to difficult clients. This finding is consistent with the findings of 12CSP and
13CSP above. A reason for the credit mean response being lower is that credit
staff believe they do not have the customer interaction skills to meet with
clients. Meeting with difficult clients could prove to be even more challenging.
An action plan should be implemented to investigate in which instances it would
be beneficial for credit to be included in client visits and explore if credit staff are
equipped with the skills required to deal with clients.
19CSP: Credit should observe live selling situations
From figure 5.4, the mean response of credit was 2.7 while the mean response
of sales was 4.0. Although as a group, both credit and sales staff are supportive
of this strategy, credit is not as strongly agreeable as sales to observing live
selling situations. This finding is consistent with the finding of 14CSP above. An
73
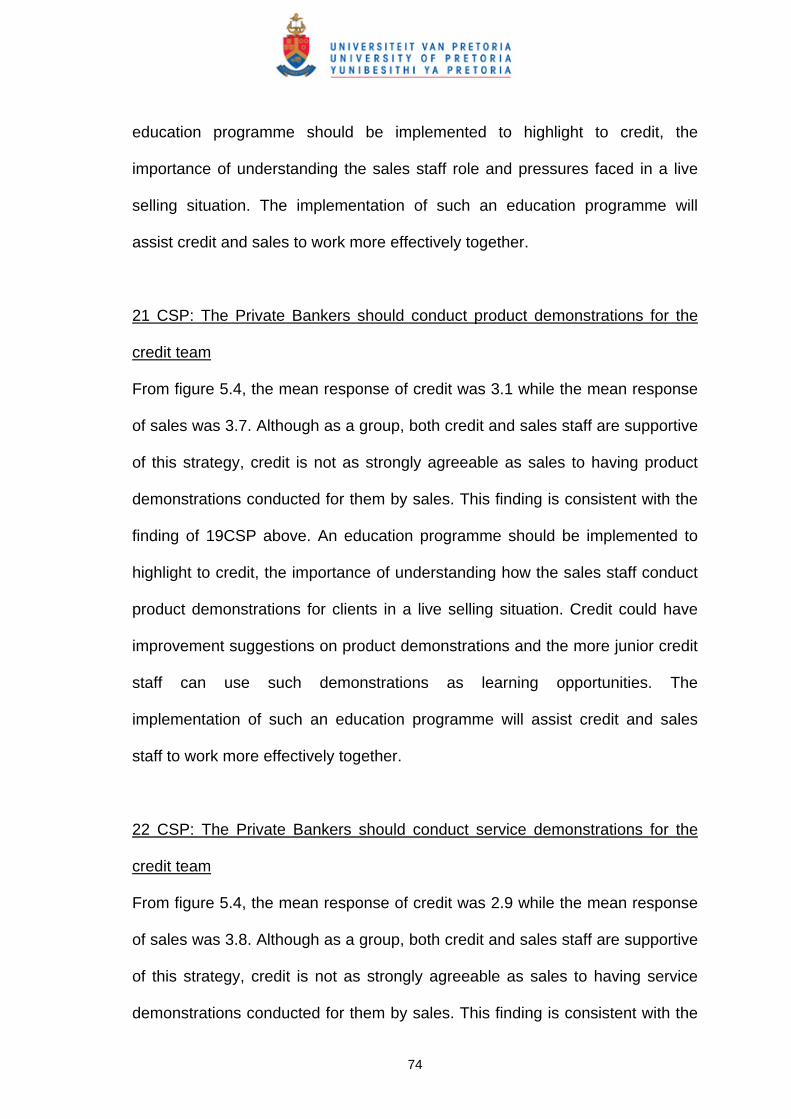
education programme should be implemented to highlight to credit, the
importance of understanding the sales staff role and pressures faced in a live
selling situation. The implementation of such an education programme will
assist credit and sales to work more effectively together.
21 CSP: The Private Bankers should conduct product demonstrations for the
credit team
From figure 5.4, the mean response of credit was 3.1 while the mean response
of sales was 3.7. Although as a group, both credit and sales staff are supportive
of this strategy, credit is not as strongly agreeable as sales to having product
demonstrations conducted for them by sales. This finding is consistent with the
finding of 19CSP above. An education programme should be implemented to
highlight to credit, the importance of understanding how the sales staff conduct
product demonstrations for clients in a live selling situation. Credit could have
improvement suggestions on product demonstrations and the more junior credit
staff can use such demonstrations as learning opportunities. The
implementation of such an education programme will assist credit and sales
staff to work more effectively together.
22 CSP: The Private Bankers should conduct service demonstrations for the
credit team
From figure 5.4, the mean response of credit was 2.9 while the mean response
of sales was 3.8. Although as a group, both credit and sales staff are supportive
of this strategy, credit is not as strongly agreeable as sales to having service
demonstrations conducted for them by sales. This finding is consistent with the
74
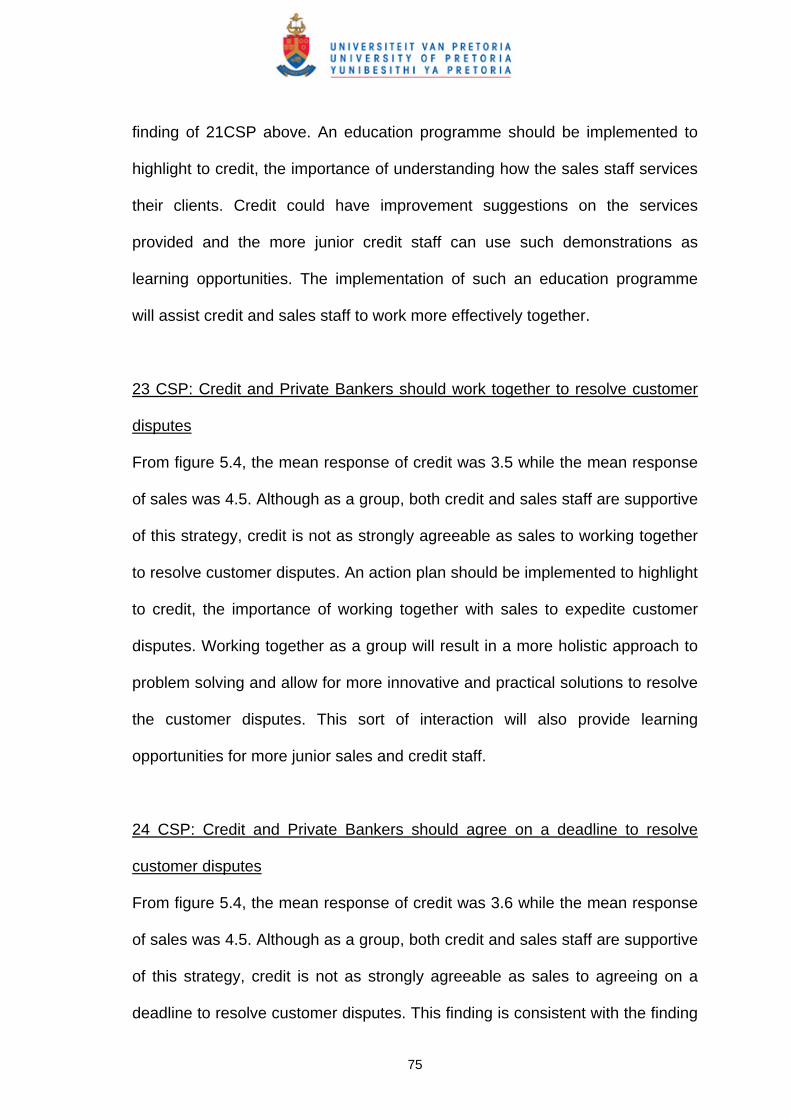
finding of 21CSP above. An education programme should be implemented to
highlight to credit, the importance of understanding how the sales staff services
their clients. Credit could have improvement suggestions on the services
provided and the more junior credit staff can use such demonstrations as
learning opportunities. The implementation of such an education programme
will assist credit and sales staff to work more effectively together.
23 CSP: Credit and Private Bankers should work together to resolve customer
disputes
From figure 5.4, the mean response of credit was 3.5 while the mean response
of sales was 4.5. Although as a group, both credit and sales staff are supportive
of this strategy, credit is not as strongly agreeable as sales to working together
to resolve customer disputes. An action plan should be implemented to highlight
to credit, the importance of working together with sales to expedite customer
disputes. Working together as a group will result in a more holistic approach to
problem solving and allow for more innovative and practical solutions to resolve
the customer disputes. This sort of interaction will also provide learning
opportunities for more junior sales and credit staff.
24 CSP: Credit and Private Bankers should agree on a deadline to resolve
customer disputes
From figure 5.4, the mean response of credit was 3.6 while the mean response
of sales was 4.5. Although as a group, both credit and sales staff are supportive
of this strategy, credit is not as strongly agreeable as sales to agreeing on a
deadline to resolve customer disputes. This finding is consistent with the finding
75

of 23 CSP above. An action plan should be implemented to highlight to credit,
the importance of working together with sales to expedite customer disputes.
Working together as a group and agreeing on a deadline will result in a more
focused approach to problem solving and allow for more innovative and
practical solutions to resolve the customer disputes. This sort of interaction will
also provide learning opportunities for more junior sales and credit staff.
Agreeing on a deadline will also facilitate the prioritising of work for both credit
and sales departments.
25 CSP: Credit and Private Bankers should implement problem solving
sessions to mutually review issues were the relevant rules and procedures were
not followed
From figure 5.4, the mean response of credit was 3.8 while the mean response
of sales was 4.4. Although as a group, both credit and sales staff are supportive
of this strategy, credit is not as strongly agreeable as sales to implementing
problem solving sessions to mutually review issues where the relevant rules
and procedures were not followed. This finding is consistent with the finding of
24 CSP above. An action plan should be implemented to encourage this kind of
interaction since it would also provide learning opportunities for more junior
sales and credit staff.
26 CSP: Credit should recognise Private Bankers for consistently doing things
correctly the first time
From figure 5.4, the mean response of credit was 4.1 while the mean response
of sales was 4.5. Although as a group, both credit and sales staff are supportive
76

of this strategy, credit is not as strongly agreeable as sales to recognising sales
staff for consistently doing things correctly the first time. An action plan should
be implemented to encourage this kind of recognition since it would improve the
motivation of the sales staff and improve the working relationship between
credit and sales staff.
27 CSP: Credit should simplify the credit rules and policies and communicate
these in a simplified and compact format to the Private Bankers
From figure 5.4, the mean response of credit was 3.3 while the mean response
of sales was 4.5. Although as a group, both credit and sales are supportive of
this strategy, credit is not as strongly agreeable as sales to simplifying the credit
rules and policies and communicating these in a simplified and compact format
to the Private Bankers. An action plan should be implemented to encourage this
process since it would improve the understanding amongst sales of the credit
requirements. This should result in the quality of applications improving with
quicker decisions from credit and less rework for sales staff.
28 CSP: Credit should share its newsletter with sales and feature a Private
Banker in each issue
From figure 5.4, the mean response of credit was 3.3 while the mean response
of sales was 4.0. Although as a group, both credit and sales staff are supportive
of this strategy, credit is not as strongly agreeable as sales to sharing its
newsletter with sales and featuring a Private Banker in each issue. This finding
is consistent with the finding of 26CSP. An action plan should be implemented
77

to encourage this kind of recognition since it would improve the motivation of
the sales staff and improve the working relationship between credit and sales.
6.5.3 Alignment of the results to the theory base
Tyburski (2005) recommends some practical steps to optimise the sales–credit
partnership (section 1.1). Sumar (2006) describes the tactics to form an
effective credit and sales partnership (section 2.5). Diana (2007) advocates that
credit managers have a key role to play in the overall financial success of a
company. The research described many alternate strategies that could be
implemented to enable credit and sales to work together more effectively.
These alternate strategies were included in the questionnaire and the results
indicated that there is a strong agreement amongst the private bank staff on the
implementation of alternate strategies as future initiatives that will allow sales
and credit staff to work more effectively together.
6.3 Job Levels
For proposition 3 relating to credit the non parametric Mann Whitney U test was
used to compare the attitudes of the 6 officers to the 10 managers. There is no
overall support as the Mann Whitney U test statistics for all the items underlying
the five sub-propositions are not significant except for one item (12CSP) for
which significance is shown at the 5% level as seen in Table 5.6.
78
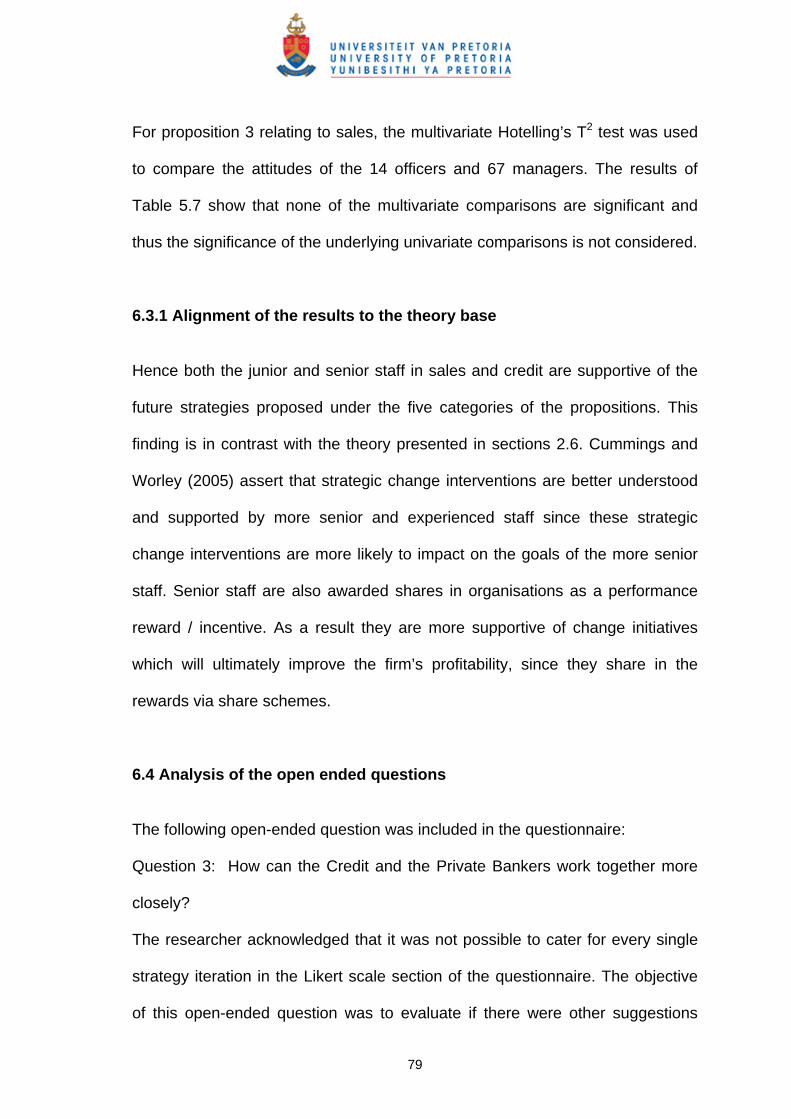
For proposition 3 relating to sales, the multivariate Hotelling’s T2 test was used
to compare the attitudes of the 14 officers and 67 managers. The results of
Table 5.7 show that none of the multivariate comparisons are significant and
thus the significance of the underlying univariate comparisons is not considered.
6.3.1 Alignment of the results to the theory base
Hence both the junior and senior staff in sales and credit are supportive of the
future strategies proposed under the five categories of the propositions. This
finding is in contrast with the theory presented in sections 2.6. Cummings and
Worley (2005) assert that strategic change interventions are better understood
and supported by more senior and experienced staff since these strategic
change interventions are more likely to impact on the goals of the more senior
staff. Senior staff are also awarded shares in organisations as a performance
reward / incentive. As a result they are more supportive of change initiatives
which will ultimately improve the firm’s profitability, since they share in the
rewards via share schemes.
6.4 Analysis of the open ended questions
The following open-ended question was included in the questionnaire:
Question 3: How can the Credit and the Private Bankers work together more
closely?
The researcher acknowledged that it was not possible to cater for every single
strategy iteration in the Likert scale section of the questionnaire. The objective
of this open-ended question was to evaluate if there were other suggestions
79

from the staff (credit and sales staff) on the subject of optimisation of the
alignment between sales and credit that were not covered in the Likert scale
section questionnaire.
The results of the open-ended questions were summarised into themes and
these themes were discussed, based on the consistency compared with the
Likert scale section of the results.
Theme 1: Regular meetings
Both credit and sales staff supported the implementation of regular meetings
between the departments in order to improve communication and work together
more effectively. Both departments responded that they would be able to gain a
better understanding of each other’s roles and responsibilities from regular
meetings.
This finding is consistent with 15CSP: Credit and Private Bankers should have
monthly meetings together and 31 CSP: Credit and Private Bankers should
conduct regular team meetings together with senior management and the
executive team (table 5.4). Eighty nine percent of the respondents (both credit
and sales) agreed or strongly agreed with 15CSP and 75% of the respondents
agreed or strongly agreed with 31CSP.
Theme 2: Decentralise Credit
Sales staff suggested that the credit department implement a decentralised
model since they believe that this model would enable business to work more
80
efficiently if credit staff are allocated to various Private Banking suites. By
having sales and credit co-located, the credit staff will be more easily accessible
to discuss deals with the sales staff. This improved interaction could result in a
better understanding of the clients’ requirements amongst both credit and sales
staff and this could result in a more customised or personalised service delivery
to the client.
This strategy was not part of the Likert scale questions. This is a valuable
suggestion that could be explored in the future and demonstrates the value of
the open-ended questions in picking up on other useful suggestions that were
not included in the Likert scale questionnaire.
Theme 3: Team Building/Workshops
Both credit and sales staff believe that having team building sessions and
workshops together would improve communication and bring the teams closer.
This finding is consistent with 20CSP: Credit and Private Bankers should do
team-building activities together; 21CSP: The Private Bankers should conduct
product demonstrations for the credit team; and 22CSP: The Private Bankers
should conduct service demonstrations for the credit staff (table 5.4). Seventy
two percent of the respondents (both credit and sales) agreed or strongly
agreed with 20CSP, 53% of the respondents agreed or strongly agreed with
21CSP, and 58% of the respondents agreed or strongly agreed with 22CSP.
Theme 4: Communication
81
Credit staff believed that the communication between credit and sales could be
improved, in terms of understanding the client’s needs holistically, hence
facilitating a more informed credit decision. Sales staff felt that credit should try
to structure a deal so it may be acceptable, rather than to just decline the deal.
Structuring of the deal would involve sales and credit working together to
develop a win-win solution for the client and the bank.
This finding is consistent with 30CSP: Credit and Private Bankers should
endeavour to communicate with each other over the phone or face to face
rather than sending e-mails (table 5.4). Sixty seven percent of the respondents
(both credit and sales) agreed or strongly agreed with 30CSP.
Theme 5: Already work well together
This was one of the positive themes that were highlighted. Some Private
Bankers believed that they already work well with credit staff and feel that no
changes are necessary.
82
CHAPTER 7: CONCLUSION
7.1 Move from product centric to customer centric approach
There was a strong agreement amongst the private bank staff (both sales and
credit respondents) on a move from a product-centric to a customer-centric
approach as a future initiative that will allow sales and credit staff to work more
effectively together. There was alignment between the views of Credit
compared to Sales staff on a move from a product-centric to a customer-centric
approach as a future strategy that can be implemented in order to work more
effectively together. This was expected since it would have been unusual to find
that there were significant differences in the attitudes of sales and credit staff
towards a move from product-centric to customer-centric as a future strategy;
yet overall as a group representing the private bank, the respondents were
supporting the move from product-centricity to customer-centricity.
The implications for the private bank that was researched are of huge
significance since if a strategy that moves from product-centric to customer-
centric is implemented, the private bank will have a distinctive competitive
advantage in the local market.
The primary goal of a customer-centric strategy is to achieve customer
satisfaction and by doing so maximise the bank’s profitability and positively
impact on retention. The implementation of customer-centric strategies in the
private bank department studied will result in customer satisfaction which will
positively impact on the bank’s profitability and assist in maintaining their
83
competitive edge. This would also result in sales and credit staff working
together more effectively, hence this strategy is recommended as a future
strategy that the private bank should consider implementing.
7.2 Goal of relationship pricing
The perception of the respondents is that the private bank currently prices on a
product-centric model based on the loan amount and not based on the
individual contribution of the customer. The perception of the respondents is
that the private bank does not have a rewards program that is market-related
and encourages clients to spend on their platinum cards.
The credit and sales departments of the private banking area will play a pivotal
role in the successful implementation of the dynamic relationship pricing model.
Through credit having a single credit view of the customer the appropriate risk
decisions can be taken into consideration when making the credit decision. The
sales area can also better understand the customer’s needs and structure
facilities / products accordingly. As a result the pursuit of the goal of relationship
pricing will allow the private bank’s credit and sales staff to work more
effectively together.
The implementation of relationship pricing strategies will result in customer
satisfaction which will positively impact on the bank’s profitability and allow
credit and sales staff to work more effectively together, hence this is highly
recommended as a future strategy for the private bank that was studied.
84

7.3 Alignment of personal KPI’s
There was a strong agreement amongst the private bank staff on the alignment
of the personal KPI’s to the broader strategy of the firm as a future initiative that
will allow sales and credit staff to work more effectively together. The attitudes
of the sales group compared to the credit group were not significantly different
regarding the alignment of KPI’s as a future initiative.
The theory indicated that the alignment of KPI’s toward the strategy of the firm
promotes staff from different departments working together more effectively.
Hence it is of significance that the results indicated that the private bank staff
supported the alignment of KPI’s as a future initiative that will allow them to
work more effectively together.
The alignment of the personal KPI’s towards the strategy of the firm is
recommended as a future initiative that will allow credit and sales working
together more effectively and this will result in customer satisfaction, which will
positively impact on the bank’s profitability.
7.4 Address system inefficiencies There was a strong agreement amongst the private bank staff on the
addressing of the system inefficiencies as a future initiative that will allow sales
and credit staff to work more effectively together. However the level of
85
agreement was stronger among the credit staff. An action plan should be
implemented to understand why the mean sales staff level of agreement is
lower that the credit staff level of agreement. It is possible that the credit staff
understands how to utilise the current functionality better, to build in relationship
pricing capabilities, or it is possible that the sales staff understand the system
limitations better and that is why the mean level of agreement was lower than
that of credit.
It is recommended that the credit, sales and product areas should work together
as partners in order to implement new systems that are customer-centric or to
modify the existing systems to become more customer-centric. A customer-
centric system will allow credit and sales staff to work together more effectively
since they both will be able to easily obtain a single view of the customer.
7.5 Implement alternate strategies The private bank credit and sales staff supported the implementation of
alternate strategies as future initiatives that will allow sales and credit staff to
work more effectively together, however the means of the credit compared to
the means of the sales groups were significantly different on13 items.
On item 12CSP: Private Bankers and Credit personnel should visit customers
together; it is recommended that an action plan should be implemented to
investigate in which instances it would be beneficial for credit to be included in
client visits.
86
On item 13CSP: Private Bankers and Credit personnel should meet first to
discuss the approach before visiting customers together; it is recommended that
an action plan should be implemented to investigate in which instances it would
be beneficial for credit staff to be included in client visits and the preparatory
meeting between sales and credit would be scheduled accordingly.
On item 14CSP: Credit and Private Bankers should spend a day in the life of
the other; it is recommended that an education programme should be
implemented to highlight to credit staff, the importance of understanding the
sales staff role and pressures.
On item 18CSP: Private Bankers should include credit staff in their visit to
difficult clients; it is recommended that an action plan should be implemented to
investigate in which instances it would be beneficial for credit to be included in
client visits and explore whether credit staff are equipped with the skills required
to deal with clients.
On item 19CSP: Credit should observe live selling situations; it is recommended
that an education programme should be implemented to highlight to credit, the
importance of understanding the sales staff role and pressures faced in a live
selling situation.
On item 21 CSP: The Private Bankers should conduct product demonstrations
for the credit team; it is recommended that an education programme should be
implemented to highlight to credit staff, the importance of understanding how
87
the sales staff conduct product demonstrations for clients in a live selling
situation.
On item 22 CSP: The Private Bankers should conduct service demonstrations
to the credit team; it is recommended that an education programme should be
implemented to highlight to credit staff, the importance of understanding how
the sales staff services their clients.
On item 23 CSP: Credit and Private Bankers should work together to resolve
customer disputes; it is recommended that an action plan should be
implemented to highlight to credit staff, the importance of working together with
sales staff to expedite customer disputes.
On item 24 CSP: Credit and Private Bankers should agree on a deadline to
resolve customer disputes; it is recommended that an action plan should be
implemented to highlight to credit, the importance of working together with sales
to expedite customer disputes.
On item 25 CSP: Credit staff and Private Bankers should implement problem
solving sessions to mutually review issues where the relevant rules and
procedures were not followed; it is recommended that an action plan should be
implemented to encourage this kind of interaction since it would also provide
learning opportunities for more junior sales and credit staff.
88

On item 26 CSP: Credit staff should recognise Private Bankers for consistently
doing things correctly the first time; it is recommended that an action plan
should be implemented to encourage this kind of recognition since it would
improve the motivation of the sales staff and improve the working relationship
between credit and sales.
On item 27 CSP: Credit staff should simplify the credit rules and policies and
communicate these in a simplified and compact format to the Private Bankers; it
is recommended that an action plan should be implemented to encourage this
process since it would improve the understanding amongst sales staff of credit
staff requirements.
On item 28 CSP: The credit department should share its newsletter with sales
and feature a Private Banker in each issue; it is recommended that an action
plan should be implemented to encourage this kind of recognition since it would
improve the motivation of the sales staff and improve the working relationship
between credit and sales.
7.6 Job Levels
Both the junior and senior staff in sales and credit are supportive of the future
strategies proposed under the five categories of the propositions. This finding is
in contrast with the theory. This finding is of significance to the private bank
since it indicates that the junior staff may be subjected to the same strategies
and action plans as the senior staff. This cuts down significantly on the amount
of work that needs to be done on future change interventions.
89
7.7 Analysis of the open-ended questions
The themes found in the open-ended questions were presented in table 5.8.
The open-ended question: “How can the Credit and the Private Bankers work
more closely?” provided some valuable insights into opinions and suggestions
on strategies not catered for in the Likert scale section of the questionnaire.
Three themes were identified: regular meetings, teambuilding/workshops, and
communication were consistent when compared to the Likert scale section of
the results. The theme “Decentralise Credit” was not part of the Likert scale
questions. It is recommended that this suggestion is explored in the future.
The theme: “Already work well together” was also identified and is indicative of
the partnership between credit and sales departments being relatively good.
There is a good foundation to work from going forward to implement the future
strategies.
90
8. REFERENCES
Achieving exceptional customer experience in retail, telecom, higher ed and
government (2007). CRM Magazine, 11(8), 3-6.
Ackermann, M. (2006) PNC Private Bank says culture lifts revenue. American
Banker, 171(107). 4-4.
Adams, J. (2007) How Much to Charge. U.S. Banker, 117(9). 24-24.
Athanassopoulos, A. (2000) Customer satisfaction cues to support market-
segmentation and explain switching behaviour. Journal of Business Research,
47(3), 191-207.
Bailor, G. (2007) Buying into the Customer Experience. CRM Magazine, 11(6).
15-15.
Bauer, K. (2004) Key Performance Indicators: The Multiple Dimensions. DM
Review, 14(10). 62-63.
Behavioural Difficulties. (2007) Chain Store Age, 83(8) 16-17.
Bodnar, B. (2007) Customer centric strategies. Marketing Health Services,
27(2), 38-39.
Botha, J. (2007) Property dips sharply to single digits. Johannesburg: Summary
at http://intranet.sbic.co.za/BankMatters/news/mr2007/03Sep07.html (accessed
5/09/07)
91
Cleveland, G. (2001) Expanding Outside the Footprint and Pricing for
Relationships. Small Business Banker. 2(10). 19-19.
Collis, D. and Montgomery, C. (2005) Corporate Strategy A Resource-Based
Approach. New York: McGraw-Hill.
Costanzo, C. (2007) Relationship Pricing Moves from Nicety to Neccessity.
American Banker. 172(122). 10-16.
Craig, T. (2006) Centricity is not revolutionary; it’s overdue. Retailing Today.
45(17), 9-9.
Credit Strategy and Corporate Performance. (2004) Credit Management.35-35.
Cummings , T. and Worley, C. (2005) Organizational Development & Change.
United States of America: Thomson.
Customer Centricity Requires Account-Level Analysis. (2006) Teller Vision.
2006(1348). 3-3.
Goldman, N. (2004) Be aware of some of the pitfalls of relationship pricing.
Credit Union Journal. 8(32), 6-6.
D’Ambrosio, M. (2000) Harris bank taps wealthy customers using life cycle
sales method. Bank Investment Consultant. 8(3). 20-20.
92
Dawson, J. (2005) The S.E.C.R.E.T. To Successful Team Dynamics. Business
Credit. 107(4). 24-25.
De Kock, D. (2006) Understanding how we should grow our customer base.
REAC: Johannesburg: Available from the Strategy area of Standard Retail
Bank.
Diana, T. (2007) Credit Managers – Major or Minor Players in Overall Corporate
Strategy. Business Credit. 109(6). 16-18.
Edelstein, S. (2007) Customer Centricity – Merchant Processing and Customer
Care. Response. 15(11). 51-51.
Fleming, J. (2005) Manage your Human Sigma. Harvard Business Review.
83(7). 106-114.
Gaskell, C. (2007) …career coach. Personnel Today. 30-30.
Glen, P. (2006) Manager’s Forum. Computerworld. 40(31). 34-34.
Hammer, M. (2007) The Seven Deadly Sins of Performance Measurement. MIT
Sloan Management Review. 48(3). 19-28.
93
Huysamen, G. (2001) Methodology for Social and Behaviour Science. Southern
Africa: Oxford University Press.
Kirby, J. (2007) The Institutional YES. Havard Business Review. 85(10). 74-82.
Lager, M. (2007) Laws of Alignment. CRM Magazine. 11(7), 48-49.
Landry, S. (2005) Dynamic relationship pricing to be banking’s next CRM
strategy. Financial Services Research Report. 1-8.
Landry, S. (2005) Plan a path to Relationship-Driven Pricing and Loyalty.
Financial Services Question and Answer. 1-3.
Lind, D. Mason, R. and Marchal, W. (2000) Basic Statistics. Singapore: McGraw
Hill.
Mametse, D. (2007) National Credit Act adversely affects car sales.
Johannesburg: Summary at
http://www.moneyweb.co.za/mw/view/en/page62093?oid=143073&sn=Detail
(accessed 5/09/07)
Mittereder, D. (2005) Pervasive Business Intelligence. DM Review. 15(4). 10-
28.
Morais, R. (2005) The Thunder of Grubel. Forbes. 176(13), 88-94.
94
Morgan, C. (2001) Building Relationship Pricing. Credit Union Magazine. 67(5).
26-26.
Nelson, C. (2007) Enterprise Cross-Sell Offers New Twist on Old Theme.
Mortgage Banking. 67(9). 121-123.
Pickworth, E (2007) Credit act smacks banks. Johannesburg: Summary at
http://www.fin24.co.za/articles/default/display_article.aspx?ArticleId=1518-
25_2141947 (accessed 5/09/07)
Rapid business growth & innovative financial services (2007). Institutional
Investor. 41(7), 1-2.
Ryals, L. (2007) Measuring and managing customer relationship risk in
business markets. Industrial Marketing Management. 36(6), 823-833.
Sandin, E. (2007) Bankers must think sales when seeking new business. North
Western Financial Review. 192(14), 9-9.
Satisfying the client. (2006) Finweek. 10-12.
Schiff, C. (2007) Bridging Business Strategy and Enabling Technology. DM
Review. 17(3). 8-8.
Sorondo, M. (2006) Top Private Banking Team JPMorgan Private Bank. U.S.
Banker. 116(1), 37-37.
95

Sperling, E. (2007) Reshaping the business of technology. EDN. 52, 24-24.
Stock, H. (2007) New client pricing to increase loyalty. Bank Investment
Consultant. 15(7), 9-10.
Sumar, E. (2006) Tactics to Help Credit and Sales Function as a Single Team.
Managing Credit, Receivables & Collections. 2006(10). 1-15.
Tyburski, D. (2005) Practical Strategies. Managing Credit Receivables and
Collections. 5(8), 4-6.
Wagner, C. (2006) Enabling Customer-Centricity Using Wikis and the Wiki Way.
Journal of Management Information Systems. 23(3). 17-43.
Walsh, P. (2006) Finding key performance drivers: some new tools. Total
Quality Management. 7(5), 509-519.
Wingate-Pearse, G. (2007) Buying properties to get slower. Johannesburg:
Summary at http://www.moneyweb.co.za/mw/en/page38?oid=69209&sn=Detail
(accessed 5/09/07)
Zikmund, W. (2003) Business Research Methods. United States of
America:Thomson.
96
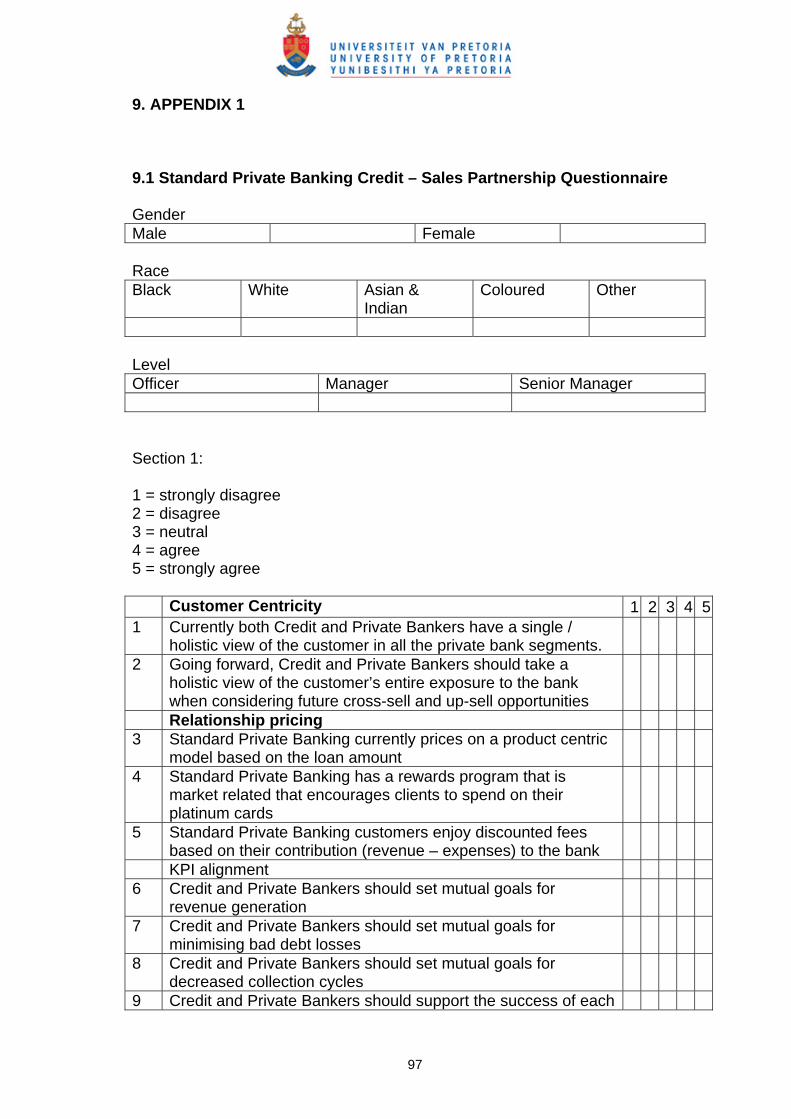
9. APPENDIX 1
9.1 Standard Private Banking Credit – Sales Partnership Questionnaire Gender Male Female Race Black White Asian &
Indian Coloured Other
Level Officer Manager Senior Manager Section 1: 1 = strongly disagree 2 = disagree 3 = neutral 4 = agree 5 = strongly agree Customer Centricity 1 2 3 4 51 Currently both Credit and Private Bankers have a single /
holistic view of the customer in all the private bank segments.
2 Going forward, Credit and Private Bankers should take a holistic view of the customer’s entire exposure to the bank when considering future cross-sell and up-sell opportunities
Relationship pricing 3 Standard Private Banking currently prices on a product centric
model based on the loan amount
4 Standard Private Banking has a rewards program that is market related that encourages clients to spend on their platinum cards
5 Standard Private Banking customers enjoy discounted fees based on their contribution (revenue – expenses) to the bank
KPI alignment 6 Credit and Private Bankers should set mutual goals for
revenue generation
7 Credit and Private Bankers should set mutual goals for minimising bad debt losses
8 Credit and Private Bankers should set mutual goals for decreased collection cycles
9 Credit and Private Bankers should support the success of each
97
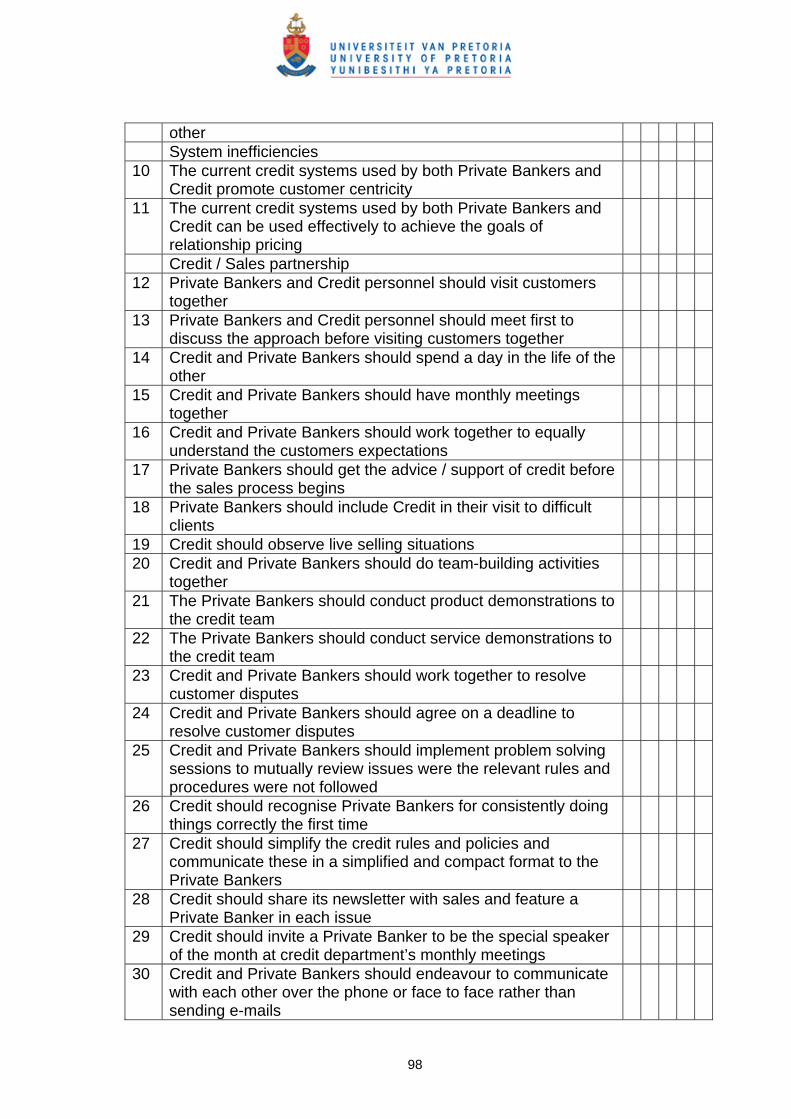
other System inefficiencies 10 The current credit systems used by both Private Bankers and
Credit promote customer centricity
11 The current credit systems used by both Private Bankers and Credit can be used effectively to achieve the goals of relationship pricing
Credit / Sales partnership 12 Private Bankers and Credit personnel should visit customers
together
13 Private Bankers and Credit personnel should meet first to discuss the approach before visiting customers together
14 Credit and Private Bankers should spend a day in the life of the other
15 Credit and Private Bankers should have monthly meetings together
16 Credit and Private Bankers should work together to equally understand the customers expectations
17 Private Bankers should get the advice / support of credit before the sales process begins
18 Private Bankers should include Credit in their visit to difficult clients
19 Credit should observe live selling situations 20 Credit and Private Bankers should do team-building activities
together
21 The Private Bankers should conduct product demonstrations to the credit team
22 The Private Bankers should conduct service demonstrations to the credit team
23 Credit and Private Bankers should work together to resolve customer disputes
24 Credit and Private Bankers should agree on a deadline to resolve customer disputes
25 Credit and Private Bankers should implement problem solving sessions to mutually review issues were the relevant rules and procedures were not followed
26 Credit should recognise Private Bankers for consistently doing things correctly the first time
27 Credit should simplify the credit rules and policies and communicate these in a simplified and compact format to the Private Bankers
28 Credit should share its newsletter with sales and feature a Private Banker in each issue
29 Credit should invite a Private Banker to be the special speaker of the month at credit department’s monthly meetings
30 Credit and Private Bankers should endeavour to communicate with each other over the phone or face to face rather than sending e-mails
98

31 Credit and Private Bankers should conduct regular team
meeting together with senior management and the executive team
32 The allocation of Private Bankers across the different segments are adequate
33 The allocation of credit resources across the different segments are adequate
Section 2: How can both credit and Private Bankers be more entrepreneurial in their respective roles? What are the main reasons that would cause credit and / or Private Bankers to leave the firm? How can the Credit Team and the Private Bankers work closer together?
99
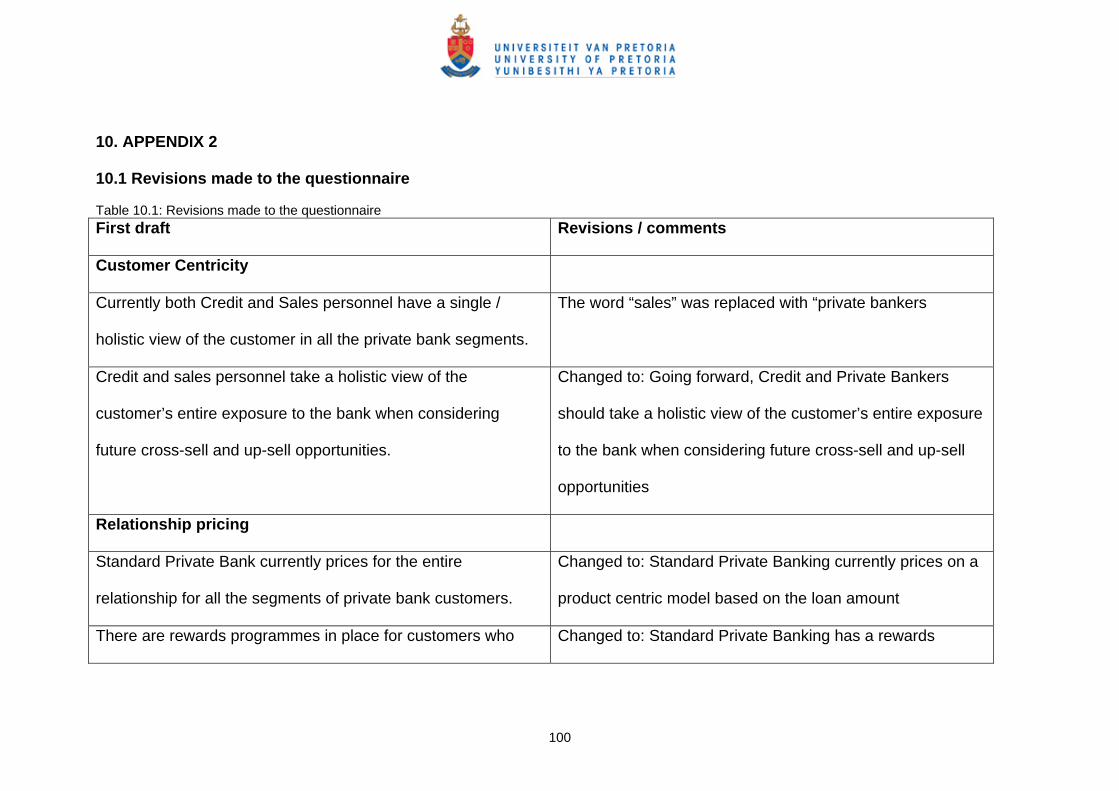
100
10. APPENDIX 2
10.1 Revisions made to the questionnaire Table 10.1: Revisions made to the questionnaire First draft Revisions / comments
Customer Centricity
Currently both Credit and Sales personnel have a single /
holistic view of the customer in all the private bank segments.
The word “sales” was replaced with “private bankers
Credit and sales personnel take a holistic view of the
customer’s entire exposure to the bank when considering
future cross-sell and up-sell opportunities.
Changed to: Going forward, Credit and Private Bankers
should take a holistic view of the customer’s entire exposure
to the bank when considering future cross-sell and up-sell
opportunities
Relationship pricing
Standard Private Bank currently prices for the entire
relationship for all the segments of private bank customers.
Changed to: Standard Private Banking currently prices on a
product centric model based on the loan amount
There are rewards programmes in place for customers who Changed to: Standard Private Banking has a rewards
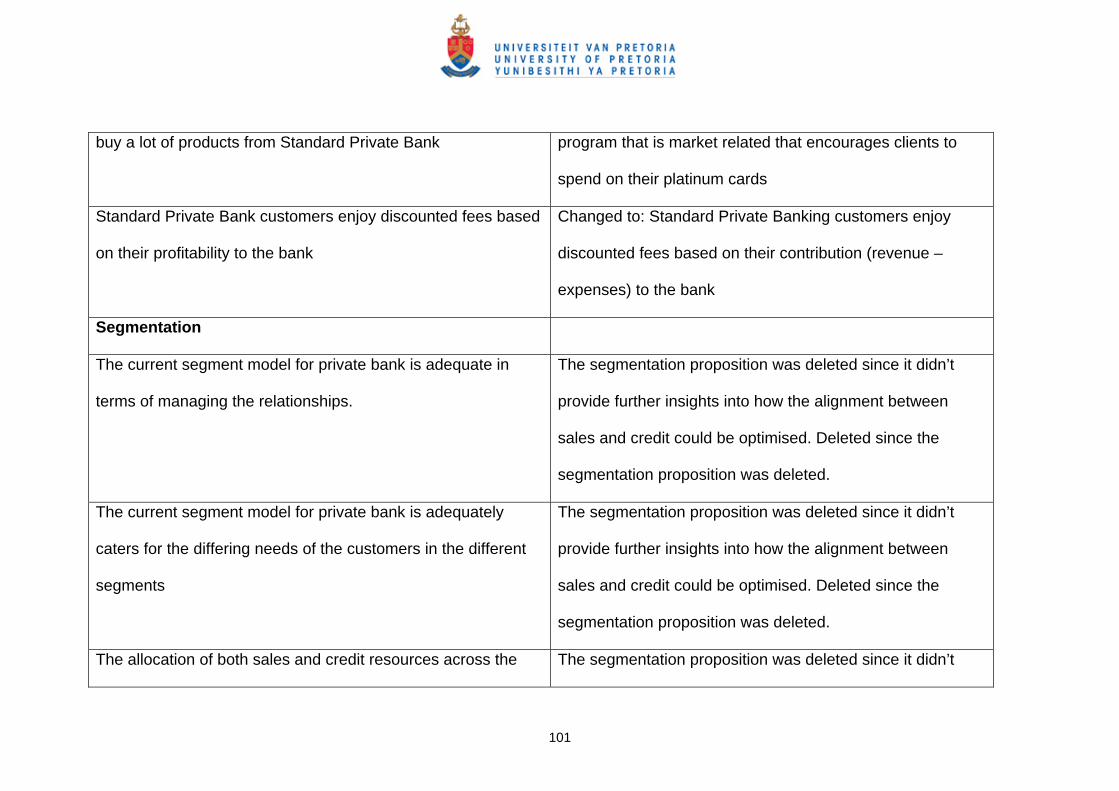
buy a lot of products from Standard Private Bank program that is market related that encourages clients to
spend on their platinum cards
Standard Private Bank customers enjoy discounted fees based
on their profitability to the bank
Changed to: Standard Private Banking customers enjoy
discounted fees based on their contribution (revenue –
expenses) to the bank
Segmentation
The current segment model for private bank is adequate in
terms of managing the relationships.
The segmentation proposition was deleted since it didn’t
provide further insights into how the alignment between
sales and credit could be optimised. Deleted since the
segmentation proposition was deleted.
The current segment model for private bank is adequately
caters for the differing needs of the customers in the different
segments
The segmentation proposition was deleted since it didn’t
provide further insights into how the alignment between
sales and credit could be optimised. Deleted since the
segmentation proposition was deleted.
The allocation of both sales and credit resources across the The segmentation proposition was deleted since it didn’t
101

different segments are adequate provide further insights into how the alignment between
sales and credit could be optimised. Deleted since the
segmentation proposition was deleted.
KPI
Credit and Sales should set mutual goals for revenue
generation, minimising bad debt losses, and decreased
collection cycles
This was broken down into 3 separate questions since the
respondent could agree with one part of the question but not
another.
Changed to:
• Credit and Private Bankers should set mutual goals
for revenue generation
• Credit and Private Bankers should set mutual goals
for minimising bad debt losses
• Credit and Private Bankers should set mutual goals
for decreased collection cycles
102

Credit and sales should support the success of each other The word “sales” was replaced with “private bankers
System inefficiencies
The current systems used by both sales and credit promote
customer centricity
Not changed
The current systems can be used effectively to achieve the
goals of relationship pricing
Not changed
Credit / Sales partnership
Sales and Credit personnel should visit customers together but
should meet first to discuss the approach
The word “sales” was replaced with “private bankers
Credit and Sales should bridge the gap by reversing roles Changed to: Credit and Private Bankers should spend a day
in the life of the other
Credit and sales should have monthly meetings The word “sales” was replaced with “private bankers
Credit and Sales should work together to equally understand
the customers expectations
The word “sales” was replaced with “private bankers
103

Credit should investigate creditworthiness before the sales
process begins
Changed to: Private Bankers should get the advice / support
of credit before the sales process begins
Credit should be allowed to be firm with difficult customers and
in doing so protect the relationship between sales and the
customer
Changed to: Private Bankers should include Credit in their
visit to difficult clients
Credit should observe live selling situations Not changed
Credit and sales personnel should do team-building activities
together
The word “sales” was replaced with “private bankers
The sales personnel should conduct product or service
demonstrations to the credit team
The word “sales” was replaced with “private bankers
Credit and sales should work together to resolve customer
disputes and agree on a deadline
Broken down into two questions since the respondent could
agree with the first part and disagree with the second part:
Changed to:
• Credit and Private Bankers should work together to
104

resolve customer disputes
• Credit and Private Bankers should agree on a
deadline to resolve customer disputes
Credit should do pre-approvals where the risk is low and obtain
the application form thereafter
This question was deleted since it was covered by one of
the other questions.
Credit and sales should implement problem solving sessions to
mutually review issues were the relevant rules and procedures
were not followed
The word “sales” was replaced with “private bankers
Credit should recognise sales personnel for high performance
by doing things correctly the first time
Changed to: Credit should recognise Private Bankers for
consistently doing things correctly the first time
Credit should simplify the credit rules and policies and
communicate these in a simplified and compact format to the
sales personnel
Not changed
Credit should share its newsletter with sales and feature a
salesperson in each issue
Not changed
105
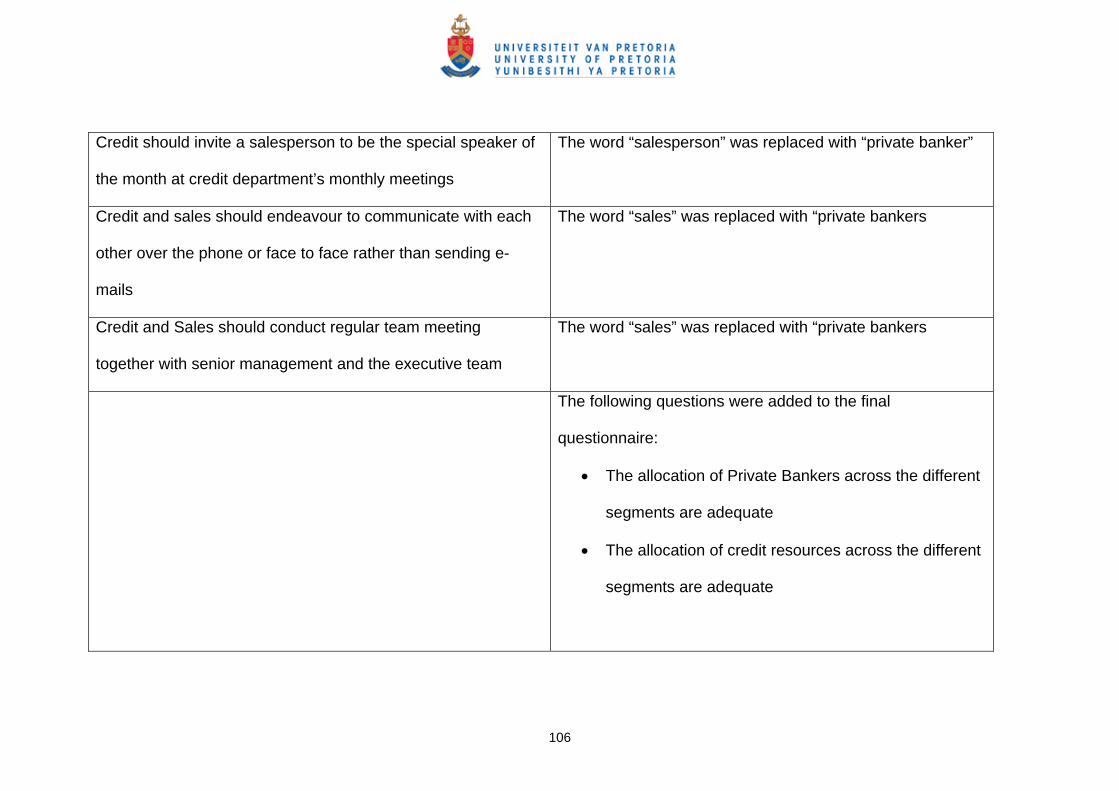
Credit should invite a salesperson to be the special speaker of
the month at credit department’s monthly meetings
The word “salesperson” was replaced with “private banker”
Credit and sales should endeavour to communicate with each
other over the phone or face to face rather than sending e-
mails
The word “sales” was replaced with “private bankers
Credit and Sales should conduct regular team meeting
together with senior management and the executive team
The word “sales” was replaced with “private bankers
The following questions were added to the final
questionnaire:
• The allocation of Private Bankers across the different
segments are adequate
• The allocation of credit resources across the different
segments are adequate
106