Embed Size (px)
Citation preview
“Optimisation of the mixed-acid online monitoring and control in stainless steel pickling plants”BFI Workshop “Pickling Solutions Technology”, Düsseldorf, 13th November 2019
Matthias Werner
Content of Presentation
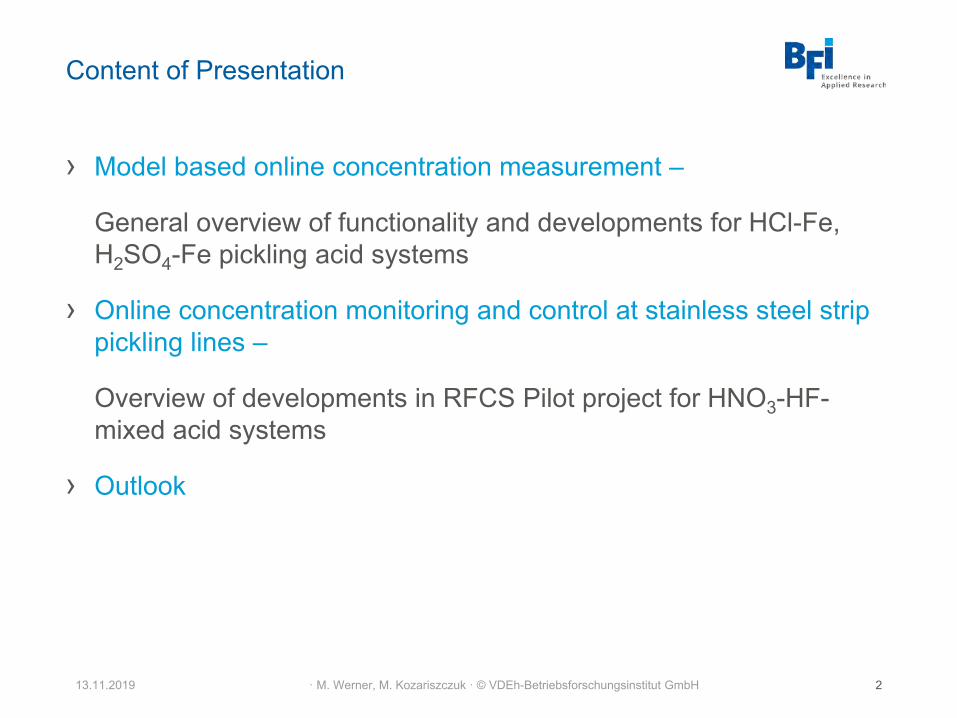
› Model based online concentration measurement –
General overview of functionality and developments for HCl-Fe, H2SO4-Fe pickling acid systems
› Online concentration monitoring and control at stainless steel strip pickling lines –
Overview of developments in RFCS Pilot project for HNO3-HF-mixed acid systems
› Outlook
· M. Werner, M. Kozariszczuk · © VDEh-Betriebsforschungsinstitut GmbH13.11.2019 2

Online-measuring technique for automated concentration supervision in acidic process bath
13.11.2019 3· M. Werner, M. Kozariszczuk · © VDEh-Betriebsforschungsinstitut GmbH
Initial Situation › Pickling by acid solutions is an important process step for fabrication
of highly pure metal surfaces › Pickling bath supervision by manual process analysis → time and
cost intensive› Not available online-concentration data → automated process control
difficult› High product quality/plant-productivity demands fast adjustment and
perpetuation of optimal set points of free acid and metal salts concentrations
Solution› Development of an operational online-measuring technique for
continuous and simultaneous acid concentration analysis › Application of a model based analysis technique by physical
parameter online measurement
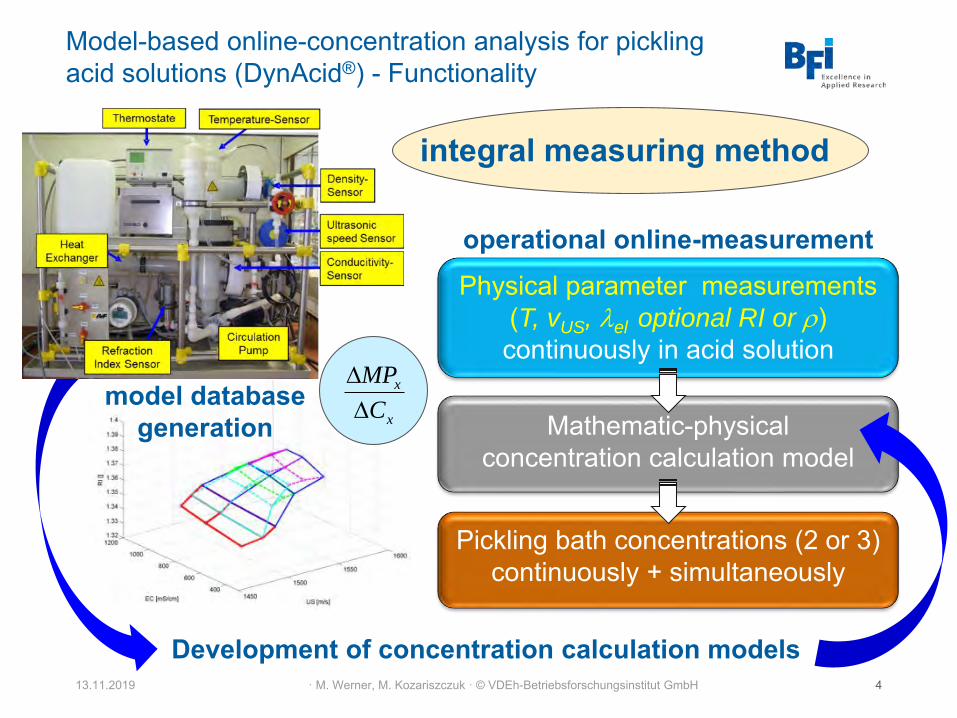
Model-based online-concentration analysis for pickling acid solutions (DynAcid®) - Functionality
13.11.2019 · M. Werner, M. Kozariszczuk · © VDEh-Betriebsforschungsinstitut GmbH 4
model databasegeneration
Development of concentration calculation models
operational online-measurement
integral measuring method
x
x
C
MP
Physical parameter measurements(T, vUS, lel optional RI or r)continuously in acid solution
Mathematic-physicalconcentration calculation model
Pickling bath concentrations (2 or 3)continuously + simultaneously

Fundamental development of DynAcid®-Technique for HCl- and H2SO4-Fe pickling lines
13.11.2019 5· M. Werner, M. Kozariszczuk · © VDEh-Betriebsforschungsinstitut GmbH
› Basic measuring method developments (model database + cal. model)› Set-up of measuring technique, testing in laboratory + technical centre
Set of characteristic curves from laboratoryinvestigations
Ultrasonicspeed
el. C
ondu
ctiv
ity
Fe-Conc..
Acid-Conc.
Mobile measuring system test and demonstration equipment
H2SO4-FeII-model
T = const.
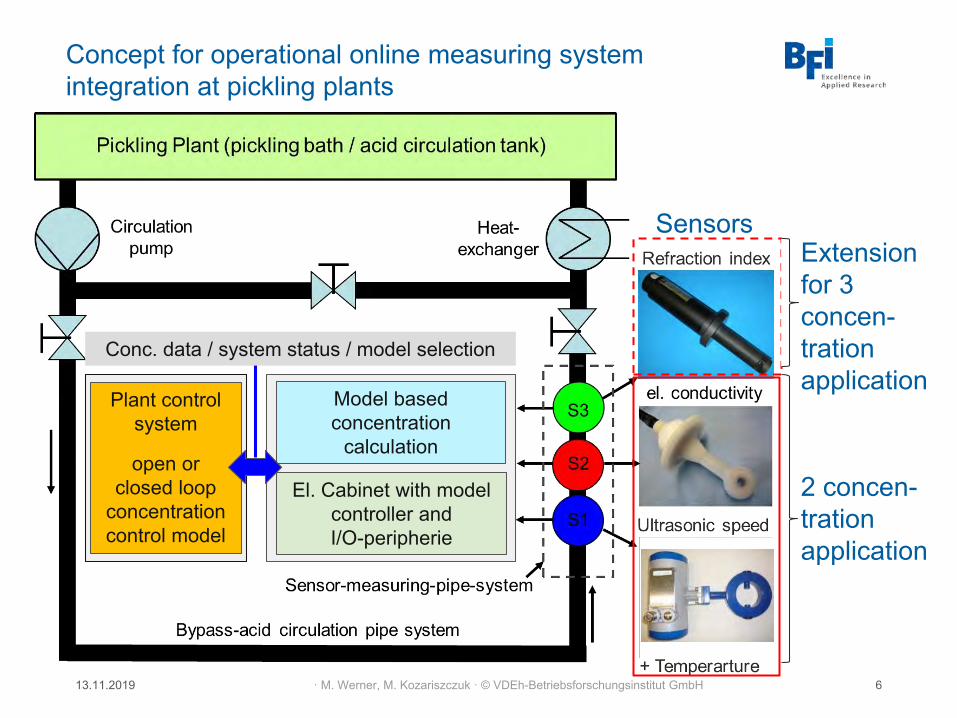
Concept for operational online measuring system integration at pickling plants
13.11.2019 6· M. Werner, M. Kozariszczuk · © VDEh-Betriebsforschungsinstitut GmbH
2 concen-trationapplication
Extensionfor 3 concen-trationapplication
El. Cabinet with modelcontroller and I/O-peripherie
Model basedconcentration
calculation
Sensors
Plant controlsystem
open orclosed loop
concentrationcontrol model
Conc. data / system status / model selection
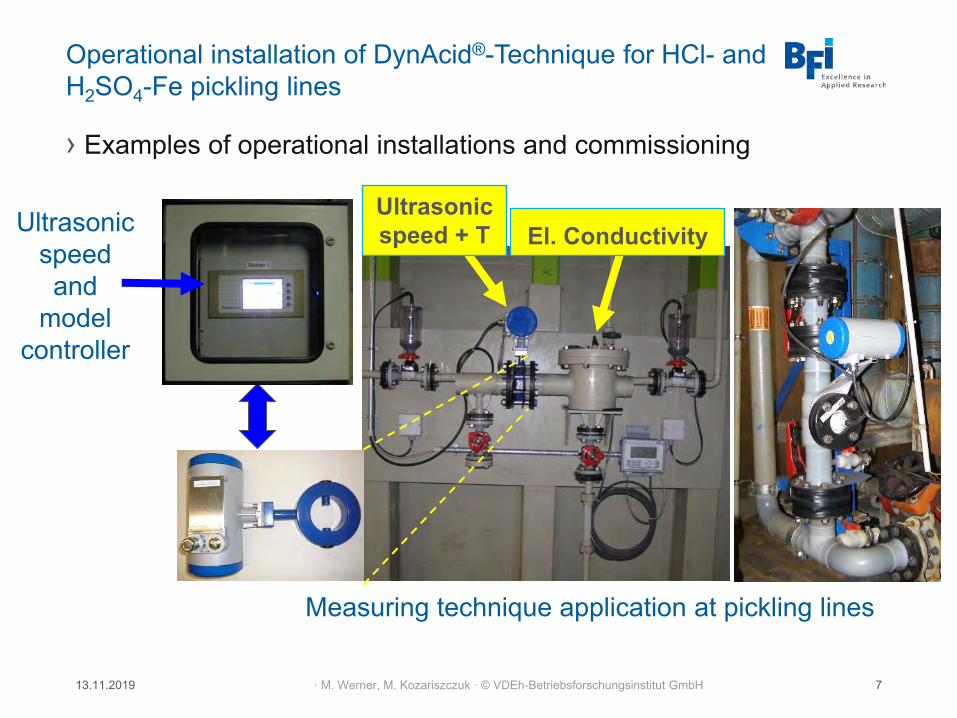
Operational installation of DynAcid®-Technique for HCl- and H2SO4-Fe pickling lines
13.11.2019 7· M. Werner, M. Kozariszczuk · © VDEh-Betriebsforschungsinstitut GmbH
› Examples of operational installations and commissioning
Ultrasonicspeed + T El. Conductivity
Measuring technique application at pickling lines
Ultrasonicspeedand
modelcontroller
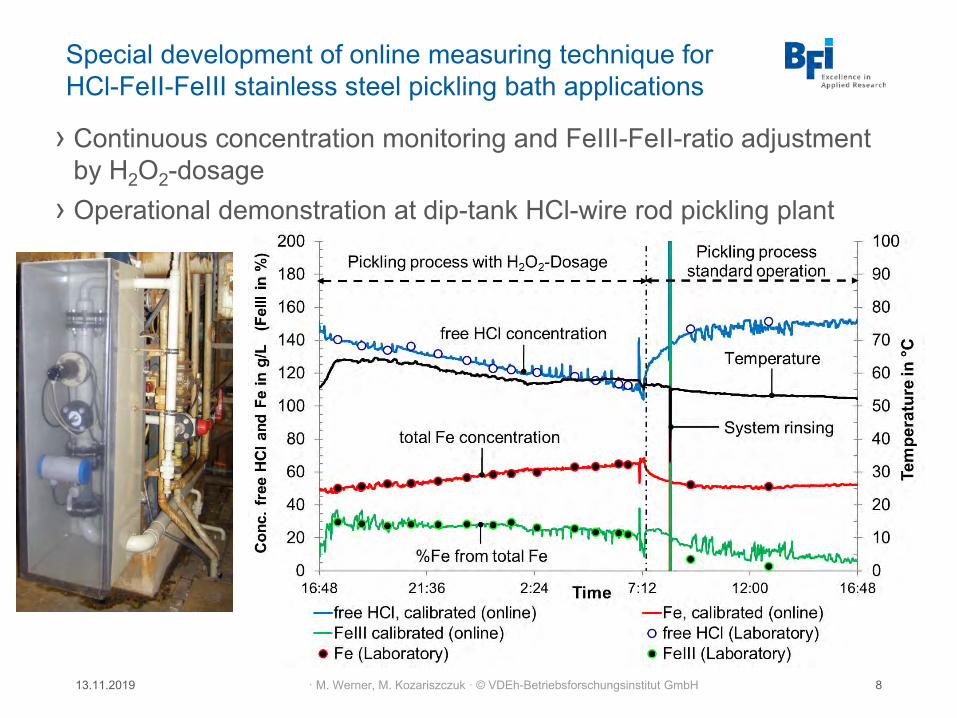
Special development of online measuring technique for HCl-FeII-FeIII stainless steel pickling bath applications
13.11.2019 8· M. Werner, M. Kozariszczuk · © VDEh-Betriebsforschungsinstitut GmbH
› Continuous concentration monitoring and FeIII-FeII-ratio adjustment by H2O2-dosage
› Operational demonstration at dip-tank HCl-wire rod pickling plant
Online measuring technique commissioning and operation
13.11.2019 9· M. Werner, M. Kozariszczuk · © VDEh-Betriebsforschungsinstitut GmbH
› Calibration of model based online analysis systems on operational measuring conditions by laboratory reference analysis
• differences between artificial model solutions and pickling acids
• differences in measuring system set-ups
• specific operational temperature and concentration ranges
› Measuring conditions of acid media: As possible low gas bubble and sludge accumulation, flow rate > ~ 6 m³/h, dTsample < 10 k/h,
› Measurement accuracy: Deviations to reference analysis mainly ~ < 5 g/L Fe and < 8 g/L HCl /H2SO4
› Maintenance – depending on operational application:
• Sensor-(pipe section) rinsing from solid matter (~ every 2 to 7 days)
• Validation of basic functionalities (~ 2 to 4 times/year)
Commercial availability of DynAcid® online measuring technique for H2SO4- and HCl-pickling bath applications
13.11.2019 10· M. Werner, M. Kozariszczuk · © VDEh-Betriebsforschungsinstitut GmbH
Sales and distribution + commissioning and support
o BFI Betriebstechnik GmbH (Düsseldorf)
o SensoTech GmbH (Magdeburg-Barleben) + Ultrasonic speed sensor and model controller technique
Specially offered measuring technique service options by BFI
o Consulting concerning system installation and operation
o System commissioning on-site the operation locations
o System calibration on operation conditions by reference analysis
o System maintenance (online sensor dismounting, cleaning and
validation, failure analysis and repair support)
o System demonstration installations

Overview DynAcid®-Installations by BFI + BFI-Betriebstechnik GmbH (inclusive commissioning)
13.11.2019 11· M. Werner, M. Kozariszczuk · © VDEh-Betriebsforschungsinstitut GmbH
o HCl-pickling lines (each 2 systems)
• DEW (Germany, dip-tank wire rod pickling), ~ 2006 →
• TKSE (Germany, strip pickling line), ~ 2007 →
• Turkey (Iskenderun, strip pickling line), ~ 2011 →
• South Korea (Pohang, strip pickling line), ~ 2012 →
o H2SO4-pickling lines
• TKS (Germany, strip pickling line) → 4 systems, ~ 2008 →
• TK (Germany, strip pickling line) → 2 systems, ~ 2009 → ~ 2015
(facility closed)
MACO-Pilot – Optimisation of the mixed-acid online monitoring and control in stainless steel pickling plants
RFCS Project (07/2016 – 12/2019)› Optimisation of the online concentration measuring technique
for different HF-HNO3-mixed acid pickling plant applications• calculation model enhancement, system set-up, sensor-lifetime
› Operational installations and optimisation of prototype systems at stainless steel strip and wire rod pickling plants
› Improvement of the pickling process operation at stainless steel pickling plants• Closed loop control model, pickling programme management tool
· M. Werner, M. Kozariszczuk · © VDEh-Betriebsforschungsinstitut GmbH13.11.2019 12

Optimisation of online measuring system set-up for HNO3-HF mixed acid applications
› New types of sensors for refraction index and ultrasonic speed measuring
› New el. cabinet model-controller and physical parameter sensor-measuring pipe set-up
13.11.2019 · M. Werner, M. Kozariszczuk · © VDEh-Betriebsforschungsinstitut GmbH 13
Main Data Screen
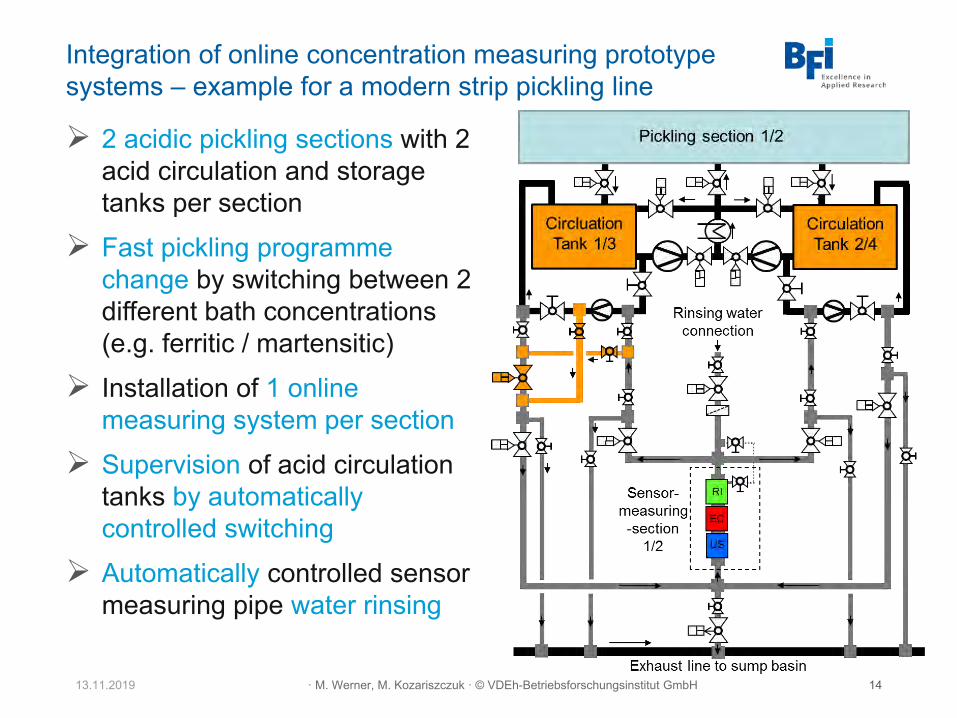
Integration of online concentration measuring prototype systems – example for a modern strip pickling line
➢ 2 acidic pickling sections with 2 acid circulation and storage tanks per section
➢ Fast pickling programme change by switching between 2 different bath concentrations(e.g. ferritic / martensitic)
➢ Installation of 1 online measuring system per section
➢ Supervision of acid circulation tanks by automatically controlled switching
➢ Automatically controlled sensor measuring pipe water rinsing
13.11.2019 · M. Werner, M. Kozariszczuk · © VDEh-Betriebsforschungsinstitut GmbH 14
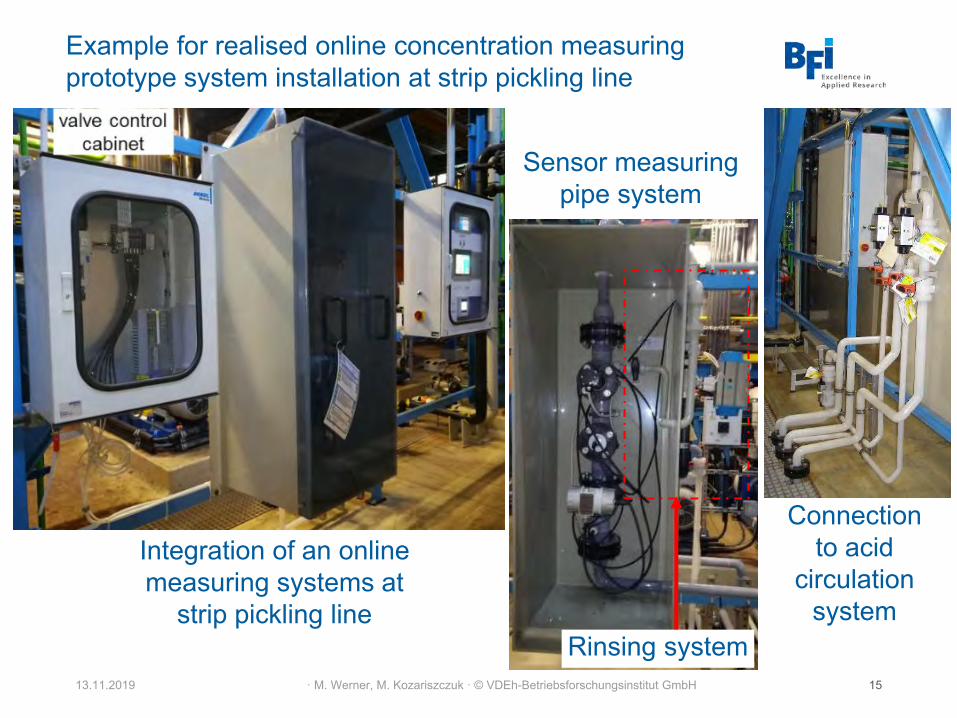
Example for realised online concentration measuring prototype system installation at strip pickling line
Integration of an online measuring systems at
strip pickling line
13.11.2019 · M. Werner, M. Kozariszczuk · © VDEh-Betriebsforschungsinstitut GmbH 15
Sensor measuring pipe system
Connectionto acid
circulation system
Rinsing system
13.11.2019 · M. Werner, M. Kozariszczuk · © VDEh-Betriebsforschungsinstitut GmbH 16
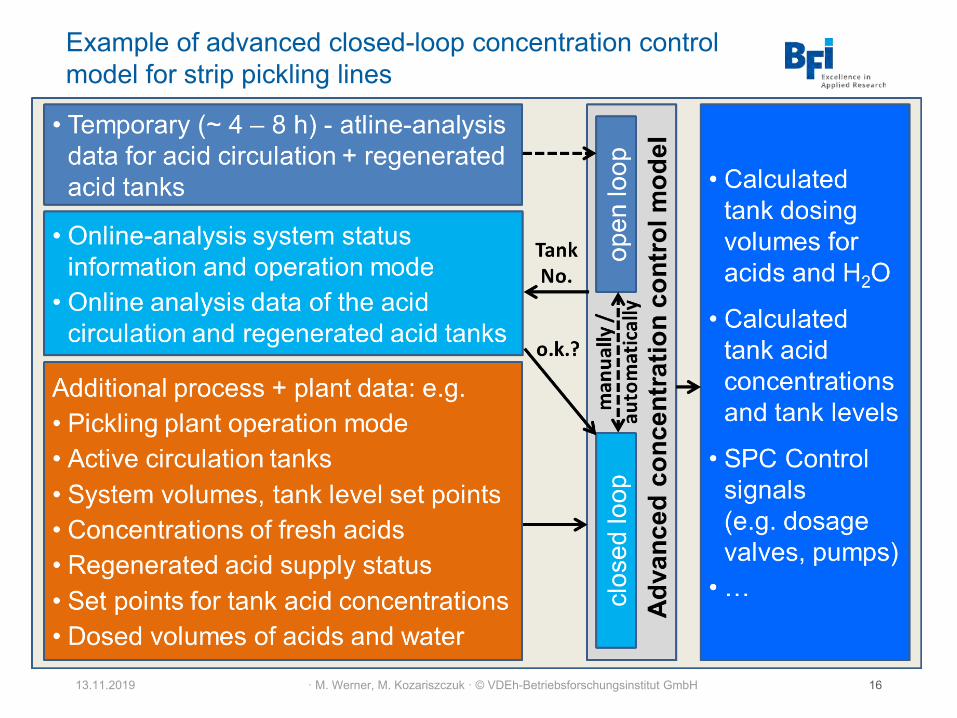
Example of advanced closed-loop concentration control model for strip pickling lines
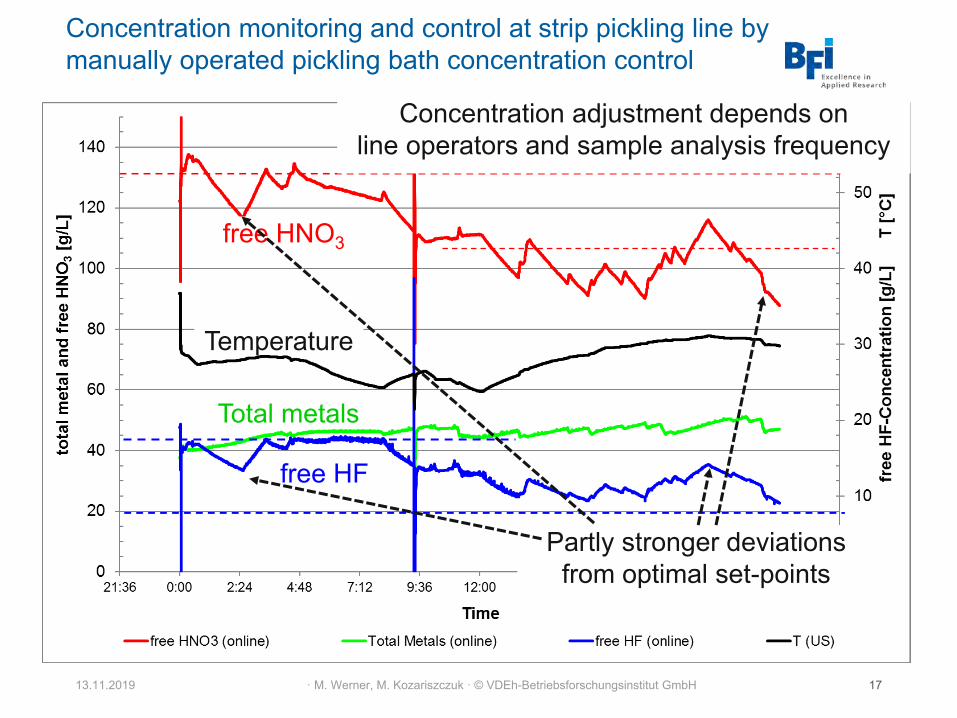
Concentration monitoring and control at strip pickling line by manually operated pickling bath concentration control
13.11.2019 · M. Werner, M. Kozariszczuk · © VDEh-Betriebsforschungsinstitut GmbH 17
Concentration adjustment depends on line operators and sample analysis frequency
Partly stronger deviations from optimal set-points
free HNO3
free HF
Total metals
Temperature
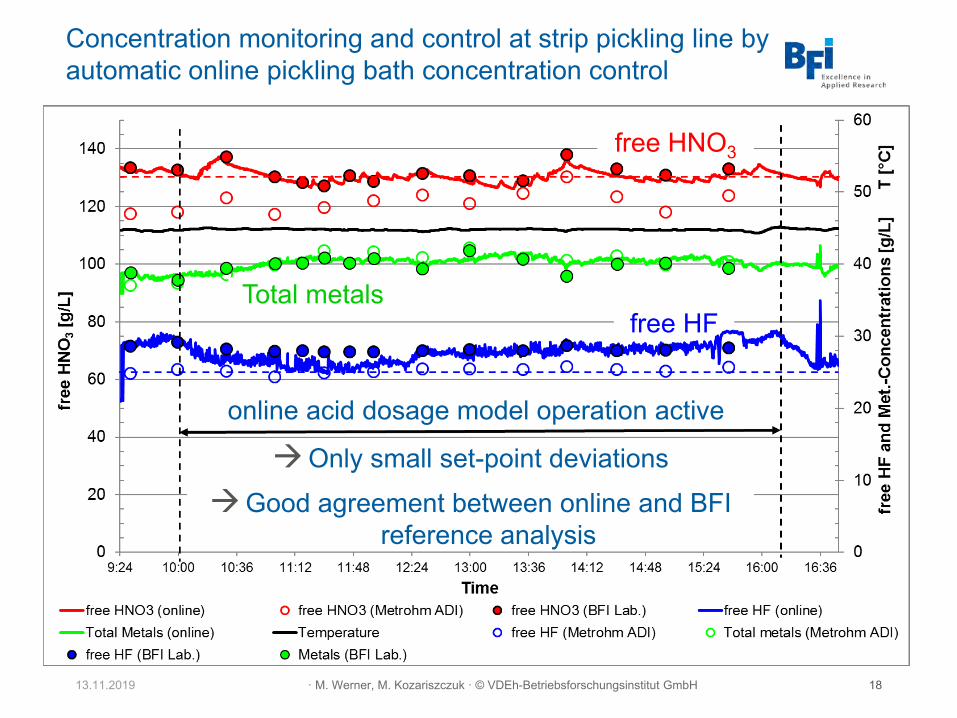
Concentration monitoring and control at strip pickling line by automatic online pickling bath concentration control
13.11.2019 · M. Werner, M. Kozariszczuk · © VDEh-Betriebsforschungsinstitut GmbH 18
online acid dosage model operation active
→Only small set-point deviations→Good agreement between online and BFI
reference analysis
free HNO3
Total metalsfree HF
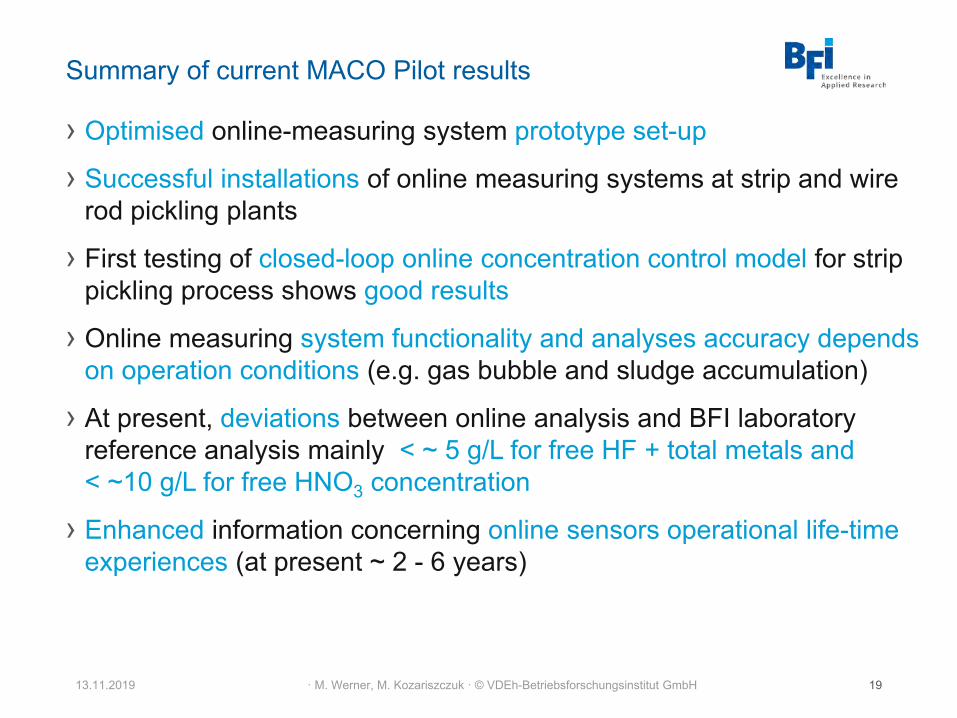
Summary of current MACO Pilot results
› Optimised online-measuring system prototype set-up
› Successful installations of online measuring systems at strip and wire rod pickling plants
› First testing of closed-loop online concentration control model for strip pickling process shows good results
› Online measuring system functionality and analyses accuracy depends on operation conditions (e.g. gas bubble and sludge accumulation)
› At present, deviations between online analysis and BFI laboratory reference analysis mainly < ~ 5 g/L for free HF + total metals and < ~10 g/L for free HNO3 concentration
› Enhanced information concerning online sensors operational life-time experiences (at present ~ 2 - 6 years)
13.11.2019 · M. Werner, M. Kozariszczuk · © VDEh-Betriebsforschungsinstitut GmbH 19
Outlook
RFCS Project MACO Pilot
› Further optimisation works and tests at the pickling plant applications → 12/2019
› Further optimisation of concentration calculation models → 12/2019
› Realisation of marketable measuring technique on basis of the experiences and prototype system set-up, 1/2020 →
Ongoing online measuring system application developments
› H2SO4-Zn-Fe acid solution mixtures (recovery of Zinc from steel scrap)
› HNO3-H2SO4-Zn acid mixtures (surface treatment of Zn products)
› …
13.11.2019 · M. Werner, M. Kozariszczuk · © VDEh-Betriebsforschungsinstitut GmbH 20
Contact
13.11.2019 · M. Werner, M. Kozariszczuk · © VDEh-Betriebsforschungsinstitut GmbH 22
VDEh Betriebsforschungsinstitut GmbH
› Dr.-Ing. Matthias Werner [email protected]
› Dr.-Ing. Ralf Wolters [email protected]
› Dr.-Ing. Matthias Kozariszczuk [email protected]
BFI Betriebstechnik GmbH
› Dipl.-Ing. Christian Warias [email protected]
“Operational experiences of process bath analysis in a wire rod pickling plant”BFI Workshop “Pickling Solutions Technology”, Düsseldorf, 13th November 2019Frederik Kolinke
RFCS Project MACO-Pilot
Content of Presentation
› Overview of DEW wire rod pickling plants for carbon steel and stainless steel
› Online concentration monitoring at HCl-Fe wire rod dip tank pickling plant
› Online concentration monitoring at HF-HNO3 mixed acid wire rod dip tank pickling plant (project MACO Pilot)
› Summary and outlook
13.11.2019 2F. Kolinke, (DEW)· M. Werner, M. Kozariszczuk · © VDEh-Betriebsforschungsinstitut GmbH
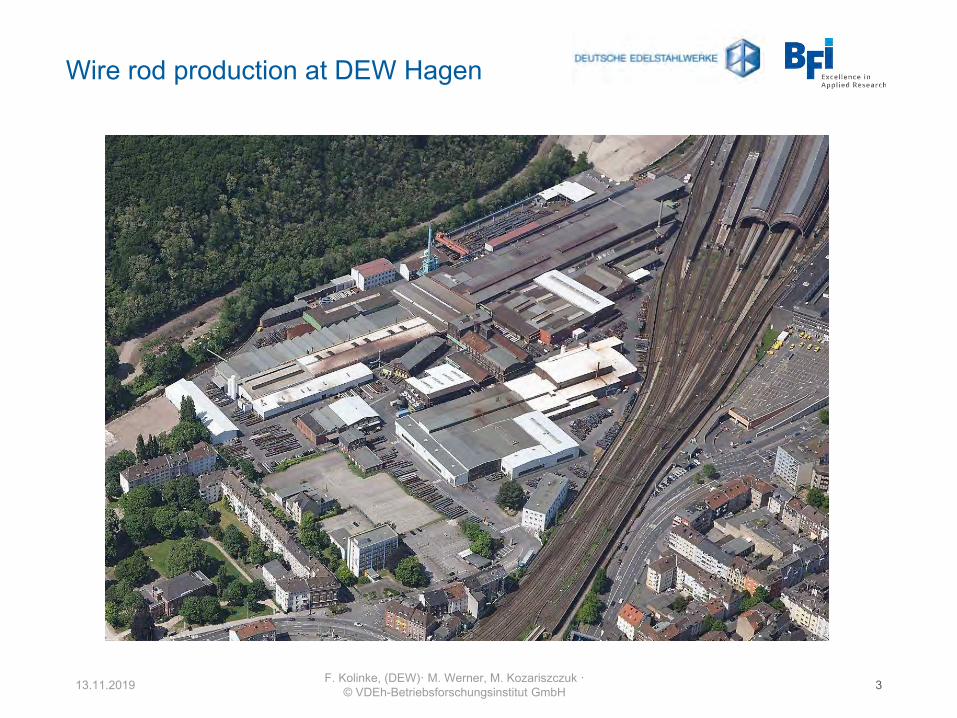
Wire rod production at DEW Hagen
13.11.2019 3F. Kolinke, (DEW)· M. Werner, M. Kozariszczuk · © VDEh-Betriebsforschungsinstitut GmbH
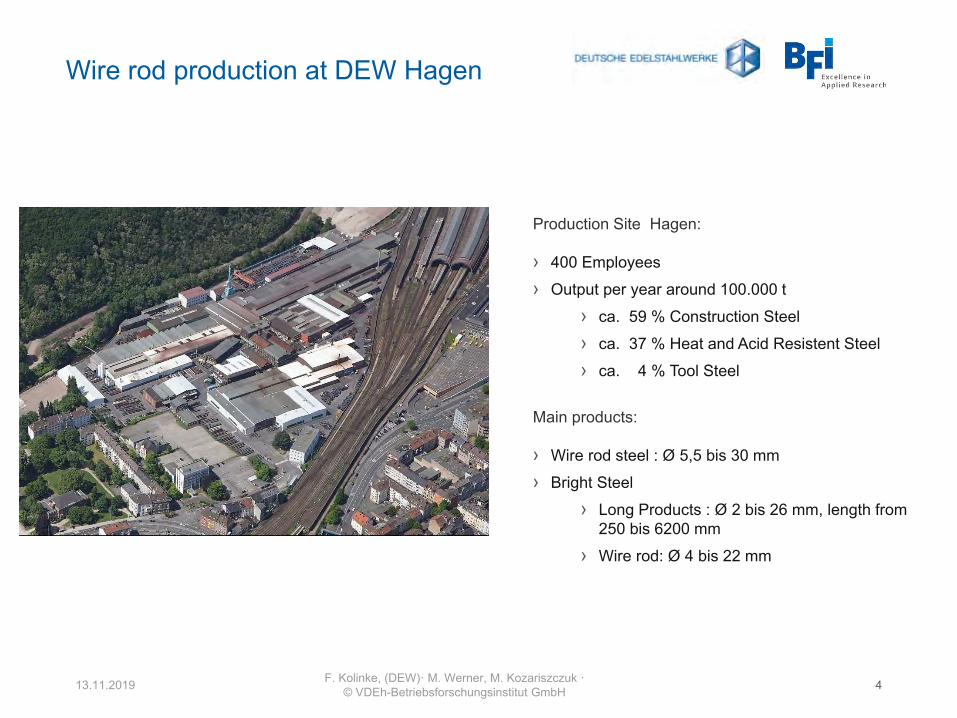
Wire rod production at DEW Hagen
13.11.2019 4
Production Site Hagen:
› 400 Employees› Output per year around 100.000 t
› ca. 59 % Construction Steel› ca. 37 % Heat and Acid Resistent Steel› ca. 4 % Tool Steel
Main products:
› Wire rod steel : Ø 5,5 bis 30 mm› Bright Steel
› Long Products : Ø 2 bis 26 mm, length from250 bis 6200 mm
› Wire rod: Ø 4 bis 22 mm
F. Kolinke, (DEW)· M. Werner, M. Kozariszczuk · © VDEh-Betriebsforschungsinstitut GmbH
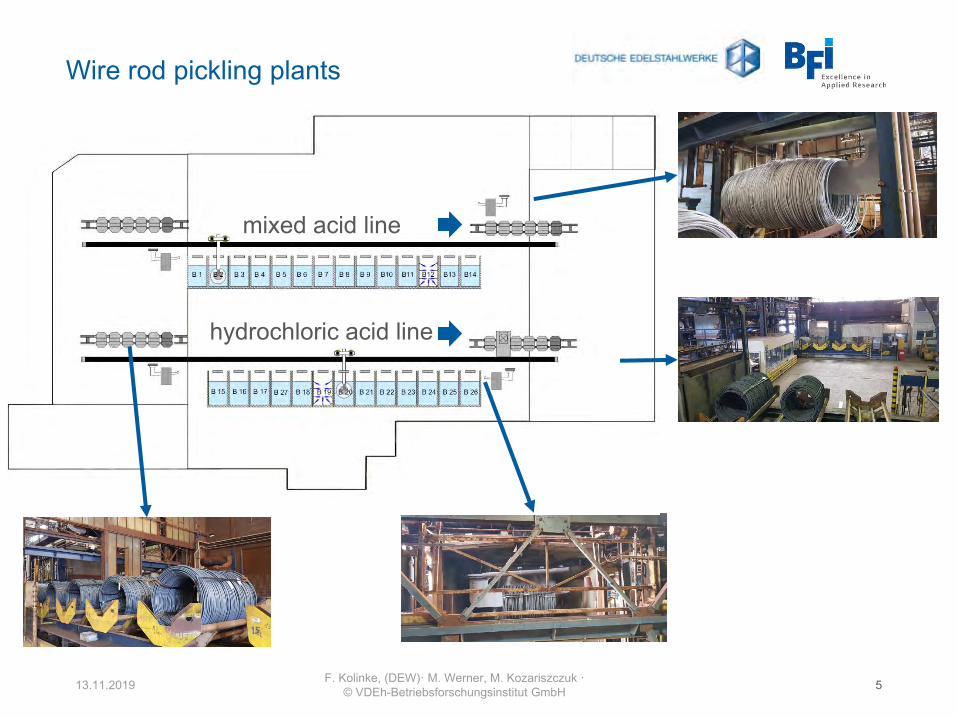
Wire rod pickling plants
13.11.2019 F. Kolinke, (DEW)· M. Werner, M. Kozariszczuk · © VDEh-Betriebsforschungsinstitut GmbH 5
mixed acid line
hydrochloric acid line
Online-measuring technique for automated concentration supervision at wired rod HCl-pickling plant
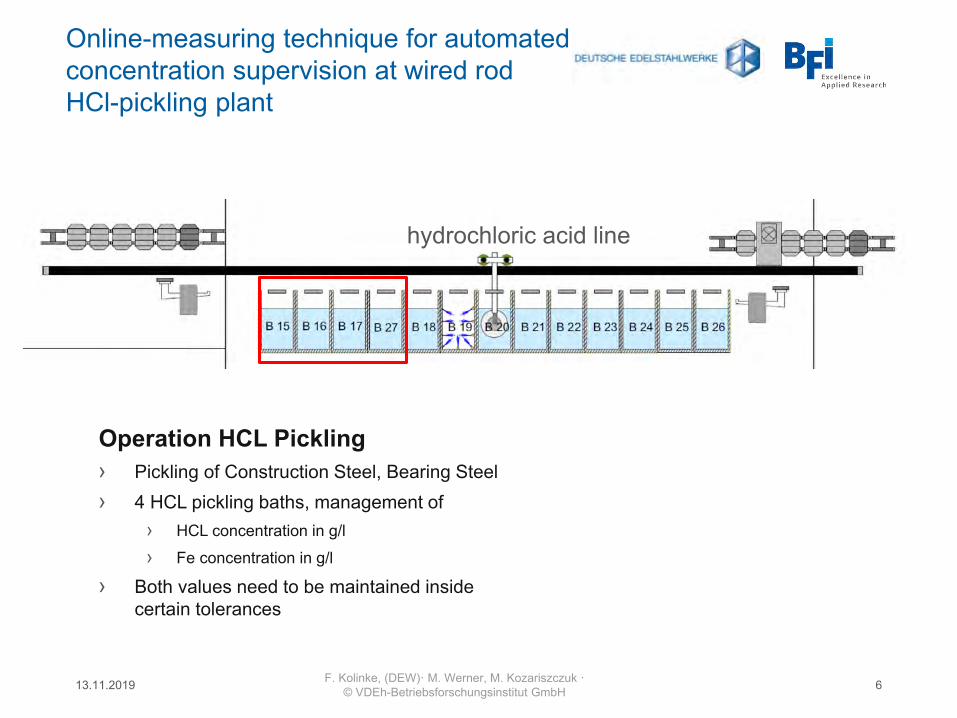
Operation HCL Pickling› Pickling of Construction Steel, Bearing Steel › 4 HCL pickling baths, management of
› HCL concentration in g/l› Fe concentration in g/l
› Both values need to be maintained inside certain tolerances
13.11.2019 6F. Kolinke, (DEW)· M. Werner, M. Kozariszczuk · © VDEh-Betriebsforschungsinstitut GmbH
hydrochloric acid line
Online-measuring technique for automated concentration supervision at wired rod HCl-pickling plant
13.11.2019 7F. Kolinke, (DEW)· M. Werner, M. Kozariszczuk · © VDEh-Betriebsforschungsinstitut GmbH
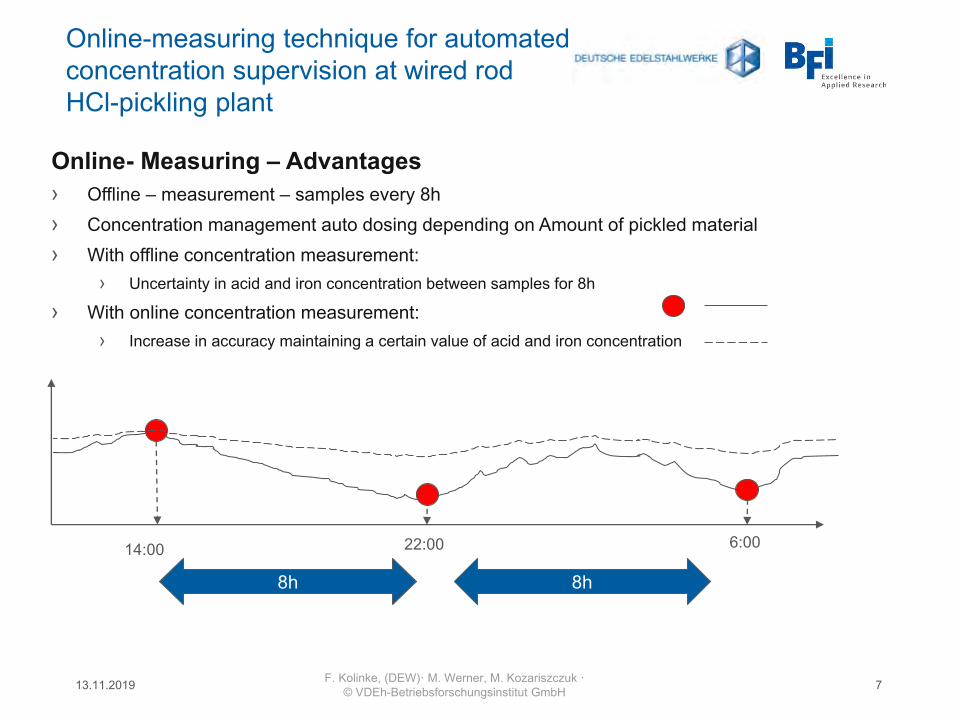
Online- Measuring – Advantages › Offline – measurement – samples every 8h › Concentration management auto dosing depending on Amount of pickled material› With offline concentration measurement:
› Uncertainty in acid and iron concentration between samples for 8h
› With online concentration measurement:› Increase in accuracy maintaining a certain value of acid and iron concentration
14:00 22:00 6:00
8h 8h
Online-measuring technique for automated concentration supervision at wired rod HCl-pickling plant
13.11.2019 8F. Kolinke, (DEW)· M. Werner, M. Kozariszczuk · © VDEh-Betriebsforschungsinstitut GmbH
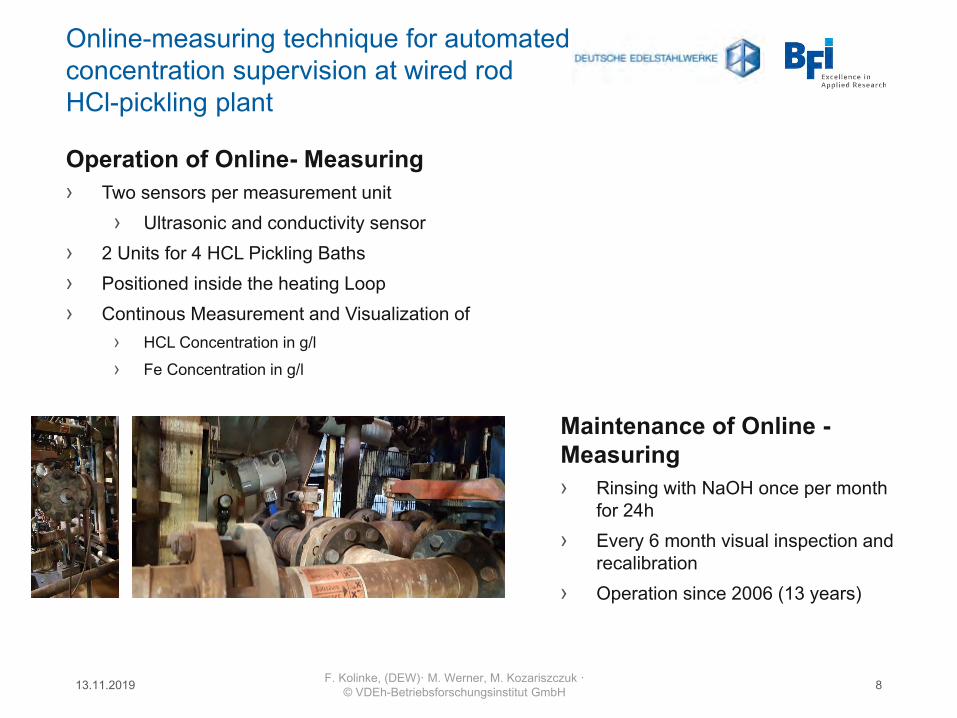
Operation of Online- Measuring› Two sensors per measurement unit
› Ultrasonic and conductivity sensor› 2 Units for 4 HCL Pickling Baths› Positioned inside the heating Loop› Continous Measurement and Visualization of
› HCL Concentration in g/l› Fe Concentration in g/l
Maintenance of Online -Measuring› Rinsing with NaOH once per month
for 24h› Every 6 month visual inspection and
recalibration› Operation since 2006 (13 years)
Concentration monitoring and control at stainless steel wire rod mixed acid pickling (Project MACO Pilot)
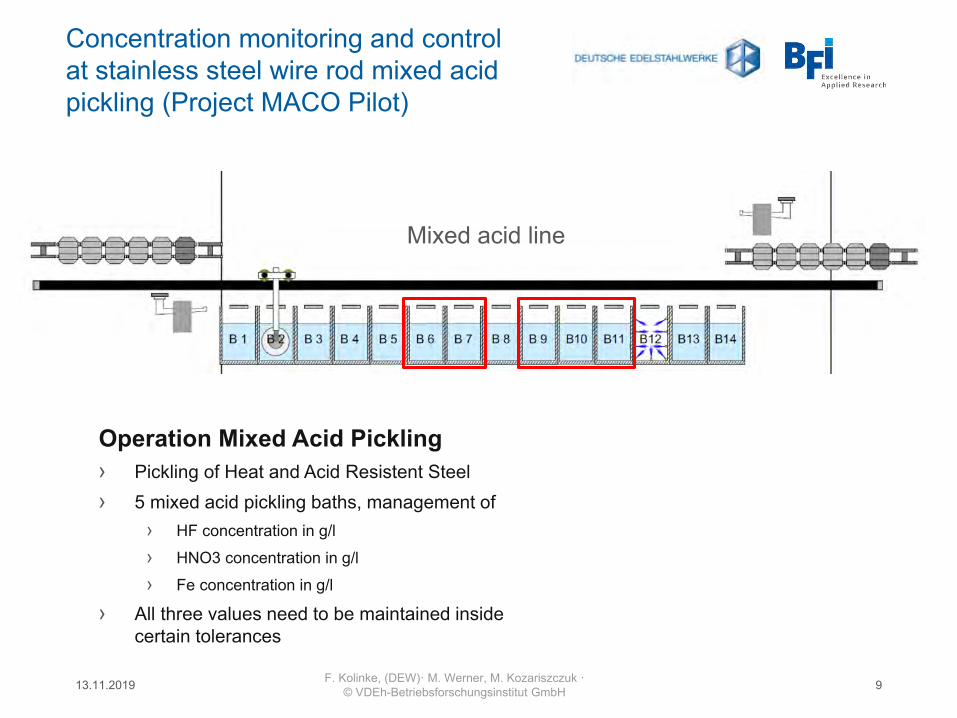
Operation Mixed Acid Pickling› Pickling of Heat and Acid Resistent Steel› 5 mixed acid pickling baths, management of
› HF concentration in g/l› HNO3 concentration in g/l› Fe concentration in g/l
› All three values need to be maintained inside certain tolerances
13.11.2019 9F. Kolinke, (DEW)· M. Werner, M. Kozariszczuk · © VDEh-Betriebsforschungsinstitut GmbH
Mixed acid line
Concentration monitoring and control at stainless steel wire rod mixed acid pickling (Project MACO Pilot)
Initial situation at mixed acid line› The bath concentration supervision by at-line analysis is time consuming
(manual sample drawing, analysis time about 30 minutes per tank sample) and thus the sample frequency limited to about 8 h.
› Some steel grades can cause high temperate increase >> 40 °C in the pickling tanks during the complex chemical reactions of the HF-HNO3-acid mixture
› The adjustment of the acid concentration within the set-point ranges andthe control of the tank temperature is very import for save process control
Solution› Additional installation of an high-rate mixed acid analysis system
13.11.2019 10F. Kolinke, (DEW)· M. Werner, M. Kozariszczuk · © VDEh-Betriebsforschungsinstitut GmbH
Concentration monitoring and control at stainless steel wire rod mixed acid pickling (Project MACO Pilot)
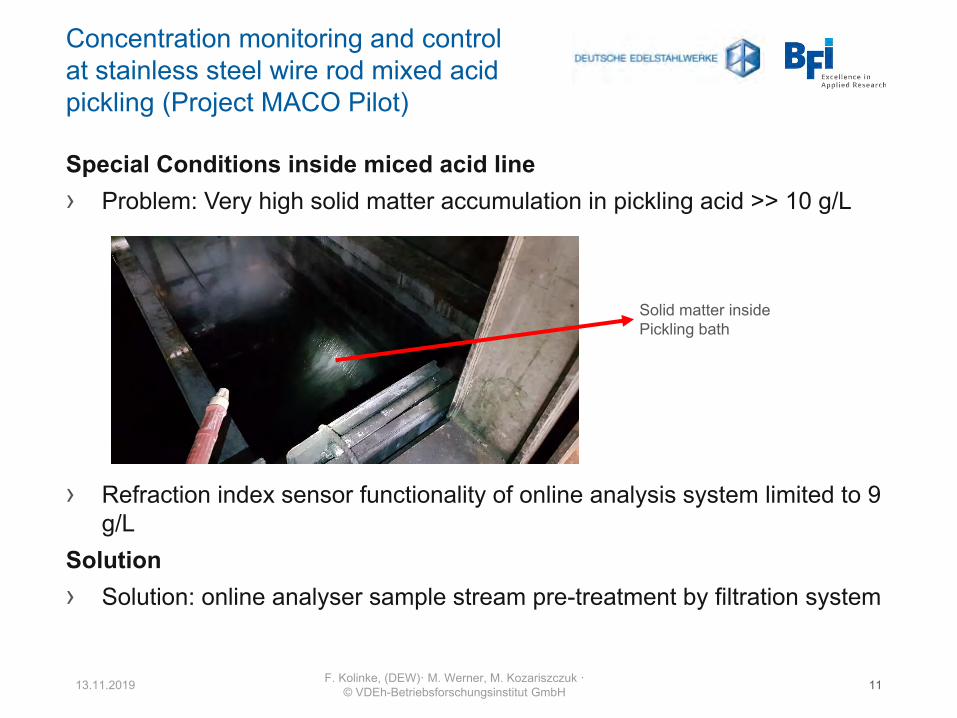
Special Conditions inside miced acid line› Problem: Very high solid matter accumulation in pickling acid >> 10 g/L
› Refraction index sensor functionality of online analysis system limited to 9 g/L
Solution› Solution: online analyser sample stream pre-treatment by filtration system
13.11.2019 11
Solid matter insidePickling bath
F. Kolinke, (DEW)· M. Werner, M. Kozariszczuk · © VDEh-Betriebsforschungsinstitut GmbH
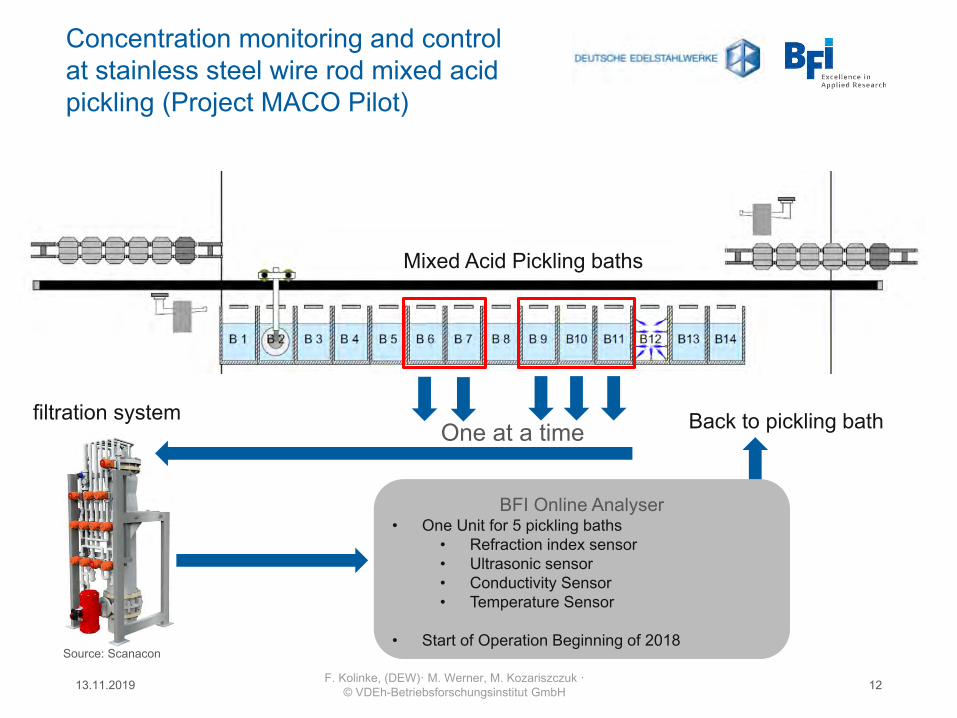
Concentration monitoring and control at stainless steel wire rod mixed acid pickling (Project MACO Pilot)
13.11.2019 12F. Kolinke, (DEW)· M. Werner, M. Kozariszczuk · © VDEh-Betriebsforschungsinstitut GmbH
Source: Scanacon
filtration system
Mixed Acid Pickling baths
One at a time
BFI Online Analyser• One Unit for 5 pickling baths
• Refraction index sensor• Ultrasonic sensor• Conductivity Sensor• Temperature Sensor
• Start of Operation Beginning of 2018
Back to pickling bath
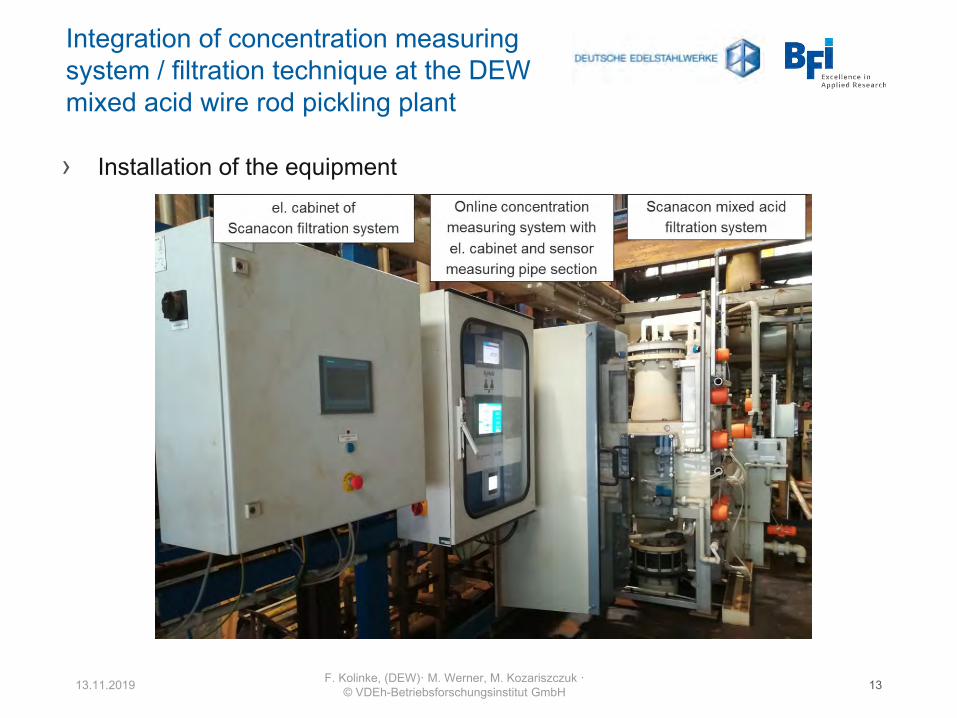
› Installation of the equipment
13.11.2019 13
Integration of concentration measuring system / filtration technique at the DEW mixed acid wire rod pickling plant
F. Kolinke, (DEW)· M. Werner, M. Kozariszczuk · © VDEh-Betriebsforschungsinstitut GmbH
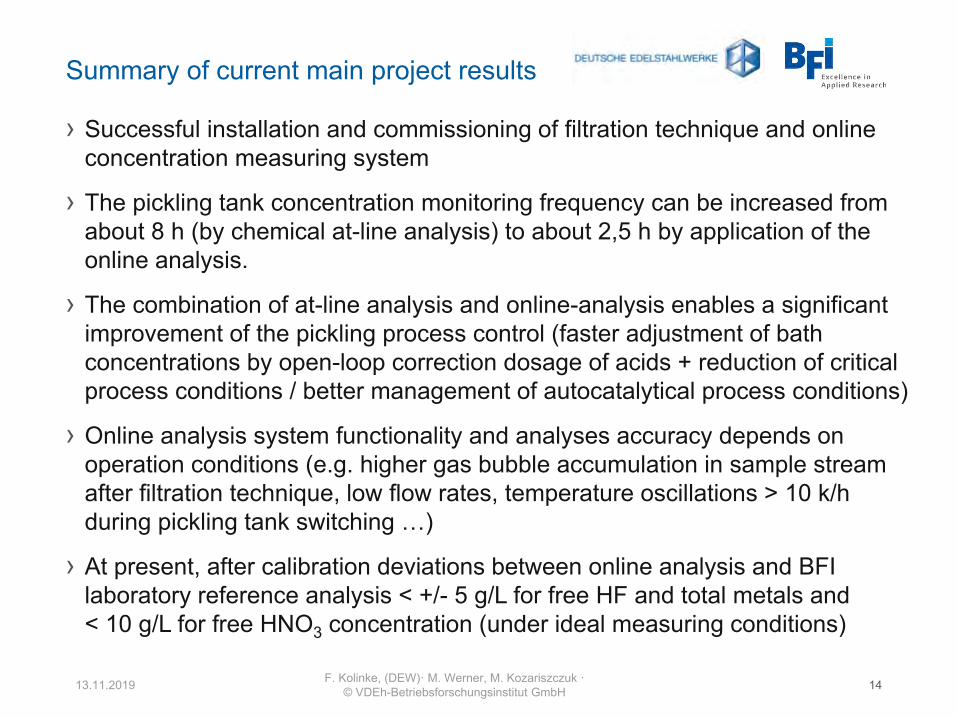
Summary of current main project results
› Successful installation and commissioning of filtration technique and online concentration measuring system
› The pickling tank concentration monitoring frequency can be increased from about 8 h (by chemical at-line analysis) to about 2,5 h by application of the online analysis.
› The combination of at-line analysis and online-analysis enables a significant improvement of the pickling process control (faster adjustment of bath concentrations by open-loop correction dosage of acids + reduction of critical process conditions / better management of autocatalytical process conditions)
› Online analysis system functionality and analyses accuracy depends on operation conditions (e.g. higher gas bubble accumulation in sample stream after filtration technique, low flow rates, temperature oscillations > 10 k/h during pickling tank switching …)
› At present, after calibration deviations between online analysis and BFI laboratory reference analysis < +/- 5 g/L for free HF and total metals and < 10 g/L for free HNO3 concentration (under ideal measuring conditions)
13.11.2019 14F. Kolinke, (DEW)· M. Werner, M. Kozariszczuk · © VDEh-Betriebsforschungsinstitut GmbH

Workshop on Pickling Solutions Technology
1
Workshop on Pickling Solutions Technology
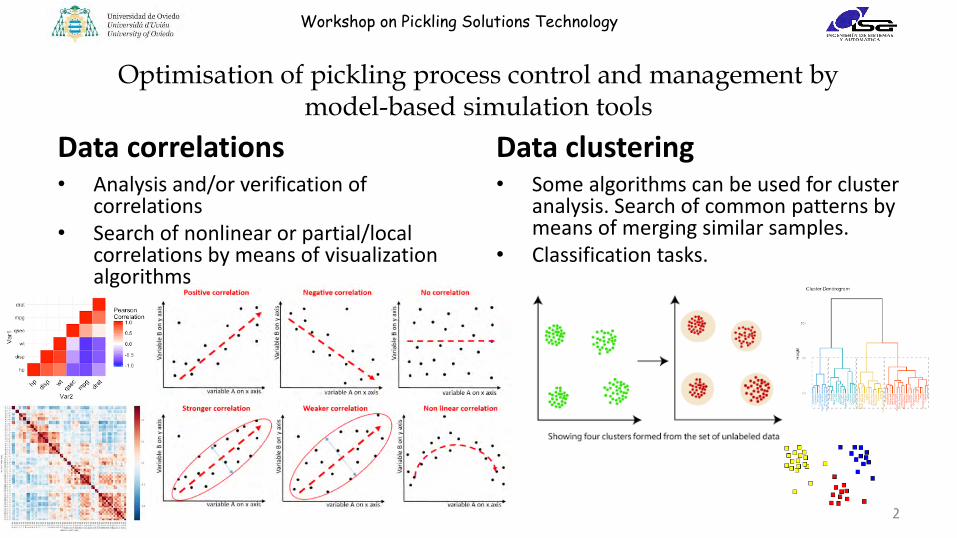
Optimisation of pickling process control and management by model-based simulation tools
University of OviedoIván Machón González
13th of November 2019, Düsseldorf
Workshop on Pickling Solutions Technology
Data correlations• Analysis and/or verification of
correlations • Search of nonlinear or partial/local
correlations by means of visualization algorithms
Data clustering• Some algorithms can be used for cluster
analysis. Search of common patterns by means of merging similar samples.
• Classification tasks.
2
Optimisation of pickling process control and management by model-based simulation tools
Workshop on Pickling Solutions Technology
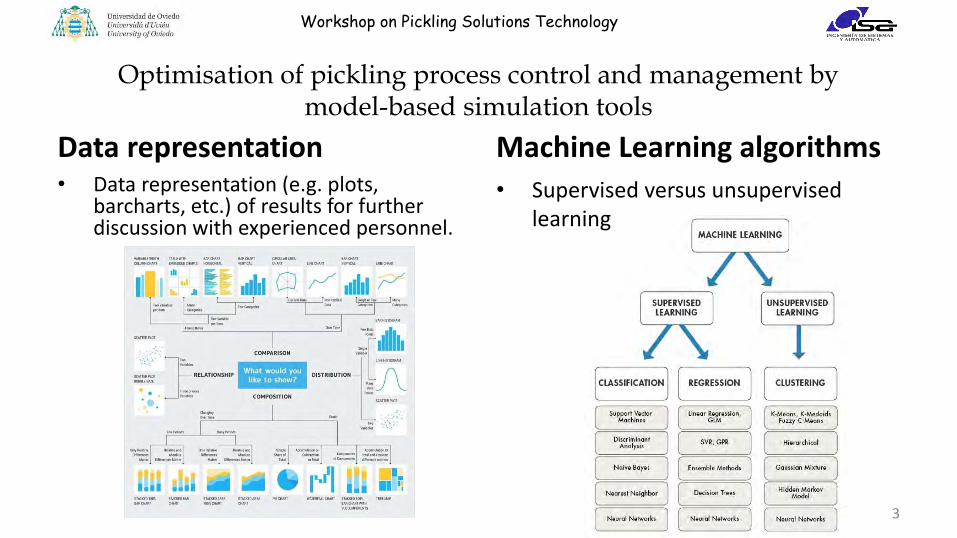
Data representation• Data representation (e.g. plots,
barcharts, etc.) of results for further discussion with experienced personnel.
Machine Learning algorithms
• Supervised versus unsupervised learning
3
Optimisation of pickling process control and management by model-based simulation tools
Workshop on Pickling Solutions Technology
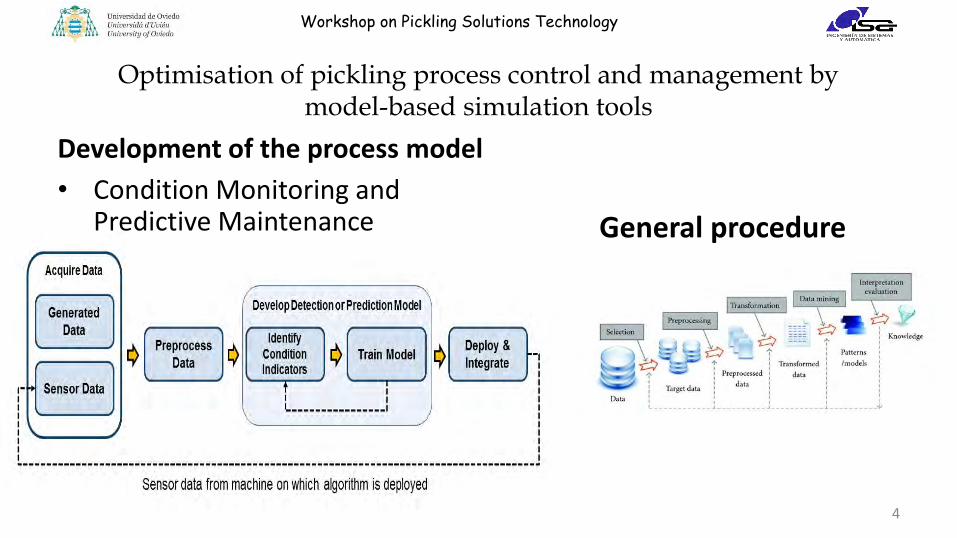
Development of the process model
• Condition Monitoring and Predictive Maintenance General procedure
4
Optimisation of pickling process control and management by model-based simulation tools
Workshop on Pickling Solutions Technology
SensorControlPilot (I)
5
• Estimation the pickling strip speed by means of a model that indicates the mean values and standard deviation of the maximum speed for different conditions in the pickling line.
• Neural Gas network as model to establish a probabilistic distribution of the pickling line speed. The main idea is to calculate the optimum strip speed of the pickling line given the remaining process variables. Data from the hot rolling mill and the pickling line were used.
• Two different trained models were considered depending on the material destination: chromium or tin.
• The aim is to obtain a set of prototypes of coils by the application of this kind of algorithms. These prototypes are synthesizing all the information of the coils and they can be used to estimate the optimum strip speed of the pickling line.
Workshop on Pickling Solutions Technology
SensorControlPilot (II)
6
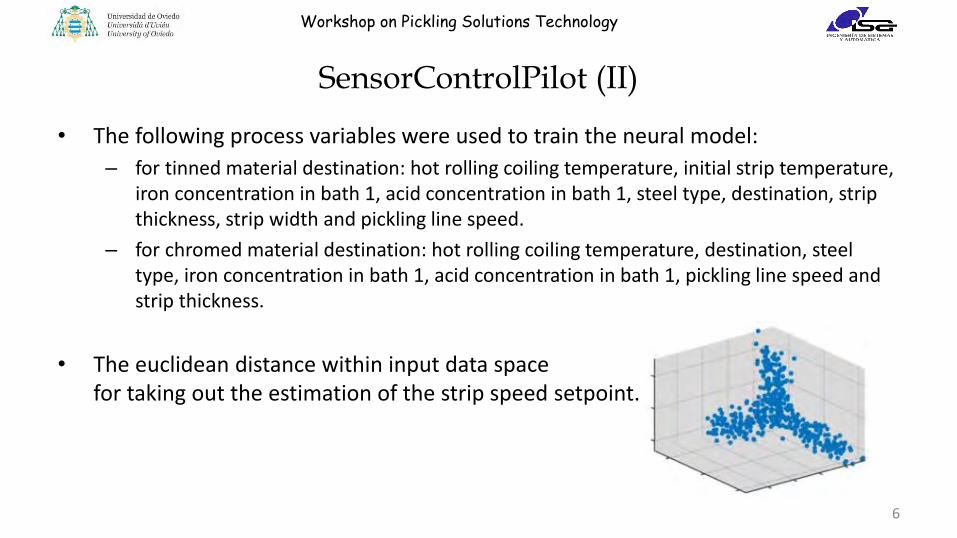
• The following process variables were used to train the neural model:
– for tinned material destination: hot rolling coiling temperature, initial strip temperature, iron concentration in bath 1, acid concentration in bath 1, steel type, destination, strip thickness, strip width and pickling line speed.
– for chromed material destination: hot rolling coiling temperature, destination, steel type, iron concentration in bath 1, acid concentration in bath 1, pickling line speed and strip thickness.
• The euclidean distance within input data space for taking out the estimation of the strip speed setpoint.
Workshop on Pickling Solutions Technology
7
Development of an innovative pickling program management model based on online data of the wire rod pickling plant process.
• Specification of the pickling dwell time before the beginning of thepickling treatment by the management software tool.
• Selection of the dip tank by means of the management model based onthe current process data for optimal pickling result.
• Simulated testing of the new pickling program management for wire rodpickling plant operation of DEW
MACOPilot
Workshop on Pickling Solutions Technology
8
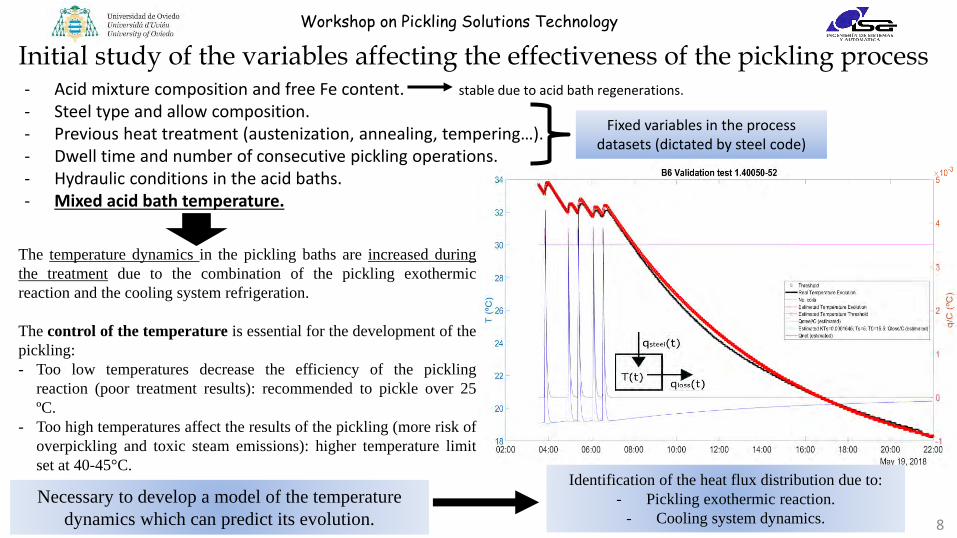
The temperature dynamics in the pickling baths are increased during
the treatment due to the combination of the pickling exothermic
reaction and the cooling system refrigeration.
The control of the temperature is essential for the development of the
pickling:
- Too low temperatures decrease the efficiency of the pickling
reaction (poor treatment results): recommended to pickle over 25
ºC.
- Too high temperatures affect the results of the pickling (more risk of
overpickling and toxic steam emissions): higher temperature limit
set at 40-45°C.
- Acid mixture composition and free Fe content. stable due to acid bath regenerations.
- Steel type and allow composition.- Previous heat treatment (austenization, annealing, tempering…).- Dwell time and number of consecutive pickling operations.- Hydraulic conditions in the acid baths.- Mixed acid bath temperature.
Initial study of the variables affecting the effectiveness of the pickling process
Fixed variables in the processdatasets (dictated by steel code)
Necessary to develop a model of the temperature
dynamics which can predict its evolution.
Identification of the heat flux distribution due to:
- Pickling exothermic reaction.
- Cooling system dynamics.
Workshop on Pickling Solutions Technology
9
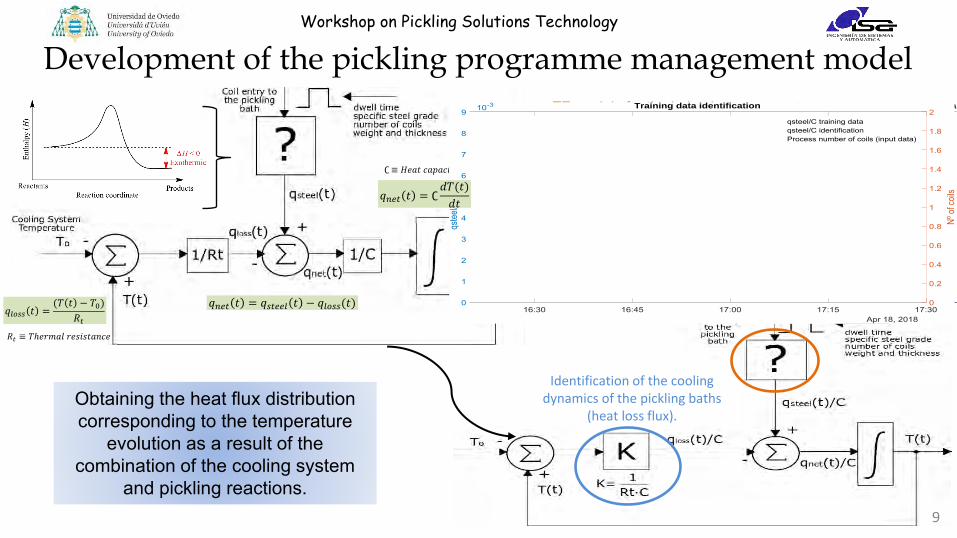
Development of the pickling programme management model
Obtaining the heat flux distribution corresponding to the temperature
evolution as a result of the combination of the cooling system
and pickling reactions.
TF models for the behaviourof the steels in the acid
exothermic reaction (picklingprocess): heat flux
distribution identification and prediction for the pickling
reaction.
Obtained by ARMAX identification concerning bathtemperature datasets for wire
rod materials.
Identification of the cooling dynamics of the pickling baths
(heat loss flux).
∁ ≡ 𝐻𝑒𝑎𝑡 𝑐𝑎𝑝𝑎𝑐𝑖𝑡𝑦
𝑅𝑡 ≡ 𝑇ℎ𝑒𝑟𝑚𝑎𝑙 𝑟𝑒𝑠𝑖𝑠𝑡𝑎𝑛𝑐𝑒
𝑞𝑙𝑜𝑠𝑠 𝑡 =(𝑇 𝑡 − 𝑇0)
𝑅𝑡
16:30 16:45 17:00 17:15 17:30Apr 18, 2018
0
1
2
3
4
5
6
7
8
9
qstee
l/C (º
C)
10-3
0
0.2
0.4
0.6
0.8
1
1.2
1.4
1.6
1.8
2
Nº of
coils
Training data identification
qsteel/C training dataqsteel/C identificationProcess number of coils (input data)
16:30 16:45 17:00 17:15 17:30Apr 18, 2018
0
1
2
3
4
5
6
7
8
9
qstee
l/C (º
C)
10-3
0
0.2
0.4
0.6
0.8
1
1.2
1.4
1.6
1.8
2
Nº of
coils
Training data identification
qsteel/C training dataqsteel/C identificationProcess number of coils (input data)
𝑞𝑛𝑒𝑡 𝑡 = ∁𝑑𝑇(𝑡)
𝑑𝑡
𝑞𝑛𝑒𝑡 𝑡 = 𝑞𝑠𝑡𝑒𝑒𝑙 𝑡 − 𝑞𝑙𝑜𝑠𝑠(𝑡)
Workshop on Pickling Solutions Technology
10
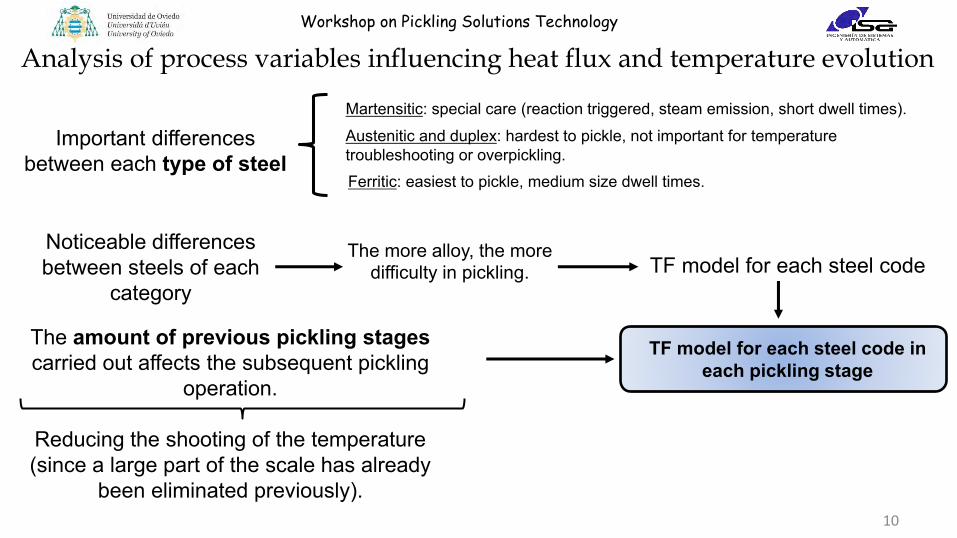
Analysis of process variables influencing heat flux and temperature evolution
Important differences between each type of steel
Martensitic: special care (reaction triggered, steam emission, short dwell times).Austenitic and duplex: hardest to pickle, not important for temperature troubleshooting or overpickling.Ferritic: easiest to pickle, medium size dwell times.
Noticeable differences between steels of each
categoryTF model for each steel code
The amount of previous pickling stages carried out affects the subsequent pickling
operation.
Reducing the shooting of the temperature (since a large part of the scale has already
been eliminated previously).
TF model for each steel code in each pickling stage
The more alloy, the more difficulty in pickling.
Workshop on Pickling Solutions Technology
11
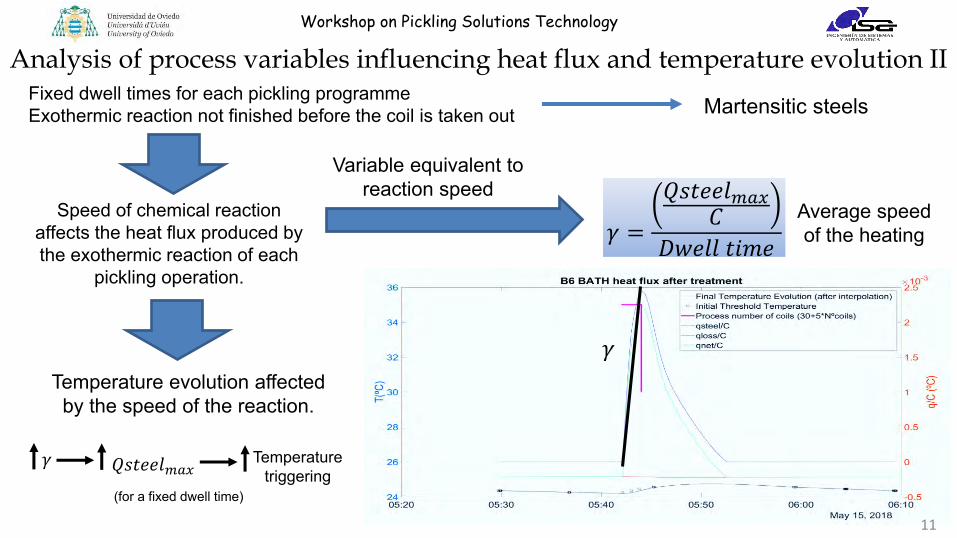
Analysis of process variables influencing heat flux and temperature evolution IIFixed dwell times for each pickling programmeExothermic reaction not finished before the coil is taken out
Speed of chemical reaction affects the heat flux produced by the exothermic reaction of each
pickling operation.
Variable equivalent to reaction speed
𝛾 =
𝑄𝑠𝑡𝑒𝑒𝑙𝑚𝑎𝑥𝐶
𝐷𝑤𝑒𝑙𝑙 𝑡𝑖𝑚𝑒
𝛾
Temperature evolution affected by the speed of the reaction.
𝛾 𝑄𝑠𝑡𝑒𝑒𝑙𝑚𝑎𝑥Temperature
triggering(for a fixed dwell time)
Average speed of the heating
Martensitic steels
Workshop on Pickling Solutions Technology
12
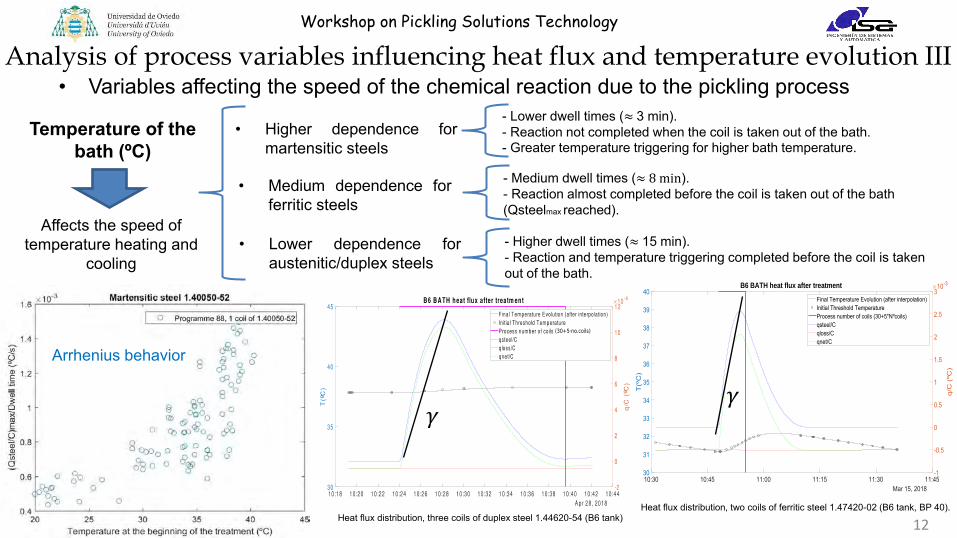
Analysis of process variables influencing heat flux and temperature evolution III• Variables affecting the speed of the chemical reaction due to the pickling process
Temperature of the bath (ºC)
• Higher dependence formartensitic steels
- Lower dwell times (≈ 3 min).- Reaction not completed when the coil is taken out of the bath.- Greater temperature triggering for higher bath temperature.
• Lower dependence foraustenitic/duplex steels
- Higher dwell times (≈ 15 min).- Reaction and temperature triggering completed before the coil is taken out of the bath.
Affects the speed of temperature heating and
cooling
• Medium dependence forferritic steels
- Medium dwell times (≈ 8 min).- Reaction almost completed before the coil is taken out of the bath (Qsteelmax reached).
10:30 10:45 11:00 11:15 11:30 11:45Mar 15, 2018
30
31
32
33
34
35
36
37
38
39
40
T(º
C)
-1
-0.5
0
0.5
1
1.5
2
2.5
3
q/C
(ºC
)
10-3B6 BATH heat flux after treatment
Final Temperature Evolution (after interpolation)Initial Threshold TemperatureProcess number of coils (30+5*Nºcoils)qsteel/Cqloss/Cqnet/C
Heat flux distribution, three coils of duplex steel 1.44620-54 (B6 tank)Heat flux distribution, two coils of ferritic steel 1.47420-02 (B6 tank, BP 40).
𝛾𝛾
Arrhenius behavior
Workshop on Pickling Solutions Technology
13
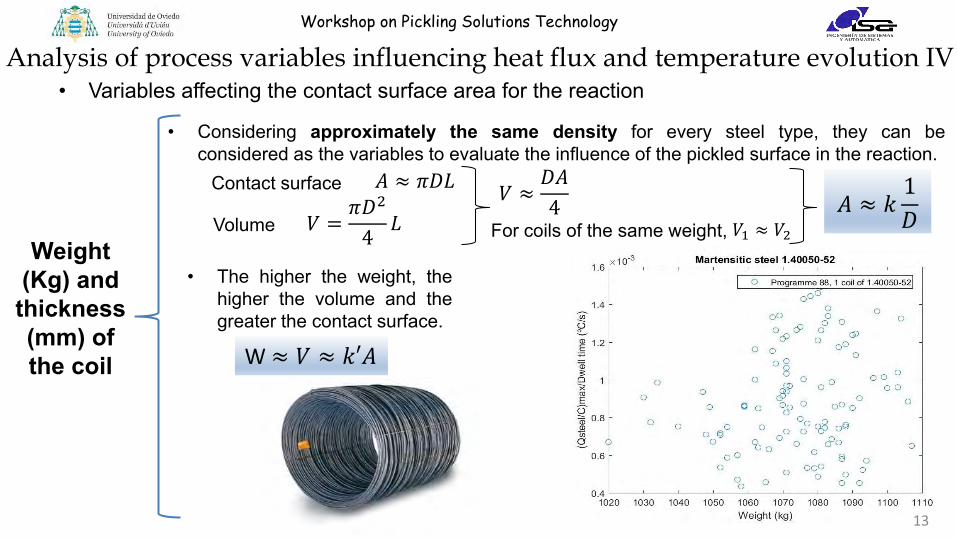
Analysis of process variables influencing heat flux and temperature evolution IV• Variables affecting the contact surface area for the reaction
Weight (Kg) and
thickness (mm) of the coil
• Considering approximately the same density for every steel type, they can beconsidered as the variables to evaluate the influence of the pickled surface in the reaction.
𝐴 ≈ 𝜋𝐷𝐿
𝑉 =𝜋𝐷2
4𝐿
Contact surface
Volume𝑉 ≈
𝐷𝐴
4For coils of the same weight, 𝑉1 ≈ 𝑉2
𝐴 ≈ 𝑘1
𝐷
• The higher the weight, thehigher the volume and thegreater the contact surface.
W ≈ 𝑉 ≈ 𝑘′𝐴
Workshop on Pickling Solutions Technology
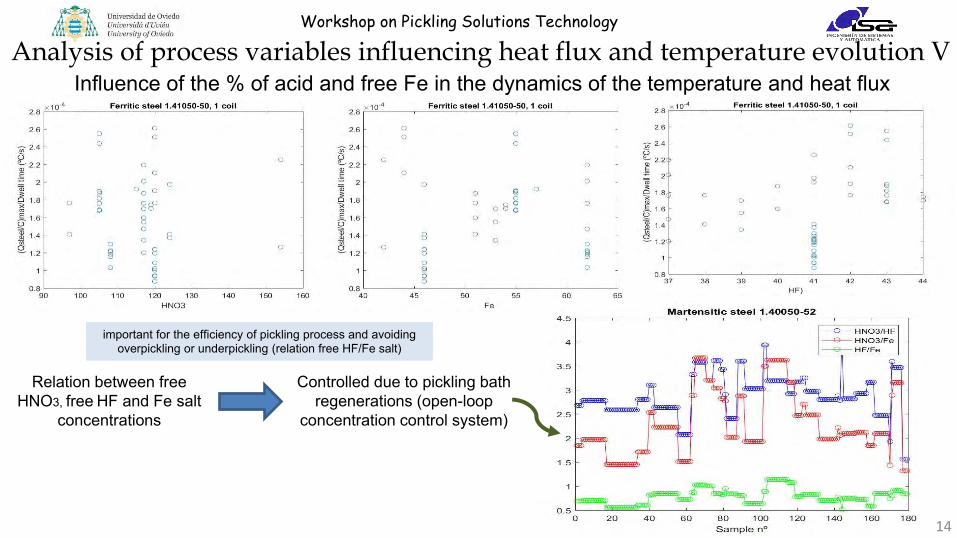
Influence of the % of acid and free Fe in the dynamics of the temperature and heat fluxAnalysis of process variables influencing heat flux and temperature evolution V
14
Relation between free HNO3, free HF and Fe salt
concentrations
Controlled due to pickling bath regenerations (open-loop
concentration control system)
important for the efficiency of pickling process and avoiding overpickling or underpickling (relation free HF/Fe salt)

Workshop on Pickling Solutions Technology
16:30 16:45 17:00 17:15 17:30Apr 18, 2018
0
1
2
3
4
5
6
7
8
9
qstee
l/C (º
C)
10-3
0
0.2
0.4
0.6
0.8
1
1.2
1.4
1.6
1.8
2
Nº of
coils
Training data identification
qsteel/C training dataqsteel/C identificationProcess number of coils (input data)
15
- Splitting the data to form a training dataset representative for the qsteel(t)/Cheat flux triggered by the exothermic reaction of each steel gradeconcerning the pickling stage.
- qsteel(t)/C is standardized per unit of weight and thickness.
- Establish zones of linear behavior regarding bath temperature ranges forwhich the qsteel(t)/C heat flux is obtained.
- Input variables: number of coils introduced for a single pickling operation,dwell time, weight and thickness of the coil.
- Identification application: ARMAX model for thedynamics of the pickling process.
Obtaining the pickling TF models (Identification of the heat flux due to the pickling reaction)
Martensitic steel 1.40052-52 Stage 1 of pickling programmes 88 and 89
Model obtained for each steel and each pickling stage.
Composed of a set of bath temperature ranges for which a transfer function is
established.
Workshop on Pickling Solutions Technology
16
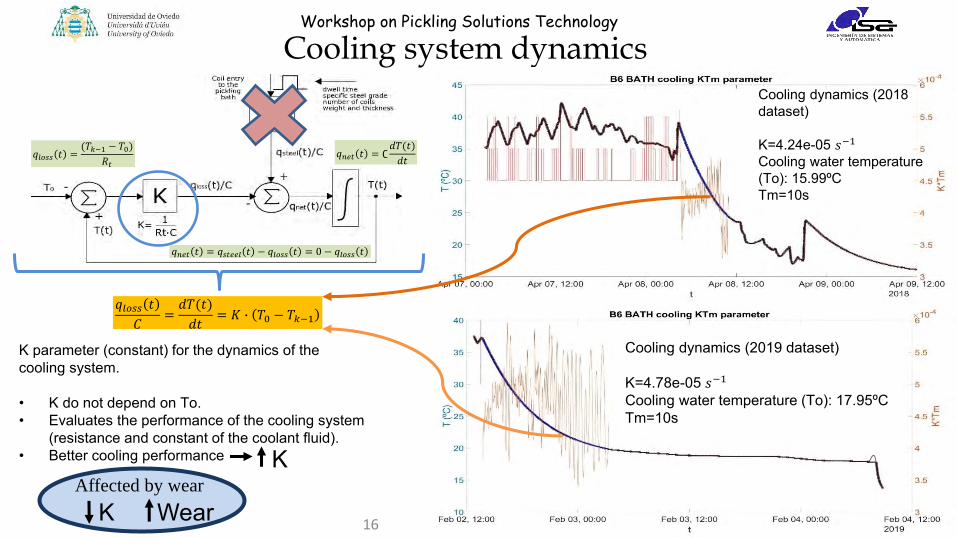
Cooling system dynamics
Cooling dynamics (2019 dataset)
K=4.78e-05 𝑠−1
Cooling water temperature (To): 17.95ºCTm=10s
K parameter (constant) for the dynamics of the cooling system.
• K do not depend on To.• Evaluates the performance of the cooling system
(resistance and constant of the coolant fluid).• Better cooling performance
Affected by wear
K Wear
Cooling dynamics (2018 dataset)
K=4.24e-05 𝑠−1
Cooling water temperature (To): 15.99ºCTm=10s
K
𝑞𝑛𝑒𝑡 𝑡 = ∁𝑑𝑇(𝑡)
𝑑𝑡
𝑞𝑛𝑒𝑡 𝑡 = 𝑞𝑠𝑡𝑒𝑒𝑙 𝑡 − 𝑞𝑙𝑜𝑠𝑠 𝑡 = 0 − 𝑞𝑙𝑜𝑠𝑠 𝑡
𝑞𝑙𝑜𝑠𝑠 𝑡 =(𝑇𝑘−1 − 𝑇0)
𝑅𝑡
𝑞𝑙𝑜𝑠𝑠 𝑡
𝐶=
𝑑𝑇(𝑡)
𝑑𝑡= 𝐾 ∙ 𝑇0 − 𝑇𝑘−1
Workshop on Pickling Solutions Technology
17
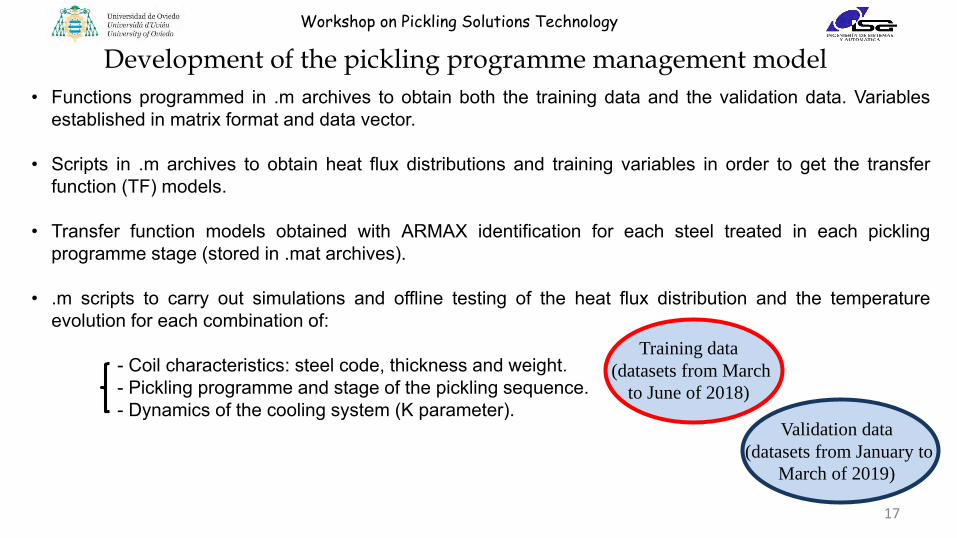
Development of the pickling programme management model
• Functions programmed in .m archives to obtain both the training data and the validation data. Variablesestablished in matrix format and data vector.
• Scripts in .m archives to obtain heat flux distributions and training variables in order to get the transferfunction (TF) models.
• Transfer function models obtained with ARMAX identification for each steel treated in each picklingprogramme stage (stored in .mat archives).
• .m scripts to carry out simulations and offline testing of the heat flux distribution and the temperatureevolution for each combination of:
- Coil characteristics: steel code, thickness and weight.- Pickling programme and stage of the pickling sequence.- Dynamics of the cooling system (K parameter).
Validation data
(datasets from January to
March of 2019)
Training data
(datasets from March
to June of 2018)
Workshop on Pickling Solutions Technology
1815:00 16:00 17:00 18:00 19:00 20:00 21:00 22:00 23:00 00:00
Jan 30, 2019
25
26
27
28
29
30
31
32
T (ºC
)
-1
0
1
2
3
4
5
q/C (º
C)
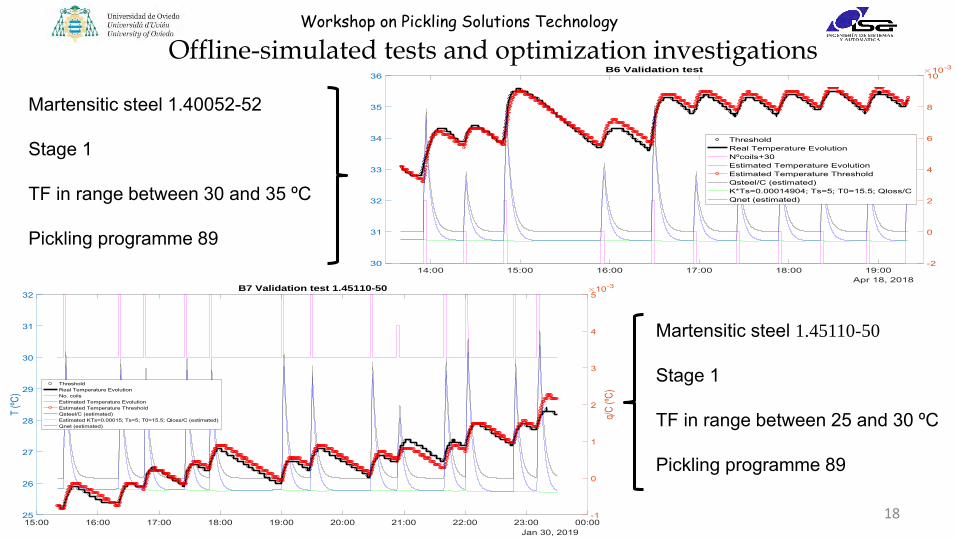
10-3B7 Validation test 1.45110-50
ThresholdReal Temperature EvolutionNo. coilsEstimated Temperature EvolutionEstimated Temperature ThresholdQsteel/C (estimated)Estimated KTs=0.00015; Ts=5; T0=15.5; Qloss/C (estimated)Qnet (estimated)
Martensitic steel 1.45110-50
Stage 1
TF in range between 25 and 30 ºC
Pickling programme 89
14:00 15:00 16:00 17:00 18:00 19:00Apr 18, 2018
30
31
32
33
34
35
36
-2
0
2
4
6
8
1010-3B6 Validation test
ThresholdReal Temperature EvolutionNºcoils+30Estimated Temperature EvolutionEstimated Temperature ThresholdQsteel/C (estimated)K*Ts=0.00014904; Ts=5; T0=15.5; Qloss/CQnet (estimated)
Martensitic steel 1.40052-52
Stage 1
TF in range between 30 and 35 ºC
Pickling programme 89
Offline-simulated tests and optimization investigations
Workshop on Pickling Solutions Technology
19
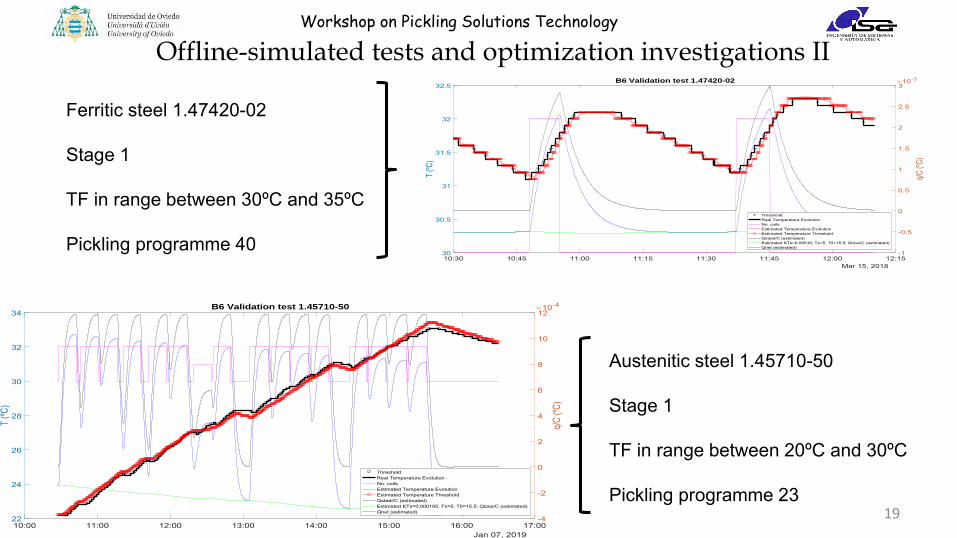
Offline-simulated tests and optimization investigations II
10:00 11:00 12:00 13:00 14:00 15:00 16:00 17:00Jan 07, 2019
22
24
26
28
30
32
34
T (ºC
)
-4
-2
0
2
4
6
8
10
12
q/C (º
C)
10-4B6 Validation test 1.45710-50
ThresholdReal Temperature EvolutionNo. coilsEstimated Temperature EvolutionEstimated Temperature ThresholdQsteel/C (estimated)Estimated KTs=0.000105; Ts=5; T0=15.5; Qloss/C (estimated)Qnet (estimated)
Ferritic steel 1.47420-02
Stage 1
TF in range between 30ºC and 35ºC
Pickling programme 40
Austenitic steel 1.45710-50
Stage 1
TF in range between 20ºC and 30ºC
Pickling programme 23
10:30 10:45 11:00 11:15 11:30 11:45 12:00 12:15Mar 15, 2018
30
30.5
31
31.5
32
32.5
T (ºC
)
-1
-0.5
0
0.5
1
1.5
2
2.5
3
q/C (º
C)
10-3B6 Validation test 1.47420-02
ThresholdReal Temperature EvolutionNo. coilsEstimated Temperature EvolutionEstimated Temperature ThresholdQsteel/C (estimated)Estimated KTs=0.00016; Ts=5; T0=15.5; Qloss/C (estimated)Qnet (estimated)
Workshop on Pickling Solutions Technology
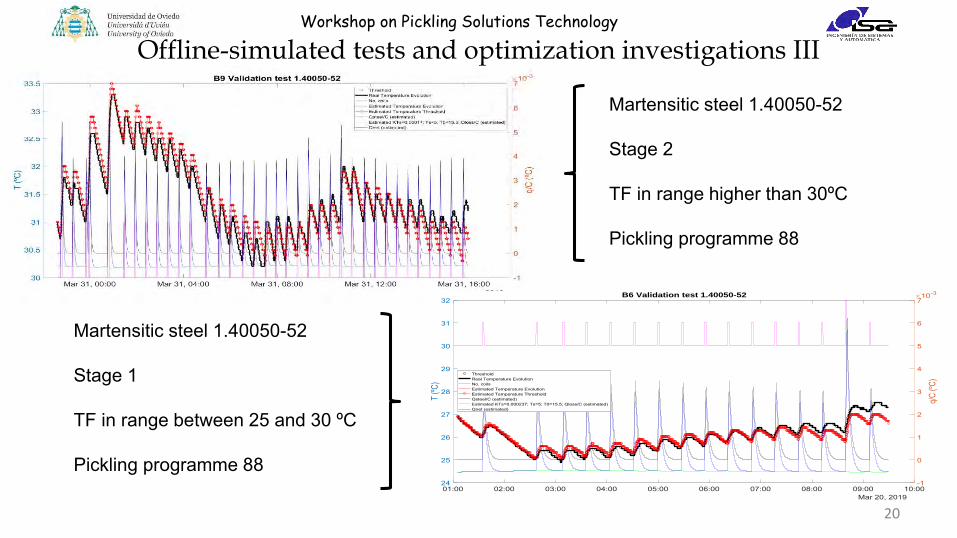
20
Martensitic steel 1.40050-52
Stage 2
TF in range higher than 30ºC
Pickling programme 88
01:00 02:00 03:00 04:00 05:00 06:00 07:00 08:00 09:00 10:00Mar 20, 2019
24
25
26
27
28
29
30
31
32
T (ºC
)
-1
0
1
2
3
4
5
6
7
q/C (º
C)
10-3B6 Validation test 1.40050-52
ThresholdReal Temperature EvolutionNo. coilsEstimated Temperature EvolutionEstimated Temperature ThresholdQsteel/C (estimated)Estimated KTs=0.000237; Ts=5; T0=15.5; Qloss/C (estimated)Qnet (estimated)
Martensitic steel 1.40050-52
Stage 1
TF in range between 25 and 30 ºC
Pickling programme 88
Offline-simulated tests and optimization investigations III
Workshop on Pickling Solutions Technology
21
Establishment of the platform for the online modelThe online model (GUI application) is programmed under Matlab environment andcan be run as a script (.m file).
- Functions and complementary scripts programmed in .m files (modifications must be carried out inMatlab environment).
- Transfer function models obtained with ARMAX identification for each steel established as .matarchives.
- Editable .xlsx file including the pickling programme characterization (BEIZPROGRAMM.xlsx).
The GUI application can be run outside Matlab environment (standalone application).
- Executable file .exe included in the same folder as the model files (.mat) for the stainless steels andthe BEIZPROGRAMM.xlsx.
- User-friendly graphical interface with multiple options to simulate and evaluate the evolution of thetemperature due to a pickling sequence.
Workshop on Pickling Solutions Technology
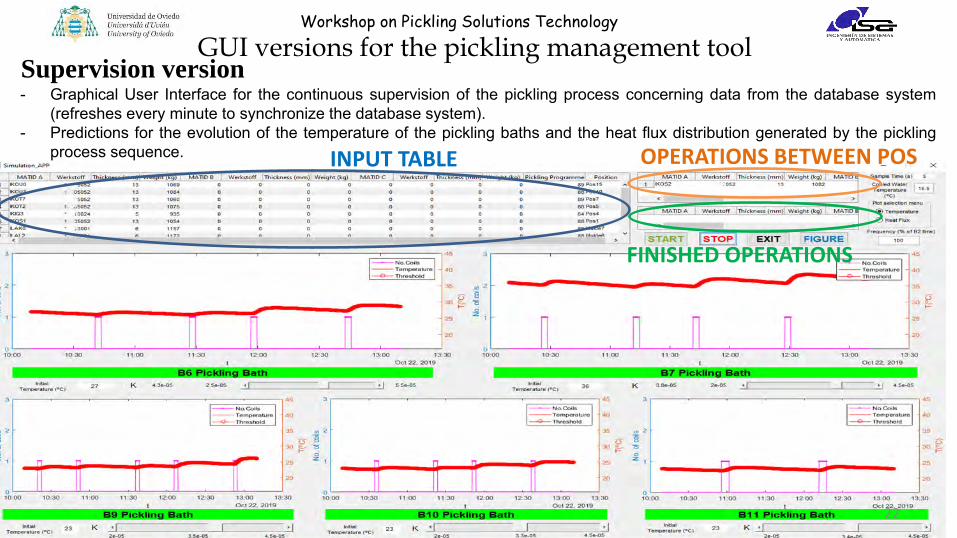
GUI versions for the pickling management toolSupervision version- Graphical User Interface for the continuous supervision of the pickling process concerning data from the database system
(refreshes every minute to synchronize the database system).- Predictions for the evolution of the temperature of the pickling baths and the heat flux distribution generated by the pickling
process sequence. INPUT TABLE
FINISHED OPERATIONS
OPERATIONS BETWEEN POS
22
Workshop on Pickling Solutions Technology
GUI versions for the pickling management tool
Supervision version
- The frequency between single operations can be increased or reduced percentage-wise.
- The figures plotted in the user interface can be changed between Temperature (temperature evolution)and Heat Flux (heat flux distribution).
- The water temperature of the cooling system can be modified regarding the current necessities.
- The temperature of the pickling baths is captured and actualized from the database system everyminute, and it is established as the initial temperature for the simulations.
- The efficiency of the cooling system (K parameter) can be increased or decreased regarding the currentnecessities for each pickling bath.
- The pickling process sequence is established avoiding overlaps between processes.
- The simulation avoids operations which are already in positions after pickling baths and does notconsider stages of the pickling already carried out.
23
Workshop on Pickling Solutions Technology
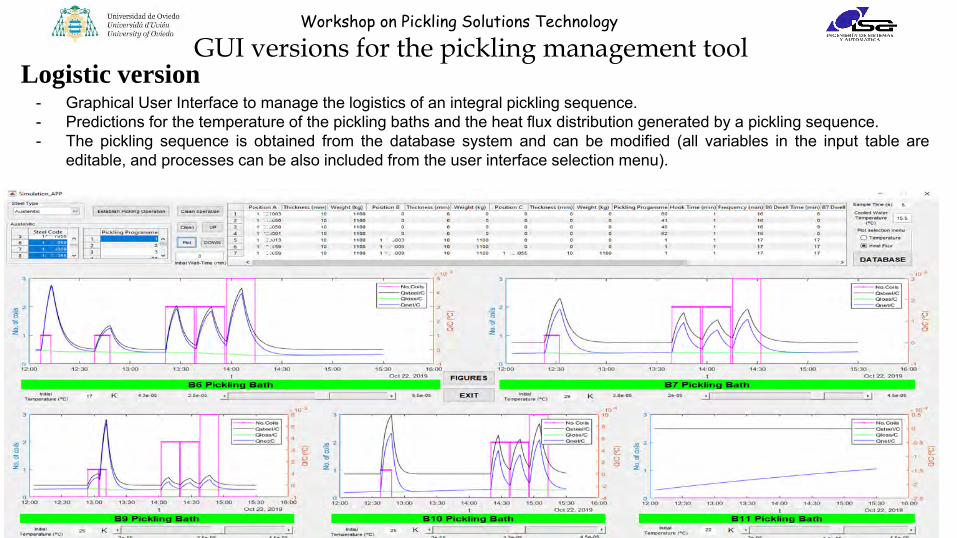
Logistic version- Graphical User Interface to manage the logistics of an integral pickling sequence.- Predictions for the temperature of the pickling baths and the heat flux distribution generated by a pickling sequence.- The pickling sequence is obtained from the database system and can be modified (all variables in the input table are
editable, and processes can be also included from the user interface selection menu).
24
GUI versions for the pickling management tool
Workshop on Pickling Solutions Technology
Logistic version
- The figures plotted in the user interface can be changed between Temperature (temperature evolution) andHeat Flux (heat flux distribution).
- The cooled water temperature of the cooling system can be modified regarding the current necessities.
- The temperature of the pickling baths is captured from the database system when the PLOT button ispressed, and it is established as the initial temperature for the simulation.
- The efficiency of the cooling system (K parameter) can be increased or decreased regarding the currentnecessities for each pickling bath.
- The pickling process sequence is established avoiding overlaps between processes. The simulations aredone considering the whole information contained in the input table and maintaining the operation orderestablished.
- Press PLOT button to carry out the simulation of temperature evolution and heat flux distribution regardingthe sequence and the information established in the input table.
25
GUI versions for the pickling management tool
Workshop on Pickling Solutions Technology
Additional characteristics
- New steel models can be added and recognized by just including them in the applicationfolder (.mat archives).
- Pickling programmes can be modified or created by editing the file“BEIZPROGRAMM.xlsx” (respecting the format and proportions of the document).
- When opening both applications, the connection to the database system is evaluated,delivering error messages when the connection fails.
- After the connection to the database system is successful, the file “BEIZPROGRAMM.xlsx”must be selected and charged to the application (a window will pop up for its selection,delivering error messages if the file selected is not “BEIZPROGRAMM.xlsx”).
26
GUI versions for the pickling management tool

Workshop on Pickling Solutions Technology
27
Thank you for your attention!
Optimisation of pickling process control and management by model-based simulation tools
University of OviedoIván Machón González
13th of November 2019, Düsseldorf

RISE Research Institutes of Sweden
MACO-PILOT - WP4
Sensor material corrosion investigations and sensor lifetime estimation
Jonas Engblom, Karin Jacobsson
November 2019
DIVISIONENHET

2
MACO Pilot
Body: EFTE coated steelTemp sensor: PTFE
Body: PFA coated steelFlange: PTFA
Body: PTFE-CPacking: FFKMLens: Sapphire glass
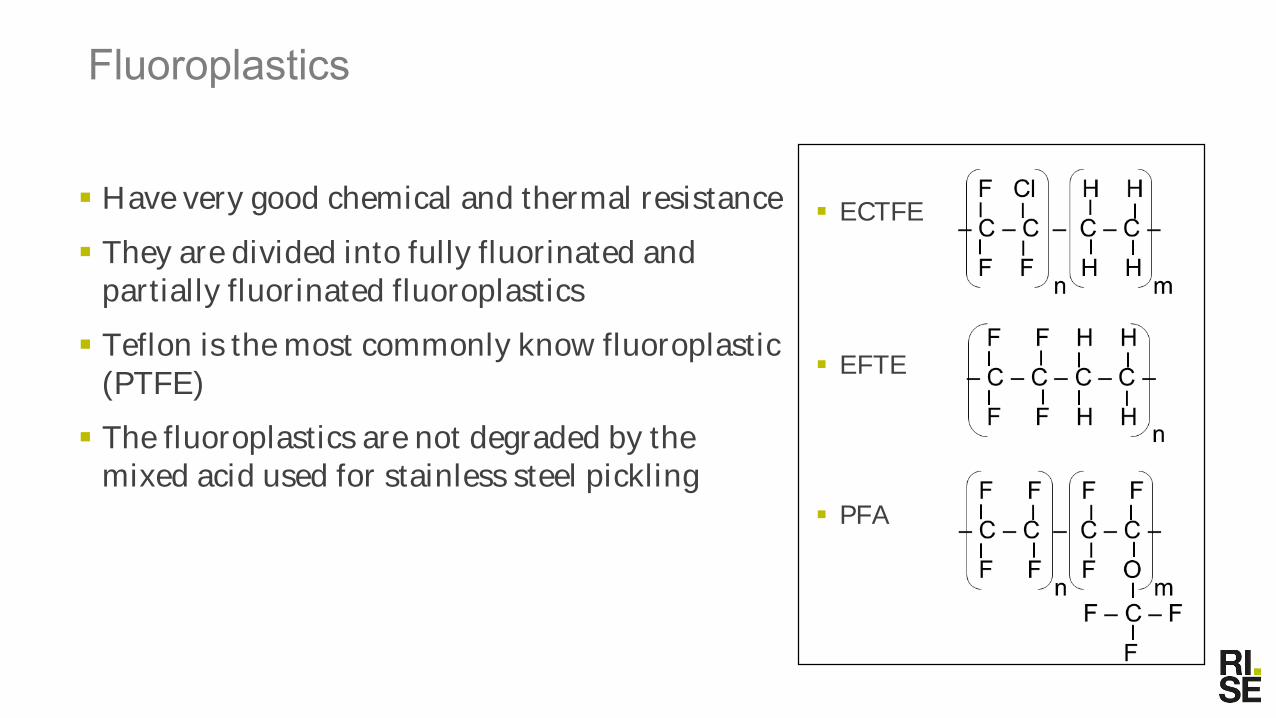
Fluoroplastics
▪ ECTFE
▪ EFTE
▪ PFA
▪ Have very good chemical and thermal resistance
▪ They are divided into fully fluorinated and partially fluorinated fluoroplastics
▪ Teflon is the most commonly know fluoroplastic (PTFE)
▪ The fluoroplastics are not degraded by the mixed acid used for stainless steel pickling
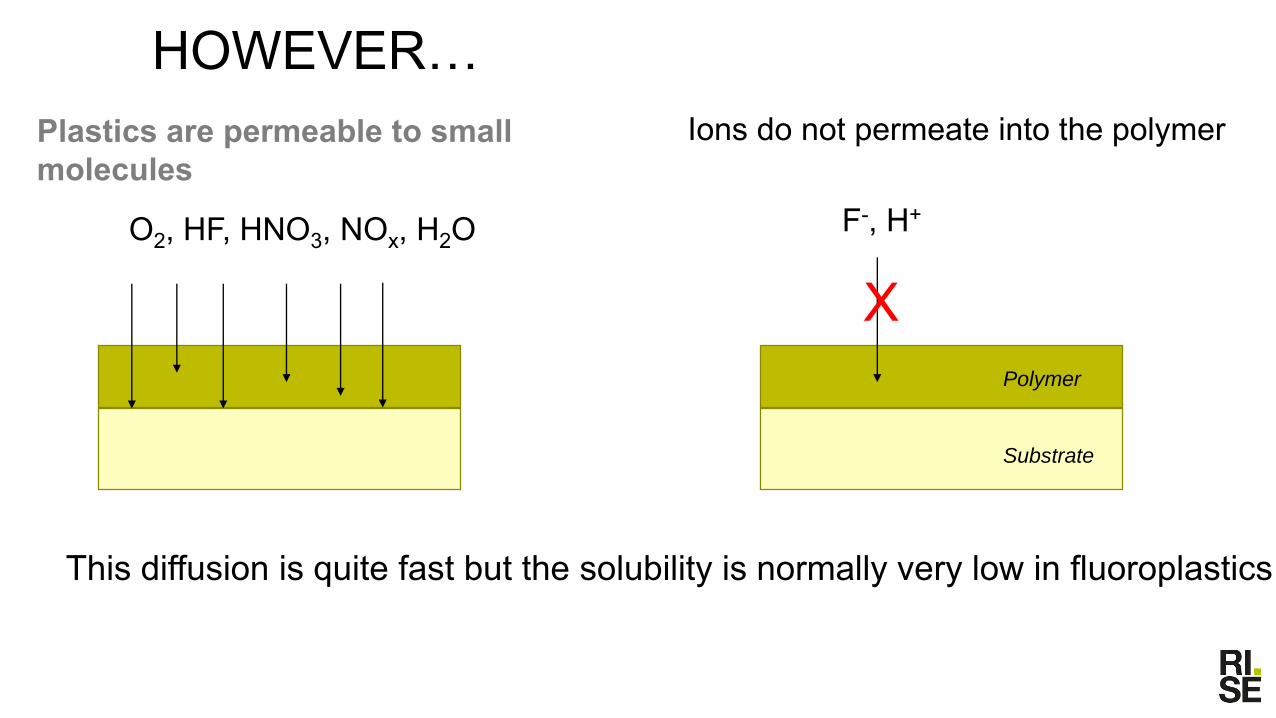
Plastics are permeable to small molecules
O2, HF, HNO3, NOx, H2O
Ions do not permeate into the polymer
F-, H+
X
This diffusion is quite fast but the solubility is normally very low in fluoroplastics
HOWEVER…
Polymer
Substrate
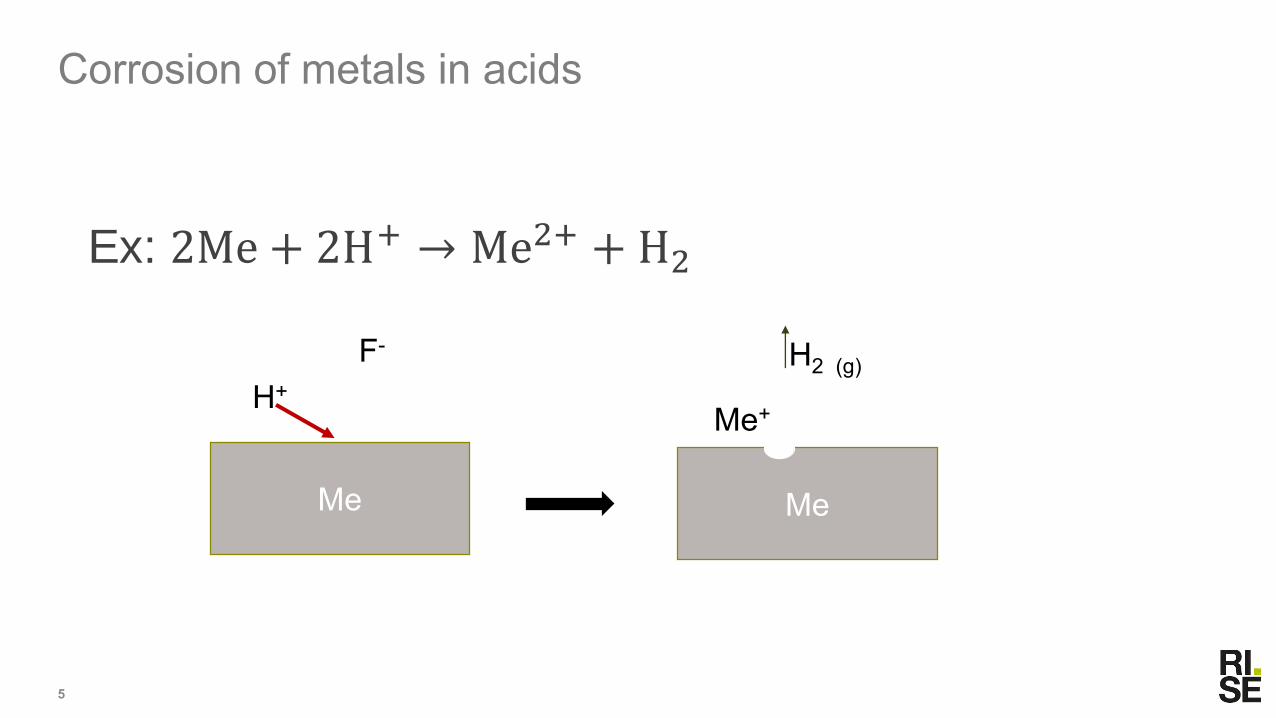
Ex: 2Me + 2H+ → Me2+ + H2
5
Corrosion of metals in acids
Me
H+
F-
Me
Me+
H2 (g)
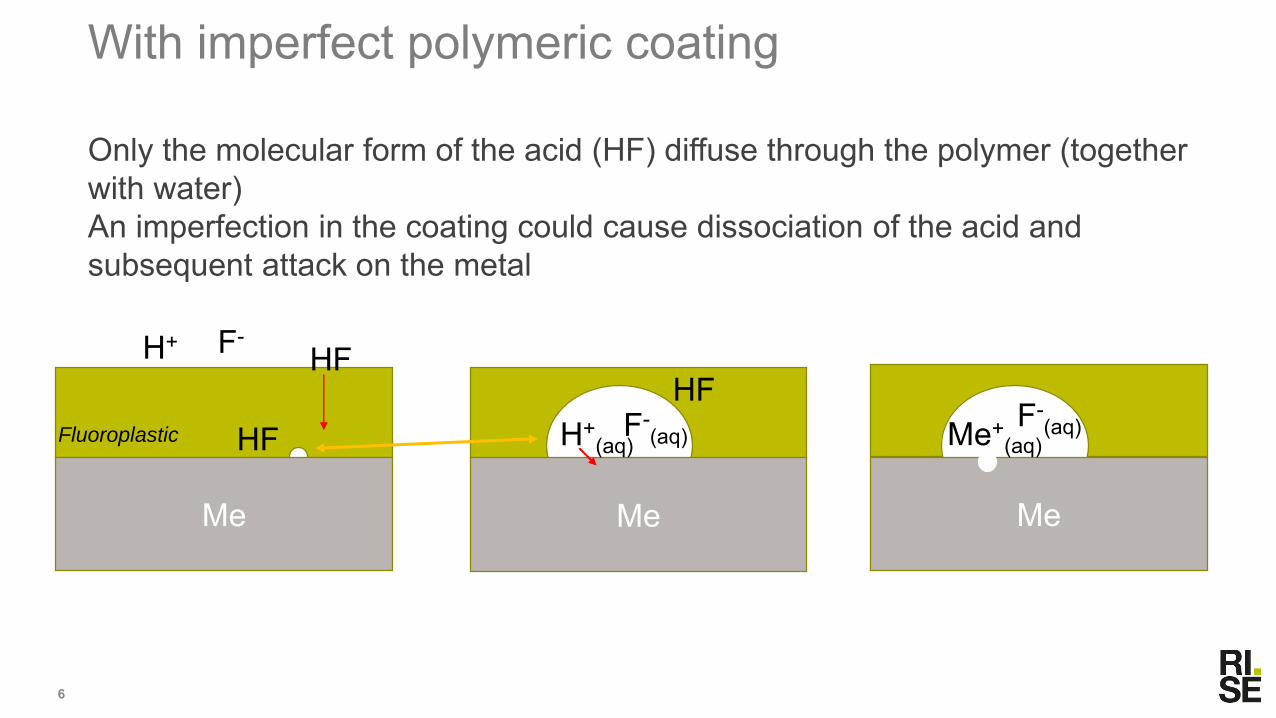
Only the molecular form of the acid (HF) diffuse through the polymer (togetherwith water)An imperfection in the coating could cause dissociation of the acid and subsequent attack on the metal
6
With imperfect polymeric coating
HF
HF
H+ F-
Fluoroplastic
Me Me
HFH+
(aq)F-
(aq)
Me
F-(aq)Me+
(aq)

Polymer coatings
Polymer
Primer
Steel
• The steel needs to be pre-treated to optimise the adhesion of the primer layer
• The primer must be optimised to have good adhesion to the steel and the polymer
• The polymer has to be modified to allow for application on the substrate
• This is different from normal polymer processing
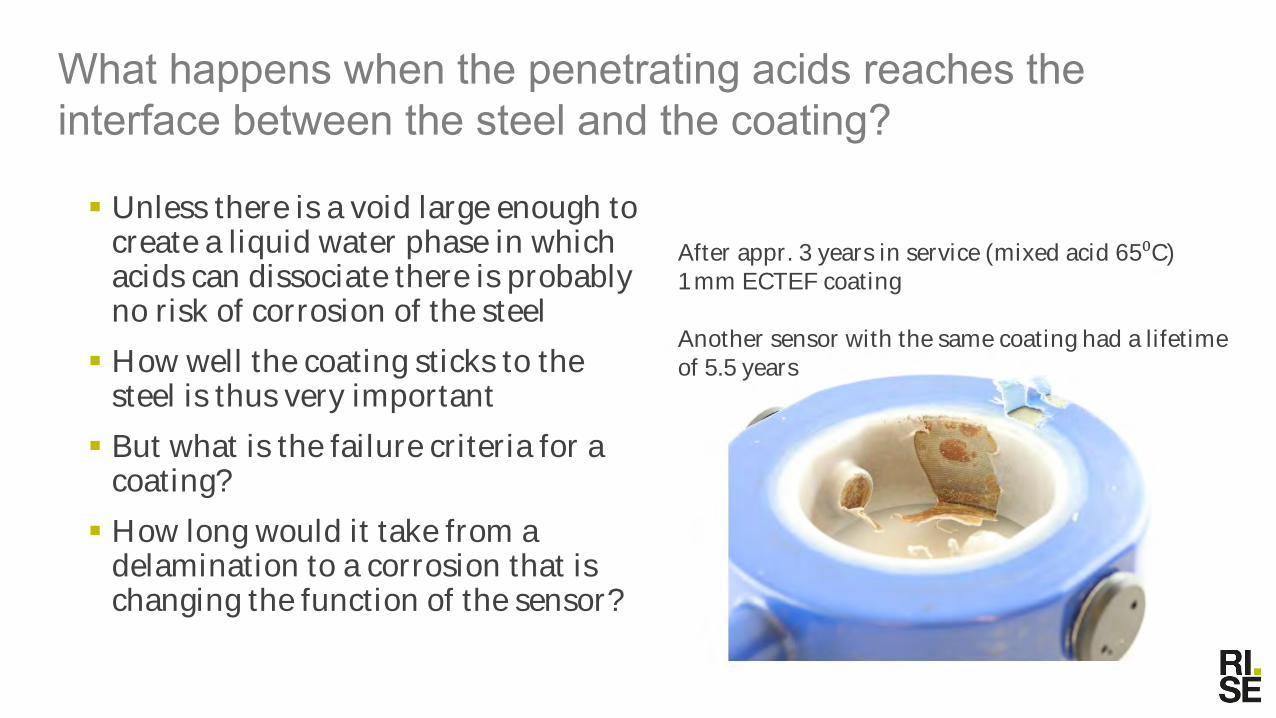
What happens when the penetrating acids reaches the interface between the steel and the coating?
▪ Unless there is a void large enough to create a liquid water phase in which acids can dissociate there is probably no risk of corrosion of the steel
▪ How well the coating sticks to the steel is thus very important
▪ But what is the failure criteria for a coating?
▪ How long would it take from a delamination to a corrosion that is changing the function of the sensor?
After appr. 3 years in service (mixed acid 65⁰C)1 mm ECTEF coating
Another sensor with the same coating had a lifetimeof 5.5 years
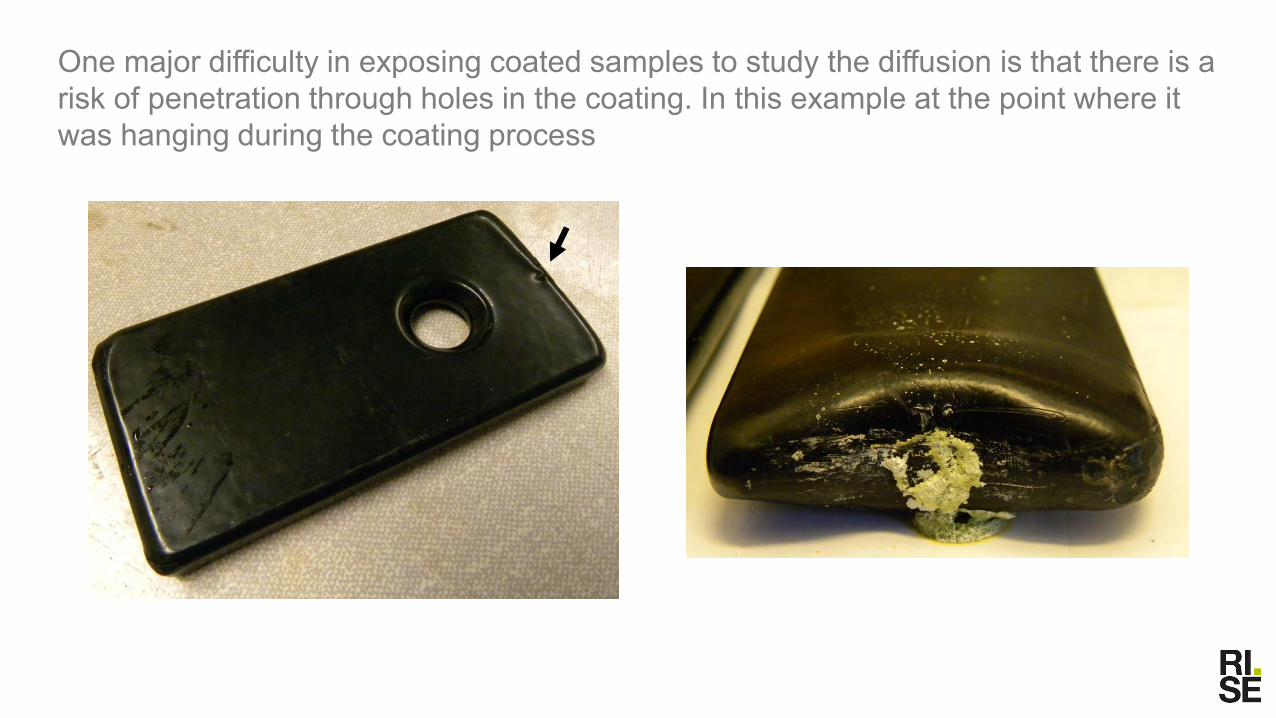
One major difficulty in exposing coated samples to study the diffusion is that there is a risk of penetration through holes in the coating. In this example at the point where it was hanging during the coating process
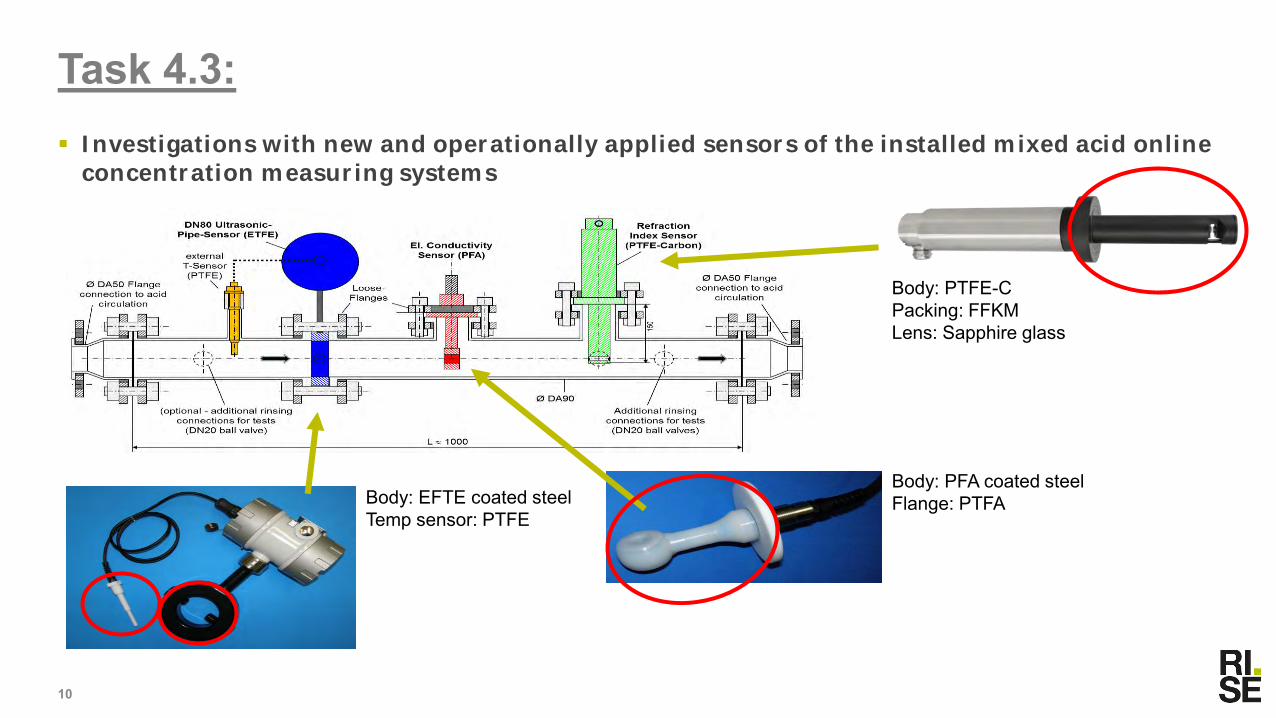
▪ Investigations with new and operationally applied sensors of the installed mixed acid online concentration measuring systems
10
Task 4.3:
Body: EFTE coated steelTemp sensor: PTFE
Body: PFA coated steelFlange: PTFA
Body: PTFE-CPacking: FFKMLens: Sapphire glass
11
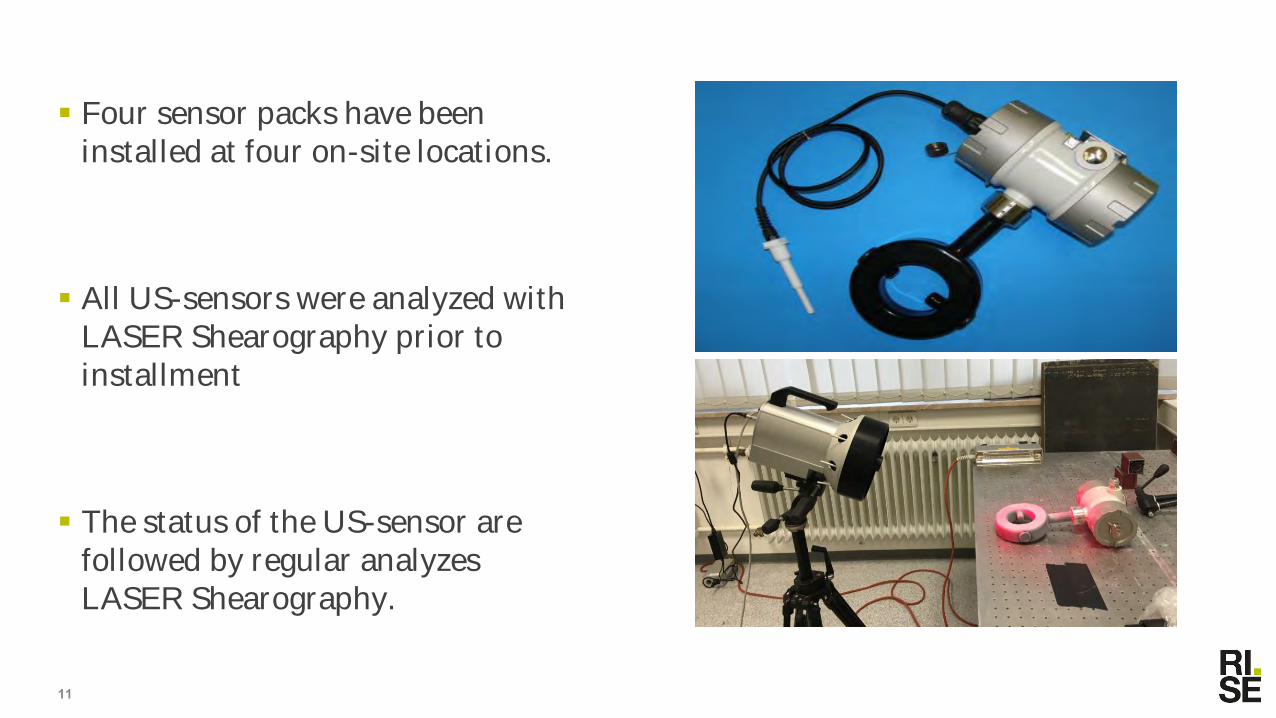
▪ Four sensor packs have beeninstalled at four on-site locations.
▪ All US-sensors were analyzed withLASER Shearography prior to installment
▪ The status of the US-sensor arefollowed by regular analyzesLASER Shearography.
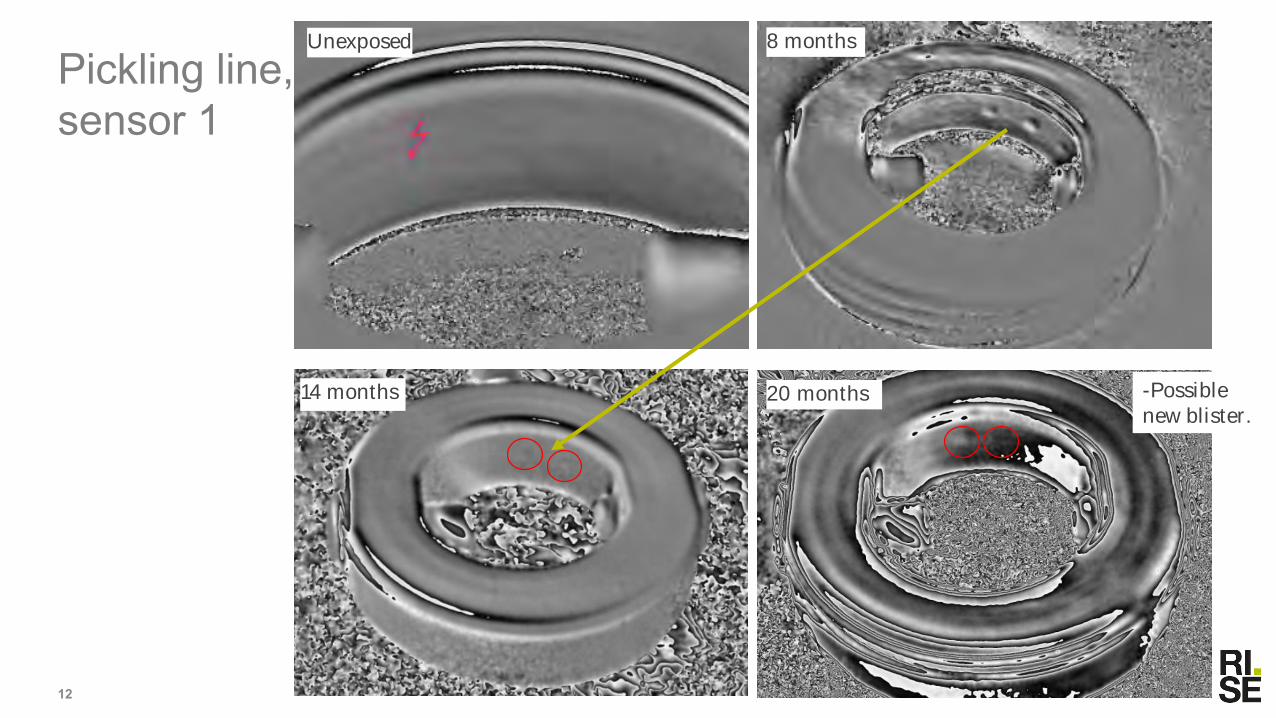
Unexposed
14 months
8 months
12
20 months
Pickling line, sensor 1
-Possiblenew blister.
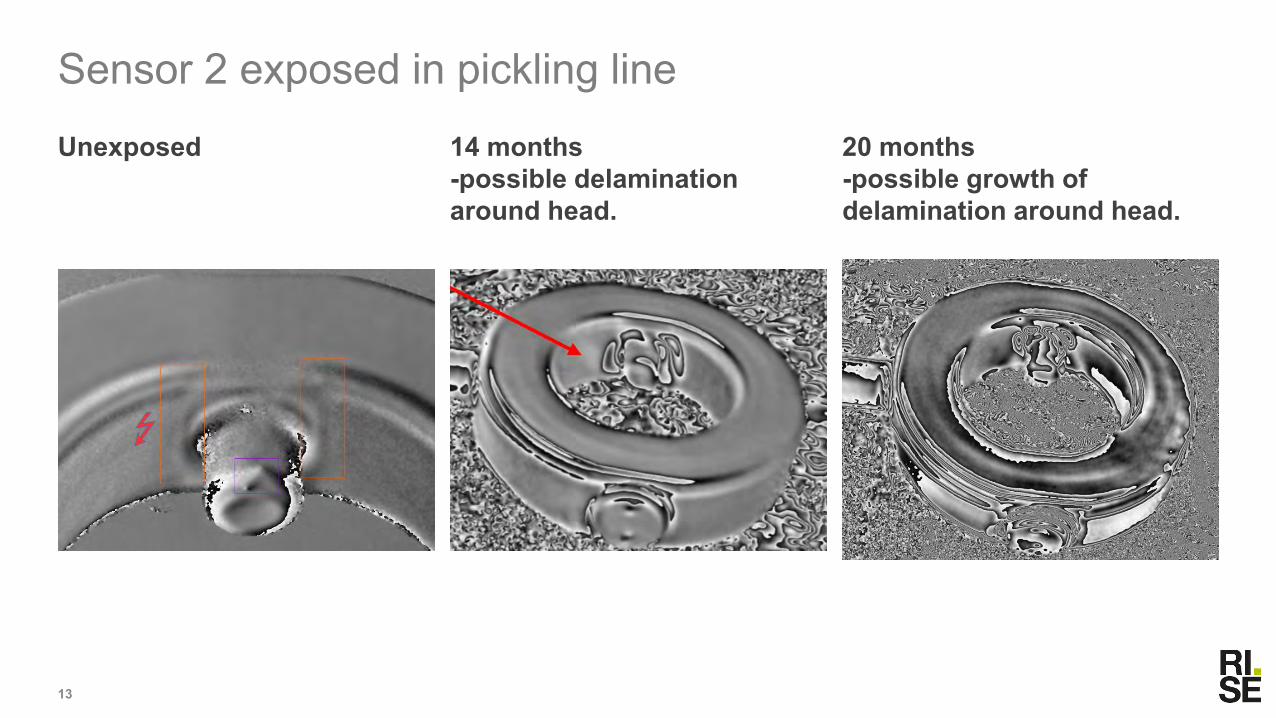
Unexposed 14 months-possible delaminationaround head.
20 months-possible growth ofdelamination around head.
13
Sensor 2 exposed in pickling line
?
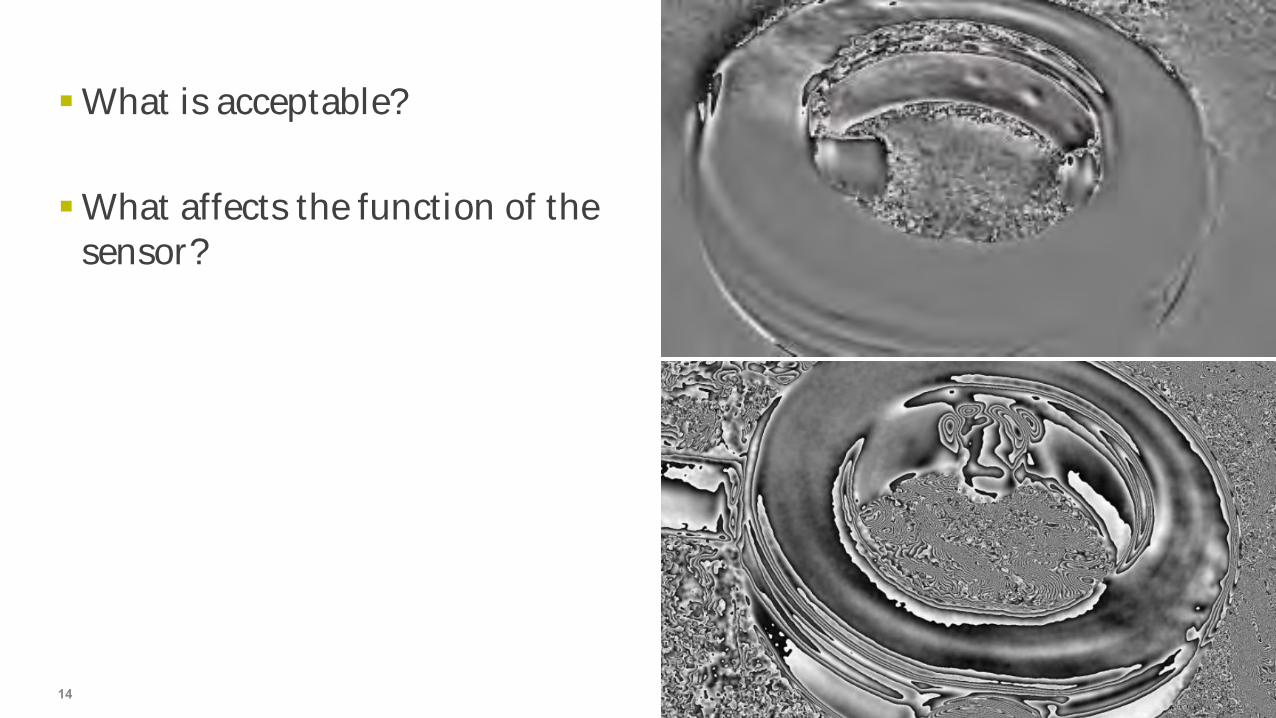
▪ What is acceptable?
▪ What affects the function of the sensor?
14
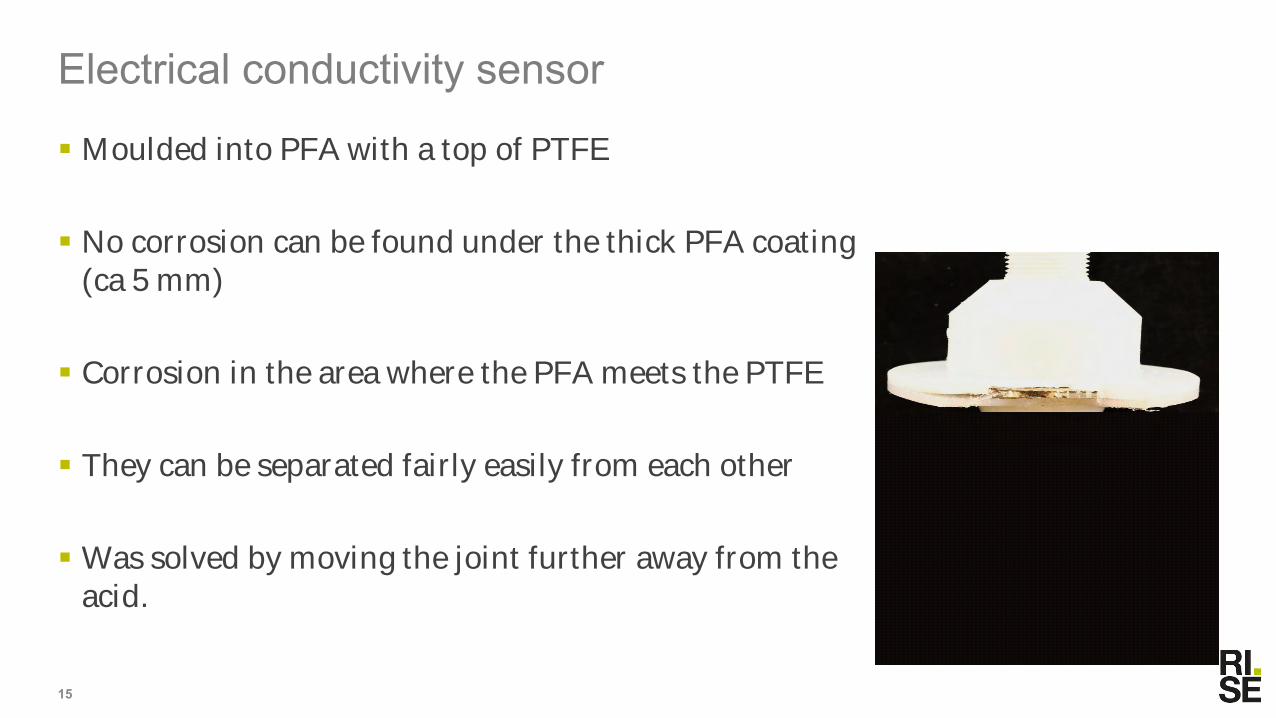
▪ Moulded into PFA with a top of PTFE
▪ No corrosion can be found under the thick PFA coating(ca 5 mm)
▪ Corrosion in the area where the PFA meets the PTFE
▪ They can be separated fairly easily from each other
▪ Was solved by moving the joint further away from theacid.
15
Electrical conductivity sensor
▪ Long-term laboratory material corrosion investigations of sensor material specimens for enhanced online sensor lifetime
16
Task 4.2:

▪ An important part of the project has been to developa method to expose steel samples with polymericcoatings
▪ As the samples are coated, they need to be attachedto something, which is why a fully coated samples is difficult and therefore a traditional immersiontesting is out of the question.
18
Development of exposure technique
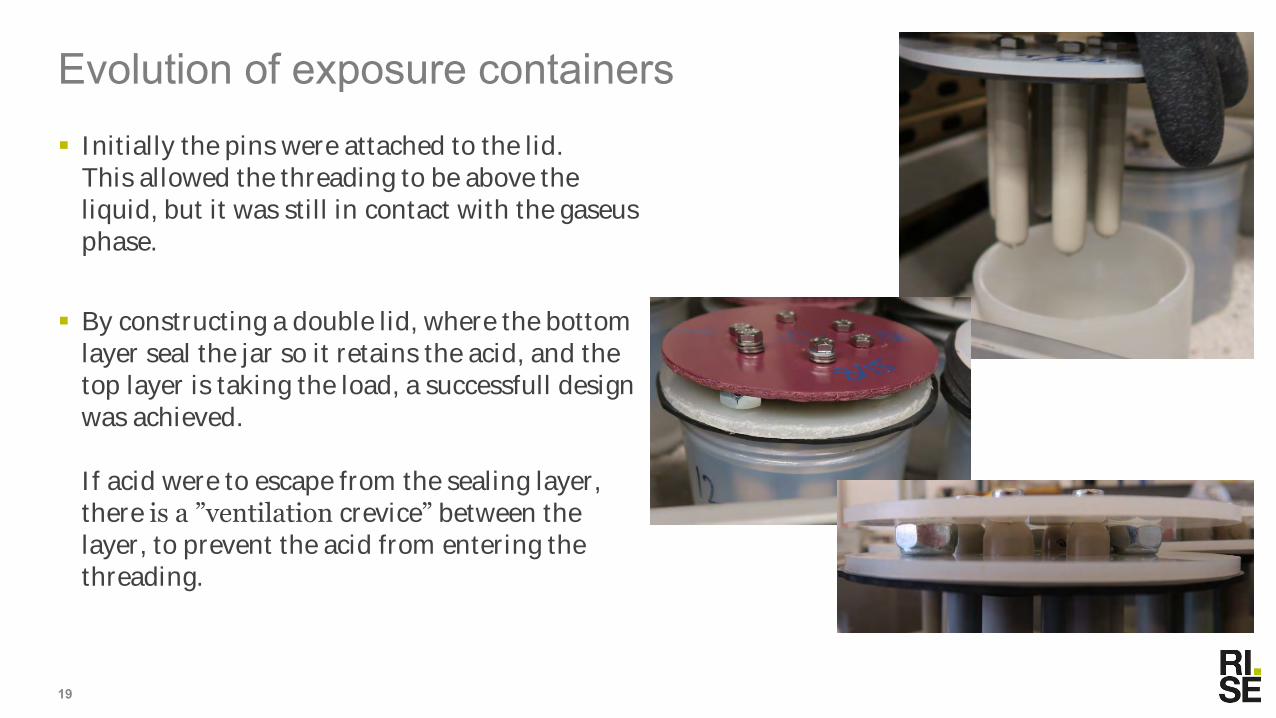
▪ Initially the pins were attached to the lid.This allowed the threading to be above the liquid, but it was still in contact with the gaseusphase.
▪ By constructing a double lid, where the bottomlayer seal the jar so it retains the acid, and the top layer is taking the load, a successfull design was achieved.
If acid were to escape from the sealing layer, there is a ”ventilation crevice” between the layer, to prevent the acid from entering the threading.
19
Evolution of exposure containers
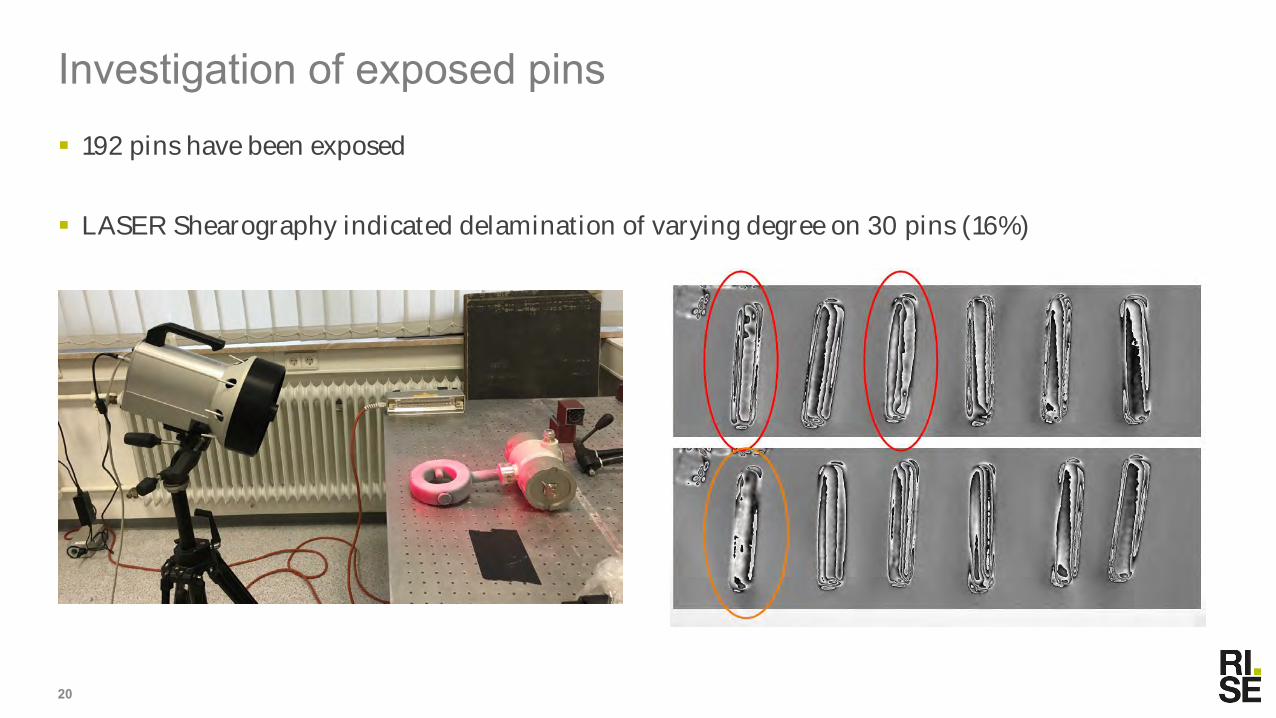
▪ 192 pins have been exposed
▪ LASER Shearography indicated delamination of varying degree on 30 pins (16%)
20
Investigation of exposed pins
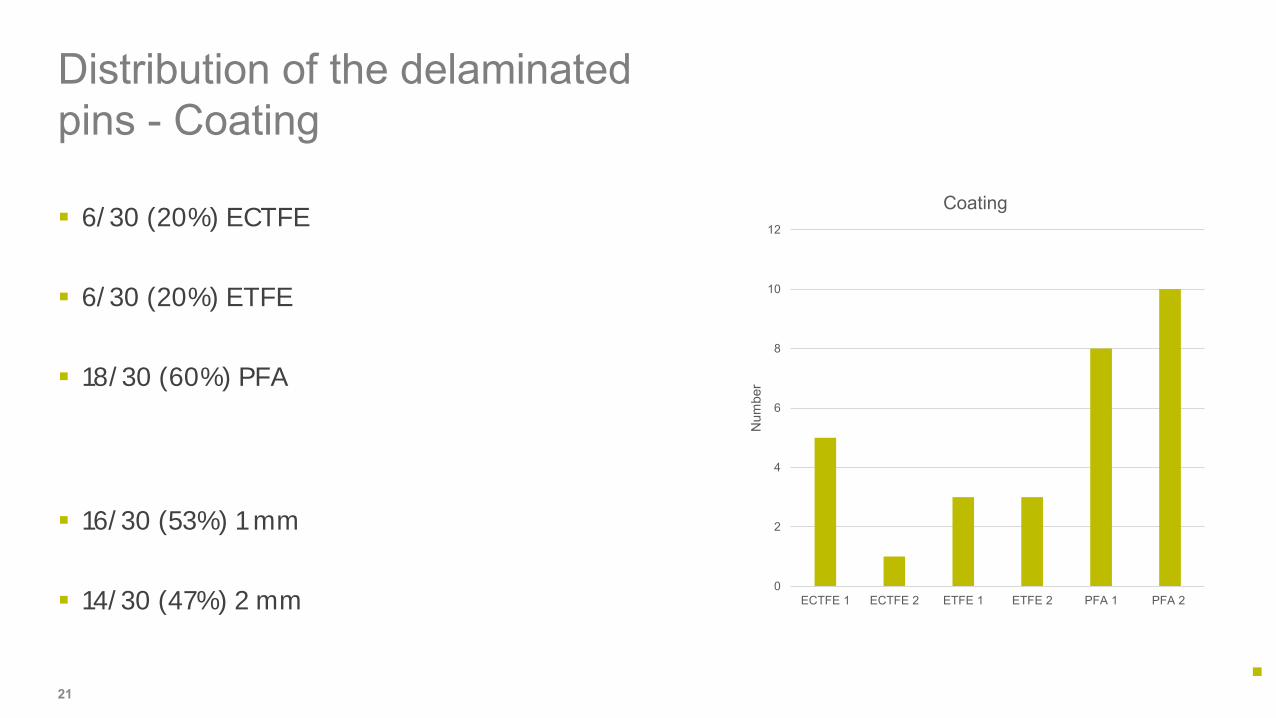
▪ 6/30 (20%) ECTFE
▪ 6/30 (20%) ETFE
▪ 18/30 (60%) PFA
▪ 16/30 (53%) 1 mm
▪ 14/30 (47%) 2 mm
21
Distribution of the delaminatedpins - Coating
0
2
4
6
8
10
12
ECTFE 1 ECTFE 2 ETFE 1 ETFE 2 PFA 1 PFA 2
Num
ber
Coating
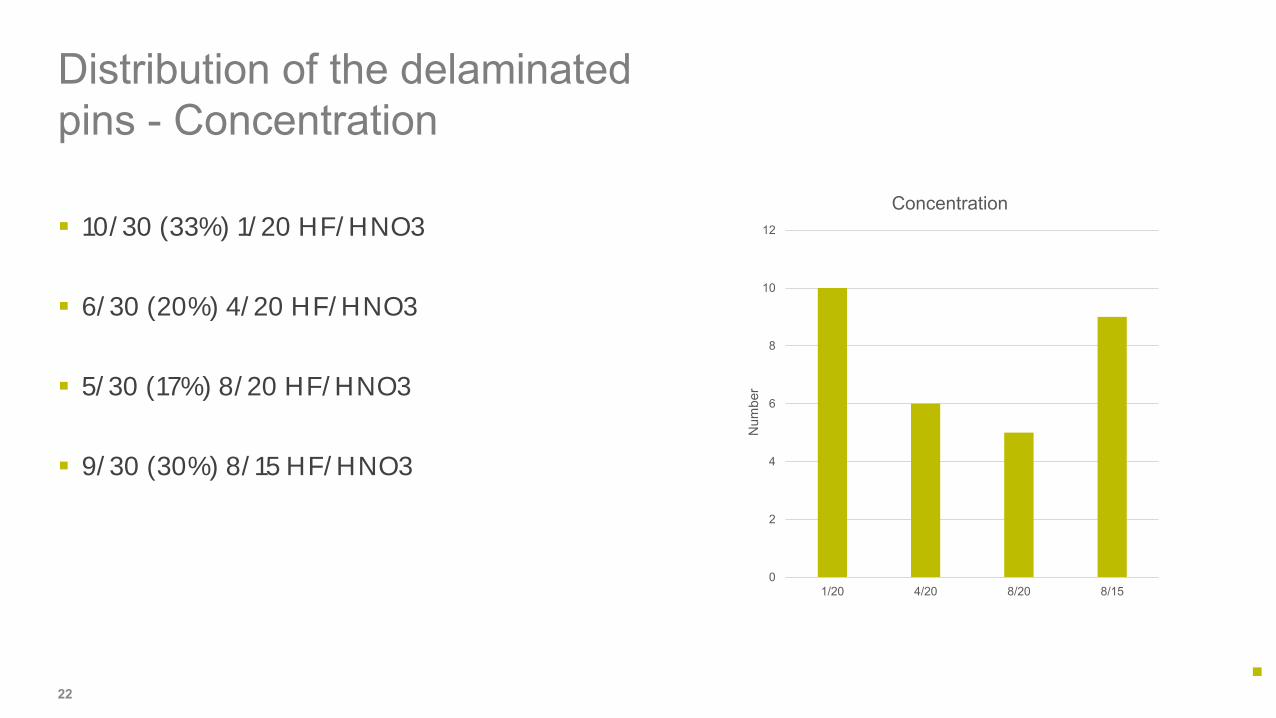
▪ 10/30 (33%) 1/20 HF/HNO3
▪ 6/30 (20%) 4/20 HF/HNO3
▪ 5/30 (17%) 8/20 HF/HNO3
▪ 9/30 (30%) 8/15 HF/HNO3
22
Distribution of the delaminatedpins - Concentration
0
2
4
6
8
10
12
1/20 4/20 8/20 8/15
Num
ber
Concentration

▪ 6/30 (20%) in 60⁰C
▪ 24/30 (80%) in 80⁰C
23
Distribution of the delaminatedpins - Temperature
0
5
10
15
20
25
30
60 80
Num
ber
Temperature
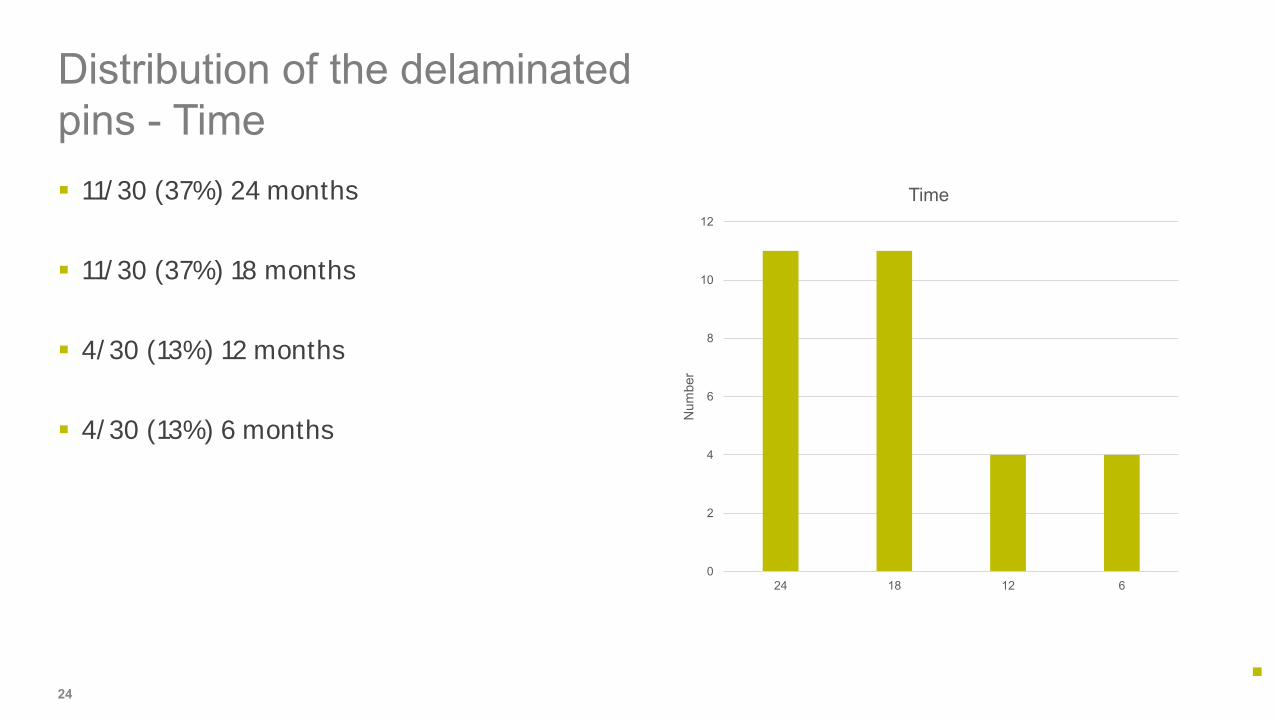
▪ 11/30 (37%) 24 months
▪ 11/30 (37%) 18 months
▪ 4/30 (13%) 12 months
▪ 4/30 (13%) 6 months
24
Distribution of the delaminatedpins - Time
0
2
4
6
8
10
12
24 18 12 6
Num
ber
Time
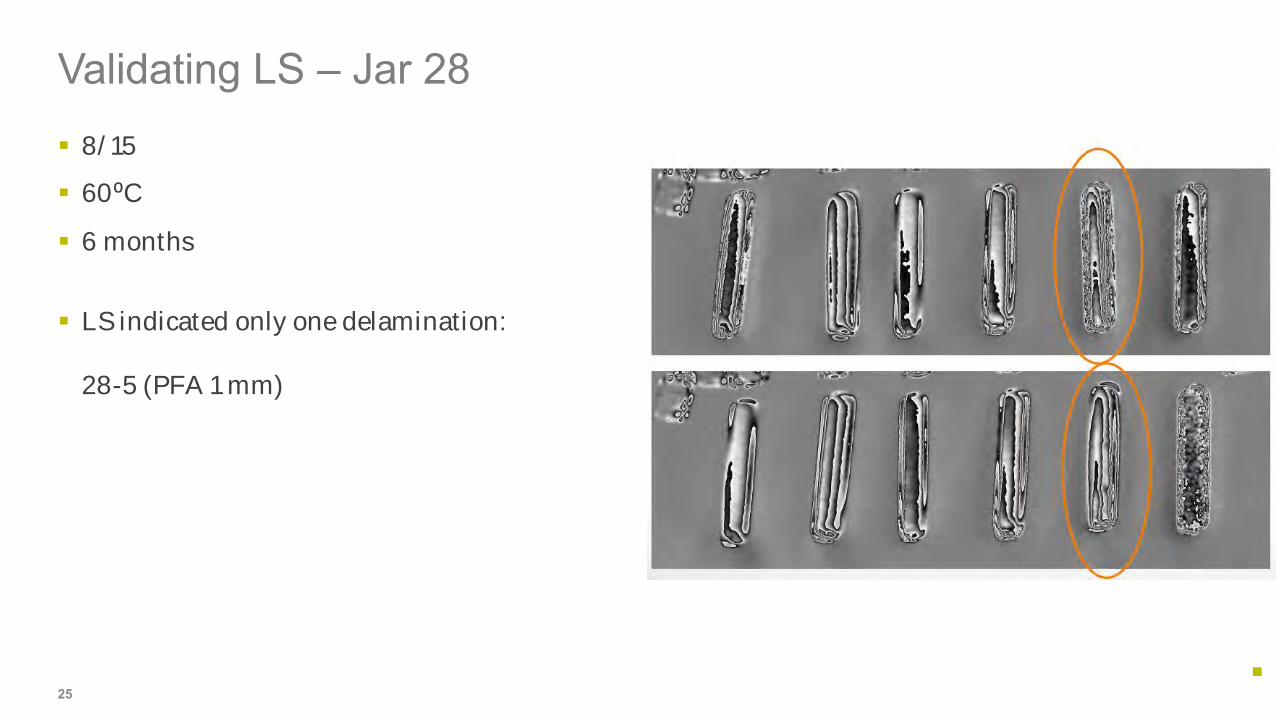
▪ 8/15
▪ 60⁰C
▪ 6 months
▪ LS indicated only one delamination:
28-5 (PFA 1 mm)
25
Validating LS – Jar 28
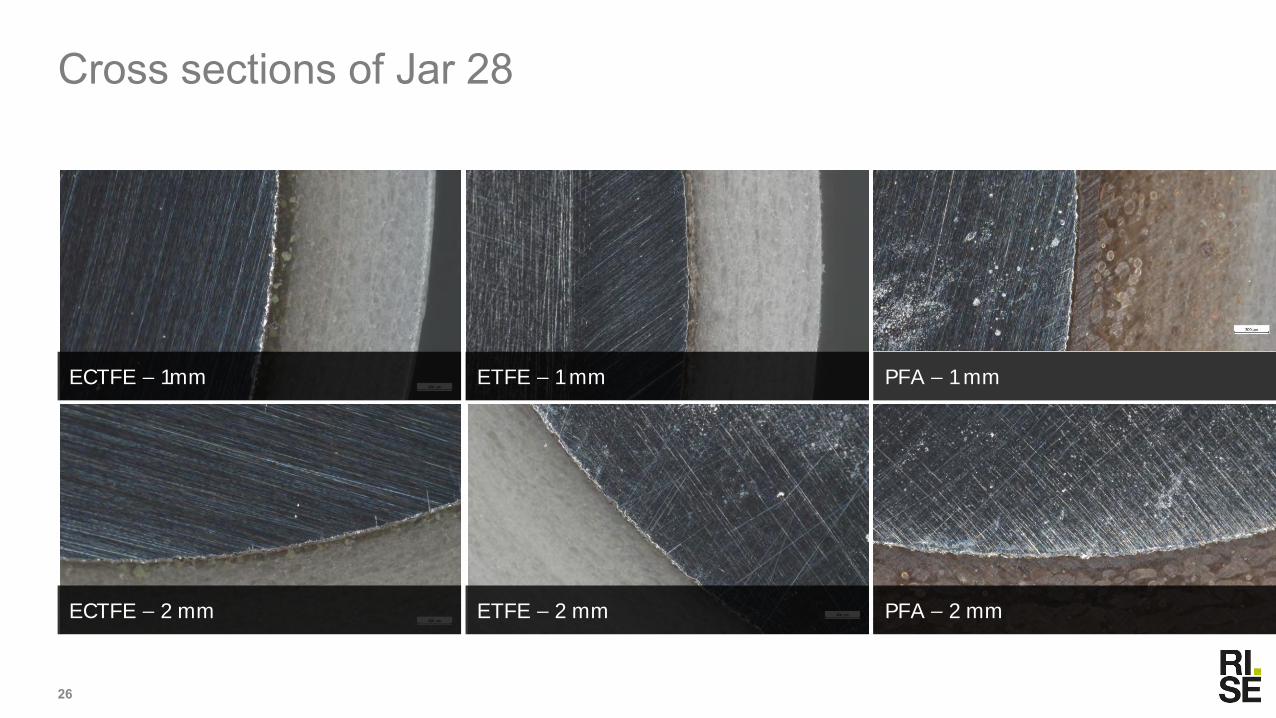
ECTFE – 1mm ETFE – 1 mm
ECTFE – 2 mm ETFE – 2 mm PFA – 2 mm
26
Cross sections of Jar 28
PFA – 1 mm

Fe F
C Cr
27
SEM/EDS of PFA delamination

▪ In order to improve the life time of the sensors, the failure mechanisms need to be identified. Does delamination have to be limiting? Location of the delamination should have a large impact.
▪ It seems possible that the determining factor is design/quality of manufacturing rather thancoating thickness or choice of fluoroplastics.
▪ Focus should be on optimizing the coating process including quality controll, using e.g. LASER Shearography.
▪ Exposure method appears to be working well.
▪ Seems like LS is a valid NDT to inspect polymer coated samples, and is able of detectingdelaminations otherwise only visable by microscopy.
28
Summary

RISE Research Institutes of Sweden
THANK YOU!
QUESTIONS?
Jonas Engblom
Materials and Production - RISE KIMABPolymers in Corrosive Environments