Embed Size (px)
Citation preview
- II -
University of Southern Queensland
Faculty of Engineering and Surveying
Optimising Condenser Air Extraction To Reduce Greenhouse Gas Emissions At The
Loy Yang B Power Station
A dissertation submitted by
Geoffrey Wayne Dyke
in fulfilment of the requirements of
Courses ENG4111 and 4112 Research Project
towards the degree of
Bachelor of Mechanical Engineering
Submitted: October, 2005
- III -
ABSTRACT
The theory of global warming due to the greenhouse effect has become widely accepted
in modern political circles. There is now a raft of initiatives and proposed legislation
aimed at to either containing or reducing greenhouse gas emissions. The electrical
power industry is very sensitive to the fact it is a major greenhouse gas emitter and has
proactively sought to reduce its emissions voluntarily. The Loy Yang B Power Station
(LYB) is no exception and has signed on to the generator efficiency standards which
mandate continuous improvement in greenhouse gas emissions.
Two approaches are available to reduce greenhouse gas emissions at a power station.
One approach is to improve the steam cycle thermal efficiency, so less coal is burnt for
the same amount of electricity sent out. The other approach is to reduce the parasitic in-
house energy consumption that is required to run the power station drives, so more
electricity is sent out for the same amount of coal burnt. This effectively lowers the
greenhouse gas emission, per kW, of electricity sent out to consumers. This project will
adopt the latter approach without impacting on the former.
The current steam condenser, air extraction system is designed to handle a wide range
of turbine operating conditions. It was proposed, that by retrofitting a smaller capacity
unit designed specifically for base load operation, significant energy reductions would
result. Investigations found a change in the boiler water chemical treatment regime had
reduced the air extraction system over-venting requirements to one third of the original
design. Actual air in-leakage rates were measured and also found to be substantially
lower than original plant design specifications. An investigation into the energy
- IV -
efficiency of the current system, based on current air in-leakage rates, showed that it
was grossly inefficient at turbine base load operation.
Research on various designs of air extraction systems indicated there were four proven
designs widely used within the industry. The operating performance, cost and energy
efficiency of these designs were compared against one another. The ultimate choice
was to select a 2-stage Liquid Ring Vacuum Pump (LRVP), with the innovation of a
Variable Frequency Drive (VFD) controlling its flow capacity to prevent cavitation and
reduce energy consumption.
Based on the selected design, a new air extraction system that is sized for optimum
capacity is predicted to reduce the in-house energy consumption across the power
station by 342 kW per annum. This will result in an effective equivalent Carbon
Dioxide emission reduction of 3,710 tonnes per annum. The Net Present Value of this
project is predicted to return $616,700 (after tax) over 18-years of operation based on a
required rate of return of 12% and an electricity cost of $30/MWh.
The presence of air in the steam condenser can lead to condensate being sub-cooled
below its saturation temperature. This sub-cooling can result in significant loss of
steam cycle thermal efficiency because the heat removed has to be re-added by the
boiler and feed heating plant. Research was conducted on the possible causes of sub-
cooling. The steam condensers historical performance data was assessed to determine if
any steam cycle thermal efficiency improvements could be made in this area.
Evaluation of this data showed no significant condensate sub-cooling is occurring
within the condenser, and no further action is warranted in this regard.
- V -
University of Southern Queensland
Faculty of Engineering and Surveying
ENG4111 & ENG4112 Research Project
Limitations of Use
The Council of the University of Southern Queensland, its Faculty of Engineering and
Surveying, and the staff of the University of Southern Queensland, do not accept any
responsibility for the truth, accuracy or completeness of material contained within or
associated with this dissertation.
Persons using all or any part of this material do so at their own risk, and not at the risk
of the Council of the University of Southern Queensland, its Faculty of Engineering and
Surveying or the staff of the University of Southern Queensland.
This dissertation reports an educational exercise and has no purpose or validity beyond
this exercise. The sole purpose of the course pair entitled "Research Project" is to
contribute to the overall education within the student’s chosen degree programme. This
document, the associated hardware, software, drawings, and other material set out in the
associated appendices should not be used for any other purpose: if they are so used, it is
entirely at the risk of the user.
Prof G Baker Dean Faculty of Engineering and Surveying
- VI -
Certification
I certify that the ideas, designs and experimental work, results, analyses and conclusions
set out in this dissertation are entirely my own effort, except where otherwise indicated
and acknowledged.
I further certify that the work is original and has not been previously submitted for
assessment in any other course or institution, except where specifically stated.
Geoffrey Wayne Dyke
Student Number: 0050029228
_____________________________________ Signature _____________________________________ Date
- VII -
ACKNOWLEDGEMENT
I would especially like to acknowledge the assistance of Dr. Ruth Mossad from USQ in
the preparation of this dissertation and over the course of the project. Her objective
feedback and patience was invaluable in making matters clear, when they initially
appeared very cloudy.
I would also like to acknowledge the assistance of Mr. Preethi Jayasunder from IPM
engineering group for gathering plant documentation, often in obscure places, and for
his assistance in conducting air extraction discharge flow testing, in the field.
I would like to acknowledge other valuable assistance that was provided by Mr. Nick
Lee and Mr. Mark Soutar, also from the IPM engineering group, in explaining the use
of various measuring equipment.
I would like to acknowledge the valuable discussion provided by Mr. Alf Hertaeg from
Sinclair Knight Mertz on the history and the problems encountered with air extraction
systems across a range of power stations, which were formally owned by the State
Electricity Commission of Victoria.
Lastly, but not least, I would like to acknowledge the assistance of Mr. David Plozza
from the IPM station chemical laboratory, for sourcing the calibrated gas flow meters
from Scientific Gas Services Pty Ltd, and also for his analysis of the gases in the air
extraction discharge.
- VIII -
Table of Contents
Page No. Abstract ....................................................................................................................... III Acknowledgements ....................................................................................................VII Table of Contents ......................................................................................................VIII List of Figures ............................................................................................................. IX List of Tables ............................................................................................................... X List of Appendixes .......................................................................................................X List of Abbreviations ..................................................................................................XI Chapter 1. Introduction ........................................................................................ 1 Chapter 2. Background......................................................................................... 3 2.1. Greenhouse Gas Emissions ................................................................................ 3 2.2. Types of Steam Turbines .................................................................................... 4 2.3. Functions of the Steam Condenser ..................................................................... 4 2.4. Functions of the Air Extraction System ............................................................. 7 2.5. Effects of Air and NC Gases on the Condenser ................................................. 8 2.6. The Steam Condenser at Loy Yang ‘B’ Power Station ...................................... 9 2.7. The Air Extraction System at Loy Yang ‘B’ Power Station ............................ 14
2.7.1. System Arrangement ............................................................................... 14 2.7.2. Modes of Operation................................................................................. 15 2.7.3. Range of Operating Conditions............................................................... 16 2.7.4. LYB Air Extraction System Performance Data ...................................... 18
2.8. Boiler Water Chemistry at Loy Yang ‘B’ Power Station ................................ 19 Chapter 3. Literature Review............................................................................. 21 3.1. Types of Air Extraction Equipment.................................................................. 21
3.1.1. Steam Jet Ejector System ........................................................................ 21 3.1.2. Liquid Ring Vacuum Pump (LRVP) System.......................................... 22 3.1.3. Air Ejector and LRVP System ................................................................ 25 3.1.4. Steam Hybrid System.............................................................................. 25 3.1.5. Other Air Extraction Equipment ............................................................. 26
3.2. Correct Sizing of Air Extraction Systems ........................................................ 27 3.3. Efficiency of Air Extraction Systems............................................................... 31 3.4. Condenser Performance and Condensate Sub-Cooling.................................... 35
Chapter 4. Current System Evaluation ............................................................. 39 4.1. LYB Condenser Air In-Leakage Rates............................................................. 39 4.2. LYB Current System Energy Consumption ..................................................... 45 4.3. LYB Current System Efficiency....................................................................... 46 Chapter 5. New System Evaluation ................................................................... 47 5.1. Alternative Designs of Air Extraction .............................................................. 47 5.2. New System Arrangement................................................................................ 49 5.3. Design Air Extraction Rate............................................................................... 52
- IX -
5.4. New System Energy Consumption................................................................... 57 5.5. New System Efficiency .................................................................................... 59 5.6. Capital Cost Recovery ...................................................................................... 60 5.7. Greenhouse Gas Emission Reduction............................................................... 62 Chapter 6. Condensate Sub-Cooling Investigation .......................................... 63 6.1. Condenser Performance Evaluation ................................................................. 63 6.2. Condensate Sub-Cooling Assessment .............................................................. 64 Chapter 7. Conclusions ....................................................................................... 66
References ................................................................................................................. 68
List of Figures
Figure 1 - LYB Rankine Cycle T-s Diagram............................................................... 5
Figure 2 - % Change in Heat Rate Vs Condenser Vacuum ......................................... 6
Figure 3 – LYB Circulating Water Flow Arrangement ............................................ 10
Figure 4 - LYB Condenser Fluid Flow Arrangement ................................................ 11
Figure 5 - Circulating Water Tube Bundle Cross-Section ........................................ 12
Figure 6 - Turbine Unloading Vs Condenser Vacuum .............................................. 14
Figure 7 - LYB Air Extraction Pump Arrangement................................................... 15
Figure 8 – LRVP LPH-10534/ Air Ejector GPV-15000 Performance Curves .......... 18
Figure 9 – 2-Stage Steam Ejector System Arrangement............................................ 22
Figure 10 – Cross Section of a LRVP........................................................................ 23
Figure 11 – LRVP System Arrangement ................................................................... 24
Figure 12 – Steam Ejector Vs LRVP Performance.................................................... 24
Figure 13 – Steam Hybrid System Arrangement........................................................ 26
Figure 14 – Steam Vs Electricity Cost of Air Extraction........................................... 35
Figure 15 – Ball Type Rotometer .............................................................................. 40
Figure 16 – Air Extraction Turbine Roof Discharge Cap ........................................ 40
Figure 17 – Rotary Type Gas Flowmeter .................................................................. 41
Figure 18 – Metal Blank ............................................................................................ 42
Figure 19 – Proposed New System Arrangement ...................................................... 50
Figure 20 – Condenser Pressure Versus Load............................................................ 52
Figure 21 - Stirling LPH 3708 Performance Curve .................................................. 58
Figure 22 – Condenser Pressure During Year .......................................................... 63
- X -
List of Tables
Table 1 – In-House Power Consumption per Generating Unit .................................... 1
Table 2 – HEI Recommended Design Over-Venting ................................................ 29
Table 3 – Comparison of Air Extraction Efficiency Based on Type ......................... 34
Table 4 – Unit 1 & 2 Air In-leakage Field Measurements......................................... 43
Table 5 - Unit 1 & 2 Estimated Air In-leakage Rates Vs Condenser Pressure.......... 44
Table 6 – Anti-Condensation Heater Energy Consumption ...................................... 45
Table 7 – AEP Cooler Pumping Energy Consumption.............................................. 45
Table 8 – Duty AEP Drive Motor Energy Consumption........................................... 46
Table 9 – Current System Total Energy Consumption .............................................. 46
Table 10 – Power Reduction & NPV......................................................................... 61
Table 11 – Greenhouse Gas Reductions .................................................................... 62
Table 12 – Unit 1 Condenser Performance June, July & August 2005 ..................... 64
Table 13 – Unit 2 Condenser Performance June, July & August 2005 ..................... 64
List of Appendixes Appendix A – Project Specification........................................................................... 70
Appendix B – Mathematic Formulae......................................................................... 72
Appendix C – Net Present Value & CO2 Calculations.............................................. 76
Appendix D – Manufacturers LRVP Data ................................................................. 78
- XI -
List of Abbreviations
Abs ........... Absolute
ACW ........ Auxiliary cooling water
AEP.......... Air extraction pump (LRVP)
AVT ......... All volatile treatment (Boiler water chemical treatment)
CO2 ................ Equivalent carbon dioxide (Carbon dioxide, Nitrous Oxide and Methane)
CW........... Circulating water (Condenser cooling water)
DAE ......... Dry air equivalent (Combined air and water vapour equivalent)
EHG ......... Electro-Hydraulic Governor (Turbine load/speed control)
HEI .......... Heat Exchanger Institute (USA)
HP ............ High pressure
kV............. kilo-Volt
kW ........... kilo-Watt
LP............. Low pressure
LRVP....... Liquid ring vacuum pump
LYB ......... Loy Yang B Power Station
MCR ........ Maximum continuous rating
MW .......... Mega-Watt
MWh........ Mega-Watt hour
NC ............ Non-condensable
NEM ........ National electricity market
NEMCO .. National Electricity Market Company (Operating authority)
NPV ......... Net present value
OT ............ Oxygenated treatment (Boiler water chemical treatment)
ppb ........... Parts per billion
scfm.......... Standard cubic feet per minute (Dry air at 20˚C and 101.3 kPa)
SGS .......... Scientific Gas Services
TTD ......... Terminal Temperature Difference
VFD ......... Variable Frequency Drive
- 1 -
Chapter 1. INTRODUCTION
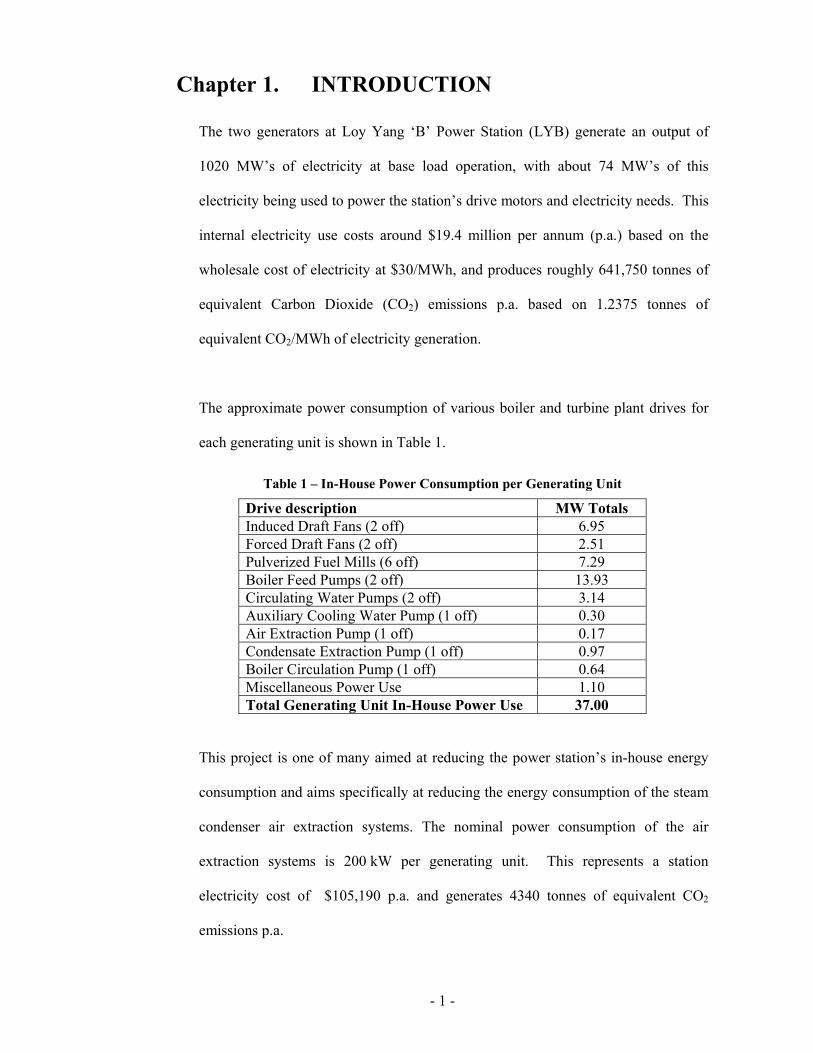
The two generators at Loy Yang ‘B’ Power Station (LYB) generate an output of
1020 MW’s of electricity at base load operation, with about 74 MW’s of this
electricity being used to power the station’s drive motors and electricity needs. This
internal electricity use costs around $19.4 million per annum (p.a.) based on the
wholesale cost of electricity at $30/MWh, and produces roughly 641,750 tonnes of
equivalent Carbon Dioxide (CO2) emissions p.a. based on 1.2375 tonnes of
equivalent CO2/MWh of electricity generation.
The approximate power consumption of various boiler and turbine plant drives for
each generating unit is shown in Table 1.
Table 1 – In-House Power Consumption per Generating Unit
Drive description MW Totals Induced Draft Fans (2 off) 6.95 Forced Draft Fans (2 off) 2.51 Pulverized Fuel Mills (6 off) 7.29 Boiler Feed Pumps (2 off) 13.93 Circulating Water Pumps (2 off) 3.14 Auxiliary Cooling Water Pump (1 off) 0.30 Air Extraction Pump (1 off) 0.17 Condensate Extraction Pump (1 off) 0.97 Boiler Circulation Pump (1 off) 0.64 Miscellaneous Power Use 1.10 Total Generating Unit In-House Power Use 37.00
This project is one of many aimed at reducing the power station’s in-house energy
consumption and aims specifically at reducing the energy consumption of the steam
condenser air extraction systems. The nominal power consumption of the air
extraction systems is 200 kW per generating unit. This represents a station
electricity cost of $105,190 p.a. and generates 4340 tonnes of equivalent CO2
emissions p.a.
- 2 -
This project came about when an operator noticed the air extraction system
discharge airflow indication, on each generating unit, showed a nominal flow rate of
0.7-1.0 m3/min. It was suggested this seemed to be a very small airflow when
compared to the nominal, 200 kW power rating for the system.
The task then, was to investigate the efficiency of the current air extraction system
and to determine the viability of installing a much smaller ‘holding’ system
specifically designed for base-load operation. While the over-riding goal of this
project is to keep the in-house energy usage to a minimum, great care needs to be
exercised to avoid any possible negative impacts on the steam cycle thermal
efficiency, which would result in energy losses of many magnitudes higher than the
efficiency gains made.
In the process of studying the condenser and its air extraction system, it was
thought appropriate to investigate whether there was any significant condensate
‘sub-cooling’ occurring within the condenser. Condensate ‘sub-cooling’ is where
the temperature of the condensate falls below the saturation temperature of the
steam entering the condenser and this can result in significant losses of steam cycle
thermal efficiency. This is because any extra heat removed from the condensate by
the condenser must be re-added further along in the cycle by the boiler and feed
heating plant.
- 3 -
Chapter 2. BACKGROUND
2.1. Greenhouse Gas Emissions
The greenhouse gases that result from the combustion of Brown Coal are Carbon
Dioxide, Methane and Nitrous Oxides. The amount of greenhouse gases that are
emitted by the power station are calculated by analysing coal samples on a six
hourly basis, and then multiplying the percentage of the constituents by the actual
tonnage of coal burned. The total greenhouse gas emission is then reported as an
equivalent tonnage of carbon dioxide (CO2) emitted.
The Loy Yang ‘B’ Power Station produces 0.99 tonne of equivalent CO2 for every
tonne of Brown Coal burnt and requires about 1.25 tonnes of Brown Coal to produce
each MWh. This means that 1.2375 tonne of equivalent CO2 is produced per MWh
of electricity produced.
There are two ways to reduce the emission of equivalent CO2 in the flue gases
discharged by the station. They are:
• Increase the steam cycle efficiency in order to burn less coal for the same
generator output.
• Reduce the amount of in-house energy consumption, so that more electrical
energy is available to be sent out to consumers, for the same amount of coal
burnt, i.e. this effectively lowers the amount of CO2 produced per kW of
electricity produced for consumers.
- 4 -
2.2. Types of Steam Turbines
The two main types of steam turbines used to generate electrical power are the
backpressure type and the condensing turbine type (Reid & Renshaw, 1988, p.940).
The backpressure type is commonly used in process industries where there is the
additional requirement to use the exhaust steam for heating in other processes as
well as driving the turbine to generate electricity. These other processes include the
drying of Brown Coal to make Briquettes and the heating of hospitals and
petrochemicals in refineries.
Where the sole purpose of the steam turbine is to generate electricity then
condensing turbines tend to dominate because they maximize the power output of
the turbine and hence the generator’s electrical power output. This arrangement
results in a lower overall steam cycle thermal efficiency because the latent heat loss
of the condensing steam is given up to the circulating water and eventually rejected
to the atmosphere, rather than being used productively for low grade heating
purposes. The higher turbine work output, compared to a backpressure turbine, is
the result of the higher temperature and pressure drop across the turbine created by
the condenser’s vacuum at the turbine’s exhaust outlet.
2.3. Functions of the Steam Condenser
The main function of the condenser and its associated plant is to maximize the
turbine work cycle by producing and maintaining the lowest economic heat rejection
pressure and temperature at the turbine exhaust (LYB PDM, 2005, vol.6, sec.2, p.1).
This is achieved by cold water circulating through tube bundles and condensing the
steam from the turbine exhaust, thereby forming a vacuum within the condenser. It
- 5 -
is the relative volume change from steam to condensate that creates this vacuum.
For steam entering the condenser at atmospheric pressure this volume ratio is
1,642:1 but at the condenser operating pressure of 9.5 kPa absolute, this volume
ratio is 15,436:1.
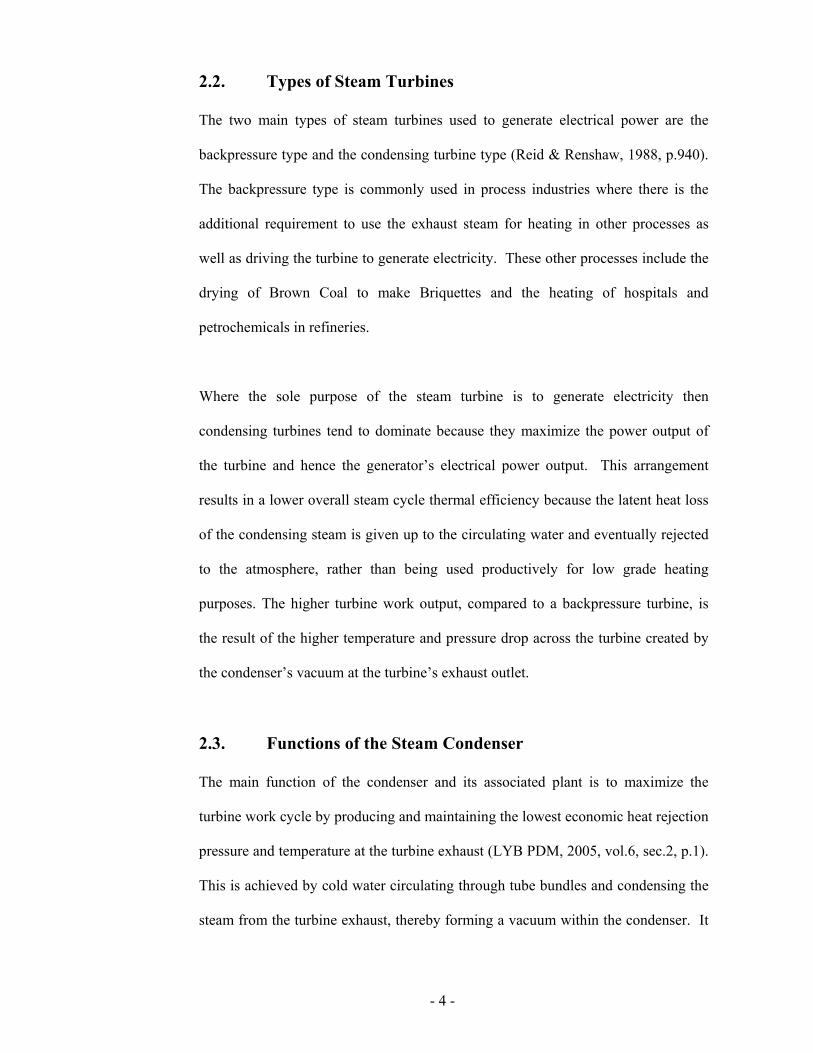
The effect of differing turbine exhaust pressures can be seen on the T-s Diagram, in
Figure 1, where the extra turbine work is represented by the area between the
saturation temperature at atmospheric pressure (100 ˚C) and the saturation
temperature at 9.5-kPa absolute (44.8 ˚C).
Figure 1 - LYB Rankine Cycle T-s Diagram
Extra turbine work due to condenser vacuum
- 6 -
-4
-2
0
2
4
6
8
4 6 8 10 12 14 16
Condenser Pressure (kPa abs)
% C
hang
e in
Hea
t Rat
e
60% Turbine Load
100% Turbine Load
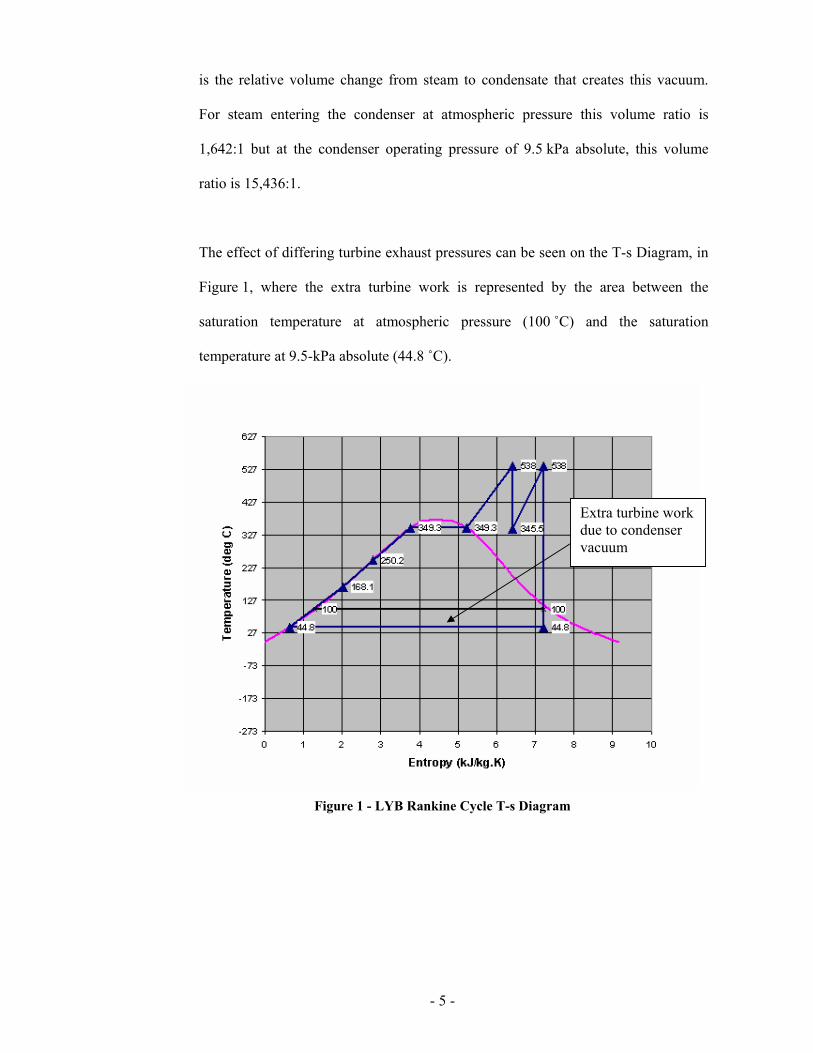
The importance of good condenser vacuum on the turbine output should not be
underestimated. The following curves, in Figure 2, illustrate the % change in the
generating unit’s heat rate with changing condenser vacuum and were reconstructed
from the LYB Hitachi Manuals.
Heat rate is calculated as the coal energy input divided by electrical energy output.
A one percent increase in heat rate will result in an extra 52,500 tonnes of brown
coal being burnt p.a. at LYB, costing an extra $236,000 p.a. and producing an extra
52,000 tonnes of equivalent CO2 p.a.
Figure 2 - % Change in Heat Rate Vs Condenser Vacuum
From the curves, it can be seen that at turbine base load (100%) a rise in condenser
pressure of just 2.5-kPa would lead to a 1 percent increase in generating unit’s heat
- 7 -
rate. Insufficient condenser venting could quite easily cause this small rise in
condenser pressure, and this is why the operating performance of the air extraction
system is so important.
Other primary functions of the condenser are to convert the exhaust steam into water
for reuse in the feed cycle, and collect useful residual heat through drainage from
the turbine, condensate and feed heating systems. The design of the condenser also
provides a net positive suction head for the condensate extraction pumps and
facilitates the removal of air and other non-condensable gases from the turbine
exhaust steam (LYB PDM, 2005, vol.6, sec.2, pp.1-3).
2.4. Functions of the Air Extraction System
Air, ammonia and other non-condensable gases, resulting from air in-leakage or the
decomposition of water treatment chemicals, are present in the turbine exhaust
steam and accumulate in the condenser (LYB PDM, 2005, vol.6, sec.2, p.1). The
main functions of the condenser air extraction system are to:
• Extract air, ammonia and other non-condensable gases from the condenser to
maintain the condenser vacuum.
• Prevent air blanketing of condenser tubing that could dramatically reduce the
heat transfer and stop the condensing process.
• Reduce the condensate dissolved oxygen levels that could lead to corrosion
of boiler tubing.
• Prevent condensate ‘sub-cooling’ caused by the presence of air lowering the
steam saturation temperature.
- 8 -
Prior to turbine start-up the air extraction system is also used to rapidly raise
vacuum by removing air from the condenser shell, turbine casing, steam side of the
low pressure (LP) heaters and all other associated steam piping. This initial raising
of vacuum is important in order to establish the correct condensate chemical
conditions prior to feeding water to the boiler and for protecting the LP Turbine
from excessive overheating that could result from ‘windage’.
2.5. Effects of Air and NC Gases on the Condenser
The effects of air and other non-condensable (NC) gases may be considered using
Dalton’s Law of Partial Pressure which states, “Each constituent of a gas mixture
exerts that pressure which it would exert, if it alone occupied the containing vessel
at the same temperature.”
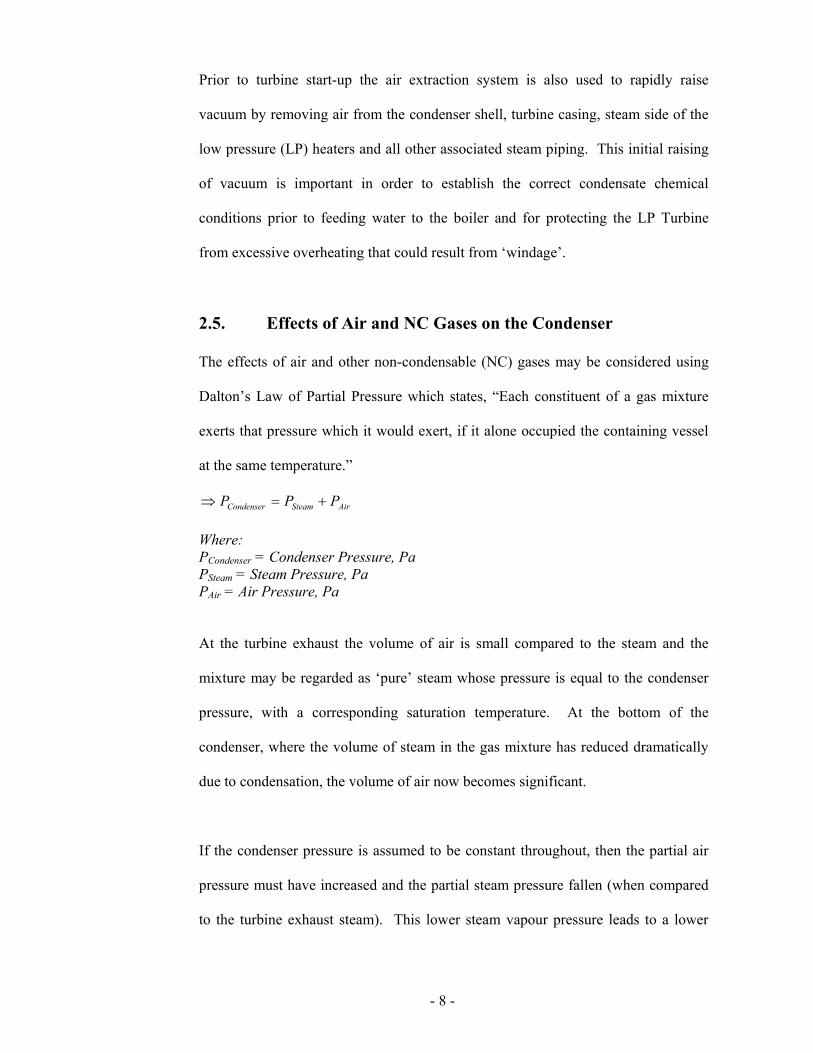
AirSteamCondenser PPP +=⇒
Where: PCondenser = Condenser Pressure, Pa PSteam = Steam Pressure, Pa PAir = Air Pressure, Pa
At the turbine exhaust the volume of air is small compared to the steam and the
mixture may be regarded as ‘pure’ steam whose pressure is equal to the condenser
pressure, with a corresponding saturation temperature. At the bottom of the
condenser, where the volume of steam in the gas mixture has reduced dramatically
due to condensation, the volume of air now becomes significant.
If the condenser pressure is assumed to be constant throughout, then the partial air
pressure must have increased and the partial steam pressure fallen (when compared
to the turbine exhaust steam). This lower steam vapour pressure leads to a lower
- 9 -
saturation temperature. As the condensate in the ‘hotwell’ is in contact with this
steam vapour it’s temperature can fall due to heat transfer and this can result in sub-
cooling (Reid & Renshaw, 1988, p.921). Sub-cooling of condensate and dissolved
oxygen pickup can also occur as the condensate falls through localised, accumulated
air pockets within the condenser (Harpster, 2002, p.537-539)
Other significant effects of air and non-condensable gases on the condenser is that
they can ‘blanket’ the condenser tubes and greatly reduce the heat transfer, which
leads to a loss of vacuum and a corresponding rise in the steam saturation
temperature, resulting in reduced turbine work output. This reduction in the rate of
heat transfer by ‘blanketing’ can be significant and if left unchecked could stop the
condensing process altogether.
Another effect of air build-up in the condenser is it can lead to high condensate
dissolved oxygen levels. If left unchecked this can lead to increased boiler tube
corrosion. Likewise, a build-up of ammonia vapour pockets within the condenser
can lead to corrosion attack on the copper within the condenser tubes, which can
lead to leaks and contamination of the condensate system by the less than pure
circulating water.
2.6. The Steam Condenser at Loy Yang ‘B’ Power Station
The condenser at LYB is a regenerative type and is designed to take the least
possible heat out of the steam, which has to be condensed, while maintaining a
temperature of the condensate near the temperature of the steam entering the
condenser. If excessive heat is removed and the condensate falls below the steam
- 10 -
temperature, this is known as ‘sub-cooling’. This type of condenser also facilitates
the extraction of air and other non-condensable gases from the turbine exhaust
steam, reducing its volume as much as possible before it enters the air pump or
ejector (Reid & Renshaw, 1988, p.913).
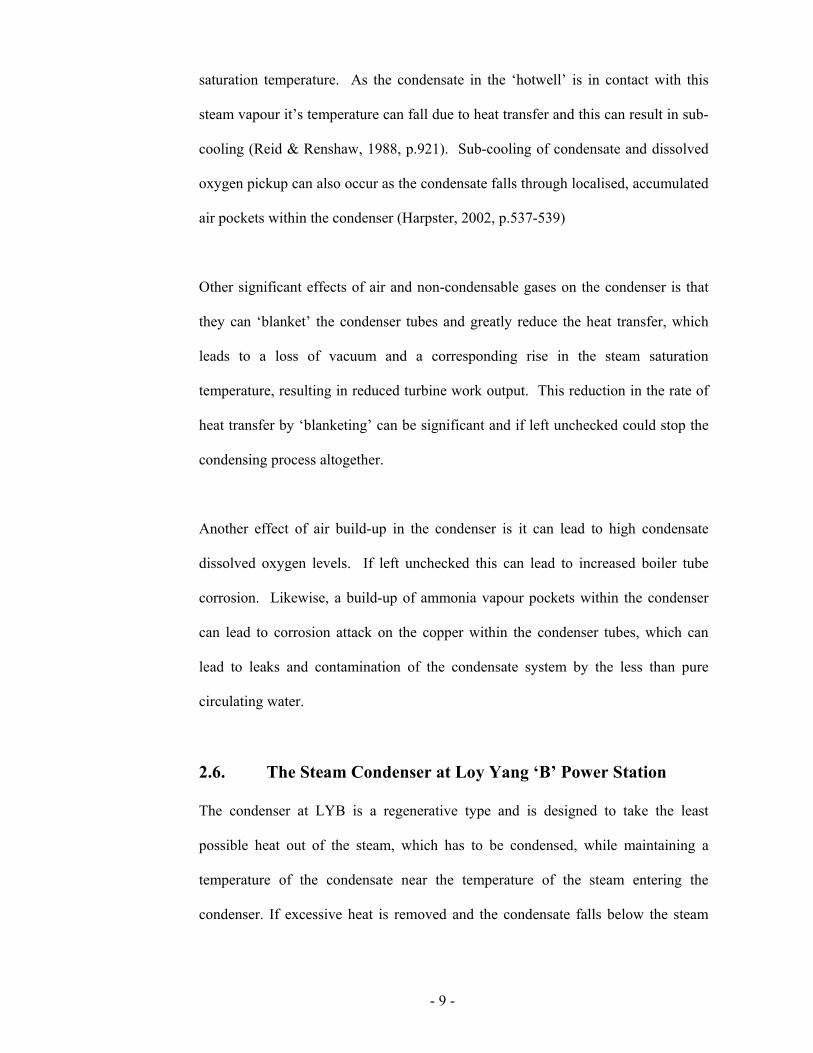
The LYB condenser consists of three Circulating Water (CW) flow paths, fitted side
by side, so as to allow for online maintenance, see figure 3. At turbine base load a
minimum of two CW flow paths are required to be in-service. Each condenser CW
flow path consists of a 2-Pass cooler arrangement. The CW enters at the top of the
condenser water-box, travels across the steam flow path to the return water-box, and
then returns across the steam flow path once again to exit at the bottom of the
condenser water-box, see Figure 4.
Figure 3 - LYB Circulating Water Flow Arrangement
- 11 -
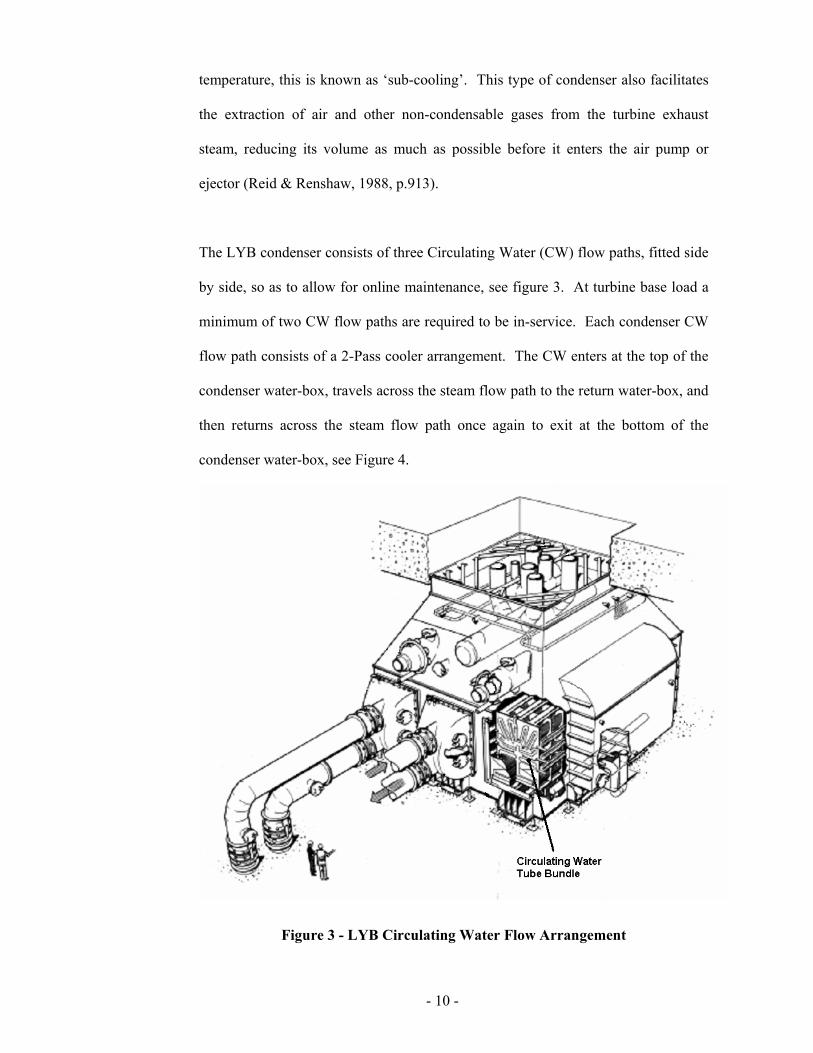
The various fluid flows for the LYB condenser are shown in figure 4.
Figure 4 - LYB Condenser Fluid Flow Arrangement
The efficiency of the condenser is dependant on the tube cleanliness, the CW inlet
temperature and the CW flow rate. The controlling factors of the CW inlet
temperature are the ambient air temperature, humidity, and the efficiency of the
cooling tower (LYB PDM, 2005, vol.6, sec.2, p.8).
A cross-section of a circulating water tube bundle for a single circulating water
(CW) flow path is shown in Figure 5. Each condenser CW flow path consists of
three tube modules positioned to provide maximum exposure to the turbine exhaust
steam. The tubes in each module are arranged to create steam lanes with decreasing
cross sectional areas. This has the effect of maintaining the steam velocity,
maximizing the condensing efficiency through the tube bundles, and eliminating the
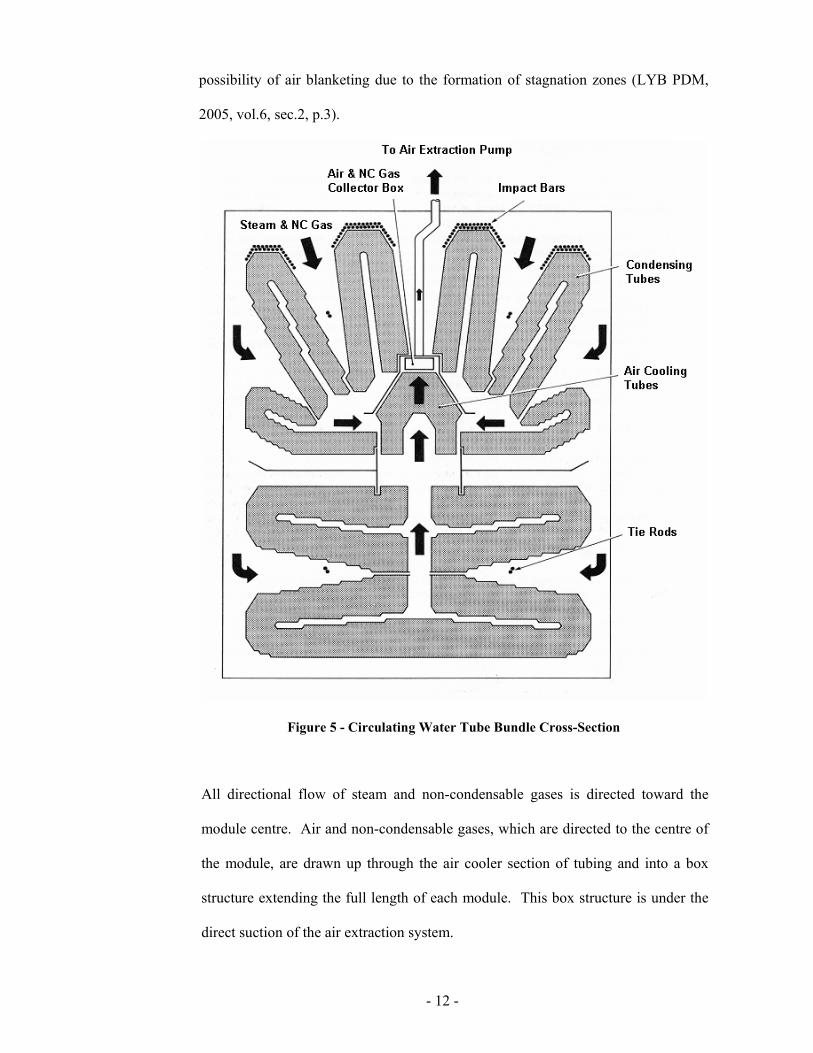
- 12 -
possibility of air blanketing due to the formation of stagnation zones (LYB PDM,
2005, vol.6, sec.2, p.3).
Figure 5 - Circulating Water Tube Bundle Cross-Section
All directional flow of steam and non-condensable gases is directed toward the
module centre. Air and non-condensable gases, which are directed to the centre of
the module, are drawn up through the air cooler section of tubing and into a box
structure extending the full length of each module. This box structure is under the
direct suction of the air extraction system.
- 13 -
As the steam condenses on the upper tubes, it falls as condensate to the bottom
section of the condenser known as the ‘hotwell’. This falling condensate exchanges
heat with the steam that it comes in contact with, assisting condensation while
maintaining the condensate temperature up to that of the turbine exhaust steam
(Reid & Renshaw, 1988, p.914).
Maintaining condensate temperature near the turbine exhaust temperature and
eliminating sub-cooling is essential for two reasons. If excessive heat is removed
from the condensate then:
• Additional heat must be provided by the feed heating plant and boiler, which
will lower the overall thermal cycle efficiency.
• The level of dissolved oxygen in the condensate increases, due to the greater
solubility of oxygen at lower temperatures (Harpster & Putman, 2000,
pp.3-4) and if left unchecked will eventually lead to increased boiler tube
corrosion.
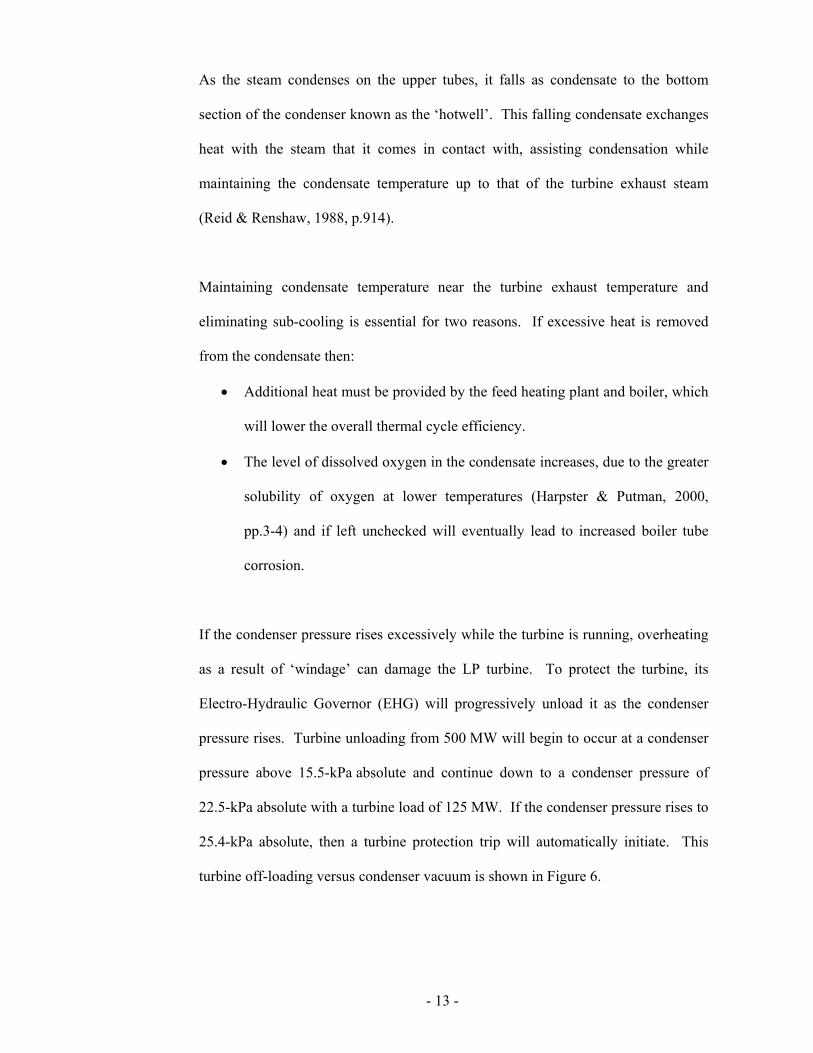
If the condenser pressure rises excessively while the turbine is running, overheating
as a result of ‘windage’ can damage the LP turbine. To protect the turbine, its
Electro-Hydraulic Governor (EHG) will progressively unload it as the condenser
pressure rises. Turbine unloading from 500 MW will begin to occur at a condenser
pressure above 15.5-kPa absolute and continue down to a condenser pressure of
22.5-kPa absolute with a turbine load of 125 MW. If the condenser pressure rises to
25.4-kPa absolute, then a turbine protection trip will automatically initiate. This
turbine off-loading versus condenser vacuum is shown in Figure 6.
- 14 -
Figure 6 - Turbine Unloading Vs Condenser Vacuum
2.7. The Air Extraction System at Loy Yang ‘B’ Power Station
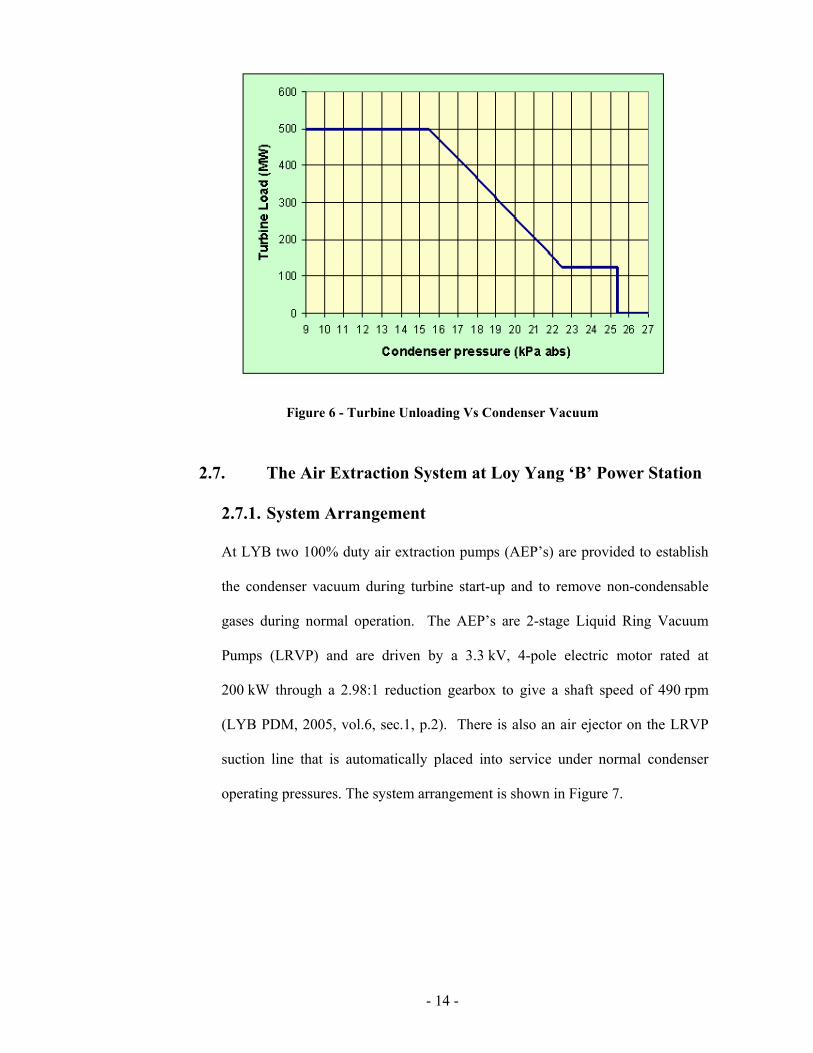
2.7.1. System Arrangement
At LYB two 100% duty air extraction pumps (AEP’s) are provided to establish
the condenser vacuum during turbine start-up and to remove non-condensable
gases during normal operation. The AEP’s are 2-stage Liquid Ring Vacuum
Pumps (LRVP) and are driven by a 3.3 kV, 4-pole electric motor rated at
200 kW through a 2.98:1 reduction gearbox to give a shaft speed of 490 rpm
(LYB PDM, 2005, vol.6, sec.1, p.2). There is also an air ejector on the LRVP
suction line that is automatically placed into service under normal condenser
operating pressures. The system arrangement is shown in Figure 7.
- 15 -
Figure 7 - LYB Air Extraction Pump Arrangement
2.7.2. Modes of Operation
There are two modes of operation for the AEP system, one being a high flow
mode and the other a low flow mode. In the high flow mode (known as
‘hogging’) the air ejector is bypassed by automatically opening the AEP suction
valve and closing the air ejector solenoid valve. This mode is activated if the
AEP suction pressure rises to 16 kPa absolute and above.
- 16 -
When the AEP suction pressure falls to 15 kPa absolute, the low flow mode
(known as ‘holding’) is activated. This is the normal mode of operation at
turbine base load. In this mode the position of the previously mentioned valves
are reversed and a large amount of air is recirculated to act as the motive force
for the air ejector. It is now the air ejector that extracts air from the condenser.
2.7.3. Range of Operating Conditions
Most air extraction systems are designed to cover a wide range of operating
conditions. These operating conditions include:
1. Rapid vacuum raising for turbine start-up – any delay in raising initial
vacuum will delay the return to service of the generating unit. Delays could
cost up to $4.6 million per hour, if the National Electricity Market (NEM)
were trading at its cap price of 10,000/MWh.
2. Turbine partial load operation – reduced turbine loads, particularly in
winter, will result in quite low condenser pressures approaching 3.38-kPa.
3. Turbine base load operation – operation around normal design condenser
pressure of 9.5-kPa with minimal air in-leakage.
4. Steam dumping to condenser – required to hold the condenser vacuum to
acceptable levels with up to 350 MW worth of steam energy being dumped
around the turbine and into the condenser.
5. Operation with a significant air leak – it is required to hold condenser
vacuum below 15.5-kPa, so that the generating unit can maintain full load
until it can be scheduled off for repair.
- 17 -
The design specifications (LYB plant specifications, n.d., sec.3.2) for the current
air extraction system at LYB follows this philosophy and states that each pump
shall be individually capable of:
• Producing a condenser pressure of 30 kPa absolute in approximately
30 minutes from initial starting conditions.
• Producing a condenser pressure of 10 kPa absolute in approximately
45 minutes from initial start.
• Pumping continuously not less than 0.0544 kg/s of air/water vapour
mixture (0.0170 kg/s of dry air) at 21.6 °C and 3.38 kPa absolute of
suction pressure.
• Be capable of maintaining the optimum condenser pressure over the full
range of normal and abnormal operating conditions.
• Have a design life of 30 years.
While this philosophy ensures the air extraction system is very versatile, in
covering all possible operating conditions, it does not place much emphasis on
efficiency of the system while operating the turbine at base load under ‘normal’
conditions. For a base load station, such as LYB, about 99% of turbine
operation occurs at full turbine load and this is where the bulk of efficiency
gains are to be made.
- 18 -
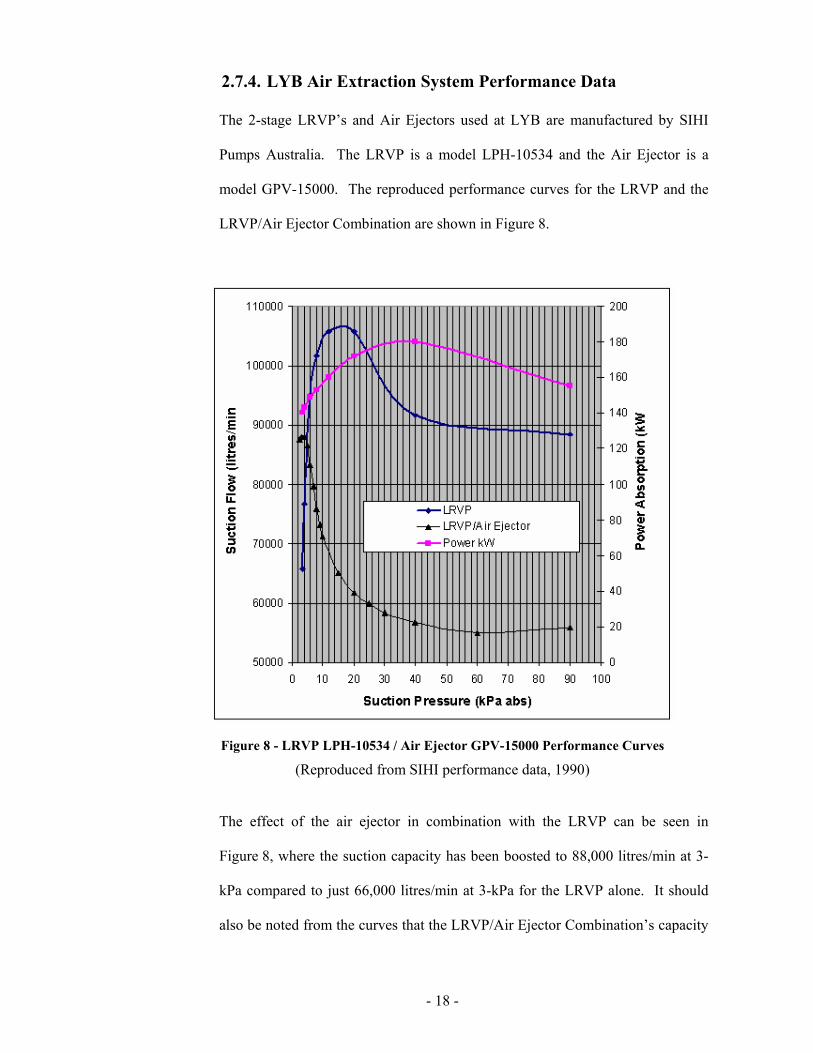
2.7.4. LYB Air Extraction System Performance Data
The 2-stage LRVP’s and Air Ejectors used at LYB are manufactured by SIHI
Pumps Australia. The LRVP is a model LPH-10534 and the Air Ejector is a
model GPV-15000. The reproduced performance curves for the LRVP and the
LRVP/Air Ejector Combination are shown in Figure 8.
Figure 8 - LRVP LPH-10534 / Air Ejector GPV-15000 Performance Curves
(Reproduced from SIHI performance data, 1990)
The effect of the air ejector in combination with the LRVP can be seen in
Figure 8, where the suction capacity has been boosted to 88,000 litres/min at 3-
kPa compared to just 66,000 litres/min at 3-kPa for the LRVP alone. It should
also be noted from the curves that the LRVP/Air Ejector Combination’s capacity
- 19 -
drops off rapidly with rising suction pressure, whereas the LRVP actually
increases rapidly. This is why there are two modes of operation at LYB, which
depend on the condenser pressure at the time.
2.8. Boiler Water Chemistry at Loy Yang B Power Station
There are two different water treatment regimes in use at LYB. These are the
traditional all-volatile treatment (AVT) and the newly adopted oxygenated
treatment (OT). Without going into too much detail, the AVT regime involves
the injection of ammonia hydroxide into the condensate system to control the
water’s pH within a range of 9.2 – 9.6. It also utilizes condensate de-aeration to
maintain low dissolved oxygen levels, typically < 10 parts per billion (ppb).
The OT regime also injects ammonia hydroxide into the condensate, but the
water’s pH is controlled within the range of 8.0 – 8.5. Instead of de-aerating the
condensate to maintain low dissolved oxygen levels, the OT regime actually
injects gaseous oxygen in a controlled manner. The aim of this oxygen injection
is to control the condensate dissolved oxygen level to a range of 30 – 150 ppb.
To prevent removal of gaseous oxygen by de-aeration all feed heater vents and
the de-aerator vent to condenser must remain closed during normal operation.
The OT regime is used during normal running because it fosters the formation of
more stable oxide layers within the boiler circuit and the lower pH levels reduce
the ammonia attack on the condenser tubes. The AVT regime is still used
immediately after boiler start-up, and prior to boiler shutdown, to maintain low
dissolved oxygen levels and to reduce the solubility of the formed oxide layers
- 20 -
by maintaining higher pH levels. This pre-caution ‘conditions’ the boiler water
in case of a prolonged generating unit shutdown.
- 21 -
Chapter 3. LITERATURE REVIEW
3.1. Types of Air Extraction Equipment
3.1.1. Steam Jet Ejector System
The steam jet ejector is a type of vacuum pump with no moving parts and is a
relatively low cost component, which is easy to operate and requires little
maintenance. In a steam jet ejector a steam nozzle discharges a high velocity jet
across a suction chamber. This jet stream creates a vacuum, which induces air
and NC gas into the suction chamber. The air and NC gas are entrained in the
steam and expelled out through a diffuser. The diffuser converts the velocity
energy into pressure energy, which helps to discharge the mixture against a pre-
determined backpressure (Birgenheier, Butzbach, Bolt, Bhatnagar, Ojala &
Aglitz, 1993, p.1).
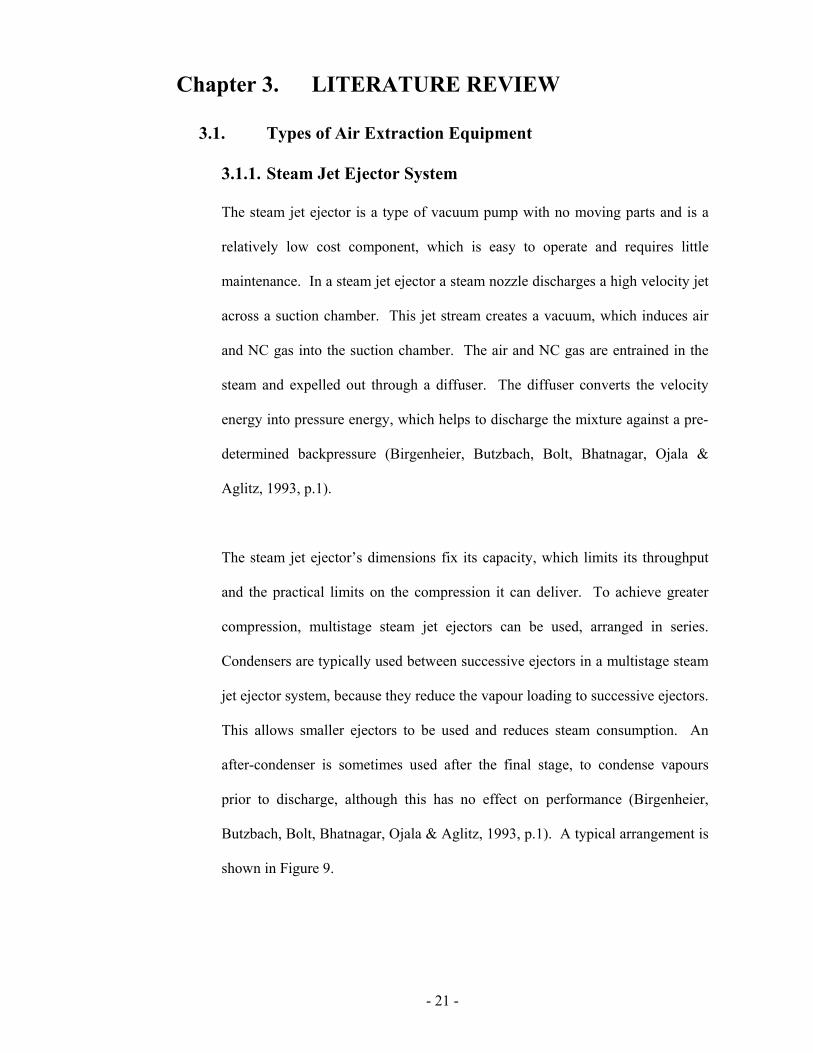
The steam jet ejector’s dimensions fix its capacity, which limits its throughput
and the practical limits on the compression it can deliver. To achieve greater
compression, multistage steam jet ejectors can be used, arranged in series.
Condensers are typically used between successive ejectors in a multistage steam
jet ejector system, because they reduce the vapour loading to successive ejectors.
This allows smaller ejectors to be used and reduces steam consumption. An
after-condenser is sometimes used after the final stage, to condense vapours
prior to discharge, although this has no effect on performance (Birgenheier,
Butzbach, Bolt, Bhatnagar, Ojala & Aglitz, 1993, p.1). A typical arrangement is
shown in Figure 9.
- 22 -
Figure 9 - 2-Stage Steam Ejector System Arrangement
3.1.2. Liquid Ring Vacuum Pump (LRVP) System
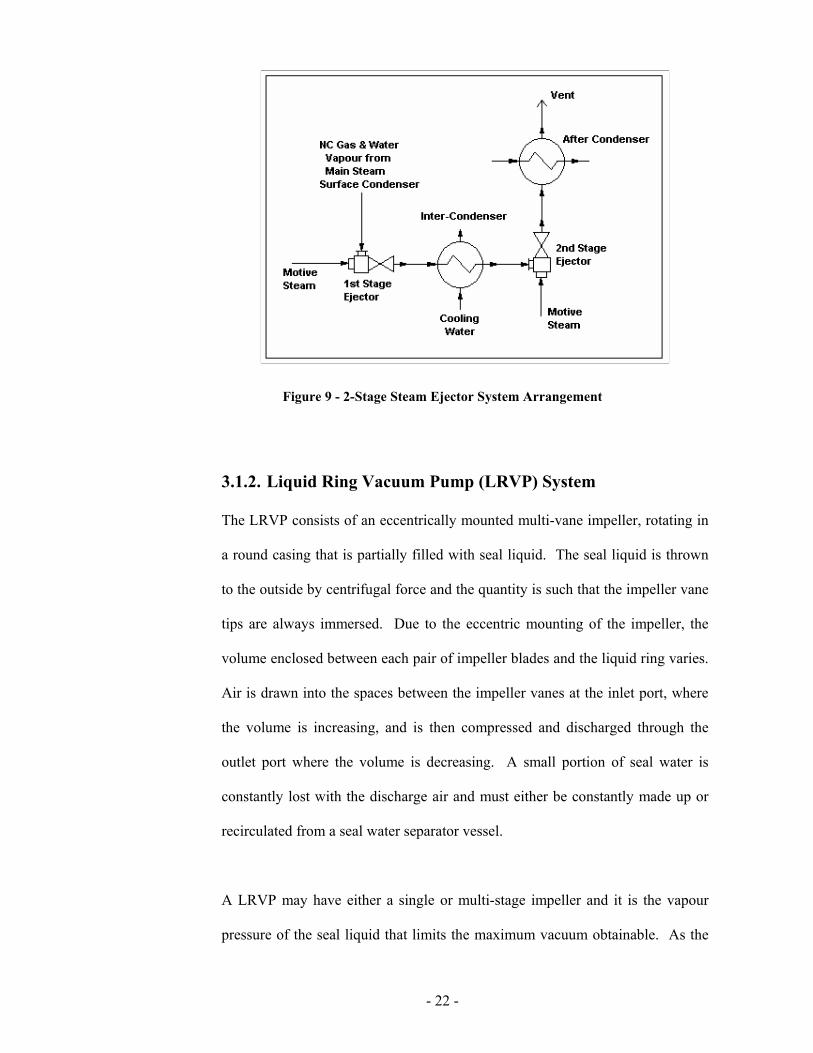
The LRVP consists of an eccentrically mounted multi-vane impeller, rotating in
a round casing that is partially filled with seal liquid. The seal liquid is thrown
to the outside by centrifugal force and the quantity is such that the impeller vane
tips are always immersed. Due to the eccentric mounting of the impeller, the
volume enclosed between each pair of impeller blades and the liquid ring varies.
Air is drawn into the spaces between the impeller vanes at the inlet port, where
the volume is increasing, and is then compressed and discharged through the
outlet port where the volume is decreasing. A small portion of seal water is
constantly lost with the discharge air and must either be constantly made up or
recirculated from a seal water separator vessel.
A LRVP may have either a single or multi-stage impeller and it is the vapour
pressure of the seal liquid that limits the maximum vacuum obtainable. As the
- 23 -
seal liquid absorbs the heat generated by compression and friction, it generally
requires cooling to keep it below its saturation temperature. If the seal liquid is
allowed to heat up and vaporize, it will take up impeller space and reduce the
capacity of the LRVP. If this is allowed to continue, cavitation will occur
inside the LRVP, resulting in damage to internal surfaces.
To prevent cavitation the operating vacuum must be limited to 0.85 kPa above
the vapour pressure of the seal liquid (Kubik & Spencer, n.d., p.4). LRVP’s are
positive displacement by nature and if there is insufficient suction load, the
suction pressure can fall to the vapour pressure of the seal liquid, causing
destructive cavitation to occur. A typical cross section of a LRVP is shown in
Figure 10, with a typical system arrangement shown in Figure 11.
Figure 10 - Cross Section of a LRVP
Some modern LRVP also spray the seal water into the suction line to sub-cool
and condense any incoming steam vapour, which reduces the incoming suction
volume and increases the LRVP’s capacity (Nash, 2005, p.4)
- 24 -
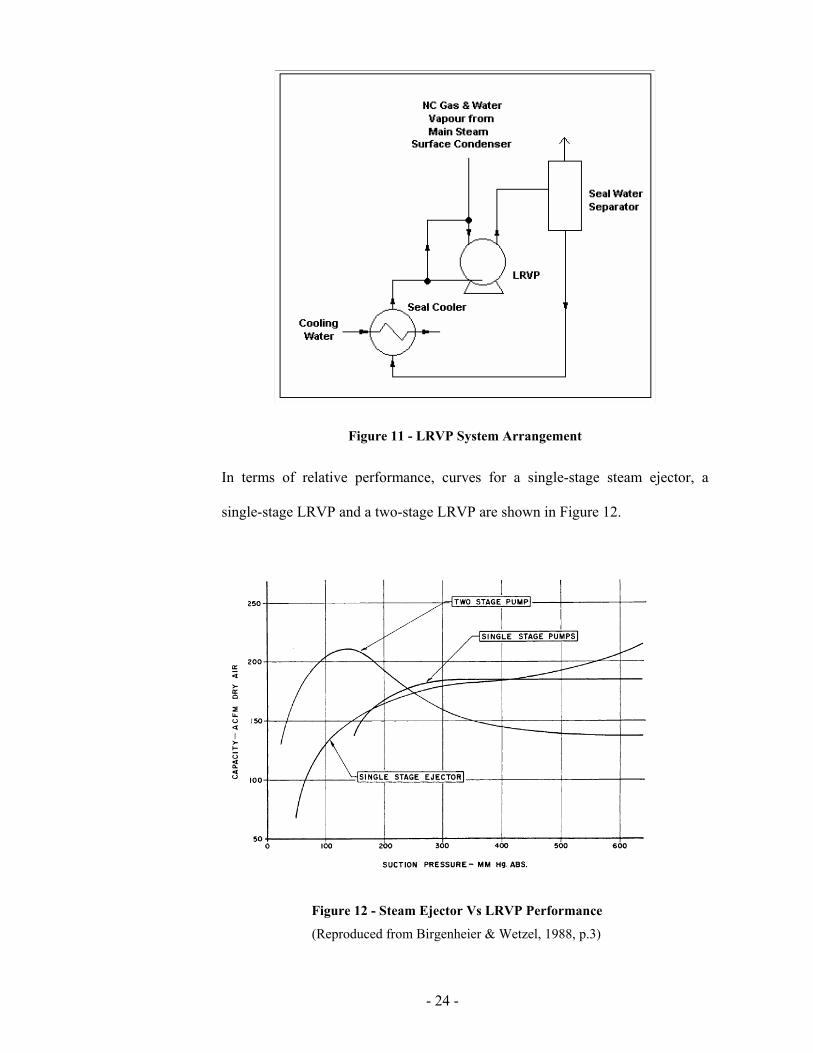
Figure 11 - LRVP System Arrangement
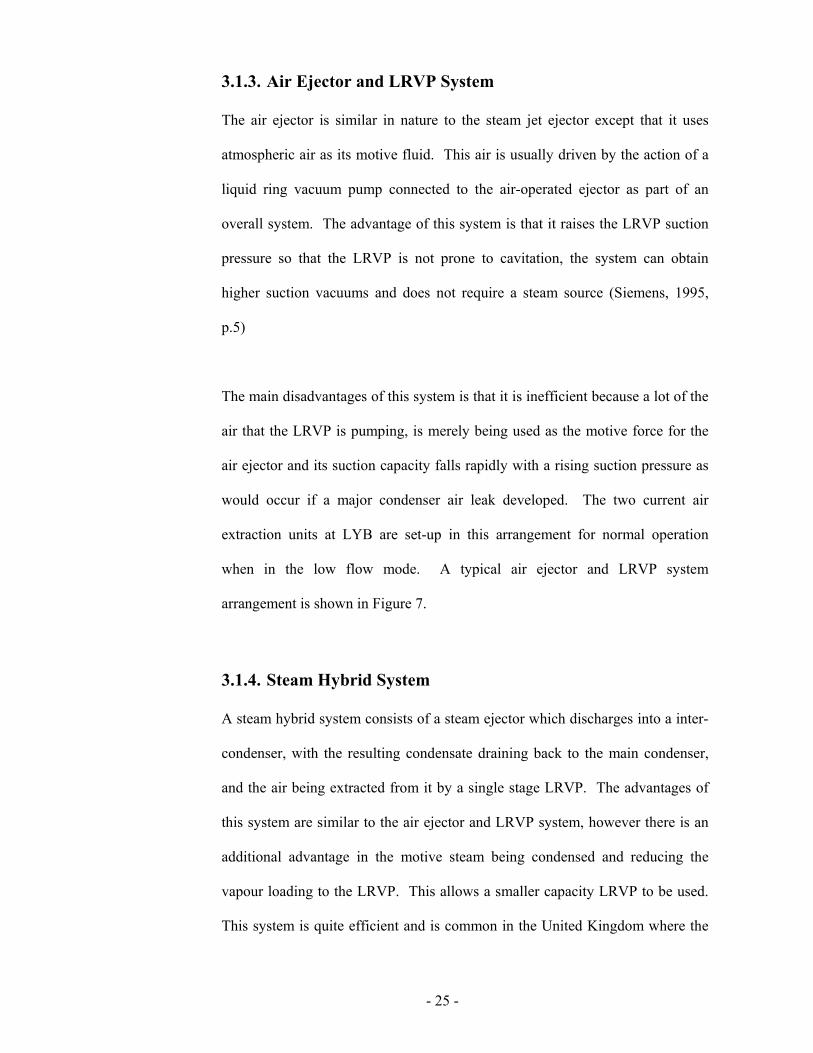
In terms of relative performance, curves for a single-stage steam ejector, a
single-stage LRVP and a two-stage LRVP are shown in Figure 12.
Figure 12 - Steam Ejector Vs LRVP Performance
(Reproduced from Birgenheier & Wetzel, 1988, p.3)
- 25 -
3.1.3. Air Ejector and LRVP System
The air ejector is similar in nature to the steam jet ejector except that it uses
atmospheric air as its motive fluid. This air is usually driven by the action of a
liquid ring vacuum pump connected to the air-operated ejector as part of an
overall system. The advantage of this system is that it raises the LRVP suction
pressure so that the LRVP is not prone to cavitation, the system can obtain
higher suction vacuums and does not require a steam source (Siemens, 1995,
p.5)
The main disadvantages of this system is that it is inefficient because a lot of the
air that the LRVP is pumping, is merely being used as the motive force for the
air ejector and its suction capacity falls rapidly with a rising suction pressure as
would occur if a major condenser air leak developed. The two current air
extraction units at LYB are set-up in this arrangement for normal operation
when in the low flow mode. A typical air ejector and LRVP system
arrangement is shown in Figure 7.
3.1.4. Steam Hybrid System
A steam hybrid system consists of a steam ejector which discharges into a inter-
condenser, with the resulting condensate draining back to the main condenser,
and the air being extracted from it by a single stage LRVP. The advantages of
this system are similar to the air ejector and LRVP system, however there is an
additional advantage in the motive steam being condensed and reducing the
vapour loading to the LRVP. This allows a smaller capacity LRVP to be used.
This system is quite efficient and is common in the United Kingdom where the
- 26 -
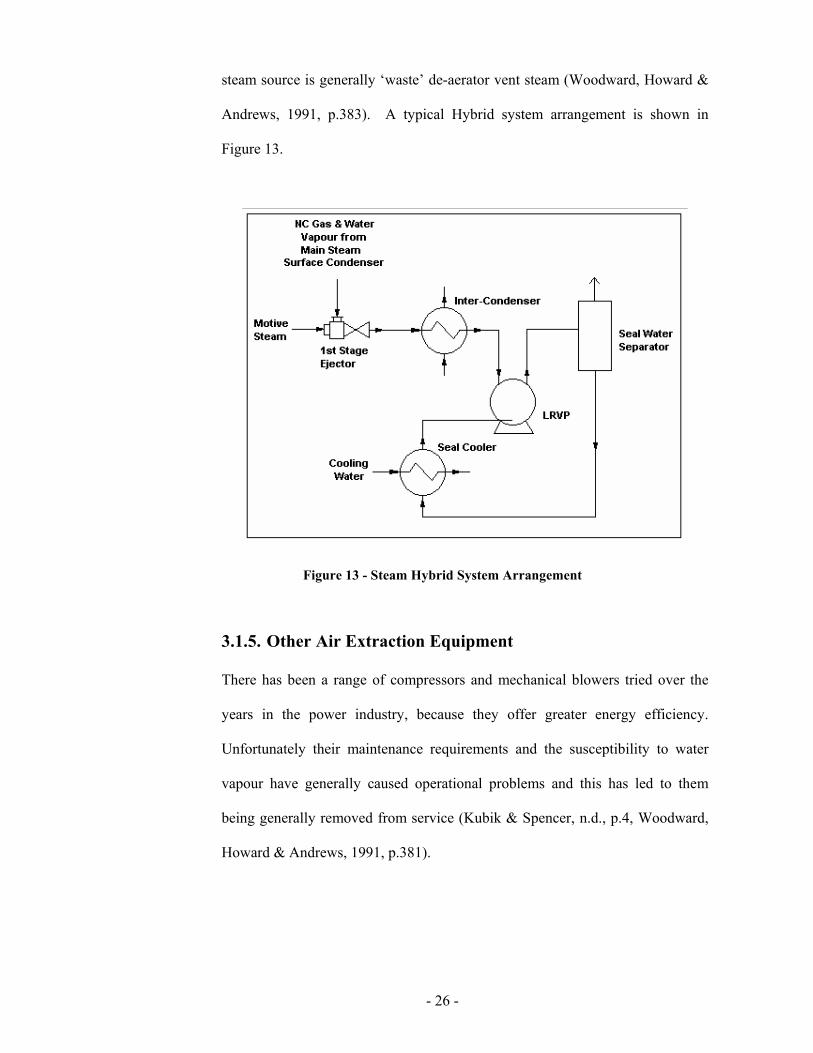
steam source is generally ‘waste’ de-aerator vent steam (Woodward, Howard &
Andrews, 1991, p.383). A typical Hybrid system arrangement is shown in
Figure 13.
Figure 13 - Steam Hybrid System Arrangement
3.1.5. Other Air Extraction Equipment
There has been a range of compressors and mechanical blowers tried over the
years in the power industry, because they offer greater energy efficiency.
Unfortunately their maintenance requirements and the susceptibility to water
vapour have generally caused operational problems and this has led to them
being generally removed from service (Kubik & Spencer, n.d., p.4, Woodward,
Howard & Andrews, 1991, p.381).
- 27 -
3.2. Correct Sizing of Air Extraction Systems
Aliasso (n.d., p.1) states that the information needed to accurately size a liquid
ring vacuum pump includes:
• Suction pressure
• Suction temperature
• Mass flow rate and the molecular weight of fluid components
• Vapour pressure for each fluid component
• Seal fluid data, if other than water
• Temperature of seal fluid or cooling water
• Discharge pressure
The Heat Exchange Institute of the USA (HEI 1995, p.30) specifies that the
condenser venting equipment shall be designed for a suction pressure of
1.0 inch HgA (3.39 kPa abs.), or the condenser design pressure, whichever is
lower. This equates to the lower of 3.39 kPa or 9.5 kPa (LYB plant
specifications, n.d., sec.3.1) giving a design suction pressure of 3.39 kPa
absolute.
The HEI (1995, p.30) also provides guidance on the venting system design
suction temperature and states, “that it shall be the steam saturation temperature
of the venting equipment’s design suction pressure, less the greater of either
0.25(TS-T1) or 7.5 °F (4.2 °C)”, where TS is the condenser saturation
temperature and T1 is the circulating water inlet temperature.
At LYB, TS = 44.8 °C at 9.5 kPa abs and T1 = 27 °C at design specifications
(LYB plant specifications, n.d., sec.3.1). Interpolating from Rodgers & Mayhew
(1996, p.2), the steam saturation temperature at 3.39 kPa is 26.1 °C. Therefore
- 28 -
the design suction temperature of the venting equipment, as specified by the
HEI, can be calculated as follows:
CT °=−=−×−= 7.2145.41.26))278.44(25.0(1.26
When the air extraction system is venting the steam condenser it will draw off
not only air and NC gases, but also water vapour. The HEI (1995, p.30)
provides the following formula to calculate the water vapour load, to saturate the
non-condensable gases:
Wt
W
NC PPP
MWW
−×=
18
Where: W = lb. of water vapour per lb. of non-condensable gas MWNC = molecular weight of non-condensable gas PW = absolute “water vapour” pressure corresponding to temperature at condenser vent outlet, in. HgA Pt = absolute “total” pressure at condenser vent outlet, in. HgA
However, when the non-condensable gas is dry air, W may be obtained directly
from the HEI’s (1995) “Standards for steam surface condensers”- Appendix E.
Using the previously obtained design suction temperature of 21.7 °C and
pressure of 3.39 kPa absolute, the water vapour load from Appendix E can be
read off as:
W = 2.05 kg water vapour/kg of dry air.
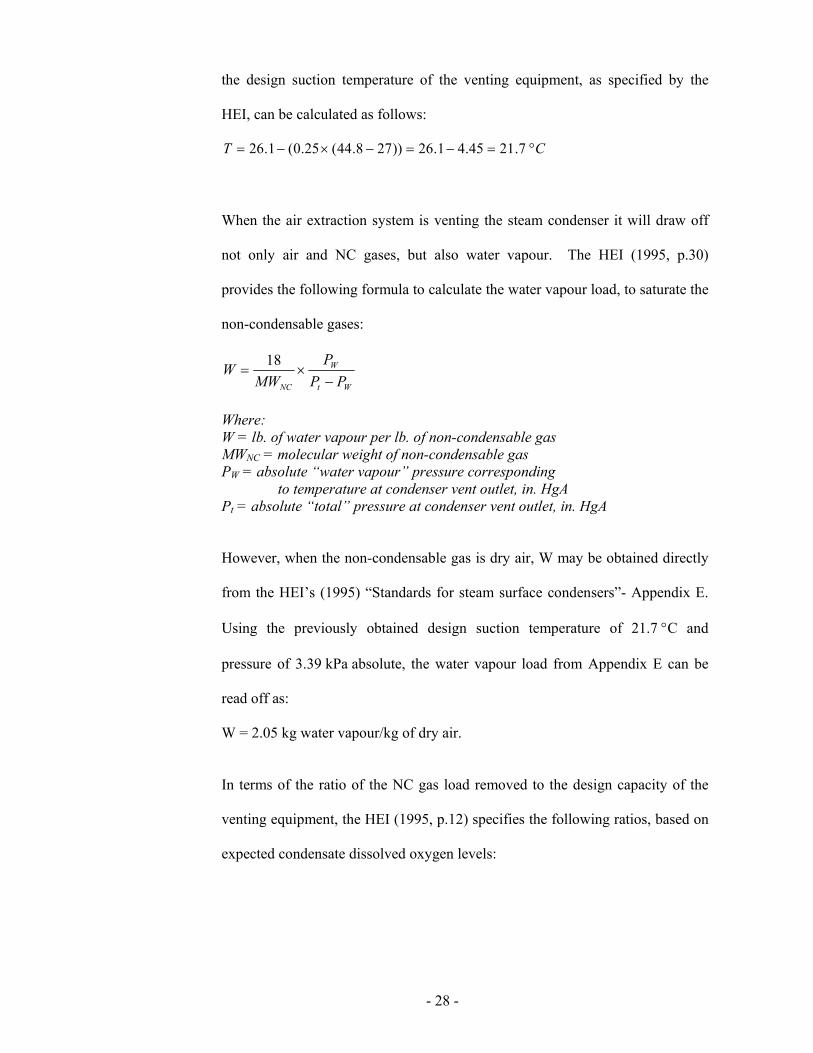
In terms of the ratio of the NC gas load removed to the design capacity of the
venting equipment, the HEI (1995, p.12) specifies the following ratios, based on
expected condensate dissolved oxygen levels:
- 29 -
Table 2 - HEI Recommended Design Over-Venting
Design Capacity (SCFM)
Actual Load/Design Capacity Ratio
Condensate Oxygen Content (ppb)
0.50 42 0.24 14
20 – 40
0.15 7
It can be seen from the HEI Load/Design Capacity recommendations that
considerable over-design of the venting system is required in order to achieve
very low oxygen levels.
There is a range of international standards available to determine the design
capacity of venting systems for steam condensers, in power stations. Some of
these standards include, the American HEI standard, the British BEAMA
standard and the German VGB guideline. The design capacity of the air
extraction system in these standards is based on the mass flow of steam into the
condenser at rated load.
Based on the LYB steam flow into the condenser of 283 kg/s at a rated load of
500 MW with two condenser inlet openings, the HEI standard specifies a design
capacity of 51.1 kg/h of dry air (HEI, 1995, Table 9). The German VGB
guideline however specifies a design capacity of around 19.0 kg/h which,
although less than the HEI standard, is still considered a conservative guideline
(Siemens, 1995, p.2). Using equation 6, in Appendix B, these capacities equate
to 707 litres/min and 263 litres/min of dry air respectively.
- 30 -
The HEI recommended maximum allowable condenser air in-leakage rate is
specified as 1 scfm per 100 MW of generating capacity and this figure is
endorsed by the Electrical Power Research Institute (EPRI) of the USA as being
a suitable limit for maintaining condensate chemical conditions (Dooley, 2002,
C-1). Using equation 7, in Appendix B, this equates to 142 litres/min of
condenser dry air in-leakage based on 5 scfm for a base load of 500 MW at
LYB.
While the intention of this project is to minimize the in-house energy
consumption at LYB by optimising the capacity and design of the condenser air
extraction system, Kubik & Spencer (n.d., p.6) contend that “it is difficult to
understand the obsessive desire to ‘undersize’ the venting system when the
energy consumption of all venting systems is minuscule when compared to the
total quantity of energy involved in the equipment serviced.”
They then go on to say that, “in fact inadequate condenser venting can result in
energy losses in the plant heat rate greater than the parasitic in-house power
saved by selecting a smaller capacity venting system.” They particularly make
the point that under turbine partial load conditions, the capacity of the venting
system may drop off, with the venting system limiting condenser vacuum
instead of the condenser. This situation can result in substantial plant heat rate
losses.
Although some of the argument put by Kubik & Spencer holds true, depending
on the design of the air extraction system employed, it is still reasonable to try
- 31 -
and attempt to minimize the in-house energy consumption. As with all
engineering design decisions, it is essentially a question of arriving at the most
economical and feasible design, which also meets all the practical performance
criteria.
3.3. Efficiency of Air Extraction Systems
As a benchmark on relative efficiency, Woodward, Howard & Andrews (1991,
p.383) mention about an air extraction system that has gained popularity in the
United Kingdom (UK) 660 MW market due to its low power requirement. This
steam hybrid system consists of a steam jet ejector utilizing de-aerator ‘waste’
steam to the condenser as its motive force and a LRVP. It is claimed that this
system has a “low power consumption of about 0.727 kW/kg/h of air, which is
approximately half that of other systems”.
As a rough comparison, based on approximately 200 kW of input power and
discharge airflow of 0.0170 kg/s, the power consumption for LYB is
3.268 kW/kg/h. This power consumption is approximately 450% higher than
the UK system mentioned and tends to suggest that there may be significant
room for improvement. It should be noted however that the de-aerator vent to
condenser is left shut at LYB, as part of the requirements for the boiler water OT
chemical treatment, prohibiting this steam source as an available option for this
project.
One reason for this higher power consumption relates to the philosophy of using
the same system to cover the full spectrum of operating conditions likely to be
- 32 -
encountered. The LRVP is a specific form of rotary positive-displacement
pump (Chaudhury, 1996) which requires a minimum load flow, otherwise its
suction pressure will continue to fall until its seal liquid reaches its vapour
pressure. When vapour pressure is reached the seal liquid will flash off and the
pump will cavitate (Lines, Athey & Frens, n.d., p10).
There are several ways of overcoming this problem. Two simple methods are to
install an inlet vacuum relief valve or an air bleed valve (Aliasso, n.d., p.1).
Both of these methods can waste energy if there is over-capacity at the holding
point (Skelton, 1998). Another more innovative approach is to use a variable
frequency drive (VFD) for the LRVP to control its speed and flow capacity.
This can also reduce energy consumption, if the LRVP is running at over-
capacity for the NC gas load (Skelton, 1998).
Yet another common approach is to use a hybrid system that consists of either a
steam jet ejector or an air operated ejector as the primary means of extraction
followed by a LRVP as the secondary means of extraction. (Kubik & Spencer,
n.d., p.4). This system ensures a higher inter-stage pressure for the LRVP
suction and reduces the likelihood of the suction pressure falling to the seal
liquid vapour pressure, providing the seal liquid is kept cool.
The current air extraction system at LYB is one of these hybrid systems. It
utilizes an air-operated ejector in combination with a two stage LRVP when
operating in the ‘holding’ mode. In this mode of operation, most of the LRVP’s
air load is purely re-circulated air used to provide the motive force for the air-
- 33 -
operated ejector. Kubik & Spencer (n.d., p.4) claim that this system is not very
efficient in terms of its energy requirements, because of the large volume of air
that the LRVP is required to pump, and suggest a hybrid system may not even
be necessary for a two stage LRVP.
Compressors and mechanical blowers have been used for condenser exhaust
service, but their use has decreased as maintenance requirements have caused
operating problems with those systems. These devices have perhaps the lowest
energy consumption but have high capital and maintenance costs (Kubik &
Spencer, n.d., p.4). A rotary pump (Le Blanc) which uses water as the motive
fluid was also once commonly used in 500 MW units but is now of little
relevance to modern practice (Woodward, Howard & Andrews, 1991, p.383).
As condenser air extraction is critical to the condenser performance (and the
output of the steam turbine/generator) compressors, mechanical blowers and
rotary pumps are not considered viable options despite their low power
consumption because of potential operating problems associated with high
maintenance.
Another type of air extraction system is a multi-stage steam ejector. Multi-stage
steam ejectors have a low capital cost, are not limited by condenser pressure or
cooling water temperature, have no moving parts, are most reliable and require
the least maintenance of all venting systems (Kubik & Spencer, n.d., p.3). The
major downside of multi-stage steam ejectors is the large amount of energy used
to create the high-pressure motive steam. The relative energy required to run a
- 34 -
two-stage steam ejector has been shown to be approximately double of that for a
two stage LRVP (Kubik & Spencer, n.d., p.5)
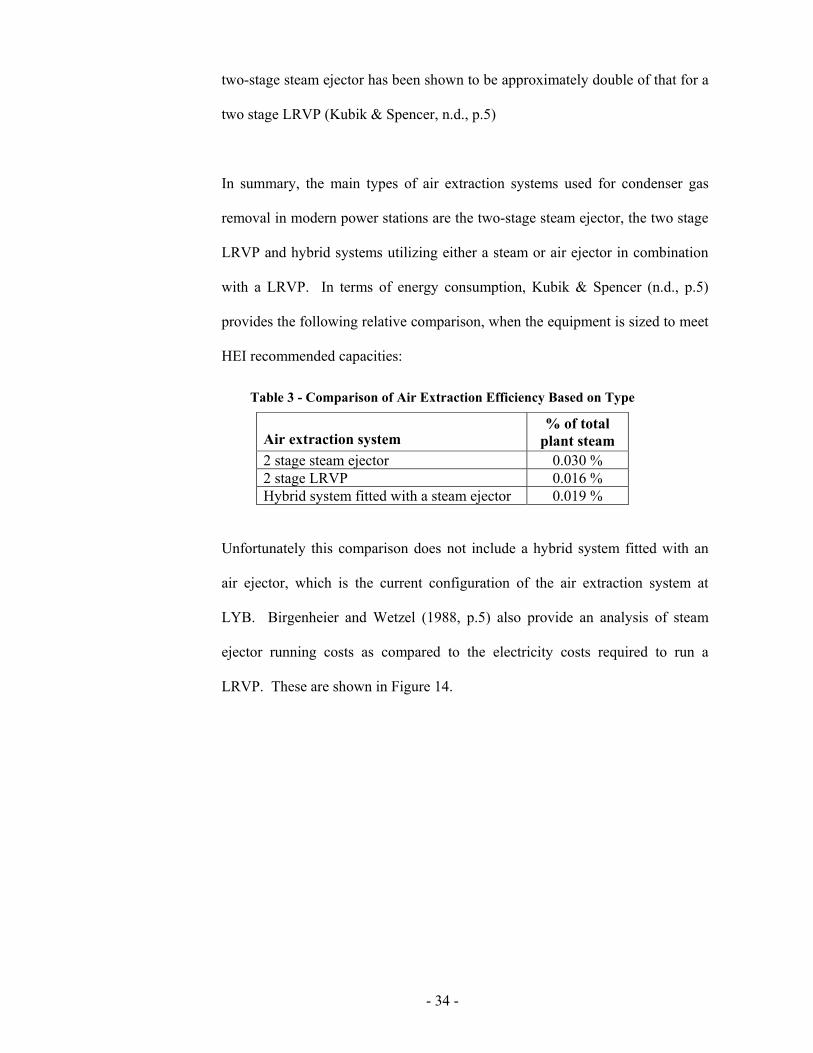
In summary, the main types of air extraction systems used for condenser gas
removal in modern power stations are the two-stage steam ejector, the two stage
LRVP and hybrid systems utilizing either a steam or air ejector in combination
with a LRVP. In terms of energy consumption, Kubik & Spencer (n.d., p.5)
provides the following relative comparison, when the equipment is sized to meet
HEI recommended capacities:
Table 3 - Comparison of Air Extraction Efficiency Based on Type
Air extraction system
% of total plant steam
2 stage steam ejector 0.030 % 2 stage LRVP 0.016 % Hybrid system fitted with a steam ejector 0.019 %
Unfortunately this comparison does not include a hybrid system fitted with an
air ejector, which is the current configuration of the air extraction system at
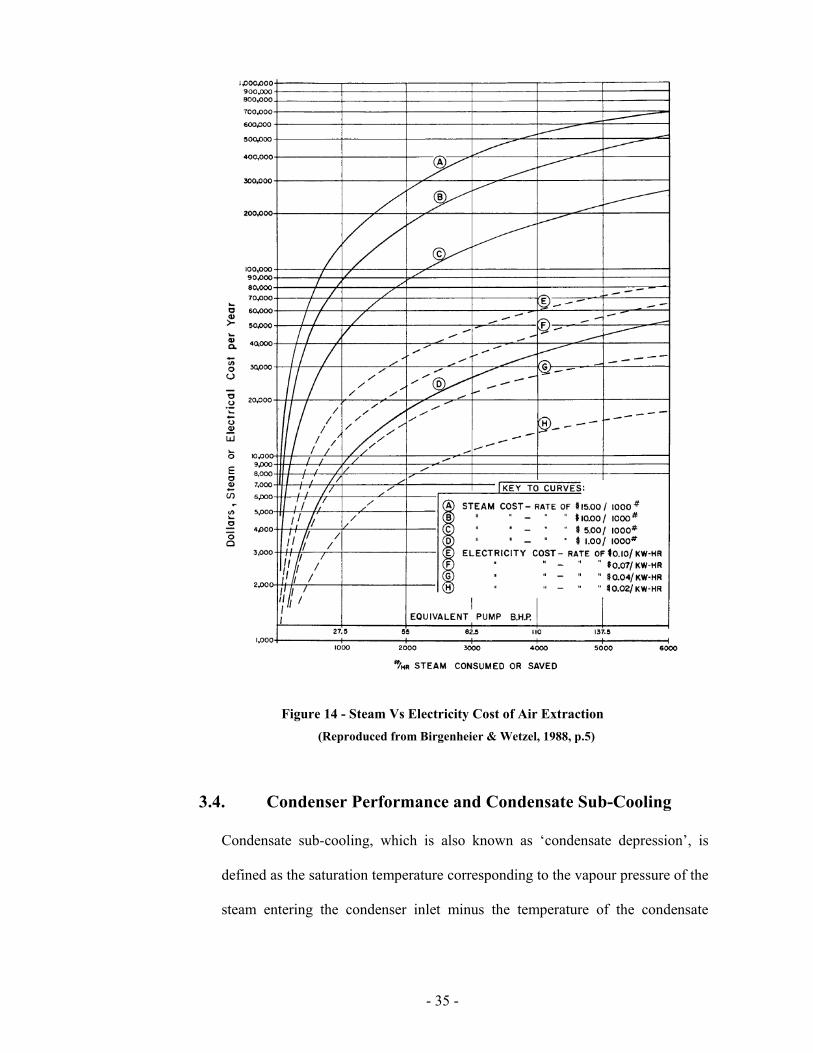
LYB. Birgenheier and Wetzel (1988, p.5) also provide an analysis of steam
ejector running costs as compared to the electricity costs required to run a
LRVP. These are shown in Figure 14.
- 35 -
Figure 14 - Steam Vs Electricity Cost of Air Extraction (Reproduced from Birgenheier & Wetzel, 1988, p.5)
3.4. Condenser Performance and Condensate Sub-Cooling
Condensate sub-cooling, which is also known as ‘condensate depression’, is
defined as the saturation temperature corresponding to the vapour pressure of the
steam entering the condenser inlet minus the temperature of the condensate
- 36 -
leaving the condenser ‘hotwell’. Condensate sub-cooling is undesirable because
it means that excess heat, which serves no useful purpose, has been removed
during the condensation process. This additional heat removed, must then be re-
added to the thermal cycle by providing additional boiler firing.
A one-degree drop in the condensate temperature from the specified hotwell
temperature of 44.8 °C (LYB plant specifications, n.d., sec.3.1) will result in a
heat loss of 4.15 kJ/kg (Rodgers & Mayhew, 1996, p.2). Based on a condensate
flow rate at LYB of 298.384 kg/s (Hitachi, 1991, Drg. JD-130-740) this
represents a heat loss from the condensate of 1.238 MW/°C. With the overall
thermal cycle efficiency at LYB being around 38%, every one-degree of
condensate sub-cooling will require an extra 3.258 MW of heat energy to be
added by the boiler.
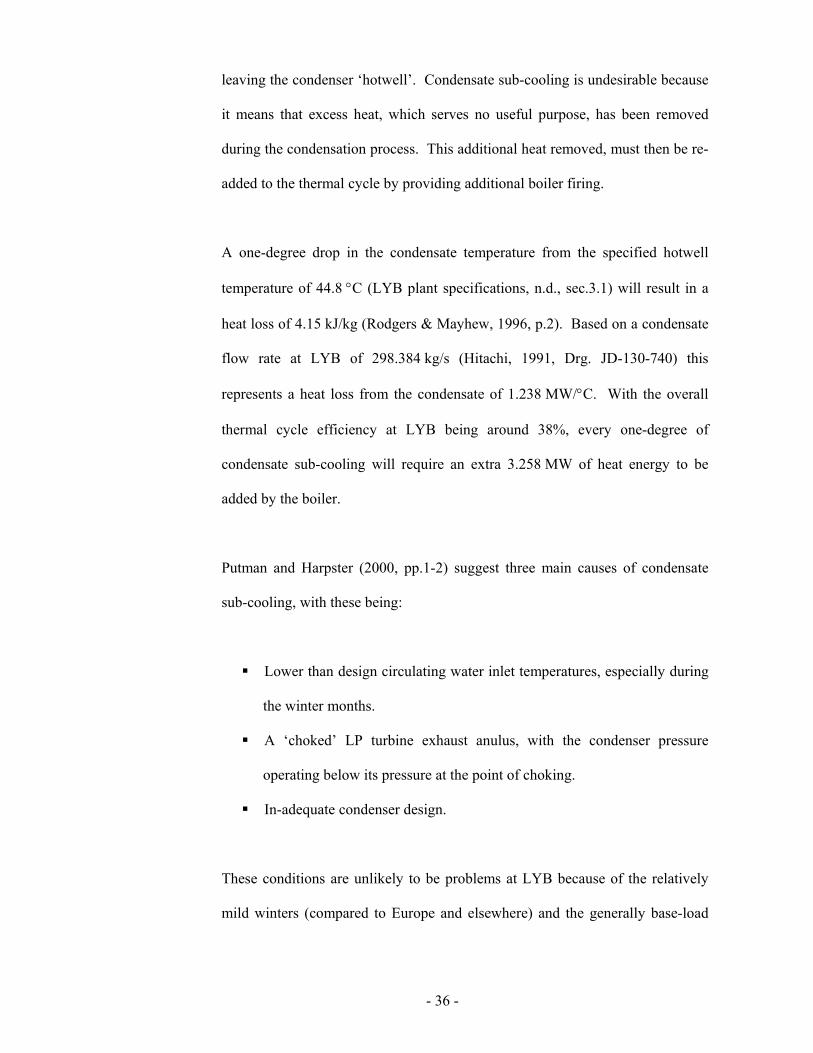
Putman and Harpster (2000, pp.1-2) suggest three main causes of condensate
sub-cooling, with these being:
Lower than design circulating water inlet temperatures, especially during
the winter months.
A ‘choked’ LP turbine exhaust anulus, with the condenser pressure
operating below its pressure at the point of choking.
In-adequate condenser design.
These conditions are unlikely to be problems at LYB because of the relatively
mild winters (compared to Europe and elsewhere) and the generally base-load
- 37 -
turbine load profile. Despite this, because of the large energy losses, which can
be incurred, an evaluation of condensate sub-cooling will be made during
turbine load operation in winter.
An accepted method to measure the condenser performance is to calculate the
Terminal Temperature Difference (TTD) because the condenser overall heat
transfer co-efficient is related to it by an inverse function (Trela, Butrymowicz,
Gluch, Gardzilewicz, Ihnatowicz, & Zieliński, 2000, p.2). Therefore a decrease
in the condenser overall heat transfer co-efficient results in a rise of the
condenser TTD and vice-versa.
The condenser (TTD) is calculated as the turbine exhaust steam temperature
minus the circulating water outlet temperature. At LYB the specified condenser
TTD is 3.2 °C, with a cleanliness factor of 85% (LYB plant specifications, n.d.,
sec.3.2). Factors that will adversely affect the condenser TTD are condenser
tube fouling internally on the CW side and condenser tube blanketing externally
on the steam side, due to insufficient NC gas removal.
In colder weather the circulating water inlet temperature will drop due to
improved cooling tower performance. The circulating water outlet temperature
will also drop in response, because the same amount of heat needs to be
transferred, and the temperature difference between the circulating water inlet
and outlet will remain the same. The lower circulating water inlet temperature
will result in improved condenser performance and hence lower condenser
pressures and steam saturation temperatures.
- 38 -
If the turbine happens to be operating at partial load, then the amount of heat
transfer will be even less with the condenser pressure reducing even further. At
lower condenser pressures the specific volume of steam increases rapidly. It is
under these conditions that choking of the turbine exhaust anulus can occur due
to the increased steam volume passing through it. If the turbine exhaust anulus
becomes ‘choked’, and the turbine pressure falls further due to even colder
circulating water inlet temperatures, then sub-cooling will result.
As mentioned previously in Chapter 2.5 accumulated air and other NC gases can
also cause condensate sub-cooling by lowering the localised steam saturation
temperature.
- 39 -
Chapter 4. CURRENT SYSTEM EVALUATION
4.1. LYB Condenser Air In-Leakage Rates
There is an installed paddle wheel type flow meter on the discharge pipe of each
generating unit’s air extraction system. These meters were reading an erratic 0.7
–1.0 litres/min. There were major doubts about the accuracy of these meters,
not only because of the erratic readings, but because the 50 mm paddle wheel
was measuring the airflow in a 250 mm discharge pipe with extremely low
discharge velocities.
Attempts had been made previously by the engineering group to measure the
condenser air in-leakage rates with little success mainly due to the low air
extraction discharge flow and the nature of the metering equipment used.
Initially it was decided to determine how close the air in-leakage rates were to
the air extraction system’s specified design flow capacity of 0.017 kg/s. Using
equation 6, in Appendix B, this equates to 847 litres/min.
To measure the discharge airflow, all alternative discharge points were blocked
off so that the system discharge airflow was forced through a 25 mm vent line
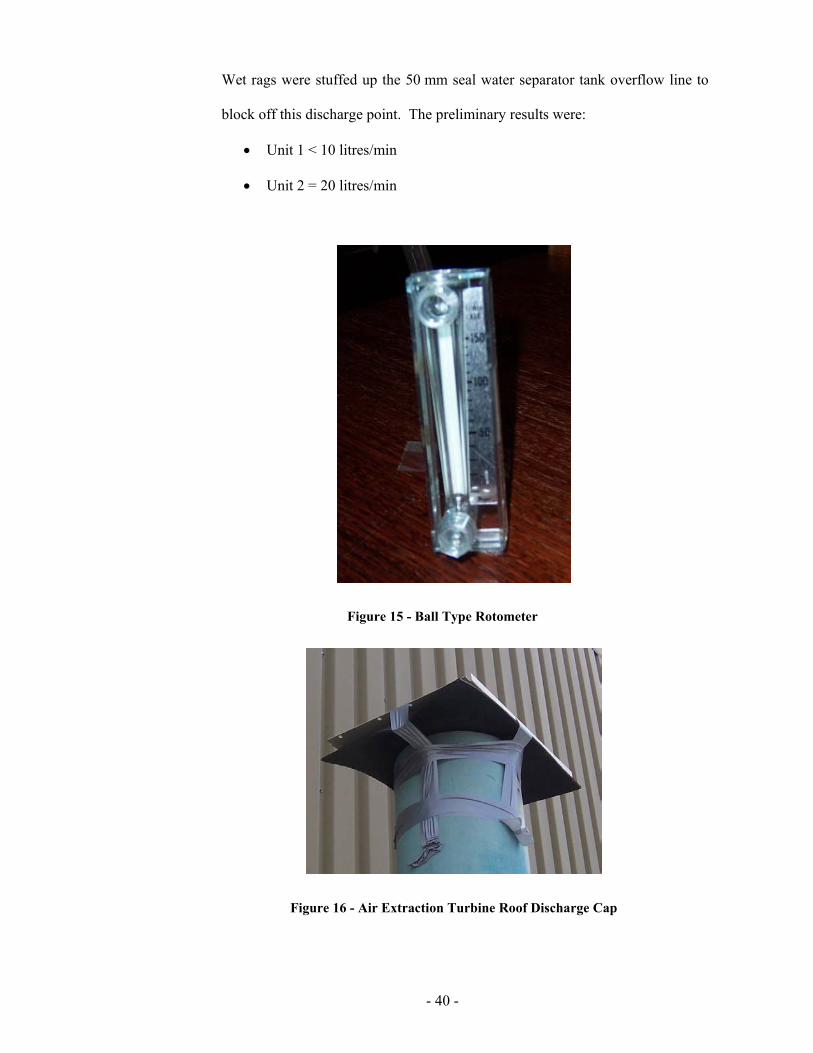
and ball type ‘Rotometer’ (0-150 litres/min) mounted at the turbine floor level.
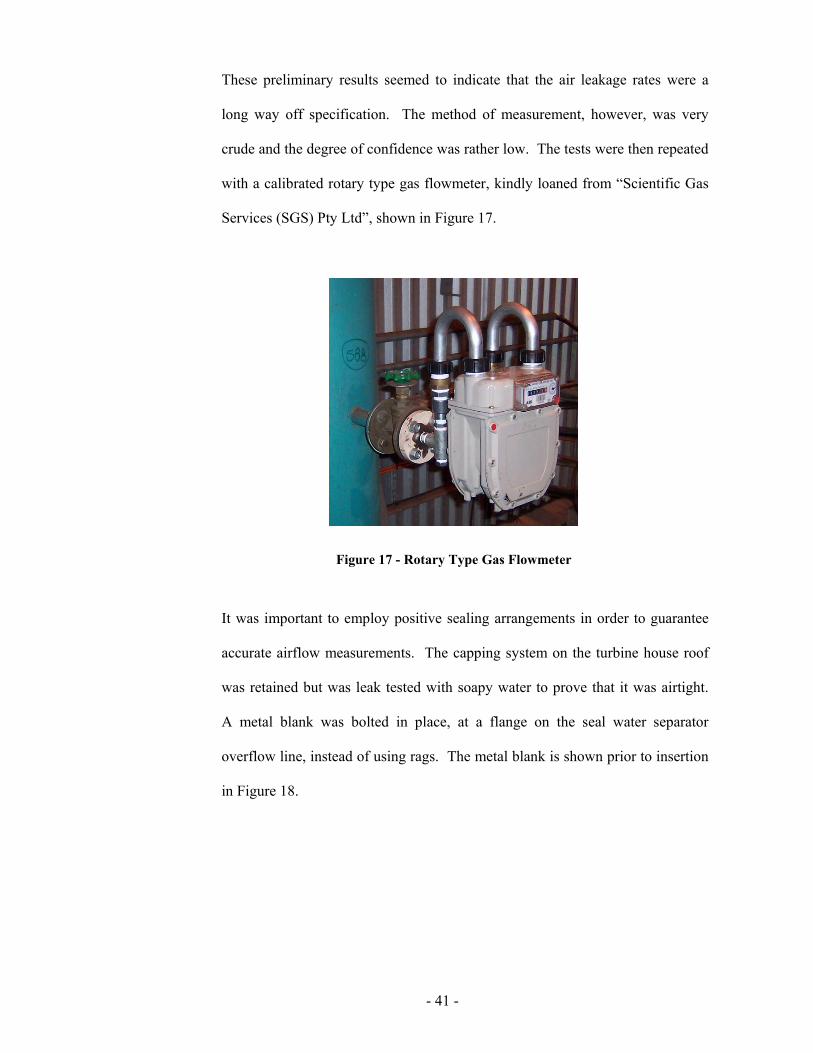
The ‘Rotometer’ used is shown in Figure 15. A rubber pad and weighted steel
plate, held in place with duct tape, was used to cap off the 250 mm discharge
pipe on the turbine house roof, as shown in Figure 16.
- 40 -
Wet rags were stuffed up the 50 mm seal water separator tank overflow line to
block off this discharge point. The preliminary results were:
• Unit 1 < 10 litres/min
• Unit 2 = 20 litres/min
Figure 15 - Ball Type Rotometer
Figure 16 - Air Extraction Turbine Roof Discharge Cap
- 41 -
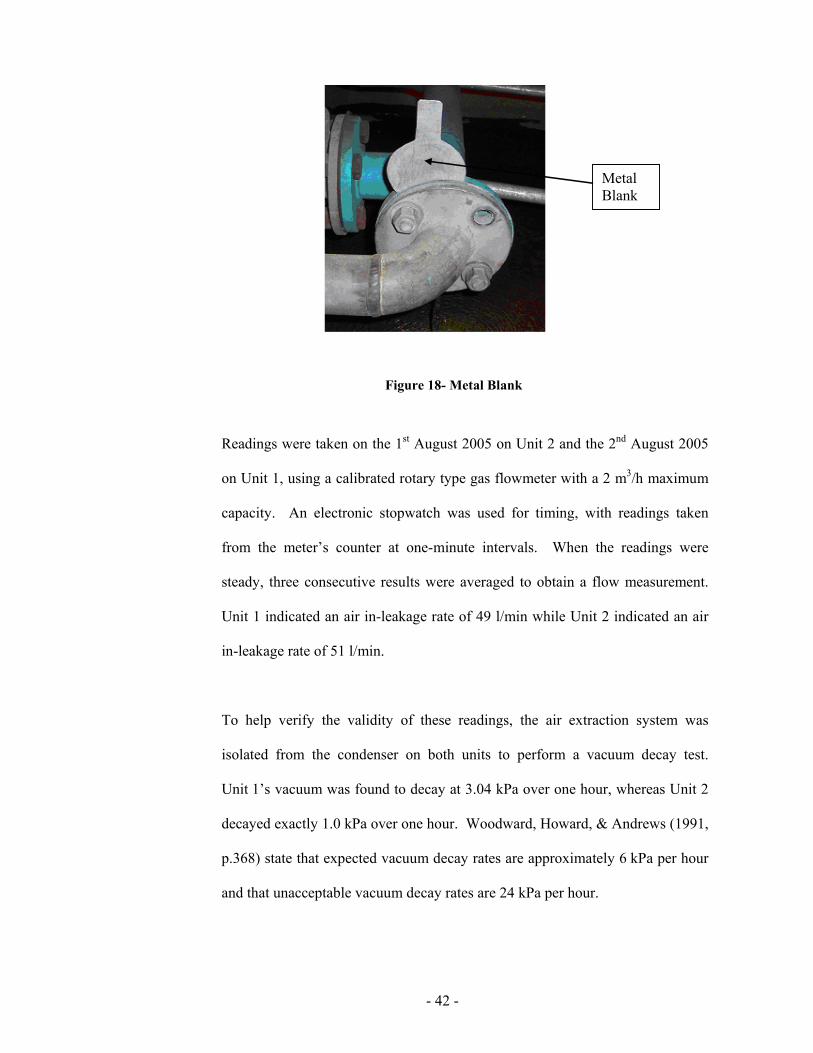
These preliminary results seemed to indicate that the air leakage rates were a
long way off specification. The method of measurement, however, was very
crude and the degree of confidence was rather low. The tests were then repeated
with a calibrated rotary type gas flowmeter, kindly loaned from “Scientific Gas
Services (SGS) Pty Ltd”, shown in Figure 17.
Figure 17 - Rotary Type Gas Flowmeter
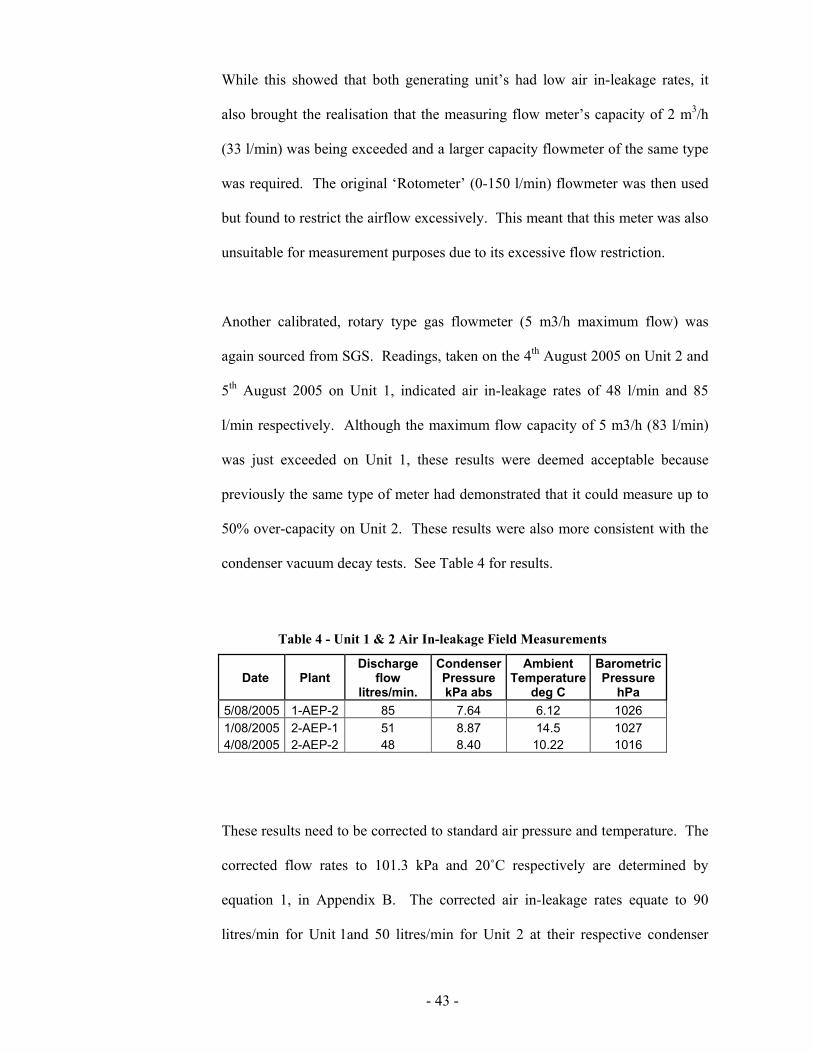
It was important to employ positive sealing arrangements in order to guarantee
accurate airflow measurements. The capping system on the turbine house roof
was retained but was leak tested with soapy water to prove that it was airtight.
A metal blank was bolted in place, at a flange on the seal water separator
overflow line, instead of using rags. The metal blank is shown prior to insertion
in Figure 18.
- 42 -
Figure 18- Metal Blank
Readings were taken on the 1st August 2005 on Unit 2 and the 2nd August 2005
on Unit 1, using a calibrated rotary type gas flowmeter with a 2 m3/h maximum
capacity. An electronic stopwatch was used for timing, with readings taken
from the meter’s counter at one-minute intervals. When the readings were
steady, three consecutive results were averaged to obtain a flow measurement.
Unit 1 indicated an air in-leakage rate of 49 l/min while Unit 2 indicated an air
in-leakage rate of 51 l/min.
To help verify the validity of these readings, the air extraction system was
isolated from the condenser on both units to perform a vacuum decay test.
Unit 1’s vacuum was found to decay at 3.04 kPa over one hour, whereas Unit 2
decayed exactly 1.0 kPa over one hour. Woodward, Howard, & Andrews (1991,
p.368) state that expected vacuum decay rates are approximately 6 kPa per hour
and that unacceptable vacuum decay rates are 24 kPa per hour.
Metal Blank
- 43 -
While this showed that both generating unit’s had low air in-leakage rates, it
also brought the realisation that the measuring flow meter’s capacity of 2 m3/h
(33 l/min) was being exceeded and a larger capacity flowmeter of the same type
was required. The original ‘Rotometer’ (0-150 l/min) flowmeter was then used
but found to restrict the airflow excessively. This meant that this meter was also
unsuitable for measurement purposes due to its excessive flow restriction.
Another calibrated, rotary type gas flowmeter (5 m3/h maximum flow) was
again sourced from SGS. Readings, taken on the 4th August 2005 on Unit 2 and
5th August 2005 on Unit 1, indicated air in-leakage rates of 48 l/min and 85
l/min respectively. Although the maximum flow capacity of 5 m3/h (83 l/min)
was just exceeded on Unit 1, these results were deemed acceptable because
previously the same type of meter had demonstrated that it could measure up to
50% over-capacity on Unit 2. These results were also more consistent with the
condenser vacuum decay tests. See Table 4 for results.
Table 4 - Unit 1 & 2 Air In-leakage Field Measurements
Date Plant Discharge
flow litres/min.
Condenser Pressure kPa abs
Ambient Temperature
deg C
Barometric Pressure
hPa 5/08/2005 1-AEP-2 85 7.64 6.12 1026 1/08/2005 2-AEP-1 51 8.87 14.5 1027 4/08/2005 2-AEP-2 48 8.40 10.22 1016
These results need to be corrected to standard air pressure and temperature. The
corrected flow rates to 101.3 kPa and 20˚C respectively are determined by
equation 1, in Appendix B. The corrected air in-leakage rates equate to 90
litres/min for Unit 1and 50 litres/min for Unit 2 at their respective condenser
- 44 -
pressures, at the time of measurement. Condenser air in-leakage will however
increase, when the condenser pressure decreases further at turbine low load
operation. This is because as the pressure difference between the condenser and
atmosphere increases, air will be sucked into the condenser at a greater rate
through the source of the leak.
The measurement of the condenser air in-leakage rate at the normal minimum
load experienced during operation (300 MW) was therefore highly desirable
because, at reduced condenser pressure, the performance of the LRVP would be
at its lowest and the air in-leakage rate at its highest. An absence of electricity
market off-loading during the period of testing meant that deliberate off-loading
would be required in order to perform this test.
Off-loading was estimated to cost $4,400 with a NEM spot price at $11/MWh if
the tests were conducted at 4.00 a.m. in the morning. To avoid this cost, it was
decided to instead to determine the increased rate of air in-leakage at lower
condenser pressures analytically rather than experimentally. A relationship
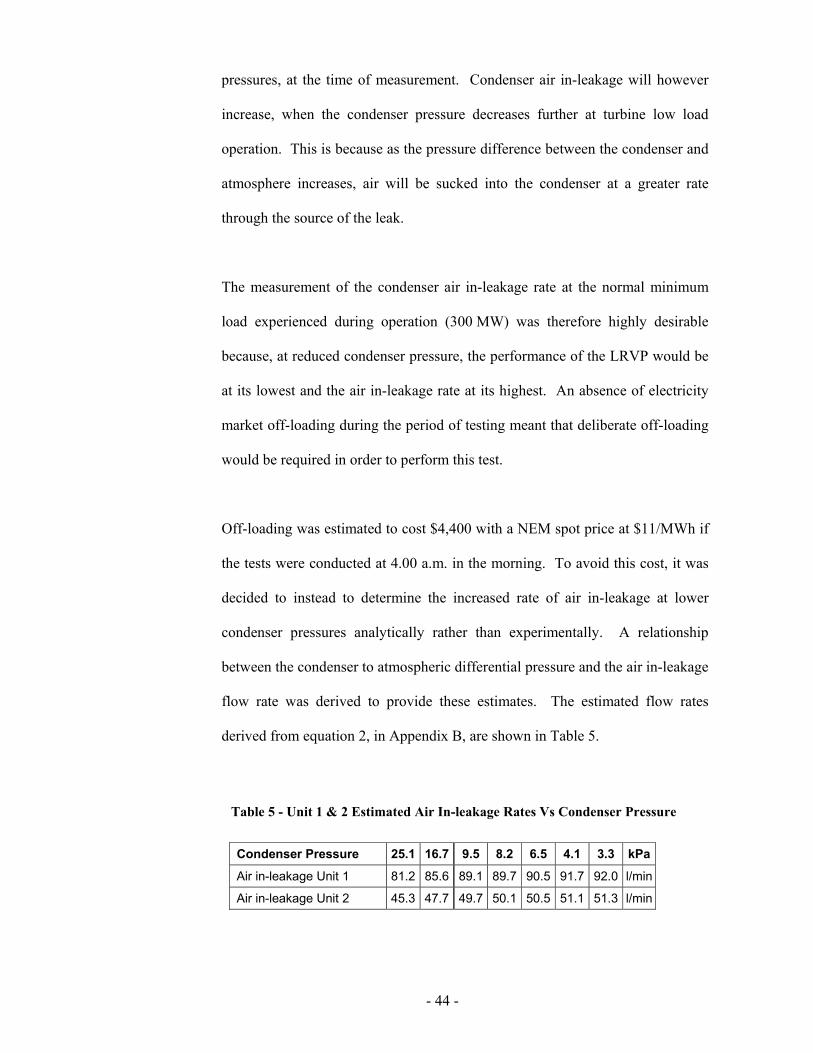
between the condenser to atmospheric differential pressure and the air in-leakage
flow rate was derived to provide these estimates. The estimated flow rates
derived from equation 2, in Appendix B, are shown in Table 5.
Table 5 - Unit 1 & 2 Estimated Air In-leakage Rates Vs Condenser Pressure
Condenser Pressure 25.1 16.7 9.5 8.2 6.5 4.1 3.3 kPa
Air in-leakage Unit 1 81.2 85.6 89.1 89.7 90.5 91.7 92.0 l/min
Air in-leakage Unit 2 45.3 47.7 49.7 50.1 50.5 51.1 51.3 l/min
- 45 -
4.2. LYB Current System Energy Consumption
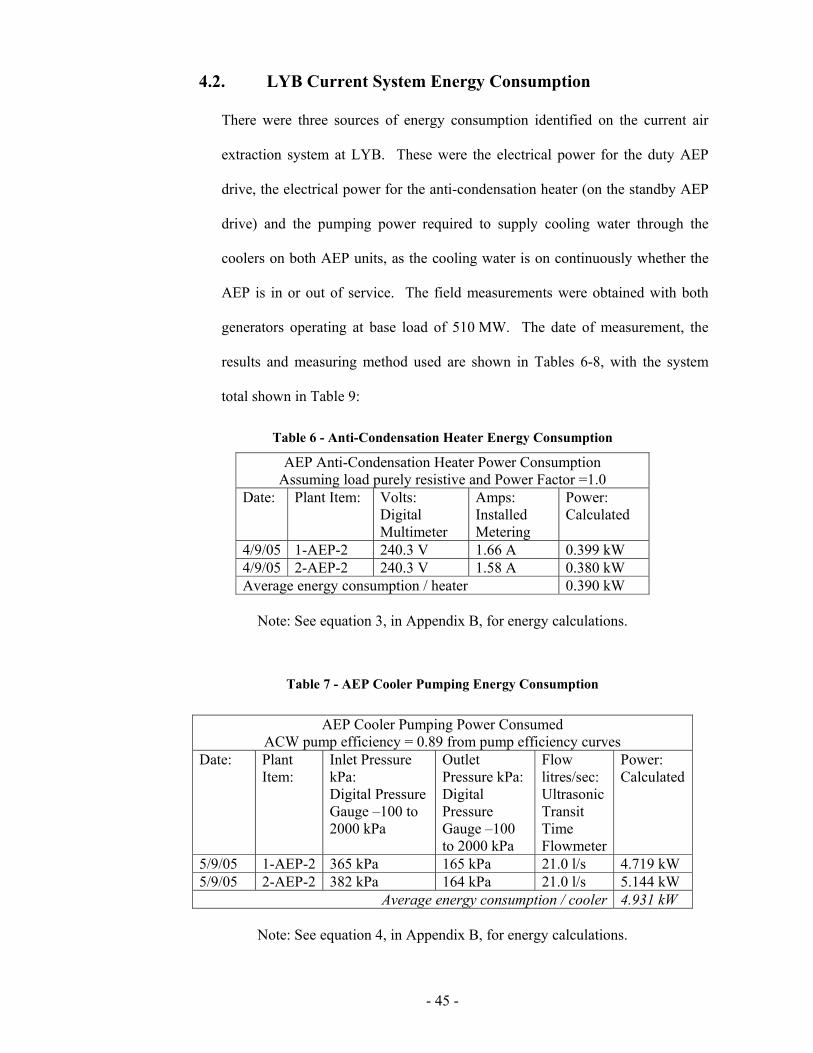
There were three sources of energy consumption identified on the current air
extraction system at LYB. These were the electrical power for the duty AEP
drive, the electrical power for the anti-condensation heater (on the standby AEP
drive) and the pumping power required to supply cooling water through the
coolers on both AEP units, as the cooling water is on continuously whether the
AEP is in or out of service. The field measurements were obtained with both
generators operating at base load of 510 MW. The date of measurement, the
results and measuring method used are shown in Tables 6-8, with the system
total shown in Table 9:
Table 6 - Anti-Condensation Heater Energy Consumption
AEP Anti-Condensation Heater Power Consumption Assuming load purely resistive and Power Factor =1.0
Date: Plant Item: Volts: Digital Multimeter
Amps: Installed Metering
Power: Calculated
4/9/05 1-AEP-2 240.3 V 1.66 A 0.399 kW 4/9/05 2-AEP-2 240.3 V 1.58 A 0.380 kW Average energy consumption / heater 0.390 kW
Note: See equation 3, in Appendix B, for energy calculations.
Table 7 - AEP Cooler Pumping Energy Consumption
AEP Cooler Pumping Power Consumed ACW pump efficiency = 0.89 from pump efficiency curves
Date: Plant Item:
Inlet Pressure kPa: Digital Pressure Gauge –100 to 2000 kPa
Outlet Pressure kPa: Digital Pressure Gauge –100 to 2000 kPa
Flow litres/sec: Ultrasonic Transit Time Flowmeter
Power: Calculated
5/9/05 1-AEP-2 365 kPa 165 kPa 21.0 l/s 4.719 kW 5/9/05 2-AEP-2 382 kPa 164 kPa 21.0 l/s 5.144 kW
Average energy consumption / cooler 4.931 kW
Note: See equation 4, in Appendix B, for energy calculations.
- 46 -
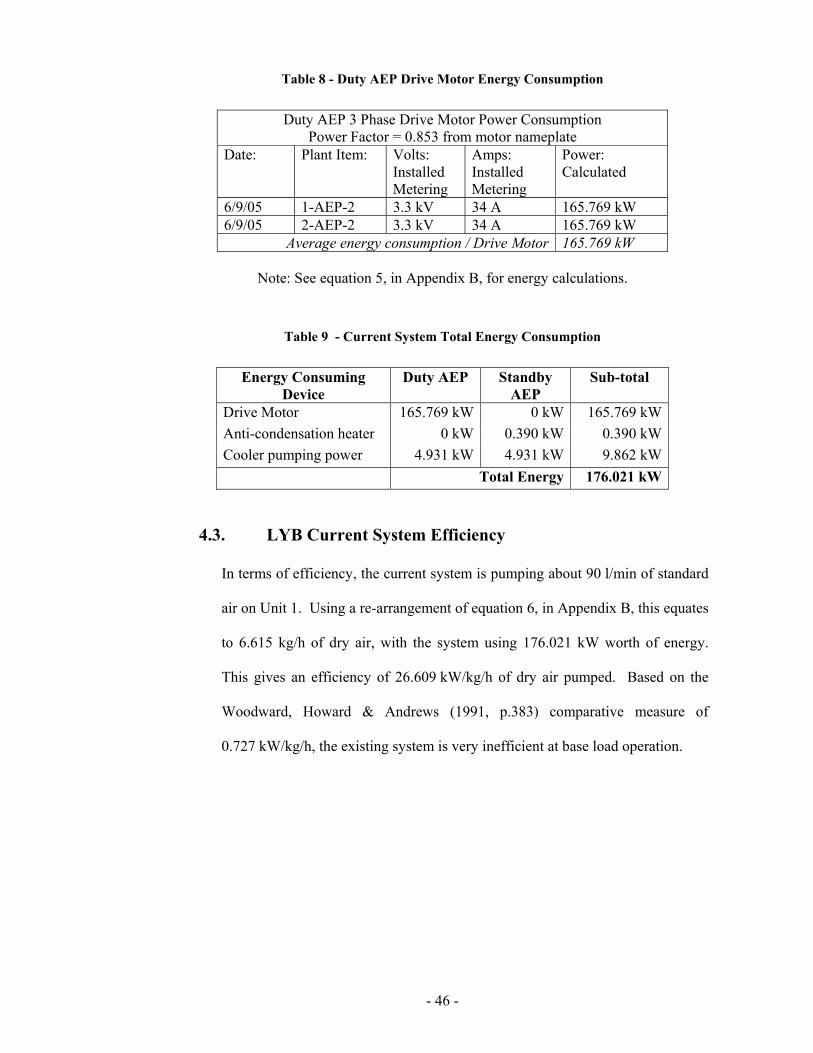
Table 8 - Duty AEP Drive Motor Energy Consumption
Duty AEP 3 Phase Drive Motor Power Consumption Power Factor = 0.853 from motor nameplate
Date: Plant Item: Volts: Installed Metering
Amps: Installed Metering
Power: Calculated
6/9/05 1-AEP-2 3.3 kV 34 A 165.769 kW 6/9/05 2-AEP-2 3.3 kV 34 A 165.769 kW
Average energy consumption / Drive Motor 165.769 kW
Note: See equation 5, in Appendix B, for energy calculations.
Table 9 - Current System Total Energy Consumption
Energy Consuming Device
Duty AEP Standby AEP
Sub-total
Drive Motor 165.769 kW 0 kW 165.769 kWAnti-condensation heater 0 kW 0.390 kW 0.390 kWCooler pumping power 4.931 kW 4.931 kW 9.862 kW Total Energy 176.021 kW
4.3. LYB Current System Efficiency
In terms of efficiency, the current system is pumping about 90 l/min of standard
air on Unit 1. Using a re-arrangement of equation 6, in Appendix B, this equates
to 6.615 kg/h of dry air, with the system using 176.021 kW worth of energy.
This gives an efficiency of 26.609 kW/kg/h of dry air pumped. Based on the
Woodward, Howard & Andrews (1991, p.383) comparative measure of
0.727 kW/kg/h, the existing system is very inefficient at base load operation.
- 47 -
Chapter 5. NEW SYSTEM EVALUATION
5.1. Alternative Designs of Air Extraction
The four alternative designs that were identified as proven in the electrical
power industry were:
1. The multi-stage steam ejector system
2. The 2-stage LRVP system
3. The air ejector and 2-stage LRVP system
4. The steam hybrid system
The relative high efficiency of the 2-stage LRVP system initially makes this
system appear to be the most attractive. However, like the high efficiency
mechanical compressors and blowers that were ruled out because of
maintenance and operational problems, the 2-stage LRVP system also has its
problems.
Discussions with Mr. Alf Hertaeg of Sinclair Mertz and Knights, who had
previously worked for the State Electricity Commission of Victoria, indicated
that pump cavitation had been a constant issue at the Yallourn ‘W’, Newport and
Loy Yang ‘A’ Power Stations. This issue was only resolved by moving to the
air ejector and LRVP system at the Loy Yang ‘B’ Power Station. While this
system is effective it is also very inefficient and contrary to the aims of this
project.
Based on this information the steam hybrid system was the next obvious choice
because it was the next most efficient system and eliminates pump cavitation
- 48 -
issues. The steam source, which is the most efficient to use, from the steam
cycle perspective, is the de-aerator vent steam because it flows continuously to
the condenser rejecting heat to the circulating water as ‘waste’ energy.
Unfortunately at LYB, the new OT boiler water chemical treatment demands the
de-aerator vent valve be shut during normal operation prohibiting its use as a
steam supply.
While it is possible to source an alternative steam supply from somewhere else
in the system, such as the LP heater bled steam supply, with a relatively low
steam cycle energy this will impact on the overall air extraction efficiency, as
this steam energy will be lost from the turbine work cycle.
The multistage steam ejector system has been ruled out due to its higher energy
consumption and running costs. Steam jet ejectors must also be sized for a
specified flow to obtain maximum efficiency. This means if they are over-sized,
then their efficiency will be considerably worse than the earlier figures indicate.
Also, if the air extraction load rises along with the condenser pressure, then their
capacity may be rapidly exceeded resulting in condenser under-venting and
significant unit heat rate losses.
One technological improvement, which has a direct bearing on the decision of
the choice of air extraction system, is the advent of cheap and reliable variable
frequency speed control units (VFD). Most of the cavitation problems
associated with LRVP’s systems stem from the fact that they are positive
- 49 -
displacement by nature. When a LRVP ‘over-vents’ the condenser, steam will
be drawn in as well as the non-condensable gases. This steam will condense in
the LRVP, as the pressure rises across the pump, rejecting its heat to the seal
water. This additional latent heat adds to the temperature rise across the pump
and can cause cavitation if the vapour temperature is reached (Skelton, 1999,
p.9).
According to Skelton (1998, p.1-2) a VFD to control the speed and flow
capacity of a LRVP is a relatively new innovation which can eliminate the need
for recycle lines or unreliable vacuum relief valves, while at the same time
preventing over-venting and cavitation. As a LRVP is usually sized for over-
capacity the VFD option also has the potential to result in additional energy
savings.
5.2. New System Arrangement
As the key objective of this project is to reduce in-house energy consumption,
the discission was made to select a 2-stage LRVP system, with a VSD unit
controlling its flow capacity. There is, however, a limit to the amount of speed
reduction possible with a LRVP, because if it is slowed excessively its liquid
seal will collapse due to the force of gravity exceeding the centrifugal force
imparted by the impellor leading to a total loss of pumping capacity.
As an ‘insurance policy’ to overcome this problem, a small adjustable recycle
valve will be fitted to the system. This valve will be set during commissioning
to ensure that the LRVP stays within its operating limits. This valve may
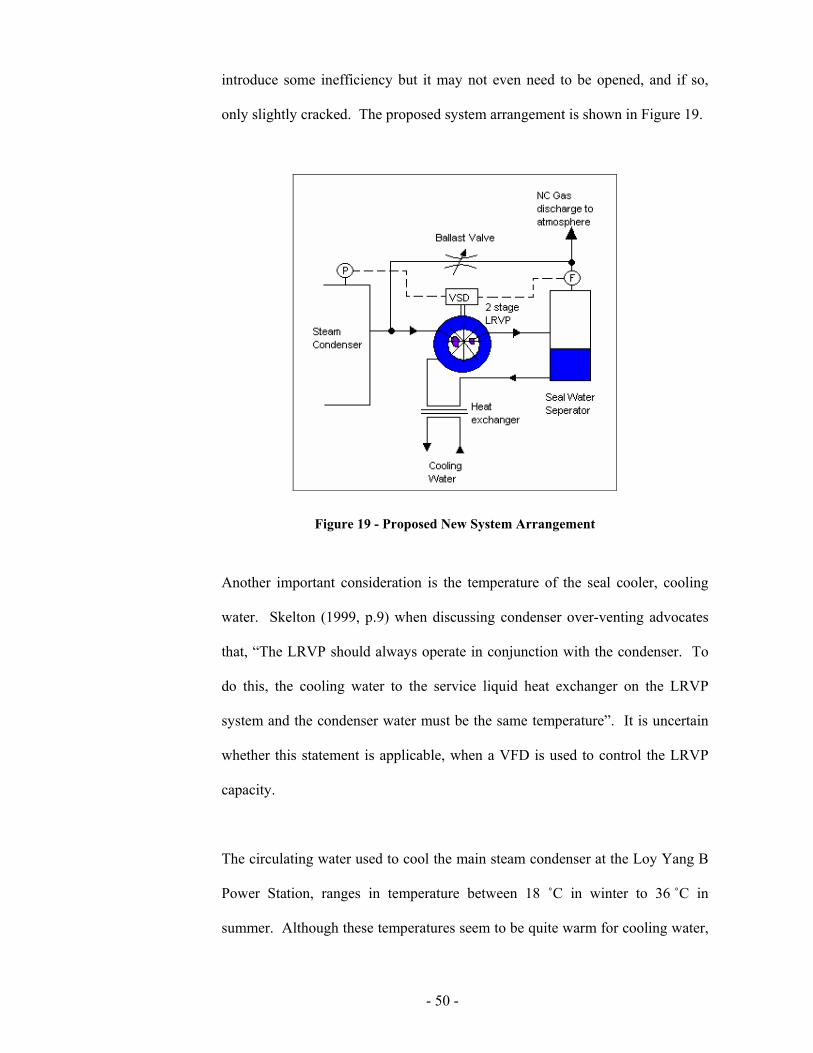
- 50 -
introduce some inefficiency but it may not even need to be opened, and if so,
only slightly cracked. The proposed system arrangement is shown in Figure 19.
Figure 19 - Proposed New System Arrangement
Another important consideration is the temperature of the seal cooler, cooling
water. Skelton (1999, p.9) when discussing condenser over-venting advocates
that, “The LRVP should always operate in conjunction with the condenser. To
do this, the cooling water to the service liquid heat exchanger on the LRVP
system and the condenser water must be the same temperature”. It is uncertain
whether this statement is applicable, when a VFD is used to control the LRVP
capacity.
The circulating water used to cool the main steam condenser at the Loy Yang B
Power Station, ranges in temperature between 18 ˚C in winter to 36 ˚C in
summer. Although these temperatures seem to be quite warm for cooling water,
- 51 -
when the circulating water temperature rises, so does the condenser pressure and
hence the LRVP suction pressure.
Although this may be suitable for cooling purposes under most circumstances, it
has been decided to utilize cooling water from the Fire and General Service
Water Supply, which has an estimated temperature range of 15 ˚C to 20 ˚C, to
increase the LRVP’s cavitation resistance. The cooler’s water discharge from
this supply can be discharged to the Auxiliary Cooling Water Return Conduit to
reduce water consumption because it is at a substantially higher pressure. The
seal water temperature rise across the LRVP will need to be monitored for
excessive temperature rise during commissioning, to ensure cavitation will not
occur.
In terms of the new systems control, the VFD speed set point will be derived
from the condenser pressure, via a function generator, so as to track the design
air extraction rate. The ballast valve will be set to provide the minimum load
required to prevent cavitation at the LRVP’s minimum speed. System air
loading changes are likely to be increases of air in-leakage rather than decreases,
and a discharge airflow meter will be used to bias the VFD speed up, in
proportion to the increase in measured airflow based on equation 8, in Appendix
B. An alarm should be triggered if the discharge air flow meter detects an
increase in the discharge airflow of more than 20%.
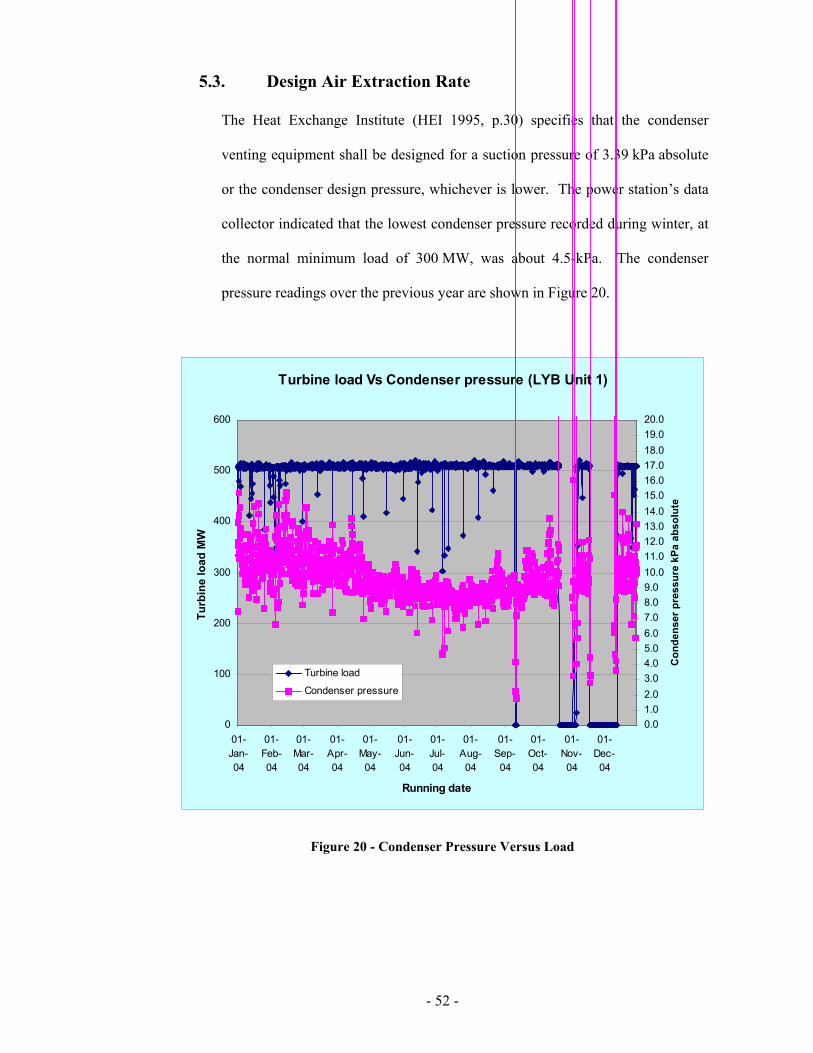
- 52 -
5.3. Design Air Extraction Rate
The Heat Exchange Institute (HEI 1995, p.30) specifies that the condenser
venting equipment shall be designed for a suction pressure of 3.39 kPa absolute
or the condenser design pressure, whichever is lower. The power station’s data
collector indicated that the lowest condenser pressure recorded during winter, at
the normal minimum load of 300 MW, was about 4.5-kPa. The condenser
pressure readings over the previous year are shown in Figure 20.
Turbine load Vs Condenser pressure (LYB Unit 1)
0
100
200
300
400
500
600
01-Jan-04
01-Feb-04
01-Mar-04
01-Apr-04
01-May-04
01-Jun-04
01-Jul-04
01-Aug-04
01-Sep-04
01-Oct-04
01-Nov-04
01-Dec-04
Running date
Turb
ine
load
MW
0.01.02.03.04.05.06.07.08.09.010.011.012.013.014.015.016.017.018.019.020.0
Con
dens
er p
ress
ure
kPa
abso
lute
Turbine load
Condenser pressure
Figure 20 - Condenser Pressure Versus Load
- 53 -
This condenser pressure is not much above the HEI recommended suction
pressure of 3.39 kPa absolute, and the HEI values for suction pressure and
temperature will be used for design purposes.
In terms of deciding on the design over-venting capacity of the new system the
target condensate dissolved oxygen level need to be considered. When based on
the AVT chemical target of < 10 ppb dissolved oxygen, a ratio of 0.15 would
need to be selected. If however, the OT chemical target of 30-150 ppb were
used, then a ratio of 0.50 could be selected because the target dissolved oxygen
level of 42 ppb would still allow an adequate control range for the oxygen
injection system.
In effect while the current system capacity was designed on an over-venting
requirement of six times the actual air in-leakage rate, the new system capacity
can be designed on over-venting requirement of just two times the actual air in-
leakage rate.
Usually the design air extraction rate would be determined by the HEI standard
of 707 litres/min or the VGB guideline of 263 litres/min. However it is assumed
that these values allow for significant reserve capacity in case of major air leak
developing on the condenser. This is assumption is supported by Siemen’s
description of the VGB guideline as being ‘conservative’. In the case of LYB,
the LP Turbine casing is welded to the condenser shell and does not have the
usual large and troublesome expansion joint, as do many other power stations.
- 54 -
The new air extraction system will also have the large current system as a
backup, in case a major air leak develops.
Because of these factors, and to optimise the capacity of the air extraction
system, the design capacity will be based on the HEI maximum recommended
air in-leakage rate of 142 litres/min at the condenser design operating pressure of
9.5-kPa absolute. This capacity selection will also reduce the potential for
LRVP cavitation developing, as the capacity will be closer to actual air in-
leakage rates.
To determine what other NC gases are required to be extracted from the
condenser, gas samples were taken from both generating unit air extraction
discharge lines and tested in the station’s gas chronograph. The test results
indicated 99.8% air and 0.2% hydrogen. The hydrogen is believed to be a result
of boiler tube oxidation processes. No ammonia was detected in the samples
and it is believed that any ammonia vapour is condensed in the LRVP as the
pressure rises across the pump. Based on this information, the design extraction
rate will be for a discharge flow of 142 litres/min of dry air.
This dry air discharge flow needs to be converted to a saturated mass airflow at
the LRVP suction and a Dry Air Equivalent (DAE) found. The design air
extraction rate at a condenser pressure of 3.39-kPa can be found by using
equation 2, in Appendix B. This gives:
min/65.14695001013003390101300142
litresQ
Q
=∴−−
×=∴
- 55 -
This figure then needs to be converted to an air mass flow rate. Re-arranging
equation 6, in Appendix B, we get:
hkgm
m
Qm
/59.101000
60204.165.146
100060
=∴
××=∴
××=∴
&
&
& ρ
Because the mass flow rate is dry air, the value of 2.05 kg of water vapour/kg of
dry air may be used, from the HEI’s Appendix E. At the air extraction suction
temperature of 21.7 ˚C, the specific volume of steam is vg = 52.4 m3/kg
(Rodgers & Mayhew, 1996, p.2) and it takes 2.05 kg of steam to saturate each
kg of dry air. The volume of steam required to saturate the 10.59 kg/h of dry air
at 21.7 ˚C is then:
hmVSteam /578.113705.24.5259.10 3=××=∴
The density of the air at the air extraction suction pressure of 3.39 kPa and
21.7 ˚C can be calculated using equation 12, in Appendix B, as:
3/040.085.294287
3390 mkg=×
=∴ρ
The specific volume of the air is then:
kgmvg /25040.011 3===∴
ρ
The volume of air at the suction is then:
hmVAir /750.26459.1025 3=×=∴
- 56 -
After adding the steam and air volumes at the suction these can then be
converted to a the standard dry air equivalent at 20 ˚C and 101.3 kPa by using
equation 1, in Appendix B, as follows:
( )
min/778/658.46
1013003390
85.29415.293750.264578.1137
3
litresDAEhmDAE
DAE
=∴=∴
××+=∴
To achieve a HEI recommended target condensate dissolved oxygen level of
42 ppb an actual load divided by the design capacity ratio of 0.50 must be used.
min/155650.0
778
litresQ
Q
Design
Design
=∴
=∴
It should be noted that the new system is being selected to operate at normal
base load conditions and is not expected to establish the initial condenser
vacuum during unit start-up. This is because any delay in establishing initial
vacuum will delay the return to service of the unit. The current air extraction
system has the capacity to reach operating vacuum on start-up in about
25 minutes and will be retained for this purpose.
The steam turbine at Loy Yang B Power Station has the capability of bypassing
70% of its full steam flow around the turbine and dumping this to the condenser.
Even though this steam is de-superheated by spraying it down, this steam
dumping causes a rapid rise in condenser pressure. The current air extraction
system will go into hogging mode under these circumstances and assist in
maintaining the condenser pressure below the turbine trip value. The new
- 57 -
system is not capable of performing this function and the existing system will
also be retained for this purpose. New control logic will be needed to start the
current system in this situation.
Excessive air in-leakage can occur as a result of deterioration of flanged joints,
expansion joints, corrosion of pipe-work, loss of seal water to valve stems or
from various valves being incorrectly left open to atmosphere. The LYB
condenser has the distinct advantage of being welded to the turbine casing, rather
than having the large and troublesome expansion joint that a lot of other power
stations have, which can be a major source of air in-leakage.
Air leaks are a maintenance and operational issue, however the air extraction
system must be able to cope with them in the short term to prevent a loss of
generation output. With good maintenance and operational practices it is
expected that events of excessive air in-leakage should rarely occur. The current
system will be retained, as a backup, for when these events occur and logic will
need to be provided to start it on rising condenser pressure.
5.4. New System Energy Consumption
Based on a DAE design suction flow rate of 1556 litres/min, at a suction
pressure of 3.39-kPa absolute, a “Stirling” 2-stage LRVP Model LPH 3708 was
selected. The performance curve of this pump versus the design suction flow for
various condenser pressures are shown in Figure 21. The design suction flows
were estimated for various condenser pressures by using equation 2, in
Appendix B.
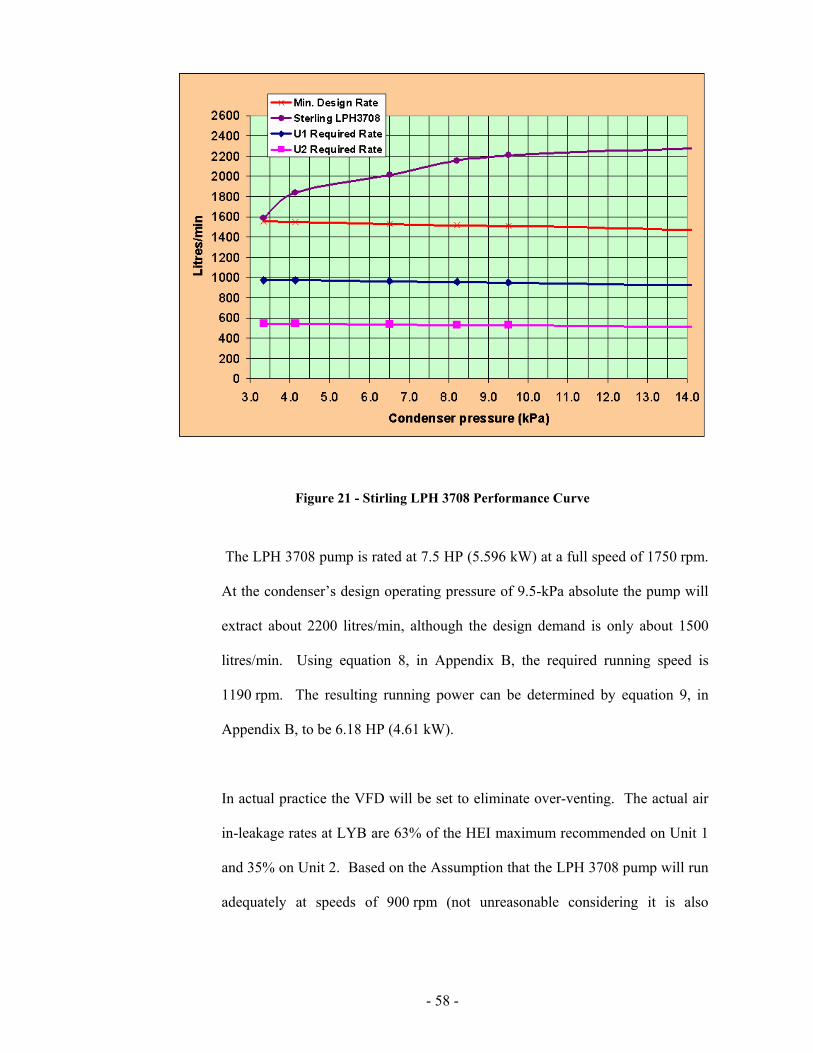
- 58 -
Figure 21 - Stirling LPH 3708 Performance Curve
The LPH 3708 pump is rated at 7.5 HP (5.596 kW) at a full speed of 1750 rpm.
At the condenser’s design operating pressure of 9.5-kPa absolute the pump will
extract about 2200 litres/min, although the design demand is only about 1500
litres/min. Using equation 8, in Appendix B, the required running speed is
1190 rpm. The resulting running power can be determined by equation 9, in
Appendix B, to be 6.18 HP (4.61 kW).
In actual practice the VFD will be set to eliminate over-venting. The actual air
in-leakage rates at LYB are 63% of the HEI maximum recommended on Unit 1
and 35% on Unit 2. Based on the Assumption that the LPH 3708 pump will run
adequately at speeds of 900 rpm (not unreasonable considering it is also
- 59 -
available with a motor speed of 1150 rpm) the actual running power is likely to
be about 4.012 kW.
To size the cooling requirements for the new system it is assumed that the heat
input will be equivalent to the motor power, if the LRVP is pumping in the no
load condition. The maximum motor power rating is 4.012 kW, so the design
heat input into the cooler is also 4.012 kW. Using equation 11, in Appendix B,
the required cooling water flow rate is 0.72 litres/s assuming a 3˚C temperature
rise across the cooler as suggested by Kubik (2005, p.3).
Assuming that a plate type cooler is used, with a pressure drop of about 200 kPa
across it and a F&GS pump efficiency 0.89, then equation 4, in Appendix B,
gives an estimated cooler energy consumption of 162 W.
5.5. New System Efficiency
The energy consumption of the new system with a VFD is likely to be
4.174 kW. Based on pumping the previously mentioned Unit 1 air mass flow
rate of 6.615 kg/h of dry air, which gives a pumping efficiency of
0.631 kW/kg/h.
There are two possible options for the system modifications that need evaluating,
these being:
- 60 -
• Option #1 – Install a new LRVP fitted with a VSD drive. This will give a
power consumption of 4.012 kW for the drive motor and about 0.162 kW for
its cooler pumping energy for a total power consumption of 4.174 kW.
• Option #2 – Install a new LRVP with a VSD drive and fit electric isolating
valves to the current air extraction system coolers, so the cooling water
supply to these standby air extraction systems is only available on system
start-up. This will give a power consumption of 4.174 kW for the new LRVP
system and save 9.862 kW of pumping energy on the current system, when
in the standby condition (most of the time).
As the current system will act as a backup for the new system, there will be also
a slight increase in power consumption, 0.39 kW, due to an extra motor anti-
condensation heater being in service. The decision between these two options
will be made on economic considerations and the comparative greenhouse gas
reductions that are achievable.
5.6. Capital Cost Recovery
One accepted method to evaluate the capital recovery of a project is to calculate
the expected monetary gain or loss by discounting all future cash inflows and
outflows to the present point in time, using the required rate of return (Horngren,
Datar & Foster, 2003, p.720).
Before Net Present Value can be determined, a number of decisions have to be
made on which to base the modelling on. For example: Should the project life
be based on the original 30 year design life of the power station or its new 75
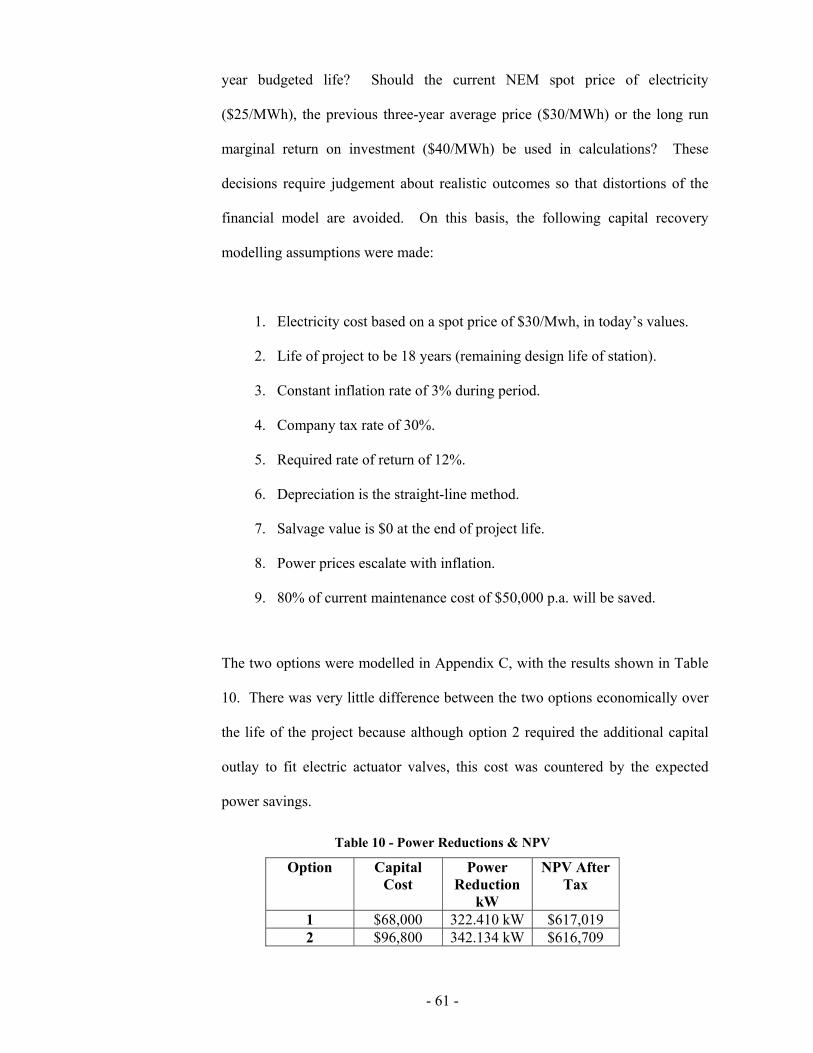
- 61 -
year budgeted life? Should the current NEM spot price of electricity
($25/MWh), the previous three-year average price ($30/MWh) or the long run
marginal return on investment ($40/MWh) be used in calculations? These
decisions require judgement about realistic outcomes so that distortions of the
financial model are avoided. On this basis, the following capital recovery
modelling assumptions were made:
1. Electricity cost based on a spot price of $30/Mwh, in today’s values.
2. Life of project to be 18 years (remaining design life of station).
3. Constant inflation rate of 3% during period.
4. Company tax rate of 30%.
5. Required rate of return of 12%.
6. Depreciation is the straight-line method.
7. Salvage value is $0 at the end of project life.
8. Power prices escalate with inflation.
9. 80% of current maintenance cost of $50,000 p.a. will be saved.
The two options were modelled in Appendix C, with the results shown in Table
10. There was very little difference between the two options economically over
the life of the project because although option 2 required the additional capital
outlay to fit electric actuator valves, this cost was countered by the expected
power savings.
Table 10 - Power Reductions & NPV
Option Capital Cost
Power Reduction
kW
NPV After Tax
1 $68,000 322.410 kW $617,019 2 $96,800 342.134 kW $616,709
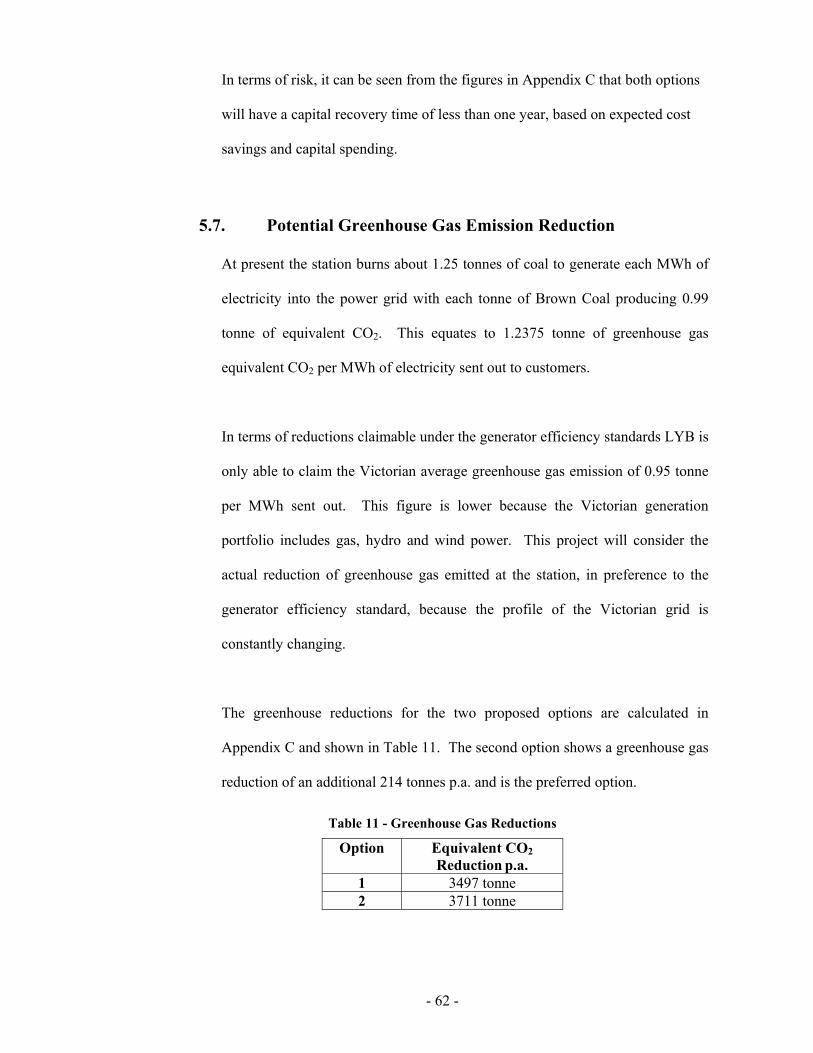
- 62 -
In terms of risk, it can be seen from the figures in Appendix C that both options
will have a capital recovery time of less than one year, based on expected cost
savings and capital spending.
5.7. Potential Greenhouse Gas Emission Reduction
At present the station burns about 1.25 tonnes of coal to generate each MWh of
electricity into the power grid with each tonne of Brown Coal producing 0.99
tonne of equivalent CO2. This equates to 1.2375 tonne of greenhouse gas
equivalent CO2 per MWh of electricity sent out to customers.
In terms of reductions claimable under the generator efficiency standards LYB is
only able to claim the Victorian average greenhouse gas emission of 0.95 tonne
per MWh sent out. This figure is lower because the Victorian generation
portfolio includes gas, hydro and wind power. This project will consider the
actual reduction of greenhouse gas emitted at the station, in preference to the
generator efficiency standard, because the profile of the Victorian grid is
constantly changing.
The greenhouse reductions for the two proposed options are calculated in
Appendix C and shown in Table 11. The second option shows a greenhouse gas
reduction of an additional 214 tonnes p.a. and is the preferred option.
Table 11 - Greenhouse Gas Reductions
Option Equivalent CO2 Reduction p.a.
1 3497 tonne 2 3711 tonne
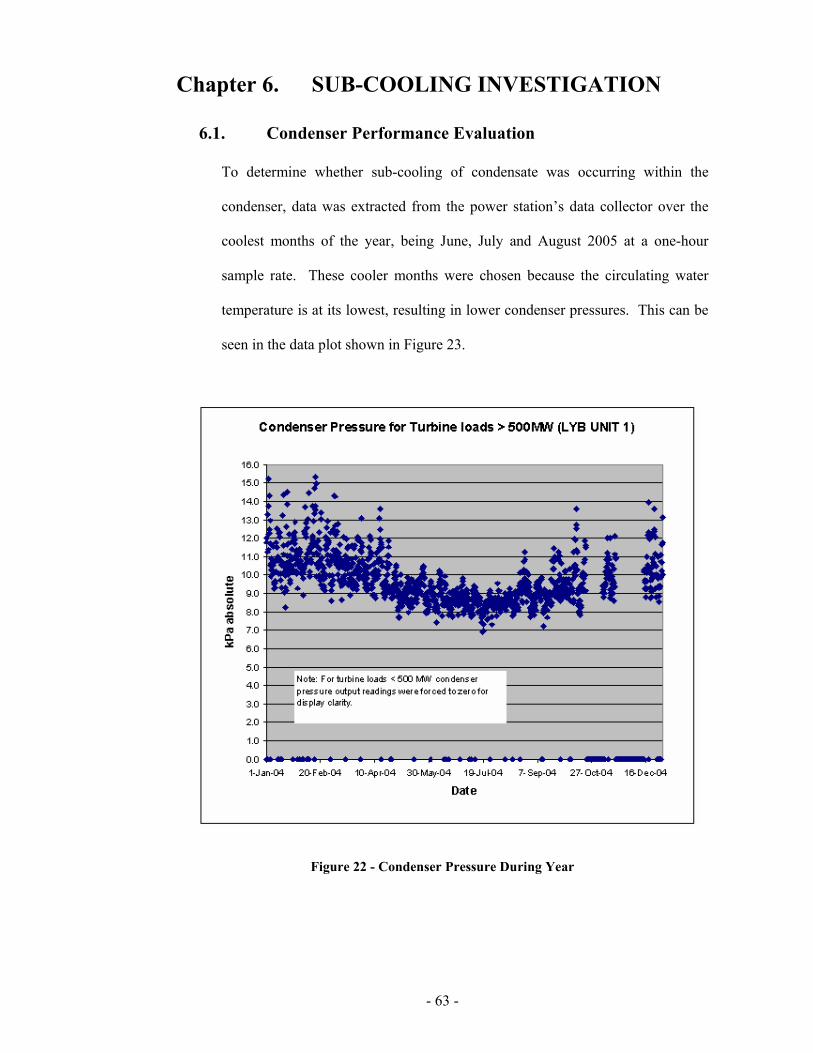
- 63 -
Chapter 6. SUB-COOLING INVESTIGATION
6.1. Condenser Performance Evaluation
To determine whether sub-cooling of condensate was occurring within the
condenser, data was extracted from the power station’s data collector over the
coolest months of the year, being June, July and August 2005 at a one-hour
sample rate. These cooler months were chosen because the circulating water
temperature is at its lowest, resulting in lower condenser pressures. This can be
seen in the data plot shown in Figure 23.
Figure 22 - Condenser Pressure During Year
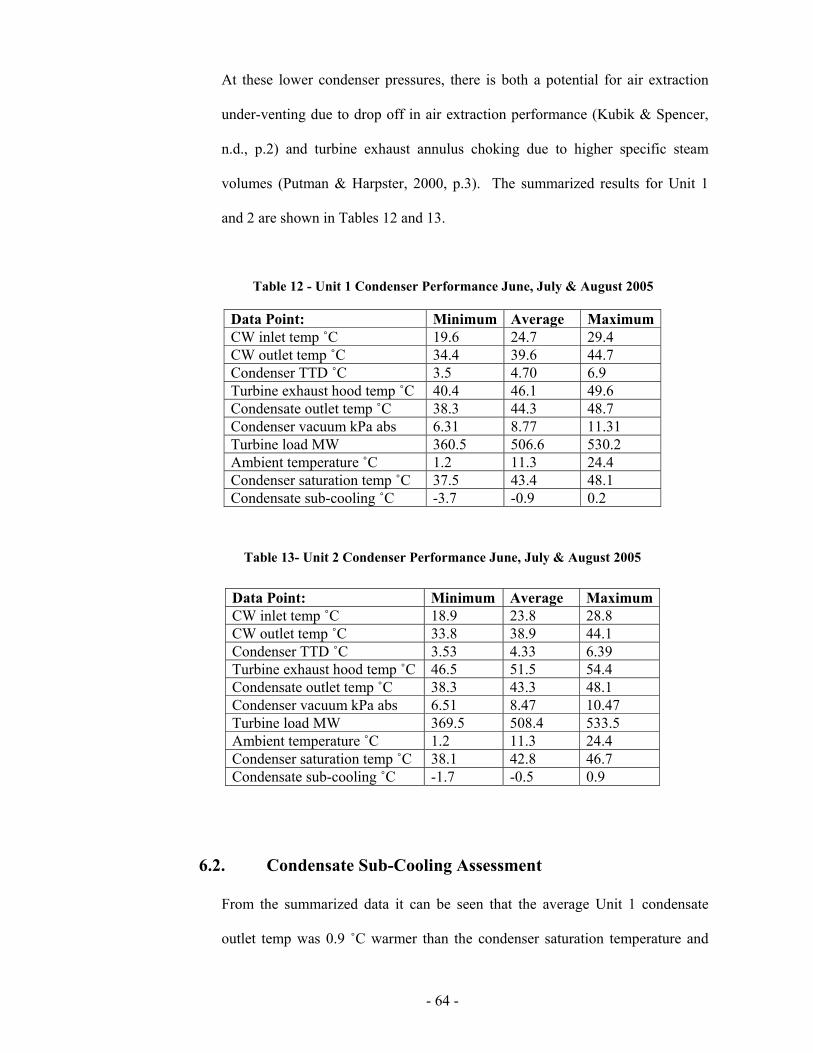
- 64 -
At these lower condenser pressures, there is both a potential for air extraction
under-venting due to drop off in air extraction performance (Kubik & Spencer,
n.d., p.2) and turbine exhaust annulus choking due to higher specific steam
volumes (Putman & Harpster, 2000, p.3). The summarized results for Unit 1
and 2 are shown in Tables 12 and 13.
Table 12 - Unit 1 Condenser Performance June, July & August 2005
Data Point: Minimum Average MaximumCW inlet temp ˚C 19.6 24.7 29.4 CW outlet temp ˚C 34.4 39.6 44.7 Condenser TTD ˚C 3.5 4.70 6.9 Turbine exhaust hood temp ˚C 40.4 46.1 49.6 Condensate outlet temp ˚C 38.3 44.3 48.7 Condenser vacuum kPa abs 6.31 8.77 11.31 Turbine load MW 360.5 506.6 530.2 Ambient temperature ˚C 1.2 11.3 24.4 Condenser saturation temp ˚C 37.5 43.4 48.1 Condensate sub-cooling ˚C -3.7 -0.9 0.2
Table 13- Unit 2 Condenser Performance June, July & August 2005
Data Point: Minimum Average Maximum CW inlet temp ˚C 18.9 23.8 28.8 CW outlet temp ˚C 33.8 38.9 44.1 Condenser TTD ˚C 3.53 4.33 6.39 Turbine exhaust hood temp ˚C 46.5 51.5 54.4 Condensate outlet temp ˚C 38.3 43.3 48.1 Condenser vacuum kPa abs 6.51 8.47 10.47 Turbine load MW 369.5 508.4 533.5 Ambient temperature ˚C 1.2 11.3 24.4 Condenser saturation temp ˚C 38.1 42.8 46.7 Condensate sub-cooling ˚C -1.7 -0.5 0.9
6.2. Condensate Sub-Cooling Assessment
From the summarized data it can be seen that the average Unit 1 condensate
outlet temp was 0.9 ˚C warmer than the condenser saturation temperature and
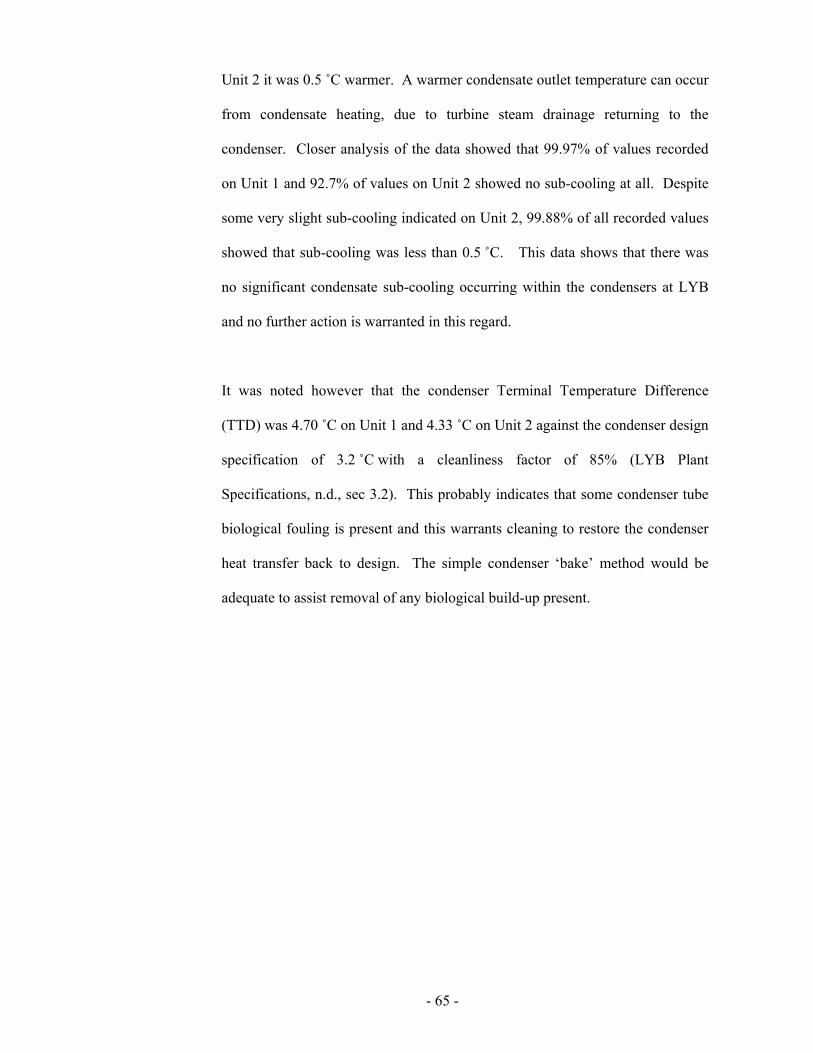
- 65 -
Unit 2 it was 0.5 ˚C warmer. A warmer condensate outlet temperature can occur
from condensate heating, due to turbine steam drainage returning to the
condenser. Closer analysis of the data showed that 99.97% of values recorded
on Unit 1 and 92.7% of values on Unit 2 showed no sub-cooling at all. Despite
some very slight sub-cooling indicated on Unit 2, 99.88% of all recorded values
showed that sub-cooling was less than 0.5 ˚C. This data shows that there was
no significant condensate sub-cooling occurring within the condensers at LYB
and no further action is warranted in this regard.
It was noted however that the condenser Terminal Temperature Difference
(TTD) was 4.70 ˚C on Unit 1 and 4.33 ˚C on Unit 2 against the condenser design
specification of 3.2 ˚C with a cleanliness factor of 85% (LYB Plant
Specifications, n.d., sec 3.2). This probably indicates that some condenser tube
biological fouling is present and this warrants cleaning to restore the condenser
heat transfer back to design. The simple condenser ‘bake’ method would be
adequate to assist removal of any biological build-up present.
- 66 -
Chapter 7. CONCLUSIONS
This project investigated four different designs of air extraction, which were proven
for use in the electrical power industry. Of these the multi-stage steam ejector was
rejected both on energy efficiency and economic grounds. The air ejector and
LRVP system, as used at LYB, had shown it was versatile and wasn’t prone to
cavitation problems. Despite its proven operating performance, this system too was
rejected due to its poor energy efficiency. The steam hybrid system was perhaps
one of the preferred choices, however the absence of the de-aerator vent steam
supply meant that it too was rejected on energy efficiency grounds.
The chosen system was the 2-stage LRVP system because it offered superior
efficiency over the alternative designs. Previous inherent cavitation problems of
this design could be resolved by using a VFD to control the pump speed and hence
its flow capacity. In terms of the air extraction suction design capacity it was found
a change from the AVT chemical treatment to OT chemical treatment for boiler
water had reduced the required over-venting capacity to one third of the original
design. The new system offers the advantage of an efficiency of 0.631 kW/kg/h of
dry airflow based on a discharge mass airflow of 6.615 kg/h compared to the
current systems efficiency of 26.609 kW/kg/h.
There were two possible options with the new system. The recommended option is
to install the LRVP system fitted with a VFD for speed control and to retrofit
electric isolating valves to the current system, so as to eliminate the waste cooler
pumping energy, while AEP is sitting in the standby mode. This option would
require an estimated capital cost of $96,800. However based on a required return of
- 67 -
12%, it would achieve a NPV of $616,700 after tax over its 18-year life. The
estimated reduction of equivalent CO2 greenhouse gases is estimated to be around
3710 tonnes p.a. There may be additional revenue associated with this greenhouse
gas reduction, however this has not been considered in the financial modelling.
Investigations into the condenser performance on both units, during the winter
months, showed that no significant sub-cooling was occurring in the condensate. It
was, however, noted that the TTD measured about 1˚C above the condenser design
specification on both units probably due to condenser tube biological fouling. A
condenser clean, using the ‘bake’ method is recommended to return the condenser
heat transfer back to original design specifications.
- 68 -
REFERENCES Aglitz, J., Bhatnagar, R., Bolt, D.E. & Butzbach, T.L. (1996), “Installing Liquid-Ring Vacuum Pumps” - in Chemical Engineering, November 1996. Aliasso, J., “How to size liquid ring vacuum pumps” – Reprinted from Pumps and Systems Magazine, http://www.graham-mfg.com/downloads/212.pdf, accessed 26th April 2005 Birgenheier, D.B., Butzbach, T.L., Bolt, D.E., Bhatnagar, R.K., Ojala, R.E. & Aglitz, J. (1993), “Designing Steam Jet Vacuum Systems”, in Chemical Engineering, July 1993. Birgenheier, D.B. & Wetzel, L. (1988), “Design of Vacuum Systems for Crude Oil Vacuum Tower Distillation”, Hydrocarbon Processing Symposium, 1988. Dooley, R.B. (2002), “Air In-leakage Monitoring and Control”, Cycle Chemistry Guidelines for Fossil Plants: All-volatile Treatment, EPRI Technical Report. Douglas, J.F., Gasiorek, J.M. & Swaffield, J.A. (1995), Fluid Mechanics, 3rd Edition, Longman Publishers Ltd, Singapore. Kubik, W.J. & Spencer, E. (n.d.), “Improved Steam Condenser Gas Removal System” - in The American Society of Mechanical Engineers, http://www.graham-mfg.com/downloads/36.pdf, Accessed 26th April 2005. Harpster, J.W. (2002), “Reducing Dissolved Oxygen under Conditions of High Air Ingress”, PowerPlant Chemistry, 2002, Vol.4 (9). Harpster, J.W. & Putman, R.E. (2000), The Economic Effects Of Condenser Backpressure On Heat Rate, Condensate Sub-cooling And Feedwater Dissolved Oxygen, Proceedings of 2000 International Joint Power Generation Conference, Miami Beach, Florida, July 23-26, 2000. Hertaeg, A. (2005), Personal communication, Executive Engineer, Sinclair, Knights & Mertz. Heat Exchange Institute (1995), Standards for Steam Surface Condensers, 9th Edition, Heat Exchange Institute, Cleveland, Ohio, USA. Hope, J.S. (1975), Middle Level Physics, Pitman, Carlton, Victoria, Australia. Horngren, C.T., Datar, S.M. & Foster, G. (2003), Cost Accounting – A Managerial Emphasis, 11th Edition, Prentice Hall, Upper Saddle River, New Jersey. Hitachi (1991), Loy Yang B Power Station – 500 MW Turbine – Heat Balance Diagram at 100% Load, Drawing No. JD-130-740, Hitachi Ltd., Tokyo, Japan.
- 69 -
Lines, J.R., Athey, R.E. & Frens, L.L. (n.d.), “Troubleshooting Surface Condenser Venting Systems” – in The American Society of Mechanical Engineers, http://www.graham-mfg.com/downloads/38.pdf, Accessed 26th April 2005.
Loy Yang B Power Station (n.d.), Plant Specifications, Sections 3.1 & 3.2
Loy Yang B Plant Description Manuals (2005), Main Turbine Plant, LYB PDM Volume 5, Sections 2. Loy Yang B Plant Description Manuals (2005), Feedwater, Steam and Condensate Systems, LYB PDM Volume 6, Sections 1 & 2. Loy Yang B Plant Description Manuals (2005), Cooling Water Systems, LYB PDM Volume 7, Sections 2. NASH (2005), “The NASH condenser exhauster SAVES ENERGY when air leakage increases”, NASH Catalogue, Gardner Denver Liquid Ring Pump Division. Reid, T.C. & Renshaw, J.C. (1988), Steam, Cole Publications, Melbourne. Rodgers, G.F.C. & Mayhew, Y.R. (1996), Thermodynamic and Transport Properties of Fluids – SI Units, 5th Edition, Blackwell Publishers Ltd., Cambridge, Massachusetts, USA. Siemens (1995), “ELMO-F Vacuum Pumps for Power Stations”, Siemens Drives and Standard Products Catalogue. SIHI Pumps Australia (1990), LPH- 10534 / GPV-15000 Performance Data Drawings. Skelton, K. (1999), “Cavitation in Liquid Ring Vacuum Pumps used in Condenser Venting Service”, EPRI conference September 1st – 3rd. Skelton, K. (1998), “Variable Frequency Drives for a Vacuum Pump System” – in Pumps and Systems Magazine, January 1998. Trela, M., Butrymowicz, D., Gluch, J., Gardzilewicz, A., Ihnatowicz, E. & Zieliński, B. (2000), “Monitoring of Air Content in a Mixture Removed from Condensers in Application to Steam Turbine Diagnostics”, Proceedings of 2000 International Joint Power Generation Conference, Miami Beach, Florida, July 23-26, 2000. Woodward, A.R., Howard, D.L. & Andrews, E.F.C. (1991), Modern Power Station Practice – Turbines, Generators and Associated Plant, 3rd Edition, Volume C, published by Pergamon Press - Oxford, for British Electricity International Ltd., London. Veizades, H. (2005), “Introduction to gas removal systems and liquid ring vacuum pumps”, http://www.unep.org/gef/content/pdf/22-Veizades.pdf, Accessed 26th April 2005.
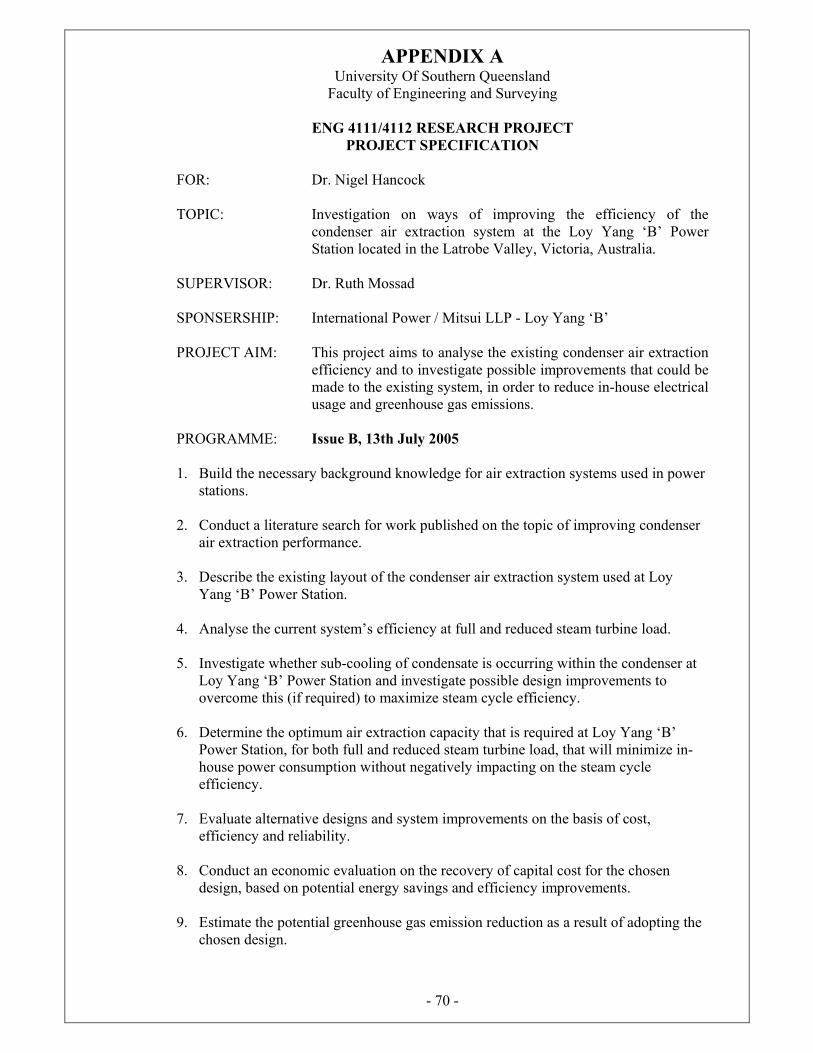
APPENDIX A University Of Southern Queensland
Faculty of Engineering and Surveying
- 70 -
ENG 4111/4112 RESEARCH PROJECT
PROJECT SPECIFICATION
FOR: Dr. Nigel Hancock TOPIC: Investigation on ways of improving the efficiency of the
condenser air extraction system at the Loy Yang ‘B’ Power Station located in the Latrobe Valley, Victoria, Australia.
SUPERVISOR: Dr. Ruth Mossad SPONSERSHIP: International Power / Mitsui LLP - Loy Yang ‘B’ PROJECT AIM: This project aims to analyse the existing condenser air extraction
efficiency and to investigate possible improvements that could be made to the existing system, in order to reduce in-house electrical usage and greenhouse gas emissions.
PROGRAMME: Issue B, 13th July 2005 1. Build the necessary background knowledge for air extraction systems used in power
stations. 2. Conduct a literature search for work published on the topic of improving condenser
air extraction performance. 3. Describe the existing layout of the condenser air extraction system used at Loy
Yang ‘B’ Power Station. 4. Analyse the current system’s efficiency at full and reduced steam turbine load. 5. Investigate whether sub-cooling of condensate is occurring within the condenser at
Loy Yang ‘B’ Power Station and investigate possible design improvements to overcome this (if required) to maximize steam cycle efficiency.
6. Determine the optimum air extraction capacity that is required at Loy Yang ‘B’
Power Station, for both full and reduced steam turbine load, that will minimize in-house power consumption without negatively impacting on the steam cycle efficiency.
7. Evaluate alternative designs and system improvements on the basis of cost,
efficiency and reliability. 8. Conduct an economic evaluation on the recovery of capital cost for the chosen
design, based on potential energy savings and efficiency improvements. 9. Estimate the potential greenhouse gas emission reduction as a result of adopting the
chosen design.
APPENDIX A University Of Southern Queensland
Faculty of Engineering and Surveying
- 71 -
As time permits: 10. Determine modifications required to the existing steel structure, piping and control
logic to incorporate the chosen design. 11. Determine the required capacity of ancillary service supplies, such as electrical
power, cooling water, steam, compressed air, etc. AGREED: ____________________ (student) _____________________ (supervisor)
(Dated) ____ / ____ / ____
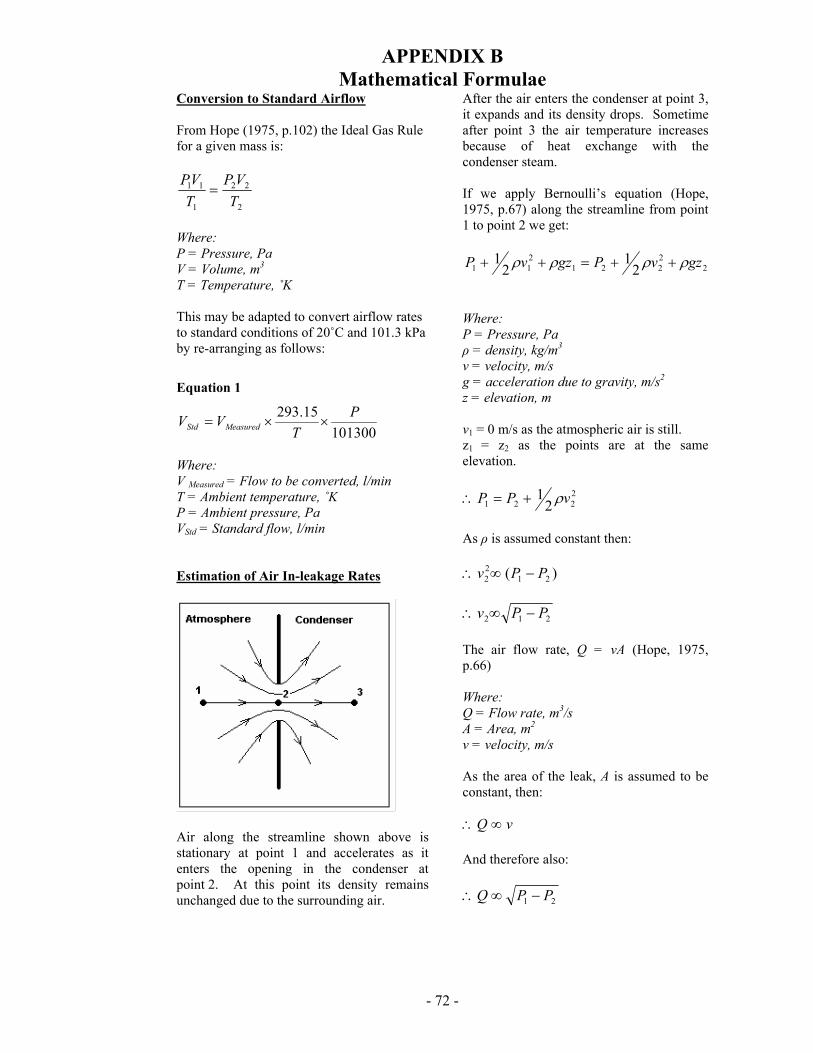
APPENDIX B Mathematical Formulae
- 72 -
Conversion to Standard Airflow
From Hope (1975, p.102) the Ideal Gas Rule for a given mass is:
2
22
1
11
TVP
TVP
=
Where: P = Pressure, Pa V = Volume, m3 T = Temperature, ˚K This may be adapted to convert airflow rates to standard conditions of 20˚C and 101.3 kPa by re-arranging as follows:
Equation 1
10130015.293 P
TVV MeasuredStd ××=
Where: V Measured = Flow to be converted, l/min T = Ambient temperature, ˚K P = Ambient pressure, Pa VStd = Standard flow, l/min
Estimation of Air In-leakage Rates
Air along the streamline shown above is stationary at point 1 and accelerates as it enters the opening in the condenser at point 2. At this point its density remains unchanged due to the surrounding air.
After the air enters the condenser at point 3, it expands and its density drops. Sometime after point 3 the air temperature increases because of heat exchange with the condenser steam. If we apply Bernoulli’s equation (Hope, 1975, p.67) along the streamline from point 1 to point 2 we get:
22221
211 2
12
1 gzvPgzvP ρρρρ ++=++
Where: P = Pressure, Pa ρ = density, kg/m3 v = velocity, m/s g = acceleration due to gravity, m/s2
z = elevation, m
v1 = 0 m/s as the atmospheric air is still. z1 = z2 as the points are at the same elevation.
2221 2
1 vPP ρ+=∴
As ρ is assumed constant then:
)( 2122 PPv −∞∴
212 PPv −∞∴
The air flow rate, Q = vA (Hope, 1975, p.66)
Where: Q = Flow rate, m3/s A = Area, m2 v = velocity, m/s As the area of the leak, A is assumed to be constant, then:
vQ ∞∴ And therefore also:
21 PPQ −∞∴
APPENDIX B Mathematical Formulae
- 73 -
Thus if we have a known air in-leakage rate, at a known condenser pressure, we can calculate the new leakage rate at the new pressure by the following relationship:
knownatmosphere
newatmosphere
known
new
PP
PP
−
−=∴
Equation 2
knownatmosphere
newatmosphereknowmnew PP
PPQQ
−
−×=∴
Where: Q known = Measured flow rate, l/min Q new = Flow rate to be estimated, l/min Pa = Std atmospheric pressure, Pa = 101300 Pa (abs) Pnew = Desired Condenser pressure to estimate new flow at, Pa (abs) P known = Condenser pressure at measured flow rate, Pa (abs)
Single Phase Electrical Power From Hope (1975, p.206) for a.c. electrical power: Equation 3
φcosVIP = Where: P = Power, W V = Voltage, V I = Current, A cosΦ = Power factor Cooler Pumping Power From Hope (1975, p.25):
FvP = Where: P = Power, W F = Force, N v = velocity, m/s
vApP ××=∴
Where: P = power, W p = pressure, Pa A = Area, m2 v = velocity, m/s Q = Av (Hope, 1975, p.66) Where: Q = Flow rate, m3/s A = Cross sectional area of pipe, m2
v = velocity, m/s
pQP =∴ Where: P = Power, W p = pressure, Pa Q = Flow rate, m3/s The power loss across the cooler, corrected for the pump efficiency, then can then be found by:
Equation 4
ηQpp
P oi )( −=
Where: P = Cooler pump power loss, W pi = Cooling water inlet pressure, Pa pi = Cooling water outlet pressure, Pa Q = Cooling water flow rate, m3/s
efficiencypumpwaterCooling=η
APPENDIX B Mathematical Formulae
- 74 -
Three Phase Electrical Power This well known equation in the power industry is simply equation 3 corrected for the effects of three phases 120˚ apart:
Equation 5
φcos3 VIP ×= Where: P = Power, W V = Voltage, V I = Current, A cosΦ = Power factor Converting Air Mass Flow to litres/min This is simply: Equation 6
601000
.
×=ρmQ
Where:
.m = mass flow of dry air, kg/h Q = airflow rate, l/min ρ = density of std. air at 20˚C = 1.204 kg/m3 Converting Air Flow scfm to litres/min This is simply: Equation 7
min/32.281 litresscfm = Where: scfm = Standard cubic feet per minute of air at 20 ˚C and 101.3 kPa.
Calculating air extraction saturated suction, mass flow rates Equation 8
Wt
W
NC PPP
MWW
−×=
18
Where: W = lb. of water vapour per lb. of non-condensable gas
MWNC = molecular weight of non-condensable gas PW = absolute “water vapour” pressure corresponding to temperature at condenser vent outlet, in. HgA Pt = absolute “total” pressure at condenser vent outlet, in. HgA
Note: When the non-condensable is dry air, W may be obtained directly from the HEI’s “Standards for steam surface condensers”- Appendix E For T = 21.7 °C (71.06 °F) & Pt = 3.39 kPa abs. (1.0 inch HgA) W = 2.05 kg water vapour/kg of dry air LRVP Speed Reduction Calculations Skelton (1998, p.1) provides the following approximations for calculations resulting from speed reductions by a VFD: Equation 9
2
1
2
1
rpmrpm
CapacityCapactity
=
Where: Capacity1 = Design flow rate, l/min Capacity2 = Pump capacity, l/min rpm1 = required running speed, rpm rpm2 = maximum running speed, rpm Equation 10
2
2
1
2
1
=
hphp
rpmrpm
Where: Hp1 = Horse Power at reduced speed Hp2 = Horse Power at maximum speed
APPENDIX B Mathematical Formulae
- 75 -
Cooling water flow estimate From Hope (1975, p.86): Equation 11
TcmInputHeat p∆=.
Where:
=.
m cooling water mass flow rate, kg/s cp = specific heat at constant pressure
= 1.850 kJ/kg. K for water
T∆ = cooler temperature rise, ˚C
Calculation of air density
From Hope (1975, p.103):
Equation 12
TRP×
=ρ
Where: ρ = Density, kg/m3 P = Pressure, Pa R = Gas Constant for Air, J/kg.K = 287J/kg.K T = Temperature, ˚K
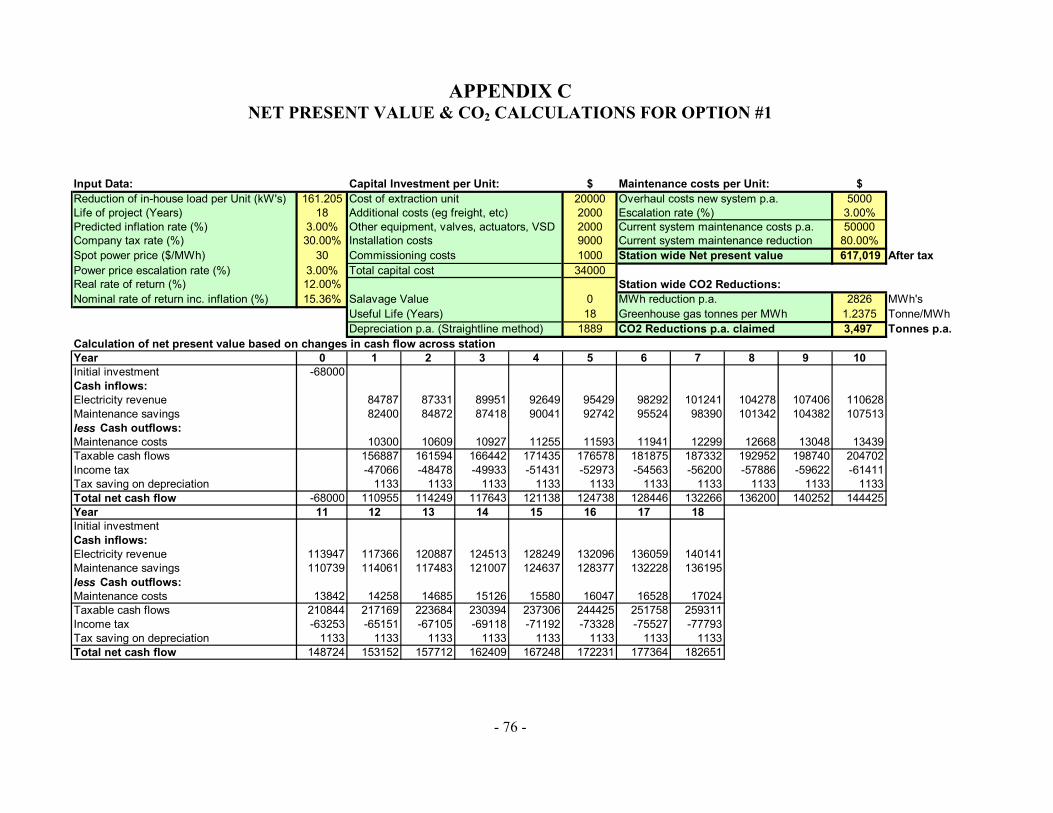
APPENDIX C NET PRESENT VALUE & CO2 CALCULATIONS FOR OPTION #1
- 76 -
Input Data: Capital Investment per Unit: $ Maintenance costs per Unit: $Reduction of in-house load per Unit (kW's) 161.205 20000 5000Life of project (Years) 18 2000 3.00%Predicted inflation rate (%) 3.00% 2000 50000Company tax rate (%) 30.00% 9000 80.00%Spot power price ($/MWh) 30 1000 617,019 After taxPower price escalation rate (%) 3.00% 34000Real rate of return (%) 12.00%Nominal rate of return inc. inflation (%) 15.36% 0 2826 MWh's
18 1.2375 Tonne/MWhDepreciation p.a. (Straightline method) 1889 3,497 Tonnes p.a.
Calculation of net present value based on changes in cash flow across stationYear 0 1 2 3 4 5 6 7 8 9 10Initial investment -68000Cash inflows:Electricity revenue 84787 87331 89951 92649 95429 98292 101241 104278 107406 110628Maintenance savings 82400 84872 87418 90041 92742 95524 98390 101342 104382 107513less Cash outflows:Maintenance costs 10300 10609 10927 11255 11593 11941 12299 12668 13048 13439Taxable cash flows 156887 161594 166442 171435 176578 181875 187332 192952 198740 204702Income tax -47066 -48478 -49933 -51431 -52973 -54563 -56200 -57886 -59622 -61411Tax saving on depreciation 1133 1133 1133 1133 1133 1133 1133 1133 1133 1133Total net cash flow -68000 110955 114249 117643 121138 124738 128446 132266 136200 140252 144425Year 11 12 13 14 15 16 17 18Initial investmentCash inflows:Electricity revenue 113947 117366 120887 124513 128249 132096 136059 140141Maintenance savings 110739 114061 117483 121007 124637 128377 132228 136195less Cash outflows:Maintenance costs 13842 14258 14685 15126 15580 16047 16528 17024Taxable cash flows 210844 217169 223684 230394 237306 244425 251758 259311Income tax -63253 -65151 -67105 -69118 -71192 -73328 -75527 -77793Tax saving on depreciation 1133 1133 1133 1133 1133 1133 1133 1133Total net cash flow 148724 153152 157712 162409 167248 172231 177364 182651
Useful Life (Years) Greenhouse gas tonnes per MWhCO2 Reductions p.a. claimed
Station wide CO2 Reductions:Salavage Value MWh reduction p.a.
Commissioning costs Station wide Net present valueTotal capital cost
Other equipment, valves, actuators, VSD Current system maintenance costs p.a.Installation costs Current system maintenance reduction
Cost of extraction unit Overhaul costs new system p.a.Additional costs (eg freight, etc) Escalation rate (%)
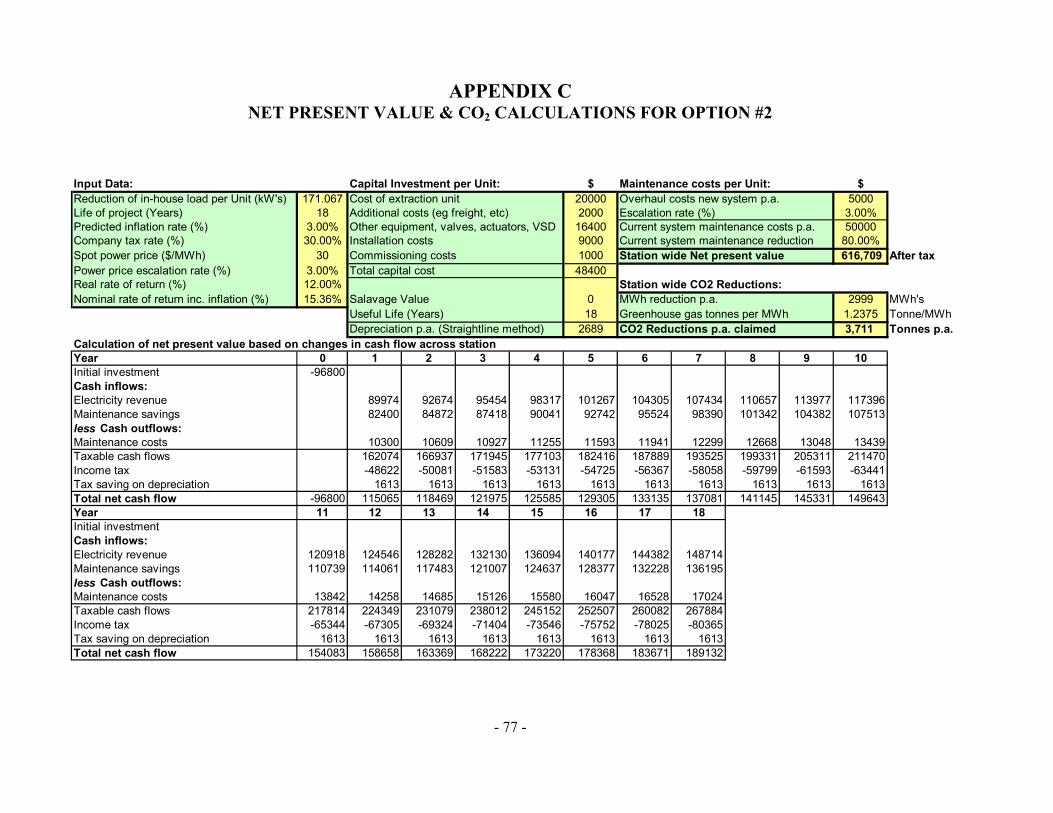
APPENDIX C NET PRESENT VALUE & CO2 CALCULATIONS FOR OPTION #2
- 77 -
Input Data: Capital Investment per Unit: $ Maintenance costs per Unit: $Reduction of in-house load per Unit (kW's) 171.067 20000 5000Life of project (Years) 18 2000 3.00%Predicted inflation rate (%) 3.00% 16400 50000Company tax rate (%) 30.00% 9000 80.00%Spot power price ($/MWh) 30 1000 616,709 After taxPower price escalation rate (%) 3.00% 48400Real rate of return (%) 12.00%Nominal rate of return inc. inflation (%) 15.36% 0 2999 MWh's
18 1.2375 Tonne/MWhDepreciation p.a. (Straightline method) 2689 3,711 Tonnes p.a.
Calculation of net present value based on changes in cash flow across stationYear 0 1 2 3 4 5 6 7 8 9 10Initial investment -96800Cash inflows:Electricity revenue 89974 92674 95454 98317 101267 104305 107434 110657 113977 117396Maintenance savings 82400 84872 87418 90041 92742 95524 98390 101342 104382 107513less Cash outflows:Maintenance costs 10300 10609 10927 11255 11593 11941 12299 12668 13048 13439Taxable cash flows 162074 166937 171945 177103 182416 187889 193525 199331 205311 211470Income tax -48622 -50081 -51583 -53131 -54725 -56367 -58058 -59799 -61593 -63441Tax saving on depreciation 1613 1613 1613 1613 1613 1613 1613 1613 1613 1613Total net cash flow -96800 115065 118469 121975 125585 129305 133135 137081 141145 145331 149643Year 11 12 13 14 15 16 17 18Initial investmentCash inflows:Electricity revenue 120918 124546 128282 132130 136094 140177 144382 148714Maintenance savings 110739 114061 117483 121007 124637 128377 132228 136195less Cash outflows:Maintenance costs 13842 14258 14685 15126 15580 16047 16528 17024Taxable cash flows 217814 224349 231079 238012 245152 252507 260082 267884Income tax -65344 -67305 -69324 -71404 -73546 -75752 -78025 -80365Tax saving on depreciation 1613 1613 1613 1613 1613 1613 1613 1613Total net cash flow 154083 158658 163369 168222 173220 178368 183671 189132
Useful Life (Years) Greenhouse gas tonnes per MWhCO2 Reductions p.a. claimed
Station wide CO2 Reductions:Salavage Value MWh reduction p.a.
Commissioning costs Station wide Net present valueTotal capital cost
Other equipment, valves, actuators, VSD Current system maintenance costs p.a.Installation costs Current system maintenance reduction
Cost of extraction unit Overhaul costs new system p.a.Additional costs (eg freight, etc) Escalation rate (%)
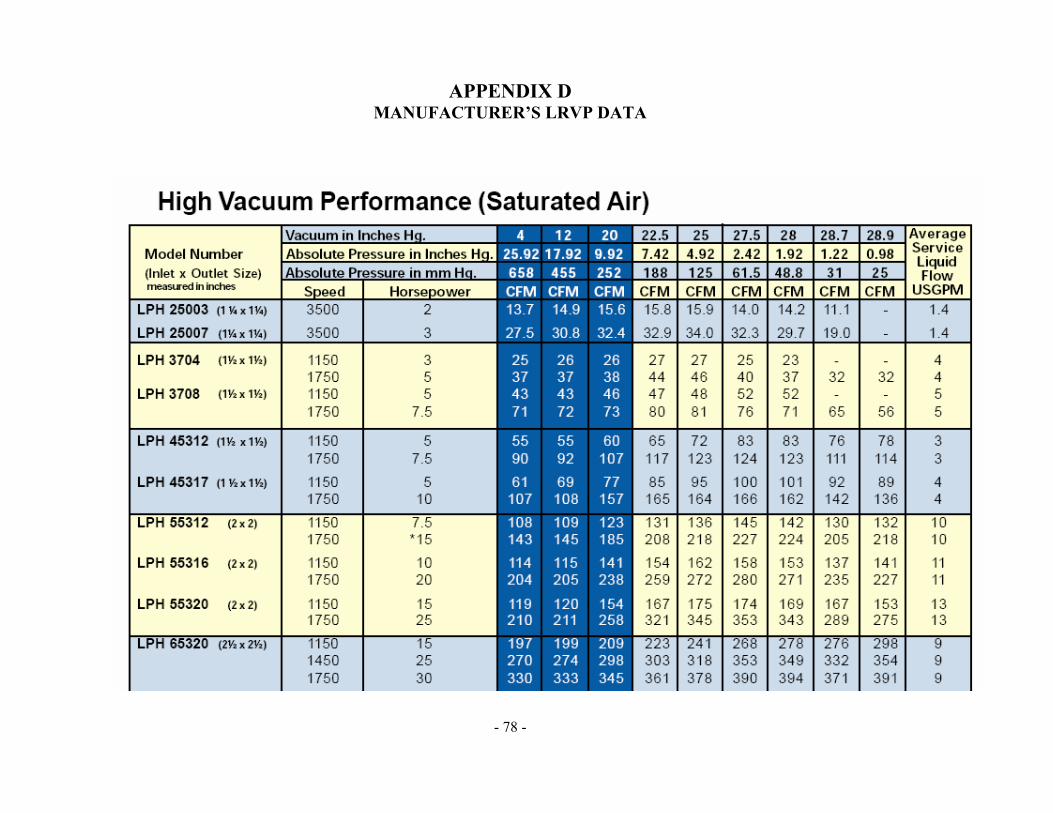
APPENDIX D MANUFACTURER’S LRVP DATA
- 78 -