Embed Size (px)
Citation preview
Journal of Immunological Methods 323 (2007) 39–54www.elsevier.com/locate/jim
Research paper
Optimization and validation of an 8-color intracellular cytokinestaining (ICS) assay to quantify antigen-specific T cells
induced by vaccination
Helen Horton a,b, Evan P. Thomas a, Jason A. Stucky a, Ian Frank a, Zoe Moodie c,Yunda Huang c, Ya-Lin Chiu c, M. Juliana McElrath a,b,d, Stephen C. De Rosa a,d,⁎
a Program in Infectious Diseases, Fred Hutchinson Cancer Research Center (FHCRC), Seattle, WA 98109, USAb Department of Medicine, University of Washington School of Medicine, Seattle, WA 98195, USA
c Statistical Center for HIV/AIDS Research and Prevention, Fred Hutchinson Cancer Research Center (FHCRC), Seattle, WA 98109, USAd Department of Laboratory Medicine, University of Washington School of Medicine, Seattle, WA 98195, USA
Received 14 November 2006; received in revised form 25 January 2007; accepted 7 March 2007Available online 3 April 2007
Abstract
Candidate HIV-1 vaccines currently being evaluated in clinical trials are designed to elicit HIV-1-specific cellular immunity.Intracellular cytokine staining (ICS) assays allow sensitive, quantitative ex vivo assessments of antigen-specific T cells includingimmunophenotyping of responding cells and measurement of multiple effector functions. Additionally, the use of bankedcryopreserved PBMC samples makes this assay attractive in the setting of large efficacy trials where it is less feasible to performimmunoassays on freshly isolated samples. Here we describe extensive studies to optimize and quantitatively validate the 8-colorICS assay for use in clinical trials of candidate vaccines, which includes measurement of viable IFN-γ, IL-2, TNF-α and IL-4producing CD4+ and CD8+ T cells. We show that omission of viability dye staining results in an over-estimate of the true antigen-specific T cell response by up to two-fold. After optimization, the 8-color assay was validated for specificity, precision, linearity,limit of quantitation and robustness. The assay has a lower quantitation limit generally below 0.04%, depending on the cytokinesubset. Additionally, with appropriate gating, the 8-color assay gives comparable cytokine-positive responses to those observedwith the conventional 4-color assay. In conclusion, we provide the first description of a quantitatively validated ICS assay, whichpermits quantitative and qualitative evaluation of vaccine-induced immunogenicity and analysis of immune correlates ofprotection.© 2007 Elsevier B.V. All rights reserved.
Keywords: Flow cytometry; Intracellular cytokine staining; Vaccine; Immunogenicity; Assay validation
Abbreviations: Intracellular Cytokine Staining (ICS); peripheral blood mononuclear cells (PBMC); HIV Vaccine Trials Network (HVTN);Cytomegalovirus (CMV); Human Immunodeficiency Virus (HIV-1); Staphylococcal enterotoxin B (SEB); potential T cell epitope (PTE); interferon-γ (IFN-γ); interleukin-2 (IL-2); tumor necrosis factor-α (TNF-α); interleukin-4 (IL-4).⁎ Corresponding author. Fred Hutchinson Cancer Research Center, 1100 Fairview Avenue N., LE-200, Seattle WA 98109, USA. Tel.: +1 206 667
1681; fax: +1 206 667 6608.E-mail address: [email protected] (S.C. De Rosa).
0022-1759/$ - see front matter © 2007 Elsevier B.V. All rights reserved.doi:10.1016/j.jim.2007.03.002
40 H. Horton et al. / Journal of Immunological Methods 323 (2007) 39–54
1. Introduction
The AIDS pandemic has created an urgent global needto produce an efficacious prophylactic HIV-1 vaccine.Unfortunately, sterilizing immunity will only be producedwith broadly reactiveHIV-specific neutralizing antibodieswhich, for numerous reasons, are difficult to induce byvaccination (discussed in Burton et al., 2004). Indeed, thiswas emphasized by the recent data from the Vaxgen, Inc.phase III trial showing no efficacy of this envelope-basedvaccine (Cohen, 2003). Thus, most current clinical trialsassessing potential HIV vaccines are designed to elicit Tcell immunity against HIV-1. Recent studies in rhesusmacaques have implicated vaccine-induced CD8+ T cellresponses in increased survival following SIV infection(Letvin et al., 2006; Mattapallil et al., 2006). Studies inmouse models have demonstrated that maintenance ofeffective CD8+ CTL requires the presence of antigen-specific CD4+ T helper cells (Sun and Bevan, 2003; Sunet al., 2004). Thus, a successful vaccine may need toinduce both T cell subset populations.
Measurement of antigen-specific T cell responsesinduced by vaccination has relied on the IFN-γ ELISpotassay, which has been extensively validated for use inclinical trials (Russell et al., 2003). However, this assay islimited in that it gives no information regarding theimmunophenotype of the responding cells, and onlymeasures production of a single effector molecule. TheICS assay provides sensitive and quantitative phenotypicand polyfunctional data on responding Tcell populations,making the assay more valuable for functional profilingof low-level vaccine-induced T cell responses. Since thecorrelates of protection against HIV-1 infection/progres-sion are not known, and since subtle differences infrequency and/or function of HIV-1-specific T cells mayhave profound effects on the capacity to protect and onsubsequent HIV-1 disease course, this information is ofconsequence. Significantly, like the ELISpot assay, theICS assay can be performed using cryopreserved PBMC,which enables retrospective analyses to measure quanti-tative and qualitative differences between differentvaccine regimens and to determine whether cellularimmune responses correlate with protection from infec-tion or control of infection.
Two ICS assays were chosen for optimization andvalidation. Initial optimization experiments were re-stricted to 4-color staining because of limited access toflow cytometers capable of examining more than fourcolors. The 4-color panel consists of antibodies specificfor CD3, CD4 and CD8 detected on separate colors, andIFN-γ and anti-IL-2 on the same color. In this way, thetotal cytokine response for the two cytokines is detected,
although the co-expression of one or both cytokinescannot be separately revealed. We expanded our stainingpanel to eight colors when an instrument capable ofexamining more than four colors became available toour laboratory. In this panel, anti-IFN-γ and anti-IL-2are included on separate colors to evaluate single andco-expression of these cytokines. In addition, antibodiesspecific for TNF-α and IL-4 are included. These twocytokines have been useful for identifying discretefunctional profiles in previous studies (De Rosa et al.,2004; Betts et al., 2006). Finally, a viability marker isincluded to identify and exclude dead cells that can bindantibodies, which result in non-antigen-specific cyto-kine responses.
Advancement of T cell vaccines to phase III efficacytrials requires validation of immunoassays that measurethe frequency and function of the induced antigen-specificT cells. While assays for detecting cellular immuneresponses in humans have recently been included asprimary endpoints for clinical trials, the validation of theseassays has generally not been approached in amanner thatsatisfies the guidelines provided in the Industry forGuidance — Bioanalytical Method Validation (http://www.fda.gov/CDER/GUIDANCE/4252fnl.htm, 2001)or the ICH Q2A and Q2B documents (http://www.fda.gov/cder/guidance/index.htm, 1996). These documentsprovide detailed definitions of eight parameters that mustbe investigated experimentally in order to validate abioanalytical assay: (1) specificity/selectivity, (2) accura-cy, (3) precision, (repeatability, intermediate precision,reproducibility), (4) detection limit, (5) quantificationlimit, (6) linearity, (7) range and (8) robustness. Here weprovide extensive optimization and, to our knowledge, thefirst quantitative validation data for an 8-color ICS assaydesigned to allow qualitative and quantitative evaluationof vaccine-induced T cell responses.
2. Methods
2.1. Study participants
Most validation experiments were performed onCMV-seropositive, HIV-seronegative individuals, cho-sen because they most closely represent the populationsparticipating in HIV Vaccine Trials Network (HVTN)clinical trials. The majority of optimization experimentswere performed on three CMV-seropositive individualswho underwent leukapheresis, providing sufficientcryopreserved PBMC from a single time point for allvalidation studies. Qualitative validation experimentsalso included individuals with chronic HIV-1 infection,some of whom were receiving anti-retroviral treatment.
41H. Horton et al. / Journal of Immunological Methods 323 (2007) 39–54
The subjects were recruited and enrolled at the SeattleHIV Vaccine Trials Unit. The Institutional ReviewBoard approved the study, and prior to enrollment vol-unteers provided written consent after being informed ofthe nature and possible consequences of the study.
2.2. PBMC sample processing
PBMC were isolated and cryopreserved either fromwhole blood or from a leukapheresis product within 8 hof venipuncture using standard procedures as previouslydescribed (Bach and Brashler, 1970; Boyum, 1976; Bullet al., in press). PBMC were thawed and restedovernight at 37 °C/5% CO2 in R10 [RPMI 1640(GibcoBRL, NY, USA) containing 10% FCS (GeminiBioproducts, CA), 2 mM L-glutamine (GibcoBRL),100 U/ml penicillin G, 100 μg/ml streptomycin sulfate]prior to stimulation. A minimum cell viability of 66%measured after overnight resting on the day followingthaw was required for use in ICS assays. This thresholdis arbitrary and was chosen because this is the thresholdcurrently used for PBMC samples processed within theHIV Vaccine Trials Network (HVTN).
Table 1Staining panels used for validation experiments
ICS Panel Marker
Panel A 4-color CD3CD4CD8IFN-γ/IL-2 a combined or IFN- γ orIL-2 or TNF-γ in separate panels b
Panel B c 4-color CD3CD4 or CD8d
IFN-γIL-2
Panel C 5-color e Violet viability dye f
CD3CD4 or CD8IFN-γIL-2
Panel D 8-color Violet viability dye f
CD3CD4CD8IFN-γIL-2TNF-αIL-4
a PE-conjugated antibodies to IFN-γ and IL-2 are both used together to stb One of these cytokines used individually in this panel (e.g., CD3, CD4, CD
cytokines.c A variation of this panel included only one cytokine on PE and CD69 od Two 4-color panels are required to examine both CD4+ and CD8+ T cell re Referred to as the modified 4-color panel in Fig. 4C.f LIVE/DEAD Fixable Violet Dead Cell Stain (see Methods).
2.3. In vitro stimulations
PBMC were assessed for ex vivo responses to (1) apool of CMV 15-mer peptides overlapping by 11 aminoacids spanning the entire pp65 protein (kindly providedby the Division of AIDS, NIH); and/or (2) pools of HIV-1 15-mer peptides overlapping by 11 amino acidsspanning Gag (HIV-1 H×B2), Nef (HIV-1 BRU) or Pol(HIV-1 H×B2) or covering potential T cell epitopes(PTE) for Env, Gag, Pol and Nef (Li et al., 2006).Staphylococcal enterotoxin B (SEB) stimulation servedas a positive control. PBMC with peptide diluent (1%DMSO) served as the negative control. During the six-hour stimulation, Brefeldin A (10 μg/ml, Sigma, St.Louis, MO) and the co-stimulatory antibodies CD28 andCD49d (each at 1 μg/ml, Becton Dickinson (BD)Biosciences, San Jose, CA) were included.
2.4. ICS protocol
All antibodies, except the CD3 ECD, were purchasedfrom BD Biosciences. The CD3 ECD (or PE-TR) waspurchased from Beckman–Coulter (Marseille, France).
Dye Purpose
APCDefines lineageFITC
PerCP-Cy5.5PE Cytokine response
APC Defines lineagePerCP-Cy5.5FITC Cytokine responsePEPacBlu channel Excludes dead cellsAPC Defines lineagePerCP-Cy5.5FITC Cytokine responsePEPacBlu channel Excludes dead cellsPE-TR
Defines lineageFITCPerCP-Cy5.5PE-Cy7 Cytokine responsePEAlx-700APC
ain cells.8, TNF-α). A separate panel needs to be used to evaluate each of these
n FITC.esponses. One panel includes CD4, and the other panel includes CD8.
42 H. Horton et al. / Journal of Immunological Methods 323 (2007) 39–54
LIVE/DEAD Fixable Violet Dead Cell Stain was pur-chased from Invitrogen/Molecular Probes (Eugene,OR). The concentration of all antibodies was titratedprior to use. Staining panels assayed during optimiza-tion and validation are detailed in Table 1. The Cytokine
Flow Cytometry (CFC) protocol from BD was chosenfor further optimization and validation since extensivedocumented standardization of this assay already exists.All samples were acquired on a FACS Calibur flowcytometer (BD) capable of measuring four colors or an
43H. Horton et al. / Journal of Immunological Methods 323 (2007) 39–54
LSRII flow cytometer capable of measuring 18 colors(BD), collecting 100–200,000 lymphocyte-gated events.Samples were collected from 96-well plates using HighThroughput Sample (HTS, BD) device for analysis bythe LSRII. All FACS analyses were performed usingFlowJo® software (Treestar, Inc; OR).
2.5. Statistical analysis
Graphs were prepared using JMP software (SASInstitute, Cary, NC). A paired T test (JMP software) wasused to compare across the conditions shown in Figs. 1and 4C.
2.5.1. Method for qualitative validation of responsesfrom ICS assays
PBMC from 50 HIV-seronegative individuals andfrom between 10 and 20 HIV-seropositive individualswere examined. For each sample and for each HIV-1 peptide pool, the responses were categorized as eitherpositive or negative. Positivity was based on compar-isons of the percentage of T cells with positive cytokinestaining between the experimental well and the negativecontrol well. Positivity was determined for each cyto-kine subset; e.g. IFN-γ+IL-2−. If at least one cytokinesubset was positive, the overall peptide pool was con-sidered positive.
Two-by-two contingency tables were derived for eachcomparison between the stimulated and negative controldata for each cytokine subset. The four entries in the tableare the number of cells positive for the cytokine subset
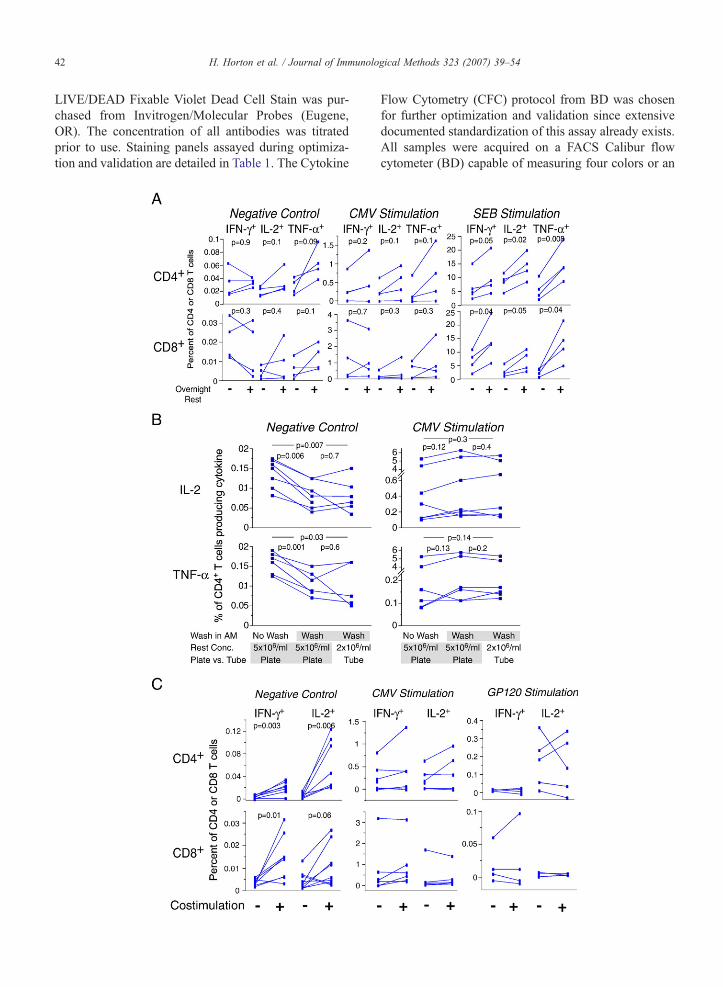
Fig. 1. A. Culture of cells overnight after thaw increases cytokine responsewashed, resuspended at 5×10⁶ cells/ml and added to the wells of two 96immediately for 6 h with DMSO, CMVor SEB, including co-stimulation anplaced into culture overnight (rested), washed in the morning, and then stimuthat included CD3, CD4, CD8 and the cytokine (IFN-γ, IL-2 or TNF-α Panel Alower panels show the CD8+ T cell responses. The left panels show responresponses to the CMVpp65 peptide pool, and the right panels show the resporesponses without or with overnight rest. All data for CMVand SEB are bacWashing cells after overnight rest decreases background for IL-2 and TNF-αexamined in this experiment: resting concentration, incubation vessel for restthe overnight rest. For the first condition (left column in each graph), cells wwashed before stimulation the next morning. The second condition (middle cothe morning before stimulation. For the third condition, cells were rested at 2stimulation. CD4+ T cell responses to IL-2 (upper panels) and TNF-α (lowecontrol, and the right panels show the responses to CMV. Six different PBMCThe 8-color ICS panel was used. Paired T test p values for comparisons bestimulation with α-CD28/CD49d increases background responses, but doesPBMC samples from five participants in HVTN protocol 041 (subunit protein2005) were stimulated with a gp120 peptide pool (right panels), with the CMleft panels). The percentages of CD4+ (upper) and CD8+ (lower) T cells produwithout co-stimulation are compared. Lines connect responses from the samsubtracted. For this experiment, cells were rested overnight at 5×10⁶/ml and wnegative control. Comparisons for the Gp120 and CMV are not significant.
and the number of cells negative for the cytokine subset,for both the stimulated and the negative control data. Aone-sided Fisher's Exact Test was applied to each table,testing whether the number of cytokine-producing cellsfor the stimulated data was greater than that for thenegative control data. Since many tests were conductedsimultaneously for the multiple cytokine subsets,multiple T cell subsets and multiple peptide pools, amultiplicity adjustment was made using the discreteBonferroni adjustment method (Westfall and Wolfinger,1997; Westfall et al., 1999). The adjusted p-values wereused to determine positivity, with values less than orequal to α=10−5 indicating a positive response.
2.5.2. Method for quantitative validation of responsesfrom ICS assays
We developed a plan to perform quantitative vali-dation, and the experimental design is summarized inthe Results section. To assess the linearity of the assay,simple linear regression models were used to determinethe relationship between assay read-out and sampleconcentration levels. Analyses of precision were doneseparately at each concentration level. Standard mixedeffect models run in SAS Inc. were used to derive variousprecision estimates for inter-analyst, inter-day, inter-plate and within-plate variance components. These as-sessments were done for each analyst, and then com-bined. The range of reliable responses was defined as therange over which the precision estimates were within30% at all concentration levels. Data values that do notmeet this criterion, and therefore do not fall within the
s. Cryopreserved PBMC from four healthy individuals were thawed,-well round-bottom plates. For one plate, the cells were stimulatedd Brefeldin A. Cells were then processed by ICS. The other plate waslated for 6 h followed by ICS. Three 4-color staining panels were usedin Table 1). The upper panels show the CD4+ Tcell responses, and the
ses to co-stimulation only (negative control), the middle panels shownse to SEB. Each color represents a different subject, and the lines joinkground subtracted. Paired T test p values are shown on the graphs. B., but does not decrease CMV-specific responses. Three variables wereand stimulation, and washing vs. not washing cells in the morning afterere rested at 5×10⁶/ml in a 96-well round-bottom plate and were notlumn in each graph) was the same except that the cells were washed in×106/ml in 50 ml conical tubes and were washed in the morning beforer panels) are shown. The left panels show responses for the negativesamples were tested, and data for each sample are connected by lines.tween each of the three conditions are shown on the graphs. C. Co-not increase antigen-specific responses after background is subtracted.vaccine including Gp120 and a Nef/Tat fusion protein) (Goepfert et al.,Vpp65 peptide pool (middle panels), or with DMSO (negative control,cing IFN-γ and IL-2 are shown. Within each graph, responses with ore PBMC donor. Gp120 and CMV results are shown with backgroundere washed before stimulation. Paired T test p values are shown for the
44 H. Horton et al. / Journal of Immunological Methods 323 (2007) 39–54
explanatory upper or lower limits of quantification, wereexcluded from the final analyses. Two outliers wereexcluded from the final analysis because of high cyto-kine responses for all cytokines, likely due to SEBcontamination during the sample processing.
3. Results
3.1. Optimization of the ICS assay
Many variables and conditions were evaluated duringthe optimization of the ICS assay (Table 2). For HIVVaccine Trials Network (HVTN) clinical trials, PBMCare isolated and cryopreserved within 8 h of venipunc-ture to ensure optimal performance in immunoassay.Therefore, the ICS assay was optimized and validatedusing cryopreserved rather than freshly isolated PBMCalthough the results should be equally applicable forfreshly isolated cells. The procedures used for freezingand thawing of PBMC samples affects the viabilities ofthe cells after thawing. Our previous studies have shownthat lower viabilities are associated with a decrease inCMV-specific T cell responses as measured by the IFN-γ ELISpot assay (Bull et al., in press). In the studiesreported here, the viabilities for the PBMC samplesdetermined immediately after thaw or after overnightculture were on average above 90% and no samples hadviabilities below 66%, the lower acceptable thresholdused for the HVTN clinical trials.
Table 2Summary of variables and conditions tested during the optimization and val
Variable Conditions tested(selected condition underlined)
Reason ch
PBMC rest post-thaw Culture overnight (rest) Increasesbut not baNo rest
Resting condition 5×10⁶/ml in plates; no wash Decreases(mainly foalso allow
5×10⁶/ml in plates; wash2×106/ml in tubes; wash
Stimulation time 4 hrs CytokineTNF-α, IL6 hrs
OvernightCostimulation With αCD28/CD49d May incre
(but alsoWithout αCD28/CD49dPeptide length 15mers overlapping by 11 Stimulate
(as reportPeptide pool size 50, 100, 150, 200 peptides ≤100; mo
N100 pepCD4 and CD8 included insame 4-color panel
CD3, CD4, cytokine (±CD69) Reduces ndouble poCD3, CD8, cytokine (±CD69)
CD3, CD4, CD8 cytokineCell viability marker Included Decreases
especiallyNot included
a Staining panel as listed in Table 1.
3.2. Processing of PBMC after thawing
Our previous experiments suggested that culturingthawed cells overnight at 37 °C/5% CO2 prior to sti-mulation (denoted “resting cells”) results in increaseddetectable cytokine-producing cells by ICS. To confirmthis, we compared CMV-specific and polyclonal (SEB)responses for PBMC stimulated immediately after thaw-ing to those after thawing and overnight rest (Fig. 1A).The percentage of bothCD4+ andCD8+ Tcells producingall three cytokines tested (IFN-γ, IL-2 and TNF-α) wereincreased by as much as three-fold after resting for SEBstimulation, supporting our earlier observations.Responses to CMV were not significantly increased, butthere was a trend toward increased responses for somesamples. Background levels of cytokine-producing cells,i.e., without antigen or SEB during the six-hour sti-mulation period, were not substantially affected whethercells had or had not been rested (Fig. 1A).
For the overnight rest, cells are cultured at 2×10⁶/mlin R10 in 50 ml conical tubes, washed the next morning,re-counted, and then distributed at 5×10⁶/ml into thewells of a 96-well round-bottom plate (Costar, CorningNY) for the stimulation. To optimize this protocol, theeffect of cell concentration, type of culture vessel andwashing of the cells after overnight rest was evaluated.The type of culture vessel used for either the rest or thestimulation, whether tubes or 96-well round-bottom orv-bottom plates, had no effect on cytokine responses
idation of the ICS assay
osen for assay Figure/staining panel a
Ag-specific cytokine responses,ckground
1A/Panel D
background but not Ag-specific responsesr IL-2 and TNF-α from CD4+ T cells);s for recounting after rest
1B/Panel D
responses maximal (for IFN-γ, IL-2,-4); also for convenience
N/A/Panel D
ases Ag-specific responsesincreases background)
1C/Panel D
s both CD4+ and CD8+ T cellsed previously)
N/A/Panel A
derate decrease in responses fortides per pool
2/Panel A
on-specific staining because CD4/CD8sitive cells excluded
N/A/Panel B
low-level non-specific staining,for IL-2 and IL-4
4/Panels C and D
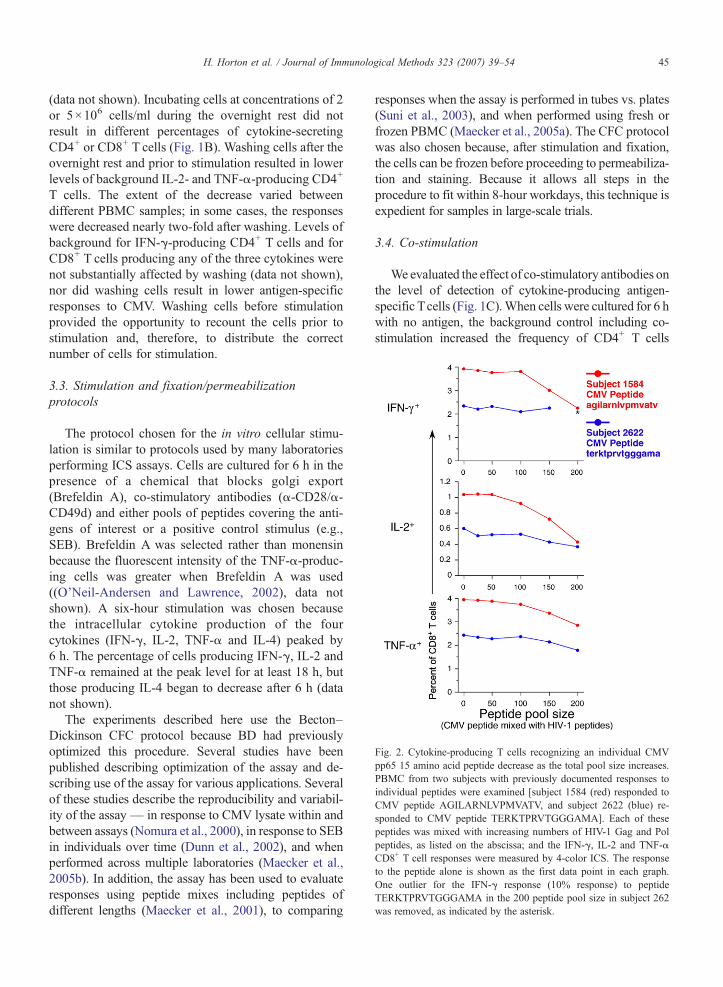
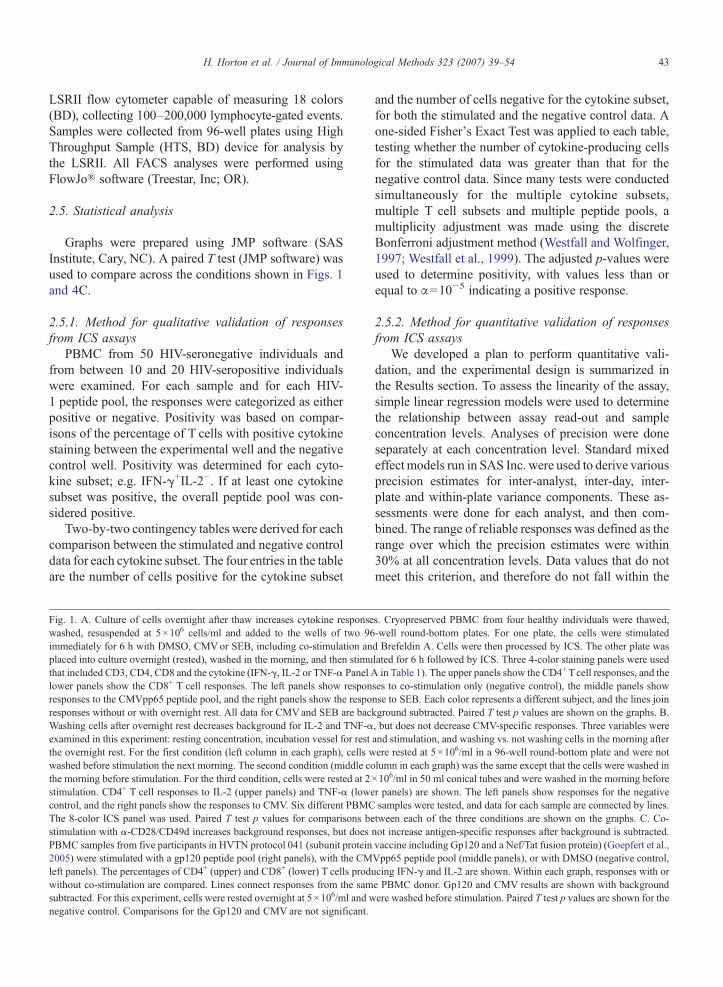
Fig. 2. Cytokine-producing T cells recognizing an individual CMVpp65 15 amino acid peptide decrease as the total pool size increases.PBMC from two subjects with previously documented responses toindividual peptides were examined [subject 1584 (red) responded toCMV peptide AGILARNLVPMVATV, and subject 2622 (blue) re-sponded to CMV peptide TERKTPRVTGGGAMA]. Each of thesepeptides was mixed with increasing numbers of HIV-1 Gag and Polpeptides, as listed on the abscissa; and the IFN-γ, IL-2 and TNF-αCD8+ T cell responses were measured by 4-color ICS. The responseto the peptide alone is shown as the first data point in each graph.One outlier for the IFN-γ response (10% response) to peptideTERKTPRVTGGGAMA in the 200 peptide pool size in subject 262was removed, as indicated by the asterisk.
45H. Horton et al. / Journal of Immunological Methods 323 (2007) 39–54
(data not shown). Incubating cells at concentrations of 2or 5×10⁶ cells/ml during the overnight rest did notresult in different percentages of cytokine-secretingCD4+ or CD8+ T cells (Fig. 1B). Washing cells after theovernight rest and prior to stimulation resulted in lowerlevels of background IL-2- and TNF-α-producing CD4+
T cells. The extent of the decrease varied betweendifferent PBMC samples; in some cases, the responseswere decreased nearly two-fold after washing. Levels ofbackground for IFN-γ-producing CD4+ T cells and forCD8+ T cells producing any of the three cytokines werenot substantially affected by washing (data not shown),nor did washing cells result in lower antigen-specificresponses to CMV. Washing cells before stimulationprovided the opportunity to recount the cells prior tostimulation and, therefore, to distribute the correctnumber of cells for stimulation.
3.3. Stimulation and fixation/permeabilizationprotocols
The protocol chosen for the in vitro cellular stimu-lation is similar to protocols used by many laboratoriesperforming ICS assays. Cells are cultured for 6 h in thepresence of a chemical that blocks golgi export(Brefeldin A), co-stimulatory antibodies (α-CD28/α-CD49d) and either pools of peptides covering the anti-gens of interest or a positive control stimulus (e.g.,SEB). Brefeldin A was selected rather than monensinbecause the fluorescent intensity of the TNF-α-produc-ing cells was greater when Brefeldin A was used((O'Neil-Andersen and Lawrence, 2002), data notshown). A six-hour stimulation was chosen becausethe intracellular cytokine production of the fourcytokines (IFN-γ, IL-2, TNF-α and IL-4) peaked by6 h. The percentage of cells producing IFN-γ, IL-2 andTNF-α remained at the peak level for at least 18 h, butthose producing IL-4 began to decrease after 6 h (datanot shown).
The experiments described here use the Becton–Dickinson CFC protocol because BD had previouslyoptimized this procedure. Several studies have beenpublished describing optimization of the assay and de-scribing use of the assay for various applications. Severalof these studies describe the reproducibility and variabil-ity of the assay— in response to CMV lysate within andbetween assays (Nomura et al., 2000), in response to SEBin individuals over time (Dunn et al., 2002), and whenperformed across multiple laboratories (Maecker et al.,2005b). In addition, the assay has been used to evaluateresponses using peptide mixes including peptides ofdifferent lengths (Maecker et al., 2001), to comparing
responses when the assay is performed in tubes vs. plates(Suni et al., 2003), and when performed using fresh orfrozen PBMC (Maecker et al., 2005a). The CFC protocolwas also chosen because, after stimulation and fixation,the cells can be frozen before proceeding to permeabiliza-tion and staining. Because it allows all steps in theprocedure to fit within 8-hour workdays, this technique isexpedient for samples in large-scale trials.
3.4. Co-stimulation
Weevaluated the effect of co-stimulatory antibodies onthe level of detection of cytokine-producing antigen-specific Tcells (Fig. 1C).When cells were cultured for 6 hwith no antigen, the background control including co-stimulation increased the frequency of CD4+ T cells
46 H. Horton et al. / Journal of Immunological Methods 323 (2007) 39–54
producing IFN-γ or IL-2 by as much as ten-fold. This“background” is generally greater for CD4+ T cellsproducing IL-2, and co-stimulation produced the largestproportional increase for this cytokine subset population.The detection of background cytokine-producing CD8+ Tcells was also increased, but to a lesser extent. In general,co-stimulation did not increase antigen-specific responsesto CMV or to Gp120 (in PBMC from individualsvaccinated with Gp120 protein) after background res-
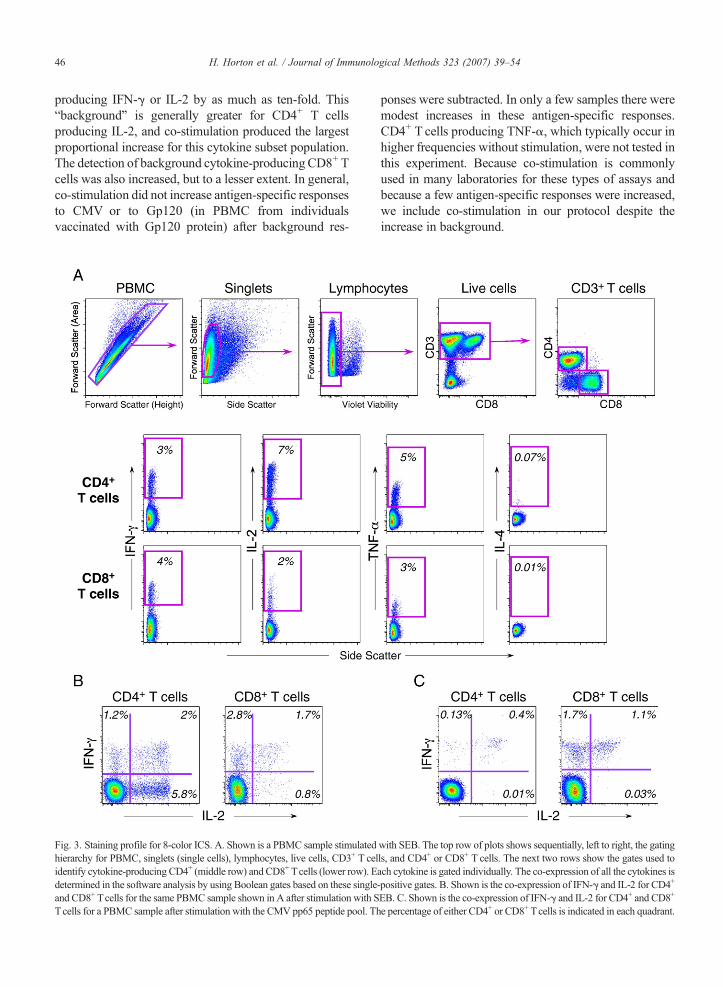
Fig. 3. Staining profile for 8-color ICS. A. Shown is a PBMC sample stimulatedhierarchy for PBMC, singlets (single cells), lymphocytes, live cells, CD3+ T celidentify cytokine-producing CD4+ (middle row) and CD8+ Tcells (lower row). Edetermined in the software analysis by using Boolean gates based on these singleand CD8+ Tcells for the same PBMC sample shown in A after stimulation with STcells for a PBMC sample after stimulation with the CMV pp65 peptide pool. Th
ponses were subtracted. In only a few samples there weremodest increases in these antigen-specific responses.CD4+ T cells producing TNF-α, which typically occur inhigher frequencies without stimulation, were not tested inthis experiment. Because co-stimulation is commonlyused in many laboratories for these types of assays andbecause a few antigen-specific responses were increased,we include co-stimulation in our protocol despite theincrease in background.
with SEB. The top row of plots shows sequentially, left to right, the gatingls, and CD4+ or CD8+ T cells. The next two rows show the gates used toach cytokine is gated individually. The co-expression of all the cytokines is-positive gates. B. Shown is the co-expression of IFN-γ and IL-2 for CD4+
EB. C. Shown is the co-expression of IFN-γ and IL-2 for CD4+ and CD8+
e percentage of either CD4+ or CD8+ Tcells is indicated in each quadrant.
47H. Horton et al. / Journal of Immunological Methods 323 (2007) 39–54
3.5. Peptide pool size
The peptides used for stimulation, were 15 aminoacids in length, and overlapped by 11 amino acids.These 15-mer peptides used for stimulation werecombined into pools. The effect of pool size, i.e., thenumber of peptides in the pool, was examined by
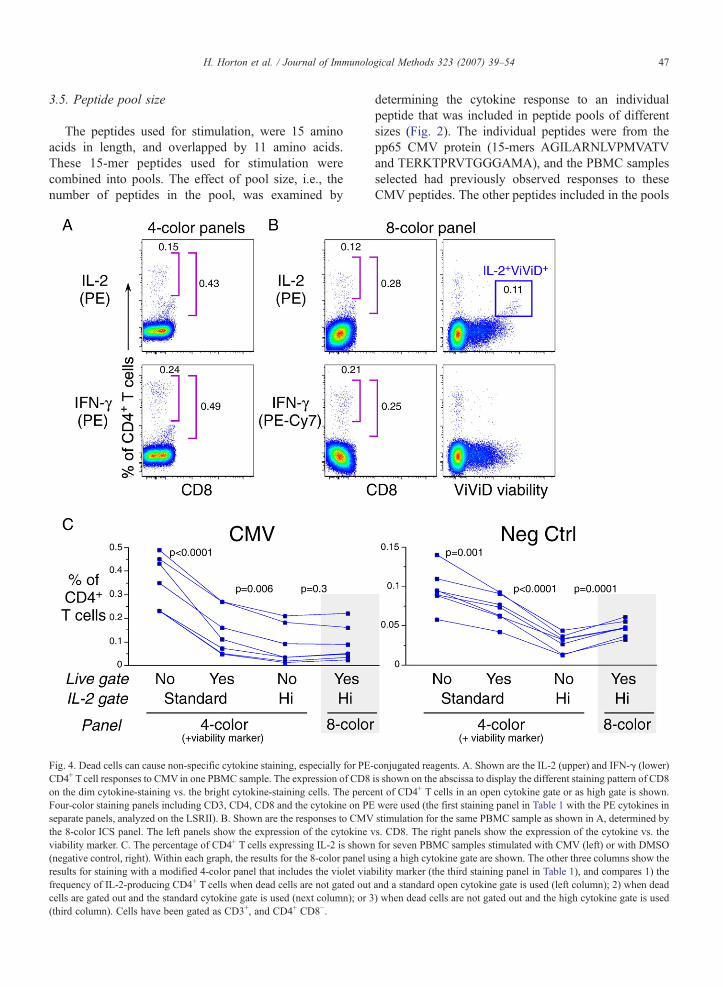
Fig. 4. Dead cells can cause non-specific cytokine staining, especially for PE-CD4+ T cell responses to CMV in one PBMC sample. The expression of CD8on the dim cytokine-staining vs. the bright cytokine-staining cells. The perceFour-color staining panels including CD3, CD4, CD8 and the cytokine on PEseparate panels, analyzed on the LSRII). B. Shown are the responses to CMVthe 8-color ICS panel. The left panels show the expression of the cytokine vviability marker. C. The percentage of CD4+ T cells expressing IL-2 is shown(negative control, right). Within each graph, the results for the 8-color panel uresults for staining with a modified 4-color panel that includes the violet viabfrequency of IL-2-producing CD4+ T cells when dead cells are not gated outcells are gated out and the standard cytokine gate is used (next column); or 3(third column). Cells have been gated as CD3+, and CD4+ CD8−.
determining the cytokine response to an individualpeptide that was included in peptide pools of differentsizes (Fig. 2). The individual peptides were from thepp65 CMV protein (15-mers AGILARNLVPMVATVand TERKTPRVTGGGAMA), and the PBMC samplesselected had previously observed responses to theseCMV peptides. The other peptides included in the pools
conjugated reagents. A. Shown are the IL-2 (upper) and IFN-γ (lower)is shown on the abscissa to display the different staining pattern of CD8nt of CD4+ T cells in an open cytokine gate or as high gate is shown.were used (the first staining panel in Table 1 with the PE cytokines instimulation for the same PBMC sample as shown in A, determined bys. CD8. The right panels show the expression of the cytokine vs. thefor seven PBMC samples stimulated with CMV (left) or with DMSOsing a high cytokine gate are shown. The other three columns show theility marker (the third staining panel in Table 1), and compares 1) theand a standard open cytokine gate is used (left column); 2) when dead) when dead cells are not gated out and the high cytokine gate is used
48 H. Horton et al. / Journal of Immunological Methods 323 (2007) 39–54
were derived from HIV proteins, and the PBMC testedwere from HIV-uninfected subjects. The appropriateamount of DMSO was added for each stimulationcondition to control for the larger amount of DMSOpresent for the largest pool size. Therefore, the responsewas specific only to the CMV peptide. In someinstances, up to a two-fold decrease in the cytokine-producing CD8+ T cells was observed when the peptidewas mixed with pools containing more than 100 pep-tides. In others, the larger pool sizes did not substantiallydecrease responses. Testing of a larger number ofsamples will be required to determine if our observa-tions in these few samples are statistically significant.Nevertheless, in light of the anecdotal observationspresented here and because we need the capability todetect low-level responses in our clinical trials, weinclude 100 peptides or fewer for the examination of ourclinical trial samples, except when the number ofpeptides is too large for this to be feasible (e.g., forthe PTE peptide pools used in the qualitative validationas discussed below).
3.6. Staining panels: 4- and 8-color; use of a viabilitydye
As noted in the Introduction, initial optimizationexperiments were performed using 4-color stainingpanels. Later, an 8-color staining panel was developed
Fig. 5. Summary of the ICS protocol is shown. This diagram outlines the mprotocol requires 3 days. Plates frozen on day 2 can be kept at − 80° for at
and was used for all the qualitative and quantitativevalidation experiments described below. An example ofthe gating hierarchy and cytokine-staining profiles ofCD4+ and CD8+ T cells generated from the 8-colorpanel and the gating hierarchy is depicted in Fig. 3.
To determine whether the 4- and 8-color panels detectthe same frequency of IFN-γ- and IL-2-producing Tcells,we compared two 4-color panels (CD3, CD4, CD8, andeither IFN-γ or IL-2) to the 8-color panel (Table 1). Sincethe 8-color panel included a viability dye, but the 4-colorpanels did not, this comparison also allowed us todetermine whether dead cells contribute significantly tonon-specific cytokine staining.
Examination of the staining profiles for the IL-2-and IFN-γ-producing cells using the 4-color panelsrevealed two levels of fluorescence intensity for thesecells — cells with either bright or dull fluorescence(Fig. 4A). We compared the percentage of cytokine-producing cells as determined by applying an open gate(including cells with either dim or bright cytokinestaining) vs. a high gate that only included the brightcytokine-staining cells. When an open gate was appliedto the 4-color panel, the frequency of IFN-γ+ or IL-2+
cells was at least double the frequency seen vs. whena higher cytokine gate was applied (Fig. 4A). Thefrequency of cytokine-positive cells determined withthe higher cytokine gates was more comparable to thedata obtained from the 8-color panel after excluding
ajor steps in the ICS protocol used for analysis of trial samples. Theleast 4 weeks before proceeding to the next steps as shown on day 3.
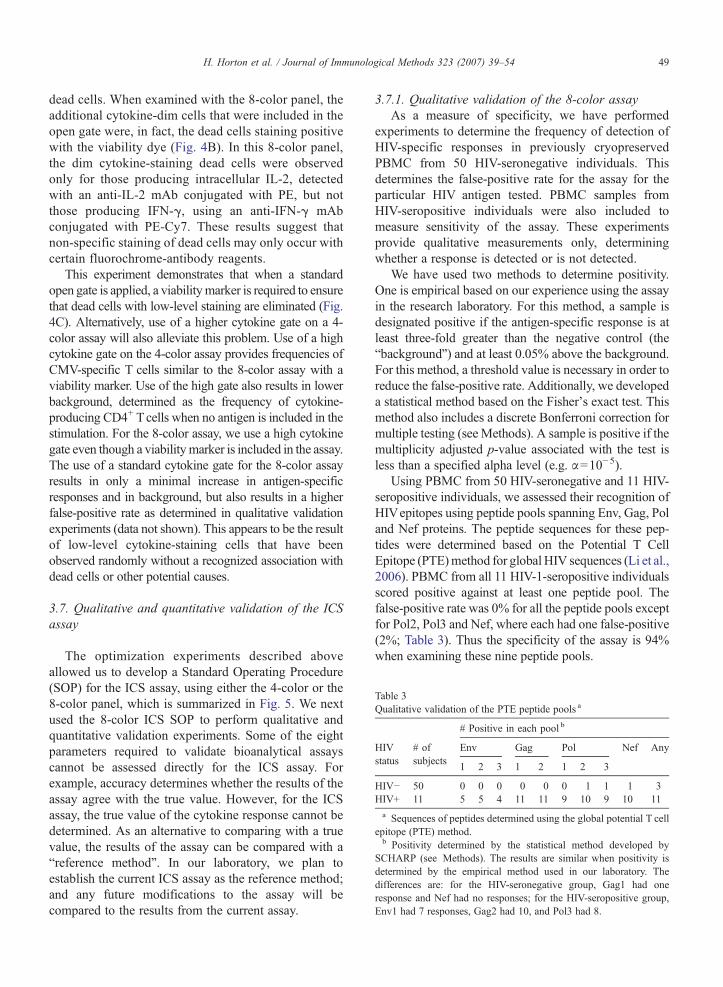
Table 3Qualitative validation of the PTE peptide pools a
# Positive in each pool b
HIVstatus
# ofsubjects
Env Gag Pol Nef Any
1 2 3 1 2 1 2 3
HIV− 50 0 0 0 0 0 0 1 1 1 3HIV+ 11 5 5 4 11 11 9 10 9 10 11
a Sequences of peptides determined using the global potential T cellepitope (PTE) method.b Positivity determined by the statistical method developed by
SCHARP (see Methods). The results are similar when positivity isdetermined by the empirical method used in our laboratory. Thedifferences are: for the HIV-seronegative group, Gag1 had oneresponse and Nef had no responses; for the HIV-seropositive group,Env1 had 7 responses, Gag2 had 10, and Pol3 had 8.
49H. Horton et al. / Journal of Immunological Methods 323 (2007) 39–54
dead cells. When examined with the 8-color panel, theadditional cytokine-dim cells that were included in theopen gate were, in fact, the dead cells staining positivewith the viability dye (Fig. 4B). In this 8-color panel,the dim cytokine-staining dead cells were observedonly for those producing intracellular IL-2, detectedwith an anti-IL-2 mAb conjugated with PE, but notthose producing IFN-γ, using an anti-IFN-γ mAbconjugated with PE-Cy7. These results suggest thatnon-specific staining of dead cells may only occur withcertain fluorochrome-antibody reagents.
This experiment demonstrates that when a standardopen gate is applied, a viabilitymarker is required to ensurethat dead cells with low-level staining are eliminated (Fig.4C). Alternatively, use of a higher cytokine gate on a 4-color assay will also alleviate this problem. Use of a highcytokine gate on the 4-color assay provides frequencies ofCMV-specific T cells similar to the 8-color assay with aviability marker. Use of the high gate also results in lowerbackground, determined as the frequency of cytokine-producing CD4+ Tcells when no antigen is included in thestimulation. For the 8-color assay, we use a high cytokinegate even though a viabilitymarker is included in the assay.The use of a standard cytokine gate for the 8-color assayresults in only a minimal increase in antigen-specificresponses and in background, but also results in a higherfalse-positive rate as determined in qualitative validationexperiments (data not shown). This appears to be the resultof low-level cytokine-staining cells that have beenobserved randomly without a recognized association withdead cells or other potential causes.
3.7. Qualitative and quantitative validation of the ICSassay
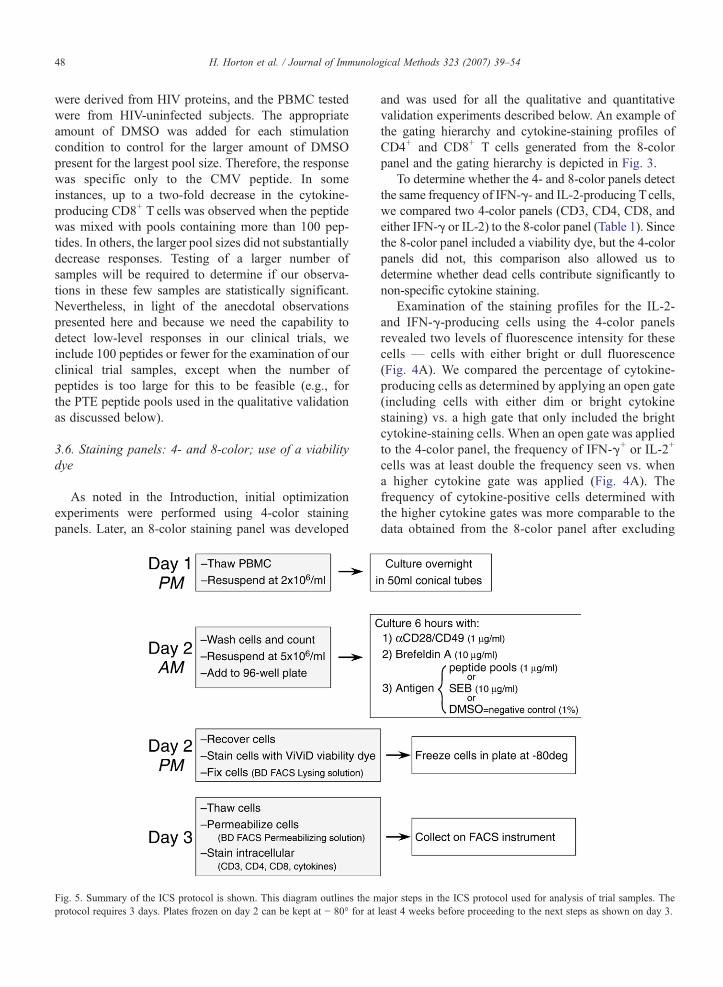
The optimization experiments described aboveallowed us to develop a Standard Operating Procedure(SOP) for the ICS assay, using either the 4-color or the8-color panel, which is summarized in Fig. 5. We nextused the 8-color ICS SOP to perform qualitative andquantitative validation experiments. Some of the eightparameters required to validate bioanalytical assayscannot be assessed directly for the ICS assay. Forexample, accuracy determines whether the results of theassay agree with the true value. However, for the ICSassay, the true value of the cytokine response cannot bedetermined. As an alternative to comparing with a truevalue, the results of the assay can be compared with a“reference method”. In our laboratory, we plan toestablish the current ICS assay as the reference method;and any future modifications to the assay will becompared to the results from the current assay.
3.7.1. Qualitative validation of the 8-color assayAs a measure of specificity, we have performed
experiments to determine the frequency of detection ofHIV-specific responses in previously cryopreservedPBMC from 50 HIV-seronegative individuals. Thisdetermines the false-positive rate for the assay for theparticular HIV antigen tested. PBMC samples fromHIV-seropositive individuals were also included tomeasure sensitivity of the assay. These experimentsprovide qualitative measurements only, determiningwhether a response is detected or is not detected.
We have used two methods to determine positivity.One is empirical based on our experience using the assayin the research laboratory. For this method, a sample isdesignated positive if the antigen-specific response is atleast three-fold greater than the negative control (the“background”) and at least 0.05% above the background.For this method, a threshold value is necessary in order toreduce the false-positive rate. Additionally, we developeda statistical method based on the Fisher's exact test. Thismethod also includes a discrete Bonferroni correction formultiple testing (seeMethods). A sample is positive if themultiplicity adjusted p-value associated with the test isless than a specified alpha level (e.g. α=10−5).
Using PBMC from 50 HIV-seronegative and 11 HIV-seropositive individuals, we assessed their recognition ofHIVepitopes using peptide pools spanning Env, Gag, Poland Nef proteins. The peptide sequences for these pep-tides were determined based on the Potential T CellEpitope (PTE)method for global HIV sequences (Li et al.,2006). PBMC from all 11 HIV-1-seropositive individualsscored positive against at least one peptide pool. Thefalse-positive rate was 0% for all the peptide pools exceptfor Pol2, Pol3 and Nef, where each had one false-positive(2%; Table 3). Thus the specificity of the assay is 94%when examining these nine peptide pools.
50 H. Horton et al. / Journal of Immunological Methods 323 (2007) 39–54
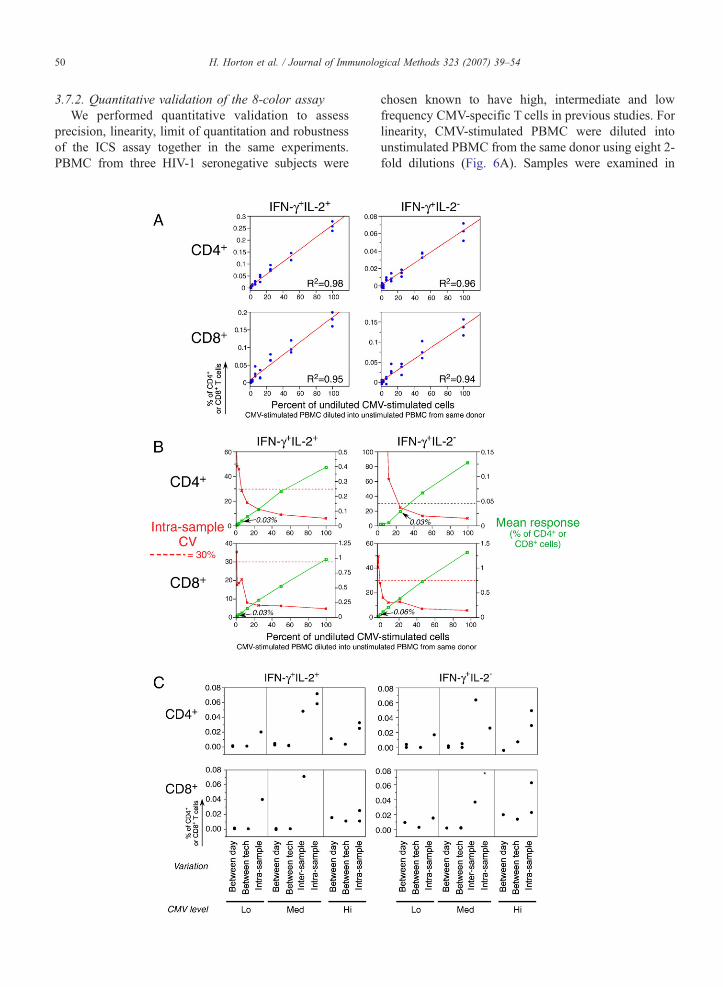
3.7.2. Quantitative validation of the 8-color assayWe performed quantitative validation to assess
precision, linearity, limit of quantitation and robustnessof the ICS assay together in the same experiments.PBMC from three HIV-1 seronegative subjects were
chosen known to have high, intermediate and lowfrequency CMV-specific T cells in previous studies. Forlinearity, CMV-stimulated PBMC were diluted intounstimulated PBMC from the same donor using eight 2-fold dilutions (Fig. 6A). Samples were examined in
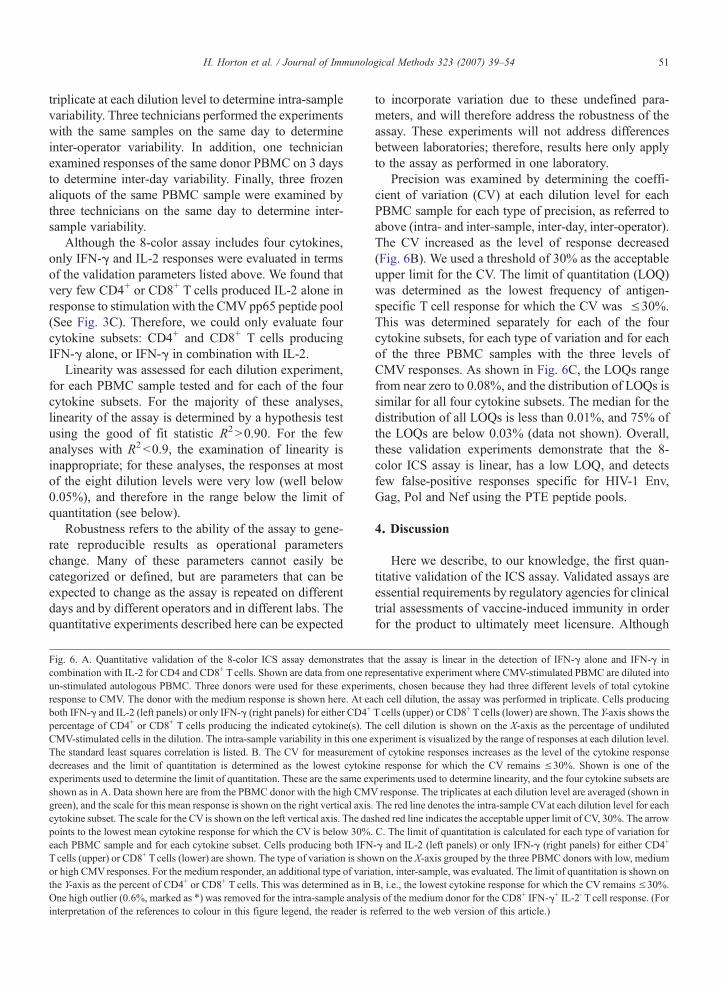
51H. Horton et al. / Journal of Immunological Methods 323 (2007) 39–54
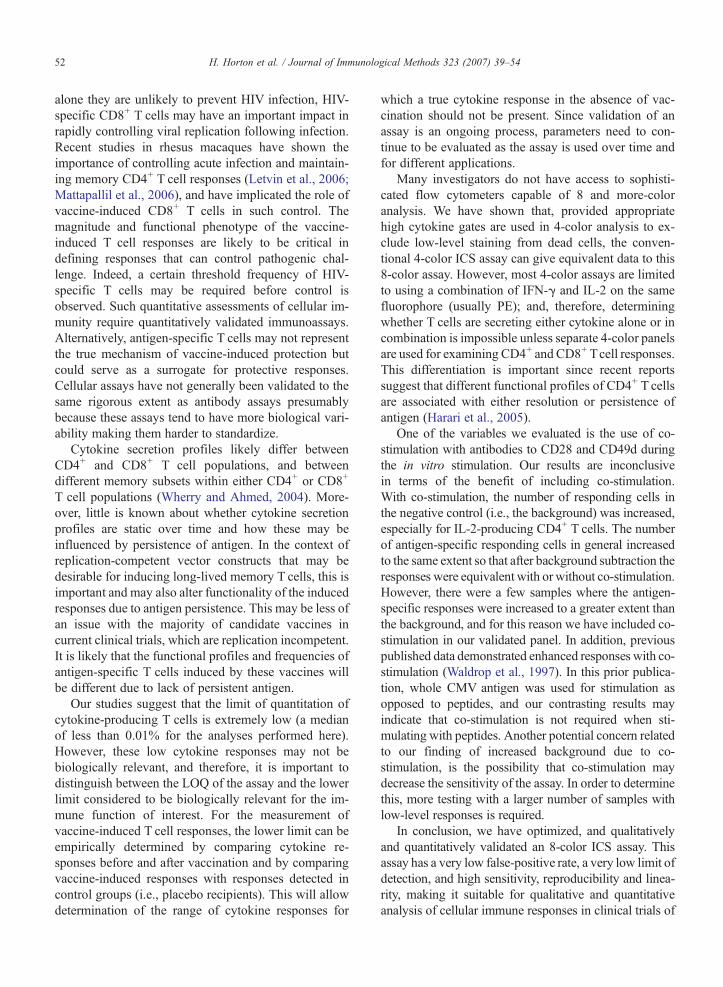
triplicate at each dilution level to determine intra-samplevariability. Three technicians performed the experimentswith the same samples on the same day to determineinter-operator variability. In addition, one technicianexamined responses of the same donor PBMC on 3 daysto determine inter-day variability. Finally, three frozenaliquots of the same PBMC sample were examined bythree technicians on the same day to determine inter-sample variability.
Although the 8-color assay includes four cytokines,only IFN-γ and IL-2 responses were evaluated in termsof the validation parameters listed above. We found thatvery few CD4+ or CD8+ T cells produced IL-2 alone inresponse to stimulation with the CMV pp65 peptide pool(See Fig. 3C). Therefore, we could only evaluate fourcytokine subsets: CD4+ and CD8+ T cells producingIFN-γ alone, or IFN-γ in combination with IL-2.
Linearity was assessed for each dilution experiment,for each PBMC sample tested and for each of the fourcytokine subsets. For the majority of these analyses,linearity of the assay is determined by a hypothesis testusing the good of fit statistic R2N0.90. For the fewanalyses with R2b0.9, the examination of linearity isinappropriate; for these analyses, the responses at mostof the eight dilution levels were very low (well below0.05%), and therefore in the range below the limit ofquantitation (see below).
Robustness refers to the ability of the assay to gene-rate reproducible results as operational parameterschange. Many of these parameters cannot easily becategorized or defined, but are parameters that can beexpected to change as the assay is repeated on differentdays and by different operators and in different labs. Thequantitative experiments described here can be expected
Fig. 6. A. Quantitative validation of the 8-color ICS assay demonstrates thcombination with IL-2 for CD4 and CD8+ T cells. Shown are data from one reun-stimulated autologous PBMC. Three donors were used for these experimresponse to CMV. The donor with the medium response is shown here. At eaboth IFN-γ and IL-2 (left panels) or only IFN-γ (right panels) for either CD4+
percentage of CD4+ or CD8+ T cells producing the indicated cytokine(s). TCMV-stimulated cells in the dilution. The intra-sample variability in this one eThe standard least squares correlation is listed. B. The CV for measurementdecreases and the limit of quantitation is determined as the lowest cytokinexperiments used to determine the limit of quantitation. These are the same exshown as in A. Data shown here are from the PBMC donor with the high CMVgreen), and the scale for this mean response is shown on the right vertical axis.cytokine subset. The scale for the CV is shown on the left vertical axis. The daspoints to the lowest mean cytokine response for which the CV is below 30%.each PBMC sample and for each cytokine subset. Cells producing both IFNTcells (upper) or CD8+ T cells (lower) are shown. The type of variation is shoor high CMVresponses. For the medium responder, an additional type of variathe Y-axis as the percent of CD4+ or CD8+ T cells. This was determined as inOne high outlier (0.6%, marked as ⁎) was removed for the intra-sample analysinterpretation of the references to colour in this figure legend, the reader is r
to incorporate variation due to these undefined para-meters, and will therefore address the robustness of theassay. These experiments will not address differencesbetween laboratories; therefore, results here only applyto the assay as performed in one laboratory.
Precision was examined by determining the coeffi-cient of variation (CV) at each dilution level for eachPBMC sample for each type of precision, as referred toabove (intra- and inter-sample, inter-day, inter-operator).The CV increased as the level of response decreased(Fig. 6B). We used a threshold of 30% as the acceptableupper limit for the CV. The limit of quantitation (LOQ)was determined as the lowest frequency of antigen-specific T cell response for which the CV was ≤30%.This was determined separately for each of the fourcytokine subsets, for each type of variation and for eachof the three PBMC samples with the three levels ofCMV responses. As shown in Fig. 6C, the LOQs rangefrom near zero to 0.08%, and the distribution of LOQs issimilar for all four cytokine subsets. The median for thedistribution of all LOQs is less than 0.01%, and 75% ofthe LOQs are below 0.03% (data not shown). Overall,these validation experiments demonstrate that the 8-color ICS assay is linear, has a low LOQ, and detectsfew false-positive responses specific for HIV-1 Env,Gag, Pol and Nef using the PTE peptide pools.
4. Discussion
Here we describe, to our knowledge, the first quan-titative validation of the ICS assay. Validated assays areessential requirements by regulatory agencies for clinicaltrial assessments of vaccine-induced immunity in orderfor the product to ultimately meet licensure. Although
at the assay is linear in the detection of IFN-γ alone and IFN-γ inpresentative experiment where CMV-stimulated PBMC are diluted intoents, chosen because they had three different levels of total cytokinech cell dilution, the assay was performed in triplicate. Cells producingT cells (upper) or CD8+ T cells (lower) are shown. The Y-axis shows thehe cell dilution is shown on the X-axis as the percentage of undilutedxperiment is visualized by the range of responses at each dilution level.of cytokine responses increases as the level of the cytokine responsee response for which the CV remains ≤30%. Shown is one of theperiments used to determine linearity, and the four cytokine subsets areresponse. The triplicates at each dilution level are averaged (shown inThe red line denotes the intra-sample CVat each dilution level for eachhed red line indicates the acceptable upper limit of CV, 30%. The arrowC. The limit of quantitation is calculated for each type of variation for-γ and IL-2 (left panels) or only IFN-γ (right panels) for either CD4+
wn on the X-axis grouped by the three PBMC donors with low, mediumtion, inter-sample, was evaluated. The limit of quantitation is shown onB, i.e., the lowest cytokine response for which the CV remains ≤30%.is of the medium donor for the CD8+ IFN-γ+ IL-2- T cell response. (Foreferred to the web version of this article.)
52 H. Horton et al. / Journal of Immunological Methods 323 (2007) 39–54
alone they are unlikely to prevent HIV infection, HIV-specific CD8+ T cells may have an important impact inrapidly controlling viral replication following infection.Recent studies in rhesus macaques have shown theimportance of controlling acute infection and maintain-ing memory CD4+ T cell responses (Letvin et al., 2006;Mattapallil et al., 2006), and have implicated the role ofvaccine-induced CD8+ T cells in such control. Themagnitude and functional phenotype of the vaccine-induced T cell responses are likely to be critical indefining responses that can control pathogenic chal-lenge. Indeed, a certain threshold frequency of HIV-specific T cells may be required before control isobserved. Such quantitative assessments of cellular im-munity require quantitatively validated immunoassays.Alternatively, antigen-specific T cells may not representthe true mechanism of vaccine-induced protection butcould serve as a surrogate for protective responses.Cellular assays have not generally been validated to thesame rigorous extent as antibody assays presumablybecause these assays tend to have more biological vari-ability making them harder to standardize.
Cytokine secretion profiles likely differ betweenCD4+ and CD8+ T cell populations, and betweendifferent memory subsets within either CD4+ or CD8+
T cell populations (Wherry and Ahmed, 2004). More-over, little is known about whether cytokine secretionprofiles are static over time and how these may beinfluenced by persistence of antigen. In the context ofreplication-competent vector constructs that may bedesirable for inducing long-lived memory T cells, this isimportant and may also alter functionality of the inducedresponses due to antigen persistence. This may be less ofan issue with the majority of candidate vaccines incurrent clinical trials, which are replication incompetent.It is likely that the functional profiles and frequencies ofantigen-specific T cells induced by these vaccines willbe different due to lack of persistent antigen.
Our studies suggest that the limit of quantitation ofcytokine-producing T cells is extremely low (a medianof less than 0.01% for the analyses performed here).However, these low cytokine responses may not bebiologically relevant, and therefore, it is important todistinguish between the LOQ of the assay and the lowerlimit considered to be biologically relevant for the im-mune function of interest. For the measurement ofvaccine-induced T cell responses, the lower limit can beempirically determined by comparing cytokine re-sponses before and after vaccination and by comparingvaccine-induced responses with responses detected incontrol groups (i.e., placebo recipients). This will allowdetermination of the range of cytokine responses for
which a true cytokine response in the absence of vac-cination should not be present. Since validation of anassay is an ongoing process, parameters need to con-tinue to be evaluated as the assay is used over time andfor different applications.
Many investigators do not have access to sophisti-cated flow cytometers capable of 8 and more-coloranalysis. We have shown that, provided appropriatehigh cytokine gates are used in 4-color analysis to ex-clude low-level staining from dead cells, the conven-tional 4-color ICS assay can give equivalent data to this8-color assay. However, most 4-color assays are limitedto using a combination of IFN-γ and IL-2 on the samefluorophore (usually PE); and, therefore, determiningwhether T cells are secreting either cytokine alone or incombination is impossible unless separate 4-color panelsare used for examining CD4+ and CD8+ Tcell responses.This differentiation is important since recent reportssuggest that different functional profiles of CD4+ T cellsare associated with either resolution or persistence ofantigen (Harari et al., 2005).
One of the variables we evaluated is the use of co-stimulation with antibodies to CD28 and CD49d duringthe in vitro stimulation. Our results are inconclusivein terms of the benefit of including co-stimulation.With co-stimulation, the number of responding cells inthe negative control (i.e., the background) was increased,especially for IL-2-producing CD4+ T cells. The numberof antigen-specific responding cells in general increasedto the same extent so that after background subtraction theresponses were equivalent with or without co-stimulation.However, there were a few samples where the antigen-specific responses were increased to a greater extent thanthe background, and for this reason we have included co-stimulation in our validated panel. In addition, previouspublished data demonstrated enhanced responses with co-stimulation (Waldrop et al., 1997). In this prior publica-tion, whole CMV antigen was used for stimulation asopposed to peptides, and our contrasting results mayindicate that co-stimulation is not required when sti-mulating with peptides. Another potential concern relatedto our finding of increased background due to co-stimulation, is the possibility that co-stimulation maydecrease the sensitivity of the assay. In order to determinethis, more testing with a larger number of samples withlow-level responses is required.
In conclusion, we have optimized, and qualitativelyand quantitatively validated an 8-color ICS assay. Thisassay has a very low false-positive rate, a very low limit ofdetection, and high sensitivity, reproducibility and linea-rity, making it suitable for qualitative and quantitativeanalysis of cellular immune responses in clinical trials of
53H. Horton et al. / Journal of Immunological Methods 323 (2007) 39–54
candidate HIV-1 vaccines. The quantitative and qualita-tive data produced from this assay should enable more in-depth characterization of vaccine-induced T cellresponses, and aid in determining if cellular immunitycontributes to vaccine efficacy.
Acknowledgements
We would like to acknowledge John Hural, PatriciaD'Souza, Isaac Rodriguez and Jean Novak for theirhelpful discussions concerning ICS validation. We thankPhyllis Stegall for the help with editing. We acknowl-edge support from the University of Washington Centerfor AIDS Research (CFAR), and NIH funded program(P30 AI 27757). We also thank the clinicians at theSeattle HIV Vaccine Trials Unit. Special appreciationgoes to the study volunteers for donating their time andblood as part of the global effort to develop an HIVvaccine.
References
Bach, M.K., Brashler, J.R., 1970. Isolation of subpopulations of lym-phocytic cells by the use of isotonically balanced solutions ofFicoll. I. Development of methods and demonstration of the exis-tence of a large but finite number of subpopulations. Exp. Cell.Res. 61, 387.
Betts, M.R., Nason, M.C., West, S.M., De Rosa, S.C., Migueles, S.A.,Abraham, J., Lederman, M.M., Benito, J.M., Goepfert, P.A.,Connors, M., Roederer, M., Koup, R.A., 2006. HIV nonprogres-sors preferentially maintain highly functional HIV-specific CD8+
T cells. Blood 107, 4781.Boyum, A., 1976. Isolation of lymphocytes, granulocytes and
macrophages. Scand. J. Immunol., Suppl. 5, 9.Bull, M., Lee, D., Stucky, J., Chiu, Y.L., Rubin, A., Horton, H.,
McElrath, M.J., in press. Defining blood processing parameters foroptimal detection of cryopreserved antigen-specific responses forHIV vaccine trials. J. Immunol. Methods.
Burton, D.R., Desrosiers, R.C., Doms, R.W., Koff, W.C., Kwong, P.D.,Moore, J.P., Nabel, G.J., Sodroski, J., Wilson, I.A., Wyatt, R.T.,2004. HIV vaccine design and the neutralizing antibody problem.Nat. Immunol. 5, 233.
Cohen, J., 2003. Public health. AIDS vaccine trial produces dis-appointment and confusion. Science 299, 1290.
De Rosa, S.C., Lu, F.X., Yu, J., Perfetto, S.P., Falloon, J., Moser, S.,Evans, T.G., Koup, R., Miller, C.J., Roederer, M., 2004.Vaccination in humans generates broad T cell cytokine responses.J. Immunol. 173, 5372.
Dunn, H.S., Haney, D.J., Ghanekar, S.A., Stepick-Biek, P., Lewis,D.B., Maecker, H.T., 2002. Dynamics of CD4 and CD8 T cellresponses to cytomegalovirus in healthy human donors. J. Infect.Dis. 186, 15.
Goepfert, P.A., Horton, H., McElrath, M.J., Gurunathan, S., Ferrari,G., Tomaras, G.D., Montefiori, D.C., Allen, M., Chiu, Y.L.,Spearman, P., Fuchs, J.D., Koblin, B.A., Blattner, W.A., Frey, S.,Keefer, M.C., Baden, L.R., Corey, L., 2005. High-dose recombi-nant Canarypox vaccine expressing HIV-1 protein, in seronegativehuman subjects. J. Infect. Dis. 192, 1249.
Harari, A., Vallelian, F., Meylan, P.R., Pantaleo, G., 2005. Functionalheterogeneity of memory CD4 T cell responses in different con-ditions of antigen exposure and persistence. J. Immunol. 174, 1037.
http://www.fda.gov/cder/guidance/index.htm, 1996. International Confer-ence on Harmonisation Q2A Text on Validation of Analytical Proce-dures and Q2B Validation of Analytical Procedures: Methodology.
http://www.fda.gov/CDER/GUIDANCE/4252fnl.htm, 2001. Guid-ance for Industry: Bioanalytical Method Validation.
Letvin, N.L., Mascola, J.R., Sun, Y., Gorgone, D.A., Buzby, A.P., Xu, L.,Yang, Z.Y., Chakrabarti, B., Rao, S.S., Schmitz, J.E.,Montefiori,D.C.,Barker, B.R., Bookstein, F.L., Nabel, G.J., 2006. Preserved CD4+
central memory T cells and survival in vaccinated SIV-challengedmonkeys. Science 312, 1530.
Li, F., Malhotra, U., Gilbert, P.B., Hawkins, N.R., Duerr, A.C.,McElrath, M.J., Corey, L., Self, S.G., 2006. Peptide selection forhuman immunodeficiency virus type 1 CTL-based vaccineevaluation. Vaccine 24, 6893.
Maecker, H.T., Dunn, H.S., Suni, M.A., Khatamzas, E., Pitcher, C.J.,Bunde, T., Persaud, N., Trigona, W., Fu, T.M., Sinclair, E., Bredt,B.M., McCune, J.M., Maino, V.C., Kern, F., Picker, L.J., 2001.Use of overlapping peptide mixtures as antigens for cytokine flowcytometry. J. Immunol. Methods 255, 27.
Maecker, H.T., Moon, J., Bhatia, S., Ghanekar, S.A., Maino, V.C.,Payne, J.K., Kuus-Reichel, K., Chang, J.C., Summers, A., Clay,T.M., Morse, M.A., Lyerly, H.K., DeLaRosa, C., Ankerst, D.P.,Disis, M.L., 2005a. Impact of cryopreservation on tetramer,cytokine flow cytometry, and ELISPOT. BMC Immunol. 6, 17.
Maecker, H.T., Rinfret, A., D'Souza, P., Darden, J., Roig, E., Landry,C., Hayes, P., Birungi, J., Anzala, O., Garcia, M., Harari, A., Frank,I., Baydo, R., Baker, M., Holbrook, J., Ottinger, J., Lamoreaux, L.,Epling, C.L., Sinclair, E., Suni, M.A., Punt, K., Calarota, S., El-Bahi, S., Alter, G., Maila, H., Kuta, E., Cox, J., Gray, C., Altfeld,M., Nougarede, N., Boyer, J., Tussey, L., Tobery, T., Bredt, B.,Roederer, M., Koup, R., Maino, V.C., Weinhold, K., Pantaleo, G.,Gilmour, J., Horton, H., Sekaly, R.P., 2005b. Standardization ofcytokine flow cytometry assays. BMC Immunol. 6, 13.
Mattapallil, J.J., Douek, D.C., Buckler-White, A., Montefiori, D.,Letvin, N.L., Nabel, G.J., Roederer, M., 2006. Vaccinationpreserves CD4 memory T cells during acute simian immunode-ficiency virus challenge. J. Exp. Med. 203, 1533.
Nomura, L.E., Walker, J.M., Maecker, H.T., 2000. Optimization ofwhole blood antigen-specific cytokine assays for CD4(+) T cells.Cytometry 40, 60.
O'Neil-Andersen, N.J., Lawrence, D.A., 2002. Differential modula-tion of surface and intracellular protein expression by T cells afterstimulation in the presence of monensin or Brefeldin A. Clin.Diagn. Lab. Immunol. 9, 243.
Russell, N.D., Hudgens, M.G., Ha, R., Havenar-Daughton, C.,McElrath, M.J., 2003. Moving to human immunodeficiency virustype 1 vaccine efficacy trials: defining T cell responses as potentialcorrelates of immunity. J. Infect. Dis. 187, 226.
Sun, J.C., Bevan, M.J., 2003. Defective CD8 T cell memory followingacute infection without CD4 T cell help. Science 300, 339.
Sun, J.C., Williams, M.A., Bevan, M.J., 2004. CD4+ T cells are requiredfor the maintenance, not programming, of memory CD8+ T cellsafter acute infection. Nat. Immunol. 5, 927.
Suni, M.A., Dunn, H.S., Orr, P.L., de Laat, R., Sinclair, E., Ghanekar,S.A., Bredt, B.M., Dunne, J.F., Maino, V.C., Maecker, H.T., 2003.Performance of plate-based cytokine flow cytometry with auto-mated data analysis. BMC Immunol. 4, 9.
Waldrop, S.L., Pitcher, C.J., Peterson, D.M., Maino, V.C., Picker, L.J.,1997. Determination of antigen-specific memory/effector CD4+ T

54 H. Horton et al. / Journal of Immunological Methods 323 (2007) 39–54
cell frequencies by flow cytometry: evidence for a novel, antigen-specific homeostatic mechanism in HIV-associated immunodefi-ciency. J. Clin. Invest. 99, 1739.
Westfall, P., Wolfinger, R., 1997. Multiple tests with discrete distri-butions. Am. Stat. 51, 3.
Westfall, P., Tobias, R., Ram, D., Wolfinger, R., Hochbert, Y., 1999.Multiple Comparisons and Multiple Tests Using the SAS System.SAS Institute, Cary, NC.
Wherry, E.J., Ahmed, R., 2004. Memory CD8 T-cell differentiationduring viral infection. J. Virol. 78, 5535.


![Cytotoxic Function and Cytokine Production of Natural Killer Cells … · 2019. 7. 30. · Diego, CA, USA) as previously described [4]. Intracellular perforin and granzyme B expressions](https://img.pdfslide.net/doc/110x75/60e52d36673ae7205900ddd1/cytotoxic-function-and-cytokine-production-of-natural-killer-cells-2019-7-30.jpg)