Embed Size (px)
Citation preview

FISCAL POLICY INSTITUTE
PROJECT REPORT
Optimization Model for Food
Grain Distribution and
Movement Planning in
Karnataka
Submitted as part of Summer Internship
By
Varun Chhabra
Indian Institute of Management, Lucknow-226013
June 2011

i
Letter of Transmittal
6th
June 1, 2011
Shri P. R. Devi Prasad,
Director,
Fiscal Policy Institute,
Finance Department,
Government of Karnataka,
Bangalore.
Dear Sir,
I am pleased to submit the project report titled ‘Optimization Model for Food Grain
Distribution and Movement Planning in Karnataka’. I hereby declare that this is an original
work done by me and the findings of this work have not been previously submitted for any
publication.
Please feel free to revert to me with any questions and/or comments regarding this report.
Sincerely
(Varun Chhabra)
Summer Intern,
Indian Institute of Management,
Lucknow
Enclosure: Project Report

ii
Certificate
This is to certify that the project report titled ‘Optimization Model for Food Grain
Distribution and Movement Planning in Karnataka’ submitted by Shri Varun Chhabra as
part of Summer Internship is the result of the work done by him at Fiscal Policy Institute,
Bangalore, Finance Department, Government of Karnataka, from April to June 2010 under
our guidance.
Place: Bangalore
Date: 01/05/2011
Shri P.R. Devi Prasad IES
Director,
Fiscal Policy Institute,
Finance Department,
Government of Karnataka
Place: Bangalore
Date: 01/05/2011
Shri Shivakumar Y.C.
Deputy Director (Admn.)
Fiscal Policy Institute,
Finance Department,
Government of Karnataka
iii
Acknowledgements
I am deeply indebted to Shri P.R. Devi Prasad, Director, Fiscal Policy Institute, Bangalore,
under whose guidance the present study was conducted. He has been giving valuable
suggestions, generous help and corrections during all the phases of the project, without which
the efforts could not have been completed successfully.
I would like to extend my indebtedness and gratitude to my guide Shri Shivakumar Y.C.
Deputy Director (Administration), FPI for the invaluable guidance and feedback provided by
him at every stage of the project.
I am indebted to Shri Srinivas Kumar Advisor, FPI, Smt. Anita V Nazare, Smt. Margaret
Abraham, Smt. Nelleri Umeshwari, all Special Officers at FPI, Shri Balasubramanyam H.S
Special Officer, FPA and Shri Anilkumar M. Special Officer, FDA for their guidance and
support from time to time.
I would like to extend my gratefulness to Shri Mandar Nayak Consultant, ERC and Kum.
Munawwara Shakila Consultant, FPI for their guidance and invaluable inputs during all the
phases of the project.
I am indebted to Shri B.A. Harish Gowda Secretary, FCS&CA , Shri S Narasimaiah
Additional Secretary, FCS & CA for their guidance and invaluable help in getting
information from FCS & CA Department.
I am indebted to the following officials for their guidance and invaluable help in getting
responses.
1. Shri M.C. Gangadhara, Additional Director & Deputy Director (PDS), FCS & CA
2. Smt T.R Shobha, ex-Chief Accounts Officer & HQA, FCS & CA
3. Shri Shivana Gowda, Chief Accounts Officer, FCS & CA
4. Shri Azizuddin Hafiz, Deputy Director (FCS & CA) & CIO (Akshaya Kosha), FCS &
CA
5. Shri M. Muralidhar, Financial Adviser to Transport Commissioner
6. Koshy Eipe, General Manager, Finance IOCL
7. Mr. A.P. Verma Senior Manager, BPCL, Retail sales
8. Elumalai Kannan, ADRTC, ISEC, Bangalore
I am deeply thankful to my fellow interns Shri Abhilash Kumar and Shri Santosh Kamble for
their enormous support, guidance and help at every juncture through exchange of ideas and
views on the study.

iv
I am thankful to Officers and Staff at FPI and FPAC who have shown tremendous
cooperation and support throughout the course of study. I am thankful to Kiran, Nagaraj,
Namitha and Sangeeta for helping me with the translation of crucial documents.
I am also thankful to Officers, Case Workers and Staff in the Transport Division of FCS &
CA especially Arun, Naveen, Ervin D’Souza, Radha and Sudha for valuable inputs and
support at every stage of the project.
I would also like to thank Shri B K Bhattacharya ex-IAS, Chairman, Expenditure Reforms
Commission, Government of Karnataka for his support and encouragement.
I would also like to thank Government of Karnataka for giving me an opportunity to work on
this project at FPI.
I would also like to thank all the respondents for giving their time and invaluable responses
for this study.
The author alone is responsible for any errors and omissions.
Varun Chhabra,
Summer Intern,
Indian Institute of Management,
Lucknow

v
Table of Contents
Letter of Transmittal ................................................................................................................................ i
Certificate ................................................................................................................................................ ii
Acknowledgements ................................................................................................................................ iii
Table of Contents .................................................................................................................................... v
List of Figures ....................................................................................................................................... vii
List of Tables ....................................................................................................................................... viii
Abbreviations ......................................................................................................................................... ix
Abstract ................................................................................................................................................... x
1. Introduction ..................................................................................................................................... 1
1.1 Problem Statement ........................................................................................................................ 1
1.2 Objectives of the Study ................................................................................................................. 1
1.3 Significance of the Study .............................................................................................................. 2
1.4 Research Design ............................................................................................................................ 2
1.4.1 Exploratory Research ............................................................................................................. 2
1.5 Tools of the Study ......................................................................................................................... 2
1.6 Research Elements ........................................................................................................................ 3
1.7 Limitations of the Study ................................................................................................................ 4
2. PDS in Karnataka ............................................................................................................................ 5
2.1 Food, Civil Supplies and Consumer Affairs Department ............................................................. 5
2.2 Administrative Set Up ................................................................................................................... 5
2.3 Targeted Public Distribution System ............................................................................................ 6
2.4 Details of shops and cards ............................................................................................................. 8
2.5 Costing Sheet for Prices and Margin .......................................................................................... 10
2.6 Panchtantra .................................................................................................................................. 11
3. Analysis of Distribution System ................................................................................................... 12
3.1 Procurement Concerns ................................................................................................................ 12
3.2 Transportation & Distribution of PDS commodities .................................................................. 13
3.2.1 Tender Process (Transport Note, 2009) ............................................................................... 13
3.2.2 Tender Systems .................................................................................................................... 15
3.3 Direct Sourcing ........................................................................................................................... 17
3.3.1 Costing Sheet for Transportation charges ............................................................................ 17
3.3.2 Application of the Costing Sheet ......................................................................................... 20

vi
3.3.3 Handling Charges ................................................................................................................. 22
4. Conclusions ................................................................................................................................... 25
5. Recommendations ......................................................................................................................... 27
6. Scope for Further Research ........................................................................................................... 29
7. Bibliography ................................................................................................................................. 30
8. Annexure ....................................................................................................................................... 31
8.1 Annexure 1: List of Questions asked during interviews ............................................................. 31
8.2 Annexure 2: Copy of an APL Ration Card ................................................................................. 34
8.3 Annexure 3: Transport Rate Prevalent in Different Districts of Karnataka in 2004-05 .............. 35
8.4 Annexure 4: Tender Advertisement in English ........................................................................... 37
8.5 Annexure 5: Government Order (dated 11.04.2011) for fixing of Transport and Handling
Charges ............................................................................................................................................. 38
8.6 Annexure 6: Accounting to calculate Benchmark Rates ............................................................. 39
8.6.1 Indian Oil Tender Schedule iii for Changes in Different rates ............................................ 41
8.7 Annexure 7: Copy of Goods Carriage Permit showing Actual Load Capacity .......................... 42
8.8 Annexure 8: Motor Vehicle Taxation Schedules ........................................................................ 43
8.9 Annexure 9: Tender Notification (FCI to Wholesale) Dated 18-08-09 ...................................... 44
8.10 Annexure 10: Tender Notification (Wholesale to FPD Transportation) – Points of Difference
.......................................................................................................................................................... 53
8.10.1 Technical Conditions: ........................................................................................................ 53
8.10.2 Commercial Conditions: .................................................................................................... 53
8.11 Annexure 11: Wholesale Average Distance, Benchmark Rate over the years and Agreed Rate
for 2008-09........................................................................................................................................ 54
8.12 Annexure 12: Rural Transportation Average Distance, Bench Mark Rates and Agreed Rate for
the year 2008-09 ............................................................................................................................... 55

vii
List of Figures Figure 1: District wise plot of Average number of cards per FPD and average number of FPD per
wholesale nominee .................................................................................................................................. 9
Figure 2: Year wise trend of Food Subsidy in Karnataka ..................................................................... 10
Figure 3: Flow of PDS commodities to beneficiaries ........................................................................... 12
Figure 4: Different between Bench Mark rates and Agreed Rates ....................................................... 14
Figure 5: Fair Price Shops operating with less than the prescribed number of ration cards ................. 21
Figure 6: Route Map prior to Direct Sourcing (Circular, Left Image) and post Direct Sourcing (Hub
and Spoke, Right Image) ....................................................................................................................... 23
Figure 7: Percentage increase of agreed rate over bench mark rates for 2008-09 ................................ 25

viii
List of Tables Table 1: Roles and Responsibilities of various officials ......................................................................... 6
Table 2: Category wise monthly allocation and price details ................................................................. 7
Table 3: District wise standing of FPD, Wholesale Depots, Total Cards, Average No. of Cards per
FPD and Average number of FPDs per wholesale nominees ................................................................. 9
Table 4: Costing Sheet (for 1 quintal of grains) for different category of cards ................................... 10
Table 5: Bench Mark Rates prevalent in slab rate system .................................................................... 16
Table 6: Costing Sheet for Transportation charges ............................................................................... 17
Table 7: Computation of Total Demand of Wheat, Rice and Sugar .................................................... 20
Table 8: Computation of total margin on Rice, Wheat and Sugar by Retailer ..................................... 21
Table 9: Long term rates as quoted by transporters .............................................................................. 22
Table 10: Impact Assessment of Direct sourcing Vs Slab Rate System ............................................... 26

ix
Abbreviations
APL Above Poverty Line
AAY Antyodaya Anna Yojana
BPL Below Poverty Line
CAS – 5 Cost Accounting Standard – 5
CCI Central warehouse Corporation of India
CIP Common Issue Price
DCP Decentralized Procurement Programme
EAC Economic Advisory Committee
EBPL Extra Below Poverty Line
FCI Food Corporation of India
FPAC Fiscal Policy Analysis Cell
FPD Fair Price Depot
FPI Fiscal Policy Institute
FPS Fair Price Shop
FI Food Inspector
FSC Food Security Committee
FC&CA Food, Civil Supplies and Consumer Affairs
GOI Government of India
GP Gram Panchayat
ICWAI Institute of Cost and Work Accountants
IRA Informal Rationing Area
JIT Just In Time
KFCSC Karnataka Food and Civil Supplies Corporation
MSP Minimum Support Price
NAC National Advisory Council
PAC Public Accounts Committee
PDS Public Distribution System
RDS Ration Distribution System
TAPCMS Taluk Agriculture Produce and Co-operative Marketing Society
TP Taluk Panchayat
TPDS Targeted Public Distribution System
ZP Zilla Panchayat
x
Abstract
The report begins with description of the concerns faced by the Food, Civil Supplies and
Consumer Affairs Department in relation to the Public Distribution System. The objectives
have been to do an exploration research which can help us gain useful insights into the
Department in general and transportation system for distribution in particular. These insights
can be set as the basis for designing an Optimized Model for Food Grain Distribution and
Movement Planning in Karnataka. The scope of this study has been limited to the micro-level
cost analysis of present and earlier systems; their understanding can help us set realistic and
just bench mark rates. The rates along with distance and time constraints are the useful
parameters for designing a Transport Model.
In the Chapter 2 of the report, we have done a macro level analysis of the Public Distribution
System in Karnataka. Here we have tried to understand the roles and responsibilities of
various officials in the Department in relation to procurement and distribution. Thereafter, we
have done an analysis on the distribution of Fair Price Shops, Wholesale Depots and card
holders in the system. This analysis is the followed by pricing analysis of essential
commodities in the system and a discussion on the implications of the recent contemplated
changes at the Central Level.
The next chapter highlights the micro-level analysis of the transportation system prevalent in
the distribution of the commodities. We have tried to have a look at some of the concerns
relating to procurement and distribution of food-grains. This is followed by an analysis on the
tender process and related systems. Thereafter, we have done the cost-analysis on the
transportation and the handling charges of Direct Sourcing. Then we had a look at the
strategic implications of the current system in terms of ensuring a lean transportation system.
We also conducted an analysis on the current system in terms of time efficiency and derived
value.
In the chapter of conclusions, we stated the findings of the study and did an impact analysis
of the current system for six months tenure. Then, we have stated some of the
recommendations that can help us mitigate the irrelevant cost expenditure in the system along
with the formation of a robust distribution system in the future.
Further research areas have also been highlighted in light of the recent study.

1
1. Introduction
Public Distribution System (PDS) programme in India has been introduced for achieving
multiple objectives. Its primary objective is to provide subsidized food grains and other items
of daily necessity such as oil, sugar and Kerosene etc. to weaker sections of the population
The programme also aims to stabilize market prices of food grains in times of unusual
inflationary tendencies, to provide food security to areas suffering from drought and similar
natural calamities and manmade disasters, to provide support prices to farmers and to
maintain buffer stock. The PDS programme is implemented in welfare state mode with
universal beneficiary approach and hence it has been under criticism for being non-specific
and wasteful. It has also been found to be an inadequate programme to fully address the food
security problem of the poor and vulnerable. PDS is a centrally planned programme and each
state in India implements the design set by the Central Government.
In Karnataka, the PDS is implemented by the Department of Food, Civil Supplies and
Consumer Affairs. The recent performance audit revealed that Karnataka was the first State
in the country to launch computerization of ration cards for creating a data base of
beneficiaries of PDS by capturing digital photographs and bio-metrics of the family
members. However, the system is fraught with its problems, concerns and inefficiencies.
1.1 Problem Statement
The current study has its focus on the distribution of the food grains and optimization of
various parameters which can help us derive value from the system. The distribution chain
here consists of lifting, transportation and delivery of various essential commodities1 under
the PDS. Some of the key factors that need to be considered are given below:
How are card holders, Fair Price Depots and wholesale nominees distributed across
the state?
What could be possible reasons for existing of different bench mark rates across
different districts of the state?
Whether or not the present system is Time and Cost Efficient?
What is the value generation by the present system?
Whether or not the present system strategically important?
Whether or not the measures taken to reach the targeted public segment are effective?
1.2 Objectives of the Study
The purpose of the study is given below:
1 ‘Essential Commodities’ means essential commodities as defined under the Essential Commodities
Act 1955, and meant for Public Distribution System by the State or Central Government or any other
authority authorized in that behalf by such Government .

2
To do analysis of the distribution of Fair Price Depots and Wholesale Depots across
different districts of the State
To do analysis of the distribution of cardholders across different Fair Price Depots
A look into the Tender Process, its system for fixing bench mark & agreed rates and
problems faced therein
Cost analysis of various systems in order to understand the fixation and changing of
bench mark rates
Understanding changes in various models of Transportation (like Circular Route Map
and Hub and Spoke Route map) and its cost implications on the system
Macro-level Analysis of the Retailer’s Margin and impact assessment of introducing
new system
1.3 Significance of the Study
This study gives a macro-level understanding of the PDS in Karnataka. It also gives micro-
level analysis of transportation and loading/unloading system present in the distribution
chain. The analysis of cost criteria for establishing bench mark rates in various tender
systems and costing sheet of direct sourcing can prove to be very effective in developing an
Optimized Transport Model for food grain distribution and movement planning.
1.4 Research Design
The following research techniques were used in this study.
1.4.1 Exploratory Research
Exploratory research has the goal of formulating problems more precisely, clarifying
concepts, gathering explanations, gaining insight, eliminating impractical ideas, and forming
hypotheses. It provides insights into and comprehension of an issue or situation2.The initial
phase of the project demanded an exploratory research to capture the knowledge and
understanding of the PDS in Karnataka. Thereafter, we moved into a combination of both the
formal in-depth interviews with higher officials and informal discussions with concerned case
workers. Interactions with focused groups and analysis of primary data collected through
field work helped in gaining of crucial insights.
1.5 Tools of the Study
Interviews were conducted to collect data from top officials. The interviews were mainly
unstructured3 where questions had been changed or adapted to meet the respondent's intelligence,
understanding or belief. These set of questions are hence open-ended unlike a structured interview
where a pre-set range of answers for a respondent to choose, but instead we advocated listening to
how each individual person is responding to the question.
2http://en.wikipedia.org/wiki/Exploratory_research Date of Retrieval: 01/05/2011
3 http://en.wikipedia.org/wiki/Unstructured_interview Date of Retrieval: 01/05/2011

3
1.6 Research Elements
Interviews
Interviews were designed after studying secondary information and in consultation with
experts. The following information was gathered:
Reasons for increase in the transportation and loading/unloading rates (Hamali
charges)
Concerns related to the tender process
Reasons for the increasing subsidy in the system
Reasons for the delay in implementation of the crucial changes in the system
Reasons for introducing direct sourcing
Process for removing ineligible cards
Reasons for differences between bench mark and actual quotes
Concerns of the transporters
Possible effects of empowering FPS owner
Conference
The author also attended the 39th
Annual Conference of Expenditure Reform Commission
where in important insights relating to types and kind of subsidy are obtained.
Discussions with officials of Oil-marketing companies
Further the author also had discussions with officials of oil marketing companies for
understanding of various pricing mechanisms pertaining to diesel pricing and subsidy.
Random discussions
Random discussions with case-workers and various managers in the transport department of
FSC&CA, financial advisory services of officials of RTO and test-check with a few local
transporters & mandi operators have also brought about crucial insights which were helpful
in drawing conclusions.
Analysis of Tender Files
Another form of Primary data collection has been the disclosures obtained from (Tender File,
2004-05), (Tender File, 2005-06), (Tender File, 2007-08), (Tender File, 2008-09).
Secondary Resources
The secondary resources of information includes Annual Report of FC&CA for the year
2007-08, 2008-09, 2009-10; (Citizen's Charter); (Cost Accounting Standard - 5); (Transport
Note, 2009); (Performance Audit, 2009); (Government Order, April, 2011) other than these
citations we have also refered to web portal of FC&CA Karnataka, Ministry of Petroleum4,
4 http://petroleum.nic.in/ last visited on 30-04-2011

4
CAG office5, and parliamentary discussions
6. Newspapers discussions pertaining to draft of
Food Security Bill, 2011 have also been another form of secondary resources.
1.7 Limitations of the Study
The study has the following limitations:
The non-availability of any manual explaining the different tender systems has been a
cause of concern because a lot of data has been obtained without any explanation
The author also had language constraints because almost all the information available
in tender files is in Kannada. There is no secondary language documentation in the
files
Crucial files of important orders were obtained at a later stage due to which author has
to restrict the scope of this project to cost analysis only
The author also observed serious problems of knowledge transfer in the system due to
which most of the information was coming in bits and pieces thus scope of the project
has to be restricted
5 http://www.cag.gov.in/ last visited on 06-05-2011
6 http://www.cag.gov.in/ last visited on 24-04-2011

5
2. PDS in Karnataka
The Ration Distribution System under the public distribution system has been implemented in
Karnataka state with specific aim. The department strives to distribute the ration to the
sections and the families below poverty line identified by various sources under this scheme
and to provide food security to all other families.
2.1 Food, Civil Supplies and Consumer Affairs Department
Department of Food, Civil Supplies and Consumer Affairs has the responsibility of
implementing the Essential Commodities Act, 1955 (Central Act) and the following Act and
Rules coming under it, issued by Central and State Governments.
1. Karnataka Essential Commodities (Public Distribution System) Control Order, 1992
The Karnataka Prevention Of Unauthorized Possession of Ration Cards Order, 1977
2. The Karnataka Essential Commodities Licensing Order, 1986
3. The Karnataka Essential Commodities (Maintenance of Accounts, Display of Prices
and Stocks) Order, 1981
4. The Karnataka Rice Milling Regulation and Rice and Paddy Procurement (Levy)
Order, 1999
5. The Edible Oil Packaging (Regulation ) Order, 1998
6. The Sugar Control Order, 1966
7. The Kerosene (Restriction on use and Fixation of Ceiling Price ) Order, 1993
8. The Liquefied Petroleum Gas (Regulation of Supply and Distribution ) Order, 2000
9. The Lubricating Oils and Greases ( Processing, Supply and Distribution Regulation )
Order, 1987
10. The Motor Spirit and High Speed Diesel (Regulation of Supply and Distribution and
Prevention of Malpractices) Order, 2005
11. The Naphtha (Acquisition, Sale, Storage and Prevention of Use in Automobiles )
Order, 2000
12. The Solvent, Raffinate and Slop ( Acquisition, Sale, Storage and Prevention of Use in
Automobiles ) Order, 2000
13. The Petroleum Products ( Maintenance of Production, Storage and Supply) Order,
1999
2.2 Administrative Set Up
The Principal Secretary, Department of Food, Civil Supplies and Consumer Affairs
(FC&CA) assisted by the Commissioner (FC&CA) was responsible for implementation of
the scheme at the State level. The Commissioner was assisted by the Deputy Commissioners,
Deputy Directors (FC&CA) and Chief Executive Officers of Zilla Panchayats at the district
level and by the Tahsildars and Executive Officers of Taluk Panchayat at taluk level. The
relevant roles and responsibilities of different officials of the state have been described in the
table below:
Roles Responsibilities

6
Commissioner Distribute the ration items released by the central
government based on district wise demand
Responsible for changes in bench mark rates of
transport tenders
Deputy
Commiss
ioner
Chief Executive
Officer of Zilla
Panchayat
Taluk-wise Allotment
Fixes bench mark rates and agreed rates for
transport tenders
Deputy
Director
(Districts
)
Range
Officers
(I.R.A.)7
Assistant
Director
(I.R.A.)
Sub-allotment of commodities as per allotment
made by Joint Director (PDS)/ Deputy
Commissioner
Monitoring the lifting performance of wholesale
nominees/ fair price depots and taking necessary
action in cases of poor lifting
Cursory Inspections of FPD, Wholesale depots
Report the detailed inspections
Assistant Directors Collection of various data from subordinate Offices
including lifting and distribution and balance of
food grains and compiling the same and submit the
same to the Deputy Commissioner/Head Office
Food
Shirestedars
Food
Inspectors Ensuring the proper distribution of food grains,
sugar and Kerosene oil & all such rationed articles
to the cardholders through Fair Price Depots
Prevention of diversion of Essential commodities
issued through the public Distribution system at all
levels
Cursory, Detailed and Intensive inspections as per
the schedule specified
Accounts Superintendent Scrutiny of transport and other tenders
Table 1: Roles and Responsibilities of various officials8
2.3 Targeted Public Distribution System
The Targeted Public Distribution System has been implemented in the State from 01-06-1997
on the direction of the Government of India. The main objective of this system is to ensure
food security by ensuring minimum supply of food grains to the population below poverty
line. For this purpose, households belonging to vulnerable sections of the society and living
below poverty line in the rural areas and in urban areas have been identified. These families
are being supplied food grains at subsidized prices.
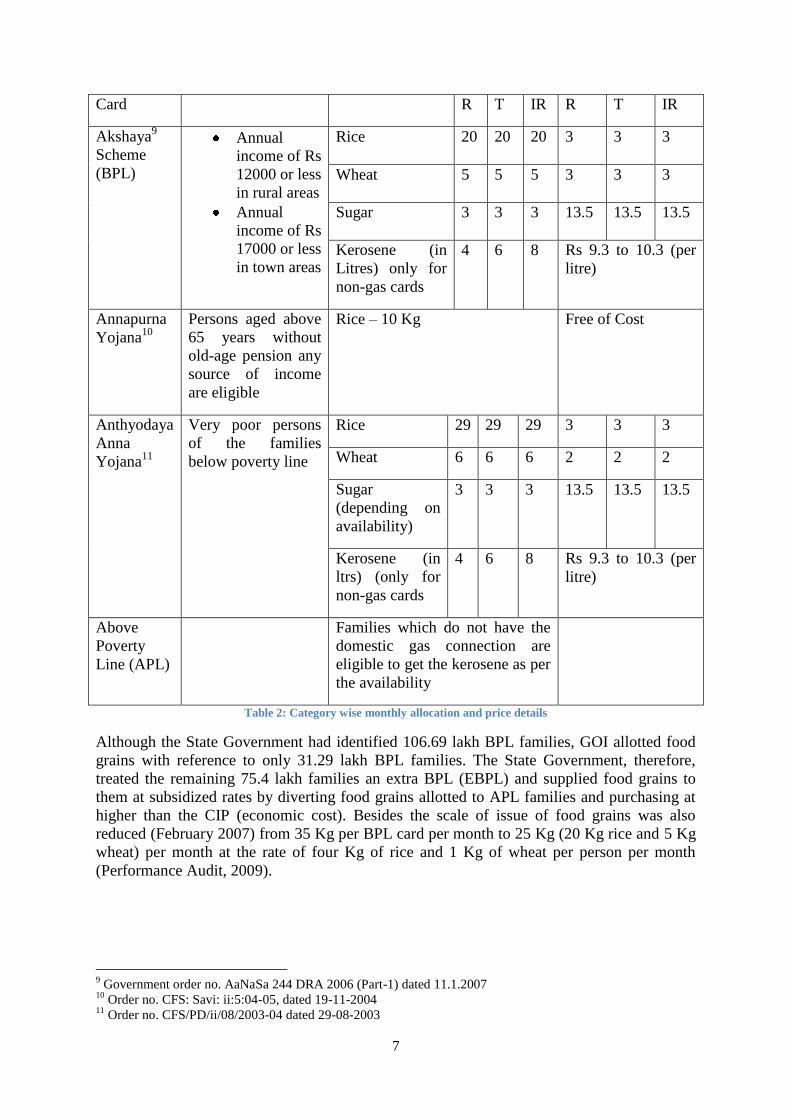
Different types of Ration Card holders, their eligibility criteria and monthly allocation details
are given below (Citizen's Charter): Remark – (R – Rural, T – Town, IR – Informal Rationing
Area)
Type of Eligibility Criteria Maximum Quantity (in Kgs) Price (in Rs)
7 50 cities with a population of 40000 and above have been notified as Informal Rationing Areas
8 http://ahara.kar.nic.in/jobchart.html Date of retrieval: 12 April, 2011
7
Card R T IR R T IR
Akshaya9
Scheme
(BPL)
Annual
income of Rs
12000 or less
in rural areas
Annual
income of Rs
17000 or less
in town areas
Rice 20 20 20 3 3 3
Wheat 5 5 5 3 3 3
Sugar 3 3 3 13.5 13.5 13.5
Kerosene (in
Litres) only for
non-gas cards
4 6 8 Rs 9.3 to 10.3 (per
litre)
Annapurna
Yojana10
Persons aged above
65 years without
old-age pension any
source of income
are eligible
Rice – 10 Kg Free of Cost
Anthyodaya
Anna
Yojana11
Very poor persons
of the families
below poverty line
Rice 29 29 29 3 3 3
Wheat 6 6 6 2 2 2
Sugar
(depending on
availability)
3 3 3 13.5 13.5 13.5
Kerosene (in
ltrs) (only for
non-gas cards
4 6 8 Rs 9.3 to 10.3 (per
litre)
Above
Poverty
Line (APL)
Families which do not have the
domestic gas connection are
eligible to get the kerosene as per
the availability
Table 2: Category wise monthly allocation and price details
Although the State Government had identified 106.69 lakh BPL families, GOI allotted food
grains with reference to only 31.29 lakh BPL families. The State Government, therefore,
treated the remaining 75.4 lakh families an extra BPL (EBPL) and supplied food grains to
them at subsidized rates by diverting food grains allotted to APL families and purchasing at
higher than the CIP (economic cost). Besides the scale of issue of food grains was also
reduced (February 2007) from 35 Kg per BPL card per month to 25 Kg (20 Kg rice and 5 Kg
wheat) per month at the rate of four Kg of rice and 1 Kg of wheat per person per month
(Performance Audit, 2009).
9 Government order no. AaNaSa 244 DRA 2006 (Part-1) dated 11.1.2007
10 Order no. CFS: Savi: ii:5:04-05, dated 19-11-2004
11 Order no. CFS/PD/ii/08/2003-04 dated 29-08-2003

8
2.4 Details of shops and cards
Every year new ration cards are issued and database is refined. The following table gives the
latest available figures:
S No. Districts
Total No.
of FPDs
Total No. of
Wholesale
Nominees
Average No. of
FPD
Total Cards
(AAY + Akshaya
+ APL)
Average
No. of
Cards per
FPD
As on
28.02.2011
As on
28.02.2011
As on 01.04.2011 As on
01.04.2011
1 Bangalore IR 1329 19 69.95 1317984 991.71
2 Bangalore (U) 504 7 72.00 527676 1046.98
3 Bangalore (Ru) 353 6 58.83 221770 628.24
4 Bagalkot 654 12 54.50 404339 618.26
5 Belgaum 1713 18 95.17 1143734 667.68
6 Bellary 594 11 54.00 514919 866.87
7 Bidar 743 6 123.83 386258 519.86
8 Bijapur 796 12 66.33 437820 550.03
9 Chamrajnagar 470 8 58.75 283169 602.49
10 Chickballapur 560 6 93.33 297448 531.16
11 Chickmagalore 494 10 49.40 280390 567.59
12 Chitradurga 578 9 64.22 420308 727.18
13 Davanagere 791 12 65.92 463790 586.33
14 D.Kannada 531 8 66.38 384787 724.65
15 Dharwad 515 8 64.38 434711 844.10
16 Gadag 362 7 51.71 246350 680.52
17 Gulbarga 988 9 109.78 537004 543.53
18 Hassan 851 11 77.36 442146 519.56
19 Haveri 436 7 62.29 366496 840.59
20 Kodagu 290 6 48.33 136805 471.74
21 Kolar 639 7 91.29 359553 562.68
22 Koppala 450 4 112.50 278774 619.50
23 Mandya 722 11 65.64 500331 692.98
24 Mysore 1062 17 62.47 735691 692.74
25 Ramnagar 559 7 79.86 306579 548.44
26 Raichur 679 5 135.80 374919 552.16
27 Shimoga 584 11 53.09 411941 705.38
28 Tumkur 1106 14 79.00 650461 588.12
29 Udupi 289 3 96.33 227598 787.54
30 U.Kannada 446 14 31.86 352858 791.16
31 Yadgiri 392 3 130.67 206678 527.24
9
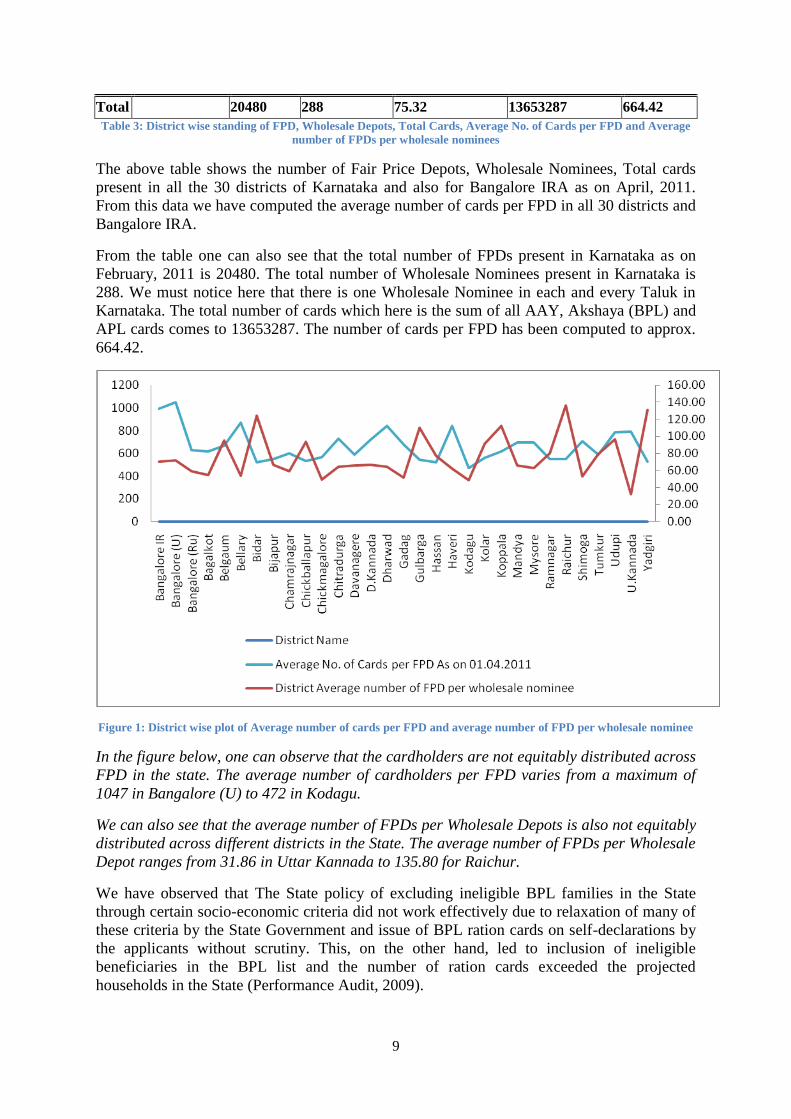
Total
20480 288 75.32 13653287 664.42
Table 3: District wise standing of FPD, Wholesale Depots, Total Cards, Average No. of Cards per FPD and Average
number of FPDs per wholesale nominees
The above table shows the number of Fair Price Depots, Wholesale Nominees, Total cards
present in all the 30 districts of Karnataka and also for Bangalore IRA as on April, 2011.
From this data we have computed the average number of cards per FPD in all 30 districts and
Bangalore IRA.
From the table one can also see that the total number of FPDs present in Karnataka as on
February, 2011 is 20480. The total number of Wholesale Nominees present in Karnataka is
288. We must notice here that there is one Wholesale Nominee in each and every Taluk in
Karnataka. The total number of cards which here is the sum of all AAY, Akshaya (BPL) and
APL cards comes to 13653287. The number of cards per FPD has been computed to approx.
664.42.
Figure 1: District wise plot of Average number of cards per FPD and average number of FPD per wholesale nominee
In the figure below, one can observe that the cardholders are not equitably distributed across
FPD in the state. The average number of cardholders per FPD varies from a maximum of
1047 in Bangalore (U) to 472 in Kodagu.
We can also see that the average number of FPDs per Wholesale Depots is also not equitably
distributed across different districts in the State. The average number of FPDs per Wholesale
Depot ranges from 31.86 in Uttar Kannada to 135.80 for Raichur.
We have observed that The State policy of excluding ineligible BPL families in the State
through certain socio-economic criteria did not work effectively due to relaxation of many of
these criteria by the State Government and issue of BPL ration cards on self-declarations by
the applicants without scrutiny. This, on the other hand, led to inclusion of ineligible
beneficiaries in the BPL list and the number of ration cards exceeded the projected
households in the State (Performance Audit, 2009).

10
The reduced quantities (25 Kg instead of 35 Kg) and inclusion of ineligible BPL families in
the BPL category has led to the denial of deserving share of food grains and hence food
security to genuine BPL families. It has also rendered the PDS system useless for APL
families. This is one of the many reasons for presence of ineligible cards in the system.
2.5 Costing Sheet for Prices and Margin
The table below represents the prices and margin at different levels in the system (rates are
constant since 2008). Thus they are not moving with the inflationary trends.
S No. Particulars BPL
EBPL12
AAY
Rice Wheat Rice Wheat Rice Wheat
1 Central Issue Price 565 415 830 610 300 200
2 State Subsidy 314 158 579 353 48 38
3 Wholesale Margin 20 20 20 20 19 15
4 Wholesale issue price 271 277 271 277 271 177
5 Retail Margin 29 23 29 23 29 23
6 Retail Issue Price 300 300 300 300 300 200
Table 4: Costing Sheet (for 1 quintal of grains) for different category of cards
The Government of India procure the food grains at MSP (Minimum Support Price) from the
farmers and issues it to the State Government at CIP (Common Issue Price). The State
Government issues rice at Rs 300 per quintal or wheat at Rs 300 or Rs 200 per quintal. We
have to realize here that both the MSP is increasing with time and the number of cardholders
in the BPL category is rising which has increased subsidy burden on both Centre and the
State. The figure below gives the year wise trend of food subsidy in the state:
Figure 2: Year wise trend of Food Subsidy in Karnataka
12
EBPL grains are actually grains diverted from APL category, therefore the prices stated here are on the higher
side.

11
The rising subsidy bill along with inefficiency in the present system has triggered a national
level debate which led to the inclusion of following things in the draft Food Security Bill13
:
The draft calls for improved "modern and scientific" storage and doorstep delivery of
grain to targeted public distribution system outlets
The draft Food Security Bill makes it compulsory for state governments to pay a food
security allowance to targeted sections in case of failure to supply food grain through
a sweeping welfare scheme targeted at nearly three-fourths of the population
The bill also guarantees 7 Kgs of grain to every person belonging to priority
households and 3 Kgs to individuals from general households every month at
subsidized prices
The draft bill says that the centre must periodically prescribe guidelines to identify
households selected for the food schemes, including exclusion criteria. It also says
these households must be reviewed and updated through periodic surveys
The inclusion of food security allowance instead of grains can have a bigger implication in
the system as it would enable FPD work as retail stores here all people can go make their
purchases for essential commodities. This can also lead to improved retailer’s margin.
The point three if implemented in combination with point four can result in people using APL
ration cards to obtain essential commodities.
2.6 Panchtantra
This initiative has been started by the Food, Civil Supply and Consumer Affairs Department
to identify bogus cards14
in their system. As part of this initiative, the Department is mapping
its computerized card holder’s data base with:
Property tax no. at rural level
RR no. (Electric meter reading no.) at urban level
Based upon author’s cursory look at the mapped database and explanation by a higher
official, the department has already mapped around 25 lakh cards out of the 96 lakh BPL
cards. The department has identified families who own as much as 10 cards. The efforts are
commendable and the initiative looks promising. Hopefully it will help the department
identify the 22 lakh bogus cards present in their system which can result in massive reduction
in food subsidy.
13
http://economictimes.indiatimes.com/news/economy/policy/states-should-pay-cash-if-they-fail-to-provide-
grain-draft-food-bill/articleshow/8641415.cms Date of Retrieval: 30 May, 2011 14
Bogus Card: if a family has more than one card then all but one of those cards are bogus cards
Ineligible Card: A card is an ineligible card if the author defaults on any criteria

12
3. Analysis of Distribution System
Food grains procured by GOI are stored in FCI godowns and made available to wholesale
nominees at CIP fixed by GOI for each commodity. Separate allocations are there for APL
and BPL categories. Whereas Levy sugar is made available to the wholesale nominees by the
designated sugar factories at rates fixed by GOI. Kerosene is supplied by the oil companies to
the wholesale nominees on the basis of allotment orders of the Commissioner. The
Department arranges transportation of PDS commodities from FCI godowns/sugar
factories/oil companies to wholesale nominees’ godowns (wholesale godowns) and wholesale
kerosene points and from there to the distribution points (FPD). The flow diagram of the PDS
commodities from the State level to FPD is given in the figure below (Performance Audit,
2009).
Figure 3: Flow of PDS commodities to beneficiaries
3.1 Procurement Concerns
Important Audit (Performance Audit, 2009) findings related to procurement are stated below:
Procurement of rice under the Decentralized Procurement Programme was only 1.24
percent of total rice production in the state

13
The shortfall in lifting of PDS food grains was high under APL category
The Department did not lift 3,171 MT rice and 19,697 MT wheat meant for BPL
families during the period 2004-09
The Department did not take action to lift 9,667.70 MT of levy sugar (2007-09) from
sugar factories
In the absence of norms for transit and handling losses, the shortages in the food
grains were passed on to the consumers
Blank delivery-cum-cash challans signed by food inspectors could have facilitated
diversion of food grains
The wholesale godowns did not have quality check and weighing facilities in place
3.2 Transportation & Distribution of PDS commodities
In this sub-section we will first state the important audit findings, thereafter author’s research
findings, understanding of various systems for awarding contracts and research conclusions
will be cited.
The important audit findings (Performance Audit, 2009) related to transport and distribution
of commodities are as stated below:
The FCI godowns assigned by the Government for lifting food grains were not the
nearest ones leading to an avoidable expenditure of Rs 2.82 crore
Levy sugar was lifted from far-off sugar factories entailing avoidable extra
expenditure on transportation
Action of the Department to award transport contracts at freak rates facilitated
diversion of food grains
The irregularities in the functioning of FPS were strongly indicative of diversion of
PDS commodities to black market
Fair price shops were economically unviable due to very poor profit margin
The deficiencies in the distribution and accounting of kerosene were suggestive of its
diversion to black market
3.2.1 Tender Process (Transport Note, 2009)
One the most crucial stage in the delivery of commodities is the awarding of tenders through
a transparent and a robust process at justifiable rates. The tender process and its underlying
rules have evolved over the years.
1) Earlier (before 2003-04) wholesale tenders15
would be issued through KFCSC while
the concerned district Deputy Commissioners would issue tenders for rural areas.
There were a lot of problems in this system. In this context, the tender applicants
have filed a writ petition on the tender rules.
2) Subsequent to this, in order to maintain uniformity, the wholesale transportation and
rural transportation tender rules are being drafted at the office of the Commissioner
since 2004-05 and tenders are being floated. Till 2007-08 the tender rates were being
submitted to the Commissioner for approval and the system was working
successfully.
15
Wholesale Tenders or rates at wholesale level means tenders for transportation from FCI/CCI godowns to
wholesale nominees;
Rural Tenders or rates at rural level means tenders for transportation from wholesale nominees to FPS

14
3) In the year 2007-08 Government had stopped this process (reasons are not available in
the files) and the Deputy Commissioners of the districts were appointed as Competent
Authority to fix tender rates and approve them. The Commissioner’s office has been
asked to prepare benchmark rates using scientific criteria and send it to the districts
and action has been taken accordingly. In the year 2007-08 tenders were issued
without any problems. But, in the year 2008-09 it has been observed that very high
tender rates have been fixed. At times these rates were as high as 50 to 100 percent of
that of benchmark rates ( Refer Annexure 11)
Figure 4: Different between Bench Mark rates and Agreed Rates
4) The Comptroller and Accountant General Audit team in their Performance audit for
the year of 2009-10 in the Department of Food and Civil Supplies have observed that
without approval of the Commissioner the transportation tender rates have been fixed.
Government has been spending crores of rupees on transportation of food and the
money has to be paid from the Commissioner’s office. But, it has been stated that the
Commissioner does not have any control over the transportation rates. Hence, the
Deputy Commissioners of the districts may be allowed to fix transportation rates at
10% more or less and incase it exceeds this rate, the permission of Commissioner has
to be obtained with appropriate explanation and contract may be entered into. This has
been achieved by introduction of slab-rate system for award of Tenders.
Till 2009 the tender was being issued once a year, but post performance audit only one tender
has been issued for the year 2009-10 and 2010-11.
A copy of Tender Advertisement is also available (See Annexure 4)
3.2.1.1 Fixing of Turn over: The concerned Deputy Commissioners have been asked to contact the wholesale transporters
and fix the Turnover in the current tender process. As a result, there is no uniformity in the
process of fixing the Turnover. On observing the transportation rates released it is found that
each wholesale tender applicant has a Turnover of Rs. 1 crore (Annexure 9). It means, the
annual release to the office of the Commissioner is Rs.70 to 75 crore. For example: The total
transportation costs for the year 2008-09 is Rs.73 crore. It averages to Rs.2.40 crore for 30
districts.

15
3.2.1.2 Technical Specifications/Conditions:
Change in number of lorry’s: Monthly or quarterly meetings with the Deputy
Directors, are being held in the office of the Commissioner, in such meetings one of
the important issues that is flagged is the time lag in lifting of food grains. When the
reason for this is observed it is found that the transporters have failed to lift more food
grains in the stipulated time. The Deputy Director is of the opinion that 10 Lorries are
insufficient. Also, in the tender process though it is stated that the tender applicants
who fail to lift the grains in the stipulated time must be black listed no action has been
taken. This issue has been observed and stated in the Justice Wadhwa Report as “Zero
tolerance” towards erring transporters. The number of Lorries have been increased to
15 (8 owned) for wholesale and 10 (5 owned) for rural transportation (Annexure 9,
10).
Lorry’s with uniform color: It has been made mandatory that the lorry’s designated
for PDS have to be ‘yellow’ in color and naming the lorry or writing across on it as
‘Public Distribution System Lorries’.
Capacity of the Lorries: For the tender process and calculation of the benchmark
rates, capacity of the lorry has been fixed to 10 Tonnes. But actual capacity of the
lorries being used has been found to be 16 Tonnes (Annexure 7).
3.2.2 Tender Systems
For award of tenders, two types of systems have been used:
I. Bench mark based tender quotes
II. Slab rate system
3.2.2.1 Bench mark based system This system has been introduced in the year 2004-05, where in bench marks has been
developed using following references:
Calculation of operational cost of auto by transport department (Annexure 6)
Prevalent Government Rates in 2004-05 (Annexure 6)
Prevalent KSRTC rates in 2004-05 (Annexure 6)
Prevalent PWD SR Rates in 2004-05 (Annexure 6)
Transport rates prevalent in different districts of Karnataka in 2004-05 (Annexure 3)
The author could not understand how benchmark rates have been established using the above
references as no explanation was given in the files (Tender File, 2004-05).
However, the criteria of changing the rates wrt to different parameters were available in the
file (See schedules iii-a, iii-b & iii-c Annexure 6). These formulas were never used to modify
the benchmark rates.
Changes in Bench mark rates
The author observed that, in practice, yearly change in bench mark rates is equal to the
yearly percentage change in the diesel prices in contrast to formula given in schedule iii-a,
where fuel mileage of the vehicle has also been considered. (Refer Annexure 6, 11)
An assumption has been made in this regard that changes in all other parameter is equal to
the change in diesel prices.
Distances for calculation of charges
16
The bench marks as well as agreed rates of the transportation are reported in per km per qtl.
This implies the important of distance covered as well as quantity of food grains transported.
The average distances for transportation at wholesale level for different districts are given in
Annexure 11. The average distances for transportation at rural level are given for 3 selected
districts in Annexure 12. It has to be noted here that these distances are available for other
districts as well and have been computes using average distances for transportation of goods
from wholesale nominees in each taluk to fair price shops in the respective taluk.
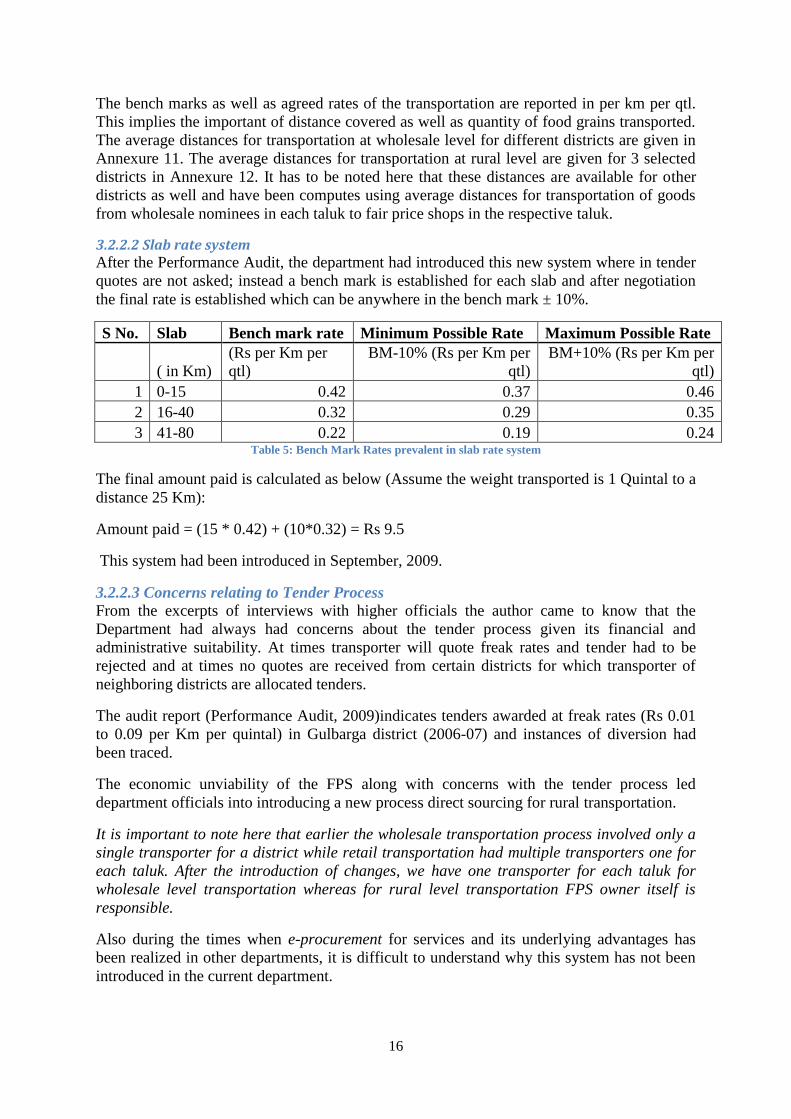
3.2.2.2 Slab rate system After the Performance Audit, the department had introduced this new system where in tender
quotes are not asked; instead a bench mark is established for each slab and after negotiation
the final rate is established which can be anywhere in the bench mark ± 10%.
S No. Slab Bench mark rate Minimum Possible Rate Maximum Possible Rate
( in Km)
(Rs per Km per
qtl)
BM-10% (Rs per Km per
qtl)
BM+10% (Rs per Km per
qtl)
1 0-15 0.42 0.37 0.46
2 16-40 0.32 0.29 0.35
3 41-80 0.22 0.19 0.24 Table 5: Bench Mark Rates prevalent in slab rate system
The final amount paid is calculated as below (Assume the weight transported is 1 Quintal to a
distance 25 Km):
Amount paid = (15 * 0.42) + (10*0.32) = Rs 9.5
This system had been introduced in September, 2009.
3.2.2.3 Concerns relating to Tender Process
From the excerpts of interviews with higher officials the author came to know that the
Department had always had concerns about the tender process given its financial and
administrative suitability. At times transporter will quote freak rates and tender had to be
rejected and at times no quotes are received from certain districts for which transporter of
neighboring districts are allocated tenders.
The audit report (Performance Audit, 2009)indicates tenders awarded at freak rates (Rs 0.01
to 0.09 per Km per quintal) in Gulbarga district (2006-07) and instances of diversion had
been traced.
The economic unviability of the FPS along with concerns with the tender process led
department officials into introducing a new process direct sourcing for rural transportation.
It is important to note here that earlier the wholesale transportation process involved only a
single transporter for a district while retail transportation had multiple transporters one for
each taluk. After the introduction of changes, we have one transporter for each taluk for
wholesale level transportation whereas for rural level transportation FPS owner itself is
responsible.
Also during the times when e-procurement for services and its underlying advantages has
been realized in other departments, it is difficult to understand why this system has not been
introduced in the current department.

17
3.3 Direct Sourcing
This system has been introduced in the year 2011 (Government Order, April, 2011)
(Annexure 5) for a period of six months to transport food grains from Wholesale Nominees to
FPS. In this system, FPS owners have to arrange for the transport of Food grains & other
commodities. A price of Rs 1/ Km/ qtl has been fixed as Transportation charges while the
handling charges have been fixed as Rs 6 per qtl.
3.3.1 Costing Sheet for Transportation charges
The author collected the following costing sheet from the department.
S No
PARTICULARS CALCULATION AMOUNT IN Rs.
1 Salaries and wages
of drivers, cleaners
and others
Rs.16000 per month/30 Rs.533 per day. 533/day
2 Fuel and lubricants Rs.50/- towards fuel/5kms=10Rs,
Lubricant cost Rs.18000/12/50=1500
litres. Amount is calculated per month
for the minimum run of 50 kms per
month.
1510/month
3 Amortized cost of
tyre, tube and
battery
Tube and tyres Rs 25000 per pair gives
40000 Kms, battery expenses Rs 4000
per annum
335 / month (Rs 333
per month + Rs 1.6
per Km)
4 Spares, repairs and
imminences
Approximate cost of Rs 20000 per
month
400/ month /km
5 Other variable cost Toll Tax, Hamali cost etc. 50 / Month/km
6 Insurance (20,000/12)/50 33/month/km
7 Licence fee,
permit fee and
taxes
Rs.10 lakh is taken for calculation as
annual turnover (10,00,000 X 5 /100)/12
4166 / month
8 Other fixed cost Rs.10 lakh is taken for calculation as
annual turnover (10,00,000 X 1/100)/12
833/month
Total 7860
9 Profit 1572
Total Cost 9432
Since the above calculation is done for 10 MT capacity lorries, per kilometer per quintal cost
would be 9432 / 1000 = Rs.0.94
This can be rounded off to Re. 1/ Km/ Quintal
Table 6: Costing Sheet for Transportation charges
The author observed that the above costing sheet has following implicit or explicit
assumptions:
1. The Fair Price Shop owner already owns a truck
2. Price of Diesel is Rs 50 per litre
3. He has employed one truck driver and two cleaners
4. The owned truck travels only 50 Km/ month

18
5. The annual turnover for transportation to each FPS is Rs 10 lakh
6. All expenses are calculates for a 10 Tonne capacity lorry
7. Basis is per km and not per day or per month or per month per Km
First of all we need to understand that once a basis of apportionment is adopted, the same
should be followed consistently. (Cost Accounting Standard - 5) Section 6.3
Salary and Wages of Drivers, cleaners and others:
Salary of one driver (Rs 8000) and two cleaners (Rs 4000 each) has been considered. This
amounts to Rs 16000 per month or Rs 533 per day (as a month has 30 days).
Now we have to understand that this cannot be accounted as it is and we need to convert it
into per Km basis. From the above assumption, Rs 16000 divided by 50 gives us Rs 320 per
Km.
Fuel and Lubricants
A fuel mileage of 5 Km per litre and an annual consumption of 180 litres have been
considered. In addition to this, price of diesel has been assumed to be Rs 50 per litre and price
of lubricants has been assumed to be Rs 100.
This gives Rs 30/ Km + Rs 10/ Km = Rs 40 / Km
Here the unit is per Km and not per month as stated in the sheet.
The author has also observed a lube oil requirement of 400 litre lube oil for a truck
(Schedule iii-b Annexure 6) this will give lube oil cost of Rs 66.67/ Km +Rs 10 / Km =Rs
76.67 per Km
Amortized cost of tyre, tube and battery
An expense of Rs 25000 per pair gives 40000 Km and a battery expense Rs 4000 per annum.
Here the calculation has been done as 40000 divided by 25000 = Rs 1.6 per Km
And Rs 4000 divided by 12 = Rs 333.33 per month and then both have been added to Rs 335
per month
As per author’s understanding calculation should have been as follows:
Total no. of tyres in the truck = 10 or 5 pairs
This gives an expense of 25000 * 5 = Rs 125000
Now 3 figures have been observed for life of tyre 40000 Km (Costing Sheet above), 36000
Km (Annexure 6) and 50000 Km (Annexure 6, Schedule iii-b). We are taking 40000 Km for
our calculation. Since our requirement is 12 * 50 = 600 Km annually.
But we have to understand here that the expense will be paid for the full year (Assuming that
Rs 125000 is expense for full year) and not according to our requirement. A truck runs 54750
Kms annually (Annexure 6).
This gives a total of Rs 129000 (an expense of Rs 10750 per month) or Rs 215 per Km
Spares, repairs and imminences:

19
An expense of Rs 400/ month/ Km has been reported which is Rs 400 / Km.
Toll Tax, Hamali cost etc:
An expense of Rs 50/ month/ Km has been reported which is Rs 50 / Km.
Insurance:
An expense of Rs 33/ month/ Km has been reported which is Rs 33 / Km.
License fee, permit fee and Taxes:
Here Rs 10 lakh has been assumed as annual turnover.
Cost computed is 5% of Rs 1000000 divided by 12 = Rs 4166 per month
This cost has to be divided by 50 to convert it to per Km basis. Thus, actual cost here would
be only Rs 83.32 per Km.
Our research on Motor Vehicle Taxation schedules have revealed following observations:
A road tax of Rs 2200 + Cess of 11% payable on a quarterly basis (Refer Annexure 8)
A permit fee of Rs 850 for 5 years permit and a license fee of Rs 250 for obtaining a
smart card
Depreciation:
This is one parameter that has not been accounted (Cost Accounting Standard - 5).
We are assuming that the present price of one such vehicle is Rs 1000000 (Annexure 6).
Assuming Salvage value of 15% = Rs 150000 and Life of 15 years
Depreciation = Rs 56666.67 per annum or (56666.67 divided by 12*50 = Rs 94.44 per Km
Other fixed cost:
Cost computed is 1% of Rs 1000000 divided by 12 = Rs 833 per month
This cost has to be divided by 50 to convert it to per Km basis
Thus actual cost here would be only Rs 16.66 per Km
Total Cost w/o profit =Rs 320+Rs 76.67+Rs 215+Rs 400+Rs 50+Rs 33+Rs 83.32+Rs
94.44+Rs 16.66 = Rs 1286.67 per Km
Profit: 20% of 1286.66 = Rs 257.334 per Km
This means Total Cost = Rs 1544 per Km for 10 Tonne capacity or Rs 0.1544 per Km per
Quintal much in line with figure arrived at in 2004-05 ( Refer Annexure 6)
Note: We have tried to demonstrate here the computation procedures given the above stated
assumptions and prices. We have not verified any of the prices stated above due to time
constraints.

20
3.3.2 Application of the Costing Sheet
This costing sheet cannot be applied for cost-estimation for direct sourcing because of the
following loopholes in the assumptions:
It is not possible to buy truck or parts thereof if one has to travel only 50 Km per
month
Parameters like spares, repairs and imminences; insurance are out of question once
we know that there is no truck
Full month salary of one driver and two cleaners is again questionable. Their
requirement is there only when truck is purchased or hired. We need to hire people
(as per vehicle used) only for a few days i.e. only when trip is planned.
We need not use a 10 Tonne truck as the quantity that we need to transport is only
150 quintal per FPS (see calculations below)
Life span of Truck should be 10 years only for our calculations, we have restricted
truck life in our tender rules
The above sheet does not take into account times and effort devoted by FPS owner
himself i.e.it does not pay FPS owner for making trips to collect grains
The above costing sheet is ideal for long-term distances with a few changes. Cost of
Amortization of tyres, tubes will increase on account of increase in usage (Refer Annexure 6
schedule iii-c).
No. of APL
cards
Rice (6 Kg/ Card)
(in Tonnes)
Wheat (1 Kg/ Card)
(in Tonnes)
Demand (APL) 4031576 24189.456 4031.576
No. of BPL
cards
Rice (20 Kg/ Card)
(in Tonnes)
Wheat (5 Kg/ Card)
(in Tonnes)
Sugar (3 Kg/
Card)
(in Tonnes)
Demand (BPL) 8482648 169652.96 42413.24 25447.944
No. of AAY
cards
Rice (29 Kg/Card)
(in Tonnes)
Wheat (3 Kg/ Card)
(in Tonnes)
Sugar (3 Kg/
Card)
(in Tonnes)
Demand (AAY) 1139063 33032.827 3417.189 3417.189
No. of Police
Cards
Rice (13 Kg/ Card)
(in Tonnes)
Wheat (3 Kg/ Card)
(in Tonnes)
Demand
(Police) 79701 1036.113 239.103
Total Demand
(in Tonnes)
227911.356 50101.108 28865.133
Table 7: Computation of Total Demand of Wheat, Rice and Sugar
From the above table one can observe that total quantity of grains and sugar that has to be
lifted is the sum of Rice (227911.356), Wheat (50101.108) and Sugar (28865.133) which is
equal to 306877.597 Tonnes or 3068775.97 quintals.
Total number of Fair Price Depots in the state = 20480
Total quantity to be lifted per FPD = 150 quintals

21
This can also be shown as the sum of 111.3 quintals of rice/ FPD, 24.5 quintal of wheat / FPD
and 14.1 quintals of sugar/ FPD. From this we can compute Retailers (FPD owner’s) margin
as
Quantity (qtls/FPD) Retailer Margin/
Quintal16
Margin (in Rs)
Rice 111.3 29 3228
Wheat 24.5 23 563
Sugar 14.1 27 381
4172
Table 8: Computation of total margin on Rice, Wheat and Sugar by Retailer
The above calculations have been made on the assumptions that:
1. There is no other commodity than Rice, Wheat and Sugar
2. Kerosene Margins have not been considered
3. There is no other way to compensate FPS owner
The average monthly income of an FPS owner with 300 cards was around Rs 2,600 after
reckoning the expenditure towards ground rent, salary for assistants, electricity,
transportation and that of the FPS owner with 500 cards around Rs 4,200, the FPS were found
economically unviable. With the number of cards assigned to each FPS being less than the
prescribed norm and with the reduction in the scale of food grains supplied to each
beneficiary the viability of the FPS was further reduced. The irregularities brought out could
be attributed to the non-viability of the FPS. (Performance Audit, 2009)
Figure 5: Fair Price Shops operating with less than the prescribed number of ration cards
We need to see this already stated economic non-viability wrt following things:
16
Costing Sheet 2010-11

22
We are refining our card database this will reduce the number of cards
The reduced number of cards means the number of cardholders per FPS will decrease
further
Retail margin is fix in the costing sheet and there is no account for inflation on his
compensation
Therefore we have to realize the need to reduce the number of fair price shops so that FPS
owner can distribute more quantity per shop and earn more revenues.
3.3.2.1 Fieldwork for Transportation Costing We have test-check a few transporters and obtained following quotes:
S No. From To Distance (Km)
Capacity of Lorry (Tonne) Rate
Rate ( Rs per Km per Quintal)
1 Bangalore Chandigarh 2298 27 Rs 85000 0.137
2 Bangalore Delhi 2061 27 Rs 75000 0.135
3 Bangalore Kolkata 1881 27 Rs 65000 0.128
4 Bangalore Agra 1858 - Rs 340 per Qtl 0.183
5 Bangalore Udaipur 1751 - Rs 250 per Qtl 0.143
6 Bangalore Jaipur 1985 - Rs 280 per Qtl 0.141 Table 9: Long term rates as quoted by transporters
We also enquired about the prevalent short distance rates. Short-distance quotes are
negotiable rates in the range Rs 2500 to 3000 for a lorry capacity ranging (10 – 15 – 21
Tonnes) to cover a distance to the tune of 50 Km.
Note: We have to observe here that long-distance rates are much in line with the rates
calculated by us using CAS – 5 standards whereas short distance rates are negotiable and
market driven for the same vehicle
3.3.3 Handling Charges
From the excerpts of an interview with a higher official, we have observed that these rates
have been increased from existing Rs 4.5 per quintal to Rs 6 per quintal. The possible reasons
for this increase are increase in the number of loading and unloading points and reduced
quantity for transport. As shown in the figure below, earlier lorries used to follow a circular
map with higher capacities and go on distributing goods through various FPS falling in
between but now the present system is like a hub and spoke system.
Earlier a full truck load could have been used to transport grains at a single time but now only
small quantities will be transported. All this has diminished the possibilities of a cost bargain.
3.3.3.1 Fieldwork for Handling Charges We have done some test-studies which reveal the following real life scenarios:
1. There is a contract with the labor for the loading and unloading of the full truck. The
amount for this is anywhere in the range Rs 500 to Rs 700. The test case here had a
capacity 300 bags of 50 Kg each which gives a total weight of 15 Tonnes or 150
quintals. This gives the charges in the range of Rs 3.33 per quintal to Rs 4.66 per
quintal.

23
2. If a transporter has a large volume or multiple trucks, he will hire labor on a day wage
basis and get the loading and unloading done. This gives even more cost advantage to
him.
The analysis of the test-cases clearly suggests that the current system is cost inefficient.
Figure 6: Route Map prior to Direct Sourcing (Circular, Left Image) and post Direct Sourcing (Hub and Spoke,
Right Image)
Now to transport reduced quantities a FPS owner has to go for multiple trips. For example, a
transporter covers a distance of 50 Km in a month (Assumption given in the cost sheet). Let
us make another assumption that his shop is at a distance of 5 Km from the wholesale depot.
Thus, he is making 10 trips in a month transporting around 15 quintals each time. We can
transport 15 quintals using a rickshaw or a hand cart and need not hire a lorry. However, the
point we are trying to make here is that more time is required to transport grains now which
makes the system inefficient with respect to time required.
Any decision for direct sourcing is seen with respect to following 4 parameters:
Cost Efficiency
Time Efficiency
Derived Value
Strategic Importance
We have demonstrated earlier how system is inefficient both with respect to Cost and Time,
now we will see value derived from or strategic importance of the direct sourcing in the
system.
Derived Value: We have seen in the costing sheet provided by the department that how
generously we are paying FPS owner for the expenditure he is not actually incurring. Though
such freebies make him realize astronomical economic gains (with respect to delivery of a
commodity i.e. valued at Rs 3 per Kg), they never ensure that there will be no diversion in the
system. Instead it substantially increases the control of FPS owner on the entire supply chain
which can be disadvantageous in the long run.

24
We understand the current tender process is fraught with challenges but e-procurement will
ensure that we generate value in terms of:
Reduced time period between issue of tenders and receipt of tenders
Substantial Tender Premium17
can be obtained
Reduced Time Cycle18
Strategic Importance:
In the times, when the whole world is going lean we are introducing one system which by
nature of its operation is inefficient.
A lean – transportation system is designed by accounting for following elements:
Organizational Structure: Change the organization to meet JIT requirements. Instead
we are introducing a system where FPS owner will making frequent trips to wholesale
godowns. Hence there will be times when delivery of the commodity will not be
possible because of unavailability of owner or transportation of small quantities of
fewer items
Number of Carriers: Reduce the number of carriers to four or fewer--one for each
region. This can be ensured if we use large vehicles for transportation but we are even
reducing the quantity transported for each cycle
Contract Basis: Put 100 percent of transportation services on a contract basis.
Interestingly, we are here removing a system in which transportation is done on
contractual basis
Computer Interface: Establish extensive computer interface with all contracted
carriers. This can be achieved if we introduce GPS and e-procurement but with direct
sourcing in place this installation is not possible
Regular Pickup and Delivery: Pick up all freight from suppliers and deliver on a
scheduled basis. Direct sourcing will make the basis ad-hoc instead of already
scheduled basis
Efficient Handling Equipment: Use state-of-the-art technology and handling
equipment. These equipments can be installed at FCI and wholesale godowns can
reduce our expenditure on handling charges.
Thus, we can state that the current system is also not capable of achieving strategically
important goals.
17
The premium offered on the current market price 18
The average value of time from Line estimate preparation to Agreement signing in your department

25
4. Conclusions
From our study of the PDS system in Karnataka we can draw following conclusions:
1. The distribution of average number of cards per FPS is not uniform across different
districts in the state
2. The distribution of average number of FPS per wholesale depot is also not uniform
across different districts in the state
3. The rising food-subsidy, the presence of ineligible and bogus cards have rendered the
system useless for the APL families
4. The Department’s efforts for identifying bogus cards look promising
5. In the bench mark system, the following discrepancies have been detected:
Agreed rates were as high as 100% higher than the bench mark rates
Figure 7: Percentage increase of agreed rate over bench mark rates for 2008-09
The changes made in the bench mark rates as compared to previous years did
not take into account the fuel mileage of the vehicle
6. The slab rate system looked promising and more efficient the bench mark rate system
7. The costing sheet of transportation for direct sourcing is not applicable on account of
faulty assumptions and is leaving a lot on table for the FPS owners
8. FPS have been seen to be non-viable, but extensive study needs to be done before we
can give some conclusive output on this
9. Direct sourcing had increased the number of loading/unloading points. This system is
both cost and time inefficient
10. Larger capacity vehicles are being used in the system
11. E-procurement must be introduced in the system to get rid of burdensome current
tender process; to achieve reduced tender cycles & achieve substantial tender
premium
12. Direct sourcing in the system scenario (small no. of items with fixed quantity) is not
capable of achieving strategically important goals of lean transportation systems
13. In the market for shorter distances rates are negotiable with respect to quantity but not
distance i.e. they are the same irrespective of the distance

26
Impact Assessment
Average Monthly distance covered by FPS
owner
50 Km
Average Monthly Quantity/ FPS 150 Qtl
Total no. of FPS 20480
Total Monthly Quantity 3068776 Qtl
Direct Sourcing:
Transportation Charges = Rs 1 per Km per Qtl
Handling Charges = Rs 6 per Qtl
Total Monthly Transport Charges 1*50*150*20480 Rs 15.36 Crore
Total Handling Charges 6*3068776 Rs 1.8412 Crore
Total DS TC Rs 17.2012 Crore
Slab Rate:
Transport Charges: Rs 0.42 per Km per Qtl
Handling Charges: Rs 4.5 per Qtl
Total Monthly Transport Charges 0.42*50*150*20480 Rs 6.4512 Crore
Total Monthly Handling Charges 4.5*3068776 Rs 1.3809 Crore
Total SR TC Rs 7.8321 Crore
Total Monthly Impact Rs 9.3691 Crore
Total Impact of 6 months Rs 56.214 Crore Table 10: Impact Assessment of Direct sourcing Vs Slab Rate System
Any number less than this is a clear indicative that distance travelled is less than 50 Km/
month.

27
5. Recommendations
1. The average no. of FPS per wholesale depot and average no. of cards per whole sale
depot must be distributed equitably
2. The department must refine cardholders data to remove all the bogus and ineligible
cards present in the system
3. One can introduce payment of food security allowance to target sections through
channels like banking. The system can thus be made cashless but the biggest
constraint here would be the availability of the refined database.
4. The Transport and Handling charges we are paying for Direct Sourcing are not
justified, so we should revert back to the slab-rate system as soon as possible to avoid
wasteful expenditure
5. The department must understand the need of reducing number of FPS in light of
refined database. Same number of shops with reduced no. of cards will deteriorate the
economic condition of the FPS
6. E-procurement must be introduced in the system that will make the tender process
more transparent and efficient
7. State institutions like TAPCMS should be awarded the contracts if in certain region
no transporter is ready filing for filing tender.
8. A manual on the creation of bench mark rates in 2004-05 and must be made and
published in at least two languages
9. Separate slab rate must be developed for separate districts by conducting proper
market research to account for differential pricing using the manual created
10. All the parameters that can possibly influence the newly developed rates must be
identified and formula must be developed to account for changes in the rate per unit
change in them. Thus every we can find the changes in the individual parameters and
can modify our rates accordingly
11. Vehicle type and specifications must be appropriately defined in the tender
notification and monitoring system must be put in place to check that same vehicles
are being used. The factors like load capacity must be binding and must not exceed to
what has been specified in the tender notification

28
29
6. Scope for Further Research
Research can be conducted on the following topics.
Study can be conducted on how the bench mark rates were established in 2004-05
(Tender File, 2004-05) and the research inputs can be used to develop new bench
mark rates.
A market research must be conducted to obtain the market prices for a max. distance
of 75 Km for all the districts
A market research can be conducted to obtain the all the prices relevant to CAS-5 for
the possible vehicle specifications
A detailed study must be conducted to identify all the possible sources of revenue and
expenditures of the retailer
A research can be conducted on the effectiveness of Panchtantra to identify bogus
cards

30
7. Bibliography
(2004-05). Tender File. Bangalore: Food Civil Supplies & Consumer Affairs Department.
(2005-06). Tender File. Bangalore: Food, Civil Supplies and Consumer Affairs Department.
(2007-08). Tender File. Bangalore: Food, Civil Supplies and Consumer Affairs Department.
(2008-09). Tender File. Bangalore: Food, Civil Supplies and Consumer Affairs Department.
(2009). Performance Audit. Bangalore: CAG office, Karnataka.
(2009). Transport Note. Bangalore: CAG office, Karnataka.
(April, 2011). Government Order. Bangalore: Government of Karnataka.
(n.d.). Citizen's Charter. Bangalore: Department of Food, Civil Supplies and Consumer Affairs.
(n.d.). Cost Accounting Standard - 5. New Delhi: ICWAI.

31
8. Annexure
8.1 Annexure 1: List of Questions asked during interviews
Q No. Content
1 Are there any performance metrics in the system?
2
Can you explain me how the final rates were being calculated in the Slab-rate
system?
3 Can you explain me the cash-flow in the transport department?
4
Can you explain the scientific criteria, which the department used to fix the
benchmark rates?
5 Can you give me the projection of rise in cost due to escalated rates?
6
Can you highlight some of the concerns of the transporters and how the department
is addressing them?
7 Can you provide me information/guidance on following areas of concern?
A scientific criterion that was being used to set benchmark rates at wholesale
and rural level and procedure that was being used to make yearly changes in
it
Relevant information on existing Linear Programming Model being used for
transportation in Karnataka
Current model being followed by Government of Gujarat for movement
planning purposes
Possible reasons for changes incorporated (from contractual basis to direct
sourcing) at Rural Level Distribution
Information on slab-rate system for tender that was put in place in 2010-2011
Procedures being contemplated for refining of eligible card holders data
Problems being faced in the tender process
8 Coming to loss control, don’t you think RFID would help a lot?
9
Does there exist any government order that provides the detail of rates that will be
prevalent in the new system?
10 Don’t you think giving more power to the Fair Price Owner can be disadvantageous?
11
Even if the vehicle is on the Route Map, don’t you think there is still a possibility of
theft?
12
For calculating B10 (license fee, permit fee and taxes), we have made an assumption
5% of annual turnover (Rs 10,00,000). What is this annual turnover? Why Rs
10,00,000?

32
13
From my random discussions with some junior level officers, I came to know that we
are changing the present system of tenders to direct sourcing. What are the possible
reasons for it?
14 How are we accounting for increase in benchmark rates?
15 How can GPS help control diversion?
16 How cum we had witnessed a rise in cost from Rs 0.42 average to Rs 1?
17 How does the loading/ unloading system works in your markets?
18 How was the bench marks developed for this system?
19 How we are ensuring that food grains are reaching the right kind of people?
20
I can see a huge difference between the numbers proposed by you and other states,
can you explain me the reasons for it?
21
I have come to know that food grains are being replaced (good quality by bad
quality), how are we checking this?
22 I would like to discuss the importance of end-users in the systems.
23
In which way, Can the implementation of POS and GPS system can help the present
system?
24
My understanding of the system says, one can definitely derive a cost advantage by
deploying a wage - based labor (Hamali) when volume is large than piece – based (or
bag – based) labor when volume is low?
25
One more system (i.e. slab rate system) has been used for fixing tenders, can you
explain me this system?
26 Please explain the cost – recovery part in detail?
27 Relating to Direct Sourcing, how did the rates shoot up from Rs 4.5 to Rs. 6?
28 What are bogus cards and ineligible cards? How are they different?
29 What are pre-Nemmadi and Nemmadi cards?
30 What are the major elements in the Distribution system?
31 What are the major hindrances in implementation of the above mentioned systems?
32 What is Panchtantra and how can it help to refine data in your system?
33 What is the average no. of customers a FPS owner handles?
34 What is the capacity of your FPD?
35 What is the correct number of BPL cards 96.21 lakh or 1.18 crore?
36 What is the mode/level of operation of Mobile FPS shops operating in Karnataka?
37 What is the prevalent rate of transportation for shorter distance?
38 What is the prevalent rate of transportation between Bangalore and Metro Cities?
39
What is the prevalent rate of transportation between Bangalore and some major
cities?
40 What is the rate of service tax (Transportation) that we are charging in Karnataka?
41
What would be the budget if we go ahead with implementation of POS along with
GPS?
42 What, otherwise, can be the way forward?
43 Which are the major parties involved in the system?
44
Which system, according to you, was the best?
Bench Mark Based Tender Quotes
Slab Rate System

33
Direct Sourcing
45
Which tender file (year-wise) contains the scientific formula that was used to develop
benchmark rates?
46
Who do you think is the bigger culprit?
Fair Price Shop Owner
Transporter
47 Why bench marks for different districts are varying significantly?
48 Why such huge differences exist between bench mark and actual quotes?
49 Why we are not able to implement RFID in Karnataka?
50 Why we have assumed that a FPS owner will cover only 50 Km?

34
8.2 Annexure 2: Copy of an APL Ration Card

35
8.3 Annexure 3: Transport Rate Prevalent in Different Districts of
Karnataka in 2004-05
S No.
District & Taluk Considered
Transport
Rates for 100
qtls (Rs)
Comments
Rate in Rs for
Respective Slabs (for
100 qtls)
1 Bagalkot (Bagalkot Taluk) 950.00 Irrespective of Distance
2
Bangalore (Rural) (Hoskote
Taluk)
Slab Rates
(Fixed Rate for a
Range)
0-5 Km 880
6-10 Km 1300
11-20 Km 2090
21-30 Km 2300
31-40 Km 2420
3 Belgaum (Savadatti Taluk)
Slab Rates
(Fixed Rate for a
Range)
0-5 Km Nill
6-10 Km 1438
11-30 Km 1681
31-40 Km 1898
4 Bellary (HB Halli Taluk)
Slab Rates (Rate/
Km)
0-25 Km 37
25-50 Km 38
51 & above 15
5 Bidar (Basvakalyan Taluk) 739.00 Irrespective of Distance
6 Bijapur (B. Bagevadi Taluk) 1200.00 Irrespective of Distance
7
Chamrajnagar (Gundlupete
Taluk)
Slab Rates
(Fixed Rate for a
Range)
0-5 Km 850
6-10 Km 1450
11-20 Km 4000
21-30 Km 4200
31-40 Km 4300
8
Chikkamagalur (Shringeri
Taluk) 1587.00 Irrespective of Distance
9
Chitradurga (Chitradurga
Taluk)
Slab Rates
(Rate/Km)
0-10 Km 79
11-20 Km 74
21-30 Km 62
31-40 Km 55
10 D.Kannada (Puttur Taluk)
Slab Rates
(Fixed Rate for a
Range)
0-5 Km 1246
6-10 Km 1486
11-15 Km 1610
16-20 Km 1664
21-25 Km 1750
26-35 Km 1950
11 Davangere (Davangere Taluk)
Slab Rates
(Rate/Km)
0-10 Km 30
11-30 Km 72
31-40 Km 20
12 Dharwad (Dharwad Taluk) 798.00 Irrespective of Distance
13 Gadag (Mundargi Taluk) 839.00 Irrespective of Distance
14 Gulbarga (Yadgiri Taluk) 1590.00 Irrespective of Distance
15
Hassan ( Same Rate for all
Taluks) 1520.00 Irrespective of Distance
16 Haveri (Hangal Taluk) 993.00 Irrespective of Distance

36
17 Kodagu (Virajpete Taluk)
Slab Rates
(Fixed Rate for a
Range)
0-5 Km 750
6-10 Km 900
11-20 Km 1250
21-30 Km 1600
31-40 Km 1800
18 Kolar (Srinivaspur Taluk)
Slab Rates
(Fixed Rate for a
Range)
0-15 Km 1400
16-30 Km 1410
31-40 Km 1410
19 Koppal (Gangavati Taluk)
Slab Rates
(Fixed Rate for a
Range)
0-25 Km 1900
25 & above 2100
20 Mandya (Mandya Taluk)
Slab Rates
(Fixed Rate for a
Range)
0-5 Km 1420
6-10 Km 1710
11-20 Km 1970
21-30 Km 2230
31-40 Km 2310
21 Mysore (T. Narsipur Taluk)
Slab Rates
(Fixed Rate for a
Range)
0-5 Km 700
6-10 Km 700
11-20 Km 2100
21-30 Km 2700
31-40 Km 2480
22 Raichur (Lingsugur Taluk)
Slab Rates
(Fixed Rate for a
Range)
0-25 Km 1700
25 & above 1900
23 Shimoga (Hosanagara Taluk) 1230.00 Irrespective of Distance
24 Tumkur (Kunigal Taluk) 1225.00 Irrespective of Distance
25 Udupi (Karkala Taluk)
Slab Rates
(Fixed Rate for a
Range)
0-15 Km 1375
16-25 Km 1710
26-40 Km 1900
41-60 Km 2000
61 & above 2000
26 Uttar Kannada (Ankola Taluk)
Slab Rates
(Fixed Rate for a
Range)
0-5 Km 989
6-10 Km 1236
11-20 Km 1545
21-30 Km 1730
31-40 Km 1915

37
8.4 Annexure 4: Tender Advertisement in English

38
8.5 Annexure 5: Government Order (dated 11.04.2011) for fixing of
Transport and Handling Charges

39
8.6 Annexure 6: Accounting to calculate Benchmark Rates

40

41
8.6.1 Indian Oil Tender Schedule iii for Changes in Different rates
8.6.1.1 Schedule iii-A Formula for working out escalation/ De- escalation in transportation rates on account of
increase/decrease in retail selling price of HSD.
Increase/ Decrease in the transportation rate in paise per Kl/ RTKM
Formula =
Where Q represents notional capacity of a tank truck and it is taken as 12 Kl and 4 represents
distance (4 Kms) which a tank truck can run with 1 lit of HSD (loaded or otherwise) for the
purpose of calculations.
8.6.1.2 Schedule iii-B Formula for working out escalation/ De-escalation in transportation rates on account of
increase/decrease in retail selling price of Automotive Lube Oil (Engine Oil) servo pride
30/40 or its equivalent grades of OMCs. Increase/ Decrease in the transportation rate in paise
per Kl/ RTKM.
Formula =
Where Q represents notional capacity of a tank truck and it is taken as 12 Kl and 400
represents 1 lit of lube oil required to run a tank truck a distance of 400 Kms for the purpose
of calculations.
8.6.1.3 Schedule iii-C Formula for working out escalation/ De- escalation in bulk transportation rates on account of
increase/decrease in the average list prices of tyres, tubes, flaps which are described
subsequently. Average increase/ decrease in the transportation rate in paise per Kl/ RTKM.
Formula =
Where Q represents notional capacity of a tank truck and it is taken as 12 Kl. In the formula
given above, 12 represents number of tyres which are assumed as required for running the
tank truck through a destination of 1,00,000 Kms in one year required to be changed every
six months. Life of a tyre is assumed as 50,000 Km.
Increase or decrease in 1 lit of HSD RSP ex-state capital cities (within
municipal limits) of the supply point concerned inclusive of taxes
Increase or decrease in 1 lit of Automotive Lube Oil ex-state capital cities
(within municipal limits) of the supply point concerned inclusive of taxes
Average increase or decrease in the listed prices of tyres, tube flaps of 4
companies stated subsequently ex-State Capital of the Supply Point concerned

42
8.7 Annexure 7: Copy of Goods Carriage Permit showing Actual Load
Capacity
Copy 1 of a Vehicle Permit from 2007-08 Tender File
Copy 2 of a Vehicle Permit from 2007-08 Tender File

43
8.8 Annexure 8: Motor Vehicle Taxation Schedules

44
8.9 Annexure 9: Tender Notification (FCI to Wholesale) Dated 18-08-09
ÀЦѷЧ
ÊÐ–Ð©Ô Êіѱґ٠ªÙ�®Ð¤ý ·Ñ“ÄÙ
ÁÈЕ¦ÐÔ:- ÊÑÀÐþ¡º‘Ñ Á³Ð¤Ð²Ñ ÀÐôÀÐÊÙë�¦ÐÔ¯�¦ÐÔÅö 2009-10 ÀÐÔ³ÐÔê
2010-2011¹ÙÓ ÊÑÅ–Ñ— _________________£ÄÙö•¦ÐÔ
ŠÄÑö ³ÑÃÖö‘ÐÔ ÊÐ–Ð©Ô ÀÐÔÏ–Ù–ÐÏ–Ù ¾°Ñ¤Ð³Ð „ÌѤРº–ÐÀÐÔ/
ÁÁ·°Ð ÊБÐܤ٠‘Ñ”Ñþ¹Ù–ÐÏ•·Ð „ÌѤз°Ñ¹Ðô–ÐÎйÐÔî/ÊБÐܤٕ¦ÐÔ¹ÐÔî
Êіѱґ٠ÀЦѮÐÃÔ Êіѱґ٠–ÐÔ´ê–ٷѤФйÐÔî ¹ÙÓÀÐÔ‘Ð
ÀЦѮÐÔÀÐ ½–ÙÞ.
--0--
I.ÁÀФÐ:
2009-10 ÀÐÔ³ÐÔê 2010-2011¹ÙÓ ÊÑÅ–Ñ— ¸¹Ñ�‘Ð 01/10/2009 §�·Ð 31/03/2011
¤ÐÀФٖ٠ÊÑÀÐþ¡º‘Ð Á³Ð¤Ð²Ñ ÀÐôÀÐÊÙë�¦ÐÔ¯�¦ÐÔÅö Á³Ð§ÊÐÃï®ÐÔÀÐ „ÌѤз°Ñ¹Ðô–ÐÎйÐÔî ¾°Ñ¤Ð³Ð „ÌѤÐ
º–ÐÀÐÔ·Ð ƒ¸°‘ÐسР–ÙÖÓ·ÑÀÐÔÔ–ÐÏ•·Ð £ÄÙö•¦ÐÔ ŠÄÑö ³ÑÃÖö‘ÐÔ ÊÐ–Ð©Ô ÀÐÔÏ–Ù–ÐÏ–Ù ÌÑ–ÐÖ
ÊБÐܤÙ�¦ÐÔ¹ÐÔî ÁÁ·°Ð ÊБÐܤ٠‘Ñ”Ñþ¹Ù–ÐÏ�·Ð ‘йÑþ©‘Ð „ÌѤРÀÐÔ³ÐÔê ¹Ñ–Ð§‘Ð ÊФн¤Ñ¡Ô º–ÐÀÐÔ
º•¦ÐÔÁԳР¤ÐÀФРÊÐ–Ð©Ô ÀÐÔÏ–Ù–ÐÏ–Ù ÀЦѳÐõ £ÄÑö¸°‘ѧ–ÐÎÐÔ ÊÐ֜˷Ð�³Ù Êіѱґ٠ÀЦѮÐÃÔ ÊÑ–
ѱґ٠–ÐÔ´ê–ٷѤФйÐÔî ¹ÙÓÀÐÔ‘Ð ÀЦѮÐÔÀÐ ÊÐÃÔÀÑ—, ‘йÑþ©‘Ð »Ñ¤Ð·ÐÆÐþ‘Ð³Ñ ƒ¸°º�¦ÐÔÀÐÔ 1999 ¤Ð
ÀÑô¼ê–Ù •ÎлЩÔå ¹ÙÖÓ•·ÑÂÔÊÐÃï©å Äѧ–ÐÎÐ ÀЦÑÅӑЧ�·Ð ËÓÄý ÀЦѯ·Ð ªÙ�®Ð¤ÐÔ–ÐÎйÐÔî ¸÷»Ðõ´–
ÐÎÐÅö, ¸÷ÑÙÖÓªÙ�¦ÐÔÅö ‘Фٕ¦ÐÔÄÑ—·Ù.
„ÌѤз°Ñ¹Ðô–ÐÎйÐÔî Êіѱґ٠ÀЦѮоÙÓ‘Ñ·Ð ÊÐ–Ð©Ô ÀÐÔÏ–Ù–ÐÎÐÔ ÌÑ–ÐÖ ¾°Ñ¤Ð³Ð „ÌѤРº–
ÐÀÐÔ·Ð ��·Ð¹ÙÓ ƒ¸°‘ÐسР–ÙÖÓ·ÑÁÔº�·Ð …¤ÐÔÀÐ ·Ð֤ЖÐÎÐÔ (’.ÁÔÓ.–ÐÎÐÅö) ‘ÙÎБÐ�®Ð�´ÀÙ
‘Ðõ.
ÊЕ.
³ÑÃÖö‘ÐÔ ÊÐ–Ð©Ô ÀÐÔÏ–Ù•¦ÐÔ
ÌÙÊФÐÔ
FCI ¹Ð ƒ¸°‘ÐسÐ
–ÙÖÓ·ÑÀÐÔÔ ·Ð֤Р(’.ÁÔÓ.–ÐÎÐÅö)
II.Êіѱґ٠ªÙ�®Ð¤Ð »Ðõ’õ�¦ÙÔ–Ù ÊÐ�½�¸°Ë·Ð »Ñõ¸°‘ѤЖÐÎÐÔ:
(ƒ) ªÙ�®Ð¤ý ‘ФÙ�¦ÐÔÔÀÐ »Ñõ¸°‘ѤР(Tender Inviting Authority): £ÄÑöÀѤÐÔ Êіѱґ٠ªÙ•®Ð¤Ð
‘ФÙ�¦ÐÔÃÔ ƒ�¦Ð¦Ñ £ÄÙö�¦ÐÔ £ÄÑö¸°‘ѧ–ÐÎÐÔ, ÊБÐùÀÐÔ »Ñõ¸°‘ѤÐÀÑ—¤ÐÔ³Ñê¤Ù.
(„)ªÙ�®Ð¤ý �»ÐÔïÀÐ »Ñõ¸°‘ѤР(Tender Accepting Authority): £ÄÑöÀѤÐÔ Êіѱґ٠ªÙ�®Ð¤ý
•»ÐïÃÔ ƒ�¦Ð¦Ñ £ÄÙö�¦ÐÔ £ÄÑö¸°‘ѧ–ÐÎÐÔ, ÊБÐùÀÐÔ »Ñõ¸°‘ѤÐÀÑ—¤ÐÔ³Ñê¤Ù.

45
(…) ªÙ�®Ð¤ý ÀÙÔÓÃó¹ÐÁ »Ñõ¸°‘ѤР(Tender Appellate Authority): ªÙ�®Ð¤ý »Ðõ’õ�¦ÙÔ ÀÙÔÓŹÐ
•¦Ð¦ÑÀÐÕ·ÙÓ ÁÀѷЖÐÎÐ ÊÐ�·Ð¾°Ðþ·ÐÅö „�¦ÐÔÔ‘Ðê¤ÐÔ, „ÌѤÐ, ¹Ñ–Ч‘Ð ÊФн¤Ñ¡Ô ÀÐÔ³ÐÔê –ÑõÌБФÐ
ÀÐôÀÐÌѤЖÐÎÐ …Äє٠¤ÐÀФÐÔ ÀÙÔÓÃó¹ÐÁ »Ñõ¸°‘ѧ (Appellate Authority) „—¤ÐÔ³Ñê¤Ù.
III. ÈФгÐÔê–ÐÎÐÔ
A) ³Ñ�´õ‘Ð ÈФгÐÔê–ÐÎÐÔ
1) …�µÐ·ÙÓ ÊіѱґÙ�¦ÐÔÅö ªÙ�®Ð¤ÐԷѤФÐÔ ÌÙÖ�¸¤ÐÔÀÐ ƒ¹ÐÔ¾°ÐÀзР½–ÙÞ ÊБÑþ§ …ÄÑ”Ù/ º–
ÐÀÐÔ/ ”ÑÊЗ ÊЕÊÙë–ÐÏ�·Ð »Ð®Ù·Ð ·Ðد°Ó‘ФбÀйÐÔî ºÓ®ÐÔÀÐÕ·ÐÔ. 03 ÀÐÈÐþ–ÐÎÐ ƒ¹ÐÔ¾°ÐÀÐ
»ÐõÀЦѱ »Ð³ÐõÀйÐÔî ÖдêÊгБÐÜ·ÐÔì. ƒ¹ÐÔ¾°ÐÀÐ »ÐõÀЦѱ »Ð³ÐõÀÐÕ ‘ЮÑç�¦ÐÔÀÑ— ÊіѱґٷѤФÐ
‘Ñ�¦ÐÔþºÀÐþÌв٠§Ó´, Í�¸¹Ð ·Ñ“ÄÙ–ÐÎÐÔ ÌÑ–ÐÖ ƒÀФРÀÐØ´ê»Ð¤Ð³Ù�¦ÐÔ ½–ÙÞ ÁÀФЖÐÎйÐÔî
ÌÙÖ•¸¤Ð³Ð‘ÐÜ·ÐÔì. ƒÃö·ÙÓ, Êіѱґ٠ÀЦѯ·Ð ÀÐÈÐþ, »ÐõÀЦѱ ÀÐÔ³ÐÔê ÀÐÍÀÑ«¹Ð ÊÙÓÀÑ ³Ù§–
Ù ÀÐÔ³ÐÔê „·Ñ�¦ÐÔ ³Ù§–Ù ·Ñ“ÄÙ–ÐÎÙÖ•¸–Ù ¹ÐÀÐÔÖ¸ÊгБÐÜ·ÐÔì.
2) ÀÐô’ê–гÐ/ »ÑÃԷѧ‘Ù ÊÐ�ÊÙë�¦ÐÔÔ Chartered Accountant ¤ÐÀЧ�·Ð ·Ðد°Ó‘Фб–ÙÖ•®Ð
Í•¸¹Ð ÀÐÔÖ¤ÐÔ ÀÐÈÐþ·Ð Balance Sheet ÌÑ–ÐÖ profit and loss account ¢ÙÖ³Ù•¦ÐÔÅö
Audit Report in form No. 3 CB & Form No. 3 CD under section 44 AB of
Income Tax Act 1969 ¤Ð•³Ù ÊÐÅöÊÐÔÀÐÕ·ÐÔ.
3) ƒ) ªÙ�®Ð¤ÐԷѤФÐÔ ‘кÈÐæ 10 ©¹ý ÊÑÀÐÔµÐôþ·Ð 15 Äѧ–ÐÎйÐÔî •·Ð—ÊгБÐÜ·ÐÔì. ƒ·Ð¤ÐÅö 8
Äѧ–ÐÎйÐÔî ªÙ�®Ð¤ý·Ñ¤Ð¤ÐÔ ³ÐÀÐÔó ÊÐ÷�³Ð ÌÙÊЧ¹ÐÅö ÌÙÖ�¸¤Ð¾ÙÓ‘ÐÔ .
(„) ªÙ�®Ð¤ÐԷѤФÐÔ ÊÐ�˜Ð/ ÊÐ�ÊÙë/ »ÑÃԷѧ‘Ù�¦Ð¦Ñ—·ÐìÅö Äѧ–ÐÎÐÔ ÊÐ�˜Ð/ÊÐ�ÊÙë�¦ÐÔ
ÌÙÊЧ¹ÐÅö ƒµÐÀÑ »ÑÃԷѤФРÌÙÊЧ¹ÐÅö …¤Ð³Ð‘ÐÜ·ÐÔì.
(…) ªÙ�®Ð¤ÐÔ ÊÐÅöÊÐÔÀÐ ÀÐÔÔ�›Ù Äѧ–ÐÎÐ ÀЦÑÅӑгÐ÷ÀйÐÔî ÌÙÖ�¸¤Ð³Ð‘ÐÜ·ÐÔì. …·Ð‘ÙÜ
ÊЕ½•¸°Ë·Ð•³Ù Äѧ–ÐÎÐ RC »ÐÔÊÐê‘Ð ÌÑ–ÐÖ »Ñõ·ÙÓÇ‘Ð Êѧ–Ù ƒ¸°‘ѧ–ÐÏ•·Ð ºÓ®ÐÄÑ·Ð
Register B extract ¹Ð ·Ðد°Ó‘ÐسР»Ðõ´–ÐÎйÐÔî ªÙ�®Ð¤ÐÔ ƒ£þ•¦ÙÖ•¸–٠ÖдêÊÐÔÀÐÕ·ÐÔ.
(†) ÊзЧ ÀÑÌйЖÐÎÐÔ ÌгÐÔê ÀÐÈÐþ’Ü�³Ð ÌÐÎÙ�¦ÐÔ·Ñ—¤Ð¾Ñ¤Ð·ÐÔ.
4) ��·ÐÔ ÀÙÓÎÙ …Äє٠–ÙÖöÓ½Äý »ÙÖËÈк•–ý ËÊÐåÀЦý (£.¼.ŠÊý.) ÀÐôÀÐÊÙë�¦ÐÔ¹ÐÔî ³ÐÀÐÔó
Äѧ–ÐÎÐÅö ƒÎÐÀЯÊÐÃÔ ´ÓÀЦÑþºË·ÐÅö ªÙ�®Ð¤ý ·Ñ¤Ð¤ÐÔ ƒ·Ð¹ÐÔî ³ÐÀÐÔó ÊÐ÷�³Ð “œþ¹ÐÅö
ƒÎÐÀЯÊÐÃÔ Ë·Ð짤оÙÓ‘ÐÔ .
5) ¾°Ñ¤Ð³Ð „ÌѤРº–ÐÀÐÔ·ÐÅö „ÌѤз°Ñ¹Ðô–ÐÎйÐÔî ¤ÑÇÂÔ•·Ð ³Ù–Ù·ÐÔ ³ÐÖ‘Ð ÌÑ’ Äѧ–ÐÏ–Ù
‹§ÊÐÔÀÐÕ·ÐÔ ÌÑ–ÐÔ Äѧ–ÐÏ�·Ð …ÏË ÊÐ–Ð©Ô ÀЦѤѩ ÀÐÔÏ–Ù–ÐÎÐÀФٖ٠³ÐÃÔ¼ÊÐÔÀÐÕ·ÐÔ
ÊіѱґٷѤйР‘гÐþÀÐôÀÑ—¤ÐÔ³Ðê·Ù.
6) Êіѱґٖ٠ºÓ®ÐÔÀÐ ŠÄÑö Äѧ–ÐÎÐÔ ªÑ»ÑþŹý ÌÙ֤БÐÀЛÐÀйÐÔî ÌÙÖ�¸¤ÐÔ³Ðê·Ù.
7) ªÙ•®Ð¤ý¹ÐÅö ¾°Ñ–ÐÀÐÍÊÐÔÀÐÀФÐÔ ³ÑÀÐÕ ÌÑ–ÐÖ ³ÐÀÐÔó ‘ÐÔ©Ô�½·Ð ÊзÐÊÐô¤ÐÔ ¹Ñô�¦Ð¦ÑÃ�¦ÐÔ·Ð
ÀÐÔÔ�·Ù �¦Ð¦ÑÀÐÕ·ÙÓ „ÌѤз°Ñ¹Ðô–ÐÎÐ ·ÐÔ¤ÐԻЕ¦ÙÖӖзР½–ÙÞ ’õÁÔ¹ÐÄý ÀÙ֑зÐìÀÙÔ–ÐÎйÐÔî
ÌÙÖ�¸¤Ð¾Ñ¤Ð·ÐÔ. ƒÃö·Ù »ÙÖÓÅÓÊý, „ÌѤР…Äє٠ƒµÐÀÑ �¦Ð¦ÑÀÐÕ·ÙÓ …ÄÑ”Ù�¦ÐÔÅö
Essential Commodities Act¹Ð ƒ¯�¦ÐÔÅö �¦Ð¦ÑÀÐÕ·ÙÓ ÀÙ֑зÐìÀÙÔ�¦ÐÔ¹ÐÔî ÌÙÖ�¸¤Ð¾Ñ¤Ð·ÐÔ.

46
�¦Ð¦ÑÀÐÕ·ÙÓ ÊБÑþ§ …ÄÑ”Ù/ º–ÐÀÐÔ/”ÑÊЗ ÊЕÊÙë–ÐÎÐÅö ‘лÐÔï »Ð«å–Ù ÊÙÓ§¤Ð¾Ñ¤Ð·ÐÔ.
…·Ð‘ÙÜ ÊÐ�½�·°Ð»Ð©å�³Ù »ÐõÀЦѱ»Ð³ÐõÀйÐÔî ÊÐÅöÊÐÔÀÐÕ·ÐÔ.
8) ªÙ•®Ð¤ÐÔ •»ÐÔïÀÐ »Ñõ °̧‘ѤÐÀÐÕ �¦Ð¦ÑÀÐÕ·ÙÓ ‘Ѥб ºÓ®Ð·Ù ªÙ�®Ð¤ý¹ÐÔî �»ÐÔïÀÐ/ ´¤ÐÊÐܧÊÐÔÀÐ
ÌБÐܹÐÔî ÌÙÖ�¸¤ÐÔ³Ñê¤Ù.
9) ¤Ñ¡ô ÀÐÔ³ÐÔê ‘ÙÓ�·Ðõ ÊБÑþ¤Ð·Ð „ÌѤÐ, ¹Ñ–Ч‘Ð ÊФн¤Ñ¡Ô ÀÐÔ³ÐÔê –ÑõÌБФРÀÐôÀÐÌѤЖÐÎÐ
…Äє٠ÌÑ–ÐÖ ‘йÑþ©‘Ð „ÌѤРÀÐÔ³ÐÔê ¹Ñ–Ð§‘Ð ÊФн¤Ñ¡Ô º–ÐÀÐÔ·Ð ¹Û‘ФФÐÔ ÀÐÔ³ÐÔê ƒÀФÐ
ÊÐ�½�¸°‘ФÐÔ ªÙ�®Ð§¹ÐÅö ¾°Ñ–ÐÀÐÍÊÐÔÀÐշйÐÔî ºÈÙӸ˷Ù.
10) ªÙ•®Ð¤ý¹ÐÅö ¾°Ñ–ÐÀÐÍÊÐÔÀÐ Êіѱґ٠–ÐÔ´ê–ٷѤФÐÔ ÊÐ÷�³Ð ƒµÐÀÑ ÌÙ�®Ð´/ÀÐÔ‘ÐÜÎÐ
ÌÙÊЧ¹ÐÅö ¹Ñô�¦ÐÔ¾ÙÄÙ ƒ�–Я•¦ÐÔ¹Ñî–ÐÅ ƒµÐÀÑ ƒ’Ü ÌÑ–ÐÔ –ÙÖÓ¸° —¤Ð±Ò•¦ÐÔ¹ÐÔî
ÌÙÖ•¸¤Ð¾Ñ¤Ð·ÐÔ.
11) ÀÐôÀÐÊÑ•¦ÙÖÓ³Ðï¹Ðî ÀЦѤѩ ÊÐÁÔ´ (APMC)–ÐÎÐ ÀЦѤѩ–ѤФÐÔ ÌÑ–ÐÖ ‘ÐÁÔÈйý
‹¢Ù�©¤ÐÔ ªÙ�®Ð¤ý ¹ÐÅö ¾°Ñ–ÐÀÐÍÊÐÔÀÐշйÐÔî ºÈÙÓ¸°Ë·Ù.
B) Ìб‘ÑÊÐÔ ÈФгÐÔê–ÐÎÐÔ:
1) ªÙ�®Ð¤ý ·Ñ“ÄÙ–ÐÎйÐÔî ºÓ®ÐÃÔ ¤ÐÖ.5,000.00 (Œ·ÐÔ ÊÑÁ¤Ð–ÐÎÐÔ ÀЦѳÐõ) ÆÐÔÃÜÀйÐÔî º–и
»Ð¯Ë·Ù. …·ÐÔ ÀÐÔ¤ÐÔ»ÑÀдÊÐÄізРÀÙÖ³ÐêÀÑ—¤ÐÔ³Ðê·Ù.
2) ….Š�.¯ ÀÙÖ³ÐêÀÑ— ¤ÐÖ.2,50,000.00 (¤ÐÖ. Š¤Ð®ÐÔ Ã‘Ðù·Ð ŒÀгÐÔê ÊÑÁ¤Ð–ÐÎÐÔ ÀЦѳÐõ)
–ÐÎйÐÔî ¤ÑÉåÿõÓ‘ÐسÐ/ÊÐÌБѤР¾Ñô�‘ý/ÆÙ®ÐÔôÄýç ¾Ñô�‘ýº�·Ð £ÄÑö¸°‘ѧ–ÐÎÐÔ
___________¤ÐÀФРÌÙÊЧ¹ÐÅö »Ð®Ù·Ð ‘ÑõÊý ÀЦѯ·Ð ¯ÀЦѕ®ý ®Ñõ»°ýå¹ÐÔî
ªÙ•®Ð¤ý¹ÙÖ•¸–Ù ÊÐÅöÊгБÐÜ·ÐÔì.
3) ªÙ•®Ð¤ÐԷѤФÙÖ•¸–Ù �»Ðï�·Ð ÀЦѯ‘ÙÖÎÐÔüÀÑ–Ð £ÄÙö�¦ÐÔ �©Ôå ��·ÐÔ ÀЦÑÌÙ�¦ÐÔ ÌÐ�œ‘Ù�¦ÐÔ
„ÌѤз°Ñ¹Ðô–ÐÎÐ Êіѱґ٠ÀЦѮÐÃÔ ¾ÙÓ‘Ñ–ÐÔÀÐ ÀÙ›Ðà·Ð ÀÙÖ³Ðê ¤ÐÖ.-----------------–ÐÎйÐÔî
¾°Ð·Ðõ³Ñ ¬ÙÓÀÐ±Ò (Security Deposit) •¦Ð¦Ñ— »Ð®Ù·ÐÔ‘ÙÖÎÐüÄÑ–ÐÔ³Ðê·Ù. …·Ð‘ÙÜ
ÊЕ½•¸°Ë·Ð•³Ù Irrevocable Bank Guarantee �¦ÐÔ¹ÐÔî ¤ÑÉåÿõÓ‘ÐسР¾Ñô�‘ý /ÈÙ®ÐÖôÄý
¾Ñô�‘ý–ÐÏ�·Ð £ÄÑö °̧‘ѧ–ÐÎÐ ÌÙÊЧ¹ÐÅö »Ð®Ù•¦ÐÔÔÀÐÕ·ÐÔ ÌÑ–ÐÖ Agreement ¸¹Ñ�‘и•·Ð
24 ´•–ÐÎÐ ƒÀÐ °̧�¦ÐÔÀФٖ٠›ÑÅê�¦ÐÔÅö¤Ð³Ð‘ÐÜ·ÐÔì.
4) ªÙ•®Ð§¹ÐÅö ¾°Ñ–ÐÀÐÍÊÐÔÀÐ ªÙ�®Ð¤ÐԷѤФРƒ¸°‘ÐسРÀÐÍÀÑ«¹Ð (Turn over) ÊÑÀÐÔµÐôþÀÐÕ
‘кÈÐæ ÀÑÉþ‘Ð ¤ÐÖ. 1.00 ‘ÙÖÓ«–ÐÎÐÔ ÌÑ–ÐÖ ÀÐÔÖ¤ÐÔ ÀÐÈÐþ–ÐÏ–Ù ¤ÐÖ. 3.00 ‘ÙÖÓ«–ÐÎÐÈÐÔå
ÀÐÍÀÑ©¹ÐÔî ÌÙÖ�¸¤Ð¾ÙÓ‘ÐÔ. ÌÑ–ÐÖ Turn over ¹ÙÖ•¸–Ù , Service Tax ÌÑ–ÐÔ „·Ñ�¦ÐÔ
³Ù§–Ù ·Ñ“ÄÙ–ÐÎйÐÔî ÖдêÊоÙÓ‘ÐÔ.
5) ¤ÐÖ.5.00 ÑÐù–ÐÏ–Ù ¤ÑÉåÿõÓ‘ÐسÐ/ÊÐÌБѤР/ÆÙ®ÐÖôÄýç ¾Ñô�’º�·Ð solvency certificate ¹ÐÔî
ºÓ®ÐÔÀÐÕ·ÐÔ.
6) 3 ÀÐÈÐþ·Ð „·Ñ�¦ÐÔ ³Ù§–Ù »ÑÀд returns ¹Ð ·Ðد°Ó‘ÐسР»Ðõ´–ÐÎйÐÔî ÖдêÊоÙÓ‘ÐÔ.
7) 3 ÀÐÈÐþ–ÐÎÐ Service Tax »ÑÀдˤÐÔÀÐ ·Ðد°Ó‘Фб »Ð³ÐõÀйÐÔî ÖдêÊгБÐÜ·ÐÔì.

47
8) L1 ÀÐÔ³ÐÔê L2 ªÙ�®Ð¤ÐԷѤФРÀÙÖ³ÐêÀйÐÔî ÌÙ֤гÐÔ»Ð¯Ë ‡Ï·Ð ªÙ�®Ð¤ÐԷѤФР….Š�.¯
ÀÙÖ³ÐêÀйÐÔî ³Ð‘Ðù± Í�¸¤ÐÔ—ÊÐÄÑ–ÐÔÀÐÕ·ÐÔ. L2 ªÙ•®Ð¤ÐԷѤФРÀÙÖ³ÐêÀйÐÔî ÊіѱґÙ
•»Ðï•·ÐÀÑ·Ð ¹Ð•³Ð¤Ð Í•¸¤ÐÔ—ÊÐÄÑ–ÐÔÀÐÕ·ÐÔ.
9) ªÙ�®Ð¤ý �»Ðï�·ÐÀÑ·Ð ¹Ð�³Ð¤Ð �¦Ð¦ÑÀÐÕ·ÙÓ ‘Ѥб‘ÐÖÜ ·Ð¤Ð–ÐÎÐÅö ½·ÐÄÑÀв٠ÀЦѮоÙÓ‘Ù¹ÐÔîÀÐ
‘ÙÖÓ§‘Ù–ÐÎйÐÔî ÀÐÔºîÊÐÄÑ–ÐÔÀÐÕ¸Ãö.
10) ªÙ•®Ð¤ý ·Ð¤Ð–ÐÎÐ Ë�·°ÐÔ³Ð÷·Ð ƒÀи°�¦ÐÔÔ 90 ¸¹Ð–ÐÎÑ—¤ÐÔ³Ðê·Ù.
11) •¦Ð¦ÑÀÐÕ·ÙÓ Êіѱґ٠‘Ù֤г٠‘Ð�®ÐÔ ½�·ÐÅö ƒ·Ð‘ÙÜ ÊÑÀÐþ¡º‘Ð Á³Ð¤Ð²Ñ »Ð·Ðì´�¦ÐÔ¯�¦ÐÔ
APL „ÌѤз°Ñ¹Ðô·Ð œÃö¤Ù ÀЦѤѩ ·Ð¤Ð·Ð Š¤Ð®Ð¤ÐÈÐÔå ·Ð¤ÐÀйÐÔî ¿ÃÔö–ÐÎÐÅö ‘Я³Ð–ÙÖÏÊÐÄÑ–
ÐÔÀÐÕ·ÐÔ.
12) „�¦ÐÔÔ‘Ðê¤Ð ‘Ð�ÙÓ§ÂÔ�·Ð ªÙ�®Ð¤ý ÊÑö¾ý ·Ð¤Ð–ÐÎйÐÔî ÀÙÚ¢Ñùº‘ÐÀÑ— ³Ð�¦Ð¦Ñ§Ë ‘ÐÎÐÔÍË
‘ÙÖ®ÐÄÑ—·ÐÔì † ½–ÙÞ ·Ð¤Ðº–и »Ð¯ÊÐÔÀÑ–Ð + / - 10% ’�³Ð ÌÙ›Ñà·ÐÅöö ÊÐÖ‘Ðê
‘Ѥб–ÐÎÙÖ•¸–Ù „�¦ÐÔÔ‘Ð꧖٠½¤Ù·ÐÔ „�¦ÐÔÔ‘Ðê¤Ð ƒ¹ÐÔÀÙÖӷйÙ�¦ÐÔ ¹Ð�³Ð¤Ð �»Ðï�·Ð
ÀЦѯ‘ÙÖÎÐü½ÌÐÔ·Ñ—·Ù.
C) ÊÑÀЦѹÐô ÈФгÐÔê–ÐÎÐÔ:
1) º–и³Ð ªÙ�®Ð¤ý ¹ÐÀÐÔÖ¹Ù�¦ÐÔ¹ÐÔî ¾°Ð´þ ÀЦѯ·Ð ÑÙÖÓªÙ�¦ÐÔ¹ÐÔî ÀÐÔÔ·Ñì� ƒµÐÀÑ ƒÀФÐ
ƒ¸°‘ÐسР»Ðõ´º¸°�¦ÐÔÀФÐÔ £ÄÑö¸°‘ѧ–ÐÎÐ ‘ЛÙÓ§ ƒµÐÀÑ „�¦ÐÔÔ‘Ðê¤ÐÔ, „ÌѤÐ, ¹Ñ–Ч‘Ð
ÊФн¤Ñ¡Ô ÀÐÔ³ÐÔê –ÑõÌБФРÀÐôÀÐÌѤЖÐÎÐ …ÄÑ”Ù, ¾Ù�–ÐÎÐÖ¤ÐÔ …ÀФР‘ЛÙÓ§�¦ÐÔÅö¤ÐÔÀÐ
Tender Box ¹ÐÅö º–и³Ð ¸¹Ñ�‘Ð ÀÐÔ³ÐÔê ÊÐÀÐÔ�¦ÐÔ·ÙÖÎЖ٠ÌÑ‘ÐÔÀÐÕ·ÐÔ.
2) ³Ð®ÐÀÑ— ƒµÐÀÑ º–и³Ð ƒÀи°�¦ÙÖÎЖї Ë÷Ó‘ÐسÐÀізРƒ£þ–ÐÎйÐÔî ´¤ÐÊÐܧÊÐÄÑ–ÐÔÀÐÕ·ÐÔ.
3) ¾°Ñ¤Ð³Ð „ÌѤРº–ÐÀÐÔ·Ð ‡–Ñõ±¸�·Ð/ÊБÐܤ٠‘Ñ”Ñþ¹Ù–ÐÏ�·Ð £ÄÑö¸°‘ѧ–ÐÎÐÔ ÊÐ֜˷Ð
ÊÐëÎБÙÜ ƒ´Ó ‘ЯÀÙÔ ƒ�³Ð¤Ð·Ð�³Ù º–и»Ð¯Ë·Ð ÀЦіÐþ¹Ð‘Ùù�¦ÐÔ »Ðõ‘ѤÐÀÑ—�¦ÙÔÓ „ÌѤз°Ñ¹Ðô /
ÊБÐܤÙ�¦ÐÔ¹ÐÔî ÊÑ—ÊÐÔÀÐÕ·ÐÔ.
4) ªÙ•®Ð¤ÐԷѤФÐÔ ³ÑÀÙÓ ÊÐ÷³Ð: ƒµÐÀÑ ƒÀФРƒ¸°‘ÐسР»Ðõ´º¸°•¦ÐÔÔ ªÙ•®Ð¤ÐÔ–ÐÎйÐÔî ³Ù¤Ù•¦ÐÔÔÀÑ–Ð
ÌÑ¡§¤Ð¾ÙÓ‘ÐÔ. …›ÙᕦÐÔÔÎÐüÀФÐÔ „�¦ÐÔÔ‘Ðê¤ÐÔ, „ÌѤÐ, ¹Ñ–Ч‘Ð ÊФн¤Ñ¡Ô ÀÐÔ³ÐÔê –ÑõÌБФÐ
ÀÐôÀÐÌѤЖÐÎÐ …ÄÑ”Ù, …ÀФР‘ЛÙÓ§�¦ÐÔÅö …§ÊÐÄÑ—¤ÐÔÀÐ Tender Box ƒ¹ÐÔî ³Ù¤Ù�¦ÐÔÔÀÐ
ÊЕ·Ð¾°Ðþ·ÐÅö ÌÑ¡§¤Ð½ÌÐÔ·ÐÔ.
5) „�¦ÙÔÜ�¦Ð¦Ñ·Ð –ÐÔ´ê–ٷѤФÐÔ º–и³Ð ¸¹Ð–ÐÎÙÖÎЖї ŠÄÑö ÈФгÐÔê–ÐÎйÐÔî »ÐÖ¤ÙÚË ÊіѱґÙ
–ÐÔ´ê–Ù �»Ðï�·ÐÀйÐÔî ÀЦѯ‘ÙÖÎÐü³Ð‘ÐÜ·ÐÔì.
6) Êіѱґ٠–ÐÔ´ê–Ù •»Ðï•·ÐÀÑ·Ð ¹Ð•³Ð¤Ð –ÐÔ´ê–ٷѤФÐÔ ‘ÙÃÊÐ ºÀÐþÍÊÐÃÔ ƒÊÐÀÐÔµÐþ¤Ñ·ÐÅö
ÌÑ–ÐÖ „ÌѤÐ, ¹Ñ–Ч‘Ð ÊФн¤Ñ¡Ô ÀÐÔ³ÐÔê –ÑõÌБФРÀÐôÀÐÌѤЖÐÎÐ …ÄÑ”Ù�¦ÐÔ �»Ðï�·Ð·ÐÅö
¹ÙÖ•·Ð±Ò•¦Ð¦Ñ—¤ÐÔÀÐ Äѧ–ÐÎйÐÔî ÊБÑþ¤Ð·Ð „·ÙÓÆзРÌÙ֤гÐÔ …³Ð¤Ù �»Ðï�·Ð–ÐÏ–Ù
‡»Ð�¦ÙÖÓ—Ë·ÐÅö ƒ�µÐÀФР¾°Ð·Ðõ³Ñ ¬ÙÓÀбÒ�¦ÐÔ¹ÐÔî ÀÐÔÔ©Ôå–ÙÖÓÃÔ ÌÑ’‘ÙÖÎÐüÄÑ–ÐÔÀÐÕ·ÐÔ
ÌÑ–ÐÖ ‘лÐÔï »Ð«å–Ù ÊÙÓ§ÊÐÃÔ ‘ÐõÀÐÔÀÐÍÊÐÄÑ–ÐÔÀÐÕ·ÐÔ.

48
7) Êіѱґ٠�¼ï–Ù•¦Ð¦Ñ—¤ÐÔÀÐ –ÐÔ´ê–ٷѤФÐÔ „ÌѤз°Ñ¹Ðô/ÊБÐܤÙ�¦ÐÔ¹ÐÔî ÌÐ�œ‘Ù ÌÑ’·Ð ¸ÀÐÊЖ
ÐÎÐÅö Êіѱґ٠ÀЦѮоÙÓ‘ÐÔ. ³Ð¼ï·ÐÅö »Ðõ´�¦Ð¦Ñ— „ÌѤз°Ñ¹Ðô–ÐÎйÐÔî Êіѱґ٠ÀЦѮÐÔÀÐÕ·Ð
§•·Ñ–ÐÔÀÐ ÌÙ›ÐÔàÀЧ ¹ÐÈÐåÀйÐÔî –ÐÔ´ê–ٷѤЧ�·Ð ƒÀФР´�–ÐϹР¿Äý¹ÐÅö ‘Я³Ð–ÙÖÏË
ÀÐÊÐÖÅ ÀЦѮÐÄÑ–ÐÔÀÐÕ·ÐÔ.
8) Êіѱґ٠–ÐÔ´ê–ٷѤФї ¹ÙÓÀÐԑЖÙÖ•®Ð ÊіѱґٷѤФÐÔ ÊБÑþ¤Ð¸�·Ð ÀÐÔ�¡Ö¤Ñ·Ð …³Ð¤Ù
‘Ñ�¦ÐÔþ‘ÐõÀÐÔ–ÐÎÐ „ÌѤз°Ñ¹Ðô–ÐÎйÐÔî ÊÐÌÐ ÊзЧ ·Ð¤Ð·ÐÅö•¦ÙÔÓ Êіѱґ٠ÀЦѮоÙÓ‘Ñ–ÐÔ³Ðê·Ù.
„·Ð¤Ù, …·Ð‘ÙÜ �¦Ð¦ÑÀÐÕ·ÙÓ ‘кÈÐæ »ÐõÀЦѱ·Ð „ÆÑ÷ÊйÙ�¦ÐÔ¹ÐÔî ÊБÑþ¤Ð ºÓ®ÐÔÀÐÕ¸Ãö.
9) Êіѱґ٠–ÐÔ´ê–Ù ¹ÙÓÀÐÔ‘Ñ´ „·ÙÓÆÐÀйÐÔî ÌÑ¡¤ÐԻЯ˷Р¹Ð�³Ð¤ÐÀÙÓ ÊіѱґÙ�¦ÐÔ
‘Ñ�¦ÐÔþ‘ÐõÀÐÔÀйÐÔî »Ñõ¤Ð�¿°ÊгБÐÜ·ÐÔì. –ÐÔ´ê–ٷѤФї ¹ÙÓÀÐԑЖÙÖ•®Ð ÊіѱґٷѤФÐÔ º–
и°³Ð ƒÀи°�¦ÙÖÎЖ٠¾°Ð·Ðõ³Ñ ¬ÙÓÀбÒ, ¾Ñô�‘ý –Ñô¤Ð�«, ‘ФѤÐÔ �»Ðï�·Ð »Ð³ÐõÀйÐÔî
ÌÑ¡¤ÐԻЯÊи·ÐìÅö ƒ�³ÐÌÐÀФРÀÐÔÔ�–ЮР¬ÙÓÀбÒ�¦ÐÔ¹ÐÔî ÊБÑþ¤Ð‘ÙÜ ÀÐÔÔ©Ôå–ÙÖÓÃÔ ÌÑ‘ÐÄÑ–
ÐÔÀÐÕ·ÐÔ ÌÑ–ÐÖ ÊзЧ�¦ÐÔÀФР¹ÙÓÀÐÔ‘Ñ´�¦ÐÔ¹ÐÔî ¤Ð·ÐÔì»Ð¯Ë ÌÙÖÊзї ªÙ•®Ð¤ÐÔ »Ðõ’õ�¦ÙÔ�¦ÐÔ¹ÐÔî
»Ñõ¤Ð•¿°ÊÐÄÑ–ÐÔÀÐÕ·ÐÔ.
10) ªÙ•®Ð¤ý ·Ñ¤Ð¤ÐÔ ••·ÙÓ ¹ÙÖ�·Ð±Ò ÊÐ�”Ùô�¦ÐÔ Äѧ–ÐÎйÐÔî ³ÙÖÓ§Ë ¾ÙÓ¤Ù ¾ÙÓ¤Ù £ÄÙö–ÐÎÐÅö ÊЖ
Ð©Ô Êіѱґ٠ƒµÐÀÑ –ÑõÀЦѕ³Ð¤Ð Êіѱґٖ٠ƒ£þ ÊÐÅöË L1 ªÙ�®Ð¤ý·Ñ¤Ð¤Ñ— „�¦ÙÔÜ�¦Ð¦Ñ—
·ÐìÅö ƒµÐÀÑ��·ÙÓ £ÄÙö�¦ÐÔ ÊÐ–Ð©Ô Êіѱґ٠ÀÐÔ³ÐÔê –ÑõÀЦѕ³Ð¤Ð Êіѱґ٠Š¤Ð®Ð¤ÐÃÖö L1
ªÙ•®Ð¤ý·Ñ¤Ð¤Ñ—·Ðì¤Ù •¦Ð¦ÑÀÐշѷФÐÖ ••·ÐÔ Êіѱґ٠‘Ñ�¦ÐÔþ ºÀÐþÍÊÐÃÔ ƒÌÐþ¤Ñ—
¤ÐÔ³Ñê¤Ù. ÊзЧ•¦ÐÔÀФÐÔ ³Ù¤ÐÀÐÕ –ÙÖÏË·Ð £ÄÙö/³ÑÃÖö‘ÐÔ–ÐÎÐÅö¹Ð L2 ªÙ•®Ð¤ÐԷѤФÐÔ L1 ·Ð¤Ð–
ÐÏ–Ù �¼ï‘ÙÖ�®ÐÅö ƒÀФÙÖ�¸–Ù Êіѱґ٠–ÐÔ´ê–Ù ‘Ñ�¦ÐÔþ ºÀÐþÍÊÐÃÔ �»Ðï•·Ð ÀЦѯ
‘ÙÖÎÐüÄÑ–ÐÔÀÐÕ·ÐÔ
11) ªÙ�®Ð¤ý �»Ðï�·ÐÀÑ·Ð ¹Ð�³Ð¤Ð �¦Ð¦ÑÀÐÕ·ÙÓ ƒÀÐôÀÐÌѤЖÐÎÐÅö ƒµÐÀÑ „ÌѤР·°Ñ¹Ðô ÊіѱґÙ
ÊÐ�½�·°Ð ƒ»Ð¤Ñ·°Ð »Ðõ‘Фб–ÐÎÐÅö ¾°Ñ—•¦Ð¦Ñ—¤ÐÔÀФÙ�·ÐÔ ‘Ð�®ÐÔ½�·ÐÅö Êиõ ªÙ�®Ð¤ÐԷѤФÐ
�»Ðï�·ÐÀйÐÔî ¤Ð·ÐÔì»Ð¯Ë ….Š�.¯ ÌÑ–ÐÖ ¾°Ð·Ðõ³Ñ ¬ÙÓÀбҕ¦ÐÔ¹ÐÔî ÀÐÔÔ©Ôå–ÙÖÓÃÔ
ÌÑ’‘ÙÖÎÐüÄÑ–ÐÔÀÐÕ·ÐÔ, ÌÑ–ÐÖ ‘лÐÔï »Ð«å–Ù ÊÙÓ§ÊÐÃÔ ‘ÐõÀÐÔÀÐÍÊÐÄÑ–ÐÔÀÐÕ·ÐÔ.
13) �¦Ð¦ÑÀÐÕ·ÙÓ ƒ£þ Ë÷Ó‘ÐسÐÀіи¤ÐÔÀÐ, Ë÷Ó‘ÐسÐÀÑ—¤ÐÔÀÐ ŠÄÑö ƒ£þ–ÐÎÐÔ ´¤ÐÊÐÜسЖÙÖ•®Ð,
��·ÙÓ ƒ£þ Ë÷Ó‘ÐسÐÀÑ—¤ÐÔÀÐ ÌÑ–ÐÖ ��·ÙÓ ƒ£þ ƒÌÐþÀÑ—¤ÐÔÀÐ ÊЕ·Ð¾°Ðþ–ÐÎÐÅö
ªÙ•®Ð¤ÐÔ–ÐÎйÐÔî ´¤ÐÊÐܧË, ÌÙÖÊзї ÀÐÔ¤ÐÔ ªÙ�®Ð¤ý ‘ФÙ�¦ÐÔÄÑ–ÐÔÀÐÕ·ÐÔ.
14) ªÙ�®Ð¤ÐԷѤФÐÔ ‘Ñà ‘ÑÑÙÜ º–и°»Ð¯ÊÐÔÀÐ º•¦ÐÔÀÐÔ ÀÐÔ³ÐÔê º·ÙþÓÆйЖÐÎйÐÔî
»ÑÅÊгБÐÜ·ÐÔì.
15) Êіѱґ٠ÀЦѮоÙÓ‘Ñ·Ð „ÌѤз°Ñ¹Ðô–ÐÎÐ »ÐõÀЦѱÀÐÕ ƒ�·Ñ¢Ñ—·ÐÔì, º–и³ÐÀÑ—
¤ÐÔÀÐÕ¸Ãö.
16) „ÌѤÐ, ¹Ñ–Ч‘Ð ÊФн¤Ñ¡Ô ÀÐÔ³ÐÔê –ÑõÌБФРÀÐôÀÐÌѤЖÐÎÐ …ÄÑ”ÙÂÔ�·Ð £ÄÑöÀѤÐÔ
º–и»Ð¯Ë¤ÐÔÀÐ –ÙÖÓ·ÑÀÐÔÔ-1 §�·Ð ÀЦѳÐõ „ÌѤз°Ñ¹Ðô–ÐÎйÐÔî Š³ÐÔêÀÐÏ ÀЦѮÐÔÀÐ ƒÀБÑÆÐ
ªÙ•®Ð¤ÐԷѤЧ–Ù ºÓ¯·ÐÔì, ��·ÐÔ »Ð‘Ðù ¾°Ñ¤Ð³Ð „ÌѤРº–ÐÀÐÔÀÐÕ, –ÙÖÓ·ÑÀÐÔ¹ÐÔî ½·ÐÅË

49
„ÌѤР¿®ÐԖЮ٠(Releasing order) „·ÙÓÆÐÀйÐÔî ÌÙ֤Я˷ÐÅö, ‘ÙÓÀÐà –ÙÖÓ·ÑÀÐÔÔ 1¤Ð
ƒ�³Ð¤Ð‘ÙÜ ÀЦѳÐõ »ÑÀд ÀЦѮÐÃÔ �»Ðï�·Ð·ÐÅö ´ÏÊÐÔÀÐÕ·ÐÔ.
17) Äѧ–ÐÏ–Ù ÌÐÎи ½±éÀйÐÔî ÌÑ‘ÐÔÀÐ º½�·Ð¹Ù–Ù ªÙ•®Ð¤ý ·Ñ¤Ð¤Ð¹ÐÔî •ÎлЯÊÐÄÑ—·Ù.…·Ð‘ÙÜ
³Ð–ÐÃÔÀÐ ÀÙ›ÐàÀйÐÔî ªÙ�®Ð¤ý ·Ñ¤Ð¤Ù ¾°Ð§ÊгБÐÜ·ÐÔì. »Ðõ´ Äѧ–ÐÎÐ ÀÙÔÓÄÙ ÊÑÀÐþ¡º‘Ð »Ð¯³Ð¤Ð
Á³Ð¤Ð²Ù Äѧ Š�·ÐÔ ½¤ÙÊгБÐÜ·ÐÔì.
IV.ªÙ�®Ð¤ý ÌÑ‘ÐÔÀÐÕ·ÐÔ :
1. ªÙ�®Ð¤ÐԷѤФÐÔ ‘ЮÑ畦ÐÔÀÑ— ÊБÐܤ٠ÌÑ–ÐÖ „ÌѤз°Ñ¹Ðô–ÐÎÐ Êіѱґ٠ªÙ�®Ð¤ÐÔ–ÐÎÐÅö
¾°Ñ–ÐÀÐÍÊÐÔÀÐÕ·ÐÔ.
2. ªÙ�®Ð¤ý ÌÑ‘ÐÃÔ …›Ùá�¦ÐÔÔÎÐüÀФÐÔ £ÄÑö¸°‘ѧ–ÐÎÐÔ (ƒÌѤÐ) __________£ÄÙö …ÀФÐ
ÌÙÊЧ¹ÐÅö ¤ÐÖ.5,000.00 (¤ÐÖ. Œ·ÐÔ ÊÑÁ¤Ð–ÐÎÐÔ ÀЦѳÐõ) –ÐÎÐ Crossed ¯ÀЦÑô•®ý
®Ñõ»°ýå¹ÐÔî ¤ÑÉåÿõÓ‘ÐسР¾Ñô�‘ÐÔ/ÊÐÌБѤР¾Ñô�‘ý/ÆÙ®ÐÖôÄýç ¾Ñô�‘ýº�·Ð »Ð®Ù·ÐÔ ¸¹Ñ�‘Ð
__________§�·Ð ¸¹Ñ�‘Ð ____________¤ÐÀФٖ٠‘ÙÃÊзРÀÙÓÎÙ�¦ÐÔÅö £ÄÑö¸°‘ѧ –
ÐÎÐÔ („ÌѤÐ) __________£ÄÙö …ÀЧ–Ù ÊÐÅöË ªÙ•®Ð¤ý »°Ñ¤Ð•¹ÐÔî »Ð®Ù•¦ÐÔ ½ÌÐÔ·Ñ—
·Ù.
3. ¾°Ð´þ ÀЦѯ·Ð ÀÙÖÌФѷРªÙ•®Ð¤ý »°Ñ¤Ð•–ÐÎйÐÔî “Ô·Ñì— £ÄÑö¸°‘ѧ–ÐÎÐÔ
_____________£ÄÙö ¤ÐÀФР‘Ð�ÙÓ§�¦ÐÔÅö ƒµÐÀÑ „�¦ÐÔÔ‘Ðê¤ÐÔ, „ÌѤÐ, ¹Ñ–Ч‘Ð ÊФн¤Ñ¡Ô
ÀÐÔ³ÐÔê –ÑõÌБФРÀÐôÀÐÌѤЖÐÎÐ …ÄÑ”Ù, ¾Ù�–ÐÎÐÖ¤ÐÔ …ÀФР‘ЛÙÓ§�¦ÐÔÅö …§ÊÐÄÑ—¤ÐÔÀÐ
Tender Box ¹ÐÅö ¸¹Ñ�‘Ð __________ ¤Ð ÊÐ�¢Ù 5.00 ˜Ð�ªÙ �¦ÙÖÎЖї ÌёгБÐÜ·ÐÔì.
4. ªÙ•®Ð¤ÐÔ ÊÐÅöÊÐÔÀÐ ÊЕ·Ð¾°Ðþ·ÐÅö ªÙ�®Ð¤ÐԷѤФÐÔ ‘ÐÀЧ¹Ð (cover)
ÀÙÔÓÄÙ“__________£ÄÙö•¦ÐÔ ÊÐ–Ð©Ô Êіѱґ٠ªÙ�®Ð¤ý ƒ£þ” Š�·ÐÔ ·Ð»Ðï ƒ‘Ðù¤Ð–ÐÎÐÅö
¹ÐÀÐÔÔ¸ÊгБÐÜ·ÐÔì.
5. ªÙ�®Ð¤ý »Ðõ’õ�¦ÙÔ�¦ÐÔÅö Š¤Ð®ÐÔ Ã‘ÙÖÓªÙ »Ð·Ðí´�¦ÐÔ¹ÐÔî (Two cover system) ƒÎÐÀЯÊÐÄÑ—
¤ÐÔ³Ðê·Ù. ÑÙÖÓªÙ 1 - …·ÐÔ Technical Bid–Ù ÊЕ½•¸°Ë·ÐÔì, ¹ÐÀÐÔÖ¹Ù 1 §•·Ð 6 –ÐÎйÐÔî
ÌÑ–ÐÖ ƒ·Ð‘ÙÜ ÊÐ�½�¸°Ë·Ð ·Ñ“ÄÙ »Ð³Ðõ–ÐÎйÐÔî •ÎЖÙÖ•¯¤ÐÔ³Ðê·Ù. ÑÙÖÓªÙ 2 - …·ÐÔ
commercial bid –Ù ÊÐ�½�¸°Ë·ÐÔì, …·ÐÔ ªÙ�®Ð¤ÐԷѤФÐÔ ºÓ®ÐÔÀÐ Êіѱґ٠·Ð¤Ð–ÐÎйÐÔî
•ÎЖÙÖ•¯¤ÐÔ³Ðê·Ù. …·Ð‘ÑÜ— ¹ÐÀÐÔÖ¹Ù 7 (ƒ) ÀÐÔ³ÐÔê („) –ÐÎйÐÔî ‡»Ð�¦ÙÖÓ—ÊÐÔÀÐÕ·ÐÔ.
V (a) Š¤Ð®ÐÔ Ã‘ÙÖÓªÙ »Ð·Ðì´ (Two cover system)
ªÙ�®Ð¤ý »Ðõ’õ�¦ÙÔ�¦ÐÔÅö Š¤Ð®ÐÔ Ã‘ÙÖÓªÙ »Ð·Ðí´�¦ÐÔ¹ÐÔî (Two cover system)
ƒÎÐÀЯÊÐÄÑ—¤ÐÔ³Ðê·Ù ÀÙÖ·ÐùÙ�¦ÐÔ Ã‘ÙÖÓªÙ�¦ÐÔÅö ªÙ�®Ð¤ý ƒ£þ ¹ÐÀÐÔÖ¹Ù 1, 2, 3, 4, 5, 6 ¹ÐÔî
¾°Ð´þ ÀЦѯ † ‘ÙÎБÐ�®Ð ·Ñ“ÄÙ/»Ð֤БР·Ñ“ÄÙ–ÐÎйÐÔî ÖдêÊÐÔÀÐÕ·ÐÔ.

50
1) ….Š�.¯ ÀÙÖ³Ðê - ¤ÐÖ.2,50,000.00 (¤ÐÖ.Š¤Ð®ÐÔ Ã‘Ðù·Ð ŒÀгÐÔê ÊÑÁ¤Ð–ÐÎÐÔ ÀЦѳÐõ) –ÐÏ–
Ù £ÄÑö¸°‘ѧ–ÐÎÐÔ („ÌѤÐ) _____________£ÄÙö ¤ÐÀФРÌÙÊЧ–Ù ¤ÑÉåÿõÓ‘ÐسÐ/ÊÐÌБѤÐ
¾Ñô�‘ý/ÆÙ®ÐÖôÄýç ¾Ñô�‘ýº�·Ð »Ð®Ù·Ð ¯ÀЦÑ�®ý ®Ñõ»°ýå
2) 3 ÀÐÈÐþ·Ð Êіѱґ٠ƒ¹ÐÔ¾°ÐÀзР·Ðد°Ó‘Фб »Ð³Ðõ (³Ñ�´õ‘Ð ÈФдê¹ÐÅö ´ÏˤÐÔÀÐ�³Ù)
3) Äѧ–ÐÎÐ ·Ñ“ÄÙ »Ð³Ðõ–ÐÎÐÔ - RC »ÐÔÊÐê‘Ð ÀÐÔ³ÐÔê Register B extract ¹Ð ·Ðد°Ó‘ÐسР»Ðõ´–ÐÎÐÔ
4) „¶þ‘Ð Ë봖д ÀÐÔ³ÐÔê ÊÑÀÐÔµÐôþ·Ð ·Ðد°Ó‘Фб »Ð³Ðõ–ÐÎÐÔ - Solvency Certificate ¹ÐÔî
¤ÐÖ. 5.00 ÑÐù–ÐÏ–Ù ¤ÑÉåÿõÓ‘ÐسÐ/¯.Ë.Ë ¾Ñô�‘ý/ÆÙ®ÐÖôÄýç ¾Ñô�‘ý º�·Ð »Ð®Ù·ÐÔ
ÊÐÅöÊÐÔÀÐÕ·ÐÔ. (ÀÐÔÖà »Ðõ´)
5) 3 ÀÐÈÐþ·Ð „·Ñ�¦ÐÔ ³Ù§–Ù »ÑÀд–Ù ÊЕ½•¸°Ë·Ð returns ¹Ð ·ÐØ °̄Ó‘ÐسР»Ðõ´–ÐÎÐÔ (Ìб‘ÑÊÐÔ
ÈФдê¹ÐÅö ´ÏˤÐÔÀЕ³Ù)
6) ÊÙÓÀÑ ³Ù§–Ù ¹ÙÖÓ•·Ð±Ò »ÐõÀЦѱ »Ð³Ðõ·Ð »Ðõ´ ÌÑ–ÐÖ Í•¸¹Ð 3 ÀÐÈÐþ–ÐÎÐ ÊÙÓÀÑ ³Ù§–Ù
return ¹Ð ·ÐدӑÐسР»Ðõ´.
7) ÀÐô’ê–гÐ/»ÑÃԷѧ‘Ù ÊÐ�ÊÙë�¦ÐÔÔ ›Ñ©þ®ýþ ƒ‘Û�ªÙ�ªý ƒÀЧ�·Ð ·ÐدӑФб–ÙÖ•®Ð
Í•¸¹Ð 3 ÀÐÈÐþ·Ð Balance Sheet ÀÐÔ³ÐÔê ÄѾ°Ð ¹ÐÈÐå·Ð ³Ð:”Ùê�¦ÐÔ¹ÐÔî ÖдêÊгБÐÜ·ÐÔì.
(·ÐدӑЧ˷Р•Ñ•¦Ð¦Ñ »Ðõ´ )
8) ªÙ•®Ð¤ý¹ÐÅö ¾°Ñ–ÐÀÐÍÊÐÔÀÐÀФÐÔ ³ÑÀÐÕ ÌÑ–ÐÖ ³ÐÀÐÔó ‘ÐÔ©Ô�½·Ð ÊзÐÊÐô¤ÐÔ ¹Ñô�¦Ð¦ÑÃ�¦ÐÔ·Ð
ÀÐÔÔ�·Ù �¦Ð¦ÑÀÐÕ·ÙÓ „ÌѤз°Ñ¹Ðô–ÐÎÐ ·ÐÔ¤ÐԻЕ¦ÙÖӖзР½–ÙÞ ’õÁÔ¹ÐÄý ÀÙ֑зÐìÀÙÔ–ÐÎйÐÔî
ÌÙÖ•¸ÃöÀÙ•½ ½–ÙÞ, »ÙÖÓÅÓÊý, „ÌѤР…Äє٠ƒµÐÀÑ �¦Ð¦ÑÀÐÕ·ÙÓ …ÄÑ”Ù�¦ÐÔÅö
Essential Commodities Act¹Ð ƒ¯�¦ÐÔÅö �¦Ð¦ÑÀÐÕ·ÙÓ ÀÙ֑зÐìÀÙÔ�¦ÐÔ¹ÐÔî ÌÙÖ�¸ÃöÀÙ�½
½–ÙÞ, �¦Ð¦ÑÀÐÕ·ÙÓ ÊБÑþ§ …ÄÑ”Ù/ º–ÐÀÐÔ/”ÑÊЗ ÊЕÊÙë–ÐÎÐÅö ‘лÐÔï »Ð«å–Ù
ÊÙÓ§ÃöÀÙ•½ ½–ÙÞ, »ÐõÀЦѱ »Ð³Ðõ ÌÑ–ÐÖ affidavit ÖдêÊÐÔÀÐÕ·ÐÔ.
9) ªÙ•®Ð¤ÐԷѤФР…´êÓœ¹Ð »ÑÊý»ÙÖÓªýþ ÊÙÚ¢ý 2 ¾°ÑÀÐœ³Ðõ–ÐÎÐÔ ÌÑ–ÐÖ ªÙ�®Ð¤ý ƒ£þ
¹ÐÀÐÔÖ¹Ù 1§�·Ð 6 ¤ÐÅö ÊÐ֜ˤÐÔÀÐ ŠÄÑö »Ð֤БР·Ñ“ÄÙ ÁÀФЖÐÎйÐÔî ÖдêÊÐÔÀÐÕ·ÐÔ.
10) Š¤Ð®Ð¹Ù�¦ÐÔ Ã‘ÙÖÓªÙ�¦ÐÔÔ (Financial bid) ªÙ�®Ð¤ÐԷѤФÐÔ ºÓ®ÐÔÀÐ Êіѱґ٠·Ð¤Ð–ÐÎйÐÔî
•ÎЖÙÖ•¯¤ÐÔ³Ðê·Ù. …·Ð‘ÑÜ— ªÙ�®Ð¤ý ƒ£þ ¹ÐÀÐÔÖ¹Ù 7(ƒ) ÀÐÔ³ÐÔê („) –ÐÎйÐÔî ¾°Ð´þ ÀЦѯ
ÊÐÅöÊÐÔÀÐÕ·ÐÔ.
11) ªÙ•®Ð¤ÐԷѤФÐÔ “__________£ÄÙö•¦ÐÔ ÊÐ–Ð©Ô Êіѱґ٠ªÙ�®Ð¤ý ƒ£þ” Š�·ÐÔ ·Ð»Ðï
ƒ‘Ðù¤Ð–ÐÎÐÅö ½¤Ù�¦ÐÔÄѷРÑÙÖÓªÙ–ÐÎÐÅö »Ðõ³ÙôÓ‘ÐÀÑ— ¹ÐÀÐÔÖ¹Ù 1 §�·Ð 6 ÀÐÔ³ÐÔê 7 (ƒ)
ÀÐÔ³ÐÔê („)–ÐÎйÐÔî ¾°Ð´þ ÀЦѯ »Ðõ³ÙôÓ‘ÐÀÑ— ÀÙÖÌФÐÔ ÀЦѯ·Ð ÑÙÖÓªÙ–ÐÎÐÅö ÌÑ’, ƒÀÐÕ–
ÐÎйÐÔî ¾ÙÓ¤ÙÖ�·ÐÔ ‘ÐÀФý¹ÐÅö©Ôå, ÀÙÔÓŹР‘ÐÀФйÐÔî ËÓÄý ÀЦѯ ªÙ�®Ð¤ý »Ù«å–Ù•¦ÐÔÅö
ÌёгБÐÜ·ÐÔì. ÑÙÖÓªÙ –ÐÎйÐÔî ÊЧ•¦Ð¦Ñ— ËÓÄý ÀЦѮи·ÐìÅö ƒµÐÀÑ ËÓÃÔ „‘ÐËó‘ÐÀÑ—
³Ù¤Ù·ÐÔÌÙÖÓ·ÐÅö ÊЕ½•·°Ð»Ð©å ªÙ•®Ð¤ÐԷѤФÙÓ ÌÙֲٖѤФї¤ÐÔ³Ñê¤Ù.
12) 2 ÑÙÖÓªÙ »Ð·Ðì´•¦ÐÔÅö ´ÏˤÐÔÀÐ ÌÑ–ÐÖ Ã–Ð´êÊоÙÓ‘Ñ—¤ÐÔÀÐ ·Ñ“ÄÙ–ÐÎÐÔ ÊЕ»ÐÖ±þ
Ìб‘ÑÊÐÔ ÌÑ–ÐÖ ³Ñ�´õ‘Ð ÈФдê¹ÐÅö ´ÏˤÐÔÀÐ�³Ù »Ð֤БÐÀÑ—¤Ð¾ÙÓ‘ÐÔ.

51
V (b) Êіѱґ٠·Ð¤Ð:
1. „ÌѤз°Ñ¹Ðô–ÐÎÐ Êіѱґ٠·Ð¤ÐÀйÐÔî »Ðõ´ ’÷�ªÑÄý/»Ðõ´ ’.ÁÔÓ/ »Ðõ´Ó ÊÑöÿô¾ý–ÐÎÐÅö
¹ÐÀÐÔÖ¹Ù 7(„) ¤ÐÅö ºÓ®Ð³Ð‘ÐÜ·ÐÔì. …·Ð¤ÐÅö ÄÙÖÓ¯�–ý, ƒ¹ý ÄÙÖÓ¯�–ý, ÊÙÓÀÑ ³Ù§–Ù
ÀÐÔ³ÐÔê …³Ð¤Ù ŠÄÑö ³Ù§–Ù ÌÑ–ÐÖ »ÑõÊЕ—‘Ð ÀÙ›Ðà–ÐÎÐÔ ÊÙÓ§¤Ð¾ÙÓ‘ÐÔ.
2. ÊБÐܤ٠Êіѱґ٠·Ð¤Ð–ÐÎйÐÔî »Ðõ´ ’.ÁÔÓ, »Ðõ´ ’÷�.–Ù ÊÑöÿô¾ý (slab) »Ð·Ðì´•¦ÐÔ•³Ù ¹ÐÀÐÔÖ¹Ù
7 („) ¤ÐÅö ºÓ®Ð³Ð‘ÐÜ·ÐÔì. …·Ð¤ÐÅö ÄÙÖÓ¯�–ý, ƒ¹ý ÄÙÖÓ¯�–ý, ÊÙÓÀÑ ³Ù§–Ù ÀÐÔ³ÐÔê …³Ð¤Ù
ŠÄÑö ³Ù§–Ù ÌÑ–ÐÖ »ÑõÊЕ—‘Ð ÀÙ›Ðà–ÐÎÐÔ …·Ð¤ÐÅö ÊÙÓ§¤Ð¾ÙÓ‘ÐÔ.
3. ªÙ�®Ð¤ÐԷѤФÐÔ ‘ЮÑ畦ÐÔÀÑ— ¹ÐÀÐÔÖ¹Ù 7 (ƒ ÀÐÔ³ÐÔê „) –ÐÎйÐÔî ¾°Ð´þ ÀЦѮгБÐÜ·ÐÔì.
�¦Ð¦ÑÀÐշѷФÙÖ�·ÐÔ ¹ÐÀÐÔÖ¹Ù�¦ÐÔ¹ÐÔî ”ÑÅ ¿«å·ÐìÅö ƒ·Ð¹ÐÔî ƒ»ÐÖ±þ ƒ£þ�¦ÙÔ�·ÐÔ
»Ð§–бÒË ´¤ÐÊÐܧÊÐ ÄÑ–ÐÔÀÐÕ·ÐÔ. …·Ð‘ÙÜ „�¦Ð¦Ñ ªÙ�®Ð¤ÐԷѤФÐÔ ÌÙֲٖѤФї¤ÐÔ³Ñê¤Ù.
4. „ÌѤз°Ñ¹Ðô ÀÐÔ³ÐÔê ÊБÐܤ٠ÊіѱґÙ�¦ÐÔ¹ÐÔî »Ðõ³ÙôÓ‘ÐÀÑ— »Ð§–бÒË, ³ÐÔù٠ÀЦѯ
»Ðõ³ÙôÓ‘ÐÀÑ— »Ð§–бÒË, ³ÐÔù٠ÀЦѯ L1 ÌÑ–ÐÖ L2 ªÙ�®Ð¤ÐԷѤФйÐÔî „�¦ÙÔÜ ÀЦѮÐÄÑ–
ÐÔÀÐÕ·ÐÔ.
5. ÊБÐܤ٠Êіѱґ٠–ÐÔ´ê–ٷѤФйÐÔî ‘ÙÓÀÐà KFCSC –Ù ÀЦѳÐõ ƒ¹Ð÷ÂÔÊÐÄÑ–ÐÔÀÐÕ·ÐÔ. ‡Ï·Ð
ÊÐ–Ð©Ô ¹ÑÁÔº·Ñ¤Ð¤ÐÔ ÊБÐܤ٠Êіѱґٖ٠³ÐÀÐÔó·ÙÓ Êіѱґ٠ÀÐôÀÐÊÙë ÀЦѯ‘ÙÖÎÐÔüÀÐÕ·ÐÔ
ÌÑ–ÐÖ ÀÙÔÓŹЕ³Ù º–и»Ð¯Ë·Ð ·Ð¤Ð–ÐÎйÐÔî ÀЦѳÐõ ºÓ®ÐÄÑ–ÐÔÀÐÕ·ÐÔ.
VI. ÀÙÓÎÑ »Ð«å:
‘Ðõ.
ÊЕ.
ÁÀФР¸¹Ñ�‘Ð
1 ªÙ�®Ð¤ý »Ðõ‘Щ²Ù ºÓ®ÐÔÀÐÕ·ÐÔ 22-08-2009
2 ªÙ�®Ð¤ý ·Ñ“ÄÙ–ÐÎÐ Á³Ð¤Ð²Ù „¤Ð�¾°Ð 25-08-2009
2Š ªÙ�®Ð¤ý ·Ñ“ÄÙ–ÐÎÐ Á³Ð¤Ð²Ù–Ù ‘ÙÖ¹Ù�¦ÐÔ
¸¹Ñ�‘Ð
14-09-2009
3 ¾°Ð´þ ÀЦѯ·Ð ªÙ•®Ð¤ý »°Ñ¤Ð•–ÐÎÐ ÊÐÅö‘Ù 15-09-2009
4 ªÙ•®Ð¤ý ³Ù¤Ù•¦ÐÔÔÀÐÕ·ÐÔ
Technical bid
17-09-2009 ¾ÙÏ–ÙÞ 11.00 –ЕªÙ–Ù
Commercial Bid 17-09-2009 ÊÑ�¦ÐÔ�‘Ñà 4.00 –ЕªÙ–Ù
5 –ÐÔ´ê–ٷѤЧ–Ù •»Ðï�·Ð ÀЦѯ‘ÙÖÎÐüÃÔ
¹ÙÖÓ«ÓÊÐÔ ¢Ñ§ ÀЦѮÐÔÀÐÕ·ÐÔ.
26-09-2009
6 Êіѱґ٠–ÐÔ´ê–Ù •»Ðï�·Ð‘ÙÜ ÊÐÍ
ÀЦѮÐÔÀÐÕ·ÐÔ
29-09-2009

52
7 Êіѱґ٠–ÐÔ´ê–Ù ¢Ñ§–Ù ½¤ÐÔÀÐÕ·ÐÔ 01-10-2009
ÀÙÔÓŹР¸¹Ñ�‘ЖÐÎЕ·ÐÔ ÊÑÀÐþ´õ‘Ð ¤Ð¢ÙÂÔ·ÐìÅö / ÊÑÀÐþ´õ‘Ð ¤Ð¢Ù�¦ÙÔ�·ÐÔ ˜ÙÖÓÈвÙ�¦Ð¦Ñ·ÐÅö
ƒ·Ð¤Ð ÀÐÔÔ�¸¹Ð ¸¹Ñ�‘ЖÐÎйÐÔî »Ð§–бÒÊÐÔÀÐÕ·ÐÔ.
VII. (a) ªÙ•®Ð¤ý »Ð§ÇÓÃ¹Ñ ÊÐÁÔ´: ªÙ•®Ð¤ÐÔ–ÐÎÐ »Ð§ÇÓùٖ٠† ‘ÙÎБÐ�®Ð ƒ °̧‘ѧ–ÐÎйÙÖîÎЖÙÖ•®Ð
ªÙ�®Ð¤ý »Ð§ÇÓÃ¹Ñ ÊÐÁÔ´ …¤ÐÔ³Ðê·Ù.
i) £ÄÑö¸°‘ѧ–ÐÎÐÔ, - ƒ·°Ðô‘Ðù¤ÐÔ
ii) ÀÐÔÔ“ô ‘Ñ�¦ÐÔþºÀÐþÌвѸ°‘ѧ, £ÄÑö »Ð�›Ñ�¦ÐÔ³ý - ‡»Ñ·°Ðô‘Ðù¤ÐÔ,
iii) £ÄÑö ÀÐôÀÐÊÑë»Ð‘ФÐÔ, ‘Ù.Š»°ý.Ë.ŠÊý.Ë - ÊзÐÊÐô¤ÐÔ
iv) »Ñõ·ÙÓÇ‘Ð Êѧ–Ù ƒ °̧‘ѧ - ÊзÐÊÐô¤ÐÔ
v) £ÄÑö ÀÐôÀÐÊÑë»Ð‘ФÐÔ, ‘Ù.ŠÊý.„¤ý.«.Ë - ÊзÐÊÐô¤ÐÔ
vi) ‡»Ðº½�·°Ð‘ФÐÔ, £ÄÑö ÊÐÌБѤРÊÐ�˜Ð - ÊзÐÊÐô¤ÐÔ
vii) ‡»Ðº·ÙþÓÆБФÐÔ, „.¹Ñ.ÊÐ.ÀÐÔ³ÐÔê –Ñõ.ÀÐô.…Äє٠- ÊзÐÊÐô ‘Ñ�¦ÐÔþ·ÐÇþ
(b) ªÙ•®Ð¤ÐÔ »Ð§ÇÓÃ¹Ñ ÊÐÁÔ´–Ù ÊÐ֛йٖÐÎÐÔ
1) ªÙ�®Ð¤ÐÔ »Ð§ÇÓÃ¹Ñ ÊÐÁÔ´�¦ÐÔÔ £ÄÑö ‘ЛÙÓ§�¦ÐÔÅö Ë÷ӑЧÊÐÄÑ—¤ÐÔÀÐ ªÙ•®Ð¤ÐÔ–ÐÎÐÔ ÌÑ–
ÐÖ „�¦ÐÔÔ‘Ðê¤ÐÔ, „ÌѤÐ, ¹Ñ–Ч‘Ð ÊФн¤Ñ¡Ô ÀÐÔ³ÐÔê –ÑõÌБФРÀÐôÀÐÌѤЖÐÎÐ …Äє٠…ÀФÐ
‘ЛÙÓ§�¦ÐÔÅö Ë÷ӑЧÊÐÄÑ—¤ÐÔÀÐ ªÙ•®Ð¤ÐÔ–ÐÎйÐÔî ÊÙÓ§Ë Ë÷Ó‘ÐسÐÀÑ—¤ÐÔÀÐ ŠÄÑö ªÙ�®Ð¤ÐÔ
‘ÐÀФÐÔ–ÐÎйÐÔî Š±ÒÊÐÔÀÐÕ·ÐÔ.
2) ÀÙÖ·ÐÃÔ ��·Ð¹Ù�¦ÐÔ Ã‘ÙÖÓªÙ�¦ÐÔ¹ÐÔî ³Ù¤Ù·ÐÔ ªÙ�®Ð¤ý ·Ñ“ÄÙ–ÐÎйÐÔî »Ð§ÇÓÅË ƒÌÐþ
ªÙ•®Ð¤ÐԷѤФР»Ð«å•¦ÐÔ¹ÐÔî ³Ð•¦Ð¦Ñ§ÊÐÔÀÐÕ·ÐÔ ÌÑ–ÐÖ »Ðõ‘ЫÊÐÔÀÐÕ·ÐÔ.
3) ƒ¹ÐÌÐþ–ÙÖ�®Ð ªÙ�®Ð¤ÐԷѤФР»Ð«å�¦ÐÔ¹ÐÔî »Ðõ³ÙôÓ‘ÐÀÑ— »Ð«å ÀЦѯ »Ðõ‘ЫÊÐÔÀÐÕ·ÐÔ.
4) ÀÙÔÓŹÐ�³Ù ³Ñ�´õ‘ÐÀÑ— ƒÌÐþ¤Ñ·Ð ªÙ•®Ð¤ÐԷѤФРŠ¤Ð®Ð¹Ù�¦ÐÔ Ã‘ÙÖÓªÙ�¦ÐÔ¹ÐÔî
³Ù¤Ù�¦ÐÔÔÀÐÕ·ÐÔ. ƒ¹ÐÌÐþ ªÙ�®Ð¤ÐԷѤФРŠ¤Ð®Ð¹Ù�¦ÐÔ Ã‘ÙÖÓªÙ�¦ÐÔ¹ÐÔî �¦Ð¦ÑÀÐÕ·ÙÓ ‘Ѥб‘ÙÜ
³Ù¤Ù•¦ÐԾѤзÐÔ.
5) ÑÙÖÓªÙ–ÐÎйÐÔî ³Ù¤Ù·Ñ·Ð ÀÙÔÓÄÙ ÊÐÁÔ´•¦ÐÔÔ ªÙ•®Ð¤ÐԷѤФÐÔ Ã–Ð´êË·Ð ·Ñ“ÄÙ–ÐÎйÐÔî
»Ð§ÇÓÅË »Ðõ´�¦ÙÖ½ñ ªÙ�®Ð¤ÐԷѤФРƒÌÐþ³Ù ÌÑ–ÐÖ ƒ·Ð‘ÙÜ ÊÐ�½�·°Ð»Ð©å�³Ù
Ç»°Ñ¤ÐÊÐú¹ÐÔî ¹ÐÀÐÔÖ¸ÊÐÔÀÐÕ·ÐÔ. † »Ð§ÇÓÃ¹Ñ ‘Ñ�¦ÐÔþ·Ð ¹Ð®ÐÀÐÏ–ÐÎйÐÔî
·Ñ“ÅÊÐÔÀÐÕ·ÐÔ.
£ÄÑö¸°‘ѧ–ÐÎÐÔ,
__________£ÄÙö.

53
8.10 Annexure 10: Tender Notification (Wholesale to FPD Transportation)
– Points of Difference
8.10.1 Technical Conditions:
1) ³ÑÃÖö’¹Ð ÀЦÑÌÙ�¦Ð¦Ñ¹Ð 6000 ’÷� —�³Ð ‘ЯÀÙÔÂÔ·ÐìÅö ‘кÈÐæ 10 ©¹ý ÊÑÀÐÔµÐôþ·Ð 8
Äѧ–ÐÎйÐÔî •·Ð—ÊоÙÓ‘ÐÔ. 4 Äѧ–ÐÎйÐÔî ³ÐÀÐÔó ÊÐ÷•³Ð ÌÙÊЧ¹ÐÅö ÌÙÖ�¸¤Ð ¾ÙÓ‘ÐÔ .
2) ³ÑÃÖö’¹Ð ÌÐ�œ‘Ù ÀЦÑÌÙ�¦Ð¦Ñ¹Ð 6000 ’÷�.—�³Ð ÌÙœà–ÙÂÔ·ÐìÅö ‘кÈÐæ 10 ©¹ÐÔî
ÊÑÀÐÔµÐôþ·Ð 10 Äѧ–ÐÎйÐÔî •·Ð—ÊоÙÓ‘ÐÔ. 5 Äѧ–ÐÎйÐÔî ³ÐÀÐÔó ÊÐ÷•³Ð ÌÙÊЧ¹ÐÅö
ÌÙÖ�¸¤Ð¾ÙÓ‘ÐÔ.
3) ªÙ�®Ð¤ÐԷѤФÐÔ ÊÐ�˜Ð/ »ÑÃԷѧ‘Ù ÊÐ�ÊÙë�¦Ð¦Ñ—·ÐìÅö Äѧ–ÐÎÐÔ ÊÐ�˜Ð/ÊÐ�ÊÙë�¦ÐÔ ÌÙÊЧ¹ÐÅö
ƒµÐÀÑ »ÑÃԷѤФРÌÙÊЧ¹ÐÅö …¤Ð³Ð‘ÐÜ·ÐÔì.
8.10.2 Commercial Conditions:
1) ….Š�.¯ ÀÙÖ³ÐêÀÑ— ¤ÐÖ.1.00 ÑÐù (¤ÐÖ. ��·ÐÔ Ã‘Ðù–ÐÎÐÔ ÀЦѳÐõ) ÀйÐÔî
¤ÑÉåÿõÓ‘ÐسÐ/ÊÐÌБѤР¾Ñô�‘ý/ÆÙ®ÐÔôÄýç ¾Ñô�‘ýº�·Ð £ÄÑö¸°‘ѧ–ÐÎÐÔ __________ ¤ÐÀФÐ
ÌÙÊЧ¹ÐÅö »Ð®Ù·Ð ‘ÑõÊý ÀЦѯ·Ð ¯ÀЦѕ®ý ®Ñõ»°ýå¹ÐÔî ªÙ•®Ð¤ý¹ÙÖ•¸–Ù ÊÐÅöÊгБÐÜ·ÐÔì.
2) ¤ÐÖ.2.00 ÑÐù–ÐÏ–Ù ¤ÑÉåÿõÓ‘ÐسР¾Ñô�‘ý/ÊÐÌБѤÐ/ ÈÙ®ÐÖôÄý ¾Ñô�’º�·Ð »Ð®Ù·Ð solvency
certificate ÊÐÅöÊÐÔÀÐÕ·ÐÔ.

54
8.11 Annexure 11: Wholesale Average Distance, Benchmark Rate over the
years and Agreed Rate for 2008-09

55
8.12 Annexure 12: Rural Transportation Average Distance, Bench Mark
Rates and Agreed Rate for the year 2008-09
Details of Rural Transportation Charges for the year 2008-09
S No. Districts Bench Mark Rates
Average
distance Agreed Rates
Transport
ation
Rate (per
km/qtl
Handlin
g
Charges
(per qtl)
Transportat
ion Rate
(per km/qtl
Handling
Charges (per
qtl)
I Bangalore Urban
1 Bangalore East 0.59 4 14.33 1.2 4.5
2 Anekal 0.59 4 10.98 1.2 4.5
3 Bangalore North 0.59 4 12.94 1.2 4.5
4
Bangalore North
Addl 0.59 4 15.43 1.2 4.5
5 Bangalore South 0.59 4 15.27 1.2 4.5
0.59 4 13.79 1.2 4.5
II Bangalore Rural
Magadi 0.63 4 20.67
1 Nelamangala 0.63 4 16.34 0.76 4
2 Devanahalli 0.63 4 29.55 0.76 4
3 Hosakote 0.63 4 13.59 0.76 4
4 Doddaballapura 0.63 4 15.59 0.76 4
0.63 4 19.148 0.76 4
III Bagalkot
1 Bagalkot 0.43 4 25.27 0.43 4
2 Jamakhandi 0.43 4 38.93 0.43 4
3 Mudhol 0.43 4 18.35 0.43 4
4 Bilagi 0.43 4 16.47 0.32 3.75
5 Hungunda 0.43 4 19.1 0.32 3.8
6 Badami 0.43 4 19.69 0.35 3.85
0.43 4 22.968 0.38 3.9
Similar figures are also available for the rest of the 27 districts.