Embed Size (px)
Citation preview
Optimization of a Membrane Filtration Process for Drinking Water Production using On-line Fluorescence and Permeate Flux measurements
R. H. Peiris*, H. Budman*, C. Moresoli* and R.L. Legge*
*Department of Chemical Engineering, University of Waterloo, 200 University Avenue West, Waterloo, ON, N2L 3G1 Canada
(Tel: 519-888-4567 ext. 36980; e-mail: [email protected]; [email protected]; [email protected]; [email protected])
(Invited for special session on Optimization & Control in Wastewater Treatment - IFAC World Conference 2011)
Abstract: The optimization of membrane filtration processes for controlling fouling is essential for the sustainable application of membrane processes in drinking water treatment applications. Natural organic matter (NOM) and colloidal/particulate matter are considered as the major membrane foulants and therefore their characterization is essential for implementing optimization strategies. In a previous work by the authors, a fluorescence-based modeling approach was developed for prediction of the fouling dynamics and for optimization of a bench-scale ultrafiltration (UF) membrane cross flow set-up for drinking water treatment. In this study, this model’s predictive ability was improved by updating the model parameters based on current process measurements. The Extended Kalman Filter (EKF) approach was used to achieve this objective. The EKF approach was implemented to accomplish online-adaptive estimation of key model parameters based on either current (time = t) UF flux measurements or principal component (PC) scores related to current fluorescence measurements of membrane permeate. The model predictions and the corresponding experimental UF flux data of different membrane fouling situations revealed that on-line permeate flux-based parameter adaptation result in improved model predictions as compared to PC scores’ based adaptation. The resulting model based estimator was then employed in the optimization of the UF process in which membrane back-washing times were estimated in order to achieve minimum energy consumption while ensuring maximum production of drinking water.
Keywords: drinking water treatment, fluorescence spectroscopy, Kalman filter, membrane filtration, prediction, principal component analysis, real-time optimization.
1. INTRODUCTION
Membrane processes are increasingly becoming a widespread approach to achieve better water quality in terms of improved removal of pathogenic organisms, bacteria, viruses and other harmful water-borne materials. Implementation and maintenance of membrane-based drinking water treatment processes are however often constrained by membrane fouling. Fouling in drinking water applications is mainly caused by the accumulation of natural organic matter (NOM) and colloidal/particulate matter on the surface and/or in the pores of the membranes (Saravia et al., 2006; Jermann et al., 2007). Fouling results in increased operational costs due to membrane permeate flux decline and/or higher trans-membrane pressure (TMP) requirements, frequent chemical cleaning of fouled membranes and shortened service life that eventually leads to membrane replacements.
Implementation of membrane fouling control approaches that are able to reduce the energy demand and other operational costs associated with fouling is therefore essential for ensuring sustainable operation of membrane-based drinking water treatment systems. The state-of-the-art fouling control strategies usually involve manipulating filtration processes
variables such as permeate and backwashing fluxes, the filtration and backwashing durations and the cross-flow velocities to optimize the operation of the membrane filtration systems (Seidel and Elimelech, 2002; Busch and Marquardt, 2009).
1.1 Foulant Species-based Modeling of Membrane Filtration
Optimization of a membrane filtration operation requires modeling approaches that are capable of predicting the membrane fouling behaviour into the future. This is because early prediction of the extent of membrane fouling behaviour, for given raw water serving as feed to the membrane operations, offers great opportunities for implementing efficient fouling control strategies. Due to the lack of understanding of various complex physicochemical phenomena involved in membrane fouling, most modeling approaches have resorted to simple mechanistic (Busch et al., 2007) or non-mechanistic approaches such as artificial neural networks (Delgrange-Vincent et al., 2000; Cabassud et al., 2002), empirical models (Shengji et al., 2008) and genetic programming (Lee et al., 2009). In these studies, membrane fouling was related to the temporal evolution of the membrane flux or TMP measurements and/or long-term
Preprints of the 18th IFAC World CongressMilano (Italy) August 28 - September 2, 2011
Copyright by theInternational Federation of Automatic Control (IFAC)
3783
membrane feed water quality parameters and operational data including turbidity, temperature, and dissolved organic carbon (DOC) content. However, these modeling approaches are not able to capture the dynamic changes in the different membrane foulant species in water and relate their individual and combined contributions to membrane fouling behaviour. Due to these reasons, the accuracy of predictions of membrane fouling that result from the changes in the feed water quality (i.e. changes in foulant species matrix) over longer time horizons and the success of the optimization strategies based on these predictions are not always guaranteed. In this context, the foulant species-based modeling approach introduced by Peiris et al. (2010a) for modeling of an ultrafiltration (UF) cross-flow membrane filtration process was shown to be suitable for accurately predicting different UF fouling situations, caused by changes in the foulant species matrix of feed water, over a long time horizon (up to 4 hours). The ability of this approach to predict/forecast membrane fouling based on the fluorescence excitation-emission matrix (EEM) measurements, captured at time = 15 min of the UF operation, allowed sufficient time for fouling control strategies to be implemented.
In this previous study by Peiris et al. (2010a), principal component analysis (PCA) and fluorescence EEMs approaches were used to characterize different foulant species in the membrane feed and permeate during the course of the UF process. Thus the original fluorescence EEM measurements were projected into principal components (PCs), which were physically related to major foulant species such as NOM and colloidal/particulate matter present in natural water. Subsequently, the accumulation of these foulant species on the surface and in the pores of the membrane was modeled based on a PC score balance for a given group of foulants. PC scores were used in these balances instead of foulant concentrations since the latter could not be directly measured.
1.2 Improving Model’s Predictive Power
However, with the above approach, model predictions generally appeared to somewhat deviate from the experimental flux measurements with increasing filtration time. This study proposes to improve the predictions by updating the model parameters based on either current UF flux measurements or PC scores related to fluorescence measurements. In this study, this model adaptation methodology was conducted using the Kalman filter approach. Since the foulant species-based membrane fouling modeling is highly non-linear, the Extended Kalman filter (EKF) method, capable of handling non-linear behaviour (Baratti et al., 1995; Dochain, 2003), was used. Specifically, the EKF approach was implemented to accomplish online-adaptive estimation of key model parameters based separately on current (time = t) (i) UF flux measurements and (ii) PC scores related to fluorescence measurements of membrane permeate. This proposed approach was then used for optimization of the UF process in which membrane back-washing times were calculated in order to achieve minimum energy consumption while ensuring maximum production of
drinking water. The model predictions obtained with and without the proposed online-adaptive approach are also compared.
2. MATERIALS AND METHODS
Grand River water (GRW) (Southwestern Ontario, Canada) was used in the filtration experiments. Experimental methods used in this study including pre-filtration of GRW, UF runs, and fluorescence analysis are similar to the previously described procedures and can be found in Peiris et al. (2010a; 2010b).
2.1 Bench-scale Membrane Filtration Set-up
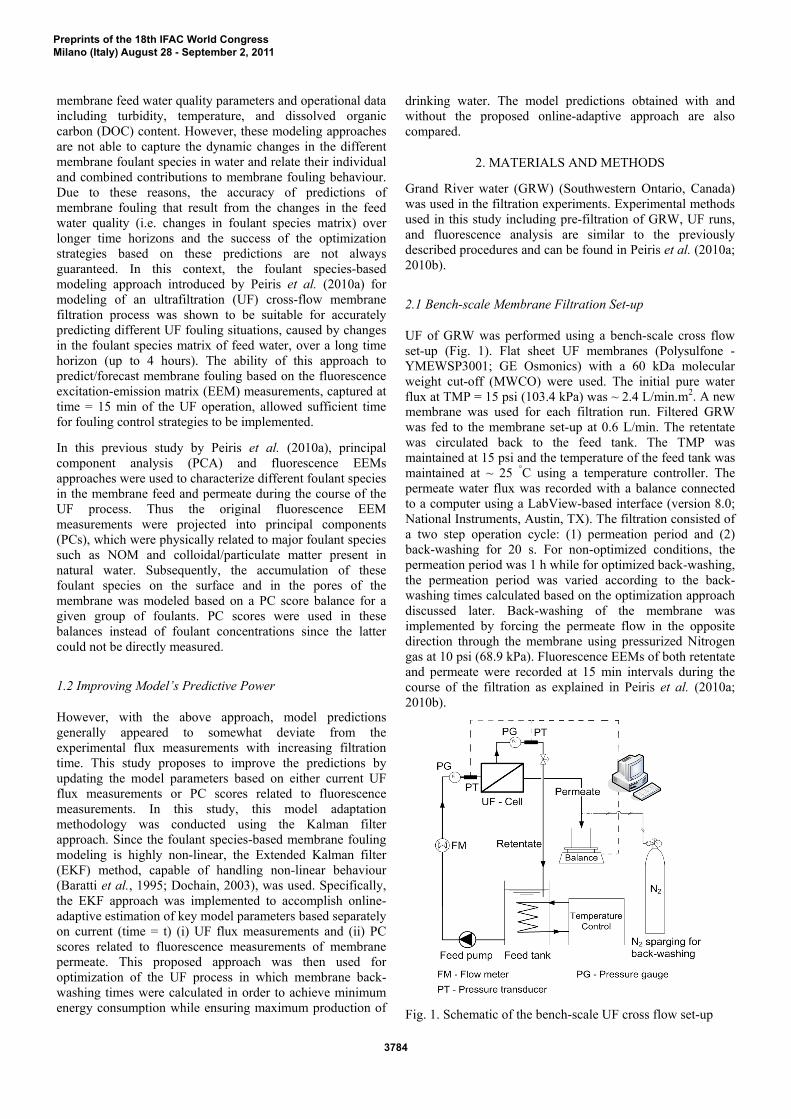
UF of GRW was performed using a bench-scale cross flow set-up (Fig. 1). Flat sheet UF membranes (Polysulfone - YMEWSP3001; GE Osmonics) with a 60 kDa molecular weight cut-off (MWCO) were used. The initial pure water flux at TMP = 15 psi (103.4 kPa) was ~ 2.4 L/min.m2. A new membrane was used for each filtration run. Filtered GRW was fed to the membrane set-up at 0.6 L/min. The retentate was circulated back to the feed tank. The TMP was maintained at 15 psi and the temperature of the feed tank was maintained at ~ 25 °C using a temperature controller. The permeate water flux was recorded with a balance connected to a computer using a LabView-based interface (version 8.0; National Instruments, Austin, TX). The filtration consisted of a two step operation cycle: (1) permeation period and (2) back-washing for 20 s. For non-optimized conditions, the permeation period was 1 h while for optimized back-washing, the permeation period was varied according to the back-washing times calculated based on the optimization approach discussed later. Back-washing of the membrane was implemented by forcing the permeate flow in the opposite direction through the membrane using pressurized Nitrogen gas at 10 psi (68.9 kPa). Fluorescence EEMs of both retentate and permeate were recorded at 15 min intervals during the course of the filtration as explained in Peiris et al. (2010a; 2010b).
Fig. 1. Schematic of the bench-scale UF cross flow set-up
Preprints of the 18th IFAC World CongressMilano (Italy) August 28 - September 2, 2011
3784
2.2 Fluorescence Data Pre-treatment and PCA
The fluorescence EEMs of both retentate (feed tank) and permeate were recorded every 15min during the course of the UF experiments. These fluorescence EEMs were then analyzed using PCA to extract PCs that are related to different foulant species present in water following the procedure described in Peiris et al. (2010b; 2010c). All computations were performed using the PLS Toolbox 5.8.2 (Eigenvector Research, Inc., Manson, WA) within the MATLAB 7.10.0 (R2010a) computational environment (MathWorks, Natick, MA).
3. ON-LINE ADAPTIVE MODEL PARAMETER ESTIMATION AND OPTIMIZATION
The PCs extracted were found to be related to humic substances-like, protein-like and particulate/colloidal foulants present in water and the scores of each PC can be considered as a qualitative measurement of the corresponding foulant component (Peiris et al., 2010b). Thus, the temporal evolution of the PC scores corresponding to both retentate and permeate can be used to calculate the accumulation of the different foulant species on the surface and/or in the pores of the membrane and consequently, model the fouling of membranes as previously described in detail (Peiris et al., 2010a), presented briefly here for completeness.
3.1 PC score-based Membrane Fouling Model
The accumulation of the foulant species (j) that contributes to fouling can be represented as follows:
−−
∆−= jPjRj
tM
Mj wLssRPAw
kVdtds
)()1(1,,
,
µ (1a)
MjRq
jwashj seeffmL tj,
−•
= (1b)
for j=1, 2, 3, ..., N and w = 0 or 1
Where sj is the PC score related to the jth foulant species. N is the number of PCs generated by PCA which were important for capturing the information related to the major groups of foulants species. Subscripts R, P and M denote retentate, permeate and the membrane, respectively. VM is the volume of the solution occupied by the membrane and k is a parameter that specifies the actual portion of VM that participates in the filtration. The membrane area, TMP and the water viscosity are denoted by symbols A, ΔP and μ respectively. is the mass flow rate used for periodic membrane back-washing, w is a binary variable that models permeation through the membrane (w=0) or back-washing (w=1). effj represents the efficiency at which the jth foulant fraction (i.e. jth PC) is removed during the back-washing. q is a parameter describing the decay of efficiency in back-washing over time due to irreversible fouling. Rt is the membrane resistance at time = t, which is given in terms of the scores as follows:
MparticcollMproteiner
N
jMjjt sssRR .,/.,.int
1,0 ×++= ∑
=
ββ (2)
R0 is the initial membrane resistance of the membrane before fouling occurs. βj, j=1, 2, 3, …, N are the model parameters. βinter is also a model parameter related to the interaction between protein and colloidal/particulate matter (represented by Sprotein,M and Scoll./partic.,M respectively) that contributes to membrane fouling (Peiris et al., 2010a).
Also, the processes involved in the transfer of membrane foulants from the retentate to the membrane or vice versa are quite complex involving deposition of foulants due to attractive forces and removal due to shear stresses acting on the foulant layers. Detailed modeling of these phenomena is difficult. Therefore, it was assumed that the net amount of foulant transfer from the retentate to the membrane is equal to the accumulation of foulants on the surface and/or in the pores of the membrane as follows:
)()( ,,,, PjRjt
MjRjj ssRPssD −
∆=−
µ (3)
Dj is the effective diffusivity coefficient of the jth foulant fraction. Dj is a lumped parameter that combines all possible mass transfer mechanisms involving the transfer of membrane foulants from the retentate to the membrane or vice versa. The permeate water flux through the membrane at time = t is given by:
tt R
PJµ∆
= (4)
The model estimates of Jt were generated by solving the above state space model given by the system of equations (1) - (4) using the MATLAB ordinary differential equation (ODE) solver “ode23.” The model parameters, k, β1, β2, β3, …, βN, βinter., eff1, eff2, eff3, …, effN and q were estimated by minimizing the sum of squares error (SSE) between experimental and model estimates of permeate water flux by using the MATLAB function “ga”, a genetic algorithm code available within the MATLAB computational environment.
For generating model predictions of the permeate flux over a future time horizon, the following empirical recursive function (equation (5)) that updates the model parameter Dj, at time = t was used in the previous study by Peiris et al. (2010a).
ttjjtj DzDzD ∆−+= ,2int,1, (5)
for j=1, 2, 3, ..., N
Where Dj,t is the value of Dj at time = t, Dj,int = is the initial estimate of Dj and Dj, t -Δt is the value of Dj at time t = t - Δt. Δt is the constant time step length used by the ODE solver. Z1 and Z2 are parameters that were estimated by minimizing the SSE between model estimates and measured permeate water flux using a genetic algorithm approach as mentioned above.
Preprints of the 18th IFAC World CongressMilano (Italy) August 28 - September 2, 2011
3785
Dj,int was calculated based on the initial fluorescence EEMs of retentate and permeate captured at time = 15 min. sj,R was assumed to be constant and equal to the values obtained at time = 15 min during the prediction period as the change in sj,R was observed to be insignificant during the UF experiments. Thus it should be noted that in the previous study by Peiris et al. (2010a), only fluorescence measurements of the permeate and the retentate, obtained 15 minutes after the start of the operation was used for generating the model predictions of permeate flux in to the future.
3.2 EKF for On-line Adaptive Parameter Estimation
Equation (5) provides a predefined mechanism for updating Dj over time and is unable to provide on-line adaptation of Dj with respect to the changes in process output measurements. Therefore, instead of equation (5), in the current study, the EKF approach was implemented for on-line adaptive estimation of Dj following the procedure described in McAuley and MacGregor, (1991). This involved linearization of Equation (1) and (4) for model adaptation that was based on current (time = t) UF flux measurements as illustrated below.
)(,1)(,)(,)()(,)(,)1(, ),(tjtMjtMjtjtRjtMjtMj vssFssfs +
−+≈
∧∧
+ (6)
)(,2)(,)(,)()(,)(,)1( ),( tjtMjtMjtjtRjtMjt vssHsshJ +
−+≈
∧∧
+ (7)
Where v1,j(t) and v2,j(t) are process noise and measurement noise with covariance Qj and Rj, respectively for the jth foulant species. And also,
tdt
dssssf
tMjtMj ss
MjtMjtRjtMj ∆⋅
+=
∧=
∧∧
)(,)(,
,)(,)(,)(, ),( (8)
)()(,)(, ),( ttRjtMj Jssh =∧
(9)
)(,)(,)(,
)(,)(,
)(
),(
tMjtMj sstMj
tRjtMj
tj s
ssfF
∧=
∂
∂= (10)
)(,)(,)(,
)(,)(,
)(
),(
tMjtMj sstMj
tRjtMj
tj s
sshH
∧=
∂
∂= (11)
Also taking the partial derivative with respect to Dj,
)(,)(,)(,
)(,)(,)(
),(
tjtj DDtj
tRjtMjtjF D
ssfJ
∧=
∂
∂= (12)
Let
=
IJF
A tjFtjtj 0
)()()(
(13)
[ ])()()( tjHtjtj JHH = (14)
Then the recursive equations for the EKF algorithm are given by:
jtT
jttjtjttj QAPAP +⋅⋅=−−−
)()1|1()()1|( (15)
1)()1|()()()1|()( ][ −
−− += jtjT
ttjtjtjT
ttjt RHPHHPKj
(16)
)1|()()()|(][ −−= ttjtjtjttj PHKIP (17)
Where Pj is the state covariance matrix and Kj is the Kalman gain matrix related to the jth foulant species. The notation Pj(t|t-1) indicates the value of the state covariance matrix at time = t, given all the information up to time = t-1. This results in the adaptive estimate for Dj at time = t as follows:
][ ,)1|()1|()|( ttmttjttjttj JJKDD∧
−−
∧∧
−+= (18)
Where Jm.t and tJ∧
are the measured and estimated permeate water flux at time = t, respectively.
Similarly, for the adaptation that is based on the PC scores of the permeate, J is replaced by sp,j in the above system of equations (Equations 7, 9, 11 & 18). sp,j can be derived from Equation (3).
3.3 Optimization of the UF process
Using the above methodology (section 3.2), the permeate flux was predicted over a future time horizon with continuous parameter adaptation based on the current (time = t) process output measurements (permeate flux or PC scores of permeate). The total filtration time was limited to 267 min.
These model predictions were then used to optimize the UF process by manipulating the back-washing. This optimization approach was implemented by minimizing the following objective function (OF), subjected to the constraints listed in Peiris et al. (2010a).
productionWaternconsumptioEnergyOF = (19)
Where energy consumption and the water production for time duration = Δt is given by:
( )tR
tPAnconsumptioEnergyµ
∆∆=
2
(20)
Preprints of the 18th IFAC World CongressMilano (Italy) August 28 - September 2, 2011
3786
tAJproductionWater t ∆= (21)
To demonstrate the application of the proposed approach, the number of back-washing cycles was limited to four. This optimization was performed using the MATLAB function “ga” which was better able to handle the non-linear and non-smooth (due to back-washing) nature of the OF compared to other optimization approaches, and was therefore selected.
4. RESULTS AND DISCUSSION
4.1 PCA of Fluorescence EEM data
PCA analysis was performed on fluorescence EEM data obtained during 14 UF experiments with different feed water qualities. This process generated four statistically significant PCs, which were related to different foulant species such as humic-like, colloidal/particulate and protein-like substances, respectively (Peiris et al, 2010a). The scores (i.e. s1, s2, s3 and s4) of these PCs were therefore used as states in the PC-based dynamic fouling model presented in Equations (1) - (4).
4.2 Model Predictions
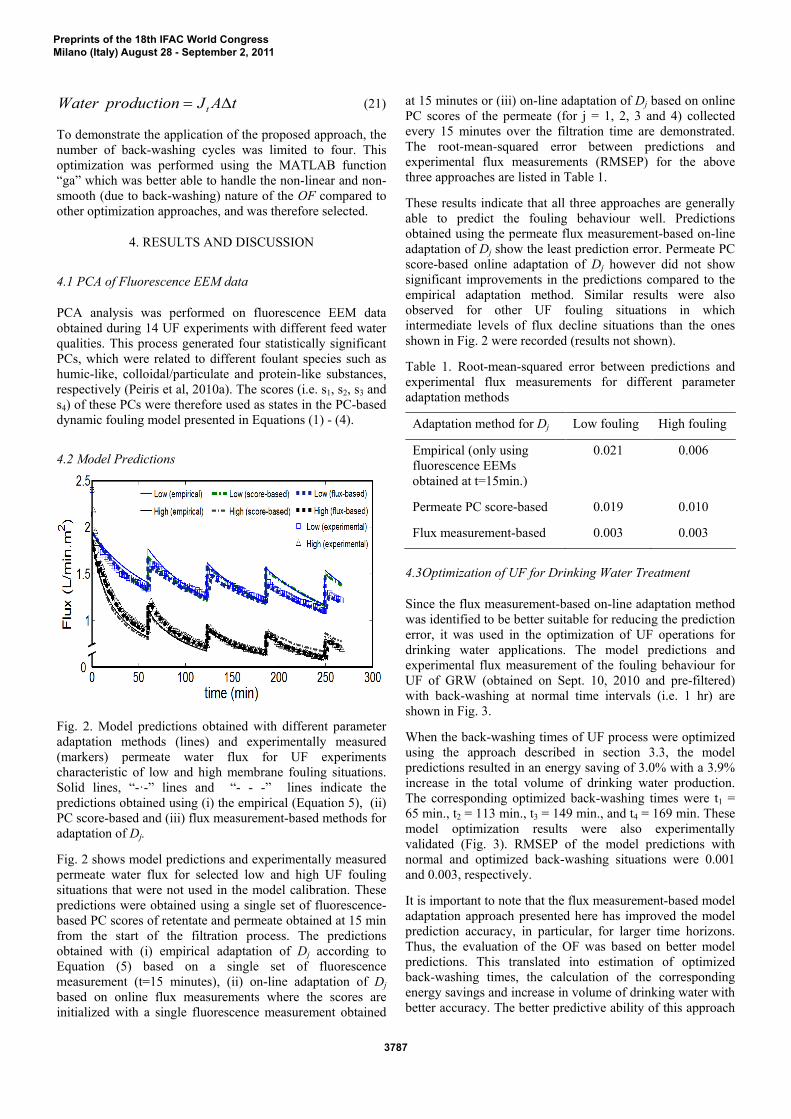
Fig. 2. Model predictions obtained with different parameter adaptation methods (lines) and experimentally measured (markers) permeate water flux for UF experiments characteristic of low and high membrane fouling situations. Solid lines, “-·-” lines and “- - -” lines indicate the predictions obtained using (i) the empirical (Equation 5), (ii) PC score-based and (iii) flux measurement-based methods for adaptation of Dj.
Fig. 2 shows model predictions and experimentally measured permeate water flux for selected low and high UF fouling situations that were not used in the model calibration. These predictions were obtained using a single set of fluorescence-based PC scores of retentate and permeate obtained at 15 min from the start of the filtration process. The predictions obtained with (i) empirical adaptation of Dj according to Equation (5) based on a single set of fluorescence measurement (t=15 minutes), (ii) on-line adaptation of Dj based on online flux measurements where the scores are initialized with a single fluorescence measurement obtained
at 15 minutes or (iii) on-line adaptation of Dj based on online PC scores of the permeate (for j = 1, 2, 3 and 4) collected every 15 minutes over the filtration time are demonstrated. The root-mean-squared error between predictions and experimental flux measurements (RMSEP) for the above three approaches are listed in Table 1.
These results indicate that all three approaches are generally able to predict the fouling behaviour well. Predictions obtained using the permeate flux measurement-based on-line adaptation of Dj show the least prediction error. Permeate PC score-based online adaptation of Dj however did not show significant improvements in the predictions compared to the empirical adaptation method. Similar results were also observed for other UF fouling situations in which intermediate levels of flux decline situations than the ones shown in Fig. 2 were recorded (results not shown).
Table 1. Root-mean-squared error between predictions and experimental flux measurements for different parameter adaptation methods
Adaptation method for Dj Low fouling High fouling
Empirical (only using fluorescence EEMs obtained at t=15min.)
0.021 0.006
Permeate PC score-based 0.019 0.010
Flux measurement-based 0.003 0.003
4.3Optimization of UF for Drinking Water Treatment
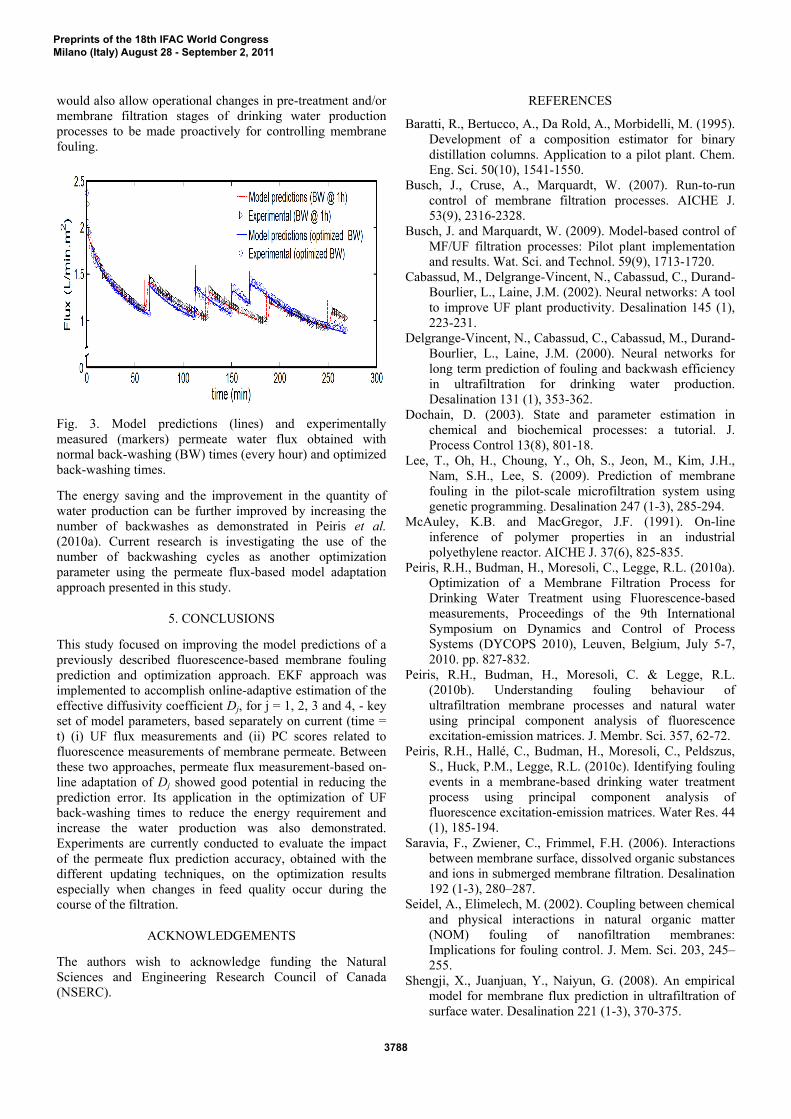
Since the flux measurement-based on-line adaptation method was identified to be better suitable for reducing the prediction error, it was used in the optimization of UF operations for drinking water applications. The model predictions and experimental flux measurement of the fouling behaviour for UF of GRW (obtained on Sept. 10, 2010 and pre-filtered) with back-washing at normal time intervals (i.e. 1 hr) are shown in Fig. 3.
When the back-washing times of UF process were optimized using the approach described in section 3.3, the model predictions resulted in an energy saving of 3.0% with a 3.9% increase in the total volume of drinking water production. The corresponding optimized back-washing times were t1 = 65 min., t2 = 113 min., t3 = 149 min., and t4 = 169 min. These model optimization results were also experimentally validated (Fig. 3). RMSEP of the model predictions with normal and optimized back-washing situations were 0.001 and 0.003, respectively.
It is important to note that the flux measurement-based model adaptation approach presented here has improved the model prediction accuracy, in particular, for larger time horizons. Thus, the evaluation of the OF was based on better model predictions. This translated into estimation of optimized back-washing times, the calculation of the corresponding energy savings and increase in volume of drinking water with better accuracy. The better predictive ability of this approach
Preprints of the 18th IFAC World CongressMilano (Italy) August 28 - September 2, 2011
3787
would also allow operational changes in pre-treatment and/or membrane filtration stages of drinking water production processes to be made proactively for controlling membrane fouling.
Fig. 3. Model predictions (lines) and experimentally measured (markers) permeate water flux obtained with normal back-washing (BW) times (every hour) and optimized back-washing times.
The energy saving and the improvement in the quantity of water production can be further improved by increasing the number of backwashes as demonstrated in Peiris et al. (2010a). Current research is investigating the use of the number of backwashing cycles as another optimization parameter using the permeate flux-based model adaptation approach presented in this study.
5. CONCLUSIONS
This study focused on improving the model predictions of a previously described fluorescence-based membrane fouling prediction and optimization approach. EKF approach was implemented to accomplish online-adaptive estimation of the effective diffusivity coefficient Dj, for j = 1, 2, 3 and 4, - key set of model parameters, based separately on current (time = t) (i) UF flux measurements and (ii) PC scores related to fluorescence measurements of membrane permeate. Between these two approaches, permeate flux measurement-based on-line adaptation of Dj showed good potential in reducing the prediction error. Its application in the optimization of UF back-washing times to reduce the energy requirement and increase the water production was also demonstrated. Experiments are currently conducted to evaluate the impact of the permeate flux prediction accuracy, obtained with the different updating techniques, on the optimization results especially when changes in feed quality occur during the course of the filtration.
ACKNOWLEDGEMENTS
The authors wish to acknowledge funding the Natural Sciences and Engineering Research Council of Canada (NSERC).
REFERENCES
Baratti, R., Bertucco, A., Da Rold, A., Morbidelli, M. (1995). Development of a composition estimator for binary distillation columns. Application to a pilot plant. Chem. Eng. Sci. 50(10), 1541-1550.
Busch, J., Cruse, A., Marquardt, W. (2007). Run-to-run control of membrane filtration processes. AICHE J. 53(9), 2316-2328.
Busch, J. and Marquardt, W. (2009). Model-based control of MF/UF filtration processes: Pilot plant implementation and results. Wat. Sci. and Technol. 59(9), 1713-1720.
Cabassud, M., Delgrange-Vincent, N., Cabassud, C., Durand-Bourlier, L., Laine, J.M. (2002). Neural networks: A tool to improve UF plant productivity. Desalination 145 (1), 223-231.
Delgrange-Vincent, N., Cabassud, C., Cabassud, M., Durand-Bourlier, L., Laine, J.M. (2000). Neural networks for long term prediction of fouling and backwash efficiency in ultrafiltration for drinking water production. Desalination 131 (1), 353-362.
Dochain, D. (2003). State and parameter estimation in chemical and biochemical processes: a tutorial. J. Process Control 13(8), 801-18.
Lee, T., Oh, H., Choung, Y., Oh, S., Jeon, M., Kim, J.H., Nam, S.H., Lee, S. (2009). Prediction of membrane fouling in the pilot-scale microfiltration system using genetic programming. Desalination 247 (1-3), 285-294.
McAuley, K.B. and MacGregor, J.F. (1991). On-line inference of polymer properties in an industrial polyethylene reactor. AICHE J. 37(6), 825-835.
Peiris, R.H., Budman, H., Moresoli, C., Legge, R.L. (2010a). Optimization of a Membrane Filtration Process for Drinking Water Treatment using Fluorescence-based measurements, Proceedings of the 9th International Symposium on Dynamics and Control of Process Systems (DYCOPS 2010), Leuven, Belgium, July 5-7, 2010. pp. 827-832.
Peiris, R.H., Budman, H., Moresoli, C. & Legge, R.L. (2010b). Understanding fouling behaviour of ultrafiltration membrane processes and natural water using principal component analysis of fluorescence excitation-emission matrices. J. Membr. Sci. 357, 62-72.
Peiris, R.H., Hallé, C., Budman, H., Moresoli, C., Peldszus, S., Huck, P.M., Legge, R.L. (2010c). Identifying fouling events in a membrane-based drinking water treatment process using principal component analysis of fluorescence excitation-emission matrices. Water Res. 44 (1), 185-194.
Saravia, F., Zwiener, C., Frimmel, F.H. (2006). Interactions between membrane surface, dissolved organic substances and ions in submerged membrane filtration. Desalination 192 (1-3), 280–287.
Seidel, A., Elimelech, M. (2002). Coupling between chemical and physical interactions in natural organic matter (NOM) fouling of nanofiltration membranes: Implications for fouling control. J. Mem. Sci. 203, 245–255.
Shengji, X., Juanjuan, Y., Naiyun, G. (2008). An empirical model for membrane flux prediction in ultrafiltration of surface water. Desalination 221 (1-3), 370-375.
Preprints of the 18th IFAC World CongressMilano (Italy) August 28 - September 2, 2011
3788