Embed Size (px)
Citation preview

Optimization of a Molten Salt Electrolytic Bath Geometry for RareEarth Metal Recovery using a Finite Element MethodHiroo Numataa, Hiroshi Akatsukab, and Haruaki Matsuurab
a Graduate School of Metallurgy and Ceramics Science, Tokyo Institute of Technology,2-12-1-S8-7, Ookayama, Meguro-ku, Tokyo 1528552, Japan
b Research Laboratory for Nuclear Reactors, Tokyo Institute of Technology, 2-12-1-N1-10,Ookayama, Meguro-ku, Tokyo 1528550, Japan
Reprint requests to H. M. and H. N; E-mail: [email protected] [email protected]
Z. Naturforsch. 68a, 48 – 58 (2013) / DOI: 10.5560/ZNA.2012-0106Received October 16, 2012 / published online February 15, 2013
For a recycling procedure for rare earths from spent hydrogen absorbing alloys by rare earths elec-trodeposition in a molten salt, the electrolytic bath and the cathode accessories have been optimizedby evaluating the appropriate secondary current distribution using finite element method (FEM) com-puter simulation. The desirable cathode dish as an accessory was designed to prevent drops of lessadherent electrodeposits, which improved the current density distribution compared with an a prioridetermined one. In the bath optimization, a reciprocal proportionality of the difference between themaximum and minimum current densities vs. the ratio of volume to surface area (or electrolyte vol-ume) was found. It was found by FEM that if a resistive floating mass is assumed on the electrolytesurface, the observed necking in the electrodeposit near the electrolyte surface can be analyzed.
Key words: Computer Simulation; Finite Element Method; Secondary Current Distribution; RareEarth; Molten Salt; Electrolytic Bath.
1. Introduction
The development of the molten salt industry hasbeen rather slow, mainly because of the difficult han-dling of these substances and a lack of scientific andengineering data. Even though computer simulationsare a promising tool, research and development workusing these techniques has been especially rare in thefield of electrochemistry of molten salts. Kobayashiet al. developed the two-dimensional finite elementmethod (FEM) program for analyzing the secondarycurrent distribution of the molten salt electrorefiner forthe nuclear fuel reprocessing plant [1].
An integrated pyroelectrochemical method for re-cycling rare earths from spent hydrogen absorbing al-loys, e.g., LaNi5, has been developed. The procedureconsists of the following three electrochemical pro-cesses, taking place in two electrolytic baths (Fig. 1in [1]) [2 – 4]:
(i) Rare earths are anodically electrodissolved intoa molten salt from spent hydrogen absorbing alloys
in the first bath. The electrolyte is a LiCl-KCl eutec-tic melt (LiCl-KCl in 59 : 41 mol %) at 793 K. In theanode basket, the rare earths preferentially dissolveinto the first bath. Electrodeposition Men+ + ne− →Me occurs on the cathode, where Me stands for lan-thanum, cerium, neodymium, and lanthanum–ceriumalloy. This method is interesting for obtaining an elec-trolyte rich in rare earths as the first step; thus the con-centrations of rare earths at the cathode are a little lessthan those in the anode area. The quality of the rareearths electrodeposits is nevertheless acceptable underan appropriate electrodeposition condition.
(ii) In the electromigration cell (coexisting in thefirst bath), the rare earth cations are then further con-centrated into the upper part of a column (one com-ponent of the electromigration cell) using the coun-tercurrent electromigration method [5]. The enrichedmelt with rare earths is transferred to the second bathby suction.
(iii) The rare earths are finally cathodically elec-trodeposited in a metallic form in the second bath.
© 2013 Verlag der Zeitschrift fur Naturforschung, Tubingen · http://znaturforsch.com
H. Numata et al. · Optimization of Molten Salt Electrolytic Bath Geometry for Rare Earth Metal Recovery 49
Then the same electrodeposition reaction of rare earthsoccurs on the cathode, where the electrolyte is muchenriched with the selected rare earths compared withthe first bath.
Hence, this method consists of two electrodeposi-tion processes in the different baths, where there maybe no significant difference in the electrodepositionconditions. So far, a preliminary experiment was con-ducted adopting a priori determined electrodepositionconditions (i.e. bath size and shape, electrolyte, elec-trolysis parameters, etc). Matsuura et al. reported thatrare earths were successfully electrodeposited fromspent hydrogen absorbing alloys using this trial elec-trodeposition condition, i.e. the bath being equippedwith a special cathode [2, 4]. As a result, a few unre-solved issues remained, mainly: less adherent and im-pure electrodeposits and a drop of electrodeposits.
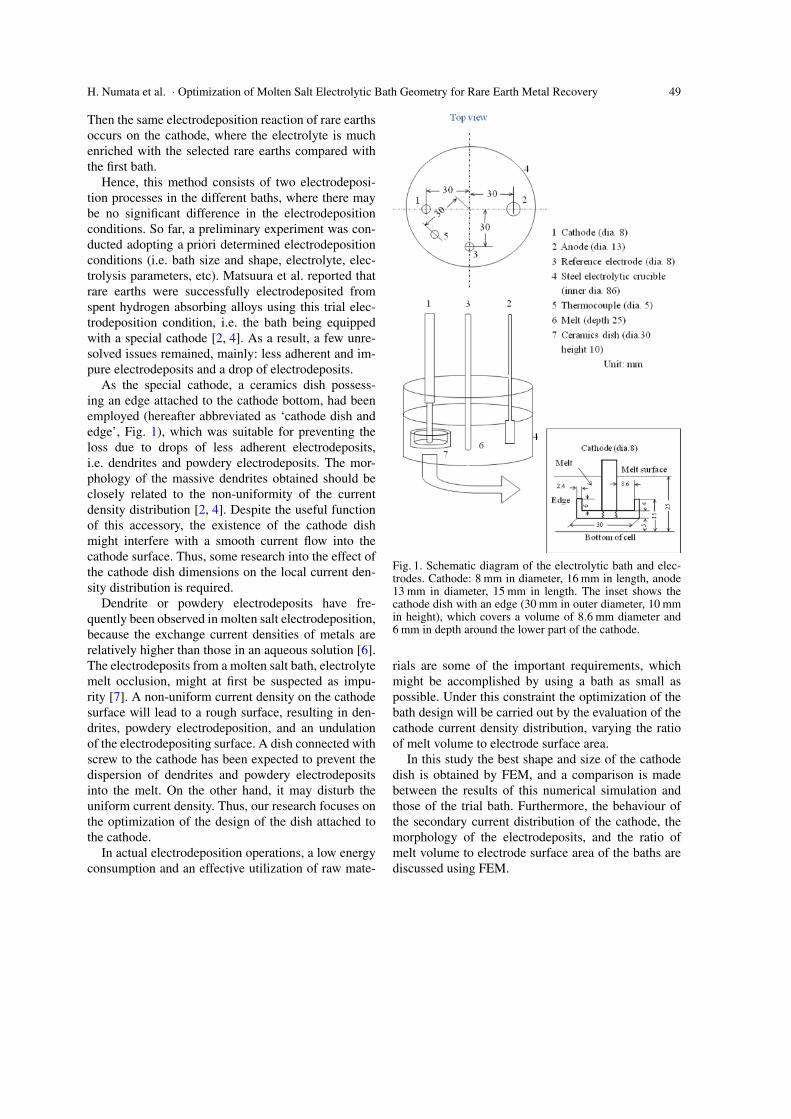
As the special cathode, a ceramics dish possess-ing an edge attached to the cathode bottom, had beenemployed (hereafter abbreviated as ‘cathode dish andedge’, Fig. 1), which was suitable for preventing theloss due to drops of less adherent electrodeposits,i.e. dendrites and powdery electrodeposits. The mor-phology of the massive dendrites obtained should beclosely related to the non-uniformity of the currentdensity distribution [2, 4]. Despite the useful functionof this accessory, the existence of the cathode dishmight interfere with a smooth current flow into thecathode surface. Thus, some research into the effect ofthe cathode dish dimensions on the local current den-sity distribution is required.
Dendrite or powdery electrodeposits have fre-quently been observed in molten salt electrodeposition,because the exchange current densities of metals arerelatively higher than those in an aqueous solution [6].The electrodeposits from a molten salt bath, electrolytemelt occlusion, might at first be suspected as impu-rity [7]. A non-uniform current density on the cathodesurface will lead to a rough surface, resulting in den-drites, powdery electrodeposition, and an undulationof the electrodepositing surface. A dish connected withscrew to the cathode has been expected to prevent thedispersion of dendrites and powdery electrodepositsinto the melt. On the other hand, it may disturb theuniform current density. Thus, our research focuses onthe optimization of the design of the dish attached tothe cathode.
In actual electrodeposition operations, a low energyconsumption and an effective utilization of raw mate-
Fig. 1. Schematic diagram of the electrolytic bath and elec-trodes. Cathode: 8 mm in diameter, 16 mm in length, anode13 mm in diameter, 15 mm in length. The inset shows thecathode dish with an edge (30 mm in outer diameter, 10 mmin height), which covers a volume of 8.6 mm diameter and6 mm in depth around the lower part of the cathode.
rials are some of the important requirements, whichmight be accomplished by using a bath as small aspossible. Under this constraint the optimization of thebath design will be carried out by the evaluation of thecathode current density distribution, varying the ratioof melt volume to electrode surface area.
In this study the best shape and size of the cathodedish is obtained by FEM, and a comparison is madebetween the results of this numerical simulation andthose of the trial bath. Furthermore, the behaviour ofthe secondary current distribution of the cathode, themorphology of the electrodeposits, and the ratio ofmelt volume to electrode surface area of the baths arediscussed using FEM.
50 H. Numata et al. · Optimization of Molten Salt Electrolytic Bath Geometry for Rare Earth Metal Recovery
Table 1. Input data for the calculations: average current densities, total currents, and time. The standard conditions are:1000 A m−2, 0.40 A, 7.2 s.
Physico-chemical properties of related materials at 600 oC
Electrode Electric conductance 1.754 ·107 S/m(La) Density 6150 kg/m3
Electrochemical equivalent 4.800 ·10−7 g/CCurrent efficiency 1.000
Electrolyte Electric conductance 246.9 S/mTemperature 600 CPolarization curve Multi point approximation from literatureCurrent density Average current density 1000 A m−2 as standard
Average current densities Total current Time∗
[A m−2] [A] [s]
1 100 0.040 722 200 0.080 363 500 0.200 14.44 1000 0.400 7.25 2000 0.800 3.6
∗ Total current and time are determined to maintain constant thickness.
2. Experimental
2.1. FEM Calculation
The full three-dimensional FEM simulation pro-gram (Electroplating Pilot System, Uyemura Co.) wasused for the analyses of the secondary current dis-tribution in the plating bath. It consists of FEMAP®
(for FEM model formation and presentation, StructureDynamics Research Co.) and EPPS® (for calculationand analysis, Uyemura Co.). This program is usefulfor obtaining quantitative time variations of compo-sition, thickness, and morphology of electrodeposits.The flow of the calculation procedure is as follows:
1. input physico-chemical properties, dimension ofthe bath and accessories, and operating conditions;
2. set initial values and boundary conditions, includ-ing constant anode and cathode potentials and polar-ization curves;
3. make a geometrical model of the bath and acces-sory used for a preliminary experiment;
4. divide objects into three-dimensional polyhedronfinite elements;
5. calculate secondary potential and current distri-butions;
6. check the convergence of the calculated data;7. output potential and current contours.As the boundary conditions, the electrode potentials
were set on all electrode surface elements and so werethe currents normal to the insulated walls of the bath.The thermocouple and the reference electrode were
given conductance zero as von Neumann’s condition(see also Tab. 1). The currents and potentials of all el-ements were determined by solving the Laplace equa-tion. Since the sets of currents and potentials were notlinear, the final values were determined by further cal-culations until the given convergence criteria were sat-isfied. In the convergence calculation, the average cur-rents of the anode and the cathode were preliminarilyobtained in order to adjust the sums of the currents forthese electrode elements. Then the calculations werecontinued until the summed currents of both electrodesreached values close to the input data within the givenallowance. Thus, this FEM calculation gave a simul-taneous solution for i (the secondary current), the po-tentials E of individual meshed elements, and the timevariations of the electrodeposits’ thickness under thegiven boundary conditions (Tab. 1). As shown above,the average current densities of both electrodes weregiven as the experimental parameters, ranging from100 to 2000 A m−2. The FEM calculation procedure isdescribed in detail elsewhere [8].
2.2. Electrodeposits Preliminary Obtained andExperimental Parameters for the Calculations
In the foregoing experiments electrodeposition [9]was performed adopting a priori determined standardconditions. However the shape of the electrodepositswas different between experiments and calculation.The experimental and calculated cross sectional pro-files of the electrodeposits are shown in Figure 2, one

H. Numata et al. · Optimization of Molten Salt Electrolytic Bath Geometry for Rare Earth Metal Recovery 51
Fig. 2. Dimension of the artificially introduced floating masspossessing a high resistance (shaded area assumed on thebasis of experiments; a = 22 mm, b = 2 mm, c = 1 mm) andthe electrodeposit obtained experimentally (solid line) andcalculated under standard conditions (dashed line). For clar-ification the distance of the solid and dashed lines from thecathode has been here chosen arbitrarily.
Fig. 3. Schematic drawing of the electrodeposition with thedish bottom at angle Ab (dashed line), the other experimentalparameters are: dish bottom width dw, edge height h, andedge angle Aa.
of these exhibits a necking, i.e. the phenomenon oflocal reduction of the diameters of the cylindrical cath-ode near the electrolyte surface. This necking is in-consistent with the profile calculated by FEM (dashedline), this implies an unidentified current flow distur-bance. In the following section, this will be eluci-dated by FEM calculations including a resistive float-ing mass. Except for the necking, the assumed cathodeform reproduced the experimentally obtained profilewell.
The dimensions and arrangement of the electrolyticbath are shown in Figure 1. The inset in Figure 1shows the dimension of the cathode together with thedish. The cathode dish should completely hold anydetached electrodeposits; otherwise, they would dis-turb the current flow into the cathode surface. Theelectrolysis conditions are given in Table 1. In Fig-ure 2, the current vectors show schematically the ioniccurrent-streams flow. In Figure 3, the parameters forthese FEM calculations were chosen as explained inthe Discussion section. In this study, the differencesbetween the maximum and minimum currents alongthe cathode were taken as a measure of the non-uniformity/uniformity of the secondary current densitydistribution.
3. Results and Discussion
3.1. Potential and Current Distributions ofCylindrical Cathode
Figure 4a shows the potential contour of the elec-trolyte surface and electrode circumference: the cath-ode (left hand side) and the anode (right hand side)under standard conditions. The potential (in V) is indi-cated by the color scale (scale bar shown on the right),referred to 0 V at the cathode surface. The shapes ofboth electrodes appear as empty cylinders embedded inthe electrolyte. At the cathode, the equipotential linesare distorted, whereas the potential contours of a pointcharge (or a charged cylinder) are radially expanded asshown in Figure 4b. However, instead of electric forcelines (defined to be orthogonal to equipotential lines),the current density distribution in a given volume ele-ment is considered in this paper (Appendix A).
The actual potential contours appear distorted; farfrom any radial symmetry (compare Figs. 4a and b).At the beginning of the calculations, the potential con-tours in Y -direction at both electrodes’ circumferences(upper and lower directions in the figure) were almostsymmetric with respect to the X-coordinate. This in-dicates that the existence of the reference electrodeand the thermocouple do not disturb the potential con-tour. Taking the bath shape into account as well as theelectrode arrangement with Y -symmetry (see Fig. 1top view), the potential distribution also exhibits Y -symmetry. The potential contours of both electrodesin X-direction (for clarification shown as rectanglesA and B in Fig. 4a) are denser than those shown as

52 H. Numata et al. · Optimization of Molten Salt Electrolytic Bath Geometry for Rare Earth Metal Recovery
Fig. 4 (colour online). Potential contour plot of the electrolyte surface and electrode circumference under standard conditions(a), and schematic potential contour plot and electric force lines of a point charge (b).
A′ and B′. This means that the electric force lines inthe vicinity of the cathode circumference are densest atthe position nearest to the countered electrode (anode).Going from A to A′, the density of the potential con-tours gradually decreases. The same is valid in the an-ode case. Comparing the behaviour at the cathode withthat at the anode at the nearest position to the counteredelectrode, that is A vs. B, the potential contours of thecathode are a little denser than those at the anode. Themajor part of the potential drops occurred around thecathode, and a further marked potential drop is con-centrated in the area close to the countered electrode(along the X-coordinate), compared with a relativelysmall potential drop at back side, due to the interfer-ence of the crucible wall.
We have focused on the thickness distribution ofthe electrodeposit, i.e. the current density distribu-tion along the Z-coordinate. Figure 5 shows the cur-rent density distribution (current contour, in A m−2)over the entire cathode surface at the standard cur-rent density 1000 A m−2, whereby the potential dropswere converted to secondary current densities obeyingOhm’s law (Appendix B). Similar to the potential con-tour, the calculated current densities at the front sideexhibit higher values than those at the back, upper, andlower sides. As shown in Figure 5, the current densitiesvary gradually from a minimum to a maximum withincreasing distance l (in mm) from the dish bottom.This current density distribution along the cathode re-veals that the undesired irregular electrodeposits actu-ally obtained are attributable to the non-uniformity ofthe current density along the cathode, described againbelow.
Fig. 5 (colour online). Current contour plot of the cylindricalcathode surface under standard conditions: average currentdensity 1000 A m−2. P indicates the points where the currentdensity distribution data are taken, called the front side. Thefront side (same as A in Fig. 4) is closest to the anode; theback side (same as A′ in Fig. 4) farthest to the anode andclose to the wall; the upper and lower sides exhibit interme-diate conditions between these two sides.
Fig. 6 (colour online). Current density ratio and thickness ofthe cathode surface at the front side vs. distance from thecathode dish bottom under standard conditions.

H. Numata et al. · Optimization of Molten Salt Electrolytic Bath Geometry for Rare Earth Metal Recovery 53
Figure 6 shows the current density ratios at the frontside of the cathode vs. the distance from the cath-ode dish bottom for different average current densities.Here, the longitudinal axis unit is the ratio r of the lo-cal to the average current density. The data points arethe nearest ones to the anode, i.e. at the front side, (Pindicated in Fig. 5). The data at the other positions (up-per, lower, and back sides) exhibit similar behaviour.The total ratio is set so that all positions around thecathode, at a given distance from the cathode dish bot-tom, should have values equal to unity. Thus, the aver-age ratio at a given position, e.g. at front side, pro-vides a measure of the extent to which the currentsare distributed. To avoid the influence of the edge onthe average ratio, these values, at the given positionranging from 6 up to 16 mm, were used for the eval-uation. Since all curves in Figure 6 are regarded as the’half wave’ common pattern (see below Section 3.2) ,the current density ratios at the front side decrease inthe order of 100, 200, 500, and 1000 A m−2, while thatof 2000 A m−2 shifts to lower values, below the otherones. Because the current density ratios of the formerare larger than one, a small amount of the current-streams turns around the cathode. Figure 6 reveals thatexcept for a current density close to 2000 A m−2, theamounts of the current-streams are nearly equal at thefront, upper, lower, and back sides. It is said that cur-rent densities a little below 2000 A m−2 give an ac-ceptable level and a radially even current distribution.As mentioned above, the effect of the imposed currentdensity on the current density distribution is thus elu-cidated, although the relation between the current den-sity ratios and the height of the cathode edge remainsat a qualitative level.
Figure 6 also shows the thickness of the electrode-posits, referred to on the right hand axis, as a func-tion of the average current densities. It seems that thethickness and the current density curves are identical.The thickness of electrodeposits is calculated, obeyingFaraday’s law, as follows. For a cathode element thethickness d of electrodeposit is calculated as
d = 10−3itM/(nFρ) , (1)
where i is the fixed current density, d is the thicknessof the electrodeposit (m), t is time (s), M is the atomicweight (for alloys the average atomic weight is used),ρ is the density (kg m−3), and nF is the electrochemicalequivalent (C mol−1).
0
0.002
0.004
2 4 8 10 12 14 16Distance from cathode dish bottom, l /mm
i = 100 Am- 2 , 72s2 , 36s
i = 500 Am- 2 , 14.4si = 1000 Am 2, 7.2si = 2000 Am - 2 , 3.6s
Top of dish edge
0.006
0.008
0.010
0 6Der
ivat
ive
of c
urre
nt d
ensi
ty ra
tio, ∂r/∂l
i = 200 Am-
-
Fig. 7 (colour online). Derivative of the cathode current den-sity ∂ r/∂ l vs. distance from the cathode dish bottom asa function of the average current densities.
Figure 7 shows the variation of the ratios of the cur-rent density vs. the distance (l/mm) from the bottom ofthe dish, that is ∂ r/∂ l. As shown in Figure 7, the dis-tance showing the maximum derivative value is coin-cident with that of the top position of the cathode dishedge (see also Fig. 3). It is apparent that the height h ofthe dish edge directly determines the dimension of thenon-uniformity area. On the other hand, the condition∂ r/∂ l = 0 at l = 0 and 16 mm assures the uniformityof the electrodeposit thickness at the bottom and topof the cathode. The electrodeposition should hence, intheory, proceed smoothly at the bottom and top of thecathode.
Through the analysis of the current contours it wasconfirmed that the current density distribution in the ra-dial direction was mostly attributable to the existenceof the crucible wall, while that along the cathode (inthe longitudinal direction) was determined by the in-fluence of the cathode edge.
3.2. Effect of Geometry of the Cathode Dish on theCurrent Density Distribution
First, as an inhomogeneous electrodeposit might beattributed to some non-uniformity of the secondarycurrent distribution, it is a key point to keep the cur-rent density homogeneous. With this in view, the di-mensions and the shape of the cathode dish (Fig. 3)were varied while evaluating the current densitydistribution.
54 H. Numata et al. · Optimization of Molten Salt Electrolytic Bath Geometry for Rare Earth Metal Recovery
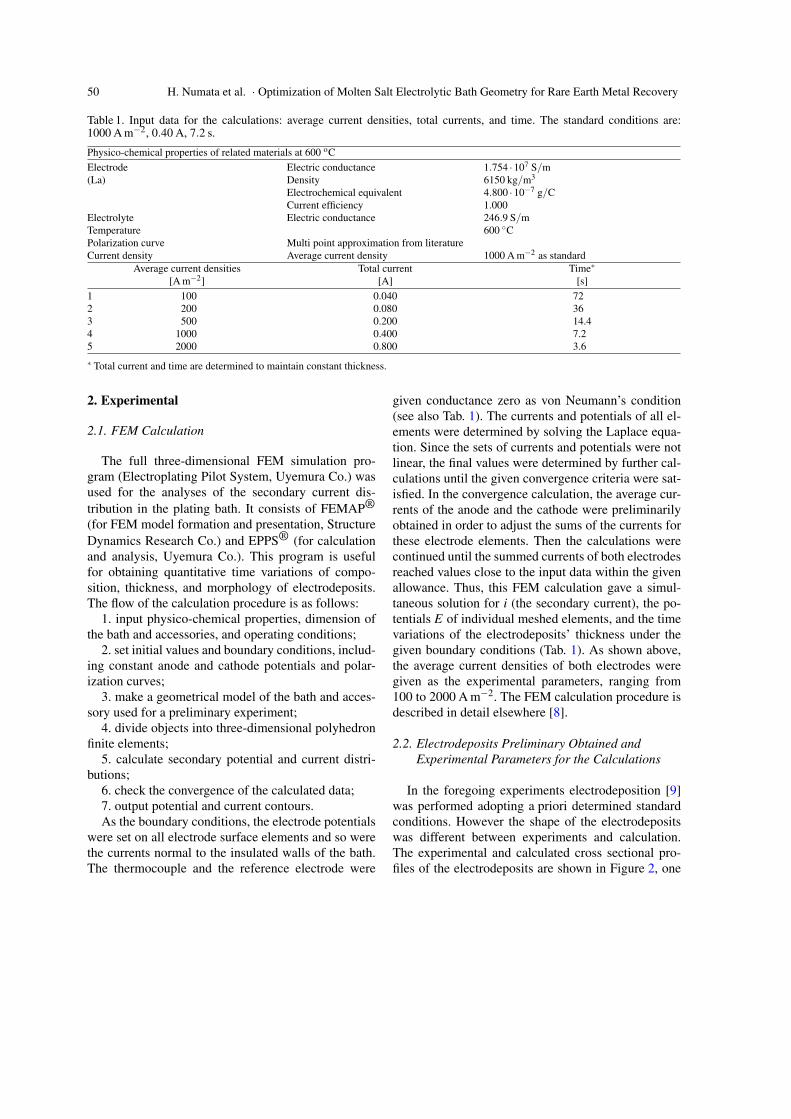
Fig. 8. Effect of the edge height h on the current density dis-tribution curves.
The effects of the cathode edge height h, the dishbottom width dw, the edge angle Aa, and the dishbottom angle Ab in Figure 3 on the current densitydistribution were examined, as exemplified in Fig-ure 8 for the height h ranging from 1 up to 10 mm.Figure 8 shows that all current density distributioncurves monotonically increase and reach a steady valueasymptotically; these curves have been named the‘half wave pattern’. The current density distributionbecomes more uniform with decreasing edge height.Considering this common behaviour, the differencesbetween the maximum (max.) and minimum (min.)values of the current density are adopted as a directlyobtainable measure of the non-uniformity of the cur-rent density distribution.
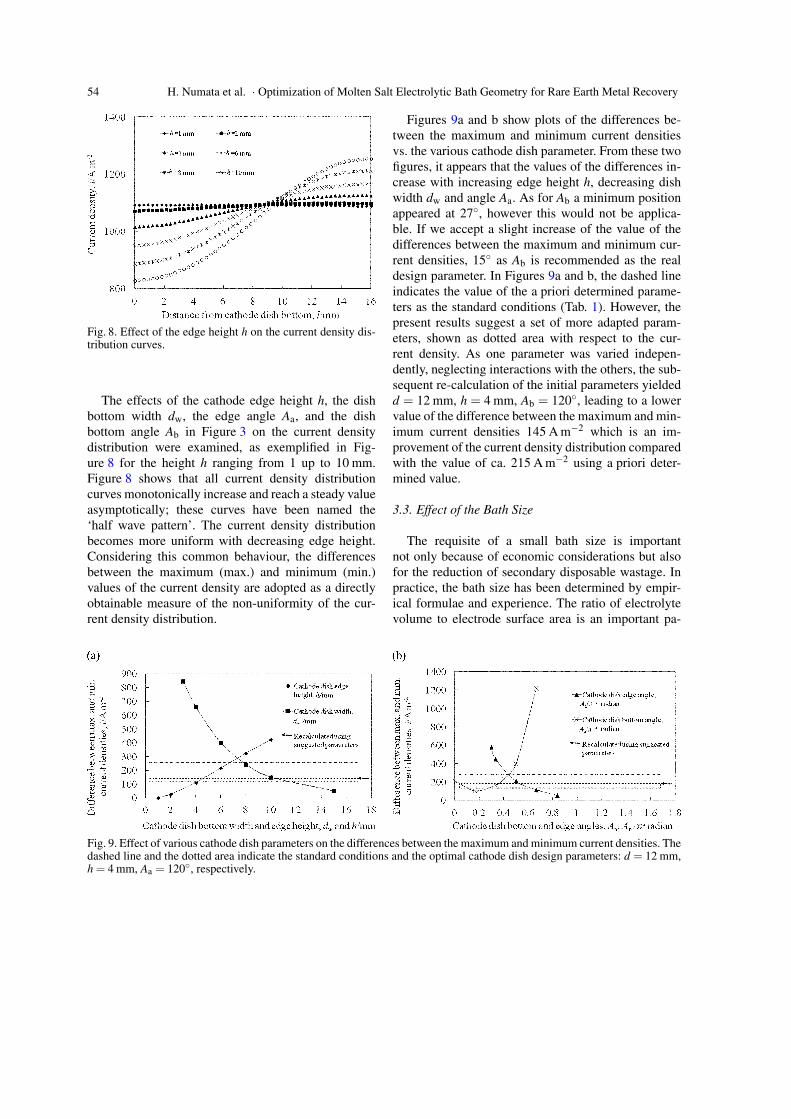
Fig. 9. Effect of various cathode dish parameters on the differences between the maximum and minimum current densities. Thedashed line and the dotted area indicate the standard conditions and the optimal cathode dish design parameters: d = 12 mm,h = 4 mm, Aa = 120, respectively.
Figures 9a and b show plots of the differences be-tween the maximum and minimum current densitiesvs. the various cathode dish parameter. From these twofigures, it appears that the values of the differences in-crease with increasing edge height h, decreasing dishwidth dw and angle Aa. As for Ab a minimum positionappeared at 27, however this would not be applica-ble. If we accept a slight increase of the value of thedifferences between the maximum and minimum cur-rent densities, 15 as Ab is recommended as the realdesign parameter. In Figures 9a and b, the dashed lineindicates the value of the a priori determined parame-ters as the standard conditions (Tab. 1). However, thepresent results suggest a set of more adapted param-eters, shown as dotted area with respect to the cur-rent density. As one parameter was varied indepen-dently, neglecting interactions with the others, the sub-sequent re-calculation of the initial parameters yieldedd = 12 mm, h = 4 mm, Ab = 120, leading to a lowervalue of the difference between the maximum and min-imum current densities 145 A m−2 which is an im-provement of the current density distribution comparedwith the value of ca. 215 A m−2 using a priori deter-mined value.
3.3. Effect of the Bath Size
The requisite of a small bath size is importantnot only because of economic considerations but alsofor the reduction of secondary disposable wastage. Inpractice, the bath size has been determined by empir-ical formulae and experience. The ratio of electrolytevolume to electrode surface area is an important pa-
H. Numata et al. · Optimization of Molten Salt Electrolytic Bath Geometry for Rare Earth Metal Recovery 55C
ylin
der u v w No. of data Reference No.
in Fig. 1020 30 46–59 5 Cylinder 1
10.75–26.15 10.75–26.15 27.75-43.17 5 Cylinder 2
Box
u v p q20 30 90 31–60 6 Box 3
6.75–20 15.75–30 45.5–74 31 6 Box 420 30 90–110 31 6 Box 5
Table 2. Parameters forboth types of bath forcalculation. u, v, w, p, q areindicated in Figure 10. Theunit is mm.
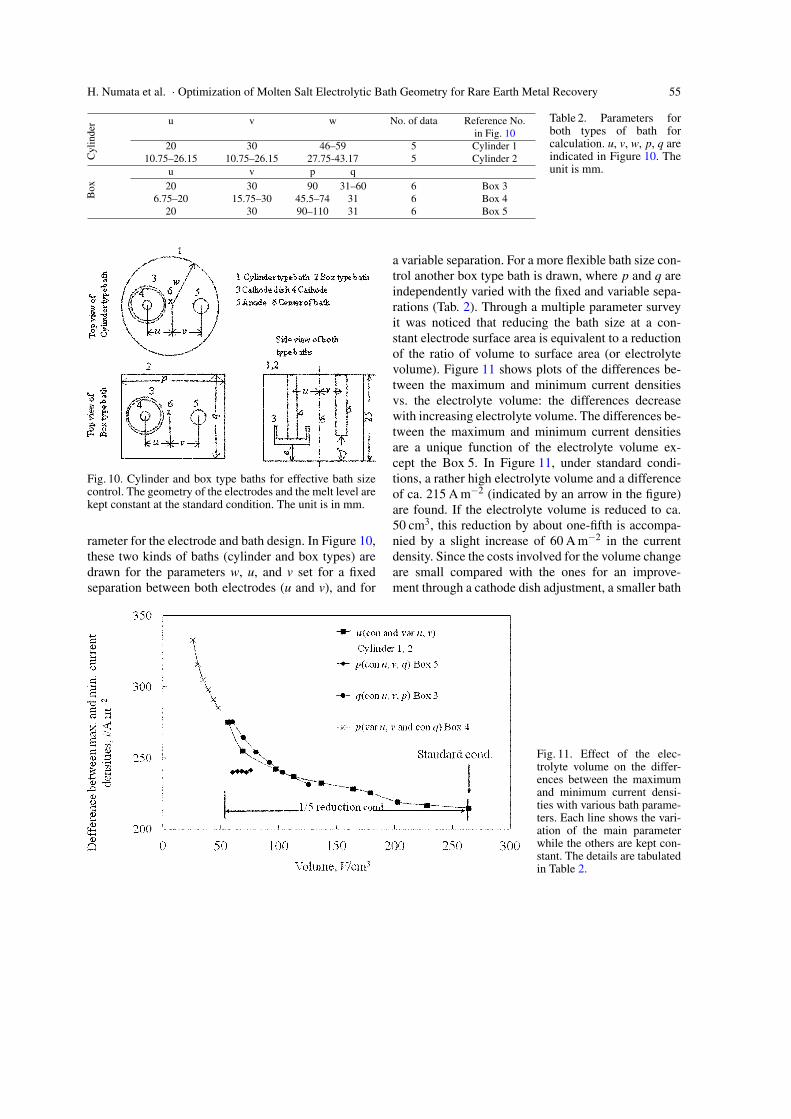
Fig. 10. Cylinder and box type baths for effective bath sizecontrol. The geometry of the electrodes and the melt level arekept constant at the standard condition. The unit is in mm.
rameter for the electrode and bath design. In Figure 10,these two kinds of baths (cylinder and box types) aredrawn for the parameters w, u, and v set for a fixedseparation between both electrodes (u and v), and for
Fig. 11. Effect of the elec-trolyte volume on the differ-ences between the maximumand minimum current densi-ties with various bath parame-ters. Each line shows the vari-ation of the main parameterwhile the others are kept con-stant. The details are tabulatedin Table 2.
a variable separation. For a more flexible bath size con-trol another box type bath is drawn, where p and q areindependently varied with the fixed and variable sepa-rations (Tab. 2). Through a multiple parameter surveyit was noticed that reducing the bath size at a con-stant electrode surface area is equivalent to a reductionof the ratio of volume to surface area (or electrolytevolume). Figure 11 shows plots of the differences be-tween the maximum and minimum current densitiesvs. the electrolyte volume: the differences decreasewith increasing electrolyte volume. The differences be-tween the maximum and minimum current densitiesare a unique function of the electrolyte volume ex-cept the Box 5. In Figure 11, under standard condi-tions, a rather high electrolyte volume and a differenceof ca. 215 A m−2 (indicated by an arrow in the figure)are found. If the electrolyte volume is reduced to ca.50 cm3, this reduction by about one-fifth is accompa-nied by a slight increase of 60 A m−2 in the currentdensity. Since the costs involved for the volume changeare small compared with the ones for an improve-ment through a cathode dish adjustment, a smaller bath

56 H. Numata et al. · Optimization of Molten Salt Electrolytic Bath Geometry for Rare Earth Metal Recovery
Fig. 12. Effect of the reciprocal of electrolyte volume onthe differences between the maximum and minimum currentdensities with various bath parameters.
may be recommended. Comparing the Cylinder 1 andCylinder 2 cases (denoted in Tab. 2), a reduction of w(cylinder radius) gives an increase of the differences,independent of values of u and v. Comparing further-more Box 3 and 5 one sees that a reduction of q (thelongitudinal wall distance) at constant u, v, and p givesa similar increase of the differences while a reductionof p (lateral wall distance) gives a negligible effect.This difference between the two box cases is explainedas follows: in a box type bath the current flow is mostlyinfluenced by a shrinkage of the gap between the cru-cible wall and the cathode edge (corresponding to q),not by a narrowed back side space (corresponding top). For Box 4, the reduction of u and v deterioratesthe differences considerably, even if q = 31 mm andp ranging 45.7 to 74 mm are assumed to increase thedifferences.
The differences vary in the range of ca. 0 to1200 A m−2 with varying dimensions of the cathode(see Fig. 9), while these differences change with vary-ing bath size (or electrolyte volume) between 210 to340 A m−2 (see Fig. 11). These results should lead toa more effective bath design taking into account botheconomical and environmental aspects.
Figure 12 shows that the differences are replottedagainst the reciprocal of the electrolyte volume. Thisplot exhibits a straight line with different slopes, whichcan be expressed as
Diff.(A m−2) =4.58 · (reciprocal of volume in cm−3)
·103 +200 at 0–16.36(in ·103cm−3) ,(2)
Fig. 13. Thickness of the electrodeposit, calculated usingthe standard conditions and with the resistive floating massshown in Figure 2. The dimension of the artificially in-troduced floating mass with a high resistance: a = 22 mm,b = 2 mm, c = 1 mm.
Diff.(A m−2) =2.64 · (reciprocal of volume in cm−3) (3)
·103 +275 at 16.36–40(in ·103cm−3) .
The relation between the differences and the elec-trolyte volume provides in practice significant in-formation for estimating the bath dimensions withina given allowable difference.
3.4. Morphology of an Electrodeposit Affected byHighly Resistive Surface Floating
Figure 13 shows the thickness variation of the elec-trodeposit under standard conditions and with a highlyresistive surface floating mass (dimensions shown inFig. 2), where the material of the floating mass is esti-mated to be Li2O or lanthanum oxichloride. The latterfloating mass is the one expected by the authors, itsresistance, however, is unknown; the value of La2O3(electric resistance 1.0 ·104 Ωm [10]) is adopted in thiscalculation. As is seen in Figure 13, the thickness of theelectrodeposit anomaly goes down while approachingthe melt surface. Figure 2 shows the electrodeposit pro-file obtained experimentally under similar experimen-tal conditions. The calculated electrodeposit profileagrees qualitatively with the experimental one, whichindicates that this sudden deviation of the current den-sity (or thickness of electrodeposit) is attributable tothe artificially located obstacle. In former experimen-tal runs, a surface floating mass was observed in thecase of LaNi5 [4], which was used also as the anode.

H. Numata et al. · Optimization of Molten Salt Electrolytic Bath Geometry for Rare Earth Metal Recovery 57
Further parameter fitting analysis is required to iden-tify the material of an object, accompanied with theaccurate analyses of the surface floating mass.
4. Conclusion
FEM calculations were used for the optimization ofa molten salt electrolytic bath and its cathode acces-sories for rare earth metal recovery. One of the goalswas to obtain a uniform current distribution. It wasshown that optimized electrolysis conditions can besatisfactorily predicted from the analysis of the sec-ondary current distribution. If the bath size needs tobe changed, an appropriate bath structure can be ob-tained as a function of the ratio of the electrolyte vol-ume to the surface area. The following results, includ-ing the desirable design parameters, were obtained inthis work:
i. The desirable level for the average current density,a little less than 2000 A m−2, is compatible witha radially symmetric current density distribution.
ii. The current density distribution along the cathodecan be determined by varying the shapes of thecathode dish.
iii. The parameter survey showed that the optimizedcathode dish (h = 4 mm, dw = 12 mm, and angleAa = 120, see Figs. 3 and 9) gives an improvementfor the current density distribution.
iv. Economic considerations lead us to evaluate thedimensions of smaller baths. An empirical rela-tion between the differences of maximum and min-imum current densities and the reciprocal of theelectrolyte volume was obtained.
v. It was elucidated that ’necking’ appearing in theelectrodeposit profile can be attributed to the exis-tence of a resistive floating mass.
Appendix A
From Faraday’s definition, bundled electric forcelines are generated from positive charges (or a chargedcylinder) to negative ones. The local current densityin a certain area shown, by vectors, is defined as the
mean orientations of the tangent of the electric forcelines and the magnitude corresponding to those den-sities. Therefore, if an obstacle interferes, the electricforce lines stream around it, e.g., for an artificial win-dow set, there exists a bunch of electric force lines, thedensity of which exhibits a high value. In this way thelocal density of the electric force lines between the an-ode and cathode surfaces shows high and low regions.Accordingly, the magnitude of the local current densitymakes the distributions from the principle.
Alternatively, in this calculation the magnitude ofthe local current density is directly converted by (B.1)below. It is proportional to the electric field, irrespec-tive of the behaviour of the electric force lines (Ap-pendix B). For the sake of clarity, the electric forcelines are related with the local current density: an areawith dense equipotential lines (or closer potential con-tours), and a strong electric field. The dense electricforce lines are related accordingly to a high local cur-rent density, the direction of which points along thesteepest slope of equipotential lines. The reverse isvalid in the areas with thin equipotential lines (or widerpotential contours).
Appendix B
The secondary potential ϕ(k) at each element k iscalculated and then the secondary current density ineach element j(k) is determined by
j(k) =−κ∆ϕ(k) , (B.1)
where κ is the electric conductance of the melt, ϕ isthe potential, and ∆ϕ is the electric field.
Acknowledgements
The authors would like to thank Mr. KatsuhikoOhara at Uyemura Co. for creating the FEM com-puter code for the floating mass. This work is sup-ported by the Industrial Technology Research GrantProgram from the New Energy and Industrial Tech-nology Development Organization (NEDO) of Japan(00B62009C).
[1] T. Kobayashi, R. Fujita, M. Fujie, and T. Koyama,J. Nucl. Sci. Technol. 32, 653 (1995).
[2] H. Matsuura, The Report of Industrial Technology Re-search Grant Program, No. 00B62009C, the New En-
ergy and Industrial Technology Development Organi-zation (NEDO), Kawasaki, Japan (in Japanese).
[3] R. Fujita and Y. Akai, J. Alloys. Compd. 271 – 273, 563(1998).

58 H. Numata et al. · Optimization of Molten Salt Electrolytic Bath Geometry for Rare Earth Metal Recovery
[4] H. Matsuura, H. Numata, R. Fujita, and H. Akatsuka,J. Phys. Chem. Solids 66, 439 (2005).
[5] A. Klemm, Z. Naturforsch. 1, 252 (1946).[6] S. Haruyama, H. Numata, and A. Nishikata, Proc. of 1st
Int. Symp. on Molten Salt Chem. and Tech., Kyoto,Molten Salt Commun., Electrochem. Soc. of Japan,pp. 153 – 156 (1983).
[7] Private communication with M. Ginatta’s group in Italy(1992).
[8] K. Ohara, Hyoumen Gijyutsu 50, 416 (1999) (inJapanese).
[9] H. Numata, H. Matsuura, R. Fujita, and H. Akatsuka,71st Annual Meeting Electrochem. Soc. Japan, Yoko-hama, Ab., p. 61 (2004) (in Jananese).
[10] U. Croatto and A. Mayer, Grazz. Chim. Ital. (Roma)73, 199 (1943).


![Polysulfonylamine, CLXXXVI [1]. Strukturvielfalt in sechs ...znaturforsch.com/s63b/s63b1276.pdf · Polysulfonylamine, CLXXXVI [1]. Strukturvielfalt in sechs Cokristallen von Tetramethylharnstoff](https://img.pdfslide.net/doc/110x75/5d63c4ec88c99398288b564b/polysulfonylamine-clxxxvi-1-strukturvielfalt-in-sechs-polysulfonylamine.jpg)

![Polysulfonylamine,CLV[1 ...znaturforsch.com/ab/v57b/s57b0777.pdf · Polysulfonylamine,CLV[1]. StarkeundschwacheWasserstoffbrückenindenKristallstrukturen von2,2 -Bipyridinium-,1,10-Phenanthrolinium-und](https://img.pdfslide.net/doc/110x75/5f2bcc3282248b2226047af6/polysulfonylamineclv1-polysulfonylamineclv1-starkeundschwachewasserstoffbrckenindenkristallstrukturen.jpg)

![Sorting Algorithms - Clark Science Center · Sorting Stuff in Java. int[] arrays double[] arrays float[] arrays String[] arrays import java.util.Arrays; ... • How can we still](https://img.pdfslide.net/doc/110x75/5f9900bd902d9842d647f390/sorting-algorithms-clark-science-sorting-stuff-in-java-int-arrays-double.jpg)