Embed Size (px)
Citation preview

International Journal of Technical Innovation in Modern
Engineering & Science (IJTIMES) Impact Factor: 5.22 (SJIF-2017), e-ISSN: 2455-2585
Volume 5, Issue 07, July-2019
IJTIMES-2019@All rights reserved 254
Optimization of Concrete Aggregates by Iteration method of Analysis
Using Python Program
A. Shanmuga Reddy1, K. Narasimhulu
2, G Mdhusudhan
3
1M.Tech Student
2Professor
3 Asst.Professor
1,2,3Department of Civil Engineering
Abstract— Concrete is an essential part of most of the civil engineering works. Aggregates are the main constituents
of the concrete. An aggregate occupies about 70% to 80% of the total volume of the concrete and also they highly
affect the fresh and hardened properties of the concrete. The concrete mix optimization implies selection of the most
suitable cost of raw materials, quantity of aggregate packing, water and cement consumption. Optimization of
aggregates can be achieved by using optimized techniques such as Maximum density line or Power curve, Coarseness
factor chart, Fineness modulus and Surface area. By using optimization of aggregates technique we can reduce the
cement content and also it gives the dense packing arrangement in between aggregate particles in total volume of
concrete. Finally optimization improves the properties of concrete such as workability, durability, compressive
strength and decreasing drying shrinkage etc,. This work also includes the development of computer based program
for calculating optimization of aggregate proportions of different sizes of aggregates used in concrete mix design by
using optimized techniques. The optimized aggregates proportions are calculated by the use of iteration method. This
paper most useful to calculate optimized combined aggregates mix proportions for generating optimized concrete by
using computer based program.
Keywords— Maximum density line or Power curve, Coarseness factor and workability factor, Fineness modulus.
I. INTRODUCTION
In construction field mostly used material is concrete. In that cement content is about 60%. In fresh concrete, cement
paste occupies 25% to 40% and total aggregates occupies up to 70% to 80% of its total volume. By the increasing the
paste of cement the total cost will be adequate. Some quantity of cement can be replaced by the cementanoius materials
like fly ash, GGBS, RHA etc…, reduced quantity of cement can be achieved by optimizing the combined aggregate
phenomenon while making the mixes. We can achieve the parameters like
1) Reducing voids between aggregate particles
2) Reducing cost of cement by reducing the cement content
3) Increasing durability by decreasing permeability for drying shrinkage cracking.
4) Increasing the structure performance by decreasing porosity and increasing the total aggregate volume.
By the shape and texture of aggregate the packing ability of individual aggregates and strength for optimizing blended
aggregates will have significant increment.
The second most expansive material in concrete is aggregate. It occupies 60% to 90% of its total volume. The type and
size distribution of aggregate will affect the properties of concrete such as durability, workability, permeability,
mechanical strength and also cost of hardened concrete. By this we can state that aggregates are essential for optimizing
concrete mix design.
A. MAXIMUM DENSITY LINE OR POWER CURVE
In 1907, Thompson and fuller developed that the ideal concept of gradation curve shape will produce the best concrete
performance. The equation for the maximum density line was shown in below, for concrete mixtures were later
developed by Talbot and Richard in 1923. In 1948, nijboer and in 1962 goode and lufsey it was further developed and
confirm for various aggregate types. In particle size distribution, the individual aggregate property required to be inputted
for this technique. The equation as follows
Where P = Combined percentage passing of aggregates
d = sieve size (or) particle size
D = Maximum sieve size or Largest particle size
N = Grading type factor or Power factor (varies from 0.3 to 1.00)

International Journal of Technical Innovation in Modern Engineering & Science (IJTIMES)
Volume 5, Issue 07, July-2019, e-ISSN: 2455-2585, Impact Factor: 5.22 (SJIF-2017)
IJTIMES-2019@All rights reserved 255
Fig: 1 Ideal distribution curves developed by Fuller, Andreassen, and Funk & Dinger
C. SHILSTON‟S COARSENESS FACTOR CHART
Shilstone built up an apparatus for deciding a very much reviewed blend, the Coarseness Factor Chart in 1990. The main
individual aggregate property required to be inputted for this system is the molecule estimate circulation.
Fig: 2 Shilstone‟s Coarseness Factor Chart
The coarseness factor (CF) and workability factor (WF) values can be calculated by using the following equations
Coarseness Factor (CF) =
Workability Factor (WF) = % cumulative Passing on the 2.36 mm IS sieve
D. SHAPE AND SIZE OF AGGREGATES
Clearly the pressing is a component of the molecule shape and the size circulation. It very well may be reasoned that the
normal aggregate went (0-27 mm) gives pressing qualities higher than of squashed aggregate for a similar aggregate
blend extents for all exploratory and hypothetical examinations. It is additionally discovered utilization of three sorts of
aggregate or more gives ideal pressing and great cement.
II. MATERIALS
A. CEMENT
Cement is used as the basic binding material for making any type concrete with including raw materials like fine
aggregate, coarse aggregates, required quantity of portable water and admixtures. Basically cement is manufactured by
using raw materials like clay, lime and some other chemicals required for fulfil construction needs. Manufacture of
cement done on the basis of wet and dry process, but now way days wet process mostly used for manufacturing of
cement in industries.
In this experimental study we are using PPC type cement (IS 1489 part- 1) manufactured by Bharathi cement private
limited. The specific gravity property of cement determined by the procedure described in the IS: 4031(part II)-1988
code provisions.
The value of specific gravity of cement is obtained as 3.10.

International Journal of Technical Innovation in Modern Engineering & Science (IJTIMES)
Volume 5, Issue 07, July-2019, e-ISSN: 2455-2585, Impact Factor: 5.22 (SJIF-2017)
IJTIMES-2019@All rights reserved 256
B. COARSE AGGREGATES
In this project, we have used 20mm, 10mm and 5mm HBG metal, these materials brought from the Chandragiri
quarry near Chandragiri Kota in Chittoor district. The physical properties of coarse aggregate of different sizes are shown
in Table 1.
Table 1. Physical properties of coarse aggregates of different sizes
Sl.No
Nominal size
of Aggregates
in (mm)
Specific
gravity
value
Water absorption
in percentage (%)
1 20 2.65 0.50
2 10 2.65 0.50
3 5 2.65 0.50
The sieve analysis of coarse aggregate of different sizes of 20mm, 10mm and 5mm are done as per IS: 2386 (Part I) –
1963codal procedure. The sieve analysis values obtained for 20mm, 10mm and 5mm size coarse aggregate are shown in
Table 2, Table 3and Table 4 respectively.
Table 2. Sieve Analysis values of 20 mm size Coarse Aggregate
Sl.No IS sieve size in
(mm)
Cumulative
percentage
passing
1 25 100.00
2 20 79.53
3 12.5 10.47
4 10 1.27
5 4.75 0.17
6 2.36 0.03
7 1.18 0.03
8 0.60 0.03
9 0.30 0.03
10 0.15 0.03
11 Pan 0.00
Table 3. Sieve Analysis values of 10 mm size Coarse Aggregate
Sl.No IS sieve size in
(mm)
Cumulative
percentage
passing
1 25 100.00
2 20 100.00
3 12.5 85.35
4 10 40.90
5 4.75 12.10
6 2.36 0.95
7 1.18 0.35
8 0.60 0.30
9 0.30 0.25
10 0.15 0.20
11 Pan 0.00

International Journal of Technical Innovation in Modern Engineering & Science (IJTIMES)
Volume 5, Issue 07, July-2019, e-ISSN: 2455-2585, Impact Factor: 5.22 (SJIF-2017)
IJTIMES-2019@All rights reserved 257
Table 4. Sieve Analysis values of 5 mm size Coarse Aggregate
Sl.No IS sieve size in
(mm)
Cumulative
percentage
passing
1 25 100.00
2 20 100.00
3 12.5 66.67
4 10 66.67
5 4.75 0.00
6 2.36 0.00
7 1.18 0.00
8 0.60 0.00
9 0.30 0.00
10 0.15 0.00
11 Pan 0.00
C. FINE AGGREGATE
If the aggregate particles passing through the 4.75mm IS sieve and retained on 75 micron IS sieve then the
material is classified as Fine aggregate. It is formed by the decomposition or weathering action of sand stone.
Table 5. Physical properties of fine aggregate
Sl.No Description
of material
Specific
gravity
value
Water
absorption in
percentage (%)
1 Fine
aggregate 2.65 1.20
The sieve analysis of fine aggregate is done as per IS: 2386(Part I) – 1963 codal procedure and the values are shown in
Table 6. After comparing the obtained fine aggregate results with standard values Shown in Table 6 in IS: 383-1970, we
then conclude that fine aggregate used for this project work is belongs to Zone II grading of aggregates.
Table 6. Sieve Analysis values of fine aggregate
Sl.No IS sieve size in
(mm)
Cumulative
percentage
passing
IS 383-1970
(Zone II)
1 25 100.00 100
2 20 100.00 100
3 12.5 100.00 100
4 10 100.00 100
5 4.75 98.40 90-100
6 2.36 92.30 75-100
7 1.18 76.60 55-90
8 0.60 49.10 35-59
9 0.30 13.20 8-30
10 0.15 2.90 0-10
11 Pan 0.00 ---

International Journal of Technical Innovation in Modern Engineering & Science (IJTIMES)
Volume 5, Issue 07, July-2019, e-ISSN: 2455-2585, Impact Factor: 5.22 (SJIF-2017)
IJTIMES-2019@All rights reserved 258
III. METHODOLOGY
We are considered experimental investigations already done on optimized techniques by the Tolbot‟s grading curve or
power curve, Shilston‟s developed coarseness factor chart, fineness modulus and IS: 10262-2009 code procedure for
preparing the concrete cubes of grade M20 for investigation the result which are obtained on after tests conducted in
laboratory on the hardened concrete cubes at 7 days and 28 day‟s curing completed.
First we are preparing target values of different N values by using mathematical relation developed by the Fuller and
Thompson in 1907, then in 1923 Talbot‟s and Richart developed as follows
P = 100 x
Where P = % passing (by mass)
d= sieve size in mm
D = max. Sieve size in mm
N = grading type factor
After preparing the target values we are developing a target curve by considering target values on X- axis and
respective sieve sizes on Y- axis, and then we are calculating the actual proportions required for the optimized aggregate
gradation by using Iteration method of analysis. In this method we are dividing the total proportion of different size of
aggregate materials are in the unity. After we are increment and decrement done on the proportions of respective
aggregates and also simultaneously calculate the actual values obtained for different new proportions. Then we prepare
the plot for actual values and sieve sizes, after we calculating the standard deviation value for each curve. Then finally
compare with the target curve, which curve gives the least value of standard deviation that respective curve proportions
gives the required optimized aggregate grading proportions.
The above procedure repeated for all possible proportions among the given different sizes of aggregates with different N
values. The manually calculation for all different N values is very difficult job to overcome these difficulty we are
developed a computer based programme in python language. Developed Python programme takes time (approximately
greater than 15 minutes) for calculating the actual value of single iteration for one N value.
After calculating the fineness modulus values for fine aggregate, coarse aggregates, total fineness modulus values of
coarse aggregates (TFMVCA) and total fineness modulus values of aggregates (TFMVA) by using following formula
Fineness modulus =
After getting the optimized aggregate proportions for different sizes of aggregates then we calculate the respective
Coarseness factor (CF) and Workability factor (WF) values for respective N value by using following formulas
Coarseness Factor (CF) = 00
Workability Factor (WF) = % Cumulative passing on 2.36 mm sieve
After checking the obtained CF and WF values with the standard values of CF and WF are given by the Shils stones‟s
coarseness Factor chart shown in Fig. 2.
Finally the computer based program developed such a way that it will automatically calculate and display the nearest
values of CF and WF with respect to the standard values of CF and WF and also displays the respective optimized
aggregate proportions required for making optimized concrete.
At end of the program execution it will also develops the following plots listed below
Percentage of passing values of aggregates Vs Sieve sizes
Individual retaining value of aggregates Vs Sieve sizes
Coarseness factor value Vs Workability factor value
A. MIX DESIGN
The mix design of M20 grade cement concrete was done by using IS: 10262- 2009 and volume of aggregates taken as the
proportions obtained in the developed computer based program on optimized aggregate gradation. The raw materials
quantities obtained for concrete mix of N=0.45 and N=0.85, S=0.279 are shown in Table 7.

International Journal of Technical Innovation in Modern Engineering & Science (IJTIMES)
Volume 5, Issue 07, July-2019, e-ISSN: 2455-2585, Impact Factor: 5.22 (SJIF-2017)
IJTIMES-2019@All rights reserved 259
Table 7. Quantities of different raw materials for different N and S values
Sl.no Description of materials
Quantity of different martial’s in (kg/m3)
N=0.45 N=0.85 and S=0.279
1 Cement 322.034 322.034
2 Fine aggregate 744.582 (41.30 %) 804.077 (44.60 %)
3 Coarse aggregate
20 mm 249.816 (13.80 %) 376.232 (20.80 %)
10 mm 361.762 (20.00 %) 276.748 (15.20 %)
5 mm 450.394 (24.90 %) 349.101 (19.30 %)
4 Water 195.413 195.572
For M20 grade concrete of N=0.45 value, the mix proportions obtained 1: 2.31: 0.78: 1.12: 1.40 as cement, fine
aggregate, coarse aggregate of sizes 20mm, 10mm, 5mm respectively and water cement ratio is 0.60.
For M20 grade concrete of N=0.45 and S=0.279 , the mix proportions obtained 1: 2.50: 1.17: 0.86: 1.08 as cement, fine
aggregate, coarse aggregate of sizes 20mm, 10mm, 5mm respectively and water cement ratio is 0.60.
IV. RESULTS AND DISCUSSIONS
The Results obtained of Combined aggregate grading analysis for different N values of 0.40, 0.50, 0.60, 0.70 and 0.80 for
given aggregates data as input (as shown in fig 3) to the computer based program developed on the basis of iteration
method as shown below.
Fig: 3 Input values in text file format
Table: 8 Optimized Mix proportions for different N values
S.No N
Value
Standard
deviation
value
Combined Aggregate mix proportions
20 mm 12.5 mm Fine aggregate
1 0.40 6.494 20.50% 26.70% 52.80%
2 0.50 4.689 24.60% 33.10% 42.30%
3 0.60 3.921 28.80% 37.30% 33.90%
4 0.70 3.77 32.90% 39.90% 27.20%
5 0.80 3.877 36.90% 41.20% 21.90%

International Journal of Technical Innovation in Modern Engineering & Science (IJTIMES)
Volume 5, Issue 07, July-2019, e-ISSN: 2455-2585, Impact Factor: 5.22 (SJIF-2017)
IJTIMES-2019@All rights reserved 260
Fig: 4 Percentage passing of combined aggregates for 0.40 power curve
Fig: 5 Percentage passing of combined aggregates for 0.50 power curve
Fig: 6 Percentage passing of combined aggregates for 0.60 power curve
International Journal of Technical Innovation in Modern Engineering & Science (IJTIMES)
Volume 5, Issue 07, July-2019, e-ISSN: 2455-2585, Impact Factor: 5.22 (SJIF-2017)
IJTIMES-2019@All rights reserved 261
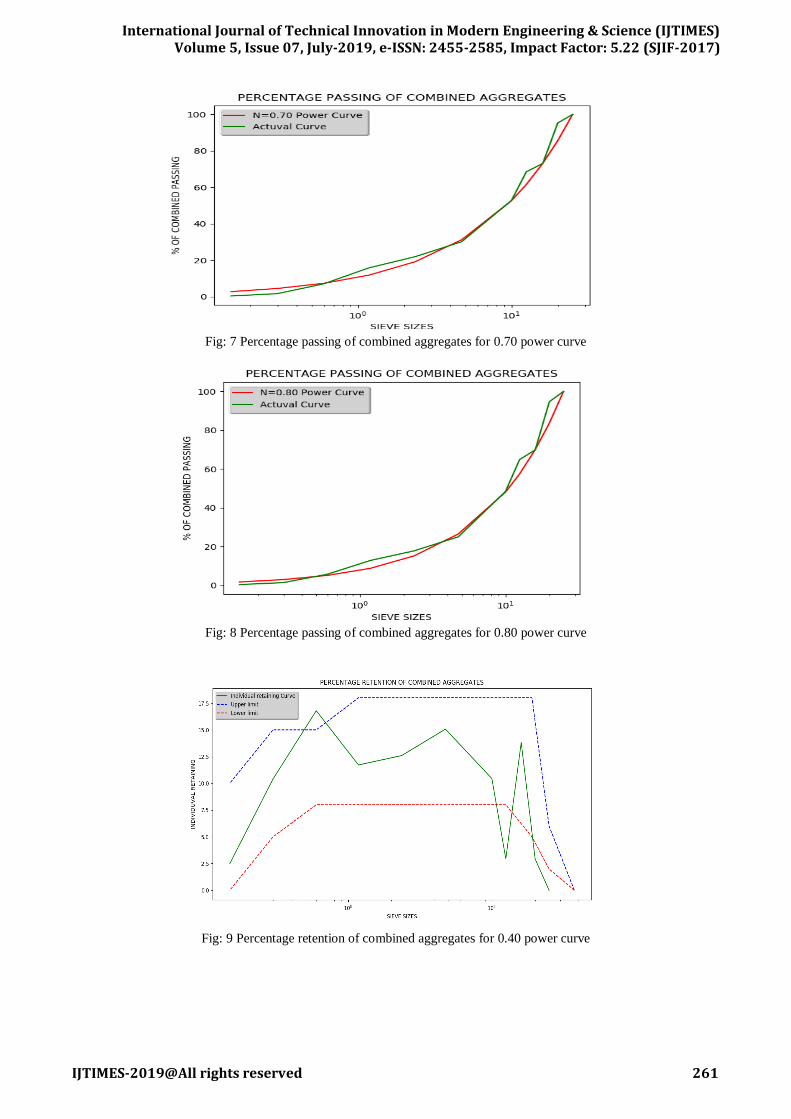
Fig: 7 Percentage passing of combined aggregates for 0.70 power curve
Fig: 8 Percentage passing of combined aggregates for 0.80 power curve
Fig: 9 Percentage retention of combined aggregates for 0.40 power curve

International Journal of Technical Innovation in Modern Engineering & Science (IJTIMES)
Volume 5, Issue 07, July-2019, e-ISSN: 2455-2585, Impact Factor: 5.22 (SJIF-2017)
IJTIMES-2019@All rights reserved 262
Fig: 10 Percentage retention of combined aggregates for 0.50 power curve
Fig: 11 Percentage retention of combined aggregates for 0.60 power curve
Fig: 12 Percentage retention of combined aggregates for 0.70 power curve
International Journal of Technical Innovation in Modern Engineering & Science (IJTIMES)
Volume 5, Issue 07, July-2019, e-ISSN: 2455-2585, Impact Factor: 5.22 (SJIF-2017)
IJTIMES-2019@All rights reserved 263
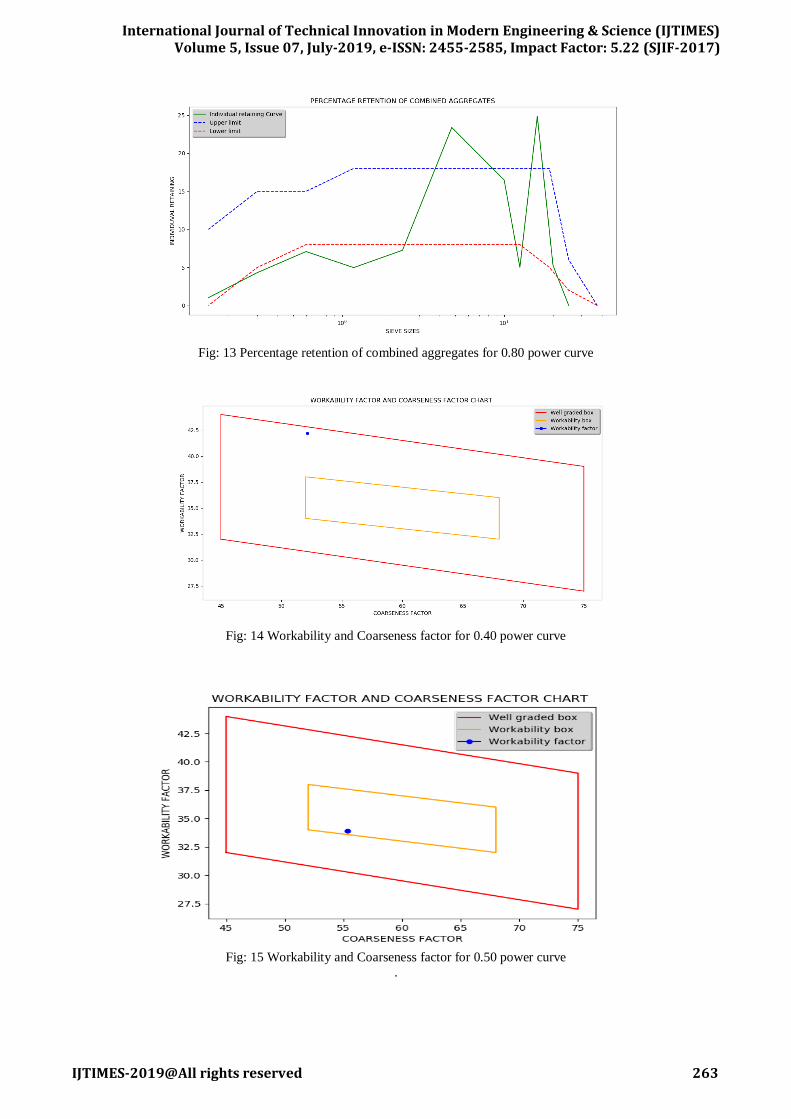
Fig: 13 Percentage retention of combined aggregates for 0.80 power curve
Fig: 14 Workability and Coarseness factor for 0.40 power curve
Fig: 15 Workability and Coarseness factor for 0.50 power curve
.

International Journal of Technical Innovation in Modern Engineering & Science (IJTIMES)
Volume 5, Issue 07, July-2019, e-ISSN: 2455-2585, Impact Factor: 5.22 (SJIF-2017)
IJTIMES-2019@All rights reserved 264
Fig: 16 Workability and Coarseness factor for 0.60 power curve
Fig: 17 Workability and Coarseness factor for 0.70 power curve
Fig: 18 Workability and Coarseness factor for 0.80 power curve

International Journal of Technical Innovation in Modern Engineering & Science (IJTIMES)
Volume 5, Issue 07, July-2019, e-ISSN: 2455-2585, Impact Factor: 5.22 (SJIF-2017)
IJTIMES-2019@All rights reserved 265
V. CONCLUSIONS
This project attempts to develop a computer based program for calculating the optimized aggregate gradation proportions
of given sieve analysis values of different sizes of aggregates (up to four sizes including fine aggregate) used in
optimized concrete mix preparation. The iteration method of analysis takes less time for calculating the optimized mix
proportions compare to the manual calculations.
In this program development we are consider both pullers and siltstone coarseness factor charts of analysis for
calculating the optimized aggregates gradations of different aggregates and also program gives minimum standard
deviation value and fineness modulus values of all aggregates.
REFERENCES
[1] Mohammed H. Mohammed, Mats Emborg, Roland Pusch and Sven Knutsson, “Packing Theory for Natural and
Crushed Aggregate to Obtain the Best Mix of Aggregate” Research and Development -World Academy of Science,
Engineering and Technology International Journal of Civil and Environmental Engineering Vol:6, No:7- 2012.
[2] SangyongKim, Hee-BokChoi, YoonseokShin, Gwang-HeeKim and Deok-SeokSeo, “Optimizing the Mixing
Proportion with Neural Networks Based on Genetic Algorithms for Recycled Aggregate Concrete” - Hindawi
Publishing Corporation, Advances in Materials Science and Engineering Volume, ArticleID527089-2013.
[3] Sun Yong, Wang Zonglin, Gao Qingfei, Liu Chenguang, “A new mixture design methodology based on the Packing
Density Theory for high performance concrete in bridge engineering”, Construction and Building Materials – JCBM
13211-2018.
[4] Peter Taylor, Fatih Bektas, Ezgi Yurdakul, and Halil Ceylan, “Optimizing Cementitious Content in Concrete Mixtures
for Required Performance” - National Concrete Pavement Technology Center Iowa State University- Federal
Highway Administration , DTFH61-06-H-00011 Work Plan 20-2012.
[5] David N Richardson, “Aggregate gradation optimization – literature search”, Research development and technology
university of Missouri – Rolla, RDT 05-001, RI 98 -035. Book- „‟Concrete Technology‟‟, Author: M.S. Shetty, S
Chand Publications-2005.
[6] IS 10262:2009, Concrete Mix Proportioning (first revision), Bureau of Indian Standards, New Delhi.
[7] IS 383:1970, Specifications for Coarse and Fine Aggregate from Natural Sources for Concrete (second revision),
Bureau of Indian Standards, New Delhi.
[8] IS 456:2000, Plain and Reinforced Concrete Code for Practice, Bureau of Indian Standards, New Delhi.