Embed Size (px)
Citation preview
http://www.iaeme.com/ijptm/index.asp 16 [email protected]
International Journal of Production Technology and Management (IJPTM) Volume 7, Issue 2, July-December, 2016, pp. 16–27, Article ID: IJPTM_07_02_003
Available online at
http://www.iaeme.com/ijptm/issues.asp?JType=IJPTM&VType=7&IType=2
Journal Impact Factor (2016): 4.7601 (Calculated by GISI) www.jifactor.com
ISSN Print: 0976- 6383 and ISSN Online: 0976 – 6391
© IAEME Publication
OPTIMIZATION OF MIG WELDING TECHNIQUE
PARAMETERS WITH THE HELP OF TAGUCHI
METHOD
Raj Kumar Yadav
Assistant Professor & Head,
Department of Mechanical Engineering, AIST Sagar M.P., India.
Sandhaya Yadav
B.E. Research Scholar, Department of Mechanical Engineering, AIST Sagar M.P., India.
Anurag Singh and Pankaj Singh
Assistant Professor, Department of Mechanical Engineering, AIST Sagar M.P., India.
ABSTRACT
Welding is a basic manufacturing process for making components or assemblies. Recent
welding economics research has focused on developing the reliable machinery database to ensure
optimum production. In this paper, the optimization of welding input process parameters for
obtaining greater weld strength in the manual metal inert gas (MIG) welding of similar metals of
mild steel is presented. The Taguchi method is adopted to analyze the effect of each welding
process parameter on the weld strength, and the optimal process parameters are obtained to
achieve greater weld strength. Experimental results are provided to illustrate the proposed
approach.
Key words: MIG Welding, Taguchi method, Signal to noise ratio, Voltage, Current, WFR.
Cite this Article: Raj Kumar Yadav, Sandhaya Yadav, Pankaj Singh and Anurag Singh,
Optimization of MIG Welding Technique Parameters with the Help of Taguchi Method,
International Journal of Production Technology and Management (IJPTM), 7(2), 2016, pp. 16–27.
http://www.iaeme.com/ijptm/issues.asp?JType=IJPTM&VType=7&IType=2
1. HISTORY OF WELDING - IN THE BEGINNING
The Bible mentions Tubal Cain, "forged all types of tools from bronze and iron." He may have been one of
the first to join metals with the forging process. His flame was an open hearth into which he placed the
metals to be heated to the forging temperature.
In 1881 a Russian inventor, Benardos demonstrated the carbon electrode welding process. An arc was
formed between essentially a moderately consumable carbon electrode and the work. A rod was added to
provide needed extra metal. At right is an image of Nikolay Benardos on a stamp from Russia honoring
him as the "father of welding" A sketch of a carbon arc torch is shown to his right.
Optimization of MIG Welding Technique Parameters with the Help of Taguchi Method
http://www.iaeme.com/ijptm/index.asp 17 [email protected]
2. MIG WELDING
Gas metal arc welding (GMAW), sometimes referred to by its subtypes metal inert gas (MIG)
welding or metal active gas (MAG) welding, is a welding process in which an electric arc is formed
between a consumable wire electrode and the work piece metal(s), which heats the work piece metal(s),
causing them to melt, and join. Along with the wire electrode, a shielding gas is fed through the welding
gun, which shields the process from contaminants in the air. The process can be semi-automatic or
automatic. A constant voltage, direct current power source is most commonly used with GMAW, but
constant current systems, as well as alternating current, can be used. There are four primary methods of
metal transfer in GMAW, called globular, short-circuiting, spray, and pulsed-spray, each of which has
distinct properties and corresponding advantages and limitations.
3. INTRODUCTION OF TAGUCHI METHOD
Every experimenter has to plan and conduct experiments to obtain enough and relevant data so that he can
infer the science behind the observed phenomenon. He can do so by,
3.1. Triel and Error Approch
Performing a series of experiments each of which gives some understanding. This requires making
measurements after every experiment so that analysis of observed data will allow him to decide what to do
next - "Which parameters should be varied and by how much". Many a times such series does not progress
much as negative results may discourage or will not allow a selection of parameters which ought to be
changed in the next experiment. Therefore, such experimentation usually ends well before the number of
experiments reaches a double digit! The data is insufficient to draw any significant conclusions and the
main problem (of understanding the science) still remains unsolved.
3.2. Design of Experiment
A well planned set of experiments, in which all parameters of interest are varied over a specified range, is a
much better approach to obtain systematic data. Mathematically speaking, such a complete set of
experiments ought to give desired results. Usually the number of experiments and resources (materials and
time) required are prohibitively large. Often the experimenter decides to perform a subset of the complete
set of experiments to save on time and money! However, it does not easily lend itself to understanding of
science behind the phenomenon. The analysis is not very easy (though it may be easy for the
mathematician/statistician) and thus effects of various parameters on the observed data are not readily
apparent. In many cases, particularly those in which some optimization is required, the method does not
point to the BEST settings of parameters. A classic example illustrating the drawback of design of
experiments is found in the planning of a world cup event, say football. While all matches are well
arranged with respect to the different teams and different venues on different dates and yet the planning
does not care about the result of any match (win or lose)!!!! Obviously, such a strategy is not desirable for
conducting scientific experiments (except for co-ordinating various institutions, committees, people,
equipment, materials etc.).
3.3. Taguchi Method
Dr. Taguchi of Nippon Telephones and Telegraph Company, Japan has developed a method based on
“ORTHOGONAL ARRAY” experiments which gives much reduced “variance” for the experiment with
“optimum settings “of control parameters. Thus the marriage of Design of Experiments with optimization
of control parameters to obtain BEST results is achieved in the Taguchi Method. "Orthogonal Arrays"
(OA) provide a set of well balanced (minimum) experiments and Dr. Taguchi's Signal-to-Noise ratios
(S/N), which are log functions of desired output, serve as objective functions for optimization, help in data
analysis and prediction of optimum results
Taguchi Method treats optimization problems in two categories,
Raj Kumar Yadav, Sandhaya Yadav, Pankaj Singh and Anurag Singh
http://www.iaeme.com/ijptm/index.asp 18 [email protected]
3.3.1. Static Problems
Generally, a process to be optimized has several control factors which directly decide the target or desired
value of the output. The optimization then involves determining the best control factor levels so that the
output is at the the target value. Such a problem is called as a "STATIC PROBLEM".
This is best explained using a P-Diagram which is shown below ("P" stands for Process or Product).
Noise is shown to be present in the process but should have no effect on the output! This is the primary
aim of the Taguchi experiments - to minimize variations in output even though noise is present in the
process. The process is then said to have become ROBUST.
3.3.2. Dynamic Problems
If the product to be optimized has a signal input that directly decides the output, the optimization involves
determining the best control factor levels so that the "input signal / output" ratio is closest to the desired
relationship. Such a problem is called as "DYNAMICPROBLEM".
This is best explained by a P-Diagram which is shown below. Again, the primary aim of the Taguchi
experiments - to minimize variations in output even though noise is present in the process- is achieved by
getting improved linearity in the input/output relationship.
4. STATIC PROBLEM (BATCH PROCESS OPTIMIZATION)
There are 3 Signal-to-Noise ratios of common interest for optimization of Static Problems;
4.1. Smaller- The Better
This is usually the chosen S/N ratio for all undesirable characteristics like " defects " etc. for which the
ideal value is zero. Also, when an ideal value is finite and its maximum or minimum value is defined (like
maximum purity is 100% or maximum Tc is 92K or minimum time for making a telephone connection is 1
sec) then the difference between measured data and ideal value is expected to be as small as possible. The
generic form of S/N ratio then becomes,
n = -10 Log10 [mean of sum of squares of {measured - ideal}]
4.2. Larger-The Better
This case has been converted to SMALLER-THE-BETTER by taking the reciprocals of measured data and
then taking the S/N ratio as in the smaller-the-better case.
4.3. Nominal-The Best
This case arises when a specified value is MOST desired, meaning that neither a smaller nor a larger value
is desirable.
N = -10 Log10 [squares of mean variance]
Example are;
(i) Most parts in mechanical fittings have dimensions which are nominal-the-best type.
(ii) Thickness should be uniform in deposition /growth /plating /etching.
5. STEPS IN TAGUCHI METHODOLOGY
Step-1: Identify the Main Function, Side Effects, and Falure Mode.
Step-2: Identify the Noise Factor Testing Condition and Quality Characteristics.
Step-3: Identify the Object Fun to be Optionized.
Step-4: Identify The Control Factors And Their Level.
Step-5: Select The Orthogonal Arry Matrix Experiment.
Step-6: Conduct The Matrix Experiment.
Optimization of MIG Welding Technique Parameters with the Help of Taguchi Method
http://www.iaeme.com/ijptm/index.asp 19 [email protected]
Step-7: Analyze Data Predict the Optimum Levels and Performance.
Step-8: Performation the Verification Experiment and Plan the Future Action.
5.1. Optimization Parameter Types
• Continuous parameter
• Discrete parameter
• Design parameter
5.2. Optimization Techniques
• Taguchi method
• Genetic method
• Regression analysis method
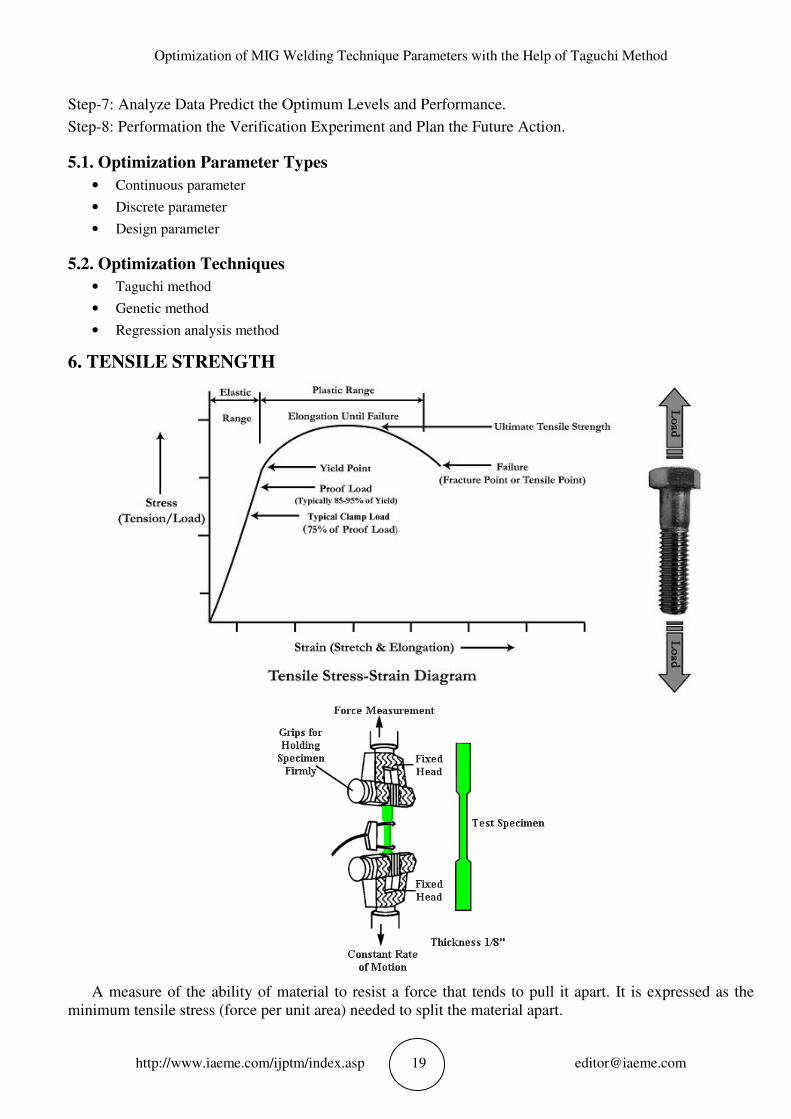
6. TENSILE STRENGTH
A measure of the ability of material to resist a force that tends to pull it apart. It is expressed as the
minimum tensile stress (force per unit area) needed to split the material apart.

Raj Kumar Yadav, Sandhaya Yadav, Pankaj Singh and Anurag Singh
http://www.iaeme.com/ijptm
7. TORSIONAL STRENGTH
Measure of the ability of a material to withstand a twisting load. It is the ultimate strength of a material
subjected to torsional loading, and is the maximum torsiona
Alternate terms are modulus of rupture and shear strength.
Grade C% Max
I 0.25
Raj Kumar Yadav, Sandhaya Yadav, Pankaj Singh and Anurag Singh
ijptm/index.asp 20
TORSIONAL STRENGTH
Measure of the ability of a material to withstand a twisting load. It is the ultimate strength of a material
subjected to torsional loading, and is the maximum torsional stress that a material sustains before rupture.
Alternate terms are modulus of rupture and shear strength.
Chemical Composition of Mild Steel
CHEMICAL COMPOSITION
Mn % Max. S% Max.
1.30 0.05
Grade of Filler Wire
Raj Kumar Yadav, Sandhaya Yadav, Pankaj Singh and Anurag Singh
Measure of the ability of a material to withstand a twisting load. It is the ultimate strength of a material
l stress that a material sustains before rupture.
P% Max.
0.05
Optimization of MIG Welding Technique Parameters with the Help of Taguchi Method
http://www.iaeme.com/ijptm/index.asp 21 [email protected]
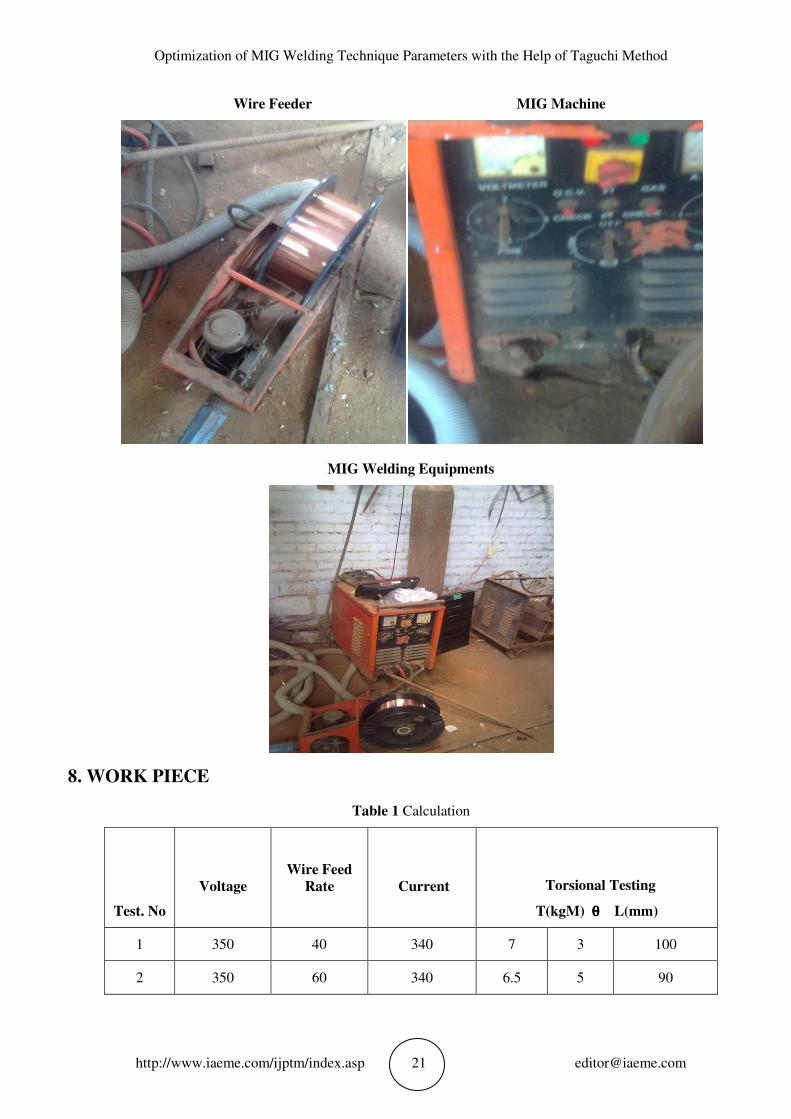
Wire Feeder MIG Machine
MIG Welding Equipments
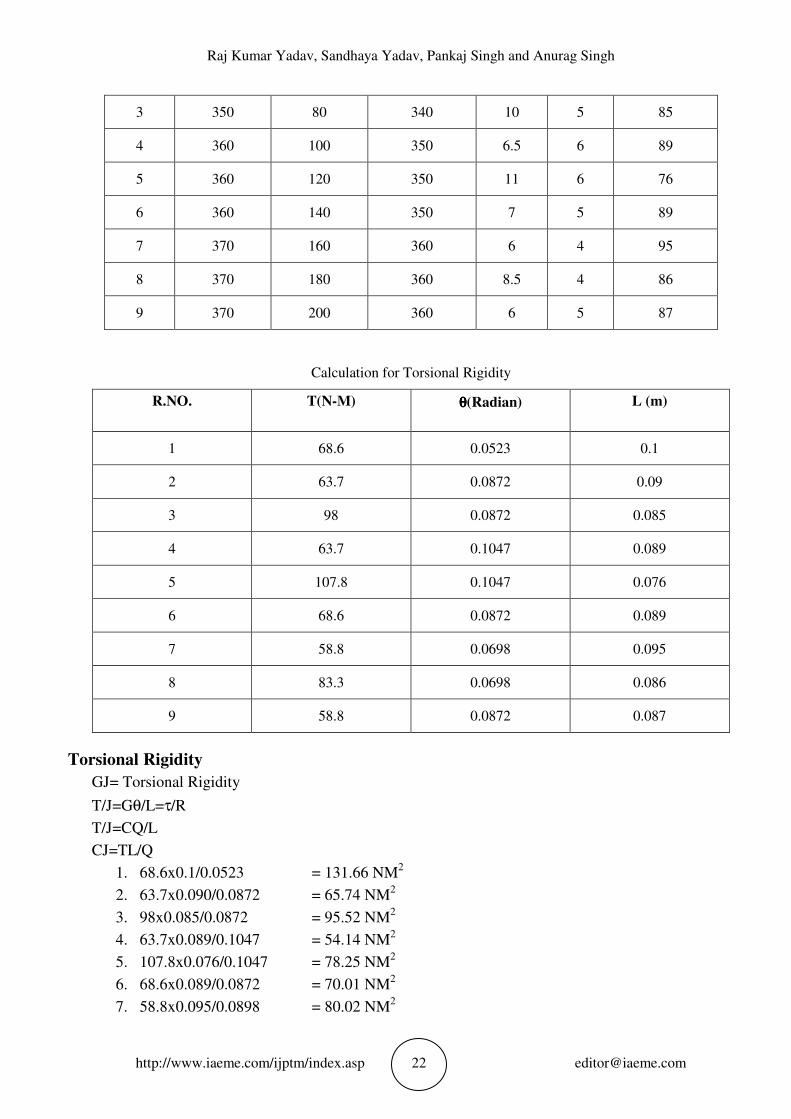
8. WORK PIECE
Table 1 Calculation
Test. No
Voltage
Wire Feed
Rate
Current
Torsional Testing
T(kgM) θθθθ L(mm)
1 350 40 340 7 3 100
2 350 60 340 6.5 5 90
Raj Kumar Yadav, Sandhaya Yadav, Pankaj Singh and Anurag Singh
http://www.iaeme.com/ijptm/index.asp 22 [email protected]
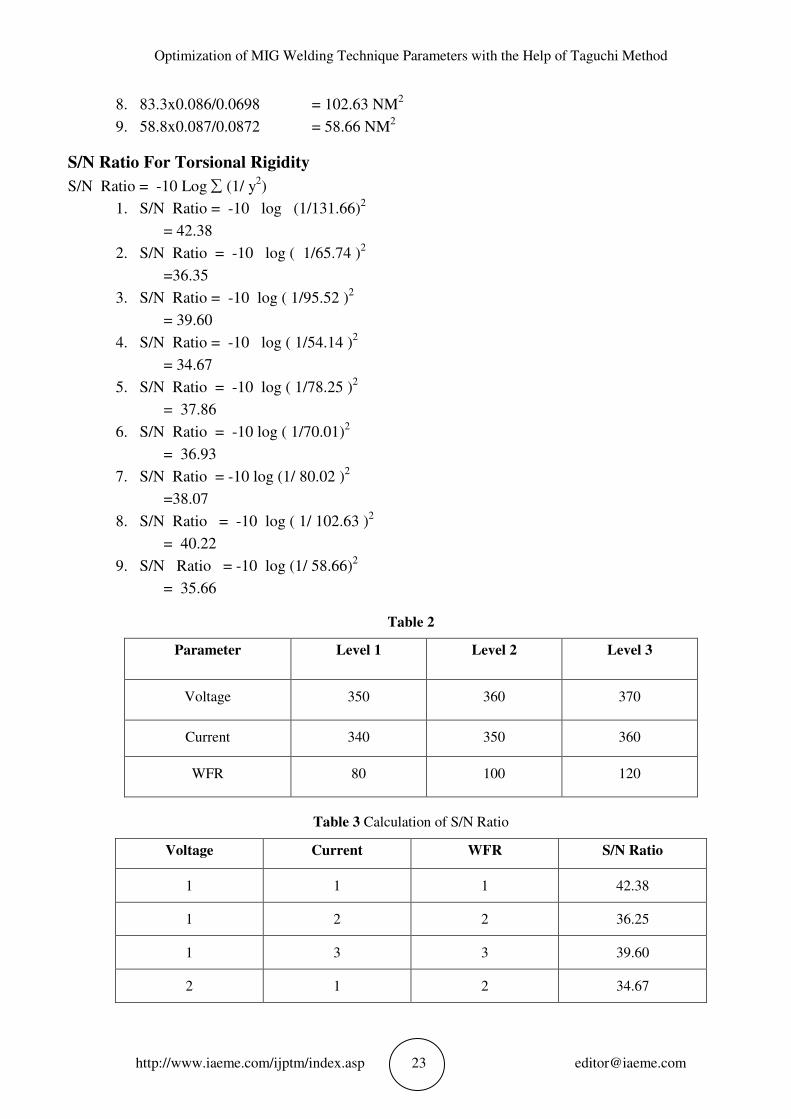
3 350 80 340 10 5 85
4 360 100 350 6.5 6 89
5 360 120 350 11 6 76
6 360 140 350 7 5 89
7 370 160 360 6 4 95
8 370 180 360 8.5 4 86
9 370 200 360 6 5 87
Calculation for Torsional Rigidity
R.NO. T(N-M) θθθθ(Radian) L (m)
1 68.6 0.0523 0.1
2 63.7 0.0872 0.09
3 98 0.0872 0.085
4 63.7 0.1047 0.089
5 107.8 0.1047 0.076
6 68.6 0.0872 0.089
7 58.8 0.0698 0.095
8 83.3 0.0698 0.086
9 58.8 0.0872 0.087
Torsional Rigidity
GJ= Torsional Rigidity
T/J=Gθ/L=τ/R
T/J=CQ/L
CJ=TL/Q
1. 68.6x0.1/0.0523 = 131.66 NM2
2. 63.7x0.090/0.0872 = 65.74 NM2
3. 98x0.085/0.0872 = 95.52 NM2
4. 63.7x0.089/0.1047 = 54.14 NM2
5. 107.8x0.076/0.1047 = 78.25 NM2
6. 68.6x0.089/0.0872 = 70.01 NM2
7. 58.8x0.095/0.0898 = 80.02 NM2
Optimization of MIG Welding Technique Parameters with the Help of Taguchi Method
http://www.iaeme.com/ijptm/index.asp 23 [email protected]
8. 83.3x0.086/0.0698 = 102.63 NM2
9. 58.8x0.087/0.0872 = 58.66 NM2
S/N Ratio For Torsional Rigidity
S/N Ratio = -10 Log ∑ (1/ y2)
1. S/N Ratio = -10 log (1/131.66)2
= 42.38
2. S/N Ratio = -10 log ( 1/65.74 )2
=36.35
3. S/N Ratio = -10 log ( 1/95.52 )2
= 39.60
4. S/N Ratio = -10 log ( 1/54.14 )2
= 34.67
5. S/N Ratio = -10 log ( 1/78.25 )2
= 37.86
6. S/N Ratio = -10 log ( 1/70.01)2
= 36.93
7. S/N Ratio = -10 log (1/ 80.02 )2
=38.07
8. S/N Ratio = -10 log ( 1/ 102.63 )2
= 40.22
9. S/N Ratio = -10 log (1/ 58.66)2
= 35.66
Table 2
Parameter Level 1 Level 2 Level 3
Voltage 350 360 370
Current 340 350 360
WFR 80 100 120
Table 3 Calculation of S/N Ratio
Voltage Current WFR S/N Ratio
1 1 1 42.38
1 2 2 36.25
1 3 3 39.60
2 1 2 34.67
Raj Kumar Yadav, Sandhaya Yadav, Pankaj Singh and Anurag Singh
http://www.iaeme.com/ijptm/index.asp 24 [email protected]
2 2 3 37.86
2 3 1 36.93
3 1 3 38.06
3 2 1 40.25
3 3 2 35.36
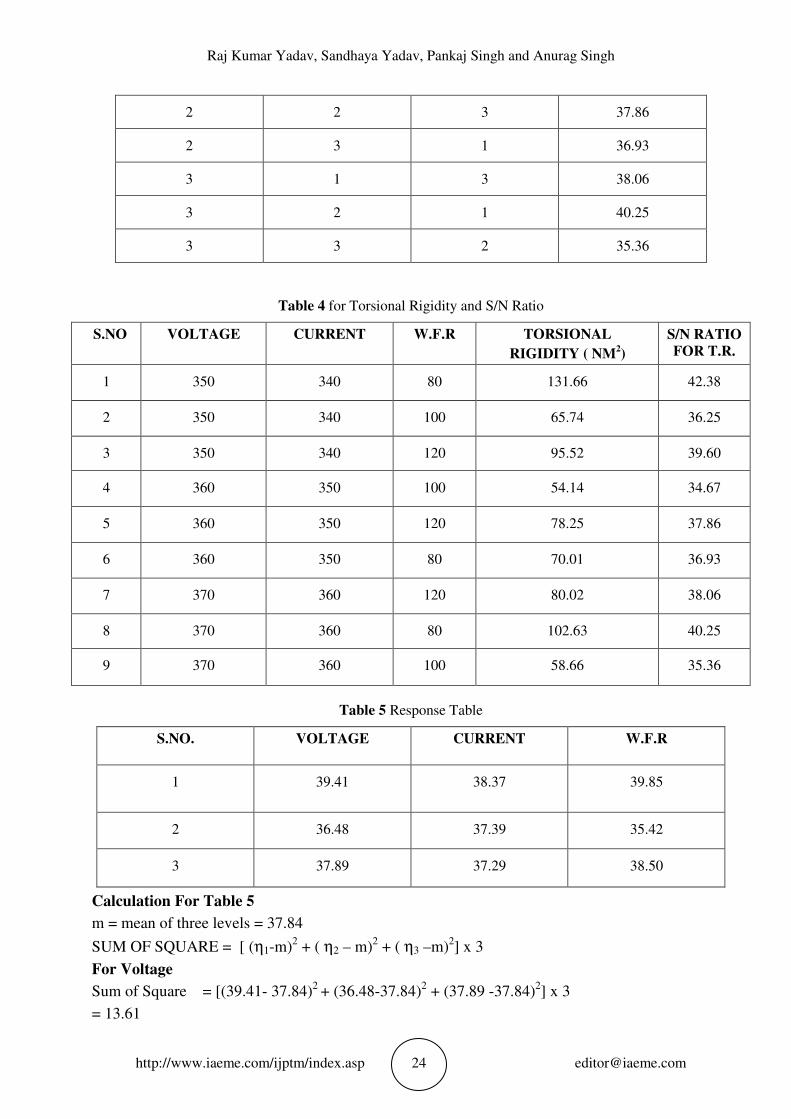
Table 4 for Torsional Rigidity and S/N Ratio
S.NO VOLTAGE CURRENT W.F.R TORSIONAL
RIGIDITY ( NM2)
S/N RATIO
FOR T.R.
1 350 340 80 131.66 42.38
2 350 340 100 65.74 36.25
3 350 340 120 95.52 39.60
4 360 350 100 54.14 34.67
5 360 350 120 78.25 37.86
6 360 350 80 70.01 36.93
7 370 360 120 80.02 38.06
8 370 360 80 102.63 40.25
9 370 360 100 58.66 35.36
Table 5 Response Table
S.NO. VOLTAGE CURRENT W.F.R
1 39.41 38.37 39.85
2 36.48 37.39 35.42
3 37.89 37.29 38.50
Calculation For Table 5
m = mean of three levels = 37.84
SUM OF SQUARE = [ (η1-m)2 + ( η2 – m)
2 + ( η3 –m)
2] x 3
For Voltage
Sum of Square = [(39.41- 37.84)2
+ (36.48-37.84)2 + (37.89 -37.84)
2] x 3
= 13.61
Optimization of MIG Welding Technique Parameters with the Help of Taguchi Method
http://www.iaeme.com/ijptm/index.asp 25 [email protected]
For Current
Sum of Square = [(38.37- 37.84)2
+ (37.39 -37.84)2 + (37.29 -
37.84)2] x 3
= 2.35
For F.W.R
Sum of Square = [(39.85- 37.84)2
+ (35.42 -37.84)2 + (38.50-
37.84)2] x 3
= 10.23
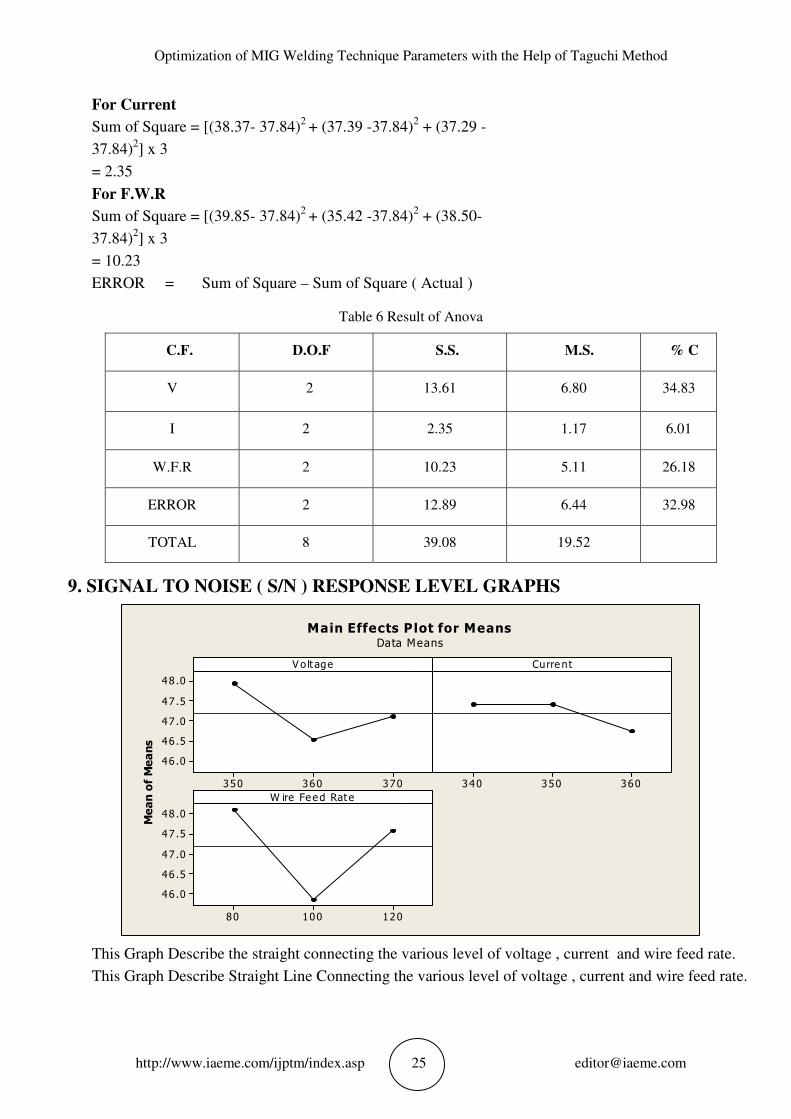
ERROR = Sum of Square – Sum of Square ( Actual )
Table 6 Result of Anova
C.F. D.O.F S.S. M.S. % C
V 2 13.61 6.80 34.83
I 2 2.35 1.17 6.01
W.F.R 2 10.23 5.11 26.18
ERROR 2 12.89 6.44 32.98
TOTAL 8 39.08 19.52
9. SIGNAL TO NOISE ( S/N ) RESPONSE LEVEL GRAPHS
370360350
48 .0
47 .5
47 .0
46 .5
46 .0
360350340
12010080
48 .0
47 .5
47 .0
46 .5
46 .0
V o lt age
Me
an
of
Me
an
s
Curre nt
W ire Feed Rate
Main Effects Plot for Means
Data Means
This Graph Describe the straight connecting the various level of voltage , current and wire feed rate.
This Graph Describe Straight Line Connecting the various level of voltage , current and wire feed rate.
Raj Kumar Yadav, Sandhaya Yadav, Pankaj Singh and Anurag Singh
http://www.iaeme.com/ijptm/index.asp 26 [email protected]
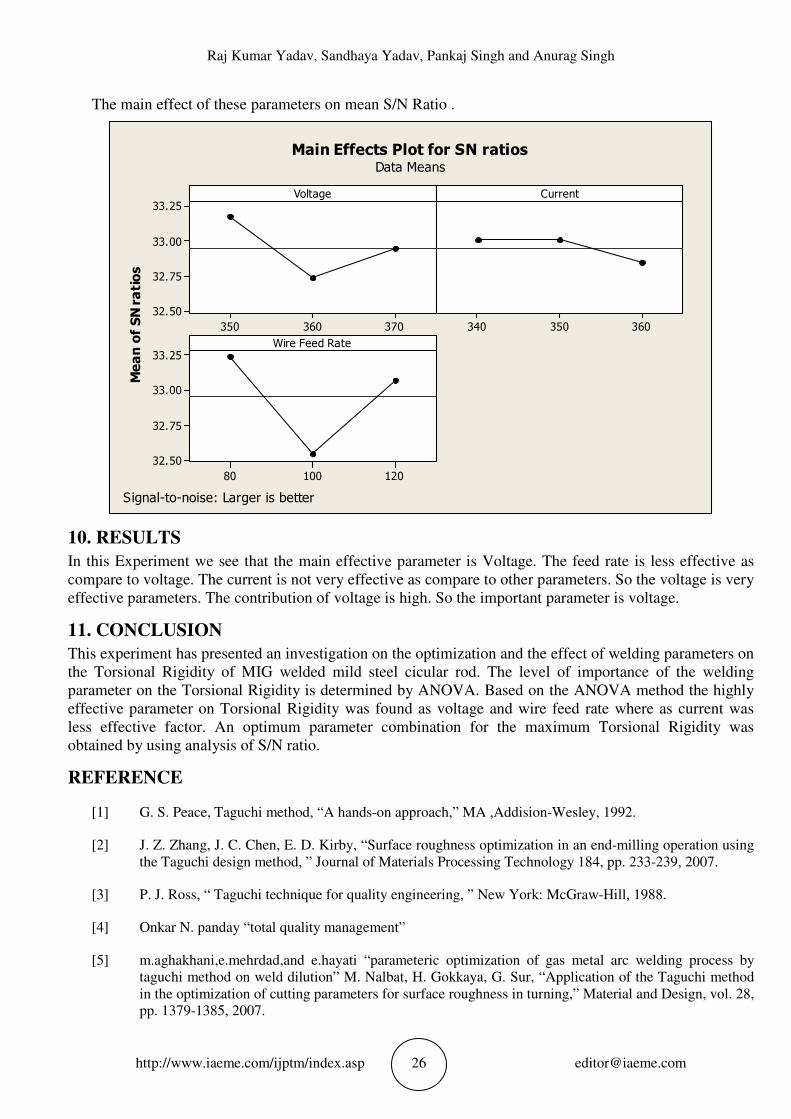
The main effect of these parameters on mean S/N Ratio .
370360350
33.25
33.00
32.75
32.50
360350340
12010080
33.25
33.00
32.75
32.50
Voltage
Me
an
of
SN
ra
tio
s
Current
Wire Feed Rate
Main Effects Plot for SN ratios
Data Means
Signal-to-noise: Larger is better
10. RESULTS
In this Experiment we see that the main effective parameter is Voltage. The feed rate is less effective as
compare to voltage. The current is not very effective as compare to other parameters. So the voltage is very
effective parameters. The contribution of voltage is high. So the important parameter is voltage.
11. CONCLUSION
This experiment has presented an investigation on the optimization and the effect of welding parameters on
the Torsional Rigidity of MIG welded mild steel cicular rod. The level of importance of the welding
parameter on the Torsional Rigidity is determined by ANOVA. Based on the ANOVA method the highly
effective parameter on Torsional Rigidity was found as voltage and wire feed rate where as current was
less effective factor. An optimum parameter combination for the maximum Torsional Rigidity was
obtained by using analysis of S/N ratio.
REFERENCE
[1] G. S. Peace, Taguchi method, “A hands-on approach,” MA ,Addision-Wesley, 1992.
[2] J. Z. Zhang, J. C. Chen, E. D. Kirby, “Surface roughness optimization in an end-milling operation using
the Taguchi design method, ” Journal of Materials Processing Technology 184, pp. 233-239, 2007.
[3] P. J. Ross, “ Taguchi technique for quality engineering, ” New York: McGraw-Hill, 1988.
[4] Onkar N. panday “total quality management”
[5] m.aghakhani,e.mehrdad,and e.hayati “parameteric optimization of gas metal arc welding process by
taguchi method on weld dilution” M. Nalbat, H. Gokkaya, G. Sur, “Application of the Taguchi method
in the optimization of cutting parameters for surface roughness in turning,” Material and Design, vol. 28,
pp. 1379-1385, 2007.
Optimization of MIG Welding Technique Parameters with the Help of Taguchi Method
http://www.iaeme.com/ijptm/index.asp 27 [email protected]
[6] P.J. Ross. 2005. Taguchi Techniques for Quality Engineering. 2nd Ed. Tata McGraw Hill.
[7] Ugur Esme. 2009. Application of Taguchi method for the optimization of resistance spot welding
process. The Arabian Journal for Science and Engineering. 34(28): 519-528.
[8] Fundamentals of American Welding Society. 1980. Welding Handbook Volume 1.
[9] American Welding Society. 1980. Welding Handbook Volume 3.
[10] S. Aslanlar. 2006. The effect of nucleus size on mechanical properties in electrical resistance spot
welding of sheets used in automotive industry. Materials and Design. 27: 125-131.
[11] Mr. Harshal K. Chavan, Mr. Gunwant D. Shelake & Dr. M. S. Kadam, Effect of Heat Input and Speed
of Welding on Distortion in MIG Welding, International Journal of Industrial Engineering Research
and Development (IJIERD), 3(2), 2012, pp. 42–50.
[12] Murat Vural, Ahmet Akkus. 2004. On the resistance spot weldability of galvanized interstitial free steel
sheets with austenitic stainless steel sheets. Journal of Materials Processing Technology. 153-154: 1-6.
[13] R. K. Roy, “ A primer on the Taguchi method, ” New York: Van Nostrand Reinhold, 1990
[14] P. J. Ross, “ Taguchi technique for quality engineering, ” New York:McGraw-Hill, 1988.
[15] R. K. Roy, “ A primer on the Taguchi method, ” New York: Van Nostrand Reinhold, 1990
[16] A.S. Shahi., S. Pandey., “Modeling of the effects of welding conditions on dilution of stainless steel
claddings produced bygas metal arc welding procedures, ” Journal of Materials Processing Technology,
196.,pp. 339–344, 2008.
[17] Mr. Harshal K. Chavan, Mr. Gunwant D. Shelake, Dr. M. S. Kadam, Finite Element Model to Predict
Residual Stresses in MIG Welding. International Journal of Mechanical Engineering and Technology
(IJMET), 3(3), 2012, pp.350–361.
[18] K. Kishore., P.V.G. Krishna., K. Veladri., S.Q. Ali., “Analysis of defects in gas shield arc welding of
AISI 1040 steel usingTaguchi Method,” ARPN Journal of Engineering and Applied Sciences. vol. 5.
No. 1, January 2010.