Embed Size (px)
Citation preview
Brazilian Journalof ChemicalEngineering
ISSN 0104-6632Printed in Brazil
www.scielo.br/bjce
Vol. 35, No. 03, pp. 1105-1116, July - September, 2018dx.doi.org/10.1590/0104-6632.20180353s20160724
OPTIMIZATION OF PREPARATION CONDITIONS FOR ACTIVATED CARBONS FROM
POLYETHYLENE TEREPHTHALATE USING RESPONSE SURFACE METHODOLOGY
Sureshkumar Ayyalusamy1,* and Susmita Mishra1
1 Department of Chemical Engineering, National Institute of Technology Rourkela, Odisha, India-769008
(Submitted: December 30, 2016; Revised: July 26, 2017; Accepted: September 6, 2017)
Abstract - This work proposes the optimal conditions for the preparation of activated carbons from polyethylene terephthalate (PET) with good surface area and yield. The PET-based activated carbon was prepared using a chemical activation technique employing sulfuric acid (H2SO4). Different preparation conditions involving impregnation ratio, activation temperature and activation time were investigated to evaluate their effects on both surface area and yield. The central composite design (CCD) approach was adopted to determine the effects of preparation conditions on responses. Based on the CCD, quadratic models for both surface area and yield were developed. The significant factors for each experimental design response were identified from the analysis of variance (ANOVA). The optimum conditions for PET-based activated carbon preparation were obtained by using an impregnation ratio of 37.63%, activation temperature of 600ºC, and activation time of 30 min, which resulted in 537 m2/g of surface area and a 12.57% yield.Keywords: Polyethylene terephthalate; Activated carbon; Surface area; Response surface methodology; Central composite design.
INTRODUCTION
Polyethelene terephthalate (PET) bottles have become an inseparable and integral part of our lives. In recent years the production and consumption of PET has recorded the fastest growth rate in the global plastics market (Kuczenski and Geyer, 2010). The overall world consumption of PET amounted to about 13 million tons/year in 1997 and increased to about 26 million tons/year in 2007 (Karayannidis and Achilias, 2007). The discharge of PET bottle waste is a serious challenge for waste management strategies
due to the large amount of solid waste produced. Stringent environmental laws have demanded suitable alternatives by which it can be reused or recycled (Hayashi et al., 2005). Most common technology adopted to mitigate the PET disposal problem is through incineration or recycling. To make better use of this cheap and abundant plastic waste, it is proposed to convert it into activated carbon because of its high percentage carbon content and its excess availability in relatively pure state.
Activated carbon can be produced from different precursors, such as coconut shell (Yang et al., 2010),
*Corresponding author. E-mail address: [email protected], [email protected]
1106 SureshkumarAyyalusamy and Susmita Mishra
Brazilian Journal of Chemical Engineering
rice husk (Foo and Hameed, 2011), sugarcane bagasse (Kalderis et al., 2008), almond shell (Hayashi et al., 2002), date stone (Foo and Hameed, 2011), bamboo (Liu et al., 2010), corn cob (Song et al., 2013), cherry stone (Olivares-Marín et al., 2012), oil palm shell (Tan et al., 2008), rice straw (Gao et al., 2011). However, the ample availability of post-consumer PET bottle makes production of activated carbon more financially viable and also reduces solid polymer waste in landfills (Laszlo, 2005).
There are two methods for preparation of activated carbon: physical activation and chemical activation. Physical activation consists of two steps: carbonization of raw materials followed by activation with CO2 or steam. In chemical activation both carbonization and the activation step proceed simultaneously. Chemical activation presents several advantages over physical activation, such as lower activation temperature, a single step process and higher yield. Many researchers have recognized and utilized PET as a potential resource to prepare activated carbon through physical and combined (chemical + physical) activation (Bratek et al., 2013; Kartel et al., 2006). However, only limited research has been carried out with direct single step chemical activation.
In this study, the preparation of activated carbon from post-consumer PET impregnated with sulfuric acid was carried out. Sulfuric acid is more favored because it is a less expensive and non-volatile dehydrating agent. Of all the available chemicals, sulfuric acid has been frequently used as cleaning and de-ashing agent of AC precursors (Olivares-Marín et al., 2012). Thus, the use of sulfuric acid for carbonization purposes may be advantageous in terms of cost and chemical composition of activated carbon.
The most significant characteristic of an activated carbon is its surface area and yield which is highly influenced by its preparatory conditions (Olivares-Marin et al., 2006). In evaluating the effect of process parameters on the prepared activated carbon, the use of an adequate experimental design is particularly important. Response surface methodology (RSM) with central composite design (CCD) is an established statistical tool for optimization of process conditions, since it takes a minimum number of systematic experimental runs for optimization, which reduces time, cost as well as resources. It can assess interaction effects between parameters affecting process conditions (Ahmed et al., 2009). Optimization of experimental conditions using RSM has been widely applied in various processes, including activated carbon preparation using precursors such as
mangosteen peel (Ahmed et al., 2010), tamarind wood (Sahu at al. 2010), and coconut husk (Tan et al., 2008). However, to the best our knowledge, the use of RSM as the optimization technique in the preparation of activated carbon from PET by the method of chemical activation with sulfuric acid as activating agent has not been investigated before.
The present work is focused on optimizing the preparatory conditions of activated carbon from PET with good surface area and yield. A central composite design was selected to study simultaneously the effects of three numerical preparation variables: chemical impregnation ratio, activation temperature and activation time on surface area and yield. Empirical models correlating the surface area and the activated carbon yield to the three variables were then developed.
MATERIALS AND METHODS
Reagents
Raw material, PET, was collected from the premises of the, National Institute of Technology Rourkela, India. Sulfuric acid (analytical grade) used for the chemical activation was procured from Merck (India) Ltd.
Preparation of activated carbonThe precursor was properly washed with distilled
water to remove dirt from its surface and dried. The dried PET was cut into small pieces of size 5-10 mm. 10 g of PET granules were impregnated with 100 mL of dilute H2SO4 to varying concentration in the range of 10-70%. The samples were soaked for 24 h at 85ºC and then dried for 3 h at 120ºC. The resulting impregnated samples were activated in a tubular furnace and heated to final temperature ranges between 600 - 800ºC, at a definite heating rate of 10ºC/min under continuous N2 flow of 100 mL/min. Holding time at the final temperature was varied between 0 - 90 min. After cooling, the activated carbon was subjected to thorough washing with base (0.1 mol/L aqueous NaOH solution), then hot water (80ºC) until the rinsed water showed neutral pH. The samples were dried at 120ºC for 24 h and stored in air-tight containers.
Design of Experiments
Response surface methodology (RSM) is a statistical method that uses quantitative data from appropriate experiments to determine regression model equations and operating conditions (Alam et al., 2007). A standard RSM design called central composite design (CCD) was employed in this work to study the
Brazilian Journal of Chemical Engineering Vol. 35, No. 03, pp. 1105-1116, July - September, 2018
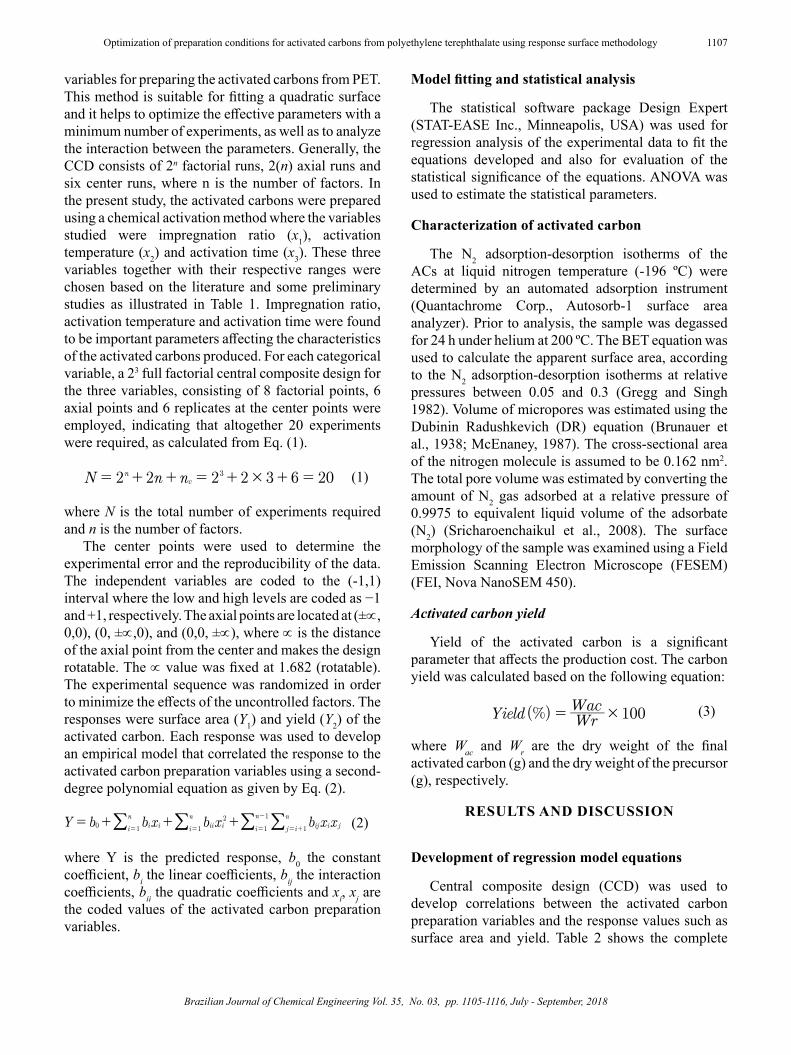
1107Optimization of preparation conditions for activated carbons from polyethylene terephthalate using response surface methodology
variables for preparing the activated carbons from PET. This method is suitable for fitting a quadratic surface and it helps to optimize the effective parameters with a minimum number of experiments, as well as to analyze the interaction between the parameters. Generally, the CCD consists of 2n factorial runs, 2(n) axial runs and six center runs, where n is the number of factors. In the present study, the activated carbons were prepared using a chemical activation method where the variables studied were impregnation ratio (x1), activation temperature (x2) and activation time (x3). These three variables together with their respective ranges were chosen based on the literature and some preliminary studies as illustrated in Table 1. Impregnation ratio, activation temperature and activation time were found to be important parameters affecting the characteristics of the activated carbons produced. For each categorical variable, a 23 full factorial central composite design for the three variables, consisting of 8 factorial points, 6 axial points and 6 replicates at the center points were employed, indicating that altogether 20 experiments were required, as calculated from Eq. (1).
(1)
where N is the total number of experiments required and n is the number of factors.
The center points were used to determine the experimental error and the reproducibility of the data. The independent variables are coded to the (-1,1) interval where the low and high levels are coded as −1 and +1, respectively. The axial points are located at (±∝, 0,0), (0, ±∝,0), and (0,0, ±∝), where ∝ is the distance of the axial point from the center and makes the design rotatable. The ∝ value was fixed at 1.682 (rotatable). The experimental sequence was randomized in order to minimize the effects of the uncontrolled factors. The responses were surface area (Y1) and yield (Y2) of the activated carbon. Each response was used to develop an empirical model that correlated the response to the activated carbon preparation variables using a second-degree polynomial equation as given by Eq. (2).
(2)
where Y is the predicted response, b0 the constant coefficient, bi the linear coefficients, bij the interaction coefficients, bii the quadratic coefficients and xi, xj are the coded values of the activated carbon preparation variables.
Model fitting and statistical analysis
The statistical software package Design Expert (STAT-EASE Inc., Minneapolis, USA) was used for regression analysis of the experimental data to fit the equations developed and also for evaluation of the statistical significance of the equations. ANOVA was used to estimate the statistical parameters.
Characterization of activated carbon
The N2 adsorption-desorption isotherms of the ACs at liquid nitrogen temperature (-196 ºC) were determined by an automated adsorption instrument (Quantachrome Corp., Autosorb-1 surface area analyzer). Prior to analysis, the sample was degassed for 24 h under helium at 200 ºC. The BET equation was used to calculate the apparent surface area, according to the N2 adsorption-desorption isotherms at relative pressures between 0.05 and 0.3 (Gregg and Singh 1982). Volume of micropores was estimated using the Dubinin Radushkevich (DR) equation (Brunauer et al., 1938; McEnaney, 1987). The cross-sectional area of the nitrogen molecule is assumed to be 0.162 nm2. The total pore volume was estimated by converting the amount of N2 gas adsorbed at a relative pressure of 0.9975 to equivalent liquid volume of the adsorbate (N2) (Sricharoenchaikul et al., 2008). The surface morphology of the sample was examined using a Field Emission Scanning Electron Microscope (FESEM) (FEI, Nova NanoSEM 450).
Activated carbon yield
Yield of the activated carbon is a significant parameter that affects the production cost. The carbon yield was calculated based on the following equation:
(3)
where Wac and Wr are the dry weight of the final activated carbon (g) and the dry weight of the precursor (g), respectively.
RESULTS AND DISCUSSION
Development of regression model equations
Central composite design (CCD) was used to develop correlations between the activated carbon preparation variables and the response values such as surface area and yield. Table 2 shows the complete
N n n2 2 2 2 3 6 20nc
3 #= + + = + + =
Y b b x b x b x xi ii
nii i ij i jj i
n
i
n
i
n0 1
2
11
1
1= + + +
= = +=
-
=/ ///
(%)Yield WrWac 100#=
1108 SureshkumarAyyalusamy and Susmita Mishra
Brazilian Journal of Chemical Engineering
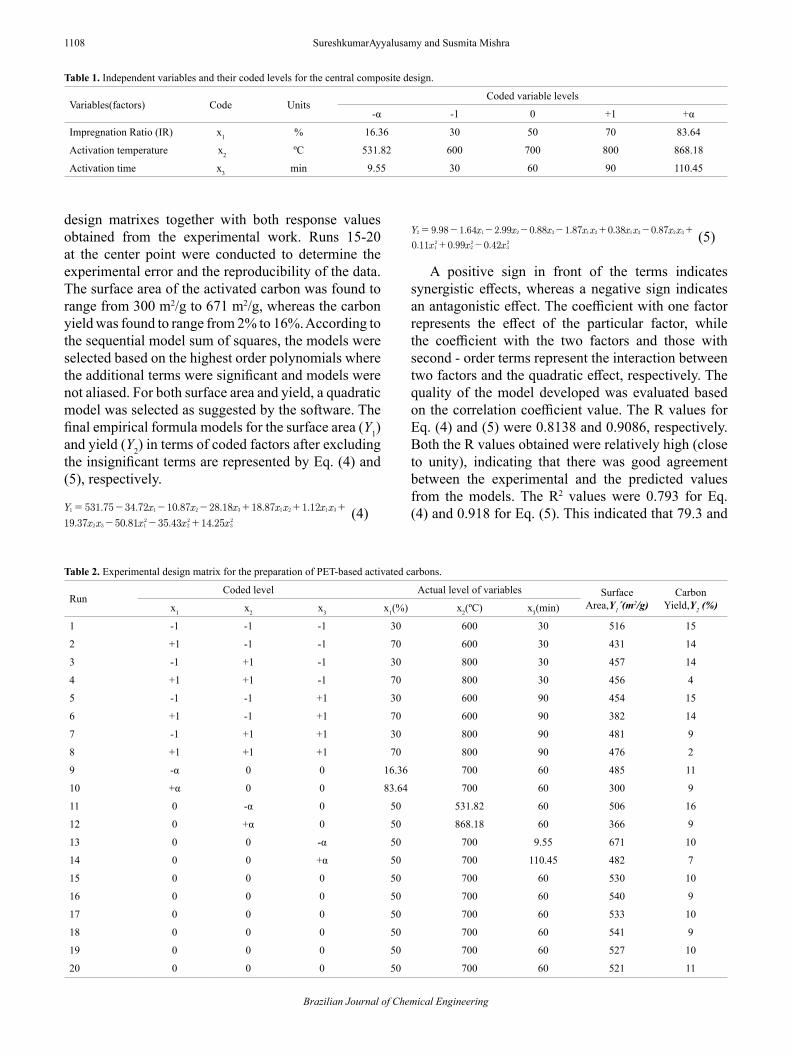
design matrixes together with both response values obtained from the experimental work. Runs 15-20 at the center point were conducted to determine the experimental error and the reproducibility of the data. The surface area of the activated carbon was found to range from 300 m2/g to 671 m2/g, whereas the carbon yield was found to range from 2% to 16%. According to the sequential model sum of squares, the models were selected based on the highest order polynomials where the additional terms were significant and models were not aliased. For both surface area and yield, a quadratic model was selected as suggested by the software. The final empirical formula models for the surface area (Y1) and yield (Y2) in terms of coded factors after excluding the insignificant terms are represented by Eq. (4) and (5), respectively.
(4)
(5)
A positive sign in front of the terms indicates synergistic effects, whereas a negative sign indicates an antagonistic effect. The coefficient with one factor represents the effect of the particular factor, while the coefficient with the two factors and those with second - order terms represent the interaction between two factors and the quadratic effect, respectively. The quality of the model developed was evaluated based on the correlation coefficient value. The R values for Eq. (4) and (5) were 0.8138 and 0.9086, respectively. Both the R values obtained were relatively high (close to unity), indicating that there was good agreement between the experimental and the predicted values from the models. The R2 values were 0.793 for Eq. (4) and 0.918 for Eq. (5). This indicated that 79.3 and
Table 1. Independent variables and their coded levels for the central composite design.
Variables(factors) Code UnitsCoded variable levels
-α -1 0 +1 +α
Impregnation Ratio (IR) x1 % 16.36 30 50 70 83.64
Activation temperature x2 ºC 531.82 600 700 800 868.18
Activation time x3 min 9.55 30 60 90 110.45
. . . . . .
. . . .
Y x x x x x x x
x x x x x
531 75 34 72 10 87 28 18 18 87 1 12
19 37 50 81 35 43 14 25
1 1 2 3 1 2 1 3
2 3 12
22
32
= - - - + + +
- - +
Table 2. Experimental design matrix for the preparation of PET-based activated carbons.
RunCoded level Actual level of variables Surface
Area,Y1´(m2/g)
Carbon Yield,Y2 (%)x1 x2 x3 x1(%) x2(ºC) x3(min)
1 -1 -1 -1 30 600 30 516 15
2 +1 -1 -1 70 600 30 431 14
3 -1 +1 -1 30 800 30 457 14
4 +1 +1 -1 70 800 30 456 4
5 -1 -1 +1 30 600 90 454 15
6 +1 -1 +1 70 600 90 382 14
7 -1 +1 +1 30 800 90 481 9
8 +1 +1 +1 70 800 90 476 2
9 -α 0 0 16.36 700 60 485 11
10 +α 0 0 83.64 700 60 300 9
11 0 -α 0 50 531.82 60 506 16
12 0 +α 0 50 868.18 60 366 9
13 0 0 -α 50 700 9.55 671 10
14 0 0 +α 50 700 110.45 482 7
15 0 0 0 50 700 60 530 10
16 0 0 0 50 700 60 540 9
17 0 0 0 50 700 60 533 10
18 0 0 0 50 700 60 541 9
19 0 0 0 50 700 60 527 10
20 0 0 0 50 700 60 521 11
. . . . . . .
. . .
Y x x x x x x x x x
x x x
9 98 1 64 2 99 0 88 1 87 0 38 0 87
0 11 0 99 0 42
2 1 2 3 1 2 1 3 2 3
12
22
32
= - - - - + - +
+ -
Brazilian Journal of Chemical Engineering Vol. 35, No. 03, pp. 1105-1116, July - September, 2018
1109Optimization of preparation conditions for activated carbons from polyethylene terephthalate using response surface methodology
91.8% of the total variation in the surface area and activated carbon yield, respectively, were attributed to the experimental variables studied. The standard deviations for the two models were 9.00 and 1.50 respectively for Eq. (4) and (5). The closer the R2 value to unity and the smaller the standard deviation, the better the model will be as it will give a predicted value which is closer to the actual value for the response. This indicated that the predicted value for Y2 should be more accurate and closer to its actual value compared to Y1.
Analysis of variance (ANOVA) was used to examine the significance of the fitting model along with effects of their parameters. In the present study ANOVA using the response surface quadratic model was employed to examine surface area and yield of activated carbon. A higher F-value indicates an adequacy of variation about its mean and a p-value (Prob. > F) less than 0.05 indicates the model is significant.
From the ANOVA for the response surface quadratic model for the surface area of the activated carbon, presented in Table 3, the model F-value of 4.86 and Prob. > F as 0.0106 revealed that the model is significant. In this case, x1,x3, x1
2 and x22 were
significant model terms, whereas x2, x1, x2, x2, x3, x1, x3 and x3
2 were all insignificant for the response. Hence, Eq. (4) can be used to study the effect of impregnation ratio, activation temperature and activation time on the surface area of the activated carbon.
The ANOVA for the quadratic model for the activated carbon yield is listed in Table 4. The model F-value of 10.71 and Prob. > F as 0.0005 implied that the model is significant. In this case x1, x2, x1x2 and x2
2 were significant model terms, whereas x3, x2x3, x1x3, x1
2 and x32 were negligible for the response.
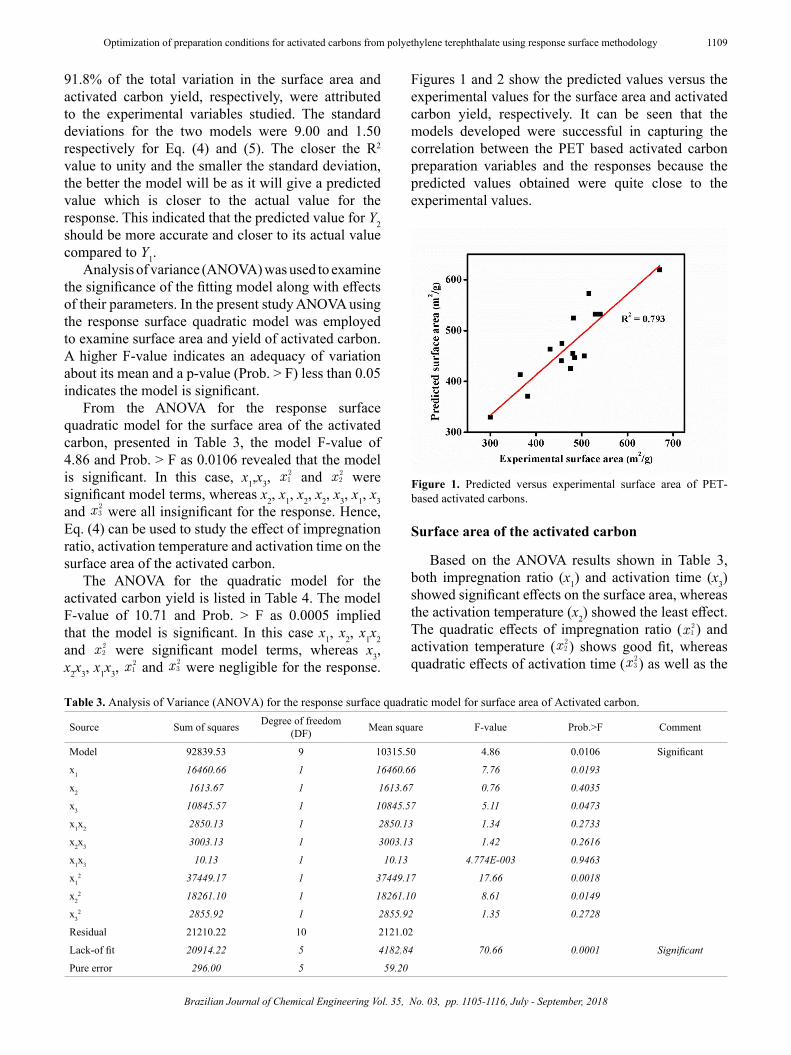
Figures 1 and 2 show the predicted values versus the experimental values for the surface area and activated carbon yield, respectively. It can be seen that the models developed were successful in capturing the correlation between the PET based activated carbon preparation variables and the responses because the predicted values obtained were quite close to the experimental values.
Table 3. Analysis of Variance (ANOVA) for the response surface quadratic model for surface area of Activated carbon.
Source Sum of squares Degree of freedom (DF) Mean square F-value Prob.>F Comment
Model 92839.53 9 10315.50 4.86 0.0106 Significant
x1 16460.66 1 16460.66 7.76 0.0193
x2 1613.67 1 1613.67 0.76 0.4035
x3 10845.57 1 10845.57 5.11 0.0473
x1x2 2850.13 1 2850.13 1.34 0.2733
x2x3 3003.13 1 3003.13 1.42 0.2616
x1x3 10.13 1 10.13 4.774E-003 0.9463
x12 37449.17 1 37449.17 17.66 0.0018
x22 18261.10 1 18261.10 8.61 0.0149
x32 2855.92 1 2855.92 1.35 0.2728
Residual 21210.22 10 2121.02
Lack-of fit 20914.22 5 4182.84 70.66 0.0001 Significant
Pure error 296.00 5 59.20
Figure 1. Predicted versus experimental surface area of PET-based activated carbons.
Surface area of the activated carbon
Based on the ANOVA results shown in Table 3, both impregnation ratio (x1) and activation time (x3) showed significant effects on the surface area, whereas the activation temperature (x2) showed the least effect. The quadratic effects of impregnation ratio (x1
2) and activation temperature (x2
2) shows good fit, whereas quadratic effects of activation time (x3
2) as well as the
1110 SureshkumarAyyalusamy and Susmita Mishra
Brazilian Journal of Chemical Engineering
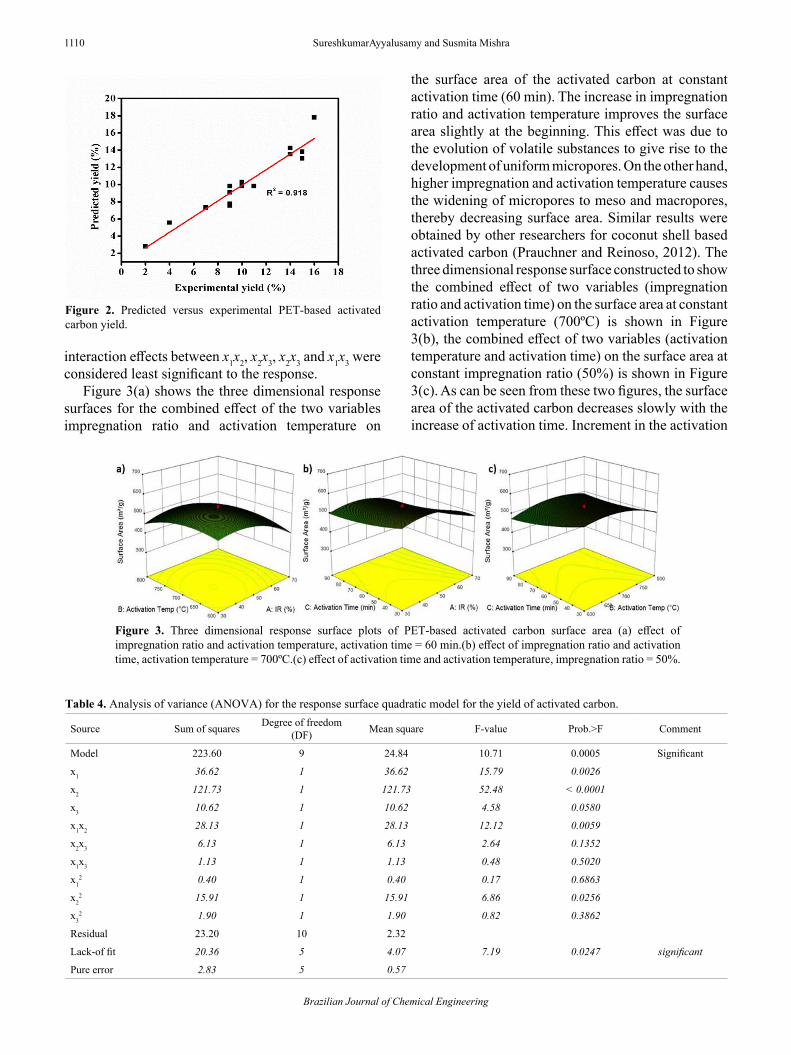
Figure 2. Predicted versus experimental PET-based activated carbon yield.
Table 4. Analysis of variance (ANOVA) for the response surface quadratic model for the yield of activated carbon.
Source Sum of squares Degree of freedom (DF) Mean square F-value Prob.>F Comment
Model 223.60 9 24.84 10.71 0.0005 Significant
x1 36.62 1 36.62 15.79 0.0026
x2 121.73 1 121.73 52.48 < 0.0001
x3 10.62 1 10.62 4.58 0.0580
x1x2 28.13 1 28.13 12.12 0.0059
x2x3 6.13 1 6.13 2.64 0.1352
x1x3 1.13 1 1.13 0.48 0.5020
x12 0.40 1 0.40 0.17 0.6863
x22 15.91 1 15.91 6.86 0.0256
x32 1.90 1 1.90 0.82 0.3862
Residual 23.20 10 2.32
Lack-of fit 20.36 5 4.07 7.19 0.0247 significant
Pure error 2.83 5 0.57
Figure 3. Three dimensional response surface plots of PET-based activated carbon surface area (a) effect of impregnation ratio and activation temperature, activation time = 60 min.(b) effect of impregnation ratio and activation time, activation temperature = 700ºC.(c) effect of activation time and activation temperature, impregnation ratio = 50%.
interaction effects between x1x2, x2x3, x2x3 and x1x3 were considered least significant to the response.
Figure 3(a) shows the three dimensional response surfaces for the combined effect of the two variables impregnation ratio and activation temperature on
the surface area of the activated carbon at constant activation time (60 min). The increase in impregnation ratio and activation temperature improves the surface area slightly at the beginning. This effect was due to the evolution of volatile substances to give rise to the development of uniform micropores. On the other hand, higher impregnation and activation temperature causes the widening of micropores to meso and macropores, thereby decreasing surface area. Similar results were obtained by other researchers for coconut shell based activated carbon (Prauchner and Reinoso, 2012). The three dimensional response surface constructed to show the combined effect of two variables (impregnation ratio and activation time) on the surface area at constant activation temperature (700ºC) is shown in Figure 3(b), the combined effect of two variables (activation temperature and activation time) on the surface area at constant impregnation ratio (50%) is shown in Figure 3(c). As can be seen from these two figures, the surface area of the activated carbon decreases slowly with the increase of activation time. Increment in the activation
Brazilian Journal of Chemical Engineering Vol. 35, No. 03, pp. 1105-1116, July - September, 2018
1111Optimization of preparation conditions for activated carbons from polyethylene terephthalate using response surface methodology
time causes the developed pores to enlarge or even collapse, thus reducing the surface area. These results were consistent with previous studies reported by Diao et al. (2002) on grain sorghum based activated carbon with phosphoric acid activation.
An increment in the activation time causes the developed pores to enlarge or even collapse, thus reducing the surface area (Diao et al., 2002).
Activated carbon yield
ANOVA for the response surface quadratic model for the activated carbon yield is shown in Table 4. Activation temperature (x2) was found to have the most significant effect on activated carbon yield, indicated by the highest F-value of 52.48. Similarly impregnation ratio (x1) and interaction effect (x1x2) showed almost the same effect, but are less significant compared to activation temperature. However, activation time, quadratic effects of all factors and the interaction effects except (x1x2) were insignificant.
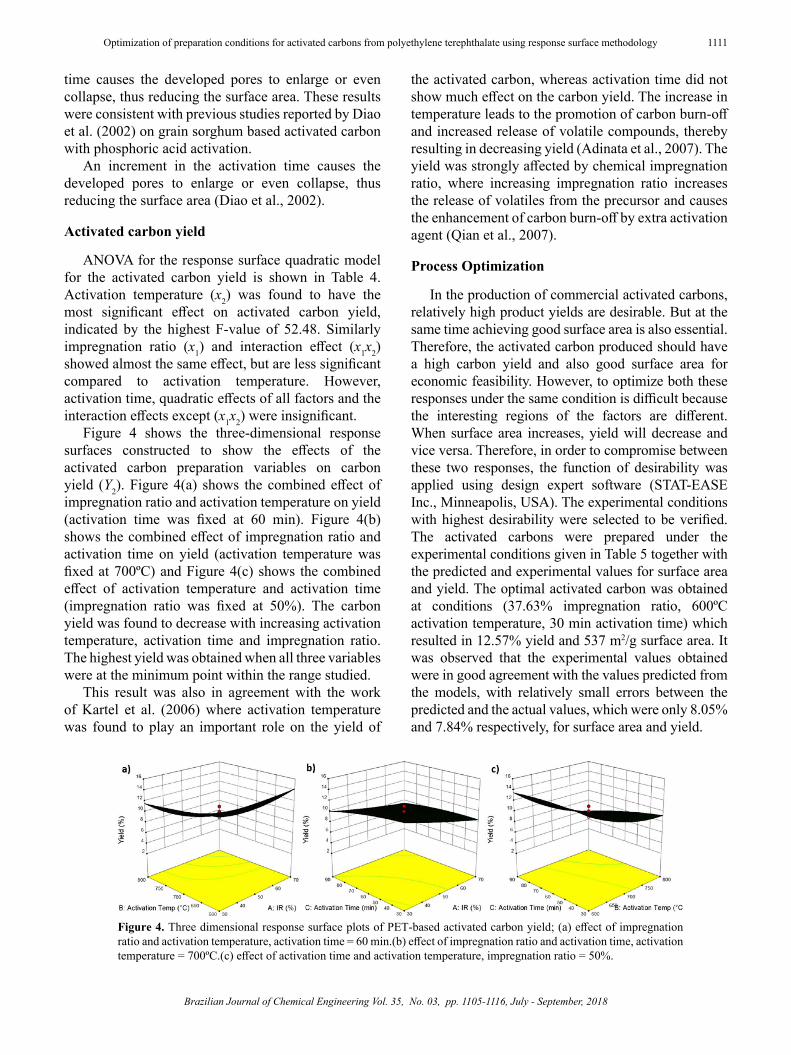
Figure 4 shows the three-dimensional response surfaces constructed to show the effects of the activated carbon preparation variables on carbon yield (Y2). Figure 4(a) shows the combined effect of impregnation ratio and activation temperature on yield (activation time was fixed at 60 min). Figure 4(b) shows the combined effect of impregnation ratio and activation time on yield (activation temperature was fixed at 700ºC) and Figure 4(c) shows the combined effect of activation temperature and activation time (impregnation ratio was fixed at 50%). The carbon yield was found to decrease with increasing activation temperature, activation time and impregnation ratio. The highest yield was obtained when all three variables were at the minimum point within the range studied.
This result was also in agreement with the work of Kartel et al. (2006) where activation temperature was found to play an important role on the yield of
the activated carbon, whereas activation time did not show much effect on the carbon yield. The increase in temperature leads to the promotion of carbon burn-off and increased release of volatile compounds, thereby resulting in decreasing yield (Adinata et al., 2007). The yield was strongly affected by chemical impregnation ratio, where increasing impregnation ratio increases the release of volatiles from the precursor and causes the enhancement of carbon burn-off by extra activation agent (Qian et al., 2007).
Process Optimization
In the production of commercial activated carbons, relatively high product yields are desirable. But at the same time achieving good surface area is also essential. Therefore, the activated carbon produced should have a high carbon yield and also good surface area for economic feasibility. However, to optimize both these responses under the same condition is difficult because the interesting regions of the factors are different. When surface area increases, yield will decrease and vice versa. Therefore, in order to compromise between these two responses, the function of desirability was applied using design expert software (STAT-EASE Inc., Minneapolis, USA). The experimental conditions with highest desirability were selected to be verified. The activated carbons were prepared under the experimental conditions given in Table 5 together with the predicted and experimental values for surface area and yield. The optimal activated carbon was obtained at conditions (37.63% impregnation ratio, 600ºC activation temperature, 30 min activation time) which resulted in 12.57% yield and 537 m2/g surface area. It was observed that the experimental values obtained were in good agreement with the values predicted from the models, with relatively small errors between the predicted and the actual values, which were only 8.05% and 7.84% respectively, for surface area and yield.
Figure 4. Three dimensional response surface plots of PET-based activated carbon yield; (a) effect of impregnation ratio and activation temperature, activation time = 60 min.(b) effect of impregnation ratio and activation time, activation temperature = 700ºC.(c) effect of activation time and activation temperature, impregnation ratio = 50%.
1112 SureshkumarAyyalusamy and Susmita Mishra
Brazilian Journal of Chemical Engineering
Characterization of activated carbon prepared under the optimum conditions
BET surface area and pore volumeThe adsorption-desorption isotherms of the
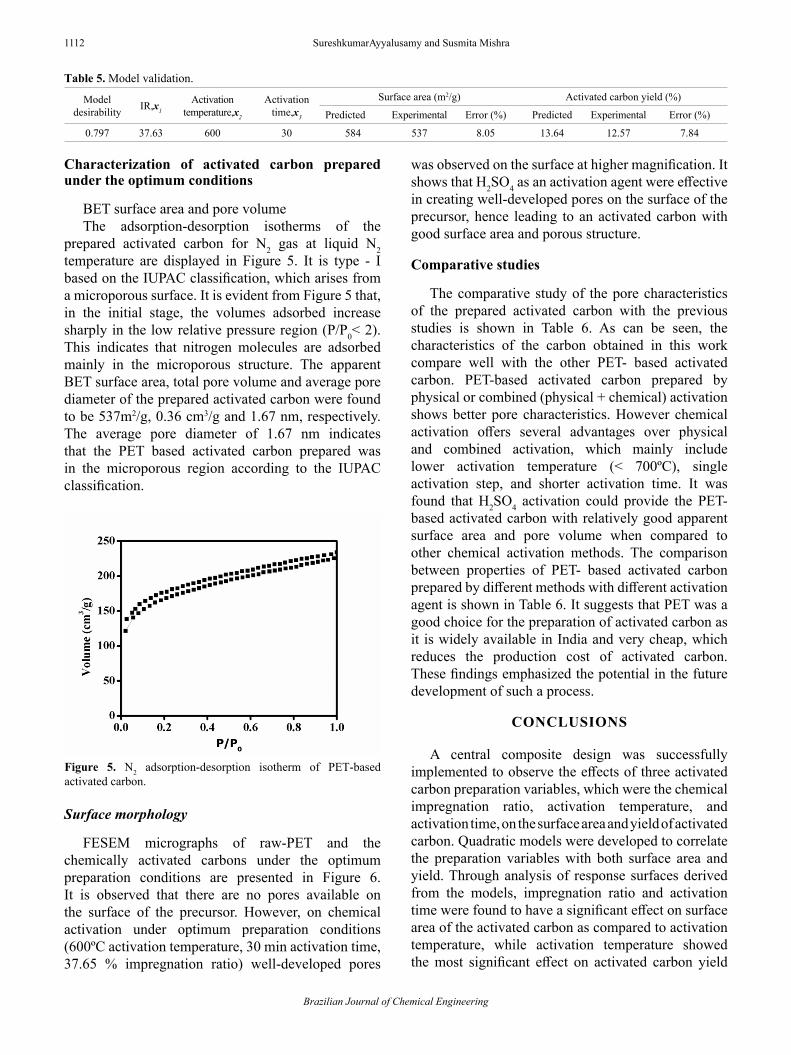
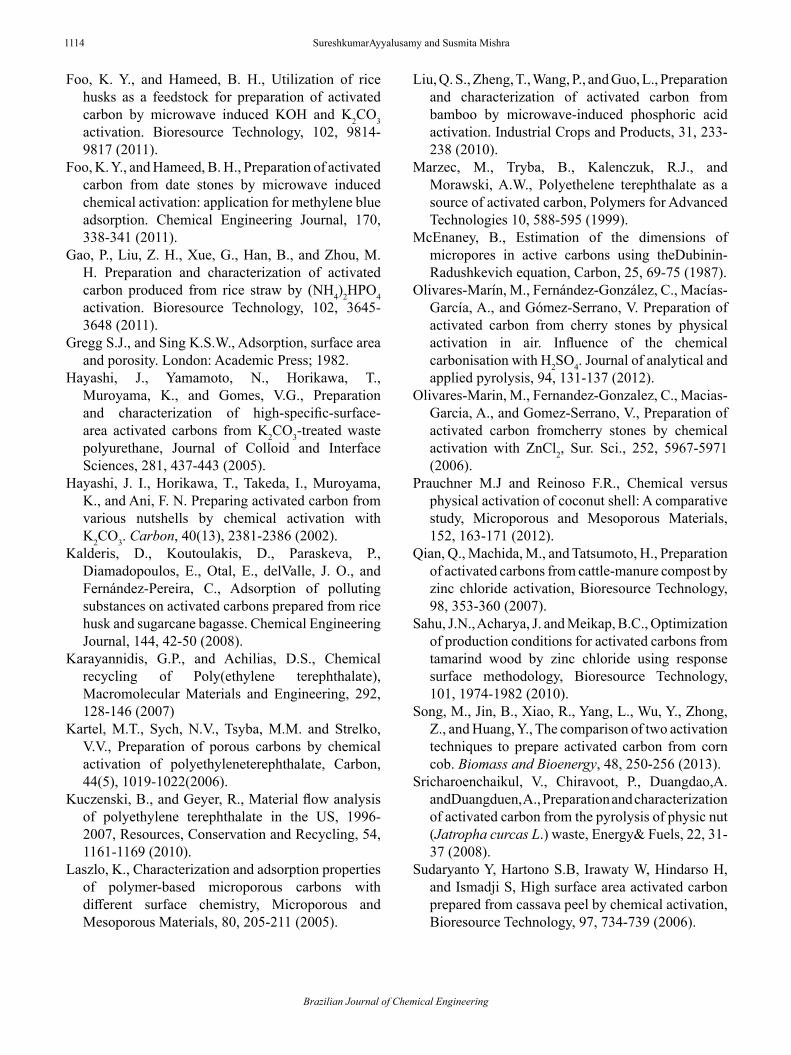
prepared activated carbon for N2 gas at liquid N2 temperature are displayed in Figure 5. It is type - I based on the IUPAC classification, which arises from a microporous surface. It is evident from Figure 5 that, in the initial stage, the volumes adsorbed increase sharply in the low relative pressure region (P/P0< 2). This indicates that nitrogen molecules are adsorbed mainly in the microporous structure. The apparent BET surface area, total pore volume and average pore diameter of the prepared activated carbon were found to be 537m2/g, 0.36 cm3/g and 1.67 nm, respectively. The average pore diameter of 1.67 nm indicates that the PET based activated carbon prepared was in the microporous region according to the IUPAC classification.
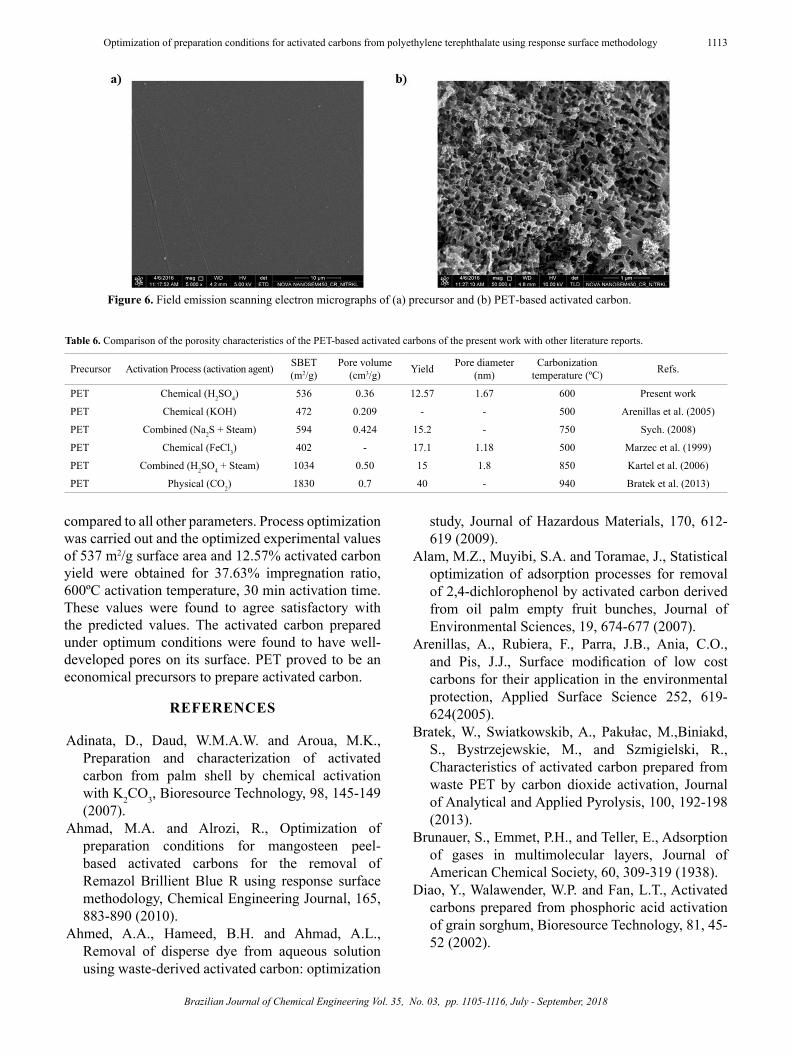
was observed on the surface at higher magnification. It shows that H2SO4 as an activation agent were effective in creating well-developed pores on the surface of the precursor, hence leading to an activated carbon with good surface area and porous structure.
Comparative studies
The comparative study of the pore characteristics of the prepared activated carbon with the previous studies is shown in Table 6. As can be seen, the characteristics of the carbon obtained in this work compare well with the other PET- based activated carbon. PET-based activated carbon prepared by physical or combined (physical + chemical) activation shows better pore characteristics. However chemical activation offers several advantages over physical and combined activation, which mainly include lower activation temperature (< 700ºC), single activation step, and shorter activation time. It was found that H2SO4 activation could provide the PET-based activated carbon with relatively good apparent surface area and pore volume when compared to other chemical activation methods. The comparison between properties of PET- based activated carbon prepared by different methods with different activation agent is shown in Table 6. It suggests that PET was a good choice for the preparation of activated carbon as it is widely available in India and very cheap, which reduces the production cost of activated carbon. These findings emphasized the potential in the future development of such a process.
CONCLUSIONS
A central composite design was successfully implemented to observe the effects of three activated carbon preparation variables, which were the chemical impregnation ratio, activation temperature, and activation time, on the surface area and yield of activated carbon. Quadratic models were developed to correlate the preparation variables with both surface area and yield. Through analysis of response surfaces derived from the models, impregnation ratio and activation time were found to have a significant effect on surface area of the activated carbon as compared to activation temperature, while activation temperature showed the most significant effect on activated carbon yield
Table 5. Model validation.
Model desirability IR,x1
Activation temperature,x2
Activation time,x3
Surface area (m2/g) Activated carbon yield (%)
Predicted Experimental Error (%) Predicted Experimental Error (%)
0.797 37.63 600 30 584 537 8.05 13.64 12.57 7.84
Figure 5. N2 adsorption-desorption isotherm of PET-based activated carbon.
Surface morphology
FESEM micrographs of raw-PET and the chemically activated carbons under the optimum preparation conditions are presented in Figure 6. It is observed that there are no pores available on the surface of the precursor. However, on chemical activation under optimum preparation conditions (600ºC activation temperature, 30 min activation time, 37.65 % impregnation ratio) well-developed pores
Brazilian Journal of Chemical Engineering Vol. 35, No. 03, pp. 1105-1116, July - September, 2018
1113Optimization of preparation conditions for activated carbons from polyethylene terephthalate using response surface methodology
compared to all other parameters. Process optimization was carried out and the optimized experimental values of 537 m2/g surface area and 12.57% activated carbon yield were obtained for 37.63% impregnation ratio, 600ºC activation temperature, 30 min activation time. These values were found to agree satisfactory with the predicted values. The activated carbon prepared under optimum conditions were found to have well-developed pores on its surface. PET proved to be an economical precursors to prepare activated carbon.
REFERENCES
Adinata, D., Daud, W.M.A.W. and Aroua, M.K., Preparation and characterization of activated carbon from palm shell by chemical activation with K2CO3, Bioresource Technology, 98, 145-149 (2007).
Ahmad, M.A. and Alrozi, R., Optimization of preparation conditions for mangosteen peel-based activated carbons for the removal of Remazol Brillient Blue R using response surface methodology, Chemical Engineering Journal, 165, 883-890 (2010).
Ahmed, A.A., Hameed, B.H. and Ahmad, A.L., Removal of disperse dye from aqueous solution using waste-derived activated carbon: optimization
study, Journal of Hazardous Materials, 170, 612-619 (2009).
Alam, M.Z., Muyibi, S.A. and Toramae, J., Statistical optimization of adsorption processes for removal of 2,4-dichlorophenol by activated carbon derived from oil palm empty fruit bunches, Journal of Environmental Sciences, 19, 674-677 (2007).
Arenillas, A., Rubiera, F., Parra, J.B., Ania, C.O., and Pis, J.J., Surface modification of low cost carbons for their application in the environmental protection, Applied Surface Science 252, 619-624(2005).
Bratek, W., Swiatkowskib, A., Pakułac, M.,Biniakd, S., Bystrzejewskie, M., and Szmigielski, R., Characteristics of activated carbon prepared from waste PET by carbon dioxide activation, Journal of Analytical and Applied Pyrolysis, 100, 192-198 (2013).
Brunauer, S., Emmet, P.H., and Teller, E., Adsorption of gases in multimolecular layers, Journal of American Chemical Society, 60, 309-319 (1938).
Diao, Y., Walawender, W.P. and Fan, L.T., Activated carbons prepared from phosphoric acid activation of grain sorghum, Bioresource Technology, 81, 45-52 (2002).
Figure 6. Field emission scanning electron micrographs of (a) precursor and (b) PET-based activated carbon.
Table 6. Comparison of the porosity characteristics of the PET-based activated carbons of the present work with other literature reports.
Precursor Activation Process (activation agent) SBET(m2/g)
Pore volume (cm3/g) Yield Pore diameter
(nm)Carbonization
temperature (ºC) Refs.
PET Chemical (H2SO4) 536 0.36 12.57 1.67 600 Present work
PET Chemical (KOH) 472 0.209 - - 500 Arenillas et al. (2005)
PET Combined (Na2S + Steam) 594 0.424 15.2 - 750 Sych. (2008)
PET Chemical (FeCl3) 402 - 17.1 1.18 500 Marzec et al. (1999)
PET Combined (H2SO4 + Steam) 1034 0.50 15 1.8 850 Kartel et al. (2006)
PET Physical (CO2) 1830 0.7 40 - 940 Bratek et al. (2013)
1114 SureshkumarAyyalusamy and Susmita Mishra
Brazilian Journal of Chemical Engineering
Foo, K. Y., and Hameed, B. H., Utilization of rice husks as a feedstock for preparation of activated carbon by microwave induced KOH and K2CO3 activation. Bioresource Technology, 102, 9814-9817 (2011).
Foo, K. Y., and Hameed, B. H., Preparation of activated carbon from date stones by microwave induced chemical activation: application for methylene blue adsorption. Chemical Engineering Journal, 170, 338-341 (2011).
Gao, P., Liu, Z. H., Xue, G., Han, B., and Zhou, M. H. Preparation and characterization of activated carbon produced from rice straw by (NH4)2HPO4 activation. Bioresource Technology, 102, 3645-3648 (2011).
Gregg S.J., and Sing K.S.W., Adsorption, surface area and porosity. London: Academic Press; 1982.
Hayashi, J., Yamamoto, N., Horikawa, T., Muroyama, K., and Gomes, V.G., Preparation and characterization of high-specific-surface-area activated carbons from K2CO3-treated waste polyurethane, Journal of Colloid and Interface Sciences, 281, 437-443 (2005).
Hayashi, J. I., Horikawa, T., Takeda, I., Muroyama, K., and Ani, F. N. Preparing activated carbon from various nutshells by chemical activation with K2CO3. Carbon, 40(13), 2381-2386 (2002).
Kalderis, D., Koutoulakis, D., Paraskeva, P., Diamadopoulos, E., Otal, E., delValle, J. O., and Fernández-Pereira, C., Adsorption of polluting substances on activated carbons prepared from rice husk and sugarcane bagasse. Chemical Engineering Journal, 144, 42-50 (2008).
Karayannidis, G.P., and Achilias, D.S., Chemical recycling of Poly(ethylene terephthalate), Macromolecular Materials and Engineering, 292, 128-146 (2007)
Kartel, M.T., Sych, N.V., Tsyba, M.M. and Strelko, V.V., Preparation of porous carbons by chemical activation of polyethyleneterephthalate, Carbon, 44(5), 1019-1022(2006).
Kuczenski, B., and Geyer, R., Material flow analysis of polyethylene terephthalate in the US, 1996-2007, Resources, Conservation and Recycling, 54, 1161-1169 (2010).
Laszlo, K., Characterization and adsorption properties of polymer-based microporous carbons with different surface chemistry, Microporous and Mesoporous Materials, 80, 205-211 (2005).
Liu, Q. S., Zheng, T., Wang, P., and Guo, L., Preparation and characterization of activated carbon from bamboo by microwave-induced phosphoric acid activation. Industrial Crops and Products, 31, 233-238 (2010).
Marzec, M., Tryba, B., Kalenczuk, R.J., and Morawski, A.W., Polyethelene terephthalate as a source of activated carbon, Polymers for Advanced Technologies 10, 588-595 (1999).
McEnaney, B., Estimation of the dimensions of micropores in active carbons using theDubinin- Radushkevich equation, Carbon, 25, 69-75 (1987).
Olivares-Marín, M., Fernández-González, C., Macías-García, A., and Gómez-Serrano, V. Preparation of activated carbon from cherry stones by physical activation in air. Influence of the chemical carbonisation with H2SO4. Journal of analytical and applied pyrolysis, 94, 131-137 (2012).
Olivares-Marin, M., Fernandez-Gonzalez, C., Macias-Garcia, A., and Gomez-Serrano, V., Preparation of activated carbon fromcherry stones by chemical activation with ZnCl2, Sur. Sci., 252, 5967-5971 (2006).
Prauchner M.J and Reinoso F.R., Chemical versus physical activation of coconut shell: A comparative study, Microporous and Mesoporous Materials, 152, 163-171 (2012).
Qian, Q., Machida, M., and Tatsumoto, H., Preparation of activated carbons from cattle-manure compost by zinc chloride activation, Bioresource Technology, 98, 353-360 (2007).
Sahu, J.N., Acharya, J. and Meikap, B.C., Optimization of production conditions for activated carbons from tamarind wood by zinc chloride using response surface methodology, Bioresource Technology, 101, 1974-1982 (2010).
Song, M., Jin, B., Xiao, R., Yang, L., Wu, Y., Zhong, Z., and Huang, Y., The comparison of two activation techniques to prepare activated carbon from corn cob. Biomass and Bioenergy, 48, 250-256 (2013).
Sricharoenchaikul, V., Chiravoot, P., Duangdao,A. andDuangduen, A., Preparation and characterization of activated carbon from the pyrolysis of physic nut (Jatropha curcas L.) waste, Energy& Fuels, 22, 31-37 (2008).
Sudaryanto Y, Hartono S.B, Irawaty W, Hindarso H, and Ismadji S, High surface area activated carbon prepared from cassava peel by chemical activation, Bioresource Technology, 97, 734-739 (2006).
Brazilian Journal of Chemical Engineering Vol. 35, No. 03, pp. 1105-1116, July - September, 2018
1115Optimization of preparation conditions for activated carbons from polyethylene terephthalate using response surface methodology
Sych, N.V., Pore structure of activated carbons prepared from polyethelene terephthalate waste preliminarily impregnated with sulfur compounds, Russian Journal of Applied cahemistry 81, 1047-1051 (2008).
Tan, I.A.W., Ahmad, A.L. and Hameed, B.H., Optimization of preparation conditions for activated carbons from coconut husk using response surface methodology, Chemical Engineering Journal, 137, 462-470 (2008).
Tan, I. A. W., Ahmad, A. L., and Hameed, B. H. Adsorption of basic dye using activated carbon prepared from oil palm shell: batch and fixed bed studies. Desalination, 225, 13-28 (2008).
Yang, K., Peng, J., Srinivasakannan, C., Zhang, L., Xia, H., and Duan, X., Preparation of high surface area activated carbon from coconut shells using microwave heating, Bioresource Technology, 101, 6163-6169 (2010).

1116 SureshkumarAyyalusamy and Susmita Mishra
Brazilian Journal of Chemical Engineering