Embed Size (px)
Citation preview
International Research Journal of Engineering and Technology (IRJET) e-ISSN: 2395 -0056
Volume: 03 Issue: 07 | July-2016 www.irjet.net p-ISSN: 2395-0072
© 2016, IRJET | Impact Factor value: 4.45 | ISO 9001:2008 Certified Journal | Page 289
OPTIMIZATION OF PROCESS CAPABILITY IN AN AUTOMOBILE
INDUSTRY: A CASE STUDY
Mr. Rahul Raut1, Mr. P.R.Attar2,
1 Dept. of Production engineering, VJTI, Mumbai. 2 Assistant Professor, Dept. of Production engineering, VJTI, Mumbai
---------------------------------------------------------------------***---------------------------------------------------------------------
Abstract - Process quality is the building block to any organization for ensuring the quality on which the customer thrives and establishing a good relationship between a manufacturer and a customer. Therefore, understanding the meaning of quality and efforts taken towards its improvement plays a pivotal role in growth of a company’s business. the most effective way towards the improvement of quality of the product in hand is by eliminating the defects from the process to make it more accurate and precise. Improvement of a process is a long term task which includes problem definition, source of a problem, root causes which include both primary and secondary and the steps taken towards the optimization. The identification of the problem is possible either by visual inspection or through statistical process control. Process capability analysis is one of the major tools used to determine the process performance as capable or incapable within a specified tolerance which is used for improving the process. This article presents the overview of use of process capability indices along related to improving the quality of certain processes with a case study of an automobile industry. A variety of quality tools including flowcharts, cause and effects diagrams, control charts, process capability indices and experimental design are illustrated throughout the manuscript. Key Words: Process Capability, Process capability analysis, process performance, Process quality.
1. INTRODUCTION ( Size 11 , cambria font)
Today, in the competitive market of automobile industries cost and quality are one of the important factors in determining the supremacy of a company. Far gone are the days where monopoly of a company in a particular sector lead to it control over the market. With new emerging technologies and innovative young minds individual dictatorship is highly unlikely. So companies main focus has been customer satisfaction and quality. Quality is defined as standard of something
as measured against other things of a similar kind or degree of excellence of something. Unsatisfactory quality is non-expectable by the consumer as well the manufacturer. This change in quality may be due to a number of factors most important being variation in a certain process[ii].
A variation in a process is defined as a change or slight difference in condition, amount, or level, typically within certain limits. The variation in the quality of product in any manufacturing process are due to two reasons, Chance causes and Assignable causes. A process with only chance causes is said to be in a state of statistical control. This means, chance causes results in only minor variation in the process whereas assignable causes results in major variation in a process. Therefore, the main aim of SPC is to identify and rectify the assignable causes as soon as possible for an acceptable quality as per industrial standards[ii].
1.1 Process Capability
Process capability study is a scientific and a
systematic procedure that uses control charts to detect and eliminate the unnatural causes of variation until a state of statistical control is reached. When the study is completed, you will identify the natural variability of the process. It is also the ability of the combination of people, machine, methods, material, and measurements to produce a product that will consistently meet the design requirements or customer expectation. It is the long-term performance level of the process after it has been brought under statistical control. In other words, process capability is the range over which the natural variation of the process occurs as determined by the system of common causes [ii][xi].
1.1.1 Determining the Process Capability
i. process capability in terms of meaningful percentages and metrics.
ii. Process capability measurements allow us to summarize To predict the extent to which the
International Research Journal of Engineering and Technology (IRJET) e-ISSN: 2395 -0056
Volume: 03 Issue: 07 | July-2016 www.irjet.net p-ISSN: 2395-0072
© 2016, IRJET | Impact Factor value: 4.45 | ISO 9001:2008 Certified Journal | Page 290
process will be able to hold tolerance or customer requirements. Based on the law of probability, you can compute how often the process will meet the specification or the expectation of your customer.
iii. You may learn that bringing your process under statistical control requires fundamental changes - even redesigning and implementing a new process that eliminates the sources of variability now at work.
iv. It helps you choose from among competing processes, the most appropriate one for meeting customers' expectation.
v. Knowing the capability of your processes, you can specify better the quality performance requirements for new machines, parts and processes
.
1.1.2 Measures of Process Capability
Process capability indices (PCI) measure the degree to which your process produces output that meets the customer's specification. PCI can be used effectively to summarize process capability information in a convenient unit less system. Cp and Cpk are quantitative expressions that personify the variability of the process (its natural limits) relative to its specification limits (customer requirements). These indices are effective tools for both Process capability analysis and quality assurance. Understanding the process and assessing the process performance are essential towards quality improvement initiatives[i].
Formally, the Cp index is defined as;
Where USL, LSL, and σ denote the upper
specification limit, lower specification limit, and process standard deviation associated with the measurements, respectively. Cp indicates how well the process fits within the two specification limits. However, process capability index Cpk provides an indication of variability associated with process and how a process can be confirmed to its specification. This index has been defined as;
where d = (USL−LSL)/2 and m = (USL+LSL)/2 are the half-length and midpoint of the specification interval, respectively. Calculation of the Cp and Cpk indices using the above equations, is for normal distributions only and will constitute to form the major difference as compared to that from the robotic calculations since they are done by software and checked constantly on regular intervals which helps in calibration of the robots designated for the tolerance and quality check. Cpk for all critical product measurements considered important by the customer should be calculated at the beginning of initial production to determine the general ability of the process to meet customer specifications. Then from time to time, over the life of the product, Cpk must be generated. A control chart must always be maintained to check statistical stability of the process before capability is computed[i][viii].
1.2 Six Sigma Six Sigma is one of the powerful business strategies
that improves quality initiatives in many industries around the world. It is a company-wide systematic approach to achieving continuous process improvements. Not only a technique but also as a philosophy, performing at Six Sigma means producing only 3.4 defects out of every million opportunities for a process. There has been a significant increase and development of Six Sigma technology and methodology in organizations. Especially in the last decade, as a change and improvement strategy, Six Sigma has received considerable attention in global companies to generate maximum benefit and competitive advantage [vi]. 2. METHODOLOGY The main methodology being employed in most of the automobile industries is one referred to as the DMAIC approach. The DMAIC methodology uses a process-step structure. Steps generally are incessant; however, some activities from various steps may occur concurrently or repetitive in nature. The DMAIC five steps are Step1. DEFINE the problem and scope the work effort of the process team Step2. MEASURE the current process or performance Step3. ANALYZE the current performance to isolate the problem Step4. IMPROVE the problem by selecting a solution Step5. CONTROL the improved process or product performance to ensure the goals(s) are met
International Research Journal of Engineering and Technology (IRJET) e-ISSN: 2395 -0056
Volume: 03 Issue: 07 | July-2016 www.irjet.net p-ISSN: 2395-0072
© 2016, IRJET | Impact Factor value: 4.45 | ISO 9001:2008 Certified Journal | Page 291
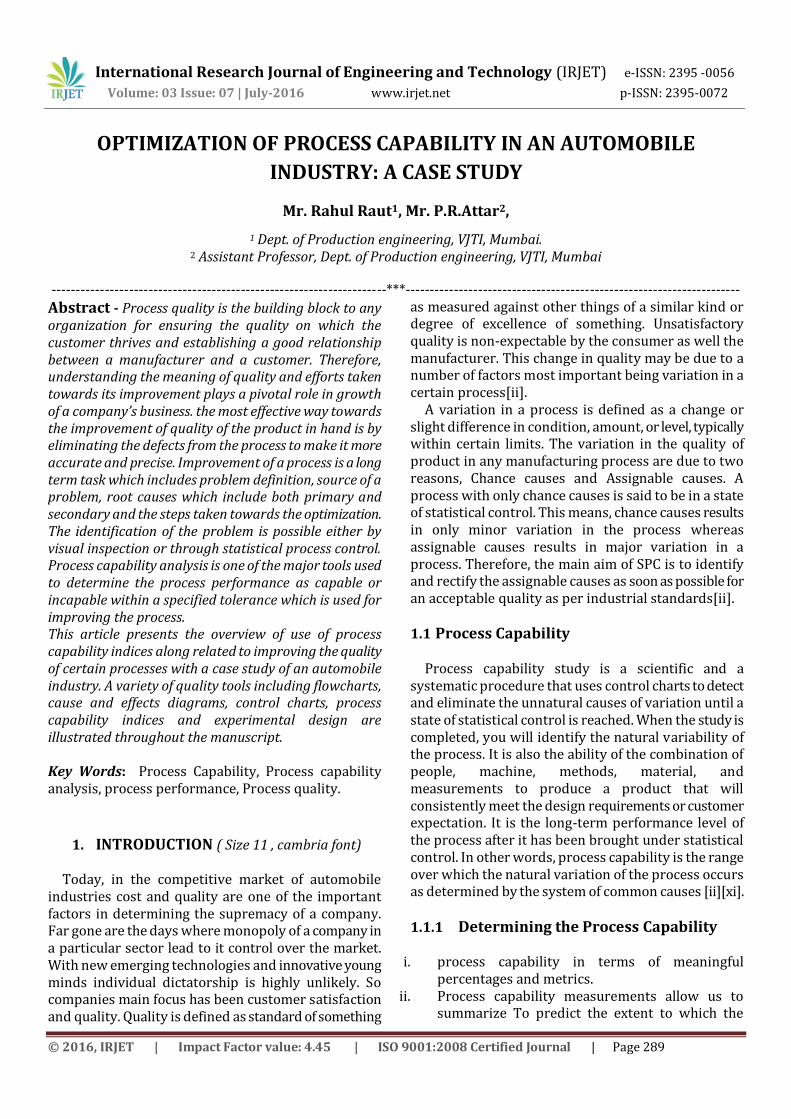
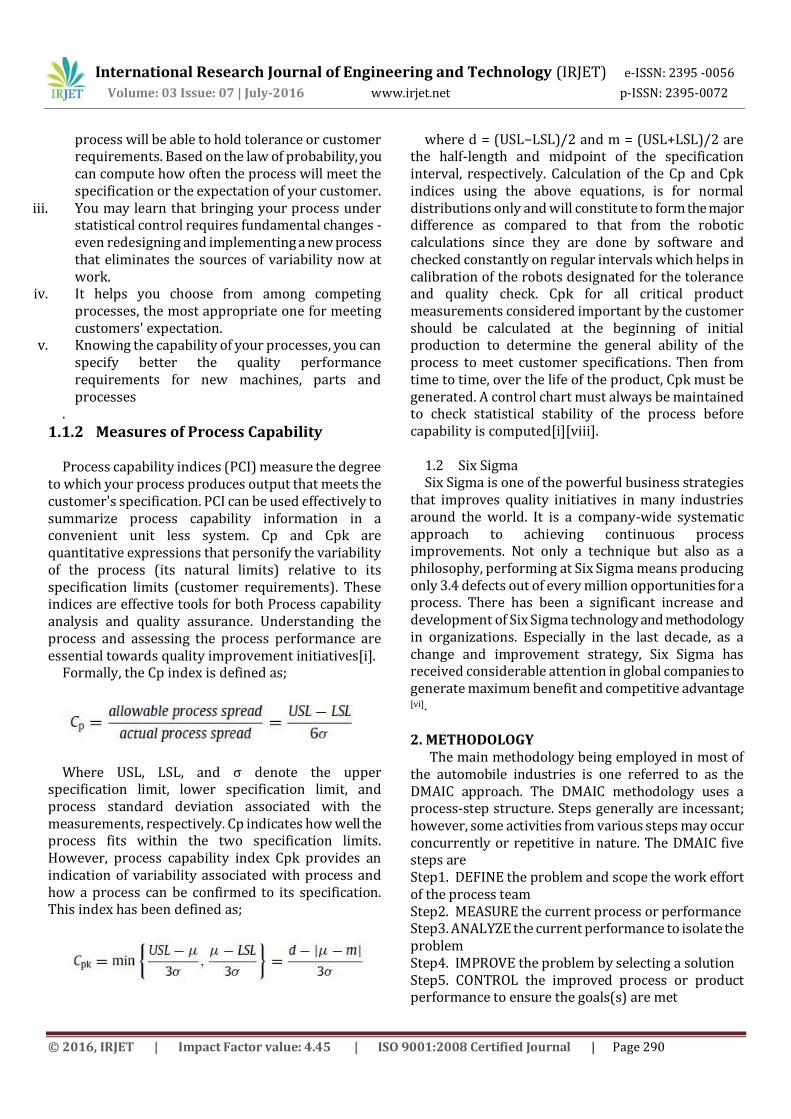
Fig-1: DMAIC Methodology The DMAIC process runs for a typically short time mainly 3-4 months and then the conclusion or findings are submitted to the higher authorities for further approval of implementation. In the mentioned case study, the whole process improvement is performed on the basis of DMAIC methodology which starts from the problem identification and ends to the implementation of the suggestions for the improvement in the PCI[v]. 2.1 Quality tools Quality tools may be defined as means used in a manufacturing industries for understanding and improving production processes. These may include any charts, devices, softwares, strategy or technique that supports quality management efforts. The mainly used tools in these case study are visual inspection, fishbone diagram and control charts[ix]. 2.1.1 Control Charts Analyse phase involves statistical analysis of the data collected in measure phase. The data should be graphed, charted and descriptive statistics obtained to draw conclusions. The statistics of interest here are the mean and standard deviation. The parts being manufactured are analysed by the robots and results are shown in form of tolerance charts for deviations. In the Six Sigma methodology that has been implemented, the control charts are the most important factor in the case study mentioned since it forms the foundation base for any problem identification in the industry[vii].
Fig-2: Control Charts
2.1.2 Visual Inspection Visual inspection has been defined in one FAA publication as “The process of using the eye alone or in conjunction with various aids, as the sensing mechanism from which judgments may be made about the condition of a unit to be inspected.” In the manufacturing firm visual inspection is one the most critical quality tool because observations can many times deduce a solution to a particular problem which not only reduces time, but also reduces the company cost on resources to a large extent. The visual inspection consists of at least two major processes. The first is a search process that, in visual inspection, use of most senses of a body. The second process is a process of combining relevant knowledge, critical input, and apposite two logical processes to provide a revelation of an anomaly or leading to pattern identification[iv].
2.2 PROCESS OVERVIEW
The Manufacturing industry reviews portions of the production specification for a variety of purposes including a) arranging process inputs (e.g., materials, labour), b) aptness of the car design (e.g., colour, quality, strength, rigidness) and c) time period in which the product can be delivered. Although Manufacturing department claims that they could provide the product binding to specifications, they could never provide Preproduction with attainable, iterative and reasonable guidelines that would consistently provide a good quality.
The body in white (BIW) is manufactured in the body shop department. From the body shop it is sent to the paint shop and then to the assembly shop for final assembly. The major operations carried out inside the body shop includes Hemming operation, spot welding, Projection Welding, MIG welding, MAG welding, Laser brazing done by programmed robots.
International Research Journal of Engineering and Technology (IRJET) e-ISSN: 2395 -0056
Volume: 03 Issue: 07 | July-2016 www.irjet.net p-ISSN: 2395-0072
© 2016, IRJET | Impact Factor value: 4.45 | ISO 9001:2008 Certified Journal | Page 292
Body in White (BIW) refers to the welded sheet metal components which form the vehicle’s structure to which the other components will be married, i.e. Engine, chassis, exterior and interior trim. The process starts from the underbody where there are two lines – UB1 and UB2. The complete underbody of the car which includes various sub-assemblies like the rear wheel house assembly, front long members, dash and cowl, front apron and others are assembled together by spot welding or MIG/MAG welding.
Then the car under body goes to the framer line 1. Here the side panels and the roof cross members are fitted by spot welding. In the framer line 2 the roof is fitted by the robotic laser brazing process and then it is sent to the fitment line. In the matching line the various closure parts or the hang on parts such as the doors, fender, hood and deck lid are fitted to the body by bolting. Along this line the parts are fitted and matched so as to maintain the gaps and flushness between the various parts within the specified tolerance limits. Fixtures are used to accomplish this purpose. The underbody at UB2 and the car body at Framer 2 undergo measurement through robot image processing at inline station for checking the feasibility and deviations in the process.
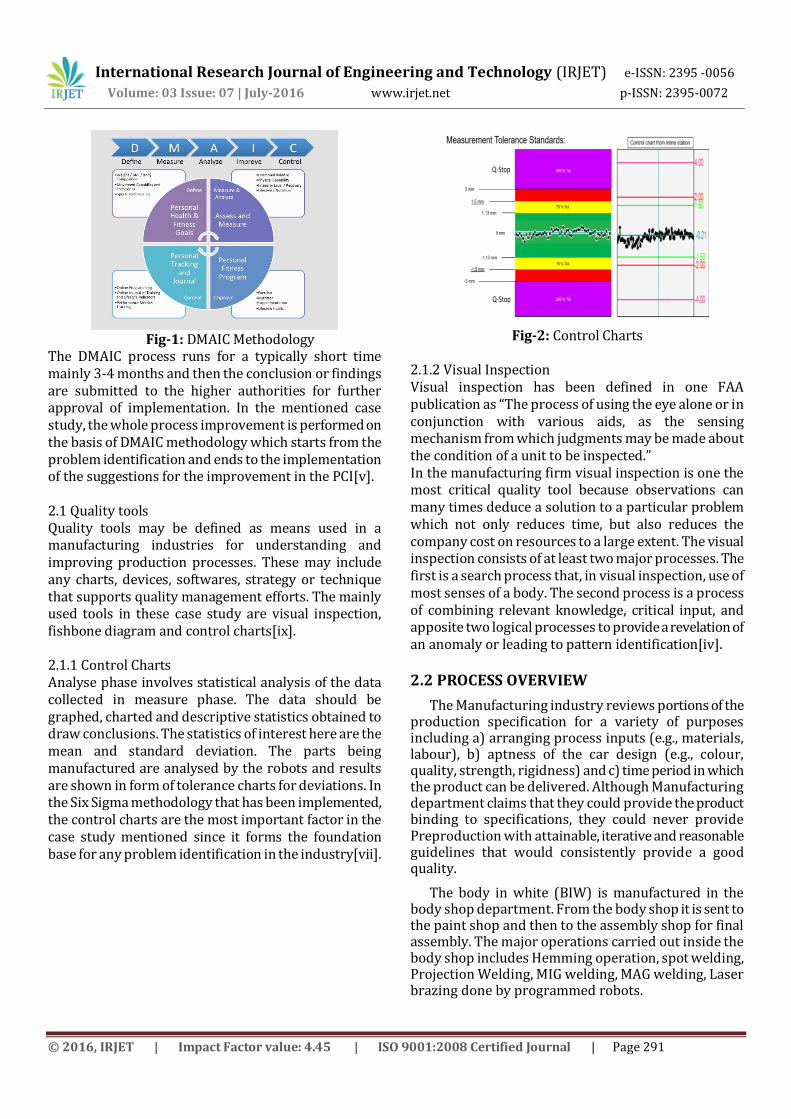
Inline station is the place where 4 robots namely ROB A,B,C,D use the technology of image processing to measure the deviations in the car body or underbody by comparing the actual values of a particular points or distances with the nominal value fed in the software named ‘X’ in form of a CAD model and difference is reflected in the form deviation which are represented on the control charts with the basics statistics such as the Cp, Cpk, sigma value, actual deviation of a particular car maximum and minimum values over a span of production and the range of deviations.
Fig-3: Measurement station with robot placement
This manuscript outlines the process of studying, measuring, quantifying, assessing and improving a
process from a process capability perspective. The various goals of the manuscript include a) providing insights into the use of process capability indices as a quality management tool, b) providing fellow researchers with an example of how-to determine the ability of a process, c) using the results to establish capabilities and techniques for the ongoing assessment and long term improvement, d) to highlight areas where there is an immediate need for development and e) to provide with a basis for discussion on the strategy followed.
2.3 Problem definition
The problem identification is mainly done through constant monitoring of the inline measurements reports and observing for any trend changes that may occur which can be on the hourly basis or based on the shift changes that may occur. This variation in the process CB1 and not for CB2 even though the geometric station (station where the actual shape and different parts are welded ensuring geometry) being same for both leads to the problem of process quality and needed to be resolved.
The standard reading for the process capability index are set by the co-relation between the measurement room (CMM reports) and the inline reports. The allowable tolerance between the CMM reports and the inline reports is 0.3mm.
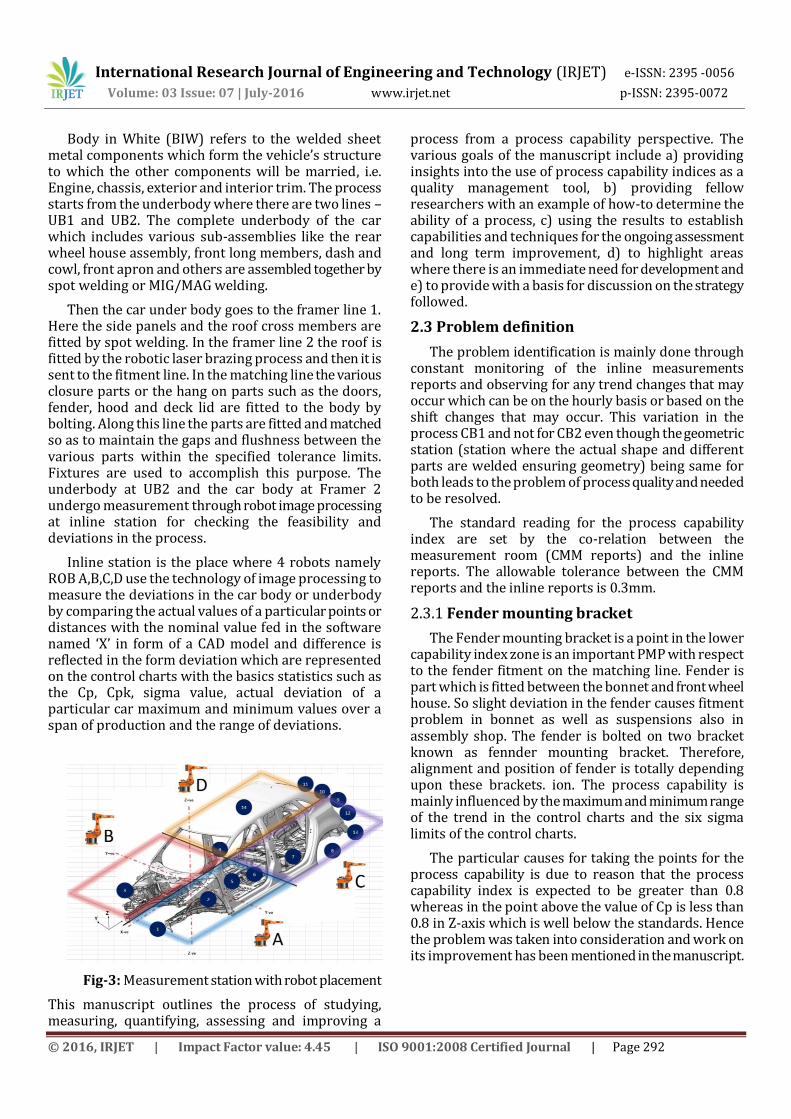
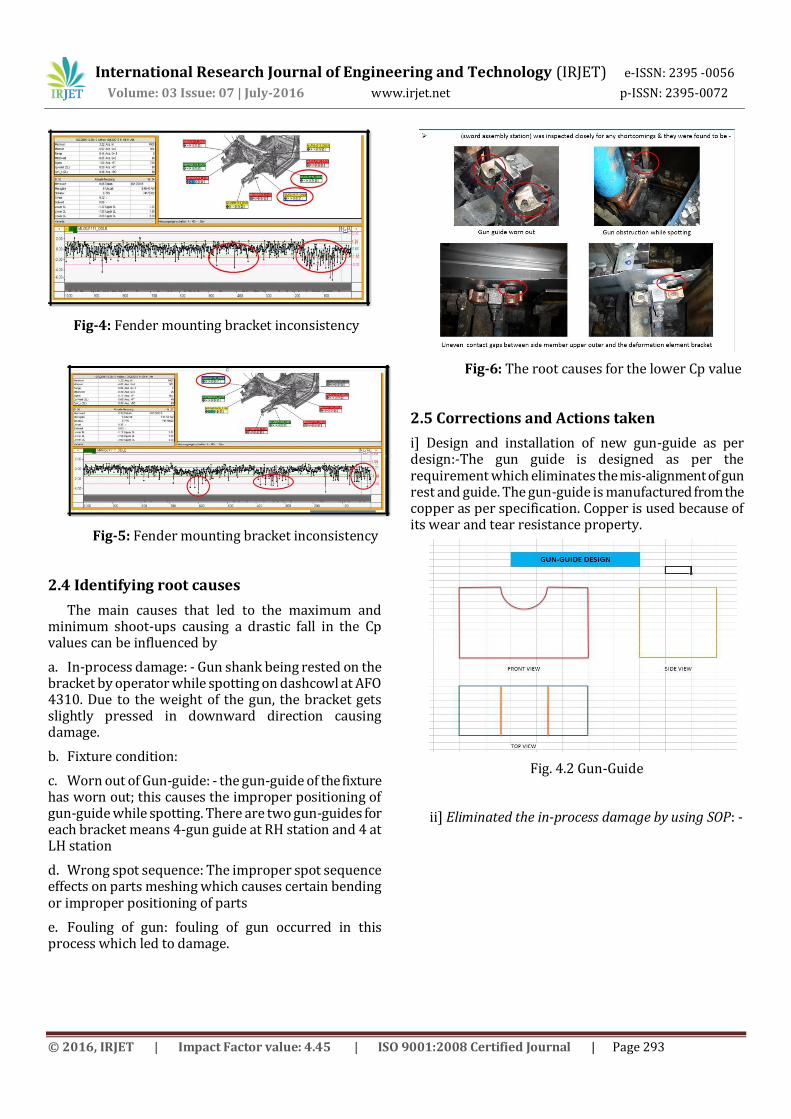
2.3.1 Fender mounting bracket
The Fender mounting bracket is a point in the lower capability index zone is an important PMP with respect to the fender fitment on the matching line. Fender is part which is fitted between the bonnet and front wheel house. So slight deviation in the fender causes fitment problem in bonnet as well as suspensions also in assembly shop. The fender is bolted on two bracket known as fennder mounting bracket. Therefore, alignment and position of fender is totally depending upon these brackets. ion. The process capability is mainly influenced by the maximum and minimum range of the trend in the control charts and the six sigma limits of the control charts.
The particular causes for taking the points for the process capability is due to reason that the process capability index is expected to be greater than 0.8 whereas in the point above the value of Cp is less than 0.8 in Z-axis which is well below the standards. Hence the problem was taken into consideration and work on its improvement has been mentioned in the manuscript.
International Research Journal of Engineering and Technology (IRJET) e-ISSN: 2395 -0056
Volume: 03 Issue: 07 | July-2016 www.irjet.net p-ISSN: 2395-0072
© 2016, IRJET | Impact Factor value: 4.45 | ISO 9001:2008 Certified Journal | Page 293
Fig-4: Fender mounting bracket inconsistency
Fig-5: Fender mounting bracket inconsistency
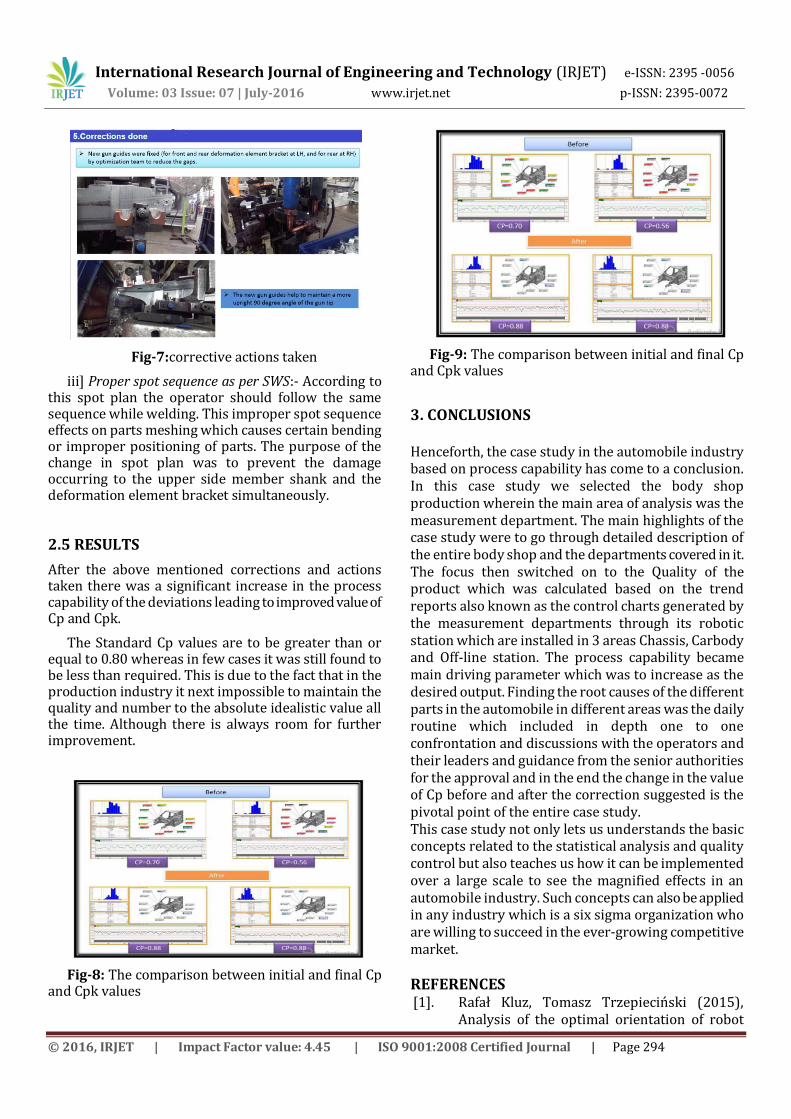
2.4 Identifying root causes
The main causes that led to the maximum and minimum shoot-ups causing a drastic fall in the Cp values can be influenced by
a. In-process damage: - Gun shank being rested on the bracket by operator while spotting on dashcowl at AFO 4310. Due to the weight of the gun, the bracket gets slightly pressed in downward direction causing damage.
b. Fixture condition:
c. Worn out of Gun-guide: - the gun-guide of the fixture has worn out; this causes the improper positioning of gun-guide while spotting. There are two gun-guides for each bracket means 4-gun guide at RH station and 4 at LH station
d. Wrong spot sequence: The improper spot sequence effects on parts meshing which causes certain bending or improper positioning of parts
e. Fouling of gun: fouling of gun occurred in this process which led to damage.
Fig-6: The root causes for the lower Cp value
2.5 Corrections and Actions taken
i] Design and installation of new gun-guide as per design:-The gun guide is designed as per the requirement which eliminates the mis-alignment of gun rest and guide. The gun-guide is manufactured from the copper as per specification. Copper is used because of its wear and tear resistance property.
Fig. 4.2 Gun-Guide
ii] Eliminated the in-process damage by using SOP: -
International Research Journal of Engineering and Technology (IRJET) e-ISSN: 2395 -0056
Volume: 03 Issue: 07 | July-2016 www.irjet.net p-ISSN: 2395-0072
© 2016, IRJET | Impact Factor value: 4.45 | ISO 9001:2008 Certified Journal | Page 294
Fig-7:corrective actions taken
iii] Proper spot sequence as per SWS:- According to this spot plan the operator should follow the same sequence while welding. This improper spot sequence effects on parts meshing which causes certain bending or improper positioning of parts. The purpose of the change in spot plan was to prevent the damage occurring to the upper side member shank and the deformation element bracket simultaneously.
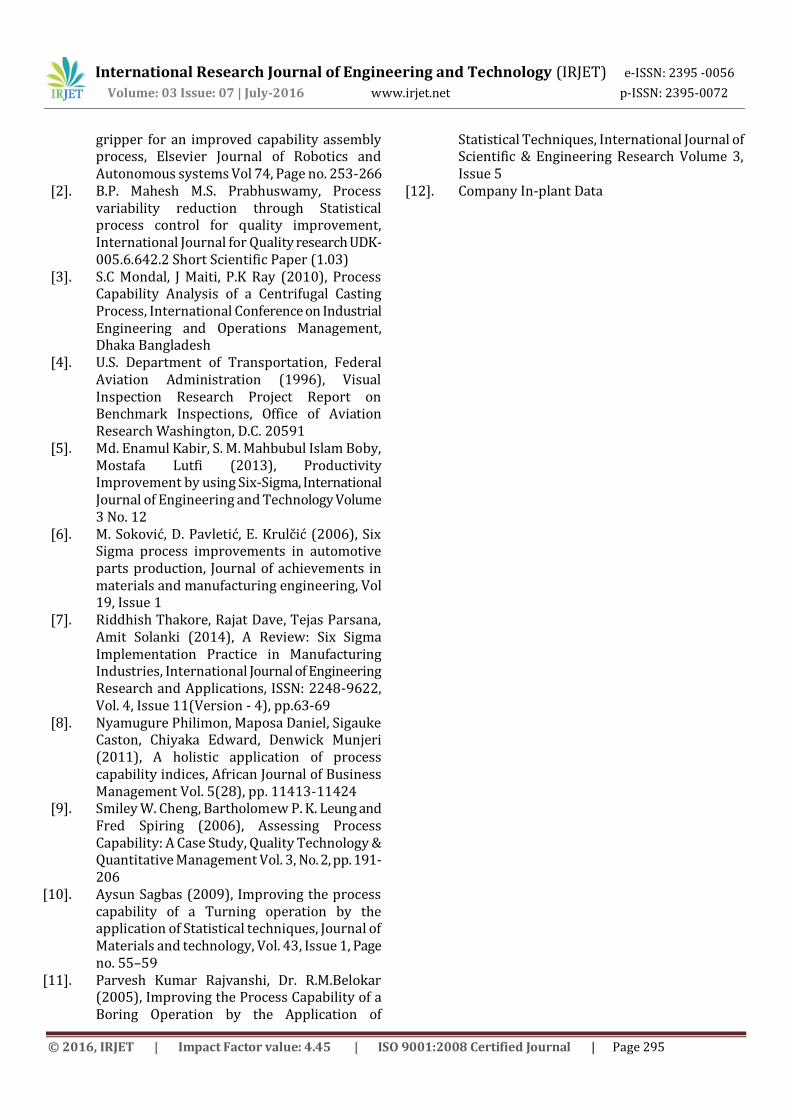
2.5 RESULTS
After the above mentioned corrections and actions taken there was a significant increase in the process capability of the deviations leading to improved value of Cp and Cpk.
The Standard Cp values are to be greater than or equal to 0.80 whereas in few cases it was still found to be less than required. This is due to the fact that in the production industry it next impossible to maintain the quality and number to the absolute idealistic value all the time. Although there is always room for further improvement.
Fig-8: The comparison between initial and final Cp and Cpk values
Fig-9: The comparison between initial and final Cp and Cpk values
3. CONCLUSIONS Henceforth, the case study in the automobile industry based on process capability has come to a conclusion. In this case study we selected the body shop production wherein the main area of analysis was the measurement department. The main highlights of the case study were to go through detailed description of the entire body shop and the departments covered in it. The focus then switched on to the Quality of the product which was calculated based on the trend reports also known as the control charts generated by the measurement departments through its robotic station which are installed in 3 areas Chassis, Carbody and Off-line station. The process capability became main driving parameter which was to increase as the desired output. Finding the root causes of the different parts in the automobile in different areas was the daily routine which included in depth one to one confrontation and discussions with the operators and their leaders and guidance from the senior authorities for the approval and in the end the change in the value of Cp before and after the correction suggested is the pivotal point of the entire case study. This case study not only lets us understands the basic concepts related to the statistical analysis and quality control but also teaches us how it can be implemented over a large scale to see the magnified effects in an automobile industry. Such concepts can also be applied in any industry which is a six sigma organization who are willing to succeed in the ever-growing competitive market. REFERENCES [1]. Rafał Kluz, Tomasz Trzepieciński (2015),
Analysis of the optimal orientation of robot
International Research Journal of Engineering and Technology (IRJET) e-ISSN: 2395 -0056
Volume: 03 Issue: 07 | July-2016 www.irjet.net p-ISSN: 2395-0072
© 2016, IRJET | Impact Factor value: 4.45 | ISO 9001:2008 Certified Journal | Page 295
gripper for an improved capability assembly process, Elsevier Journal of Robotics and Autonomous systems Vol 74, Page no. 253-266
[2]. B.P. Mahesh M.S. Prabhuswamy, Process variability reduction through Statistical process control for quality improvement, International Journal for Quality research UDK- 005.6.642.2 Short Scientific Paper (1.03)
[3]. S.C Mondal, J Maiti, P.K Ray (2010), Process Capability Analysis of a Centrifugal Casting Process, International Conference on Industrial Engineering and Operations Management, Dhaka Bangladesh
[4]. U.S. Department of Transportation, Federal Aviation Administration (1996), Visual Inspection Research Project Report on Benchmark Inspections, Office of Aviation Research Washington, D.C. 20591
[5]. Md. Enamul Kabir, S. M. Mahbubul Islam Boby, Mostafa Lutfi (2013), Productivity Improvement by using Six-Sigma, International Journal of Engineering and Technology Volume 3 No. 12
[6]. M. Soković, D. Pavletić, E. Krulčić (2006), Six Sigma process improvements in automotive parts production, Journal of achievements in materials and manufacturing engineering, Vol 19, Issue 1
[7]. Riddhish Thakore, Rajat Dave, Tejas Parsana, Amit Solanki (2014), A Review: Six Sigma Implementation Practice in Manufacturing Industries, International Journal of Engineering Research and Applications, ISSN: 2248-9622, Vol. 4, Issue 11(Version - 4), pp.63-69
[8]. Nyamugure Philimon, Maposa Daniel, Sigauke Caston, Chiyaka Edward, Denwick Munjeri (2011), A holistic application of process capability indices, African Journal of Business Management Vol. 5(28), pp. 11413-11424
[9]. Smiley W. Cheng, Bartholomew P. K. Leung and Fred Spiring (2006), Assessing Process Capability: A Case Study, Quality Technology & Quantitative Management Vol. 3, No. 2, pp. 191-206
[10]. Aysun Sagbas (2009), Improving the process capability of a Turning operation by the application of Statistical techniques, Journal of Materials and technology, Vol. 43, Issue 1, Page no. 55–59
[11]. Parvesh Kumar Rajvanshi, Dr. R.M.Belokar (2005), Improving the Process Capability of a Boring Operation by the Application of
Statistical Techniques, International Journal of Scientific & Engineering Research Volume 3, Issue 5
[12]. Company In-plant Data