Embed Size (px)
Citation preview
1
Faculty of Technology
Mechanical Engineering
Laboratory of Welding Technology
Sammy-Armstrong Atta-Agyemang
OPTIMIZATION OF STRENGTH AND TOUGHNESS ON THE
EFFECT OF THE WELDABLE HIGH STRENGTH STEELS
(HSS) USED IN OFFSHORE STRUCTURES
Supervisors: Professor Jukka Martikainen
Dr. (Tech.) Paul Kah
2
Abstract
Author: Sammy-Armstrong Atta-Agyemang
Title: Optimization of strength and toughness on the effect of the weldable HSS
used in offshore structures
Year: 2013
Master Thesis: Thesis for the Degree of Masters of Science in Lappeenranta University
of Technology
95 pages, 53 Figures, 12 Tables.
Supervisors: Professor Jukka Martikainen and Dr. (Tech.) Paul Kah
Key words: High strength steel, toughness, carbon content, offshore structures,
welding process, thermomechanical controlled process
Optimization of high strength and toughness combination on the effect of weldability is very
vital to be considered in offshore oil and gas industries. Having a balanced and improved high
strength and toughness is very much recommended in offshore structures for an effective
production and viable exploration of hydrocarbons.
This thesis aims to investigate the possibilities to improve the toughness of high strength steel.
High carbon contents induce hardness and needs to be reduced for increasing toughness. The
rare combination of high strength with high toughness possibilities was examined by
determining the following toughening mechanism of: Heat treatment and optimal
microstructure, Thermomechanical processing, Effect of welding parameters on toughness and
weldability of steel.
The implementation of weldability of steels to attain high toughness for high strength in
offshore structures is mostly in shipbuilding, offshore platforms, and pipelines for high
operating pressures.
As a result, the toughening mechanisms suggested have benefits to the aims of the effect of
high strength to high toughness of steel for efficiency, production and cost reduction.

3
Acknowledgements
The research for this Master’s thesis was carried out at the laboratory of Welding technology
in the department of Mechanical engineering of the Lappeenranta University of Technology.
First and foremost I thank the Almighty God seeing me through this research.
This research work was possible because of the guidance, patient and support of my
supervisors Prof. Jukka Martikainen and Dr. Paul Kah (Tech.). Without them I would not have
the opportunity to carry out such an interesting research of this sort. Also I would like to
express my profound gratitude to the staff and co-researchers at the level of Master’s thesis
and Doctoral thesis of welding laboratory.
Special thanks go to my family for their prayers and moral support and most especially to my
dad, Samuel Atta-Agyemang and mum, Felicia Afia Pokua. I would not have gone far at this
level of education without their help.
Finally, I would also say thanks to Joshua Omajene, MSc holder in Mechanical engineering
for his contribution of ideas to the research.
Sammy-Armstrong Atta-Agyemang
Lappeenranta
10.10.2013
4
List of symbols and abbreviations
σref Reference Stress Level
α Ferrite
γ Austenite
γ rec recrystallized austenite
a Crack length parameter
A Elongation
+AR Supply condition ´´As Rolled``
AcC Accelerated Cooling
Ac1 Lower Critical Temperature
Ac3 Upper Critical Temperature
Acm Upper Critical Temperature
AISI American Iron and Steel Institute
AWS American Welding Society
Al Aluminium
B Boron
C Carbon
CGHAZ Coarse Grain Heat Affected Zone
CEV Carbon Equivalent Value
CE (IIW) Carbon Equivalent
CSE Charpy Shelf Energy
5
CTOD Crack Tip Opening Displacement
CNV Charpy V-notch
CO2 Carbon dioxide
Cr Chromium
Cu Copper
DWTT Drop-Weight Tearing Test
d Austenite grain size
EN European Standards
FPSO Floating Production Storage and Offloading
FGHAZ Fine Grain Heat Affected Zone
Fe3C Cementite
GMAW Gas Metal Arc Welding
HRC Rockwell Hardness on scale C
HR Hot Rolling
H Hydrogen
HAZ Heat Affected Zone
HSS High Strength Steels
HD Hydrogen Content
ITT Impact Transition Temperature
I Welding Current (Amps)
IIW International Institute of Welding
6
ISO International Organization for Standardization
J Joule
J2 Impact Energy at Testing Temperature 20 degree Celsius.
L Liquid
MPa Mega Pascal (1 newton/mm2)
M Meter
MIG Metal Inert Gas
Mf Martensite Finish
MMA Manual Metal Arc
Mn Manganese
Mo Molybdenum
MS Martensite Start
+M Thermomechanical rolling
+N Normalized
NL Longitudinal Charpy V-notch impacts temp. not lower than -20
N Nitrogen
Nb Niobium
Ni Nickel
P Phosphorus
Pcm Carbon Equivalent According to Ito Bessyo
PWHT Post Welding Heat Treatment
7
kg Kilogram
kJ/mm Kilo Joule/ millimeter
Q&T Quenched and Tempered
Q (kJ/mm) Heat Input
QL Quenched and Tempered+ Low notch toughness temperature
RHN Rockwell hardness number
RHN-B Rockwell Hardness on scale B
HRB Rockwell Hardness on scale B
RA Reduction of Area
S Interlamellar spacing
S Sulphur
Sn Tin
SAW Submerged Arc Welding
SMAW Shielded Metal Arc Welding
TM Thermomechanical
TMCP Thermo Mechanically Controlled Processing
TMCR Thermomechanically Controlled Rolling
t Cementite thickness
UTS Ultimate Tensile Stress
µ Micro
YS Yield Strength
8
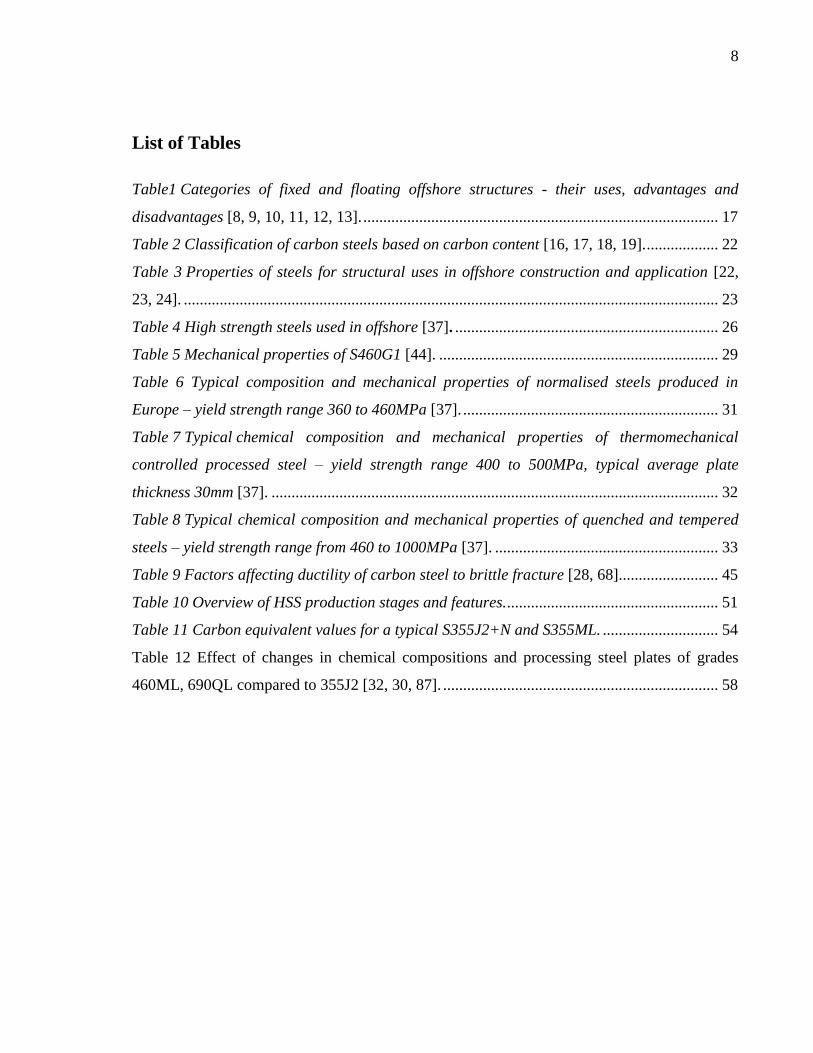
List of Tables
Table1 Categories of fixed and floating offshore structures - their uses, advantages and
disadvantages [8, 9, 10, 11, 12, 13]. ......................................................................................... 17
Table 2 Classification of carbon steels based on carbon content [16, 17, 18, 19]. .................. 22
Table 3 Properties of steels for structural uses in offshore construction and application [22,
23, 24]. ...................................................................................................................................... 23
Table 4 High strength steels used in offshore [37]. .................................................................. 26
Table 5 Mechanical properties of S460G1 [44]. ...................................................................... 29
Table 6 Typical composition and mechanical properties of normalised steels produced in
Europe – yield strength range 360 to 460MPa [37]. ................................................................ 31
Table 7 Typical chemical composition and mechanical properties of thermomechanical
controlled processed steel – yield strength range 400 to 500MPa, typical average plate
thickness 30mm [37]. ................................................................................................................ 32
Table 8 Typical chemical composition and mechanical properties of quenched and tempered
steels – yield strength range from 460 to 1000MPa [37]. ........................................................ 33
Table 9 Factors affecting ductility of carbon steel to brittle fracture [28, 68]. ........................ 45
Table 10 Overview of HSS production stages and features. ..................................................... 51
Table 11 Carbon equivalent values for a typical S355J2+N and S355ML. ............................. 54
Table 12 Effect of changes in chemical compositions and processing steel plates of grades
460ML, 690QL compared to 355J2 [32, 30, 87]. ..................................................................... 58
9
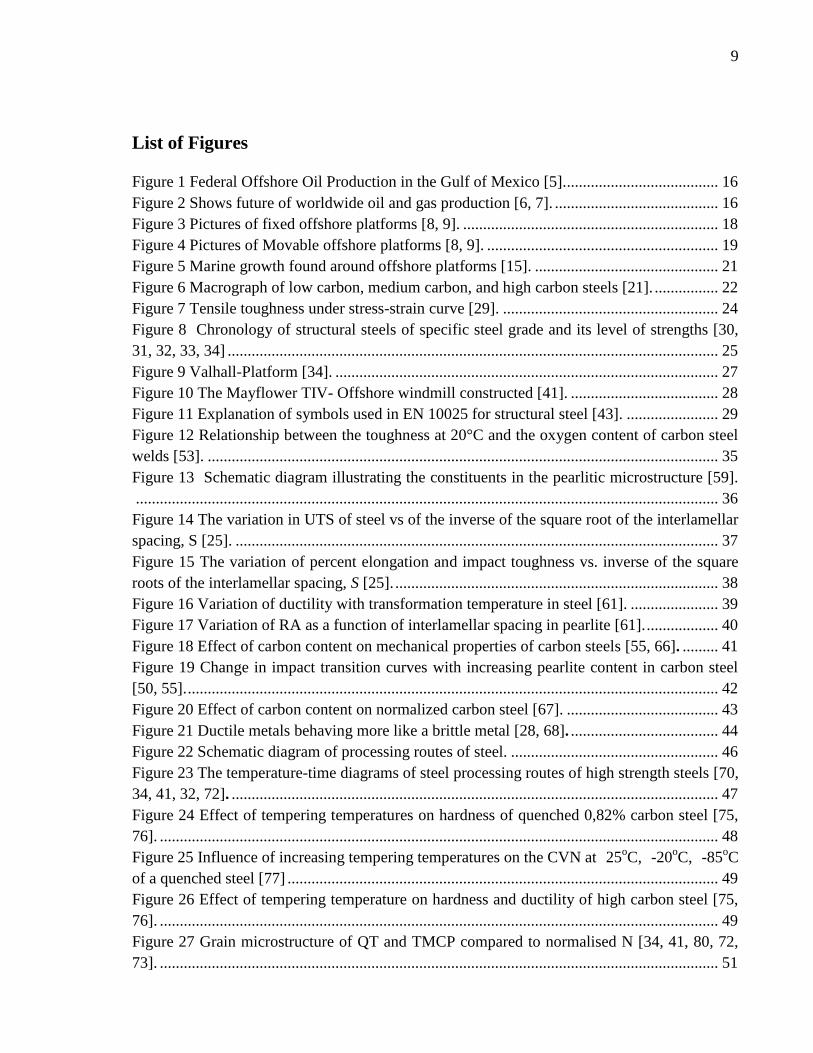
List of Figures
Figure 1 Federal Offshore Oil Production in the Gulf of Mexico [5]. ...................................... 16
Figure 2 Shows future of worldwide oil and gas production [6, 7]. ......................................... 16
Figure 3 Pictures of fixed offshore platforms [8, 9]. ................................................................ 18
Figure 4 Pictures of Movable offshore platforms [8, 9]. .......................................................... 19
Figure 5 Marine growth found around offshore platforms [15]. .............................................. 21
Figure 6 Macrograph of low carbon, medium carbon, and high carbon steels [21]. ................ 22
Figure 7 Tensile toughness under stress-strain curve [29]. ...................................................... 24
Figure 8 Chronology of structural steels of specific steel grade and its level of strengths [30,
31, 32, 33, 34] ........................................................................................................................... 25
Figure 9 Valhall-Platform [34]. ................................................................................................ 27
Figure 10 The Mayflower TIV- Offshore windmill constructed [41]. ..................................... 28
Figure 11 Explanation of symbols used in EN 10025 for structural steel [43]. ....................... 29
Figure 12 Relationship between the toughness at 20°C and the oxygen content of carbon steel
welds [53]. ................................................................................................................................ 35
Figure 13 Schematic diagram illustrating the constituents in the pearlitic microstructure [59].
.................................................................................................................................................. 36
Figure 14 The variation in UTS of steel vs of the inverse of the square root of the interlamellar
spacing, S [25]. ......................................................................................................................... 37
Figure 15 The variation of percent elongation and impact toughness vs. inverse of the square
roots of the interlamellar spacing, S [25]. ................................................................................. 38
Figure 16 Variation of ductility with transformation temperature in steel [61]. ...................... 39
Figure 17 Variation of RA as a function of interlamellar spacing in pearlite [61]. .................. 40
Figure 18 Effect of carbon content on mechanical properties of carbon steels [55, 66]. ......... 41
Figure 19 Change in impact transition curves with increasing pearlite content in carbon steel
[50, 55]. ..................................................................................................................................... 42
Figure 20 Effect of carbon content on normalized carbon steel [67]. ...................................... 43
Figure 21 Ductile metals behaving more like a brittle metal [28, 68]. ..................................... 44
Figure 22 Schematic diagram of processing routes of steel. .................................................... 46
Figure 23 The temperature-time diagrams of steel processing routes of high strength steels [70,
34, 41, 32, 72]. .......................................................................................................................... 47
Figure 24 Effect of tempering temperatures on hardness of quenched 0,82% carbon steel [75,
76]. ............................................................................................................................................ 48
Figure 25 Influence of increasing tempering temperatures on the CVN at 25oC, -20
oC, -85
oC
of a quenched steel [77] ............................................................................................................ 49
Figure 26 Effect of tempering temperature on hardness and ductility of high carbon steel [75,
76]. ............................................................................................................................................ 49
Figure 27 Grain microstructure of QT and TMCP compared to normalised N [34, 41, 80, 72,
73]. ............................................................................................................................................ 51
10
Figure 28 Shows a decreased carbon equivalent value by thermomechanical rolling and
accelerated cooling [82, 30]. ..................................................................................................... 52
Figure 29 Comparison of N and TMCP carbon equivalent CE (IIW) [34, 41, 32, 73]. ........... 53
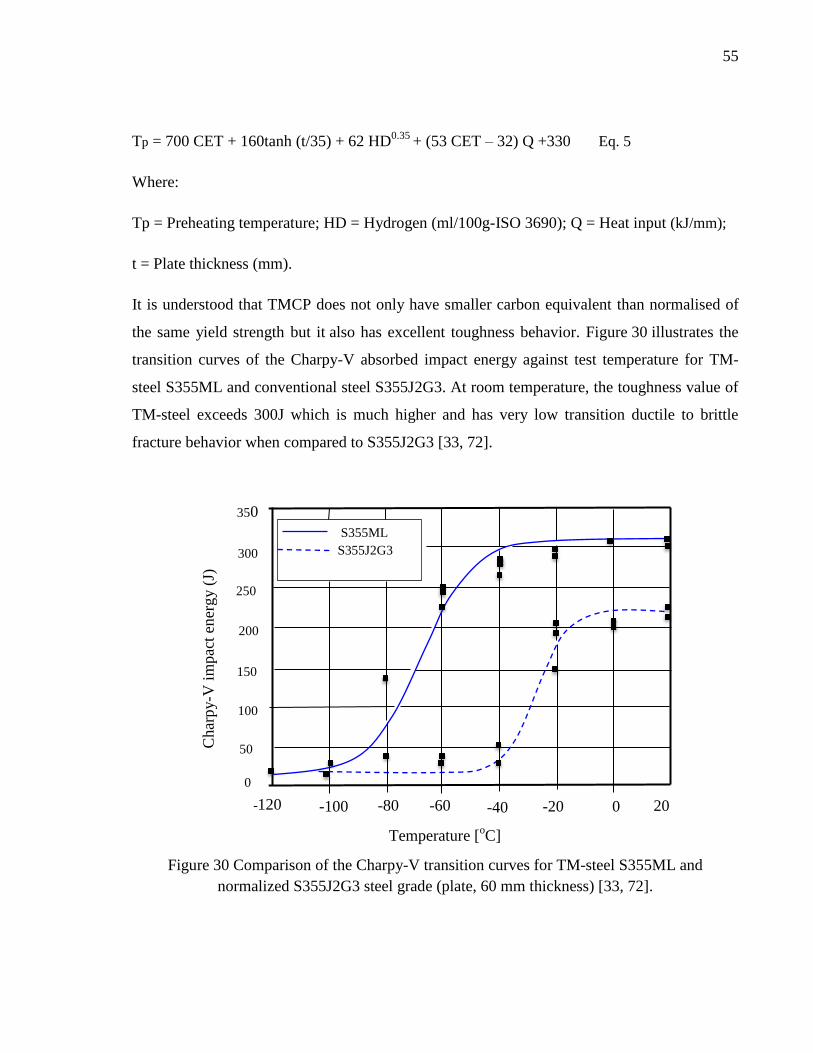
Figure 30 Comparison of the Charpy-V transition curves for TM-steel S355ML and
normalized S355J2G3 steel grade (plate, 60 mm thickness) [33, 72]. ..................................... 55
Figure 31 Relationship between the conventional manufacturing process and the TMCP
Process in terms of CE (IIW) [80]. ........................................................................................... 57
Figure 32 Charpy V- temperature transition curves for S460ML and S690QL with S355J2 for
comparison [32]. ....................................................................................................................... 59
Figure 33 Features affecting the weld quality [89], modified. ................................................. 61
Figure 34 A picture of location of different zones of welded joint [42]. .................................. 62
Figure 35 The influence of heat input on toughness and strength of a weld joint [95]. ........... 64
Figure 36 Dependence heat input vs. impact energies at testing temperatures 20oC, -20
oC,
-40oC for graphs (a), (b), (c) respectively [94]. ........................................................................ 65
Figure 37 Effect of heat input on welded steel [94, 95, 97]. .................................................... 67
Figure 38 Absorbed Charpy impact energy of weld metal with different welding amperes and
voltage [97]. .............................................................................................................................. 68
Figure 39 Effect of electrode size on weld metal in multipass welding. Cross sections as a
function of weld diameter, white areas represent re-austenitised and tempered weld metal [27].
.................................................................................................................................................. 69
Figure 40 The effect of large electrode on high strength steel. ................................................ 69
Figure 41 HAZ crack caused by insufficient preheat [87]. ....................................................... 71
Figure 42 Comparison of preheating temperatures according to EN 1011-2 between S460N
and higher strength S500M [87]. .............................................................................................. 72
Figure 43 Micro hardness distribution in the weld joint of a) QT and b) TMCP HSSs [42]. .. 72
Figure 44 Minimization of risk of hydrogen cracking in weld joint [105, 107]. ...................... 73
Figure 45 The Charpy V-notch specimen and testing machine [109]. ..................................... 75
Figure 46 Graph of the temperature dependence on the Charpy V-notch impact energy [111,
112]. .......................................................................................................................................... 76
Figure 47 Tested samples fracture appearance [108]. .............................................................. 76
Figure 48 The CTOD test piece details [113]. ......................................................................... 77
Figure 49 Picture of CTOD testing machine [113]. .................................................................. 78
Figure 50 CTOD test result plotted [117]. ................................................................................ 79
Figure 51 Drop Weight testing (DWT) of weld [120]. ............................................................. 80
Figure 52 Weld metal being tested [121]. ................................................................................. 81
11
Contents
Abstract ....................................................................................................................................... 2
Acknowledgements ..................................................................................................................... 3
List of symbols and abbreviations .............................................................................................. 4
List of Tables .............................................................................................................................. 8
List of Figures ............................................................................................................................. 9
1. INTRODUCTION ............................................................................................................. 13
1.1. Delimitations .............................................................................................................. 14
1.2. Aim of the research work ........................................................................................... 14
1.3. History of Offshore hydrocarbon exploration ............................................................ 14
2. TYPES OF OFFSHORE STRUCTURES ......................................................................... 17
2.1. Environmental Loads in offshore structures .............................................................. 20
2.2. General properties of plain carbon steel ..................................................................... 21
2.2.1. Mechanical properties of carbon steels ............................................................... 23
2.2.2. The relationship between strength and toughness .............................................. 23
3. DEVELOPMENT OF HIGH STRENGTH STEELS USED FOR OFFSHORE
STRUCTURES ......................................................................................................................... 25
3.1. Chronology and production processes for rolled steels ............................................. 25
3.2. Applications of High strength steels in offshore structures ....................................... 26
3.3. Processing methods of steels ...................................................................................... 28
3.4. Metallurgical and Chemical consideration ................................................................. 30
4. FACTORS AFFECTING THE WELDABILITY AND TOUGHNESS OF STEELS ..... 34
4.1. Effect of trace elements on steel ................................................................................ 34
4.2. The effect of pearlitic microstructure on mechanical properties of carbon steel ....... 35
4.3. Effect of carbon content on toughness of steel and weld ........................................... 41
4.4. Other failure modes which contribute to low toughness ............................................ 43
5. PROCESSES OF IMPROVING STEEL TOUGHNESS.................................................. 45
5.1. Production processes for High-performance steel ..................................................... 46
5.2. Comparison of TMCP to Conventional steel ............................................................. 52
12
5.2.1. Properties and characteristics of TMCP to Conventional steels ......................... 56
5.3. Properties of modern high-performance steel ............................................................ 57
6. WELDABILITY OF CARBON STEEL ........................................................................... 59
6.1. Effecting factors of steel weldability ......................................................................... 60
6.2. The effect of welding parameters on toughness and weldability of steel .................. 61
6.2.1. The effect of Heat Input ...................................................................................... 62
6.2.2. The effect of Voltage and Ampere ..................................................................... 67
6.2.3. The effect of welding electrodes ......................................................................... 68
6.3. Preheating temperatures for welding ......................................................................... 70
6.3.1. HAZ microstructure of steels QT and TMCP ..................................................... 72
6.3.2. Hydrogen induced cold cracking ........................................................................ 73
7. TEST METHODS FOR FRACTURE TOUGHNESS ...................................................... 74
7.1. Charpy impact Test- generally ................................................................................... 74
7.2. Crack Tip Opening Displacement (CTOD) ............................................................... 77
7.3. Drop Weight Test (DWT) .......................................................................................... 79
8. CONCLUSIONS AND SUMMARY .......................................................................... … .81
References ................................................................................................................................. 85
13
1. INTRODUCTION
It sticks out a mile that in today’s oil and gas industries, the attainment of toughness for high
strength steel on the effect of weldability of carbon steels pertaining to offshores structures has
received considerable attention of discussion. Impact toughness is one of the most important
properties associated with materials used in offshore structures to have adequate energy to
resist fracture.
The improvement to achieve toughness for high strength steel used for offshore platforms
increases efficiency and productivity. Besides it avoids problems of fractures resulting from
Impact load, reduces repair and rework of welding, waste materials would be avoided, which
saves cost and time. This causes flexibility, less work done and gives chance for continuous
progress and effectiveness.
However, these properties are generally mutually in compatible, even though it is known that
in mechanical behaviors of steels carbon plays a dominant role, there is some uncertainty
aspect of its microstructural and micromechanical mechanisms. It is notably that while
increasing the tensile strength of steel by raising its carbon content, its toughness obviously
reduces as well as its weldability and thereby limiting the extent of applications of structural
steels [1, 2]. In ferrite-pearlite steel, it may be attributed to the formation of carbides, and
some elements which forbids dislocations from moving which induces the crack nucleation
[2]. Catastrophic failures are caused by inadequate strength, poor weldability and toughness
characteristics of a given material, including both its impact and fracture toughness.
An approach to overcome this problem or the possibility of improving the toughness of steel
has been examined by considering several relevant factors. Chapter 2 and 3 reviews types of
offshore structures, mechanical properties of steel, environmental conditions in offshore,
applications of structural steel used in offshore. Chapter 4 examines the effects of carbon
content on toughness of steel and weld. Chapter 5 is also about how to increase the toughening
mechanisms of high strength steels. The rest of the chapters examine the effects of welding
parameters on toughness and weldability, cracking. Testing methods for fracture toughness
including CVN, CTOD, and DWT have been discussed as well.
14
1.1. Delimitations
This thesis provides an overview of offshore platforms structures. The main material is focus
on high carbon steels because of its detrimental effect on toughness of steel resulting from
increasing carbon content.
1.2. Aim of the research work
This research is to compare different High strength steels (HSS) and their usability in
welded structures.
To develop the understanding of toughening mechanism of carbon steels and find the
best ways to improve its toughness.
Also understanding of fracture toughness behavior of carbon steels by knowing what
happens, when they do occur by some impact tests methods.
The effects of welding parameters in achieving a sound weld which is weld defect free
such as hydrogen induced cracking.
1.3. History of Offshore hydrocarbon exploration
The rising and establishment of offshore hydrocarbon exploration has driven high interest in
oil and gas business today. This has resulted into economic and technical characteristics which
are directly related to global investment. The history behind the today global investment in
offshore is shortly discussed.
Offshore drilling typically refers to the extraction of oil and gas resources which lie
underwater. Also the term describes oil extraction off the coasts of continents, which also
applies to drilling in lakes and inland seas [3]. In 1896, the exploration of offshore drilling for
oil began off the coast of Summerfield, California, United States. Californian piers were the
first offshore platforms for petroleum production. By 1897 this first offshore well was
producing oil and 22 companies soon joined in the boom, constructing 14 more piers and over
400 wells within the next five years [4]. About 50 years later, Kerr-McGee oil industries
started their first productive drilling in water depth of about 6 meters off the coast of
15
Louisiana. And during that time wooden drilling structures which were previously used was
replaced by steel drilling structures in Summerfield. This replacement improved the structural
integrity for rigs and at lower costs as compared to the life of the well. Companies such as
Shell and Texaco were the first to use barge drilling, which is towing small mobile platforms
to locations where there is oil drilling prospect. In the 1980s the offshore oil and gas
explorations and production became more uneconomically viable for shallow water drilling
than deep water. This was due to the fact that shallow water exploration posed some
challenges like seismic limitations and highly gas prone shelf but beneficial in deeper waters
to the greater exploration for larger fields. More significant discoveries in the 1980s developed
into producing wells in the 1990s, in deep water Gulf of Mexico. In five years later, deep
water rigs worked farther off the coast was producing twice as much as shallow water. An
increasing amount of oil was coming from ultra-deep water (1524 m and deeper). Floating
platforms made in the 1970s, including semisubmersibles, tension leg platform FPSOs and
other structures keeping them above water for drilling deeper turn out to be even better than
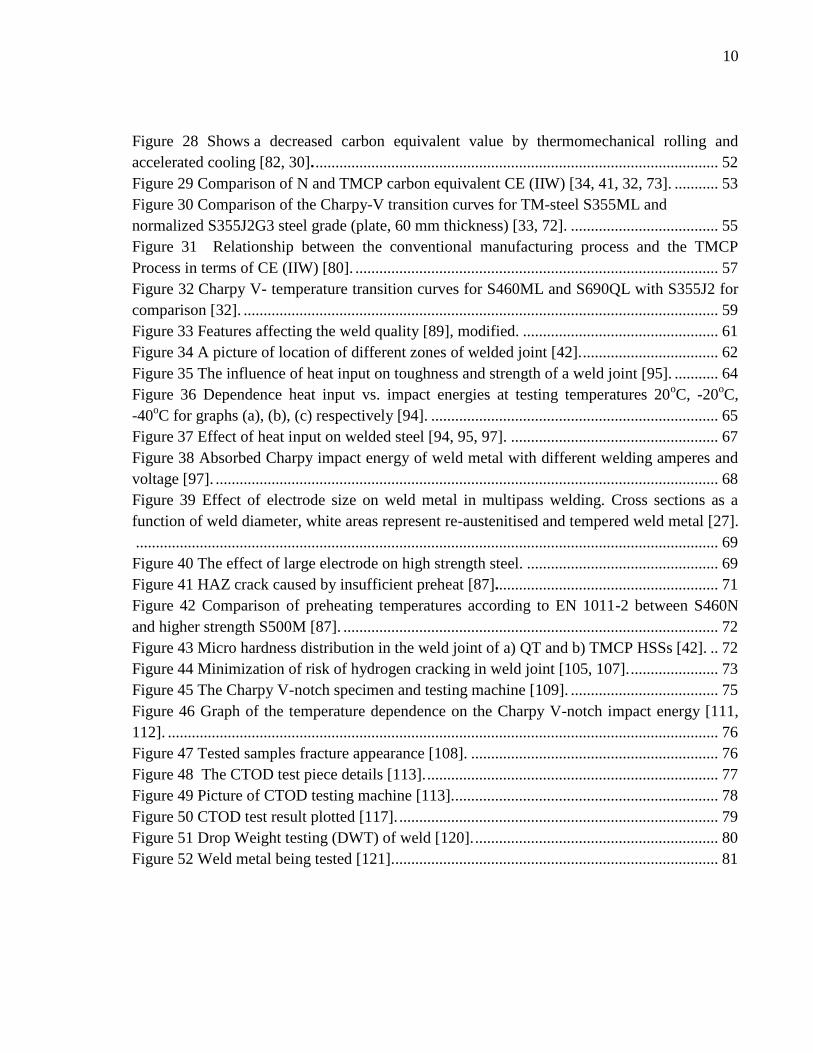
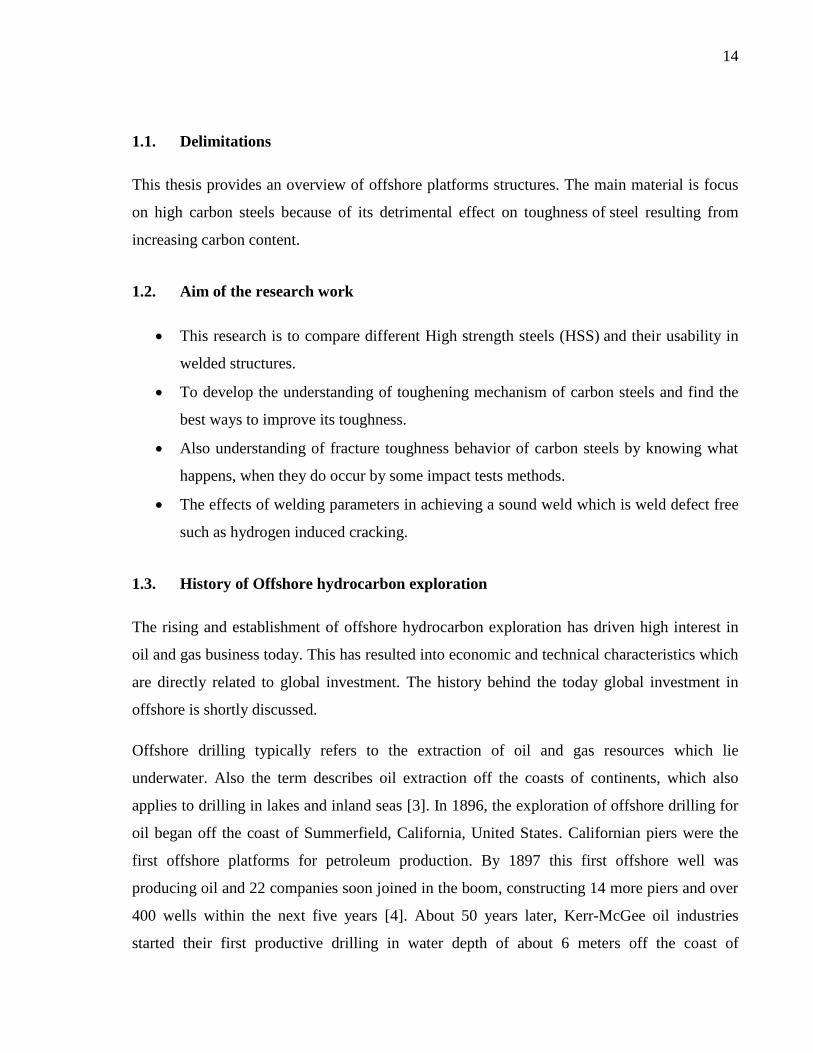
imagined [5]. Figure 1 shows the federal offshore oil production in the Gulf of Mexico from
1984 to 2009. It illustrates the depth of water throughout every year that amount of barrels of
oil drilled and produced. An increasing amount of oil was coming from ultra-deep water
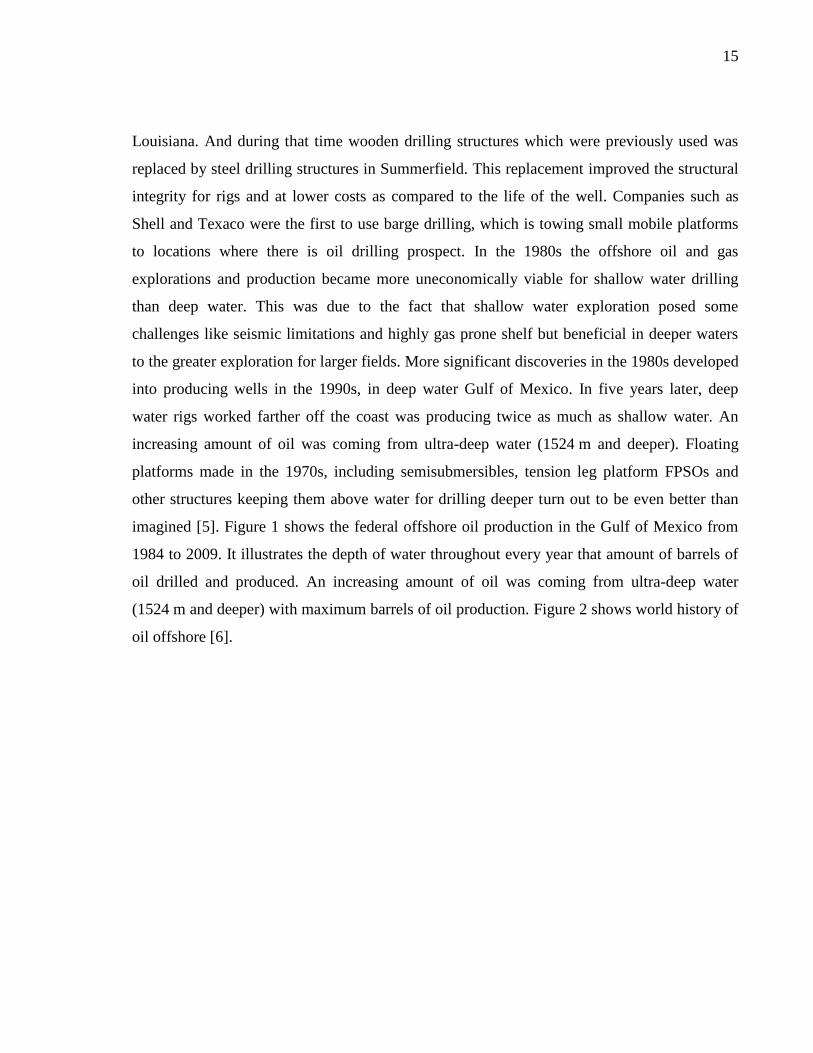
(1524 m and deeper) with maximum barrels of oil production. Figure 2 shows world history of
oil offshore [6].
16
Figure 1 Federal Offshore Oil Production in the Gulf of Mexico [5].
Figure 2 Shows future of worldwide oil and gas production [6, 7].
Non-Conventioanl Gas
Gas
Natural Gas Liquids
Polar
Deep water
Heavy Oil
Regular Oil
Oil
pro
duct
ion (
mb/d
)
17
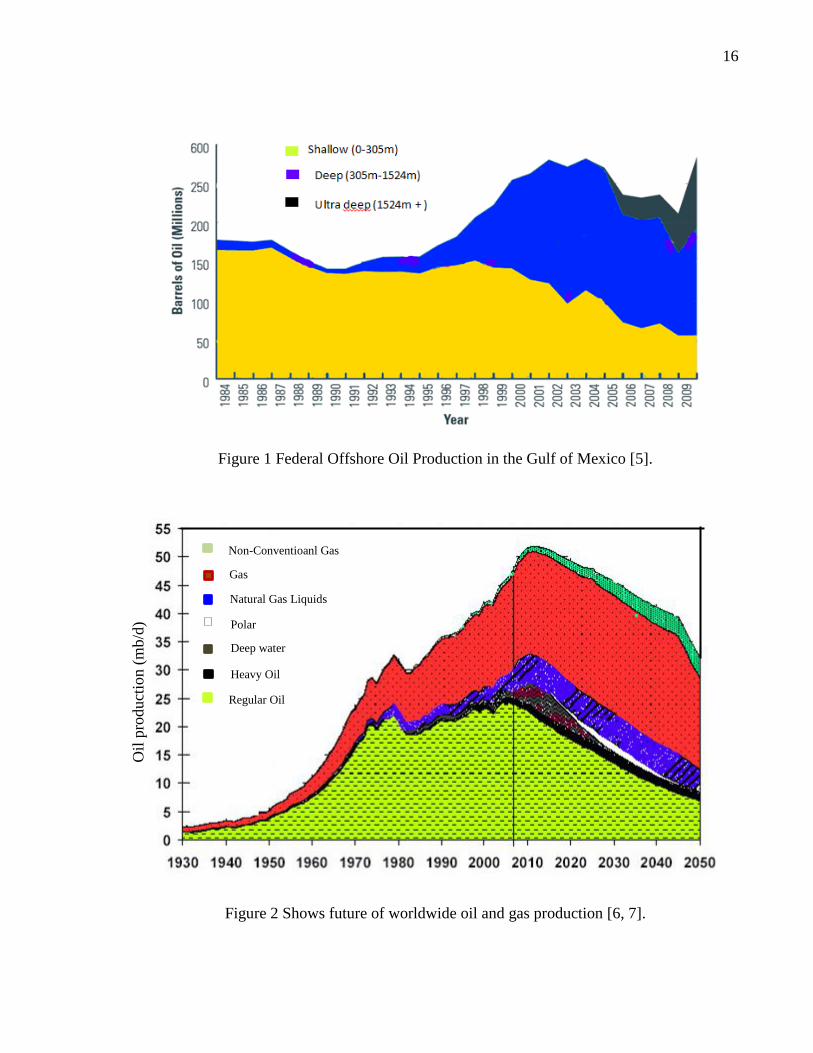
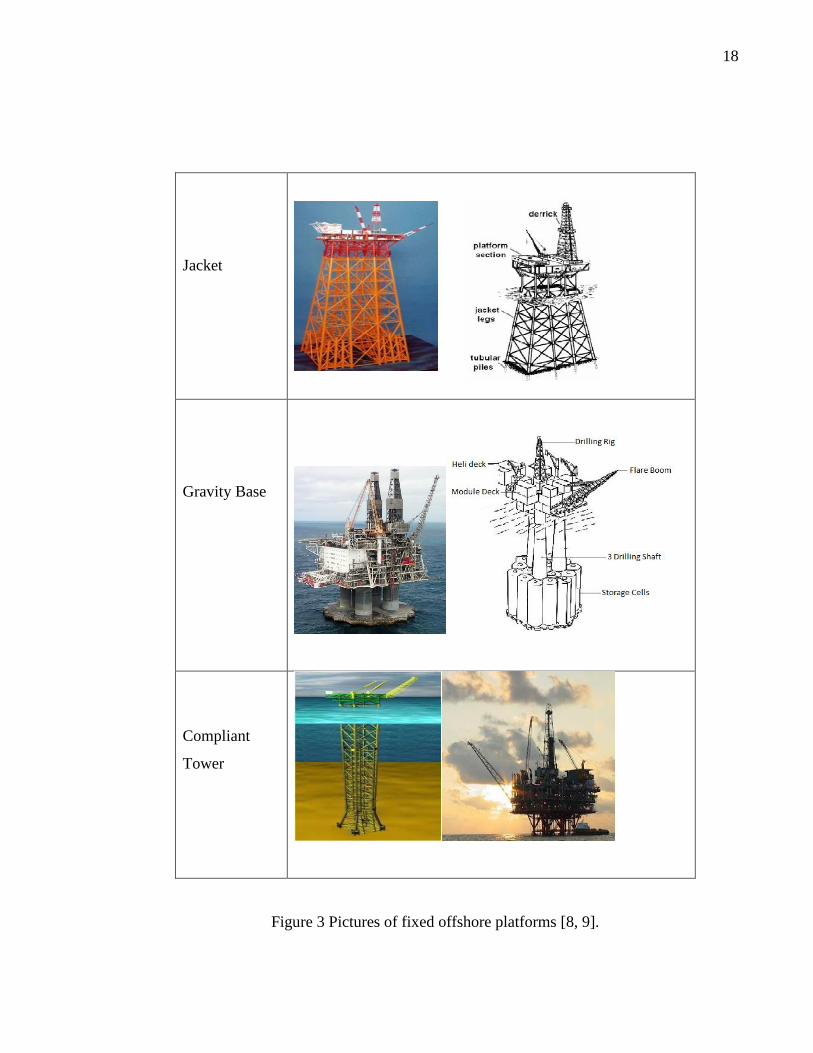
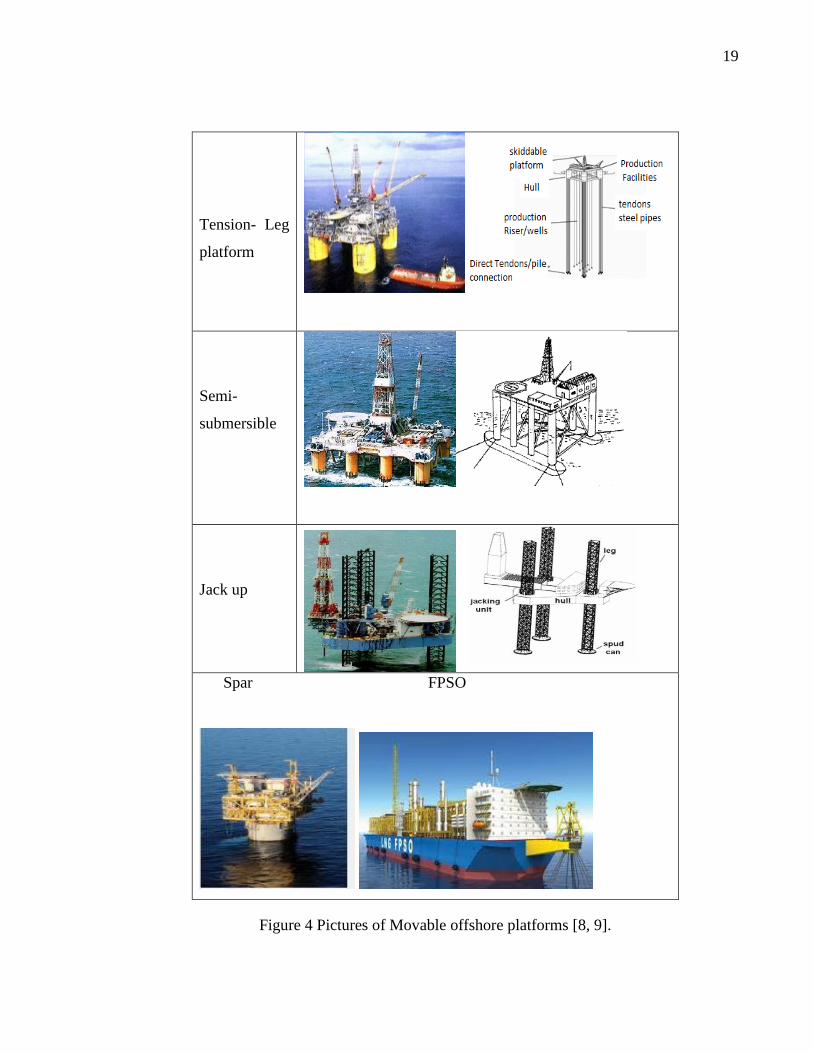
2. TYPES OF OFFSHORE STRUCTURES
Offshore platforms are used for exploration of oil and gas from under seabed and processing.
There are two classifications; fixed and movable structures and each has a number of sub-
categories as shown in Table 1. Fixed structures are those extended to the seabed for a long
period of time throughout the service of life. The movable structures can be moved from one
location to another, float, near the water. The jacket is the most platforms among the offshore
structures used in oil and gas industries because it carries production platform with high
payload. The Offshore platforms of fixed and movable structures used in oil and gas industries
are respectively shown in figure 3 and 4.
Table1 Categories of fixed and floating offshore structures - their uses, advantages and
disadvantages [8, 9, 10, 11, 12, 13].
Structure Sub-
categories Uses Advantages Disadvantages
Jacket
It provides deck space and
supports the foundation piles, conductors,
risers.
Tension- Leg
platformCan operate as Ultra deep water.
They are used mainly as
Drilling units.
Floating production unit for
Shallow and deep water.
Gravity base
Compliant
Tower
Its flexibility is enough that the applied forces
transmitted to the platform is reduced or
resisted. For moderate depths of water 500m-
900m.
Fixed Structures
FPSO
All have good Stable
working environment.
The compliant towers
use flex legs which
reduces resonance
and wave forces.
Long lead time.
Material cost raises quite
sensitive to water depth
as its depth increases.
It is not economical or
practical to have long
legs built.
Ease of relocating and
reusing.
Limited payload
capacity and lack of
storage capability.
Spar
It is a base which supports several vertical
columns which supports a deck
carrying production facilities.
Semisubmersible Used for Ultra deep water about 60m-3,050m
Used for ultra-deep water. It supports
drilling and production activities simultaneously.
Jack up
Movable Structures
18
Jacket
Gravity Base
Compliant
Tower
Figure 3 Pictures of fixed offshore platforms [8, 9].
19
Tension- Leg
platform
Semi-
submersible
Jack up
Spar FPSO
Figure 4 Pictures of Movable offshore platforms [8, 9].
20
2.1. Environmental Loads in offshore structures
Materials like high strength steels required for offshore structures have to respond properly to
its environmental impacts and conditions to exhibit satisfactory weldability characteristics and
toughness property. Also for a proper production welding it has to be done under conditions
where welding site is protected against detrimental effect of the environment. The
environmental factors which act as a limit against long service life of offshore structures and
its performance of operation, including transportation, installation, offloading and construction
are explained below [11]:
Earth quake: Earth quake phenomena including liquefaction of substance soils, submarine
slide, tsunamis and acoustic overpressure shock waves cause ground motion which is
problematic to the strength and ductility during the expected life of the structures. These
effects on structures located in areas where seismic is active are to be considered [11].
Air temperature: Environmental conditions such as applicable for strength and ductility level
needs to be considered because the air and sea temperatures affect the properties of the
material [11].
Ice and snow: Offshore structures to be installed especially in artic areas where ice and snow
may increase estimates are to be made to the extent to which ice and snow may accumulate on
the structures. Large masses like moving icebergs impact a structure and broken ice in moving
past the structure are considered as well for the sake of toughness failure [11].
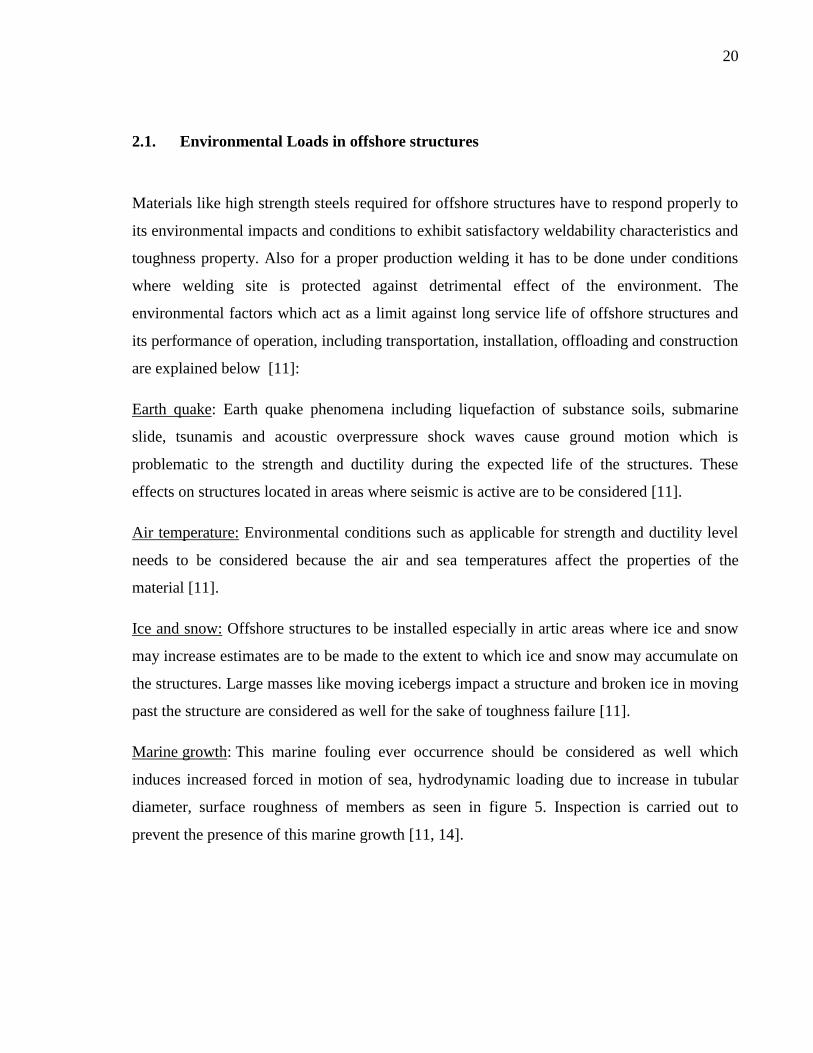
Marine growth: This marine fouling ever occurrence should be considered as well which
induces increased forced in motion of sea, hydrodynamic loading due to increase in tubular
diameter, surface roughness of members as seen in figure 5. Inspection is carried out to
prevent the presence of this marine growth [11, 14].
21
Figure 5 Marine growth found around offshore platforms [15].
Wind and waves: The dynamic effects of impacts of wind speed and water propagation forces
on offshore structures due to cyclical loads induced vibration are to be considered when
designing the structures [11].
Water depth at location: The water depth, which is the distance between the seabed and the
fluctuating components, must be taken into account due to storm surges, and rise and fall of
the water sea [11].
2.2. General properties of plain carbon steel
Steels are alloys of iron and carbon which contains no more than 2% of carbon content with or
without other alloy element. Steels which contain only carbon as its alloying element are
known as carbon steels. These carbon steels can also contain iron, carbon, less than 1,65% but
up to 1,2% manganese, less than 0.6% copper and small amount of silicon, sulphur and
phosphorus. In Table 2, carbon steels are classified by chemical composition into four groups.
22
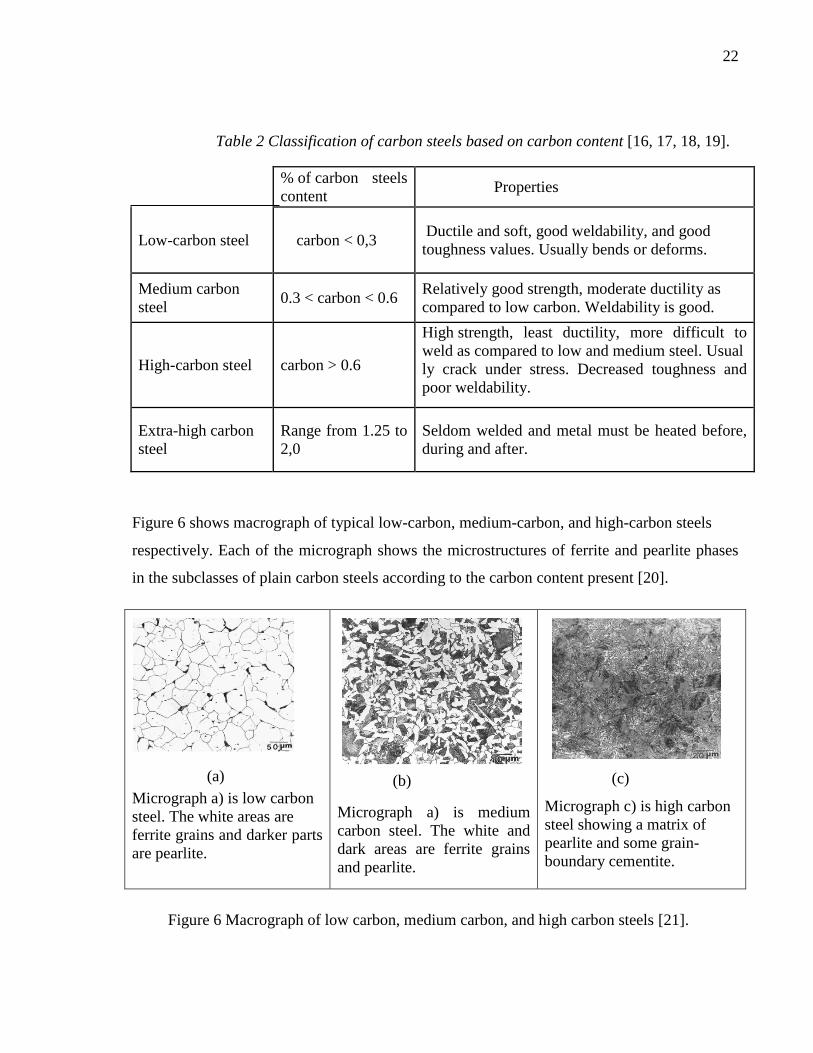
Table 2 Classification of carbon steels based on carbon content [16, 17, 18, 19].
% of carbon steels
content Properties
Low-carbon steel carbon < 0,3 Ductile and soft, good weldability, and good
toughness values. Usually bends or deforms.
Medium carbon
steel 0.3 < carbon < 0.6
Relatively good strength, moderate ductility as
compared to low carbon. Weldability is good.
High-carbon steel carbon > 0.6
High strength, least ductility, more difficult to
weld as compared to low and medium steel. Usual
ly crack under stress. Decreased toughness and
poor weldability.
Extra-high carbon
steel
Range from 1.25 to
2,0
Seldom welded and metal must be heated before,
during and after.
Figure 6 shows macrograph of typical low-carbon, medium-carbon, and high-carbon steels
respectively. Each of the micrograph shows the microstructures of ferrite and pearlite phases
in the subclasses of plain carbon steels according to the carbon content present [20].
Micrograph a) is low carbon
steel. The white areas are
ferrite grains and darker parts
are pearlite.
Micrograph a) is medium
carbon steel. The white and
dark areas are ferrite grains
and pearlite.
Micrograph c) is high carbon
steel showing a matrix of
pearlite and some grain-
boundary cementite.
Figure 6 Macrograph of low carbon, medium carbon, and high carbon steels [21].
(a) (b) (c)
23
2.2.1. Mechanical properties of carbon steels
The mechanical properties that may be considered more are those that relate its ability to resist
external mechanical forces such as sudden impact, bending and twisting. Steels being one of
the principal materials used for offshore structures have some features to assure a proper
performance under both service and extreme loads. Characteristics and reasons required
imposed on the material to perform in offshore environment when subjected to impact
conditions over a wide range of temperatures are shown in Table 3.
Table 3 Properties of steels for structural uses in offshore construction and application [22,
23, 24].
Properties Reason
Ductility Ability to deform after yielding
Light weight For high strength
Weldability Easy to weld and achieve good welds
Impact strength Notch toughness at low temperature
Shear strength Prevents sudden fracture
Young modulus Resistance to deformation
2.2.2. The relationship between strength and toughness
Strength: The word strength is the force per unit area in the field of metals, as in high strength
steels refers to the ability of the material to resist outside forces that are trying to break it. That
is how much energy it can absorb before failure. Material strength is a combination of
mechanical properties such as tensile strength, yield strength, ductility, elasticity and creep
resistance.
Toughness: The ability of a metal to absorb energy when there is a sudden impact before
fracture is termed as toughness; that is, ability to absorb energy in the plastic range. The
tougher the material, the more energy required to cause a crack to grow to fracture. Remember
that ductility is a measure of degree of material plastically deform before it fractures, but just
because the material is ductile does not make it tough. Impact toughness and percentage
elongation are the measures of toughness. It is an established fact that elongation and
toughness are proportional to each other: the higher the elongation, the greater the toughness
and vice versa [25]. Toughness also depends on carbon content, grain size and inclusion.
24
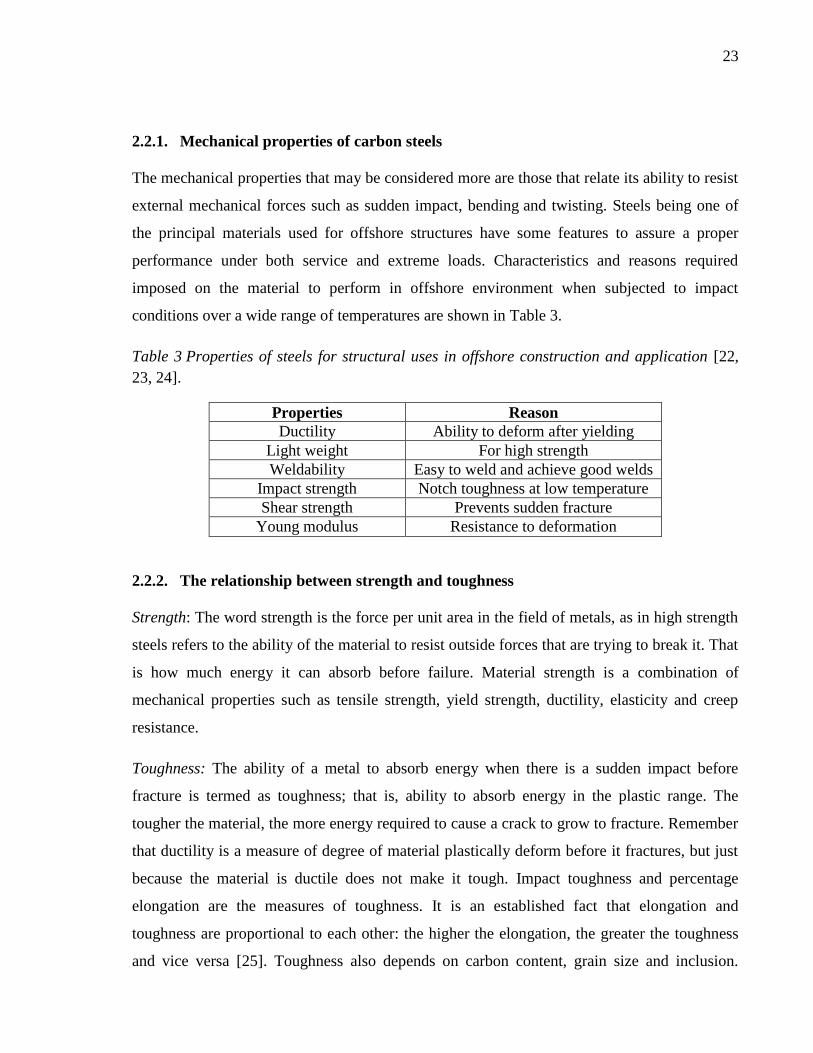
Toughness is the combination of both strength and ductility, a material with high strength and
high ductility will have high toughness than a material with low strength with high ductility as
seen in figure 7.
Strength versus toughness: Toughness falls as strength increases in all cases except where
there is toughening mechanism like grain-size reduction, thermomechanical treatment, heat
treatment which will increase strength and toughness simultaneously. Strength is of no or little
used without toughness and there is kind tradeoff between the two [26, 27, 28].
Figure 7 Tensile toughness under stress-strain curve [29].
25
3. DEVELOPMENT OF HIGH STRENGTH STEELS USED FOR
OFFSHORE STRUCTURES
The demand and production of development of high strength steel grades with yield strength
and toughness as well as good weldability are determined.
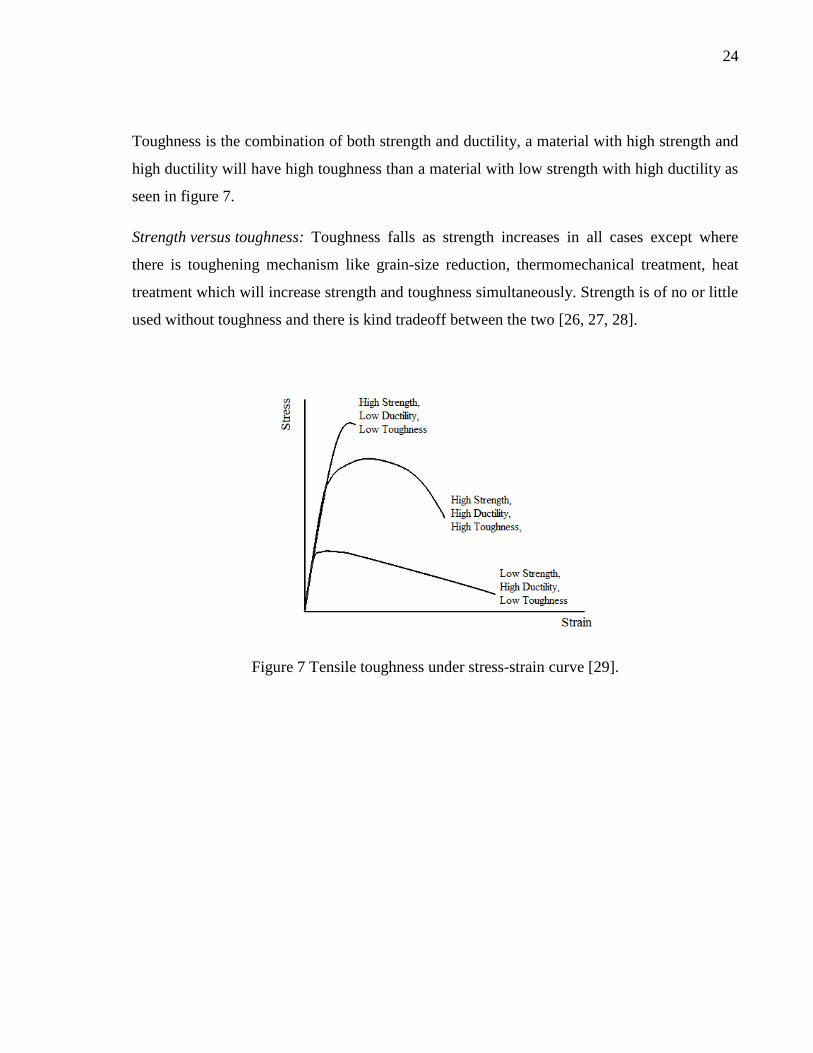
3.1. Chronology and production processes for rolled steels
Toughness as well as weldability is associated with on one hand, quenched and tempered
steels with very high yield strengths (460Q/QL, S690Q, S890Q, S960Q) and on the other hand
by thermomechanically rolled steels with a more moderate yield strength, but higher
toughness (S355M, S460M and S550M). By normalising steel grades with moderate strength
and toughness requirements usually ≤ S460N can be produced. The chronology of structural
steels during the last decades is illustrated in figure 8.
Figure 8 Chronology of structural steels of specific steel grade and its level of strengths [30,
31, 32, 33, 34]
1000
800
600
400
200
[MPa]
0
1940
Yie
ld S
tren
gth
Years
S1100Q
S960Q
S890Q
S690Q
S460N S460M
S355M
TMCP
S1100quench and tempered
S355J2
Normalised/normalised rolled
S355
S550M
1950 2010 1960 1970 1980 1990 2000
26
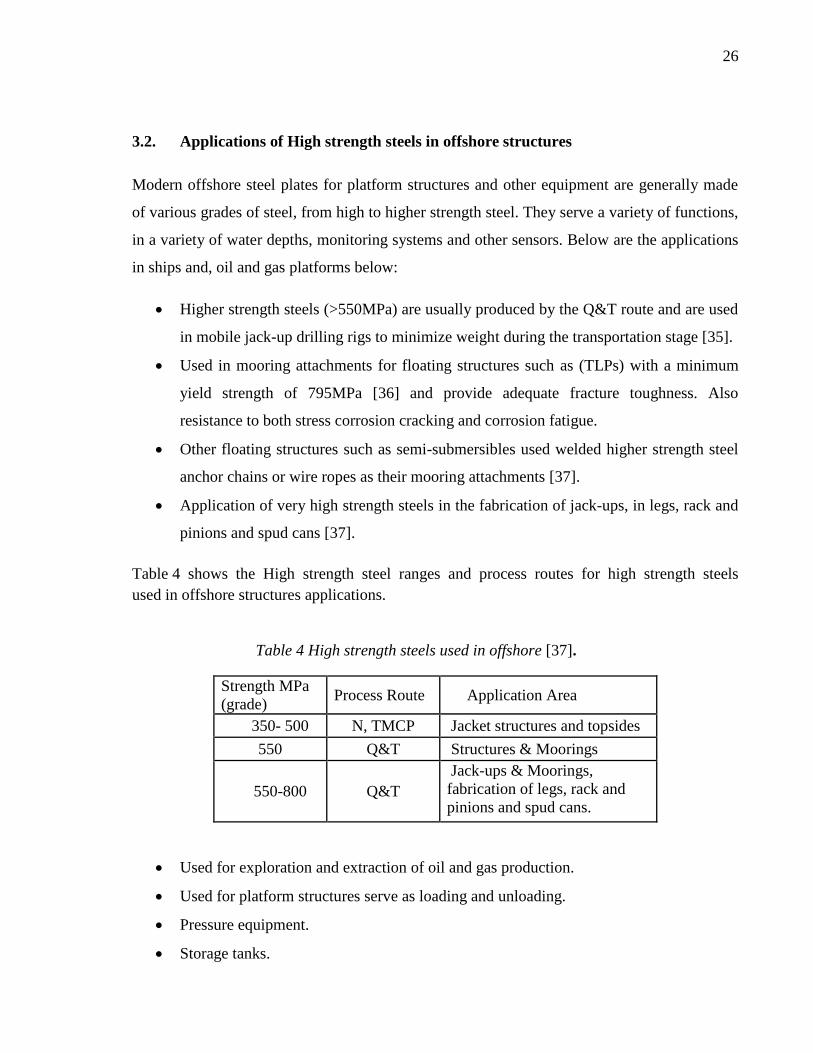
3.2. Applications of High strength steels in offshore structures
Modern offshore steel plates for platform structures and other equipment are generally made
of various grades of steel, from high to higher strength steel. They serve a variety of functions,
in a variety of water depths, monitoring systems and other sensors. Below are the applications
in ships and, oil and gas platforms below:
Higher strength steels (>550MPa) are usually produced by the Q&T route and are used
in mobile jack-up drilling rigs to minimize weight during the transportation stage [35].
Used in mooring attachments for floating structures such as (TLPs) with a minimum
yield strength of 795MPa [36] and provide adequate fracture toughness. Also
resistance to both stress corrosion cracking and corrosion fatigue.
Other floating structures such as semi-submersibles used welded higher strength steel
anchor chains or wire ropes as their mooring attachments [37].
Application of very high strength steels in the fabrication of jack-ups, in legs, rack and
pinions and spud cans [37].
Table 4 shows the High strength steel ranges and process routes for high strength steels
used in offshore structures applications.
Table 4 High strength steels used in offshore [37].
Strength MPa
(grade) Process Route Application Area
350- 500 N, TMCP Jacket structures and topsides
550 Q&T Structures & Moorings
550-800 Q&T
Jack-ups & Moorings,
fabrication of legs, rack and
pinions and spud cans.
Used for exploration and extraction of oil and gas production.
Used for platform structures serve as loading and unloading.
Pressure equipment.
Storage tanks.
27
Machinery parts.
Ice-breakers and ice-going vessels.
Used for navigation, and to support bridges and causeways services [38, 39, 40].
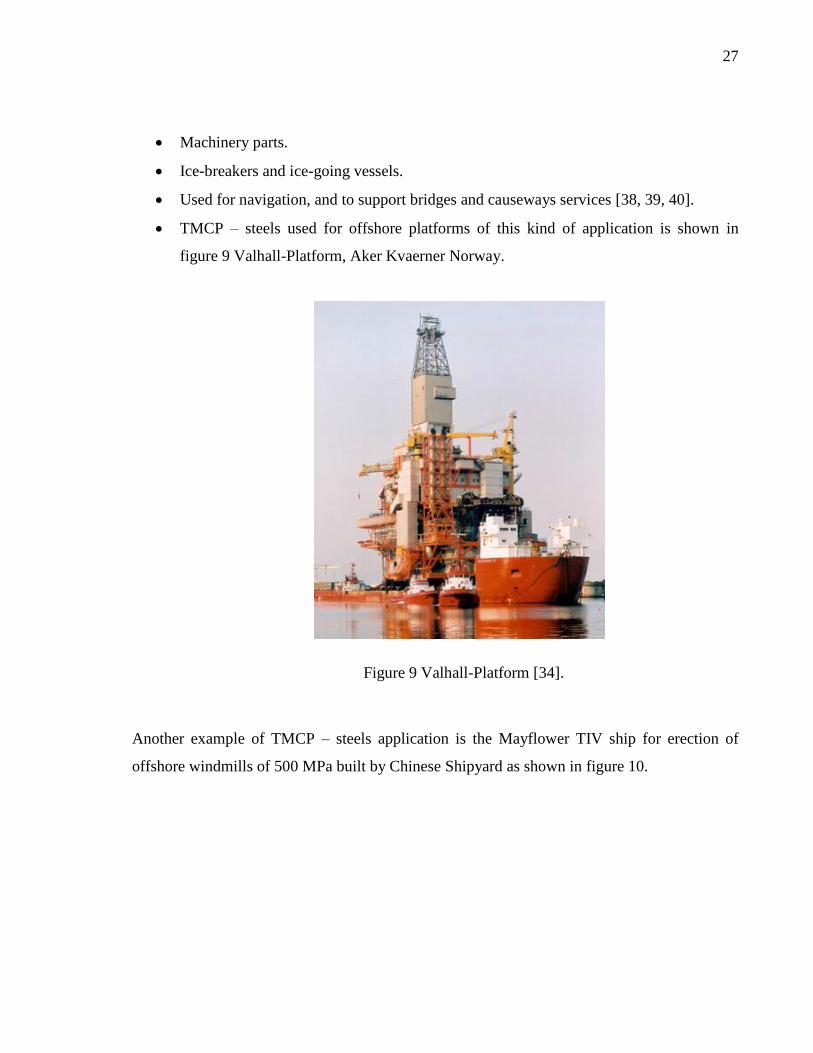
TMCP – steels used for offshore platforms of this kind of application is shown in
figure 9 Valhall-Platform, Aker Kvaerner Norway.
Figure 9 Valhall-Platform [34].
Another example of TMCP – steels application is the Mayflower TIV ship for erection of
offshore windmills of 500 MPa built by Chinese Shipyard as shown in figure 10.
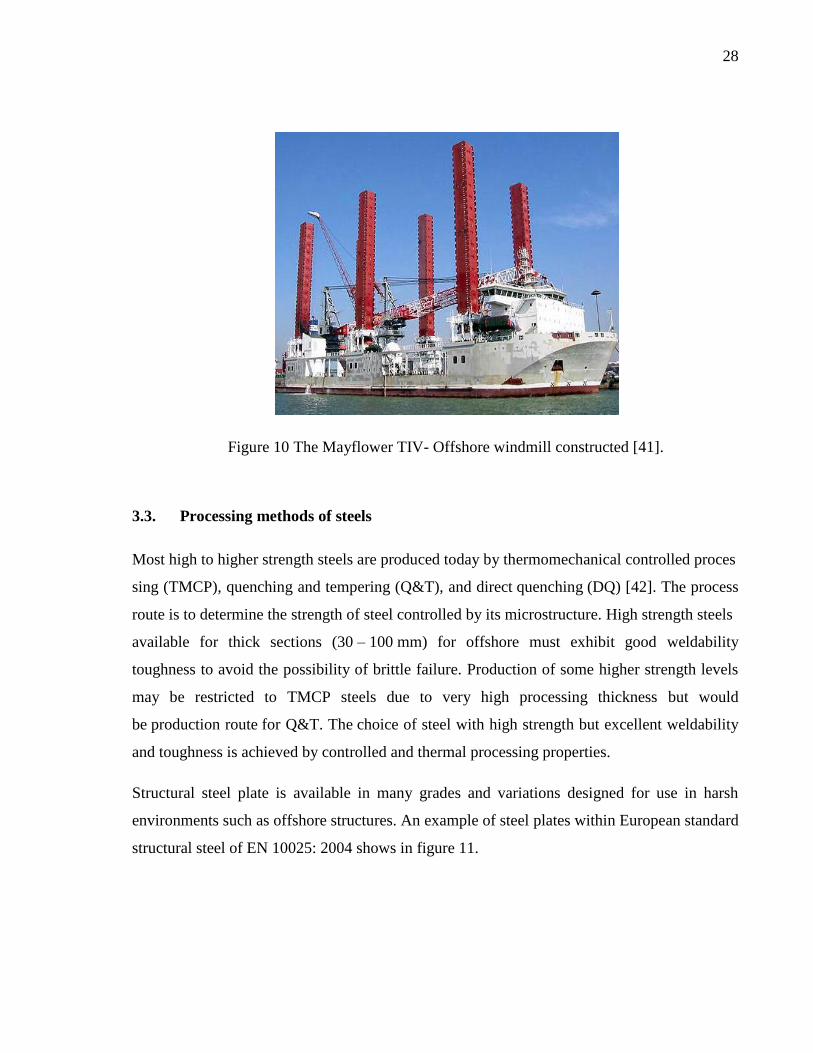
28
Figure 10 The Mayflower TIV- Offshore windmill constructed [41].
3.3. Processing methods of steels
Most high to higher strength steels are produced today by thermomechanical controlled proces
sing (TMCP), quenching and tempering (Q&T), and direct quenching (DQ) [42]. The process
route is to determine the strength of steel controlled by its microstructure. High strength steels
available for thick sections (30 – 100 mm) for offshore must exhibit good weldability
toughness to avoid the possibility of brittle failure. Production of some higher strength levels
may be restricted to TMCP steels due to very high processing thickness but would
be production route for Q&T. The choice of steel with high strength but excellent weldability
and toughness is achieved by controlled and thermal processing properties.
Structural steel plate is available in many grades and variations designed for use in harsh
environments such as offshore structures. An example of steel plates within European standard
structural steel of EN 10025: 2004 shows in figure 11.
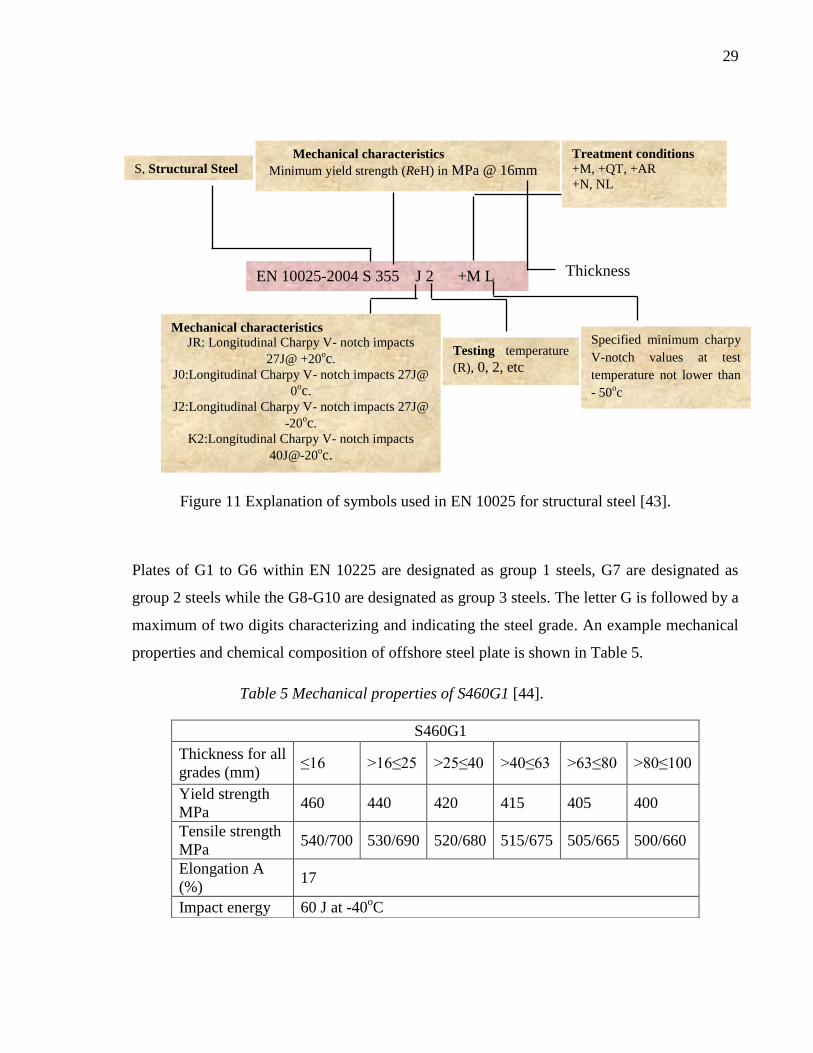
29
Figure 11 Explanation of symbols used in EN 10025 for structural steel [43].
Plates of G1 to G6 within EN 10225 are designated as group 1 steels, G7 are designated as
group 2 steels while the G8-G10 are designated as group 3 steels. The letter G is followed by a
maximum of two digits characterizing and indicating the steel grade. An example mechanical
properties and chemical composition of offshore steel plate is shown in Table 5.
Table 5 Mechanical properties of S460G1 [44].
S460G1
Thickness for all
grades (mm) ≤16 >16≤25 >25≤40 >40≤63 >63≤80 >80≤100
Yield strength
MPa 460 440 420 415 405 400
Tensile strength
MPa 540/700 530/690 520/680 515/675 505/665 500/660
Elongation A
(%) 17
Impact energy 60 J at -40oC
S, Structural Steel Mechanical characteristics
Minimum yield strength (ReH) in MPa @ 16mm
Treatment conditions
+M, +QT, +AR
+N, NL
Mechanical characteristics JR: Longitudinal Charpy V- notch impacts
27J@ +20oc.
J0:Longitudinal Charpy V- notch impacts 27J@
0oc.
J2:Longitudinal Charpy V- notch impacts 27J@
-20oc.
K2:Longitudinal Charpy V- notch impacts
40J@-20oc.
Testing temperature
(R), 0, 2, etc
EN 10025-2004 S 355 J 2 +M L Thickness
Specified minimum charpy
V-notch values at test
temperature not lower than
- 50oc
30
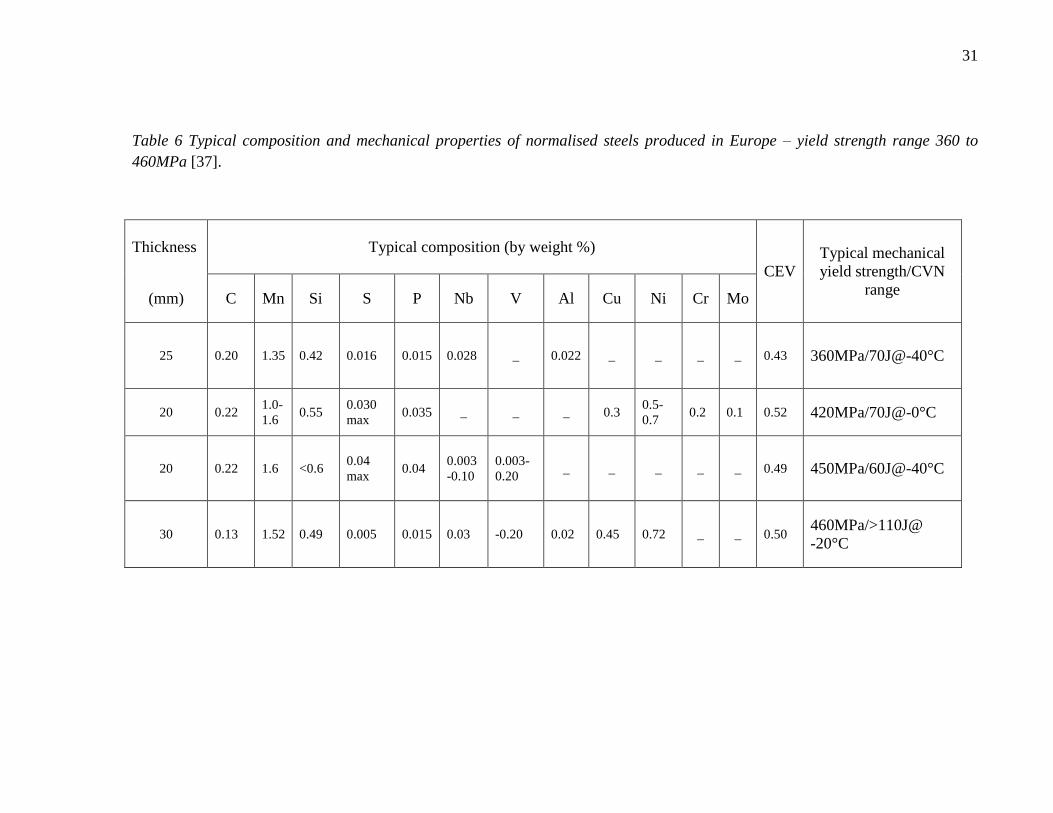
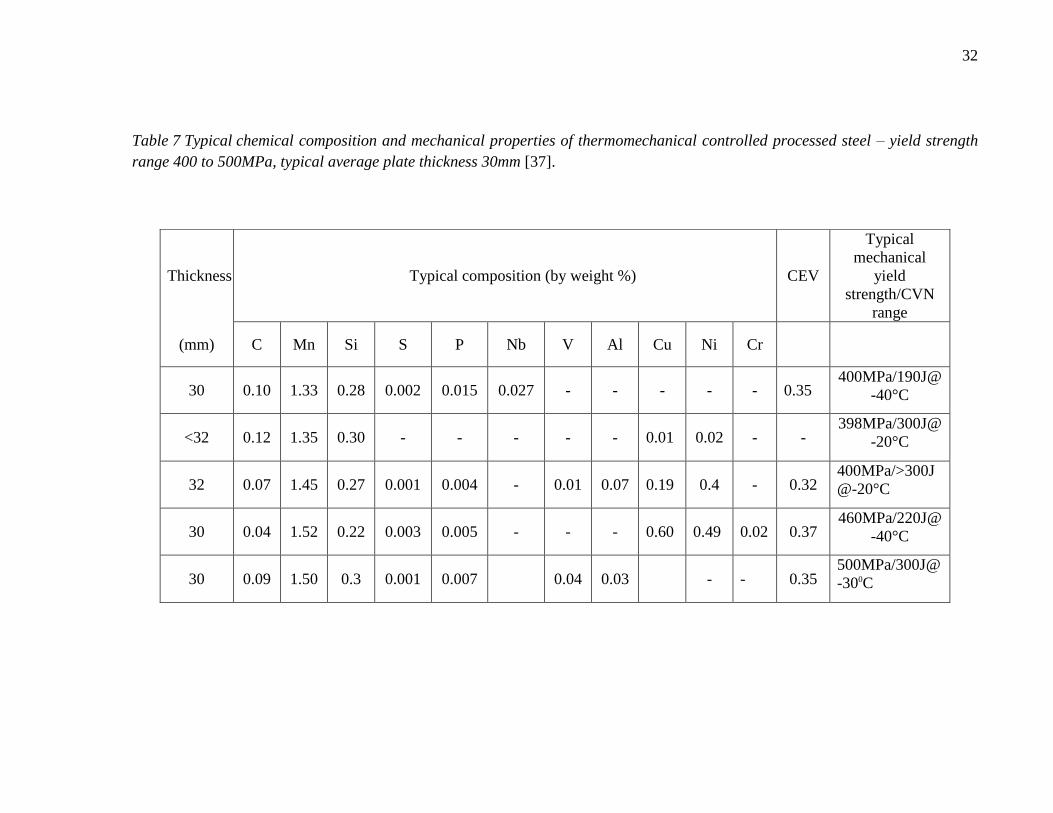
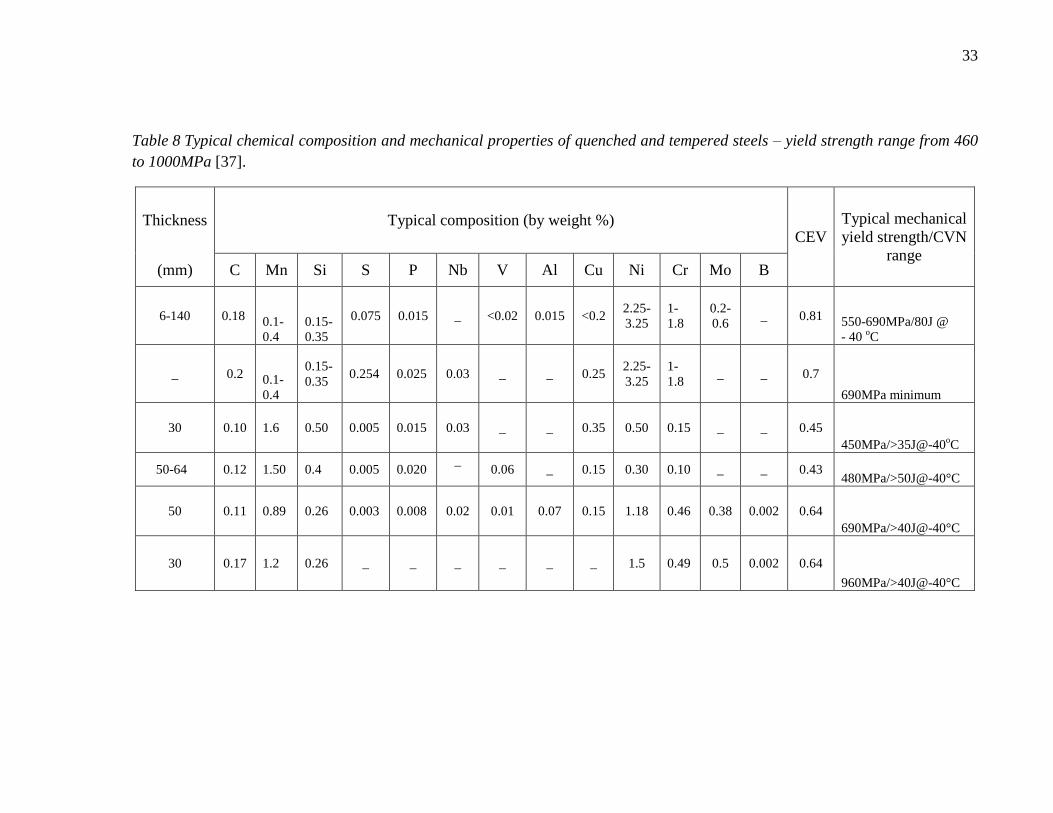
3.4. Metallurgical and Chemical consideration
The chemical composition of offshore steels is very important since it regulates the
mechanical properties of the steel material. Therefore it has influenced between strength,
toughness and weldability of steel [45]. In the following Tables 6, 7, 8 are the chemical
compositions showing an overview over steels grades suitable for applications in offshore
structures. Some typical impact toughness requirement in used today for high strength
applications is 40J at –40 oC (for offshore constructions). Temperature requirements are
normally set at least 30oC below the expected service temperature in many applications [46,
47].
31
Table 6 Typical composition and mechanical properties of normalised steels produced in Europe – yield strength range 360 to
460MPa [37].
Thickness Typical composition (by weight %)
CEV
Typical mechanical
yield strength/CVN
range (mm) C Mn Si S P Nb V Al Cu Ni Cr Mo
25 0.20 1.35 0.42 0.016 0.015 0.028 _ 0.022 _ _ _ _ 0.43 360MPa/70J@-40°C
20 0.22 1.0-
1.6 0.55
0.030
max 0.035 _ _ _ 0.3
0.5-
0.7 0.2 0.1 0.52 420MPa/70J@-0°C
20 0.22 1.6 <0.6 0.04
max 0.04
0.003
-0.10
0.003-
0.20 _ _ _ _ _ 0.49 450MPa/60J@-40°C
30 0.13 1.52 0.49 0.005 0.015 0.03 -0.20 0.02 0.45 0.72 _ _ 0.50 460MPa/>110J@
-20°C
32
Table 7 Typical chemical composition and mechanical properties of thermomechanical controlled processed steel – yield strength
range 400 to 500MPa, typical average plate thickness 30mm [37].
Thickness Typical composition (by weight %) CEV
Typical
mechanical
yield
strength/CVN
range
(mm) C Mn Si S P Nb V Al Cu Ni Cr
30 0.10 1.33 0.28 0.002 0.015 0.027 - - - - - 0.35 400MPa/190J@
-40°C
<32 0.12 1.35 0.30 - - - - - 0.01 0.02 - - 398MPa/300J@
-20°C
32 0.07 1.45 0.27 0.001 0.004 - 0.01 0.07 0.19 0.4 - 0.32 400MPa/>300J
@-20°C
30 0.04 1.52 0.22 0.003 0.005 - - - 0.60 0.49 0.02 0.37 460MPa/220J@
-40°C
30 0.09 1.50 0.3 0.001 0.007 0.04 0.03 - - 0.35 500MPa/300J@
-300C
33
Table 8 Typical chemical composition and mechanical properties of quenched and tempered steels – yield strength range from 460
to 1000MPa [37].
Thickness Typical composition (by weight %) CEV
Typical mechanical
yield strength/CVN
range (mm) C Mn Si S P Nb V Al Cu Ni Cr Mo B
6-140 0.18 0.1-
0.4
0.15-
0.35
0.075 0.015 _ <0.02 0.015 <0.2 2.25-
3.25
1-
1.8
0.2-
0.6 _ 0.81 550-690MPa/80J @
- 40 oC
_ 0.2 0.1-
0.4
0.15-
0.35 0.254 0.025 0.03 _ _ 0.25
2.25-
3.25
1-
1.8 _ _ 0.7
690MPa minimum
30 0.10 1.6 0.50 0.005 0.015 0.03 _ _ 0.35 0.50 0.15 _ _ 0.45
450MPa/>35J@-40oC
50-64 0.12 1.50 0.4 0.005 0.020 _
0.06 _ 0.15 0.30 0.10 _ _ 0.43 480MPa/>50J@-40°C
50 0.11 0.89 0.26 0.003 0.008 0.02 0.01 0.07 0.15 1.18 0.46 0.38 0.002 0.64
690MPa/>40J@-40°C
30 0.17 1.2 0.26 _ _ _ _ _ _ 1.5 0.49 0.5 0.002 0.64
960MPa/>40J@-40°C
34
4. FACTORS AFFECTING THE WELDABILITY AND TOUGHNESS
OF STEELS
The mechanical properties such as ductility, toughness, and its weldability of carbon steel can
be influenced by the effect of the following: trace elements, carbon content, pearlitic
microstructure and other variables that reduce aforementioned properties in offshore
structures.
4.1. Effect of trace elements on steel
Carbon steels contain small amount of residual element also termed as trace element which are
undesirable and have negative impacts on steel. Actually in plain carbon steels silicon and
manganese are not considered undesirable elements because they present in small amounts
[17]. At excessive amounts of alloying elements decrease the impact toughness [48]. The
descriptions of the elements as well as their bad effects they cause on steel which reduces
weldability and toughness are as follows:
Increased quantity of carbon and manganese impact higher tensile and yield properties,
low ductility, embrittlement, low weldability [49, 50].
Increased sulphur and phosphorus increase strength, impacts brittleness, which gives
low weldability, hot cracking, reduces ductility and impact toughness of steel [49, 50].
Increased quantity of silicon lowers ductility transition temperature, but also reduces
weldability.
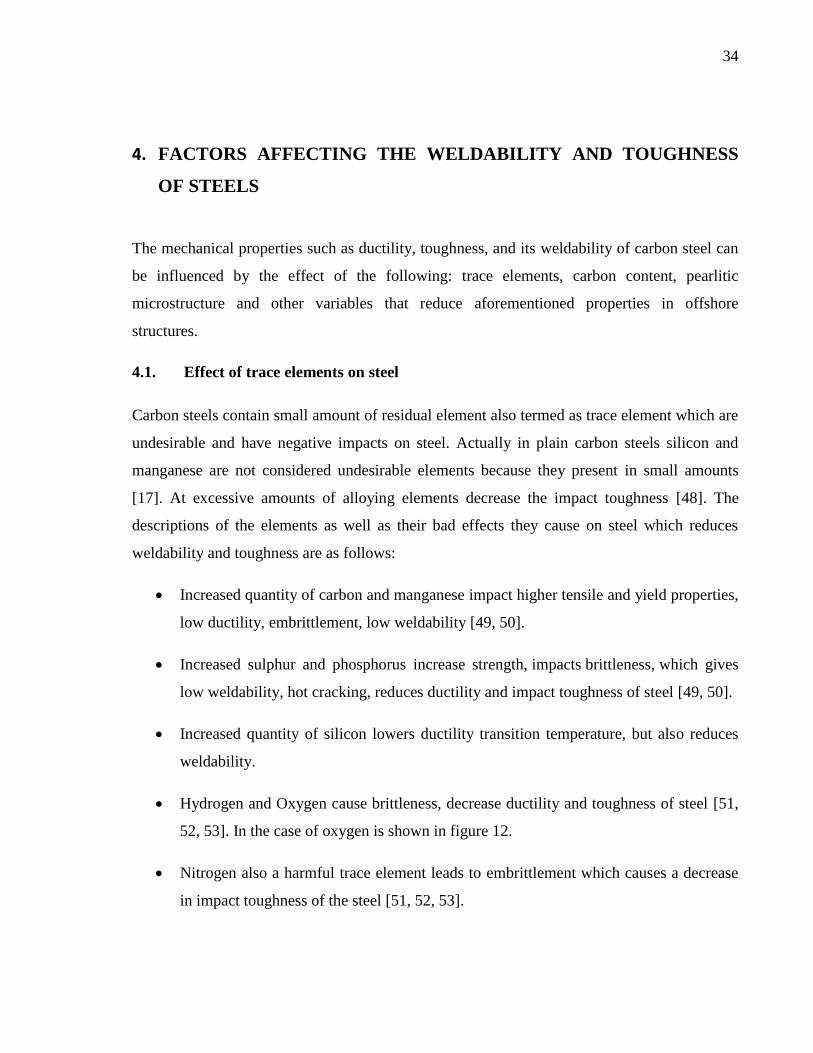
Hydrogen and Oxygen cause brittleness, decrease ductility and toughness of steel [51,
52, 53]. In the case of oxygen is shown in figure 12.
Nitrogen also a harmful trace element leads to embrittlement which causes a decrease
in impact toughness of the steel [51, 52, 53].
35
Problems of toughness can also be caused by Sn and reduced plasticity due to
inclusions existence [54, 55].
Copper content in steel may be relatively beneficial to low temperature notch
toughness when not undergone precipitation hardening. However, copper produces
precipitation hardening and promotes hardness and tensile strength which as a result,
may adversely affect toughness [56, 57].
Figure 12 Relationship between the toughness at 20°C and the oxygen content of carbon steel
welds [53].
4.2. The effect of pearlitic microstructure on mechanical properties of carbon steel
The effect of toughness of steels also depends on interlamellar spacing, s, austenite grain size,
d, pearlite colony size, and cementite thickness, t which are pearlitic microstructures.
The effect of interlamellar spacing on UTS, ductility, impact toughness of high carbon steel is
examined [25]. Pearlite inter-lamellar spacing S, is the distance from the center of a ferrite or
(cementite) plate to the center of the next ferrite or cementite plate in other words the distance
0.02 0.04 0.06 0.08
70
60
50
40
30
WELD OXYGEN CONTENT, %
TO
UG
HN
ES
S F
RO
M C
HA
RP
Y T
ES
T,
J
36
between adjacent cementite lamellar, referred to as the interlamellar spacing [58, 59].
Lamellar structure pearlite is made up of ferrite and cementite. Interlamellar spacing is a
function of transformation temperature alone so the smaller the transformation temperature the
smaller the interlamellar spacing, the stronger the steel [60]. Thick cementite in coarse pearlite
shows very low ductility and fracture easily, whereas in fine pearlite the thin cementite
appears to be ductile and improves toughness [61, 62]. Ferrite-pearlite steels, the pearlite
phase govern the strength while the ferrite phase controls the ductility [25].
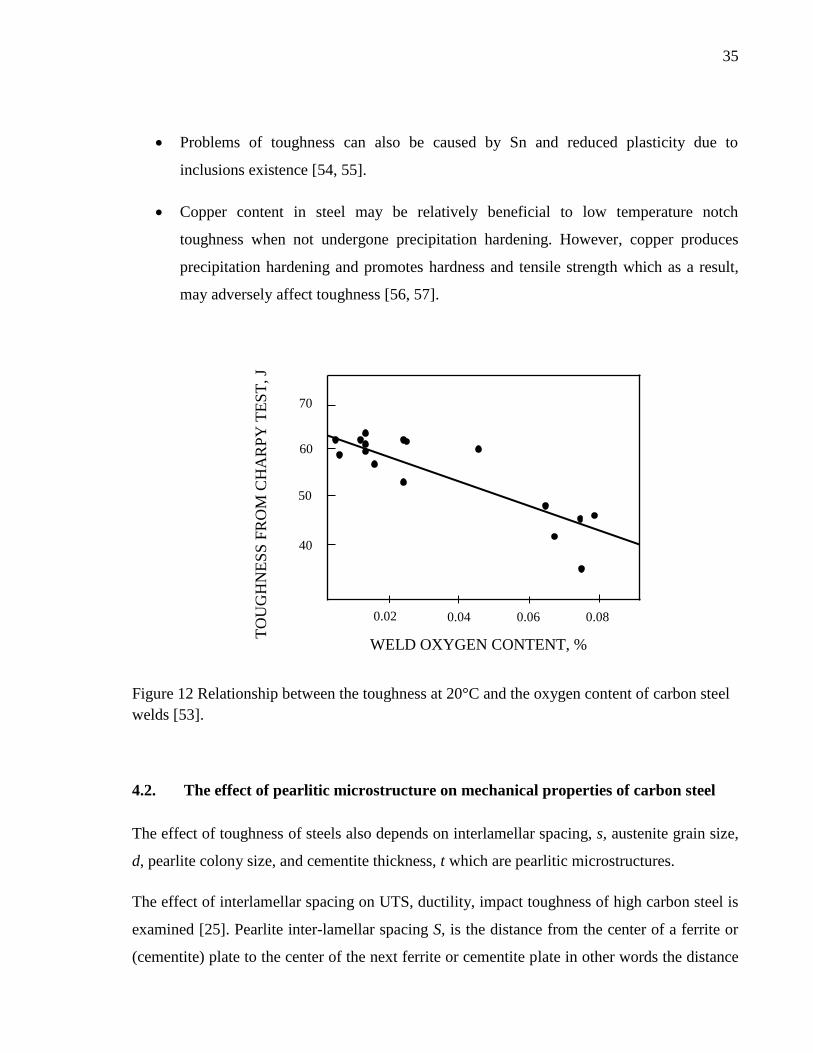
The pearlitic microstructure, including interlamellar spacing, nodule and colony size play an
important role in controlling the strength, ductility, and toughness in high carbon steels [59].
However, the colons size is not an influential microstructure to control the strength, toughness,
or ductility [63]. Figure 13 shows a pearlitic microstructure.
Figure 13 Schematic diagram illustrating the constituents in the pearlitic microstructure [59].
O.P. Modi et al [25] conducted an experiment to examine the effect of interlamellar spacing
on UTS, impact toughness and ductility of a 0,65% C hypo- (near-) eutectoid steel. The steel
was heat-treated at five different austenitization temperatures in order to vary the interlamellar
spacing for a fixed duration of 1h, after which they were cooled in the furnace. The
37
conclusions on the effect of interlamellar spacing on aforementioned mechanical properties
are discussed below:
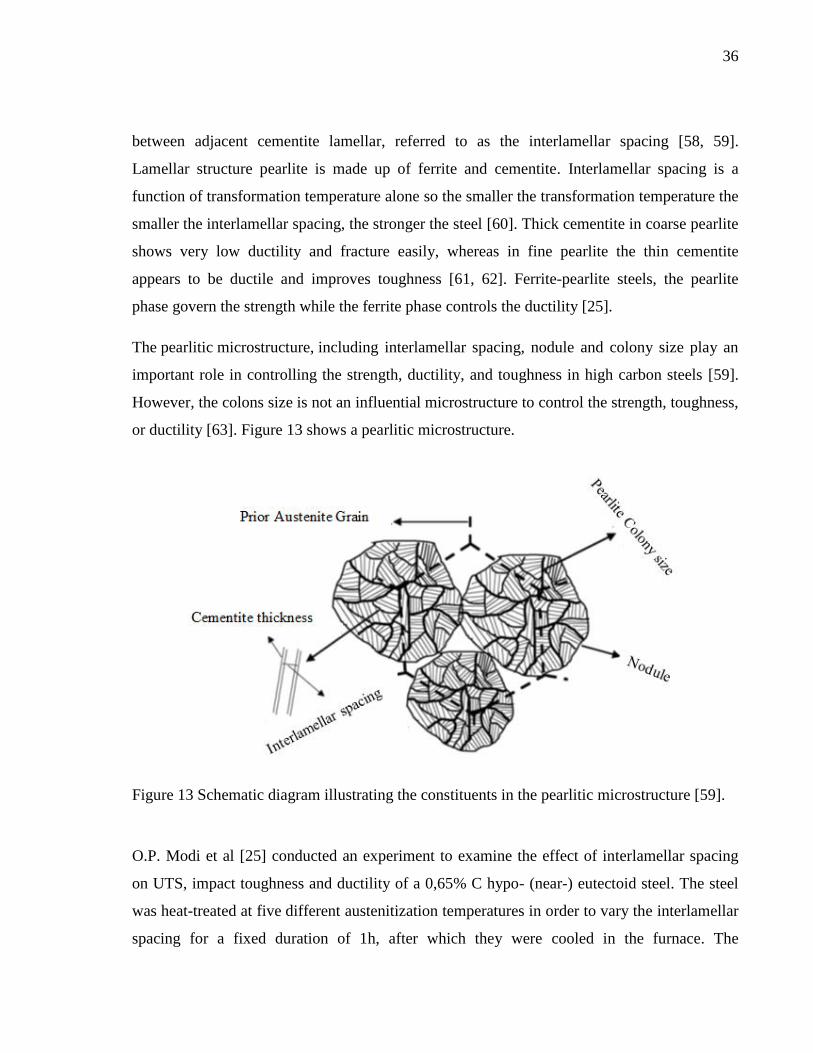
The UTS of the steel samples are plotted as functions of the inverse of the square root of the
interlamellar spacing (S-1/2
) in figure 14. UTS increases linearly up to a certain value of S-1/2
(i.e., 38mm -1/2
) but does not at values greater than 38mm -1/2
. The UTS of steel increases with
a decrease in interlamellar spacing as values of S-1/2
increases. It is indicated that up to a
critical point the interlamellar spacing decreases further even though there is no additional
increase in UTS [25].
Figure 14 The variation in UTS of steel vs of the inverse of the square root of the interlamellar
spacing, S [25].
O.P Modi et al [25] concluded that effect of interlamellar spacing on UTS is that ferrite in
pearlite which is soft also deformes during the course of pearlite defomation. The plastic
deformation is associated with free movement of dislocations. As a result, when the
interlamellar spacing is large, there is large a number of dislocation movement interacting with
each other in the ferrite zone and this causes restriction in their movement. This causes ferrite
phase to be hardened which in turn increases the UTS and reduces ductility and impact
38
toughness. The ferrite in pearlite becomes completely hardened at the point S-1/2
equal to
40 mm-1/2
. This complete hardening of the ferrite in the lamellar structure leads to a
quick crack initiation [25].
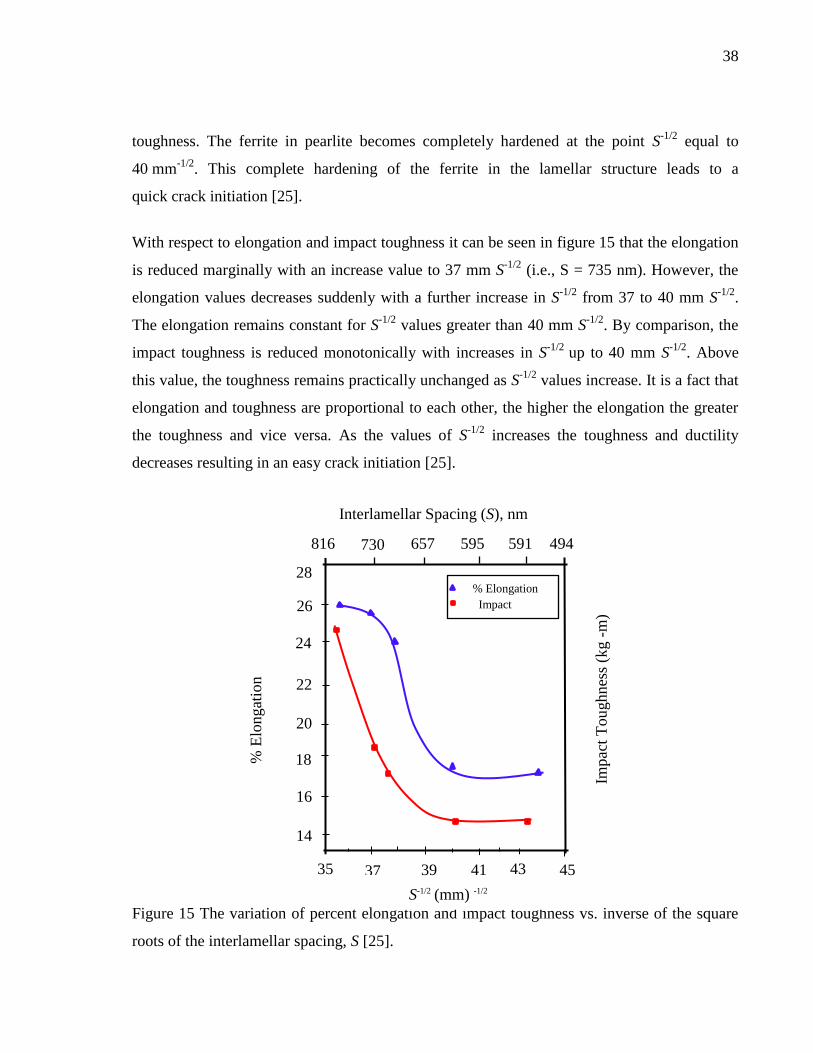
With respect to elongation and impact toughness it can be seen in figure 15 that the elongation
is reduced marginally with an increase value to 37 mm S-1/2
(i.e., S = 735 nm). However, the
elongation values decreases suddenly with a further increase in S-1/2
from 37 to 40 mm S-1/2
.
The elongation remains constant for S-1/2
values greater than 40 mm S-1/2
. By comparison, the
impact toughness is reduced monotonically with increases in S-1/2
up to 40 mm S-1/2
. Above
this value, the toughness remains practically unchanged as S-1/2
values increase. It is a fact that
elongation and toughness are proportional to each other, the higher the elongation the greater
the toughness and vice versa. As the values of S-1/2
increases the toughness and ductility
decreases resulting in an easy crack initiation [25].
Figure 15 The variation of percent elongation and impact toughness vs. inverse of the square
roots of the interlamellar spacing, S [25].
% Elongation
Impact Im
pac
t T
ou
ghnes
s (k
g -
m)
% E
longat
ion
28
26
24
22
20
18
16
35 45 39 411
S-1/2 (mm) -1/2
816 730 657 595 591 494
37 43
Interlamellar Spacing (S), nm
14
39
It can be concluded by [25] that the effect of interlamellar spacing on impact toughness and
ductility decreases with decreasing S (as values of S-1/2
increases) but when the value of S-1/2
<
38 mm-1/2
(S is greater than 712 nm) saturation of work hardening of the ferrite does not occur
so elongation and impact toughness increases. However when S is less than 712 nm and
becomes low enough (i.e. increasing S-1/2
) hardness saturation is reached in the ferrite. The
ferrite becomes hard enough and this might results in easy crack initiation at the ferrite and
cementite interface [25].
Interlamellar spacing is not adequately to explain the behavior of RA in steels [61] because it
depends also on the function of transformation temperature. A decrease in transformation
temperature was observed to decrease the interlamellar spacing which improves ductility [60,
64]. This explains the H.J Sim et al in their experiment.
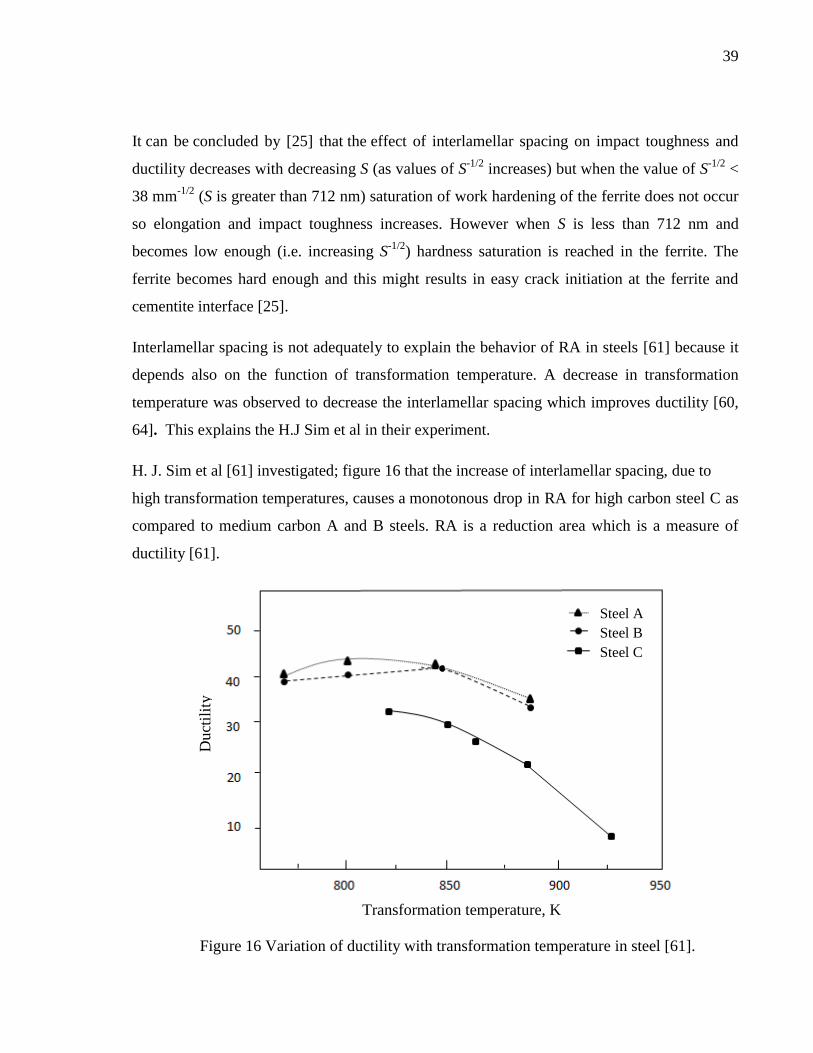
H. J. Sim et al [61] investigated; figure 16 that the increase of interlamellar spacing, due to
high transformation temperatures, causes a monotonous drop in RA for high carbon steel C as
compared to medium carbon A and B steels. RA is a reduction area which is a measure of
ductility [61].
Figure 16 Variation of ductility with transformation temperature in steel [61].
Steel A
Steel B
Steel C
Transformation temperature, K
Duct
ilit
y
40
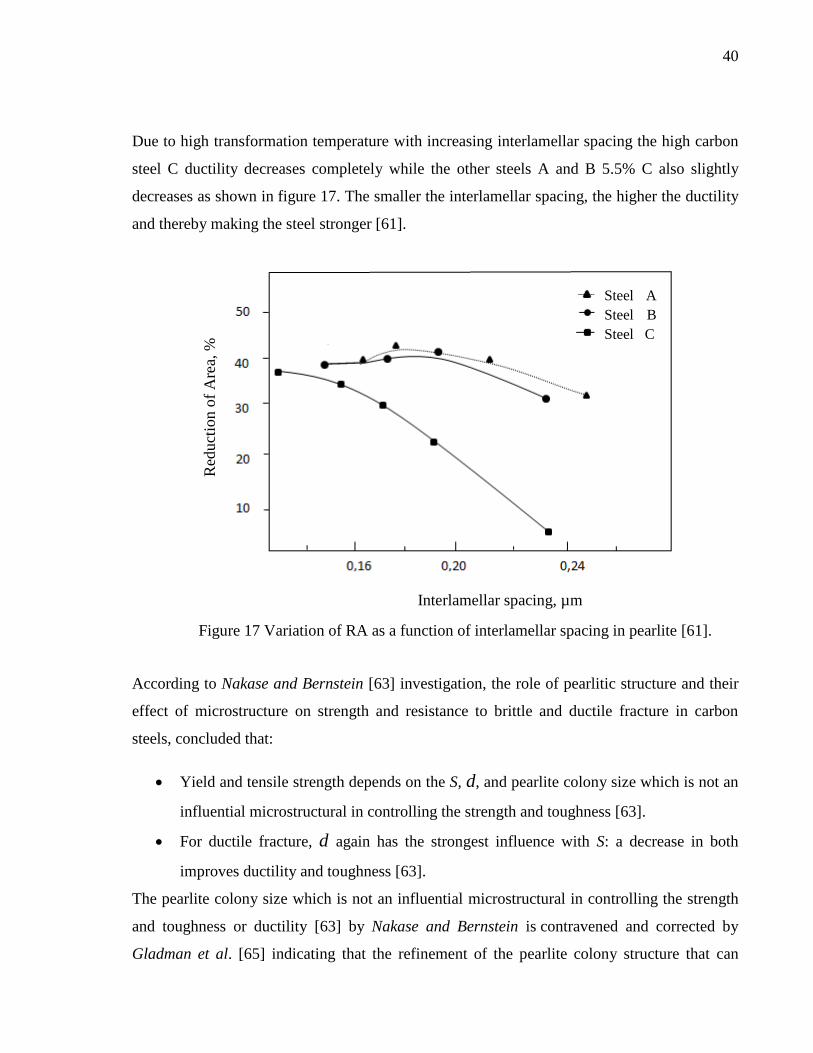
Due to high transformation temperature with increasing interlamellar spacing the high carbon
steel C ductility decreases completely while the other steels A and B 5.5% C also slightly
decreases as shown in figure 17. The smaller the interlamellar spacing, the higher the ductility
and thereby making the steel stronger [61].
Figure 17 Variation of RA as a function of interlamellar spacing in pearlite [61].
According to Nakase and Bernstein [63] investigation, the role of pearlitic structure and their
effect of microstructure on strength and resistance to brittle and ductile fracture in carbon
steels, concluded that:
Yield and tensile strength depends on the S, d, and pearlite colony size which is not an
influential microstructural in controlling the strength and toughness [63].
For ductile fracture, d again has the strongest influence with S: a decrease in both
improves ductility and toughness [63].
The pearlite colony size which is not an influential microstructural in controlling the strength
and toughness or ductility [63] by Nakase and Bernstein is contravened and corrected by
Gladman et al. [65] indicating that the refinement of the pearlite colony structure that can
Steel A
Steel B
Steel C
Interlamellar spacing, µm
Red
uct
ion o
f A
rea,
%
41
occur with decreasing transformation temperature can also contribute to an improvement in
the toughness of high carbon steels through the pearlite colony boundaries acting as hindrance
to brittle crack propagation. It should also be noted that the cementite thickness decreases with
decreased in transformation temperature reduces brittleness which improves impact toughness.
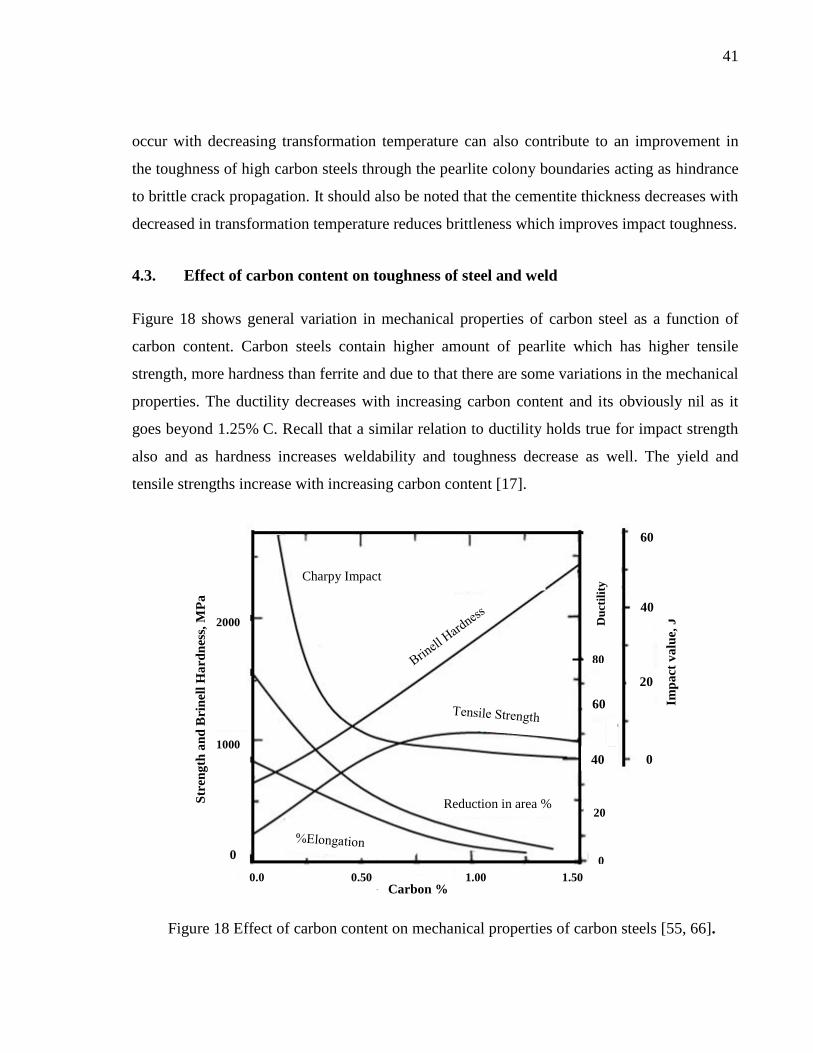
4.3. Effect of carbon content on toughness of steel and weld
Figure 18 shows general variation in mechanical properties of carbon steel as a function of
carbon content. Carbon steels contain higher amount of pearlite which has higher tensile
strength, more hardness than ferrite and due to that there are some variations in the mechanical
properties. The ductility decreases with increasing carbon content and its obviously nil as it
goes beyond 1.25% C. Recall that a similar relation to ductility holds true for impact strength
also and as hardness increases weldability and toughness decrease as well. The yield and
tensile strengths increase with increasing carbon content [17].
Figure 18 Effect of carbon content on mechanical properties of carbon steels [55, 66].
2000
1000
0.0 0.50 1.00 1.50
80
20
0
Charpy Impact
Reduction in area %
60
40
Du
ctil
ity
Imp
act
va
lue,
J
Str
eng
th a
nd
Bri
nel
l H
ard
nes
s, M
Pa
Carbon %
0
60
40
20
0
42
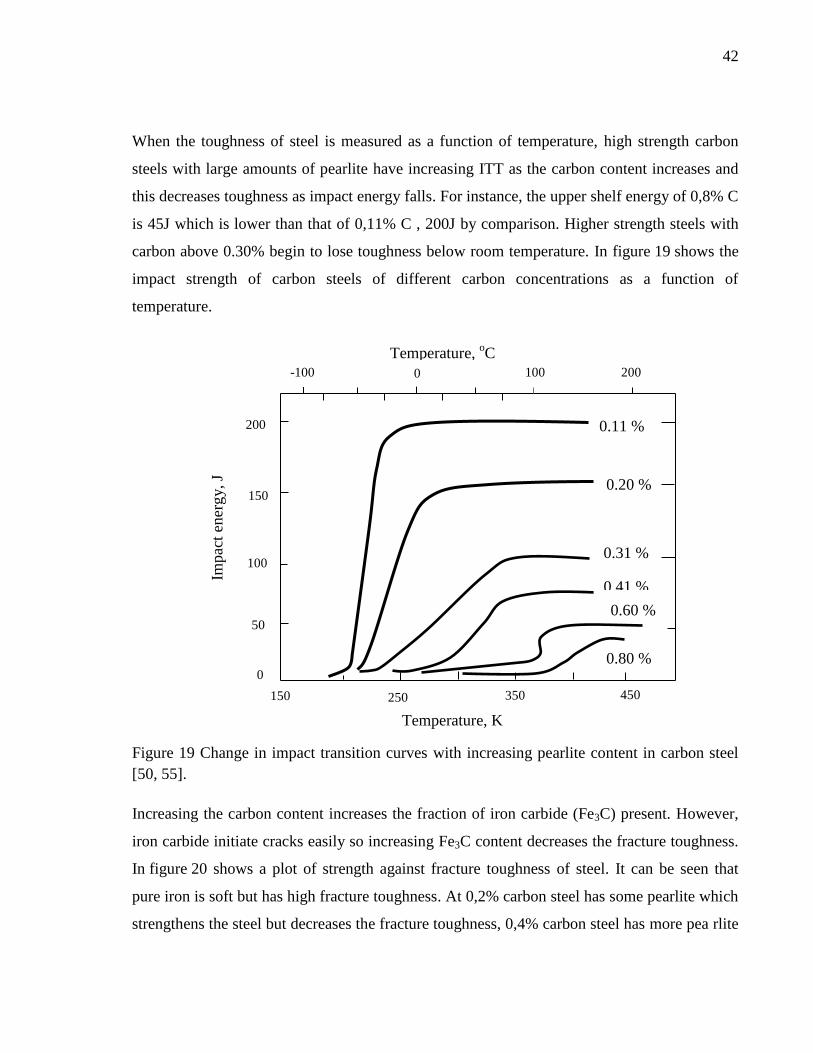
When the toughness of steel is measured as a function of temperature, high strength carbon
steels with large amounts of pearlite have increasing ITT as the carbon content increases and
this decreases toughness as impact energy falls. For instance, the upper shelf energy of 0,8% C
is 45J which is lower than that of 0,11% C , 200J by comparison. Higher strength steels with
carbon above 0.30% begin to lose toughness below room temperature. In figure 19 shows the
impact strength of carbon steels of different carbon concentrations as a function of
temperature.
Figure 19 Change in impact transition curves with increasing pearlite content in carbon steel
[50, 55].
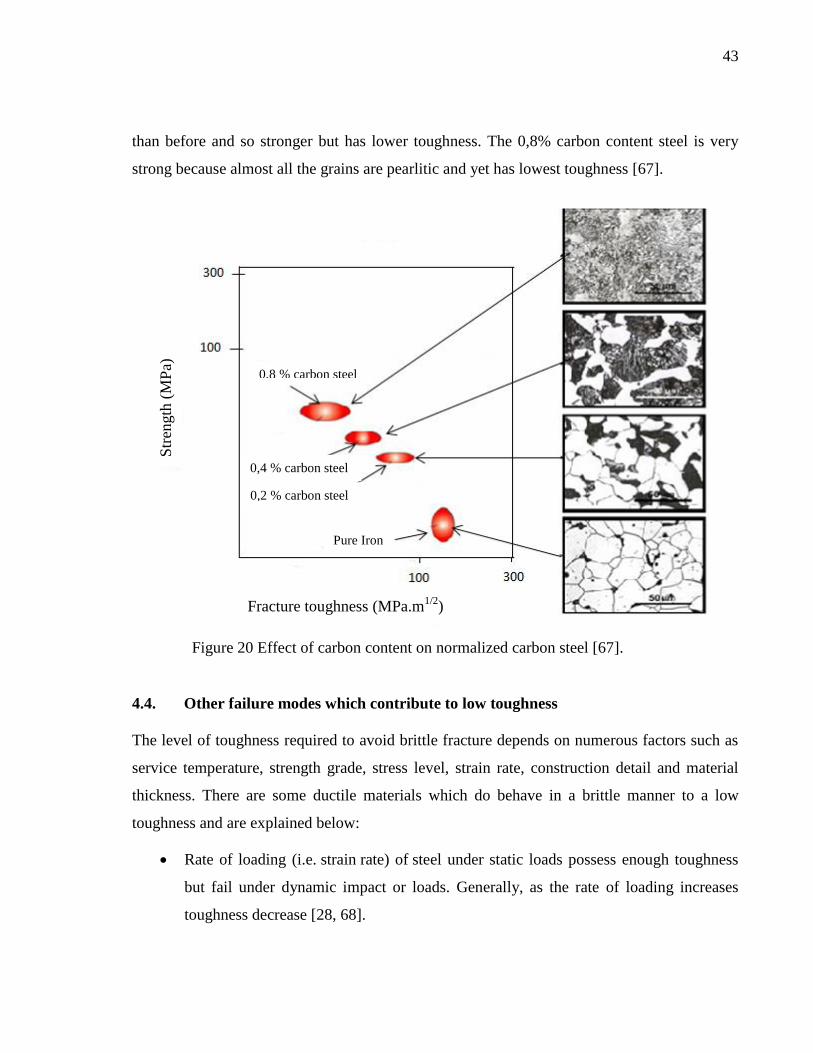
Increasing the carbon content increases the fraction of iron carbide (Fe3C) present. However,
iron carbide initiate cracks easily so increasing Fe3C content decreases the fracture toughness.
In figure 20 shows a plot of strength against fracture toughness of steel. It can be seen that
pure iron is soft but has high fracture toughness. At 0,2% carbon steel has some pearlite which
strengthens the steel but decreases the fracture toughness, 0,4% carbon steel has more pea rlite
0.11 %
C
0.20 %
C
0.31 %
C 0.41 %
0.80 %
C
0.60 %
C
-100 0 100 200
150
100
50
0
200
150 250 350 450
Temperature, K
Temperature, oC
Impac
t en
erg
y, J
43
than before and so stronger but has lower toughness. The 0,8% carbon content steel is very
strong because almost all the grains are pearlitic and yet has lowest toughness [67].
Figure 20 Effect of carbon content on normalized carbon steel [67].
4.4. Other failure modes which contribute to low toughness
The level of toughness required to avoid brittle fracture depends on numerous factors such as
service temperature, strength grade, stress level, strain rate, construction detail and material
thickness. There are some ductile materials which do behave in a brittle manner to a low
toughness and are explained below:
Rate of loading (i.e. strain rate) of steel under static loads possess enough toughness
but fail under dynamic impact or loads. Generally, as the rate of loading increases
toughness decrease [28, 68].
Fracture toughness (MPa.m1/2
)
Str
ength
(M
Pa)
0,8 % carbon steel
0,4 % carbon steel
0,2 % carbon steel
Pure Iron
44
Temperature has a significant effect on the toughness of steel. Most materials at lower
temperatures are brittle, the ductility and toughness also decrease but are more ductile
at higher temperatures [28, 68].
The distribution of stress is critical. A material might display good toughness when
the applied stress is uniaxial, but when a multiaxial stress state is produced due to the
presence of a notch the material might not withstand the simultaneous elastic and
plastic deformation in the various directions [28, 68].
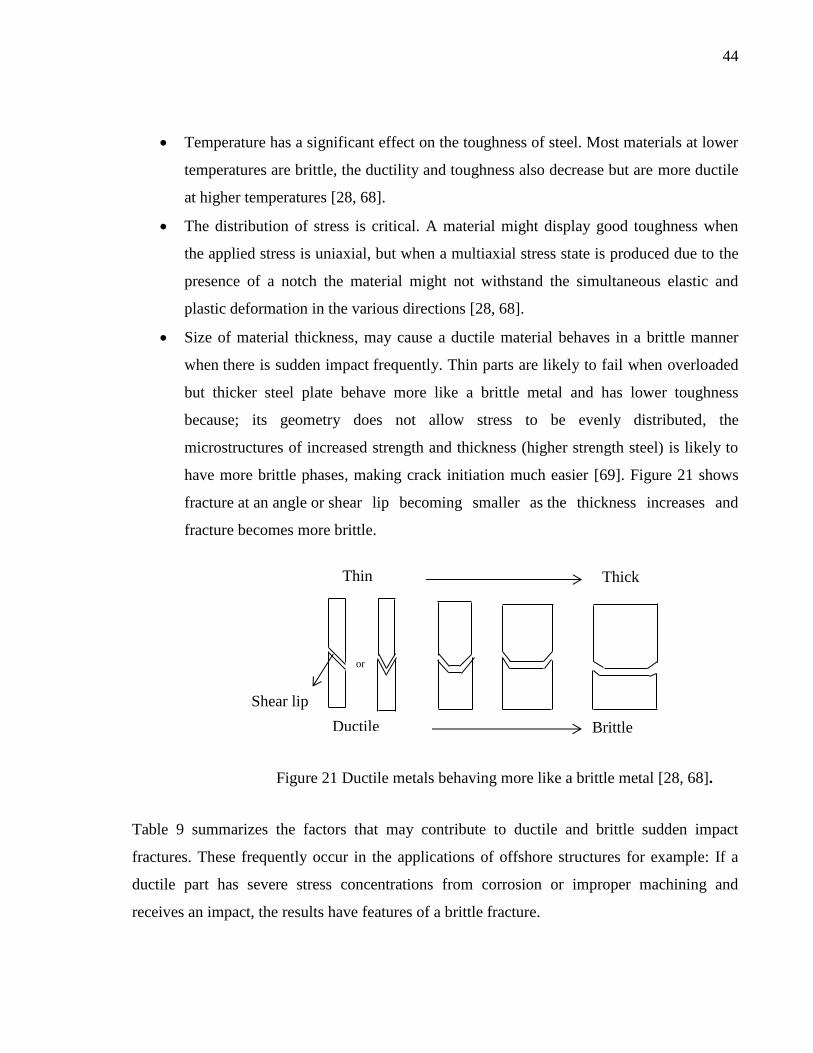
Size of material thickness, may cause a ductile material behaves in a brittle manner
when there is sudden impact frequently. Thin parts are likely to fail when overloaded
but thicker steel plate behave more like a brittle metal and has lower toughness
because; its geometry does not allow stress to be evenly distributed, the
microstructures of increased strength and thickness (higher strength steel) is likely to
have more brittle phases, making crack initiation much easier [69]. Figure 21 shows
fracture at an angle or shear lip becoming smaller as the thickness increases and
fracture becomes more brittle.
Figure 21 Ductile metals behaving more like a brittle metal [28, 68].
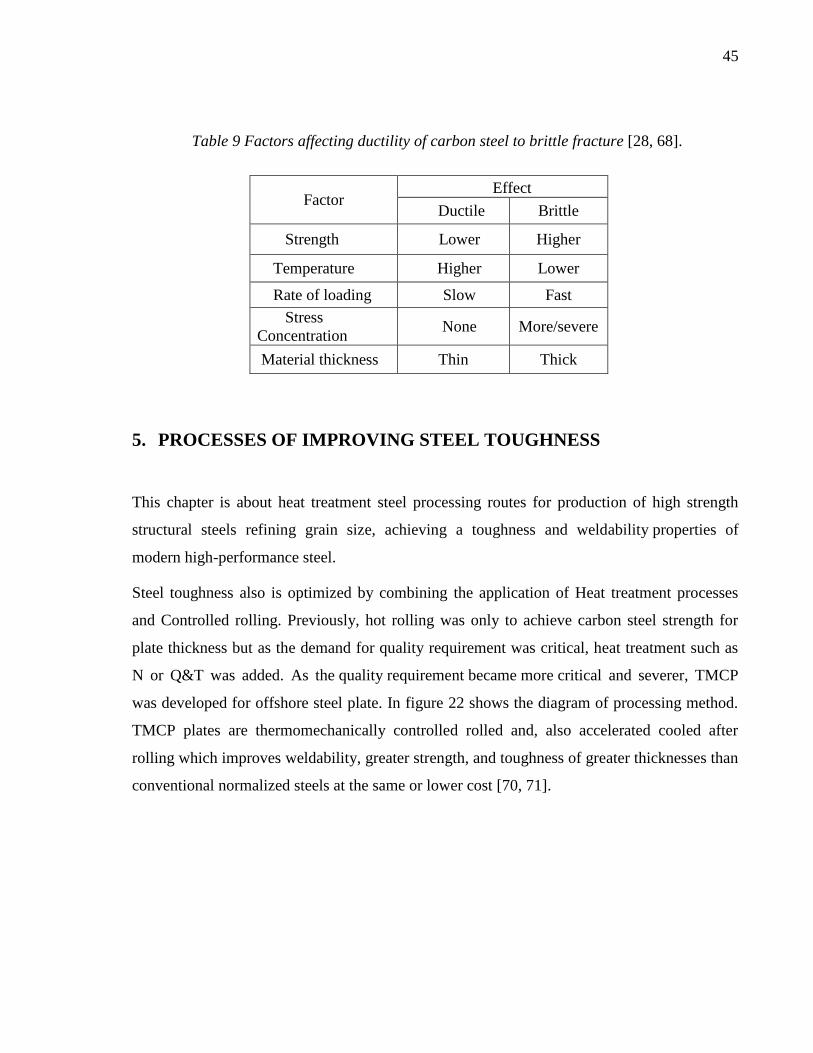
Table 9 summarizes the factors that may contribute to ductile and brittle sudden impact
fractures. These frequently occur in the applications of offshore structures for example: If a
ductile part has severe stress concentrations from corrosion or improper machining and
receives an impact, the results have features of a brittle fracture.
Thin
Ductile Brittle
Thick
Shear lip
or
45
Table 9 Factors affecting ductility of carbon steel to brittle fracture [28, 68].
5. PROCESSES OF IMPROVING STEEL TOUGHNESS
This chapter is about heat treatment steel processing routes for production of high strength
structural steels refining grain size, achieving a toughness and weldability properties of
modern high-performance steel.
Steel toughness also is optimized by combining the application of Heat treatment processes
and Controlled rolling. Previously, hot rolling was only to achieve carbon steel strength for
plate thickness but as the demand for quality requirement was critical, heat treatment such as
N or Q&T was added. As the quality requirement became more critical and severer, TMCP
was developed for offshore steel plate. In figure 22 shows the diagram of processing method.
TMCP plates are thermomechanically controlled rolled and, also accelerated cooled after
rolling which improves weldability, greater strength, and toughness of greater thicknesses than
conventional normalized steels at the same or lower cost [70, 71].
Factor Effect
Ductile Brittle
Strength Lower Higher
Temperature Higher Lower
Rate of loading Slow Fast
Stress
Concentration None More/severe
Material thickness Thin Thick
46
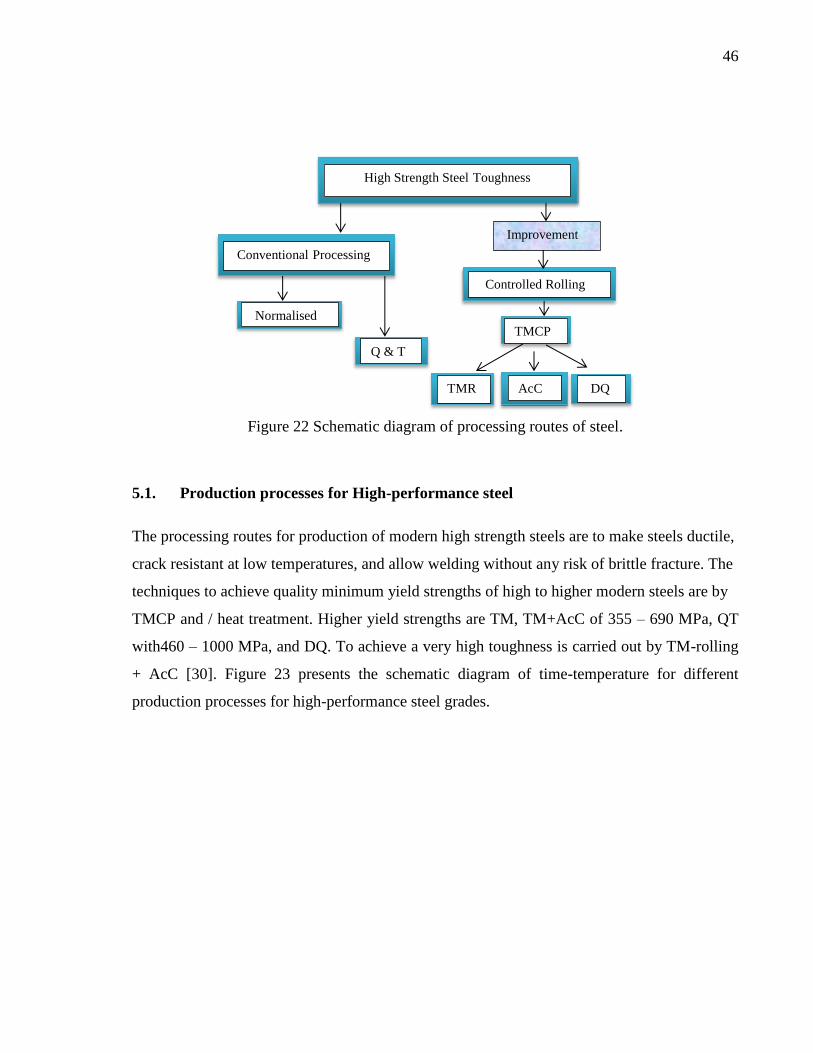
Figure 22 Schematic diagram of processing routes of steel.
5.1. Production processes for High-performance steel
The processing routes for production of modern high strength steels are to make steels ductile,
crack resistant at low temperatures, and allow welding without any risk of brittle fracture. The
techniques to achieve quality minimum yield strengths of high to higher modern steels are by
TMCP and / heat treatment. Higher yield strengths are TM, TM+AcC of 355 – 690 MPa, QT
with460 – 1000 MPa, and DQ. To achieve a very high toughness is carried out by TM-rolling
+ AcC [30]. Figure 23 presents the schematic diagram of time-temperature for different
production processes for high-performance steel grades.
High Strength Steel Toughness
Normalised
TMCP
AcC
Q & T
Conventional Processing
Controlled Rolling
Improvement
TMR DQ
47
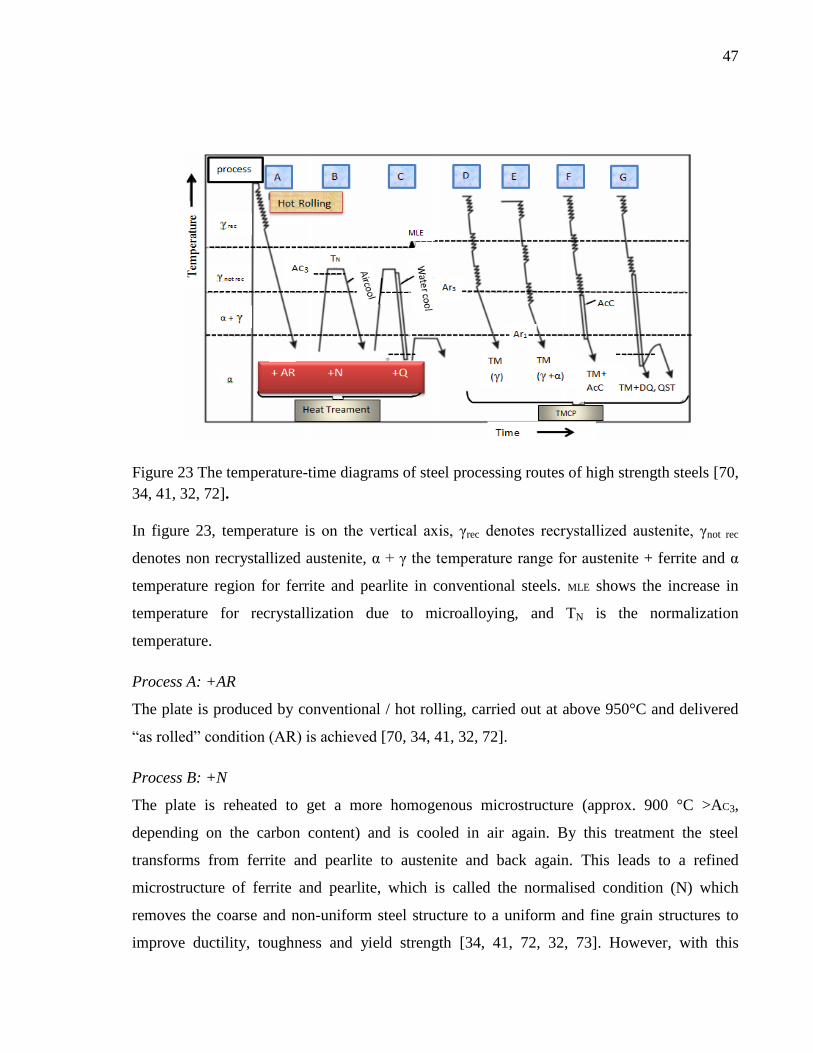
Figure 23 The temperature-time diagrams of steel processing routes of high strength steels [70,
34, 41, 32, 72].
In figure 23, temperature is on the vertical axis, γrec denotes recrystallized austenite, γnot rec
denotes non recrystallized austenite, α + γ the temperature range for austenite + ferrite and α
temperature region for ferrite and pearlite in conventional steels. MLE shows the increase in
temperature for recrystallization due to microalloying, and TN is the normalization
temperature.
Process A: +AR
The plate is produced by conventional / hot rolling, carried out at above 950°C and delivered
“as rolled” condition (AR) is achieved [70, 34, 41, 32, 72].
Process B: +N
The plate is reheated to get a more homogenous microstructure (approx. 900 °C >AC3,
depending on the carbon content) and is cooled in air again. By this treatment the steel
transforms from ferrite and pearlite to austenite and back again. This leads to a refined
microstructure of ferrite and pearlite, which is called the normalised condition (N) which
removes the coarse and non-uniform steel structure to a uniform and fine grain structures to
improve ductility, toughness and yield strength [34, 41, 72, 32, 73]. However, with this
48
process a higher strength of steel plates is mostly related to higher alloying contents which
have negative influence on weldability [32, 72].
Process C: +Q&T
For higher strength – no real thickness restriction. In Q&T process (A+C in Fig 23) the plate is
reheated above the transformation temperature (> Ac3) after hot rolling and cooling, so that
carbon can dissolve in austenite, but then cooling is not performed on cool air, but in water
(quenching) that cools fast enough, so that there is no diffusion process time for the formation
of ferrite and pearlite. Carbon then stays dissolved and at room temperature the microstructure
mainly consists of martensite, a distorted structure that has a high strength but a low
toughness. The martensite structure of steel is not extremely hard but brittle and its excess
hardness is reduced by tempering process which is by reheating the metal to lower critical
temperature than was used for hardening and cooled in air [74]. Toughness is increased since
the hardness of carbon steel decreases continuously as tempering temperatures increases [34,
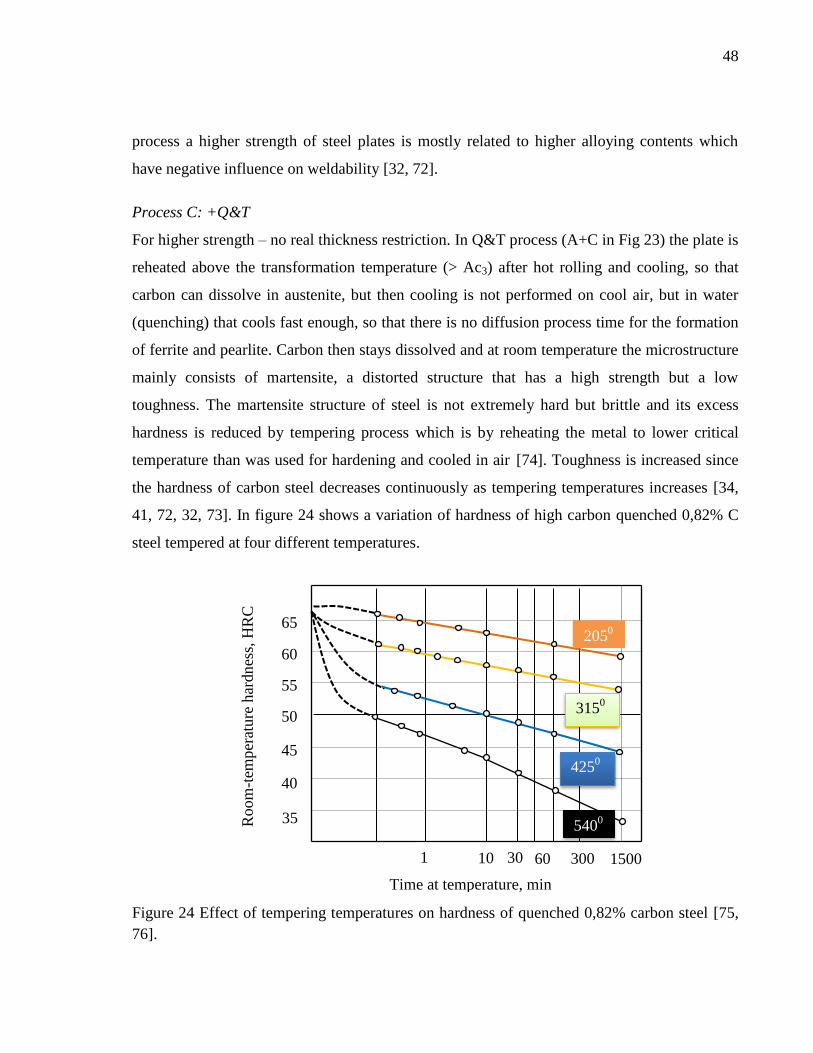
41, 72, 32, 73]. In figure 24 shows a variation of hardness of high carbon quenched 0,82% C
steel tempered at four different temperatures.
Figure 24 Effect of tempering temperatures on hardness of quenched 0,82% carbon steel [75,
76].
Room
-tem
per
ature
har
dn
ess,
HR
C
65
55
50
45
40
35
60
2050
3150
C
4250
C
5400
Time at temperature, min
1 30 1500 10 60 300
49
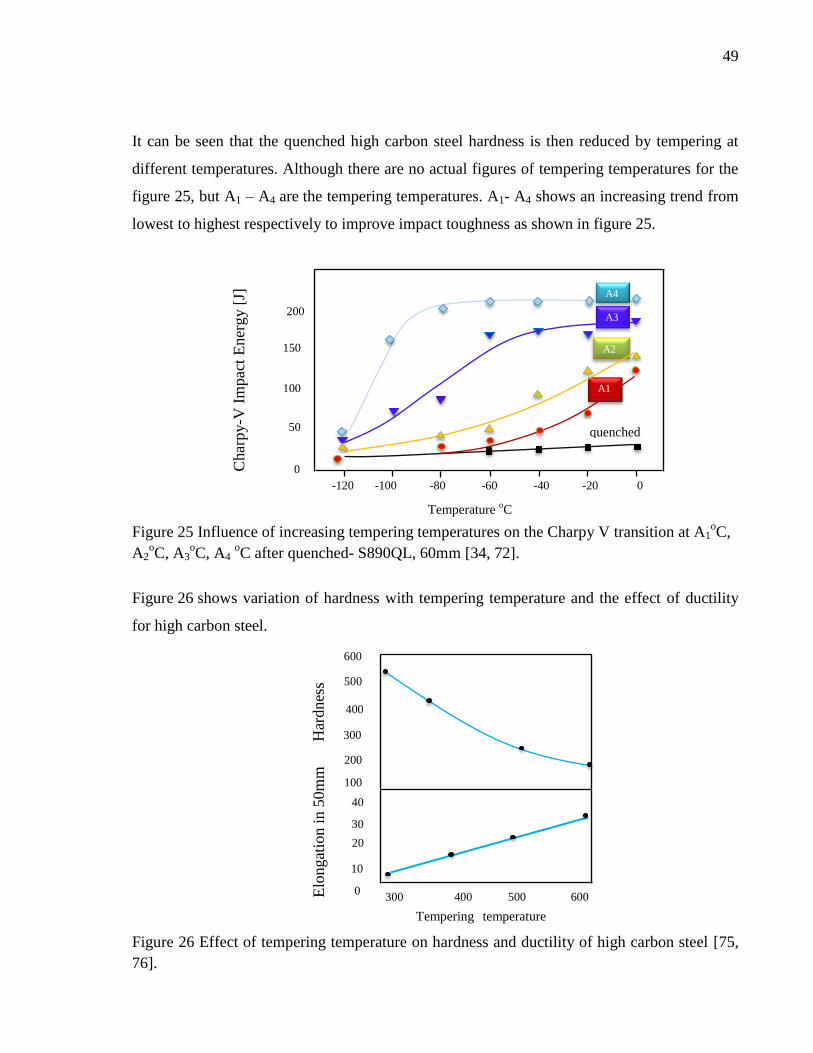
It can be seen that the quenched high carbon steel hardness is then reduced by tempering at
different temperatures. Although there are no actual figures of tempering temperatures for the
figure 25, but A1 – A4 are the tempering temperatures. A1- A4 shows an increasing trend from
lowest to highest respectively to improve impact toughness as shown in figure 25.
Figure 25 Influence of increasing tempering temperatures on the Charpy V transition at A1oC,
A2oC, A3
oC, A4
oC after quenched- S890QL, 60mm [34, 72].
Figure 26 shows variation of hardness with tempering temperature and the effect of ductility
for high carbon steel.
Figure 26 Effect of tempering temperature on hardness and ductility of high carbon steel [75,
76].
600
500
300
200
100
40
30
20
10
0
400
300 400 500 600
Tempering temperature 0C
Elo
ngat
ion i
n 5
0m
m
Har
dnes
s
150
A4
A3
A2
A1
200
100
50
0
quenched
Temperature oC
-120 -100 -80 -60 -40 -20 0
Char
py-V
Im
pac
t E
ner
gy [
J]
50
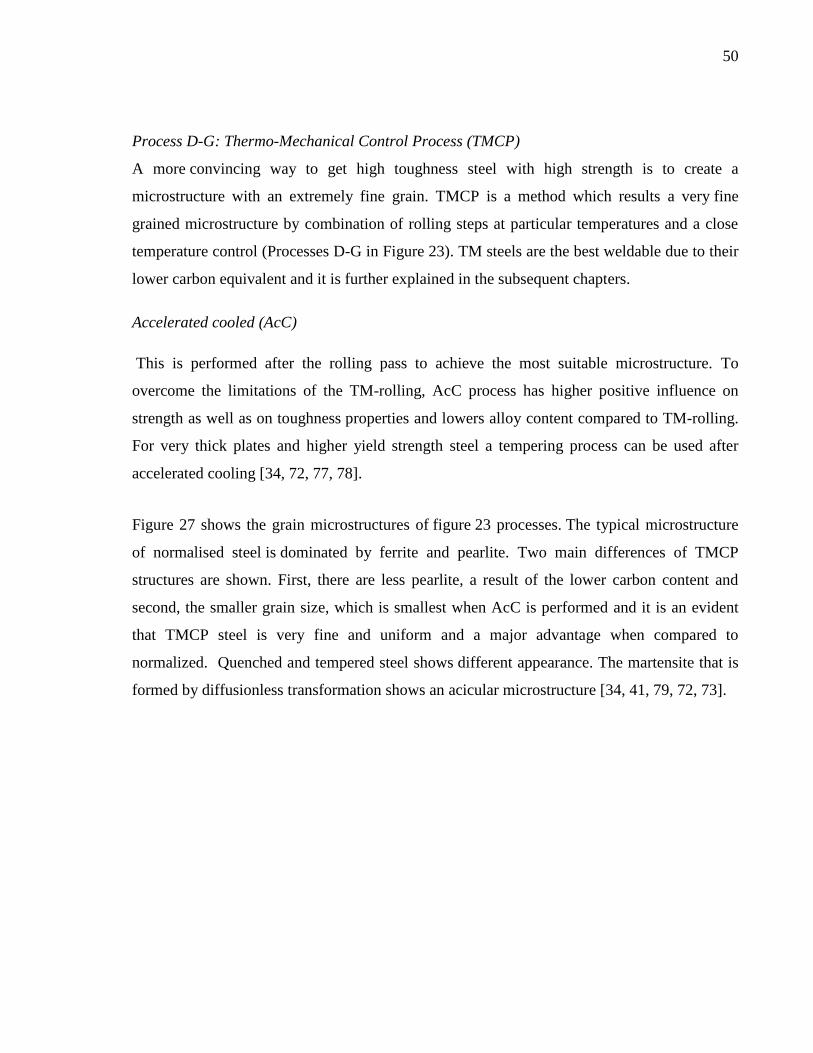
Process D-G: Thermo-Mechanical Control Process (TMCP)
A more convincing way to get high toughness steel with high strength is to create a
microstructure with an extremely fine grain. TMCP is a method which results a very fine
grained microstructure by combination of rolling steps at particular temperatures and a close
temperature control (Processes D-G in Figure 23). TM steels are the best weldable due to their
lower carbon equivalent and it is further explained in the subsequent chapters.
Accelerated cooled (AcC)
This is performed after the rolling pass to achieve the most suitable microstructure. To
overcome the limitations of the TM-rolling, AcC process has higher positive influence on
strength as well as on toughness properties and lowers alloy content compared to TM-rolling.
For very thick plates and higher yield strength steel a tempering process can be used after
accelerated cooling [34, 72, 77, 78].
Figure 27 shows the grain microstructures of figure 23 processes. The typical microstructure
of normalised steel is dominated by ferrite and pearlite. Two main differences of TMCP
structures are shown. First, there are less pearlite, a result of the lower carbon content and
second, the smaller grain size, which is smallest when AcC is performed and it is an evident
that TMCP steel is very fine and uniform and a major advantage when compared to
normalized. Quenched and tempered steel shows different appearance. The martensite that is
formed by diffusionless transformation shows an acicular microstructure [34, 41, 79, 72, 73].
51
Figure 27 Grain microstructure of QT and TMCP compared to normalised N [34, 41, 79, 72,
73].
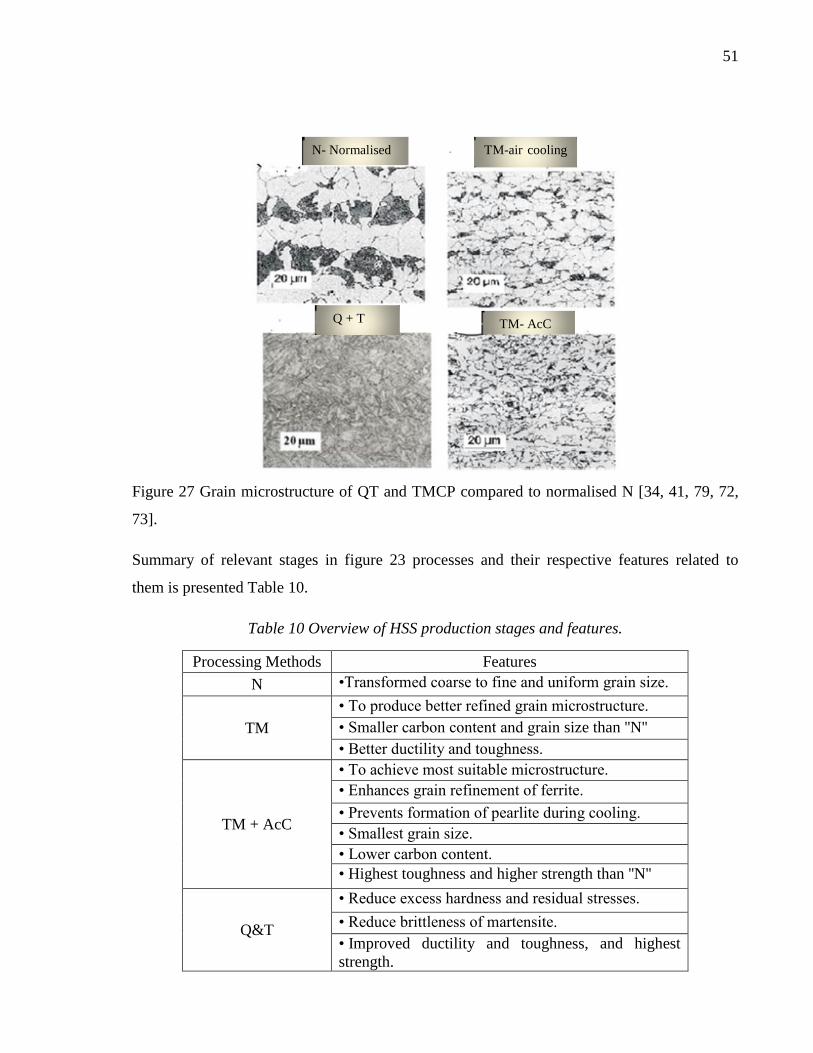
Summary of relevant stages in figure 23 processes and their respective features related to
them is presented Table 10.
Table 10 Overview of HSS production stages and features.
Processing Methods Features
N •Transformed coarse to fine and uniform grain size.
TM
• To produce better refined grain microstructure.
• Smaller carbon content and grain size than ''N''
• Better ductility and toughness.
TM + AcC
• To achieve most suitable microstructure.
• Enhances grain refinement of ferrite.
• Prevents formation of pearlite during cooling.
• Smallest grain size.
• Lower carbon content.
• Highest toughness and higher strength than ''N''
Q&T
• Reduce excess hardness and residual stresses.
• Reduce brittleness of martensite.
• Improved ductility and toughness, and highest
strength.
TM-air cooling
Normalised
N- Normalised
Q + T TM- AcC
52
5.2. Comparison of TMCP to Conventional steel
Thermomechanical steel grades exhibit high toughness and excellent ductility. This means a
higher material strength for impact and seismic loading [33].
Thermomechanical Controlled Processed (TMCP) is a thermomechanical treatment in which
the final deformation is carried out in a temperature range which cannot be achieved
significantly by heat treatment alone [80]. The final fine grain ferrite-pearlite microstructure
obtained by TMCP with AcC processing properties allows reducing effectively the carbon and
alloying content of the TM-steel, decrease of CEV, weldability improved, compared to
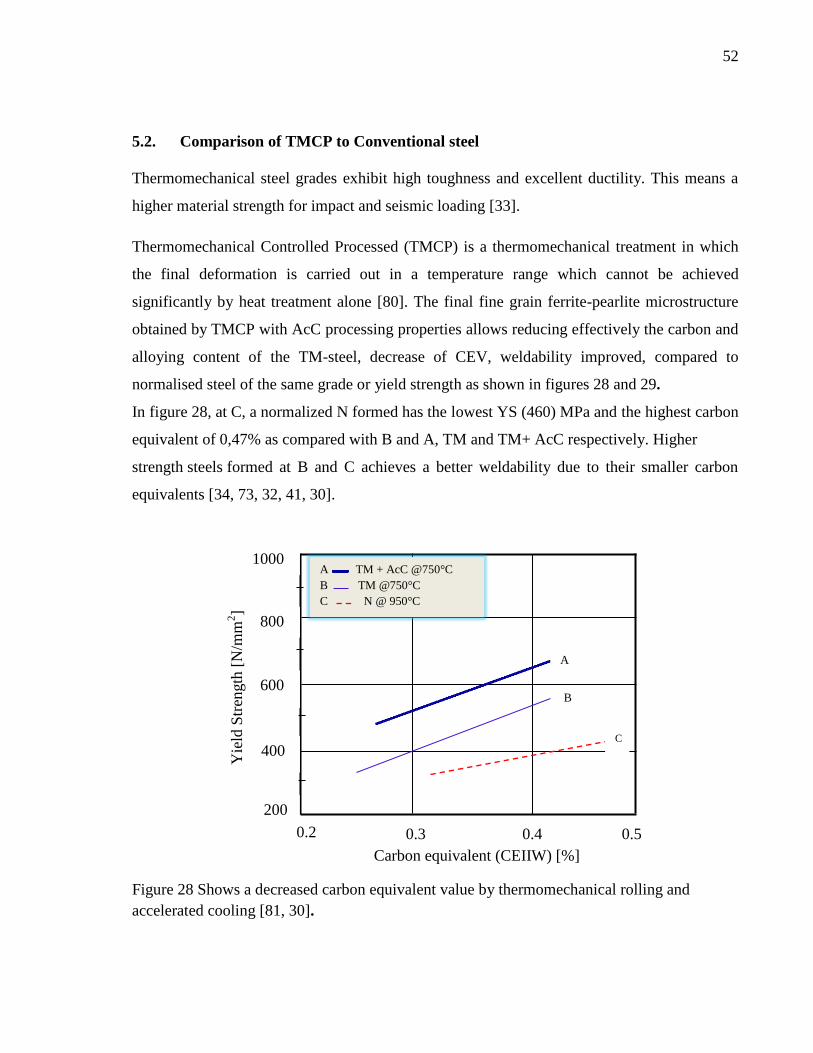
normalised steel of the same grade or yield strength as shown in figures 28 and 29.
In figure 28, at C, a normalized N formed has the lowest YS (460) MPa and the highest carbon
equivalent of 0,47% as compared with B and A, TM and TM+ AcC respectively. Higher
strength steels formed at B and C achieves a better weldability due to their smaller carbon
equivalents [34, 73, 32, 41, 30].
Figure 28 Shows a decreased carbon equivalent value by thermomechanical rolling and
accelerated cooling [81, 30].
0.2 0.3 0.4 0.5
1000
800
600
400
200
A
B
C
A TM + AcC @750°C
B TM @750°C
C N @ 950°C
Carbon equivalent (CEIIW) [%]
Yie
ld S
tren
gth
[N
/mm
2]
53
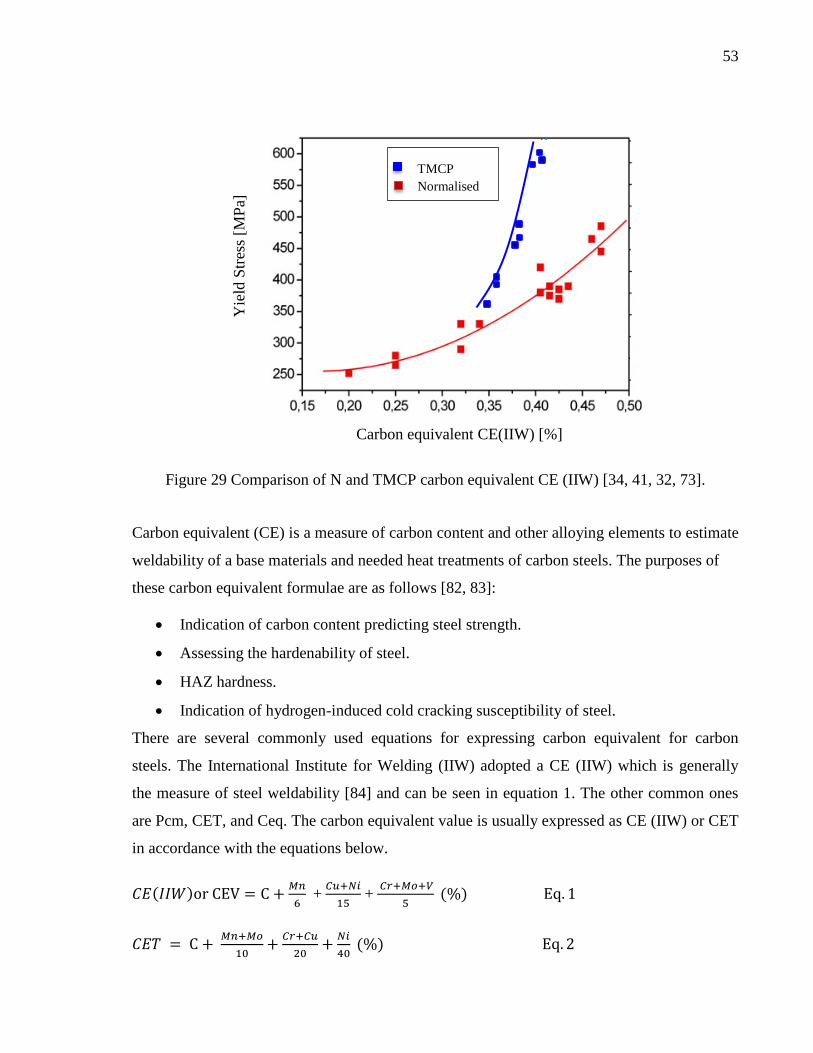
Figure 29 Comparison of N and TMCP carbon equivalent CE (IIW) [34, 41, 32, 73].
Carbon equivalent (CE) is a measure of carbon content and other alloying elements to estimate
weldability of a base materials and needed heat treatments of carbon steels. The purposes of
these carbon equivalent formulae are as follows [82, 83]:
Indication of carbon content predicting steel strength.
Assessing the hardenability of steel.
HAZ hardness.
Indication of hydrogen-induced cold cracking susceptibility of steel.
There are several commonly used equations for expressing carbon equivalent for carbon
steels. The International Institute for Welding (IIW) adopted a CE (IIW) which is generally
the measure of steel weldability [84] and can be seen in equation 1. The other common ones
are Pcm, CET, and Ceq. The carbon equivalent value is usually expressed as CE (IIW) or CET
in accordance with the equations below.
( )
+
+
( )
( )
Carbon equivalent CE(IIW) [%]
Yie
ld S
tres
s [M
Pa]
TMCP
Normalised
54
( )
In Japan, the Ito-Bessyo composition characterizing parameter (Pcm) is also used but to assess
the weldability of low carbon steels as expressed in equation 4.
= C+
The carbon equivalent of weldability is determined between typical normalized S355J2 + N
and one of the thermomechanically rolled S355ML as shown Table 11.
Table 11 Carbon equivalent values for a typical S355J2+N and S355ML.
Steel grade CET CE (IIW)
S355J2+N 0.34 0.43
S355ML 0.25 0.36
The higher the carbon equivalent value, the faster the cooling rate, the higher the tendency for
hard, brittle phases to form. In general the result of carbon equivalent value (CEV)
is considered as follows:
If CEV is up to 0.35, then is Excellent.
If CEV value is below or equal 0,40: good weldability, no need for PWHT.
If CEV exceeds 0,40 but below 0,50: Fair weldability, might need heat treatment with
thick materials because it is susceptible to hydrogen cracking.
Above 0,50: Poor, usually pre heat treatment is needed.
The carbon equivalent allows the determination of the necessary preheating temperature Tp
for welding, taking into account the avoidance of hydrogen-induced cold
cracking. According to EN 1011-2 Tp is preheating temperature which involves heating the
base metal either entirely or just around the joint to a specific temperature and is given by:
55
Tp = 700 CET + 160tanh (t/35) + 62 HD0.35
+ (53 CET – 32) Q +330 Eq. 5
Where:
Tp = Preheating temperature; HD = Hydrogen (ml/100g-ISO 3690); Q = Heat input (kJ/mm);
t = Plate thickness (mm).
It is understood that TMCP does not only have smaller carbon equivalent than normalised of
the same yield strength but it also has excellent toughness behavior. Figure 30 illustrates the
transition curves of the Charpy-V absorbed impact energy against test temperature for TM-
steel S355ML and conventional steel S355J2G3. At room temperature, the toughness value of
TM-steel exceeds 300J which is much higher and has very low transition ductile to brittle
fracture behavior when compared to S355J2G3 [33, 72].
Figure 30 Comparison of the Charpy-V transition curves for TM-steel S355ML and
normalized S355J2G3 steel grade (plate, 60 mm thickness) [33, 72].
-120 -100 -80 -60 -40 -20 0 20
350
300
250
200
150
100
50
S355ML
S355J2G3
0
Char
py-V
im
pac
t en
erg
y (
J)
Temperature [oC]
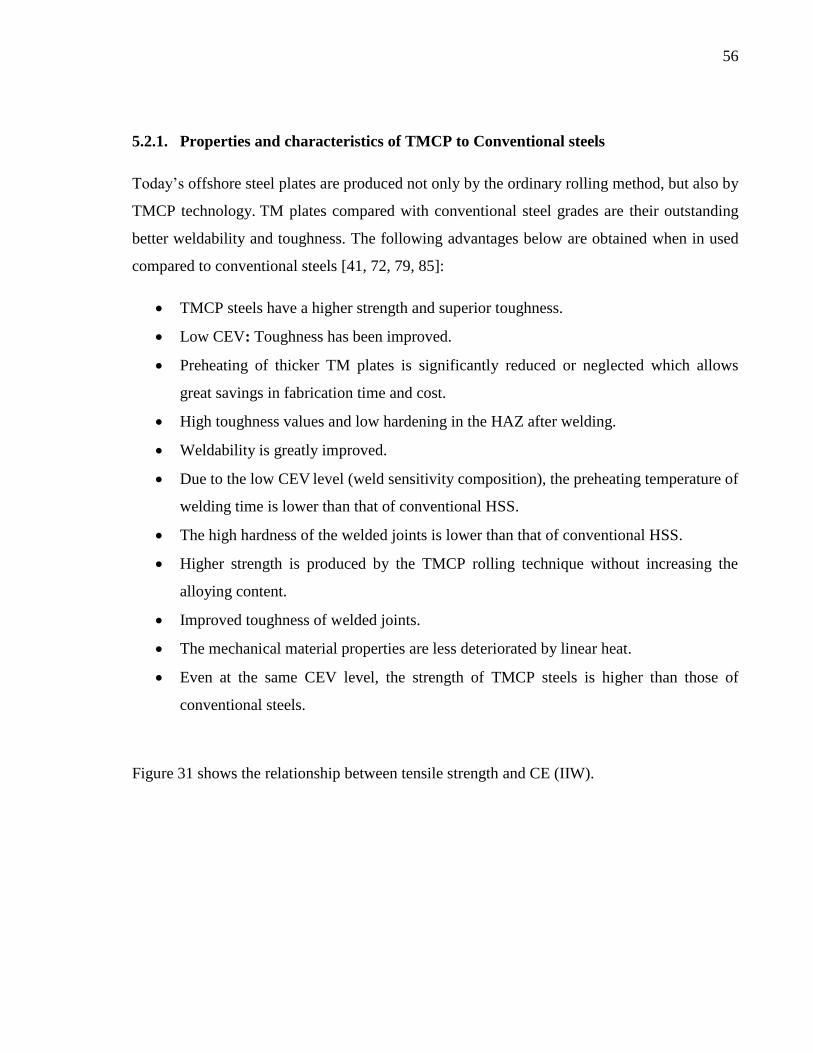
56
5.2.1. Properties and characteristics of TMCP to Conventional steels
Today’s offshore steel plates are produced not only by the ordinary rolling method, but also by
TMCP technology. TM plates compared with conventional steel grades are their outstanding
better weldability and toughness. The following advantages below are obtained when in used
compared to conventional steels [41, 72, 79, 85]:
TMCP steels have a higher strength and superior toughness.
Low CEV: Toughness has been improved.
Preheating of thicker TM plates is significantly reduced or neglected which allows
great savings in fabrication time and cost.
High toughness values and low hardening in the HAZ after welding.
Weldability is greatly improved.
Due to the low CEV level (weld sensitivity composition), the preheating temperature of
welding time is lower than that of conventional HSS.
The high hardness of the welded joints is lower than that of conventional HSS.
Higher strength is produced by the TMCP rolling technique without increasing the
alloying content.
Improved toughness of welded joints.
The mechanical material properties are less deteriorated by linear heat.
Even at the same CEV level, the strength of TMCP steels is higher than those of
conventional steels.
Figure 31 shows the relationship between tensile strength and CE (IIW).
57
Figure 31 Relationship between the conventional manufacturing process and the TMCP
Process in terms of CE (IIW) [79].
5.3. Properties of modern high-performance steel
TMCP plates show a very ´´slender`` chemical composition resulting in very good weldability
than conventional steel as shown in Table 12. On the other hand, quenched and tempered steel
as S690QL has higher alloying content resulting in carbon equivalent demand for welding
such as preheating, limited heat input to avoid too long cooling times etc [32].
700
600
500
400
0.20 0.30 0.40 0.50
B
A Section is TMCP.
B Section is Controlled-rolling
C Section is As-rolled.
Ten
sile
Str
ength
(M
Pa)
Carbon equivalent CE(IIW) (%)
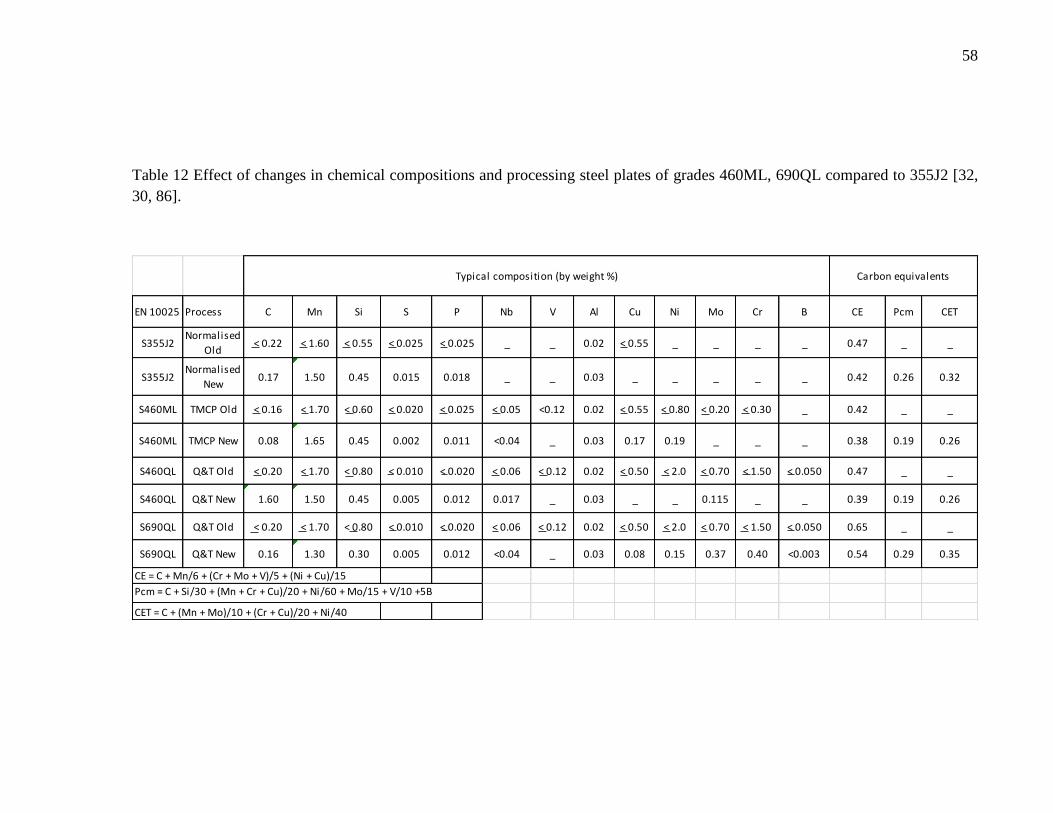
58
Table 12 Effect of changes in chemical compositions and processing steel plates of grades 460ML, 690QL compared to 355J2 [32,
30, 86].
EN 10025 Process C Mn Si S P Nb V Al Cu Ni Mo Cr B CE Pcm CET
S355J2Normalised
Old< 0.22 < 1.60 < 0.55 < 0.025 < 0.025 _ _ 0.02 < 0.55 _ _ _ _ 0.47 _ _
S355J2Normalised
New0.17 1.50 0.45 0.015 0.018 _ _ 0.03 _ _ _ _ _ 0.42 0.26 0.32
S460ML TMCP Old < 0.16 < 1.70 < 0.60 < 0.020 < 0.025 < 0.05 <0.12 0.02 < 0.55 < 0.80 < 0.20 < 0.30 _ 0.42 _ _
S460ML TMCP New 0.08 1.65 0.45 0.002 0.011 <0.04 _ 0.03 0.17 0.19 _ _ _ 0.38 0.19 0.26
S460QL Q&T Old < 0.20 < 1.70 < 0.80 < 0.010 < 0.020 < 0.06 < 0.12 0.02 < 0.50 < 2.0 < 0.70 < 1.50 < 0.050 0.47 _ _
S460QL Q&T New 1.60 1.50 0.45 0.005 0.012 0.017 _ 0.03 _ _ 0.115 _ _ 0.39 0.19 0.26
S690QL Q&T Old < 0.20 < 1.70 < 0.80 < 0.010 < 0.020 < 0.06 < 0.12 0.02 < 0.50 < 2.0 < 0.70 < 1.50 < 0.050 0.65 _ _
S690QL Q&T New 0.16 1.30 0.30 0.005 0.012 <0.04 _ 0.03 0.08 0.15 0.37 0.40 <0.003 0.54 0.29 0.35
CE = C + Mn/6 + (Cr + Mo + V)/5 + (Ni + Cu)/15
Pcm = C + Si/30 + (Mn + Cr + Cu)/20 + Ni/60 + Mo/15 + V/10 +5B
CET = C + (Mn + Mo)/10 + (Cr + Cu)/20 + Ni/40
Carbon equivalentsTypical composition (by weight %)
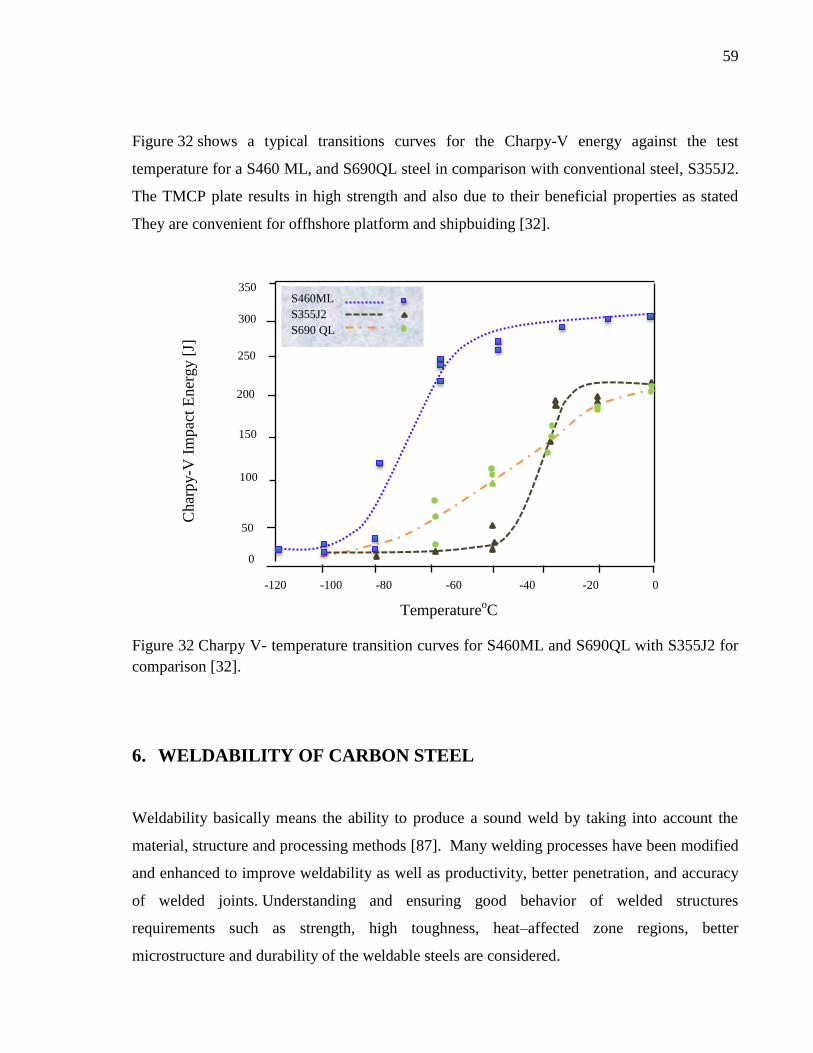
59
Figure 32 shows a typical transitions curves for the Charpy-V energy against the test
temperature for a S460 ML, and S690QL steel in comparison with conventional steel, S355J2.
The TMCP plate results in high strength and also due to their beneficial properties as stated
They are convenient for offhshore platform and shipbuiding [32].
Figure 32 Charpy V- temperature transition curves for S460ML and S690QL with S355J2 for
comparison [32].
6. WELDABILITY OF CARBON STEEL
Weldability basically means the ability to produce a sound weld by taking into account the
material, structure and processing methods [87]. Many welding processes have been modified
and enhanced to improve weldability as well as productivity, better penetration, and accuracy
of welded joints. Understanding and ensuring good behavior of welded structures
requirements such as strength, high toughness, heat–affected zone regions, better
microstructure and durability of the weldable steels are considered.
-120 -100 -80 -60 -40 -20 0
20
350
300
250
200
100
0
S460ML
S355J2
S690 QL
TemperatureoC
Char
py-V
Im
pac
t E
ner
gy [
J]
50
150
60
6.1. Effecting factors of steel weldability
The following are some of the most common factors that affect the weldability of steel
structures [87]:
Chemical composition and type of alloying elements
Material hardness (amount of carbon content)
Welding process
Heat input
Joint design
Thermal conductivity of the material
Environment
Microstructure (martensite)
Stress
Cracks (present of hydrogen and residual stresses)
Resistance of weld metal to hot crack formation.
Carbon steels are weldable if they have good strength properties and toughness in the service
life. Materials which have high tendency to form hard and brittle areas in the HAZ using
fusion welding with the susceptibility of forming defects such as hydrogen induced cold
cracks, is said to have poor weldability [86]. Residual stresses in the weld metal may cause
distortion and uneven load distribution which will eventually result in a crack. Ductile steel
(with more granular ferrite microstructure) is very resistant to internally induced crack
formation. Grain refinement can suppress stresses in the welded structure.
A good weld preparation and avoidance of defects such as lack of penetration or fusion can
lead to sound weld for all common structural steels. However other steels may need special
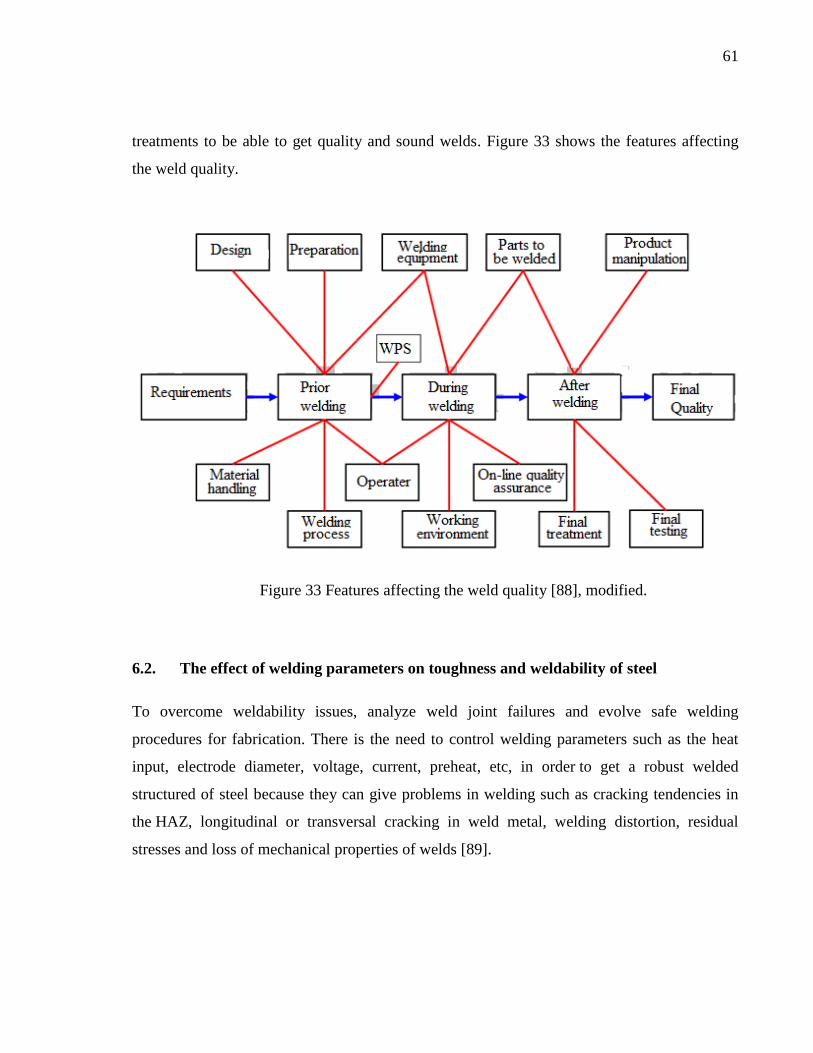
61
treatments to be able to get quality and sound welds. Figure 33 shows the features affecting
the weld quality.
Figure 33 Features affecting the weld quality [88], modified.
6.2. The effect of welding parameters on toughness and weldability of steel
To overcome weldability issues, analyze weld joint failures and evolve safe welding
procedures for fabrication. There is the need to control welding parameters such as the heat
input, electrode diameter, voltage, current, preheat, etc, in order to get a robust welded
structured of steel because they can give problems in welding such as cracking tendencies in
the HAZ, longitudinal or transversal cracking in weld metal, welding distortion, residual
stresses and loss of mechanical properties of welds [89].
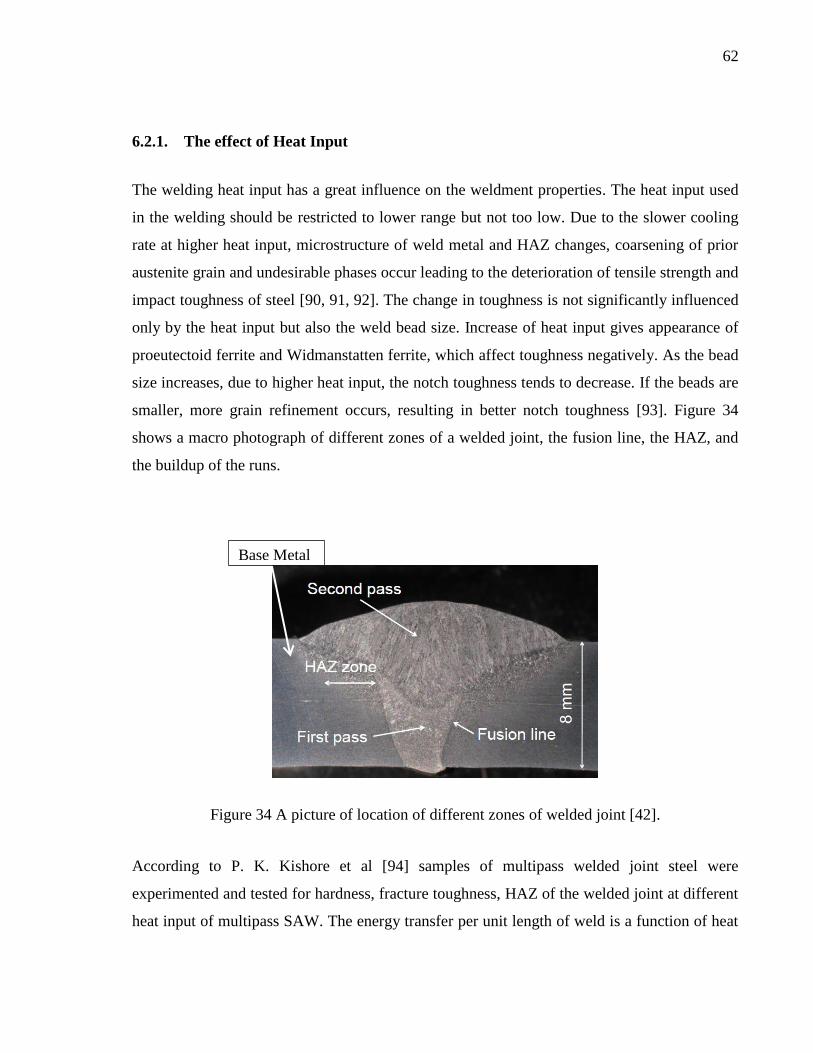
62
6.2.1. The effect of Heat Input
The welding heat input has a great influence on the weldment properties. The heat input used
in the welding should be restricted to lower range but not too low. Due to the slower cooling
rate at higher heat input, microstructure of weld metal and HAZ changes, coarsening of prior
austenite grain and undesirable phases occur leading to the deterioration of tensile strength and
impact toughness of steel [90, 91, 92]. The change in toughness is not significantly influenced
only by the heat input but also the weld bead size. Increase of heat input gives appearance of
proeutectoid ferrite and Widmanstatten ferrite, which affect toughness negatively. As the bead
size increases, due to higher heat input, the notch toughness tends to decrease. If the beads are
smaller, more grain refinement occurs, resulting in better notch toughness [93]. Figure 34
shows a macro photograph of different zones of a welded joint, the fusion line, the HAZ, and
the buildup of the runs.
Figure 34 A picture of location of different zones of welded joint [42].
According to P. K. Kishore et al [94] samples of multipass welded joint steel were
experimented and tested for hardness, fracture toughness, HAZ of the welded joint at different
heat input of multipass SAW. The energy transfer per unit length of weld is a function of heat
Base Metal
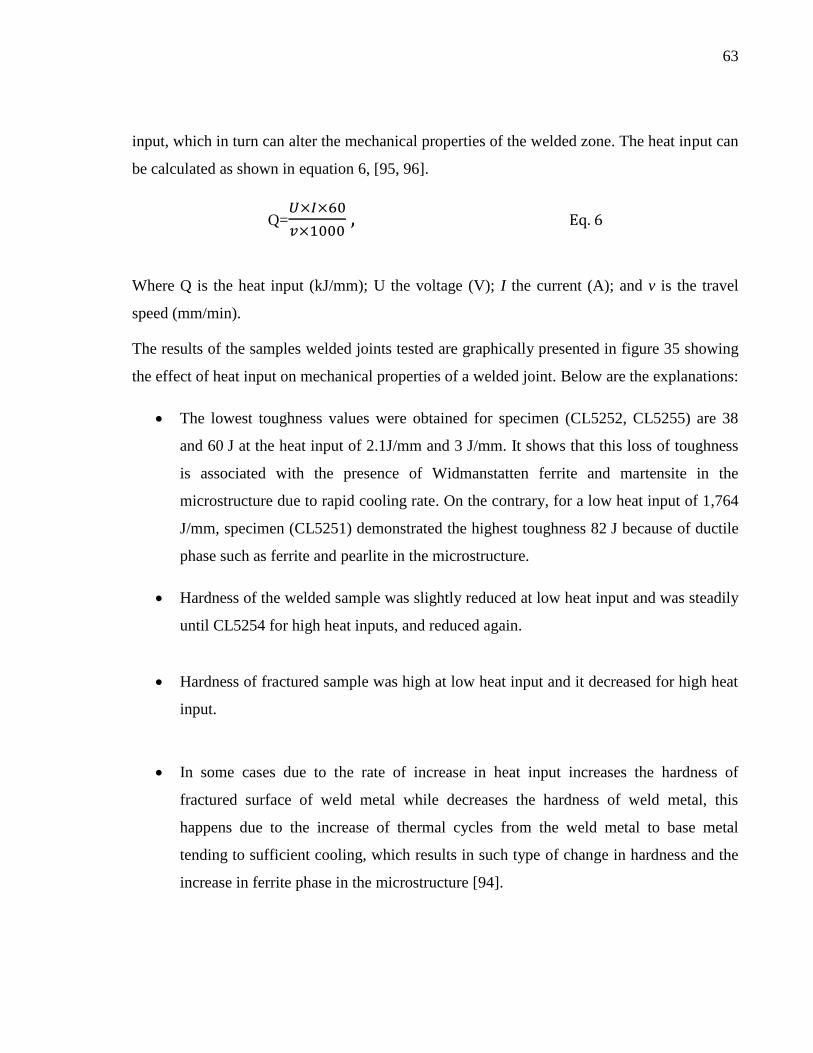
63
input, which in turn can alter the mechanical properties of the welded zone. The heat input can
be calculated as shown in equation 6, [95, 96].
Q=
Where Q is the heat input (kJ/mm); U the voltage (V); I the current (A); and v is the travel
speed (mm/min).
The results of the samples welded joints tested are graphically presented in figure 35 showing
the effect of heat input on mechanical properties of a welded joint. Below are the explanations:
The lowest toughness values were obtained for specimen (CL5252, CL5255) are 38
and 60 J at the heat input of 2.1J/mm and 3 J/mm. It shows that this loss of toughness
is associated with the presence of Widmanstatten ferrite and martensite in the
microstructure due to rapid cooling rate. On the contrary, for a low heat input of 1,764
J/mm, specimen (CL5251) demonstrated the highest toughness 82 J because of ductile
phase such as ferrite and pearlite in the microstructure.
Hardness of the welded sample was slightly reduced at low heat input and was steadily
until CL5254 for high heat inputs, and reduced again.
Hardness of fractured sample was high at low heat input and it decreased for high heat
input.
In some cases due to the rate of increase in heat input increases the hardness of
fractured surface of weld metal while decreases the hardness of weld metal, this
happens due to the increase of thermal cycles from the weld metal to base metal
tending to sufficient cooling, which results in such type of change in hardness and the
increase in ferrite phase in the microstructure [94].
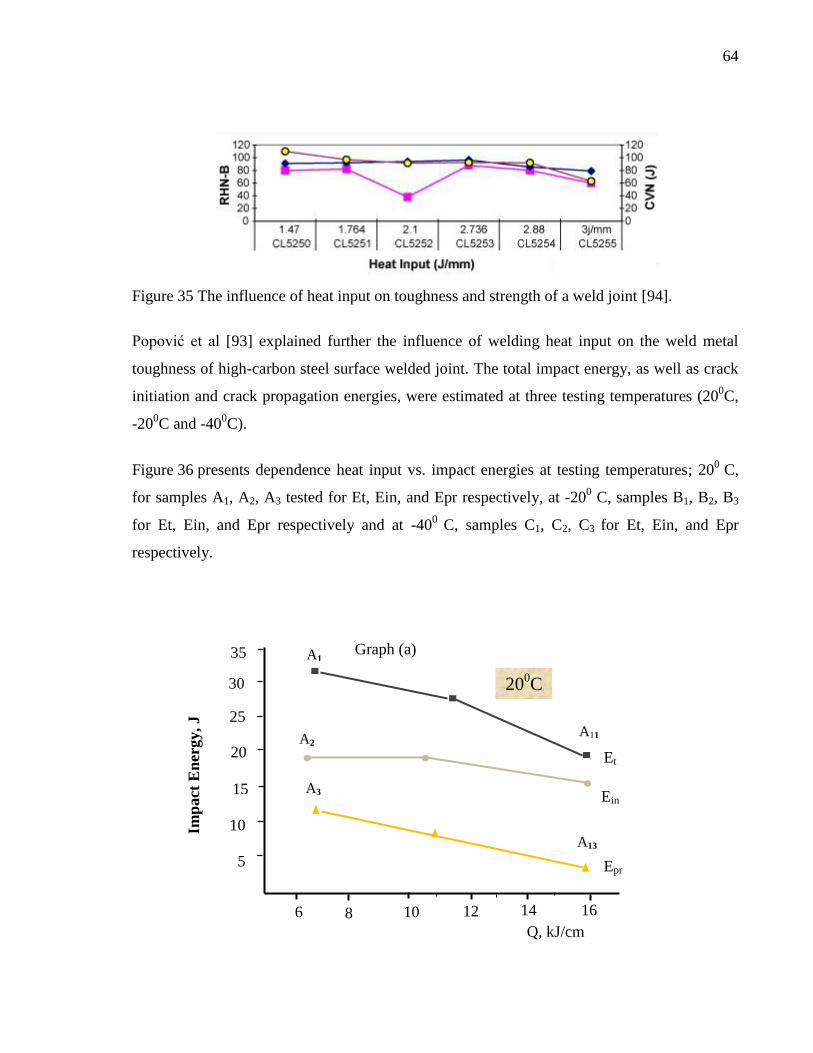
64
Figure 35 The influence of heat input on toughness and strength of a weld joint [94].
Popović et al [93] explained further the influence of welding heat input on the weld metal
toughness of high-carbon steel surface welded joint. The total impact energy, as well as crack
initiation and crack propagation energies, were estimated at three testing temperatures (200C,
-200C and -40
0C).
Figure 36 presents dependence heat input vs. impact energies at testing temperatures; 200
C,
for samples A1, A2, A3 tested for Et, Ein, and Epr respectively, at -200 C, samples B1, B2, B3
for Et, Ein, and Epr respectively and at -400
C, samples C1, C2, C3 for Et, Ein, and Epr
respectively.
6 8 10 12 14 16
30
25
20
15
10
5
Et
Ein
Epr
200C
Q, kJ/cm
Imp
act
En
ergy, J
A1
A3
A11
A13
35 Graph (a)
A2
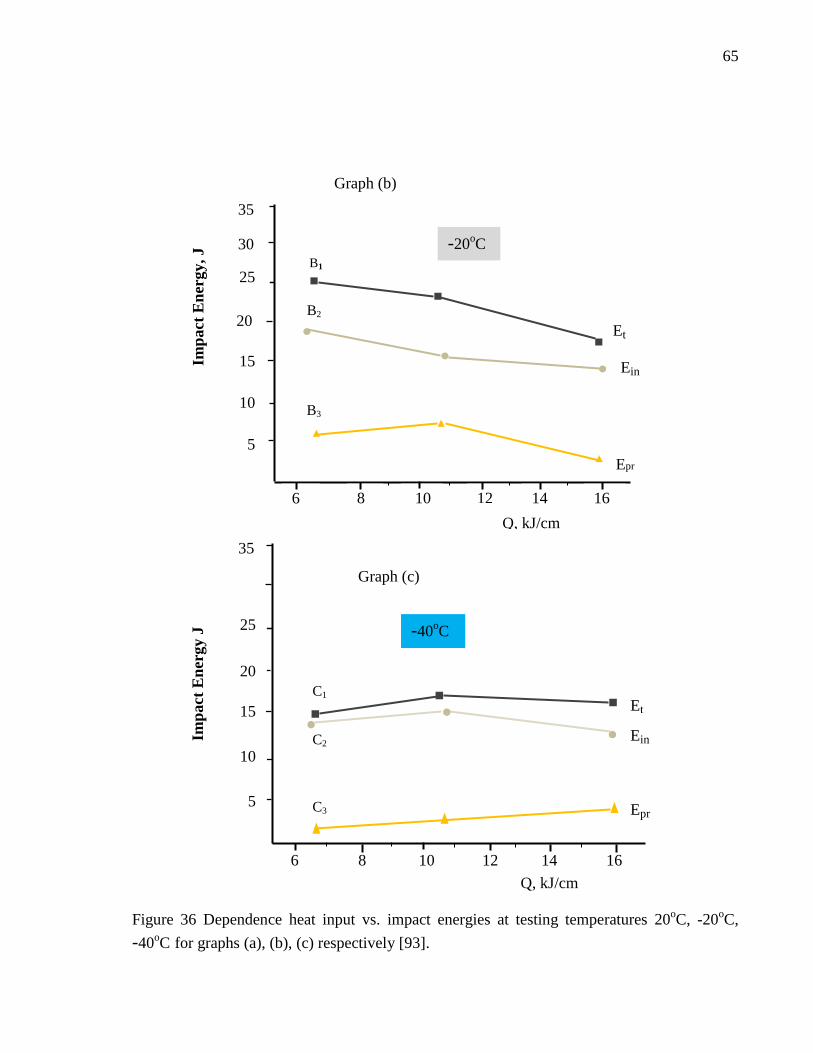
65
Figure 36 Dependence heat input vs. impact energies at testing temperatures 20oC, -20
oC,
-40oC for graphs (a), (b), (c) respectively [93].
6 8 10 12 14 16
35
30
25
20
15
10
5
0
Q, kJ/cm
Imp
act
En
ergy, J
Et
Ein
Epr
-20oC
B2
B3
B1
6 8 10 12 14 16
35
25
20
15
10
5
0
Imp
act
En
ergy J
Q, kJ/cm
Et
Ein
Epr
-40oC
C1
C2
C3
Graph (b)
Graph (c)
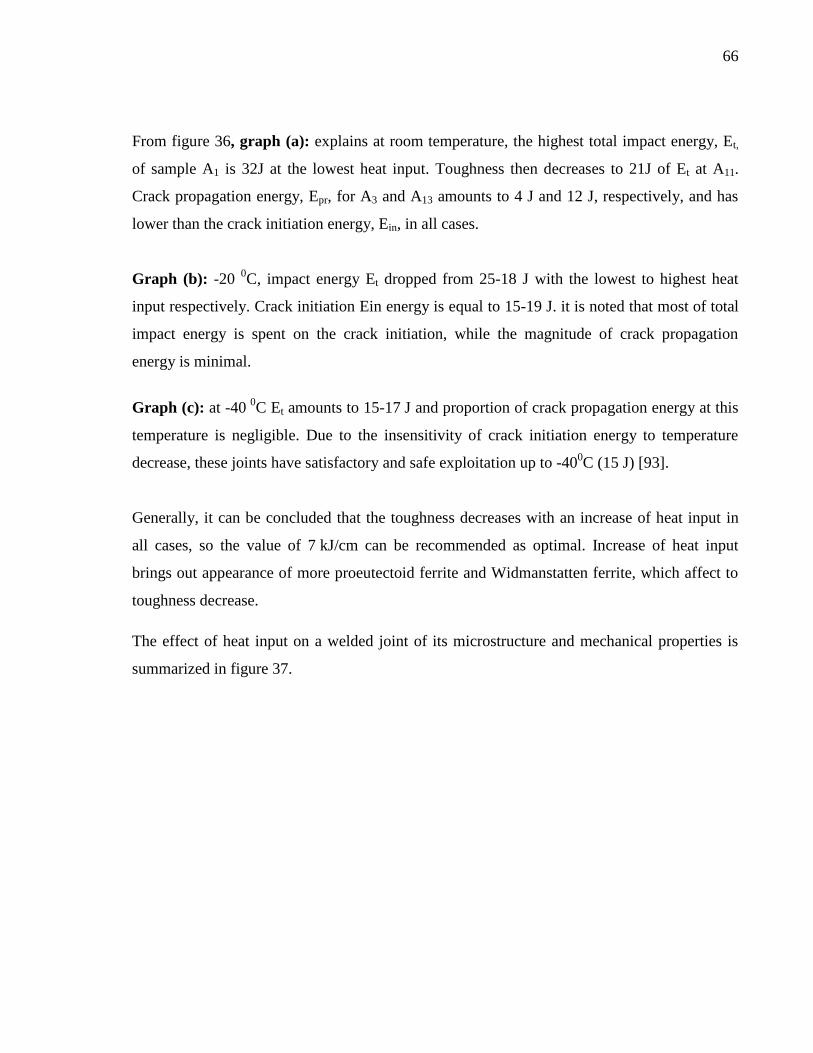
66
From figure 36, graph (a): explains at room temperature, the highest total impact energy, Et,
of sample A1 is 32J at the lowest heat input. Toughness then decreases to 21J of Et at A11.
Crack propagation energy, Epr, for A3 and A13 amounts to 4 J and 12 J, respectively, and has
lower than the crack initiation energy, Ein, in all cases.
Graph (b): -20 0C, impact energy Et dropped from 25-18 J with the lowest to highest heat
input respectively. Crack initiation Ein energy is equal to 15-19 J. it is noted that most of total
impact energy is spent on the crack initiation, while the magnitude of crack propagation
energy is minimal.
Graph (c): at -40 0C Et amounts to 15-17 J and proportion of crack propagation energy at this
temperature is negligible. Due to the insensitivity of crack initiation energy to temperature
decrease, these joints have satisfactory and safe exploitation up to -400C (15 J) [93].
Generally, it can be concluded that the toughness decreases with an increase of heat input in
all cases, so the value of 7 kJ/cm can be recommended as optimal. Increase of heat input
brings out appearance of more proeutectoid ferrite and Widmanstatten ferrite, which affect to
toughness decrease.
The effect of heat input on a welded joint of its microstructure and mechanical properties is
summarized in figure 37.
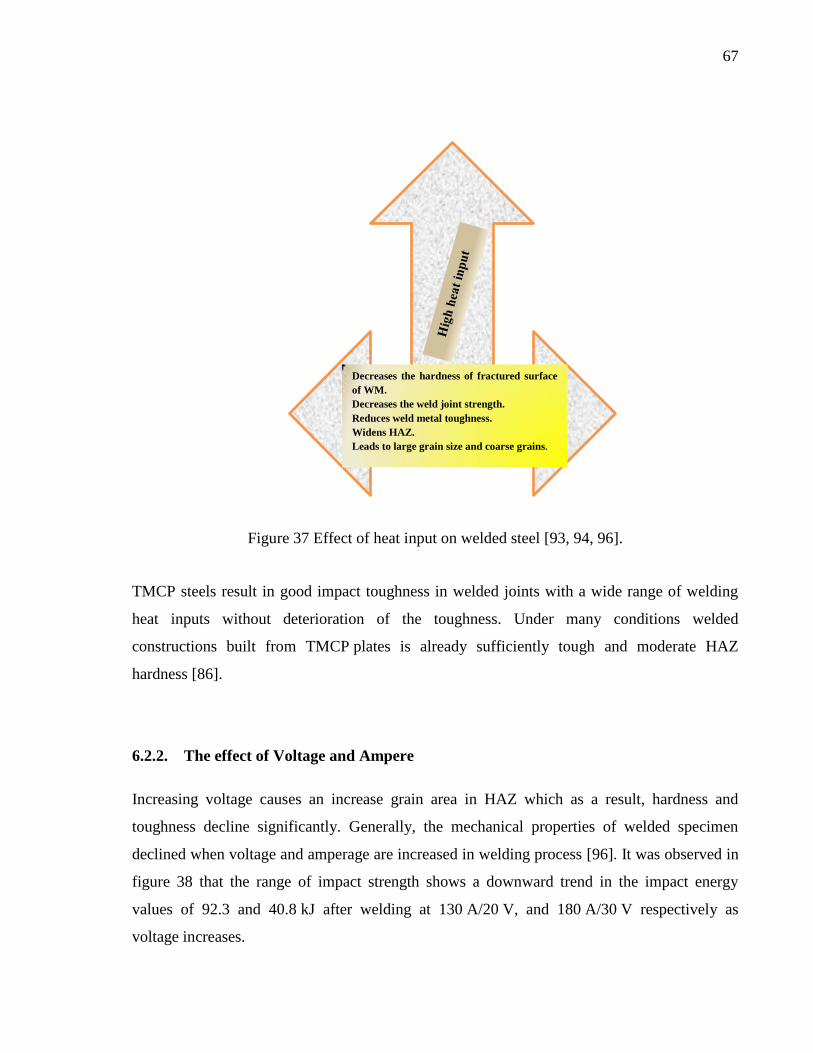
67
Figure 37 Effect of heat input on welded steel [93, 94, 96].
TMCP steels result in good impact toughness in welded joints with a wide range of welding
heat inputs without deterioration of the toughness. Under many conditions welded
constructions built from TMCP plates is already sufficiently tough and moderate HAZ
hardness [86].
6.2.2. The effect of Voltage and Ampere
Increasing voltage causes an increase grain area in HAZ which as a result, hardness and
toughness decline significantly. Generally, the mechanical properties of welded specimen
declined when voltage and amperage are increased in welding process [96]. It was observed in
figure 38 that the range of impact strength shows a downward trend in the impact energy
values of 92.3 and 40.8 kJ after welding at 130 A/20 V, and 180 A/30 V respectively as
voltage increases.
Decreases the hardness of fractured surface
of WM.
Decreases the weld joint strength.
Reduces weld metal toughness.
Widens HAZ.
Leads to large grain size and coarse grains.
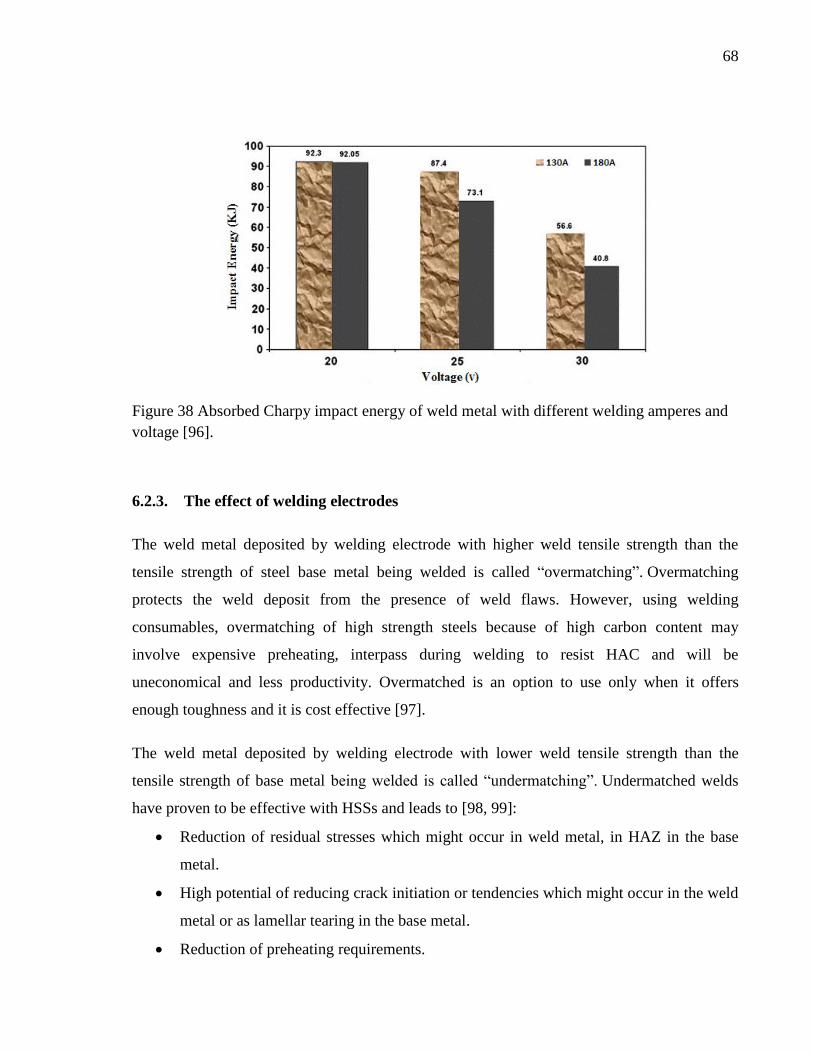
68
Figure 38 Absorbed Charpy impact energy of weld metal with different welding amperes and
voltage [96].
6.2.3. The effect of welding electrodes
The weld metal deposited by welding electrode with higher weld tensile strength than the
tensile strength of steel base metal being welded is called “overmatching”. Overmatching
protects the weld deposit from the presence of weld flaws. However, using welding
consumables, overmatching of high strength steels because of high carbon content may
involve expensive preheating, interpass during welding to resist HAC and will be
uneconomical and less productivity. Overmatched is an option to use only when it offers
enough toughness and it is cost effective [97].
The weld metal deposited by welding electrode with lower weld tensile strength than the
tensile strength of base metal being welded is called “undermatching”. Undermatched welds
have proven to be effective with HSSs and leads to [98, 99]:
Reduction of residual stresses which might occur in weld metal, in HAZ in the base
metal.
High potential of reducing crack initiation or tendencies which might occur in the weld
metal or as lamellar tearing in the base metal.
Reduction of preheating requirements.
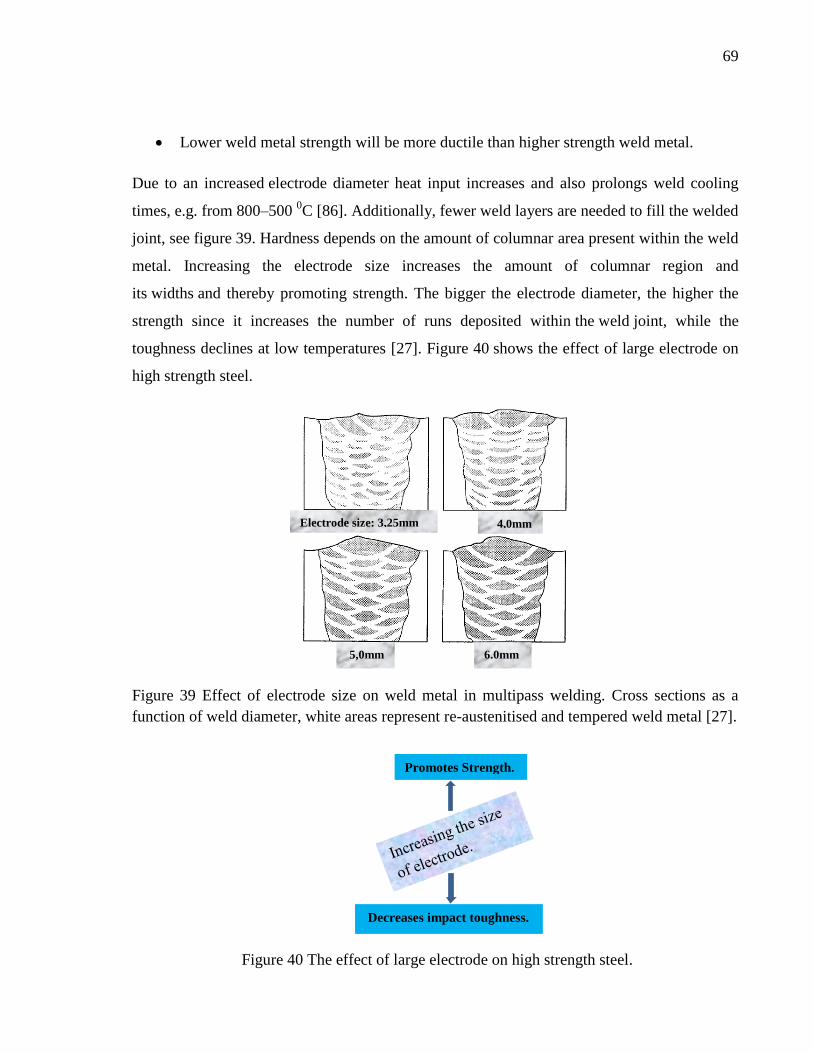
69
Lower weld metal strength will be more ductile than higher strength weld metal.
Due to an increased electrode diameter heat input increases and also prolongs weld cooling
times, e.g. from 800–500 0C [86]. Additionally, fewer weld layers are needed to fill the welded
joint, see figure 39. Hardness depends on the amount of columnar area present within the weld
metal. Increasing the electrode size increases the amount of columnar region and
its widths and thereby promoting strength. The bigger the electrode diameter, the higher the
strength since it increases the number of runs deposited within the weld joint, while the
toughness declines at low temperatures [27]. Figure 40 shows the effect of large electrode on
high strength steel.
Figure 39 Effect of electrode size on weld metal in multipass welding. Cross sections as a
function of weld diameter, white areas represent re-austenitised and tempered weld metal [27].
Figure 40 The effect of large electrode on high strength steel.
Electrode size: 3,25mm 4,0mm
5,0mm 6.0mm
Promotes Strength.
Decreases impact toughness.
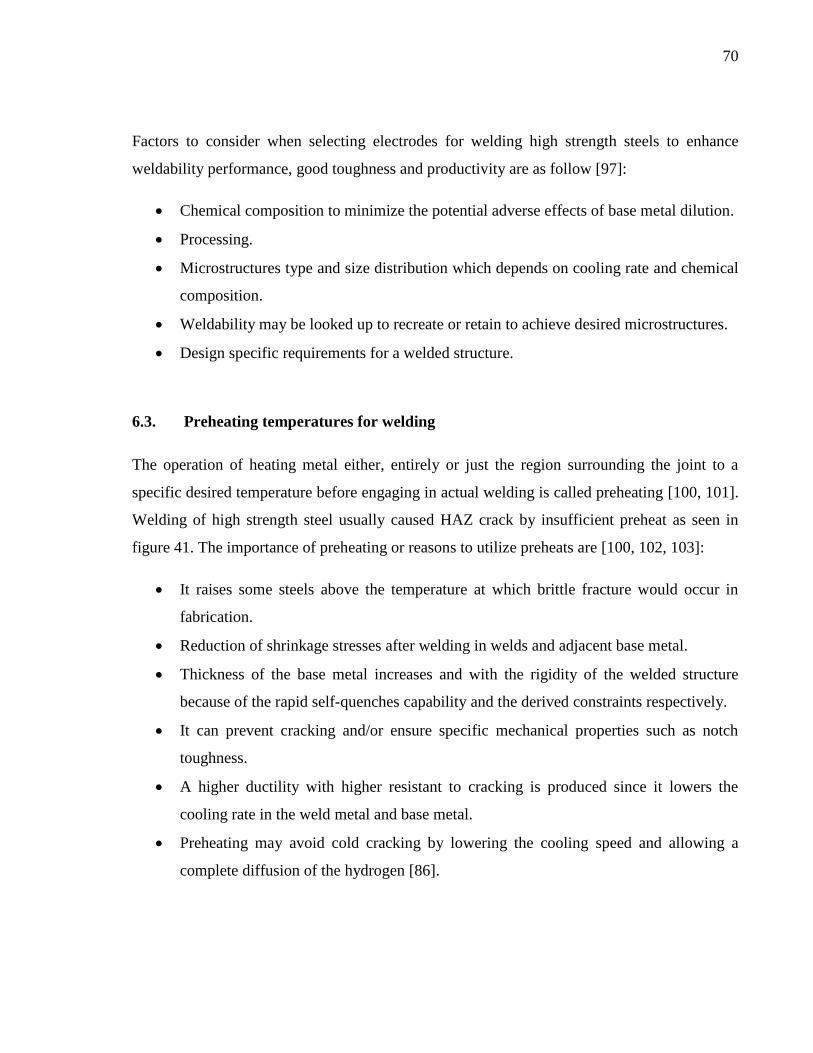
70
Factors to consider when selecting electrodes for welding high strength steels to enhance
weldability performance, good toughness and productivity are as follow [97]:
Chemical composition to minimize the potential adverse effects of base metal dilution.
Processing.
Microstructures type and size distribution which depends on cooling rate and chemical
composition.
Weldability may be looked up to recreate or retain to achieve desired microstructures.
Design specific requirements for a welded structure.
6.3. Preheating temperatures for welding
The operation of heating metal either, entirely or just the region surrounding the joint to a
specific desired temperature before engaging in actual welding is called preheating [100, 101].
Welding of high strength steel usually caused HAZ crack by insufficient preheat as seen in
figure 41. The importance of preheating or reasons to utilize preheats are [100, 102, 103]:
It raises some steels above the temperature at which brittle fracture would occur in
fabrication.
Reduction of shrinkage stresses after welding in welds and adjacent base metal.
Thickness of the base metal increases and with the rigidity of the welded structure
because of the rapid self-quenches capability and the derived constraints respectively.
It can prevent cracking and/or ensure specific mechanical properties such as notch
toughness.
A higher ductility with higher resistant to cracking is produced since it lowers the
cooling rate in the weld metal and base metal.
Preheating may avoid cold cracking by lowering the cooling speed and allowing a
complete diffusion of the hydrogen [86].
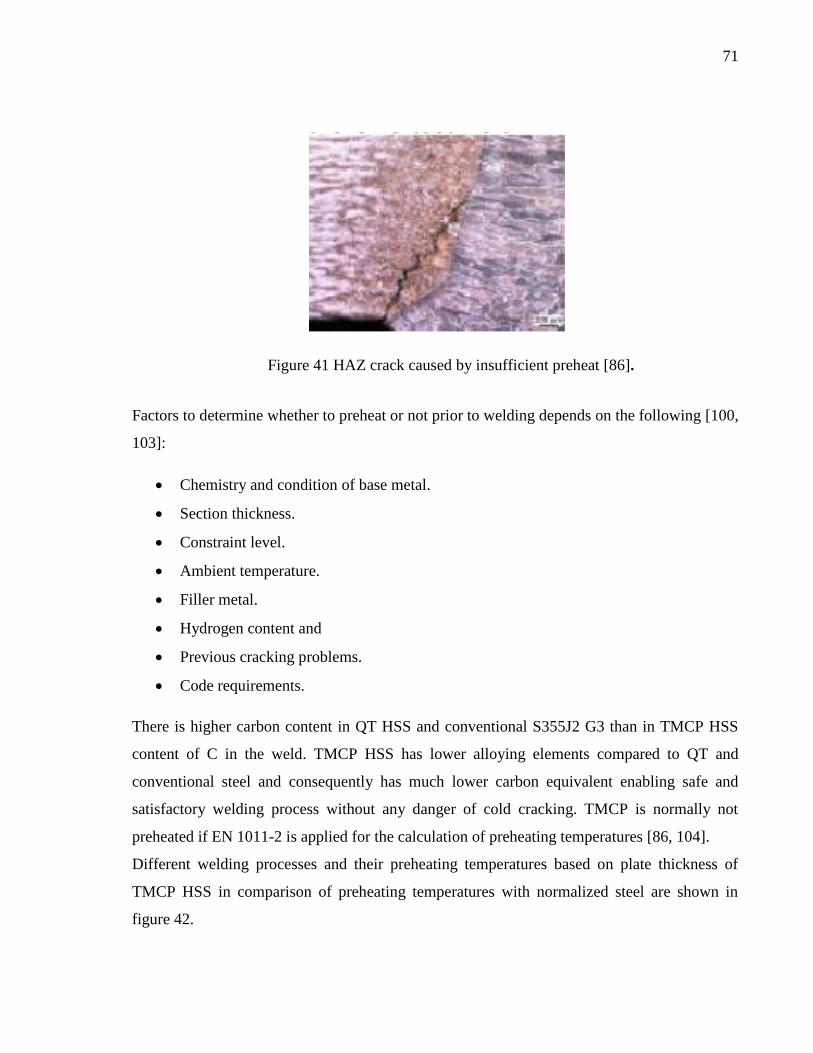
71
Figure 41 HAZ crack caused by insufficient preheat [86].
Factors to determine whether to preheat or not prior to welding depends on the following [100,
103]:
Chemistry and condition of base metal.
Section thickness.
Constraint level.
Ambient temperature.
Filler metal.
Hydrogen content and
Previous cracking problems.
Code requirements.
There is higher carbon content in QT HSS and conventional S355J2 G3 than in TMCP HSS
content of C in the weld. TMCP HSS has lower alloying elements compared to QT and
conventional steel and consequently has much lower carbon equivalent enabling safe and
satisfactory welding process without any danger of cold cracking. TMCP is normally not
preheated if EN 1011-2 is applied for the calculation of preheating temperatures [86, 104].
Different welding processes and their preheating temperatures based on plate thickness of
TMCP HSS in comparison of preheating temperatures with normalized steel are shown in
figure 42.
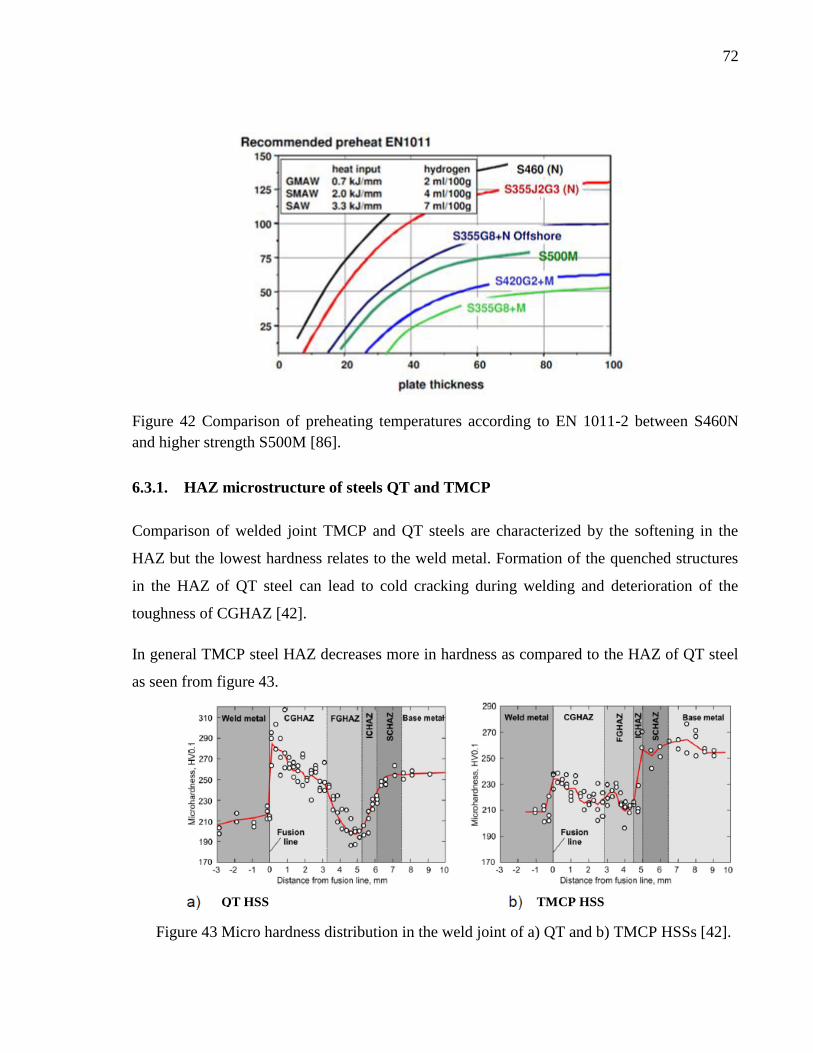
72
Figure 42 Comparison of preheating temperatures according to EN 1011-2 between S460N
and higher strength S500M [86].
6.3.1. HAZ microstructure of steels QT and TMCP
Comparison of welded joint TMCP and QT steels are characterized by the softening in the
HAZ but the lowest hardness relates to the weld metal. Formation of the quenched structures
in the HAZ of QT steel can lead to cold cracking during welding and deterioration of the
toughness of CGHAZ [42].
In general TMCP steel HAZ decreases more in hardness as compared to the HAZ of QT steel
as seen from figure 43.
Figure 43 Micro hardness distribution in the weld joint of a) QT and b) TMCP HSSs [42].
QT HSS TMCP HSS
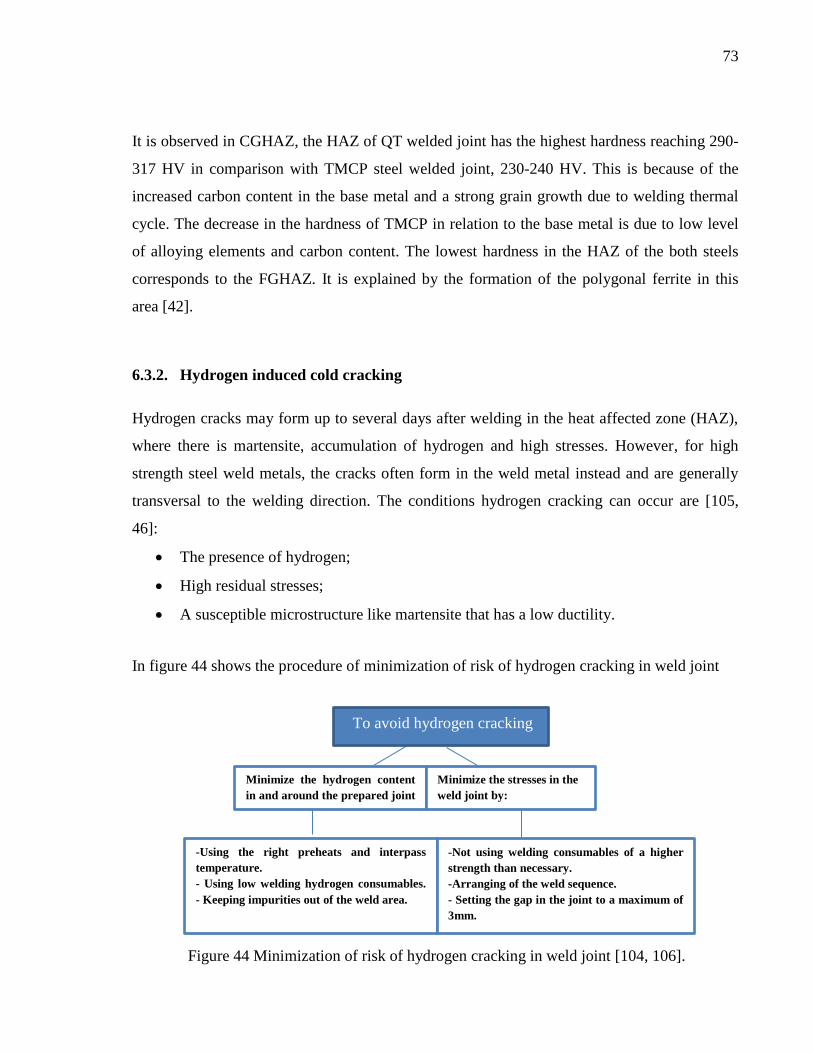
73
It is observed in CGHAZ, the HAZ of QT welded joint has the highest hardness reaching 290-
317 HV in comparison with TMCP steel welded joint, 230-240 HV. This is because of the
increased carbon content in the base metal and a strong grain growth due to welding thermal
cycle. The decrease in the hardness of TMCP in relation to the base metal is due to low level
of alloying elements and carbon content. The lowest hardness in the HAZ of the both steels
corresponds to the FGHAZ. It is explained by the formation of the polygonal ferrite in this
area [42].
6.3.2. Hydrogen induced cold cracking
Hydrogen cracks may form up to several days after welding in the heat affected zone (HAZ),
where there is martensite, accumulation of hydrogen and high stresses. However, for high
strength steel weld metals, the cracks often form in the weld metal instead and are generally
transversal to the welding direction. The conditions hydrogen cracking can occur are [105,
46]:
The presence of hydrogen;
High residual stresses;
A susceptible microstructure like martensite that has a low ductility.
In figure 44 shows the procedure of minimization of risk of hydrogen cracking in weld joint
Figure 44 Minimization of risk of hydrogen cracking in weld joint [104, 106].
Minimize the hydrogen content
in and around the prepared joint
by:
Minimize the stresses in the
weld joint by:
-Using the right preheats and interpass
temperature.
- Using low welding hydrogen consumables.
- Keeping impurities out of the weld area.
-Not using welding consumables of a higher
strength than necessary.
-Arranging of the weld sequence.
- Setting the gap in the joint to a maximum of
3mm.
To avoid hydrogen cracking
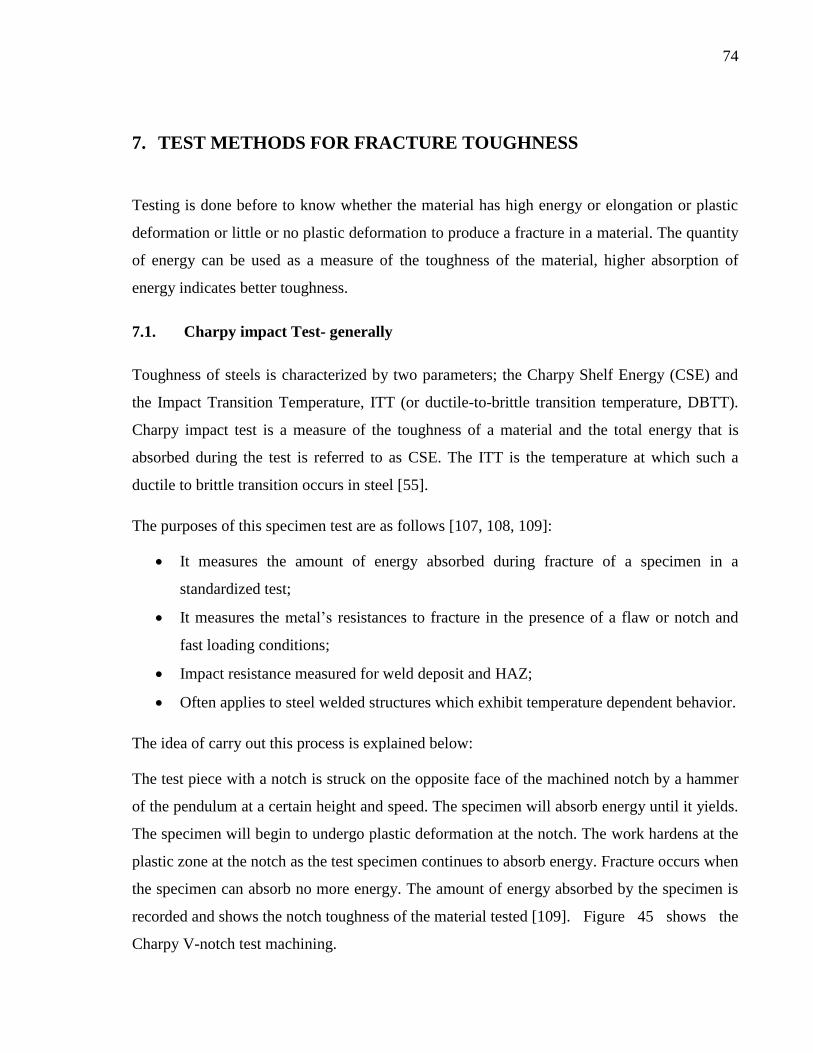
74
7. TEST METHODS FOR FRACTURE TOUGHNESS
Testing is done before to know whether the material has high energy or elongation or plastic
deformation or little or no plastic deformation to produce a fracture in a material. The quantity
of energy can be used as a measure of the toughness of the material, higher absorption of
energy indicates better toughness.
7.1. Charpy impact Test- generally
Toughness of steels is characterized by two parameters; the Charpy Shelf Energy (CSE) and
the Impact Transition Temperature, ITT (or ductile-to-brittle transition temperature, DBTT).
Charpy impact test is a measure of the toughness of a material and the total energy that is
absorbed during the test is referred to as CSE. The ITT is the temperature at which such a
ductile to brittle transition occurs in steel [55].
The purposes of this specimen test are as follows [107, 108, 109]:
It measures the amount of energy absorbed during fracture of a specimen in a
standardized test;
It measures the metal’s resistances to fracture in the presence of a flaw or notch and
fast loading conditions;
Impact resistance measured for weld deposit and HAZ;
Often applies to steel welded structures which exhibit temperature dependent behavior.
The idea of carry out this process is explained below:
The test piece with a notch is struck on the opposite face of the machined notch by a hammer
of the pendulum at a certain height and speed. The specimen will absorb energy until it yields.
The specimen will begin to undergo plastic deformation at the notch. The work hardens at the
plastic zone at the notch as the test specimen continues to absorb energy. Fracture occurs when
the specimen can absorb no more energy. The amount of energy absorbed by the specimen is
recorded and shows the notch toughness of the material tested [109]. Figure 45 shows the
Charpy V-notch test machining.
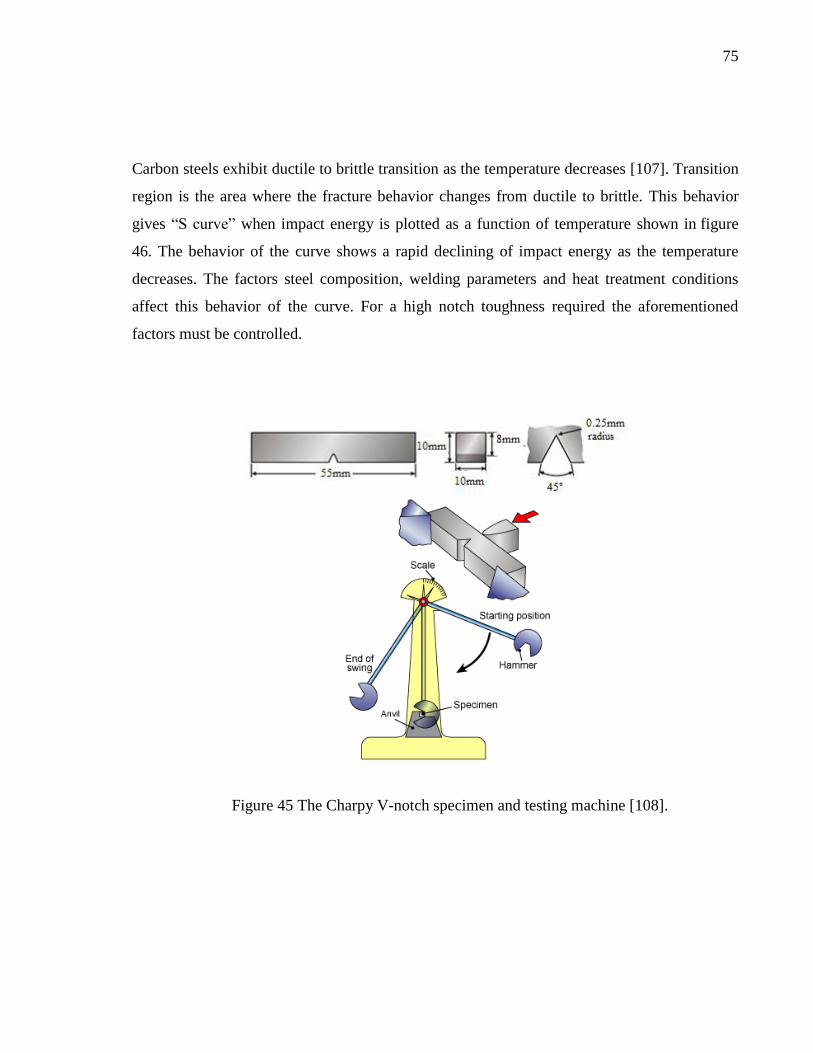
75
Carbon steels exhibit ductile to brittle transition as the temperature decreases [107]. Transition
region is the area where the fracture behavior changes from ductile to brittle. This behavior
gives “S curve” when impact energy is plotted as a function of temperature shown in figure
46. The behavior of the curve shows a rapid declining of impact energy as the temperature
decreases. The factors steel composition, welding parameters and heat treatment conditions
affect this behavior of the curve. For a high notch toughness required the aforementioned
factors must be controlled.
Figure 45 The Charpy V-notch specimen and testing machine [108].
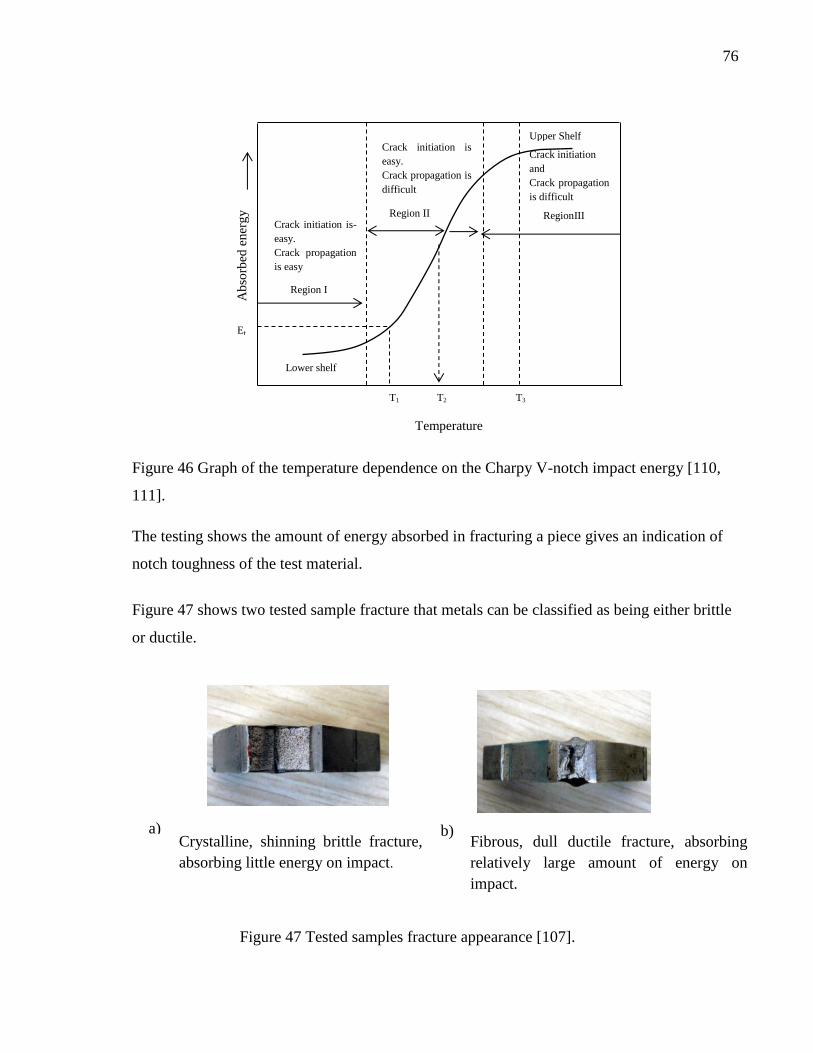
76
Figure 46 Graph of the temperature dependence on the Charpy V-notch impact energy [110,
111].
The testing shows the amount of energy absorbed in fracturing a piece gives an indication of
notch toughness of the test material.
Figure 47 shows two tested sample fracture that metals can be classified as being either brittle
or ductile.
Figure 47 Tested samples fracture appearance [107].
a) b)
) Crystalline, shinning brittle fracture,
absorbing little energy on impact.
Fibrous, dull ductile fracture, absorbing
relatively large amount of energy on
impact.
Crack initiation is-
easy.
Crack propagation
is easy
Crack initiation
and
Crack propagation
is difficult
Crack initiation is
easy.
Crack propagation is
difficult
Upper Shelf
Ab
sorb
ed e
ner
gy
Temperature
Region II
Lower shelf
T3 T2 T1
Region I
RegionIII
Et
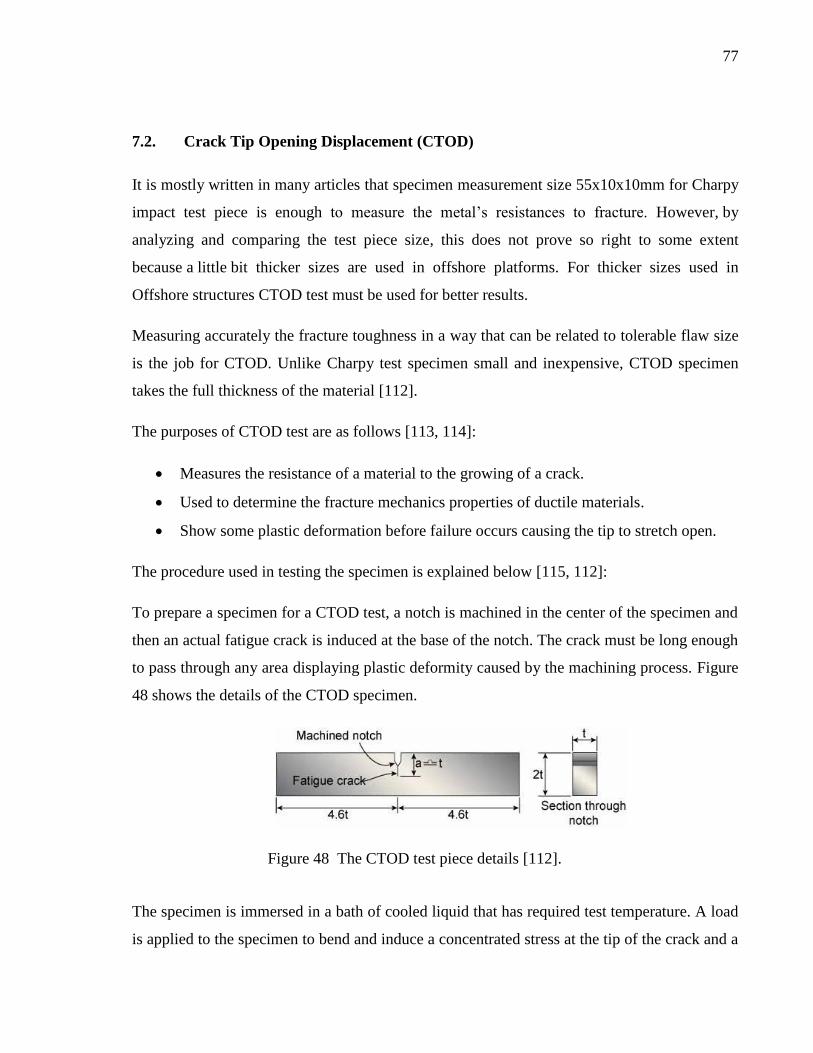
77
7.2. Crack Tip Opening Displacement (CTOD)
It is mostly written in many articles that specimen measurement size 55x10x10mm for Charpy
impact test piece is enough to measure the metal’s resistances to fracture. However, by
analyzing and comparing the test piece size, this does not prove so right to some extent
because a little bit thicker sizes are used in offshore platforms. For thicker sizes used in
Offshore structures CTOD test must be used for better results.
Measuring accurately the fracture toughness in a way that can be related to tolerable flaw size
is the job for CTOD. Unlike Charpy test specimen small and inexpensive, CTOD specimen
takes the full thickness of the material [112].
The purposes of CTOD test are as follows [113, 114]:
Measures the resistance of a material to the growing of a crack.
Used to determine the fracture mechanics properties of ductile materials.
Show some plastic deformation before failure occurs causing the tip to stretch open.
The procedure used in testing the specimen is explained below [115, 112]:
To prepare a specimen for a CTOD test, a notch is machined in the center of the specimen and
then an actual fatigue crack is induced at the base of the notch. The crack must be long enough
to pass through any area displaying plastic deformity caused by the machining process. Figure
48 shows the details of the CTOD specimen.
Figure 48 The CTOD test piece details [112].
The specimen is immersed in a bath of cooled liquid that has required test temperature. A load
is applied to the specimen to bend and induce a concentrated stress at the tip of the crack and a
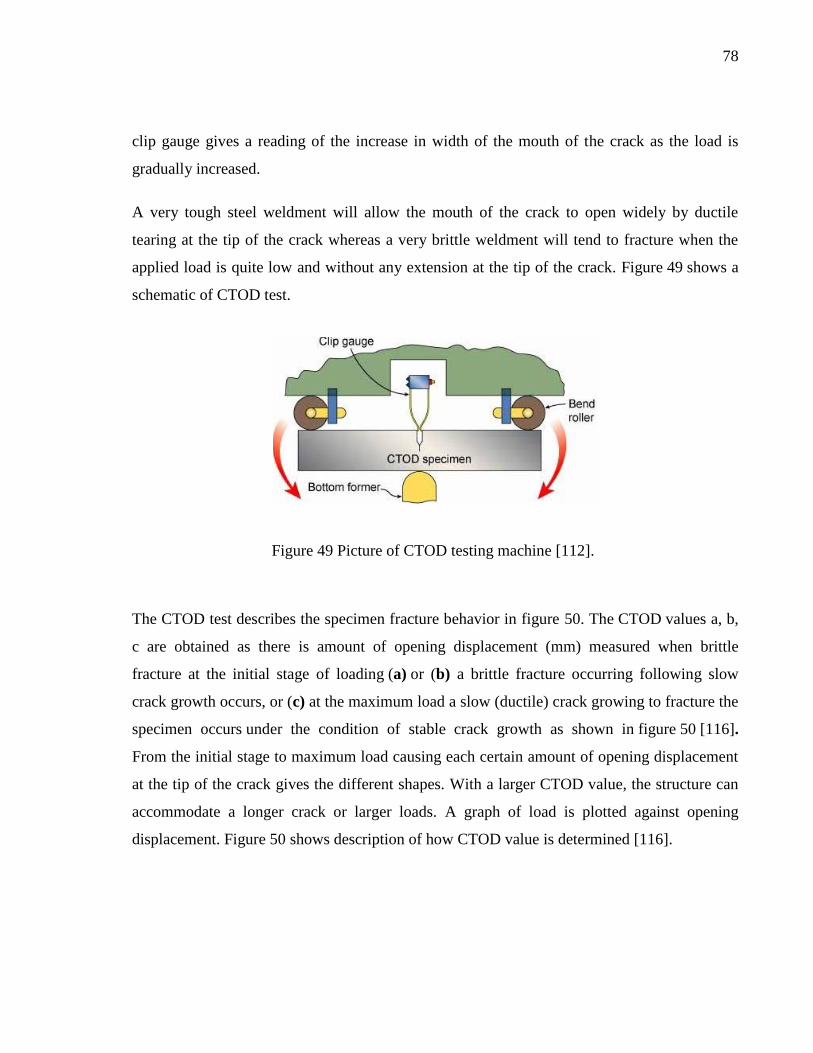
78
clip gauge gives a reading of the increase in width of the mouth of the crack as the load is
gradually increased.
A very tough steel weldment will allow the mouth of the crack to open widely by ductile
tearing at the tip of the crack whereas a very brittle weldment will tend to fracture when the
applied load is quite low and without any extension at the tip of the crack. Figure 49 shows a
schematic of CTOD test.
Figure 49 Picture of CTOD testing machine [112].
The CTOD test describes the specimen fracture behavior in figure 50. The CTOD values a, b,
c are obtained as there is amount of opening displacement (mm) measured when brittle
fracture at the initial stage of loading (a) or (b) a brittle fracture occurring following slow
crack growth occurs, or (c) at the maximum load a slow (ductile) crack growing to fracture the
specimen occurs under the condition of stable crack growth as shown in figure 50 [116].
From the initial stage to maximum load causing each certain amount of opening displacement
at the tip of the crack gives the different shapes. With a larger CTOD value, the structure can
accommodate a longer crack or larger loads. A graph of load is plotted against opening
displacement. Figure 50 shows description of how CTOD value is determined [116].
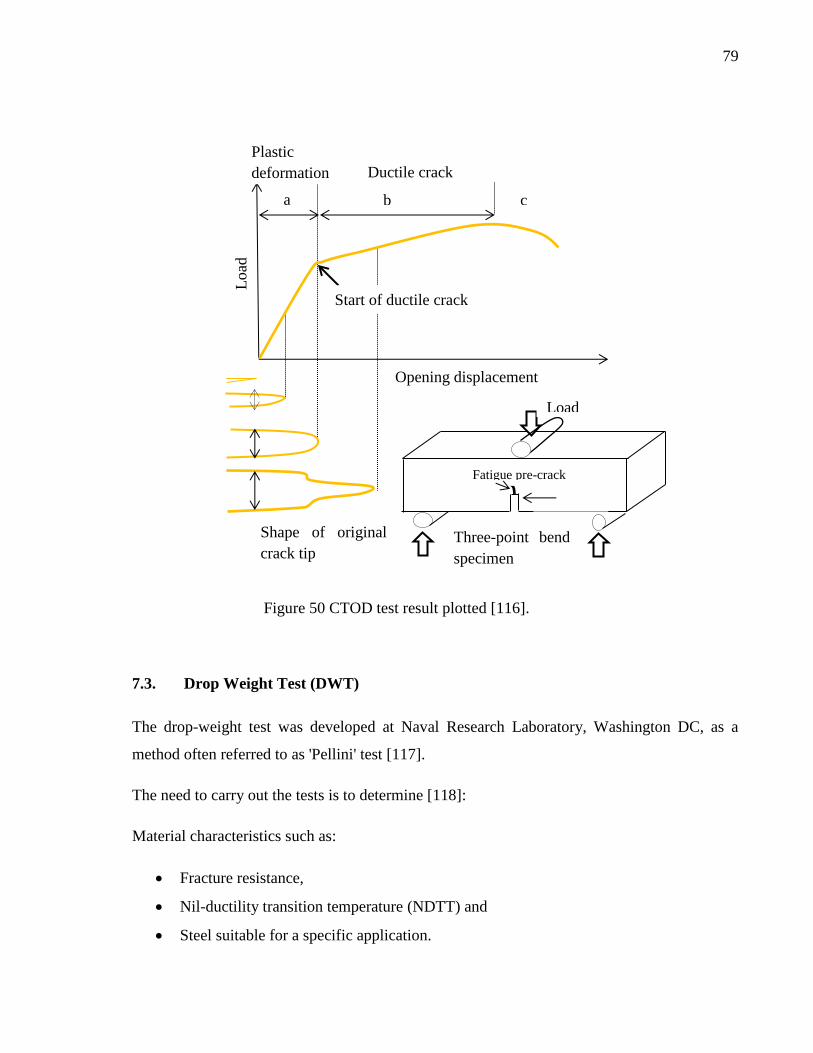
79
Figure 50 CTOD test result plotted [116].
7.3. Drop Weight Test (DWT)
The drop-weight test was developed at Naval Research Laboratory, Washington DC, as a
method often referred to as 'Pellini' test [117].
The need to carry out the tests is to determine [118]:
Material characteristics such as:
Fracture resistance,
Nil-ductility transition temperature (NDTT) and
Steel suitable for a specific application.
Ductile crack
Opening displacement
Load
Fatigue pre-crack
Three-point bend
specimen
Load
Plastic
deformation
Shape of original
crack tip
Start of ductile crack
growth
a b c
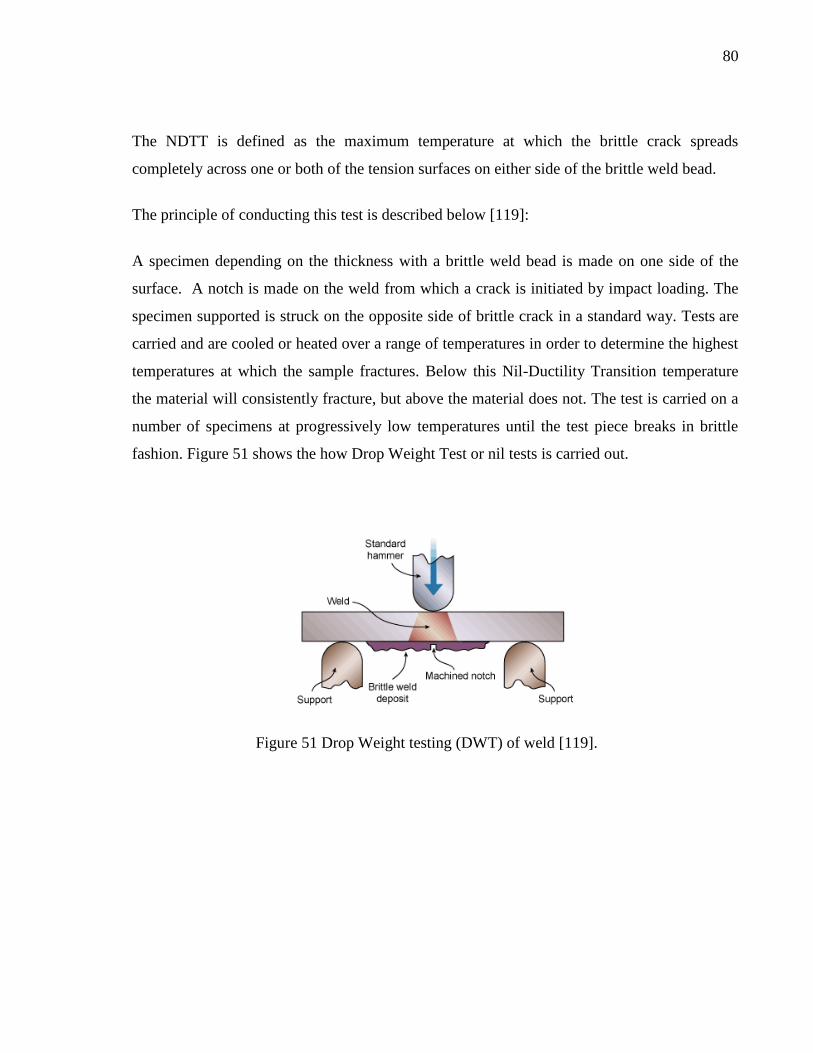
80
The NDTT is defined as the maximum temperature at which the brittle crack spreads
completely across one or both of the tension surfaces on either side of the brittle weld bead.
The principle of conducting this test is described below [119]:
A specimen depending on the thickness with a brittle weld bead is made on one side of the
surface. A notch is made on the weld from which a crack is initiated by impact loading. The
specimen supported is struck on the opposite side of brittle crack in a standard way. Tests are
carried and are cooled or heated over a range of temperatures in order to determine the highest
temperatures at which the sample fractures. Below this Nil-Ductility Transition temperature
the material will consistently fracture, but above the material does not. The test is carried on a
number of specimens at progressively low temperatures until the test piece breaks in brittle
fashion. Figure 51 shows the how Drop Weight Test or nil tests is carried out.
Figure 51 Drop Weight testing (DWT) of weld [119].
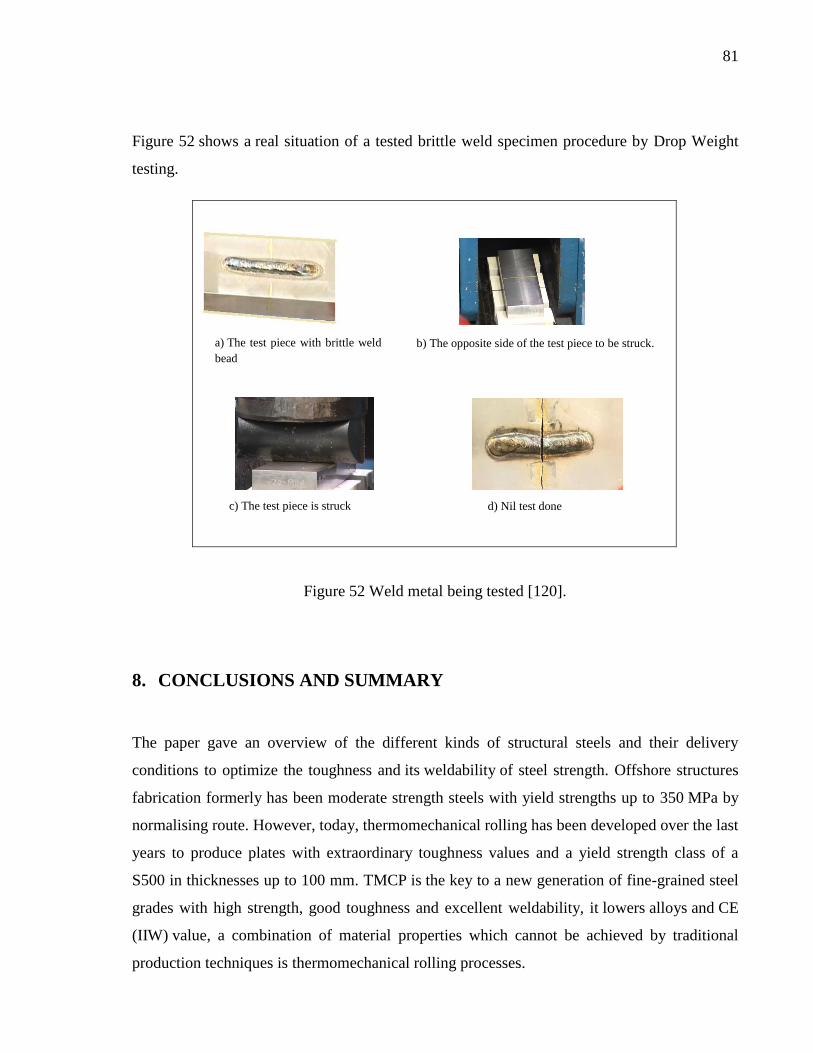
81
Figure 52 shows a real situation of a tested brittle weld specimen procedure by Drop Weight
testing.
Figure 52 Weld metal being tested [120].
8. CONCLUSIONS AND SUMMARY
The paper gave an overview of the different kinds of structural steels and their delivery
conditions to optimize the toughness and its weldability of steel strength. Offshore structures
fabrication formerly has been moderate strength steels with yield strengths up to 350 MPa by
normalising route. However, today, thermomechanical rolling has been developed over the last
years to produce plates with extraordinary toughness values and a yield strength class of a
S500 in thicknesses up to 100 mm. TMCP is the key to a new generation of fine-grained steel
grades with high strength, good toughness and excellent weldability, it lowers alloys and CE
(IIW) value, a combination of material properties which cannot be achieved by traditional
production techniques is thermomechanical rolling processes.
a) The test piece with brittle weld
bead
b) The opposite side of the test piece to be struck.
c) The test piece is struck d) Nil test done
82
In-depth investigation in offshore construction shows the superiority of TM-steels, particularly
for welding in the fields of safety, efficiency and cost reduction. Lower alloy content and the
whole range of material thicknesses can be obtained by combining TMCR rolling and
accelerated cooling and with lowest alloy content, a combination of TMCR rolling and
quenching and self-tempering (QST). By this process route steels have excellent weldability
due to their low alloy content when compared to traditional hot rolling process.
Summary physical metallurgy principles used to improve toughness for high strength
structural steels are listed:
Increasing the amount of acicular ferrite by controlling the alloying elements reduces
grain size.
Reduction of carbon content to improve weldability and toughness.
The presence of dissolved gases such as oxygen and nitrogen (in excess) and too many
inclusions that contribute to “a poor weld” can deteriorate weld metal toughness.
Proper control of shielding gas during welding and the use of clean steel technology is
important to be considered.
Strict control of impurity elements like S, P, Sn, As, Sb, and N helps to prevent
embrittlement of the structure.
Toughness and ductility increases with increasing interlamellar spacing according to
[25] while hardness increases with decreasing interlamellar spacing up to a critical
value. On the other side of the coin, with respect to transformation temperatures
ductility increases with decreasing interlamellar due to high transformation
temperatures of high carbon steel (hyper-eutectoid) [61]. There seems to be a little
contradiction between [21] and [53] with respect to interlamellar spacing and ductility.
Heat input
Considering performed examinations the following is concluded:
The welding heat input affects the structure and properties of the weld metal. Weld metal
toughness is extremely sensitive to the welding heat input. The change in toughness is not just
bound to the heat input, but is also influenced by the weld bead size. As the bead size
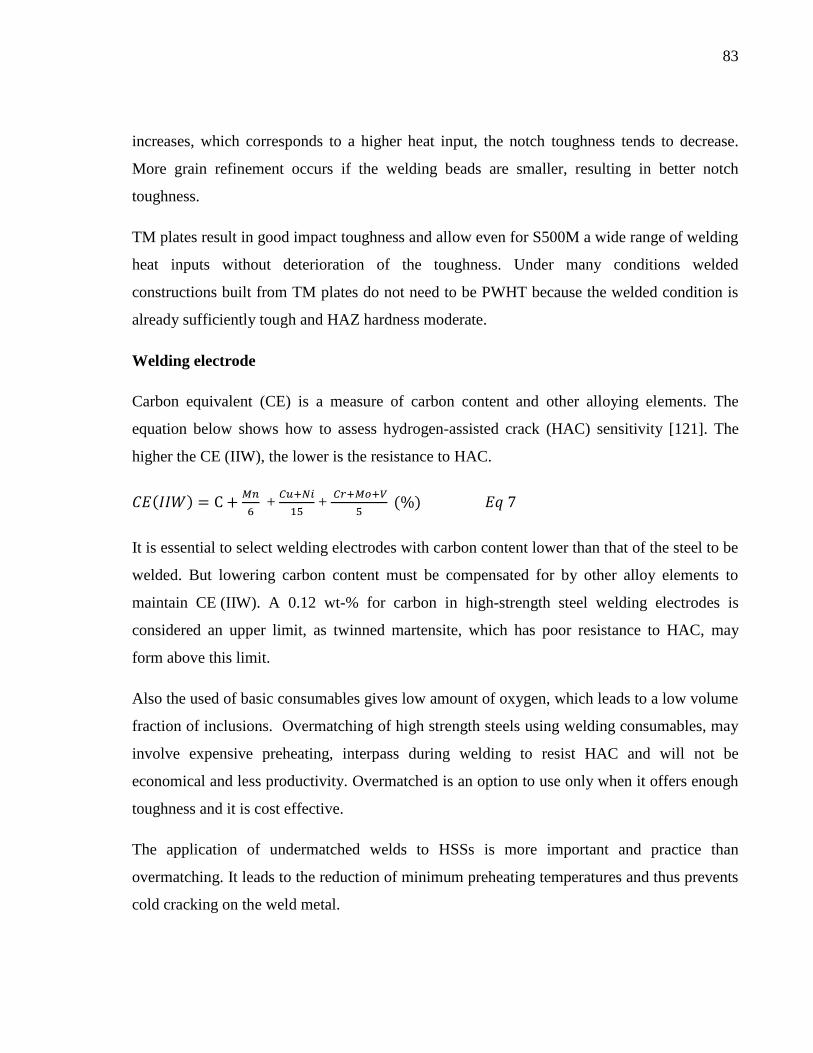
83
increases, which corresponds to a higher heat input, the notch toughness tends to decrease.
More grain refinement occurs if the welding beads are smaller, resulting in better notch
toughness.
TM plates result in good impact toughness and allow even for S500M a wide range of welding
heat inputs without deterioration of the toughness. Under many conditions welded
constructions built from TM plates do not need to be PWHT because the welded condition is
already sufficiently tough and HAZ hardness moderate.
Welding electrode
Carbon equivalent (CE) is a measure of carbon content and other alloying elements. The
equation below shows how to assess hydrogen-assisted crack (HAC) sensitivity [121]. The
higher the CE (IIW), the lower is the resistance to HAC.
( )
+
+
( )
It is essential to select welding electrodes with carbon content lower than that of the steel to be
welded. But lowering carbon content must be compensated for by other alloy elements to
maintain CE (IIW). A 0.12 wt-% for carbon in high-strength steel welding electrodes is
considered an upper limit, as twinned martensite, which has poor resistance to HAC, may
form above this limit.
Also the used of basic consumables gives low amount of oxygen, which leads to a low volume
fraction of inclusions. Overmatching of high strength steels using welding consumables, may
involve expensive preheating, interpass during welding to resist HAC and will not be
economical and less productivity. Overmatched is an option to use only when it offers enough
toughness and it is cost effective.
The application of undermatched welds to HSSs is more important and practice than
overmatching. It leads to the reduction of minimum preheating temperatures and thus prevents
cold cracking on the weld metal.
84
The bigger the electrode diameter, the higher the strength since it increases the number of runs
deposited, while the toughness declines at low temperatures.
Fracture Toughness
Research studies were also carried out aiming to rationalize the selection of steel with
resistance to brittle fracture.
It was demonstrated that more effective toughness is needed for:
Structural elements under fatigue load.
Lower service temperature.
Higher yield strength.
Thicker products.
Fracture toughness generally depends on temperature, environment, loading rate, the
composition of the material and its microstructure. It is preferable to determine fracture
toughness in CVN, CTOD and DWT.
These different testing methods measure the behavior of materials, to reveal the temperature
where material´s fracture mode changes from ductile to brittle. Other testing methods for
example crack tip opening displacement (CTOD), crack tip opening angle (CTOA) methods,
usually they are executed with full-size (actual size or thickness) test piece, but the results are
difficult to compare and there are no standardized demands for these tests in Europe.
85
References
[1] M. Sarikaya, B. G. Steinberg and G. Thomas, "Optimization of Fe/Cr/C Base Structural
Steels for improved Strength and Toughness," metallurgical transactions A, vol. 13A,
no. 12, pp. 2227-2237, 1982.
[2] J. H. Chen, S. H. Hu and G. Z. Wang, "Mechanism of Detrimental Effects of Carbon
Content on Cleavage Fracture Toughness of low-alloy steel," metallurgiacal
transactions, vol. 32A, p. 1081, 2001.
[3] "Offshore energy today.com," 25 June 2010. [Online]. Available:http://www.offshore
energytoday.com/offshore-drilling-history-and-overview/. [Accessed 13 March 2013].
[4] "American Oil & Gas Historical Society," Offshore Petroleum History, 2012. [Online].
Available: http://aoghs.org/offshore-technology-history/offshore-oil-history/. [Accessed
13 March 2013].
[5] National Commission on the BP Deepwater Horizon Oil Spill and Offshore, "A Brief
History of Offshore Oil Drilling," 20 October 2010. [Online]. Available:
http://permanent.access.gpo.gov/gpo182/A%20Brief%20History%20of%20Offshore%2
0Drilling%20Working%20Paper%208%2023%2010.pdf. [Accessed 13 March 2013].
[6] "Association for the study of Peak Oil and Gas," Uppsala University's Kjell Aleklett, 12
May 2011. [Online]. Available: http://real-economics.blogspot.fi/2011/05/peak-oil-
explained.html. [Accessed 10 September 2013].
[7] "Association for the Study of Peak Oil," Uppsala University, May 2002. [Online].
Available: http://www.mekarn.org/workshops/environ/proenv/lengnew.htm.
[8] K. T. Gökce and E. Keyder, "Offshore Structure Types and Design Principles," vol. III,
no. 4, pp. 103-106, 1991.
[9] S.Tanaka, Y.Okada and Y.Ichikawa, "Offshore Drilling and Production Equipment,"
Encyclopedia of Life Support Systems (EOLSS), Oxford, UK, 2005.
[10] API and RP, Recomended Practice for Planning, Designing and Constructuring Fixed
Offshore Platforms, Washington: American Petroleum Institute.
[11] KR, "Rules for the Classification of Fixed Offshore Structures," Korean Register of
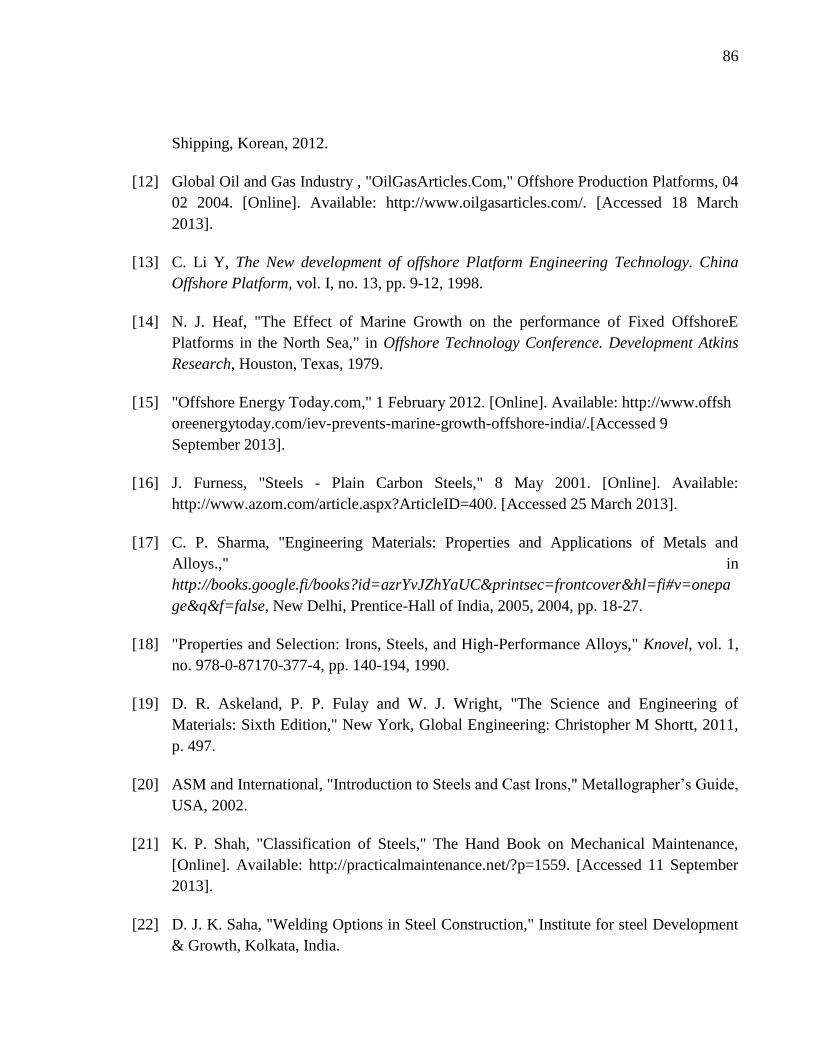
86
Shipping, Korean, 2012.
[12] Global Oil and Gas Industry , "OilGasArticles.Com," Offshore Production Platforms, 04
02 2004. [Online]. Available: http://www.oilgasarticles.com/. [Accessed 18 March
2013].
[13] C. Li Y, The New development of offshore Platform Engineering Technology. China
Offshore Platform, vol. I, no. 13, pp. 9-12, 1998.
[14] N. J. Heaf, "The Effect of Marine Growth on the performance of Fixed OffshoreE
Platforms in the North Sea," in Offshore Technology Conference. Development Atkins
Research, Houston, Texas, 1979.
[15] "Offshore Energy Today.com," 1 February 2012. [Online]. Available: http://www.offsh
oreenergytoday.com/iev-prevents-marine-growth-offshore-india/.[Accessed 9
September 2013].
[16] J. Furness, "Steels - Plain Carbon Steels," 8 May 2001. [Online]. Available:
http://www.azom.com/article.aspx?ArticleID=400. [Accessed 25 March 2013].
[17] C. P. Sharma, "Engineering Materials: Properties and Applications of Metals and
Alloys.," in
http://books.google.fi/books?id=azrYvJZhYaUC&printsec=frontcover&hl=fi#v=onepa
ge&q&f=false, New Delhi, Prentice-Hall of India, 2005, 2004, pp. 18-27.
[18] "Properties and Selection: Irons, Steels, and High-Performance Alloys," Knovel, vol. 1,
no. 978-0-87170-377-4, pp. 140-194, 1990.
[19] D. R. Askeland, P. P. Fulay and W. J. Wright, "The Science and Engineering of
Materials: Sixth Edition," New York, Global Engineering: Christopher M Shortt, 2011,
p. 497.
[20] ASM and International, "Introduction to Steels and Cast Irons," Metallographer’s Guide,
USA, 2002.
[21] K. P. Shah, "Classification of Steels," The Hand Book on Mechanical Maintenance,
[Online]. Available: http://practicalmaintenance.net/?p=1559. [Accessed 11 September
2013].
[22] D. J. K. Saha, "Welding Options in Steel Construction," Institute for steel Development
& Growth, Kolkata, India.
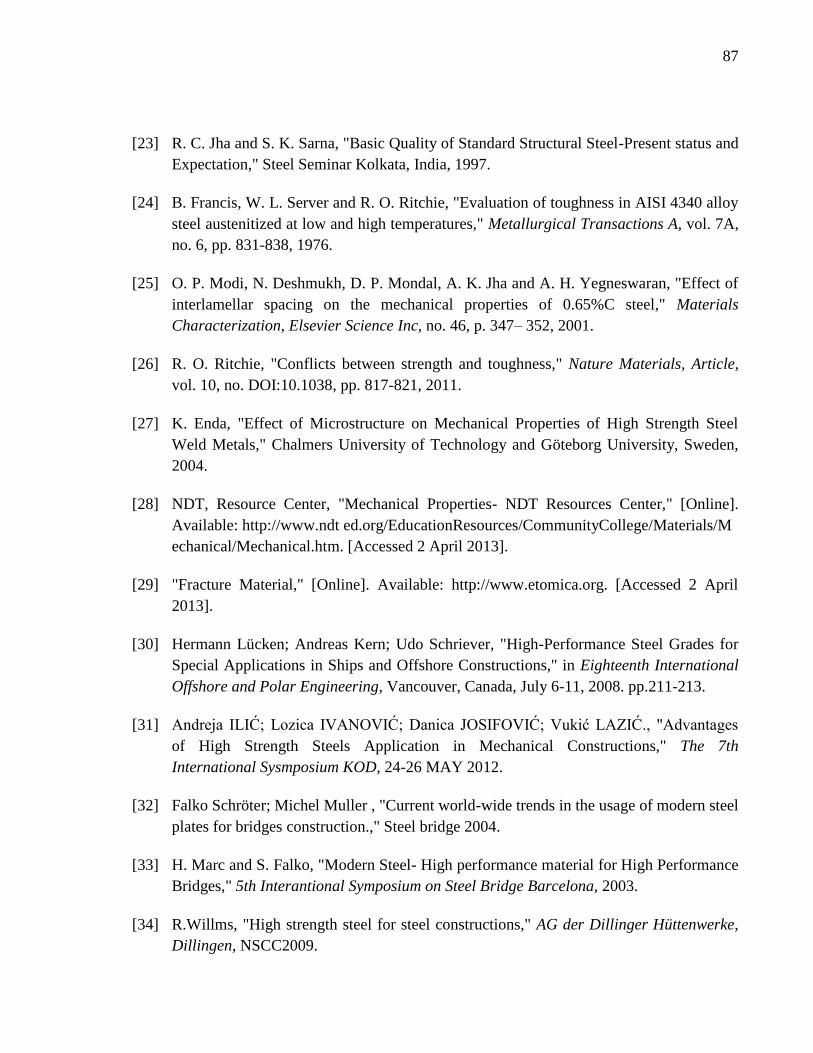
87
[23] R. C. Jha and S. K. Sarna, "Basic Quality of Standard Structural Steel-Present status and
Expectation," Steel Seminar Kolkata, India, 1997.
[24] B. Francis, W. L. Server and R. O. Ritchie, "Evaluation of toughness in AISI 4340 alloy
steel austenitized at low and high temperatures," Metallurgical Transactions A, vol. 7A,
no. 6, pp. 831-838, 1976.
[25] O. P. Modi, N. Deshmukh, D. P. Mondal, A. K. Jha and A. H. Yegneswaran, "Effect of
interlamellar spacing on the mechanical properties of 0.65%C steel," Materials
Characterization, Elsevier Science Inc, no. 46, p. 347– 352, 2001.
[26] R. O. Ritchie, "Conflicts between strength and toughness," Nature Materials, Article,
vol. 10, no. DOI:10.1038, pp. 817-821, 2011.
[27] K. Enda, "Effect of Microstructure on Mechanical Properties of High Strength Steel
Weld Metals," Chalmers University of Technology and Göteborg University, Sweden,
2004.
[28] NDT, Resource Center, "Mechanical Properties- NDT Resources Center," [Online].
Available: http://www.ndt ed.org/EducationResources/CommunityCollege/Materials/M
echanical/Mechanical.htm. [Accessed 2 April 2013].
[29] "Fracture Material," [Online]. Available: http://www.etomica.org. [Accessed 2 April
2013].
[30] Hermann Lücken; Andreas Kern; Udo Schriever, "High-Performance Steel Grades for
Special Applications in Ships and Offshore Constructions," in Eighteenth International
Offshore and Polar Engineering, Vancouver, Canada, July 6-11, 2008. pp.211-213.
[31] Andreja ILIĆ; Lozica IVANOVIĆ; Danica JOSIFOVIĆ; Vukić LAZIĆ., "Advantages
of High Strength Steels Application in Mechanical Constructions," The 7th
International Sysmposium KOD, 24-26 MAY 2012.
[32] Falko Schröter; Michel Muller , "Current world-wide trends in the usage of modern steel
plates for bridges construction.," Steel bridge 2004.
[33] H. Marc and S. Falko, "Modern Steel- High performance material for High Performance
Bridges," 5th Interantional Symposium on Steel Bridge Barcelona, 2003.
[34] R.Willms, "High strength steel for steel constructions," AG der Dillinger Hüttenwerke,
Dillingen, NSCC2009.
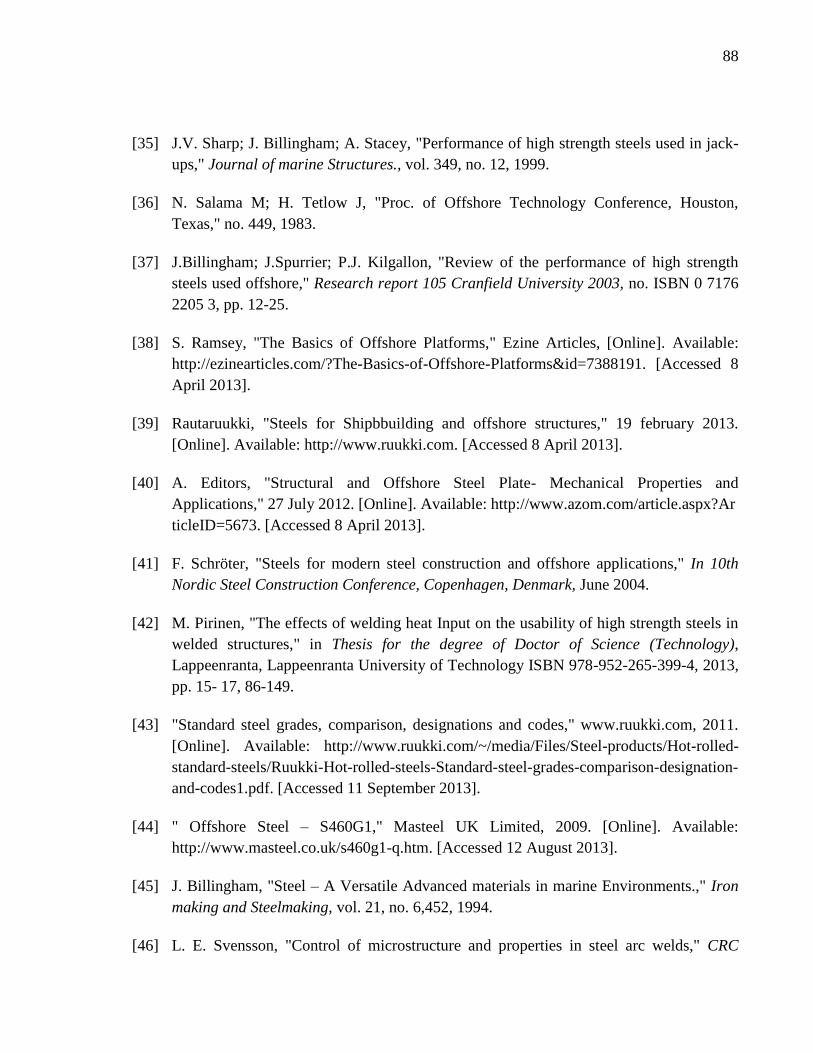
88
[35] J.V. Sharp; J. Billingham; A. Stacey, "Performance of high strength steels used in jack-
ups," Journal of marine Structures., vol. 349, no. 12, 1999.
[36] N. Salama M; H. Tetlow J, "Proc. of Offshore Technology Conference, Houston,
Texas," no. 449, 1983.
[37] J.Billingham; J.Spurrier; P.J. Kilgallon, "Review of the performance of high strength
steels used offshore," Research report 105 Cranfield University 2003, no. ISBN 0 7176
2205 3, pp. 12-25.
[38] S. Ramsey, "The Basics of Offshore Platforms," Ezine Articles, [Online]. Available:
http://ezinearticles.com/?The-Basics-of-Offshore-Platforms&id=7388191. [Accessed 8
April 2013].
[39] Rautaruukki, "Steels for Shipbbuilding and offshore structures," 19 february 2013.
[Online]. Available: http://www.ruukki.com. [Accessed 8 April 2013].
[40] A. Editors, "Structural and Offshore Steel Plate- Mechanical Properties and
Applications," 27 July 2012. [Online]. Available: http://www.azom.com/article.aspx?Ar
ticleID=5673. [Accessed 8 April 2013].
[41] F. Schröter, "Steels for modern steel construction and offshore applications," In 10th
Nordic Steel Construction Conference, Copenhagen, Denmark, June 2004.
[42] M. Pirinen, "The effects of welding heat Input on the usability of high strength steels in
welded structures," in Thesis for the degree of Doctor of Science (Technology),
Lappeenranta, Lappeenranta University of Technology ISBN 978-952-265-399-4, 2013,
pp. 15- 17, 86-149.
[43] "Standard steel grades, comparison, designations and codes," www.ruukki.com, 2011.
[Online]. Available: http://www.ruukki.com/~/media/Files/Steel-products/Hot-rolled-
standard-steels/Ruukki-Hot-rolled-steels-Standard-steel-grades-comparison-designation-
and-codes1.pdf. [Accessed 11 September 2013].
[44] " Offshore Steel – S460G1," Masteel UK Limited, 2009. [Online]. Available:
http://www.masteel.co.uk/s460g1-q.htm. [Accessed 12 August 2013].
[45] J. Billingham, "Steel – A Versatile Advanced materials in marine Environments.," Iron
making and Steelmaking, vol. 21, no. 6,452, 1994.
[46] L. E. Svensson, "Control of microstructure and properties in steel arc welds," CRC
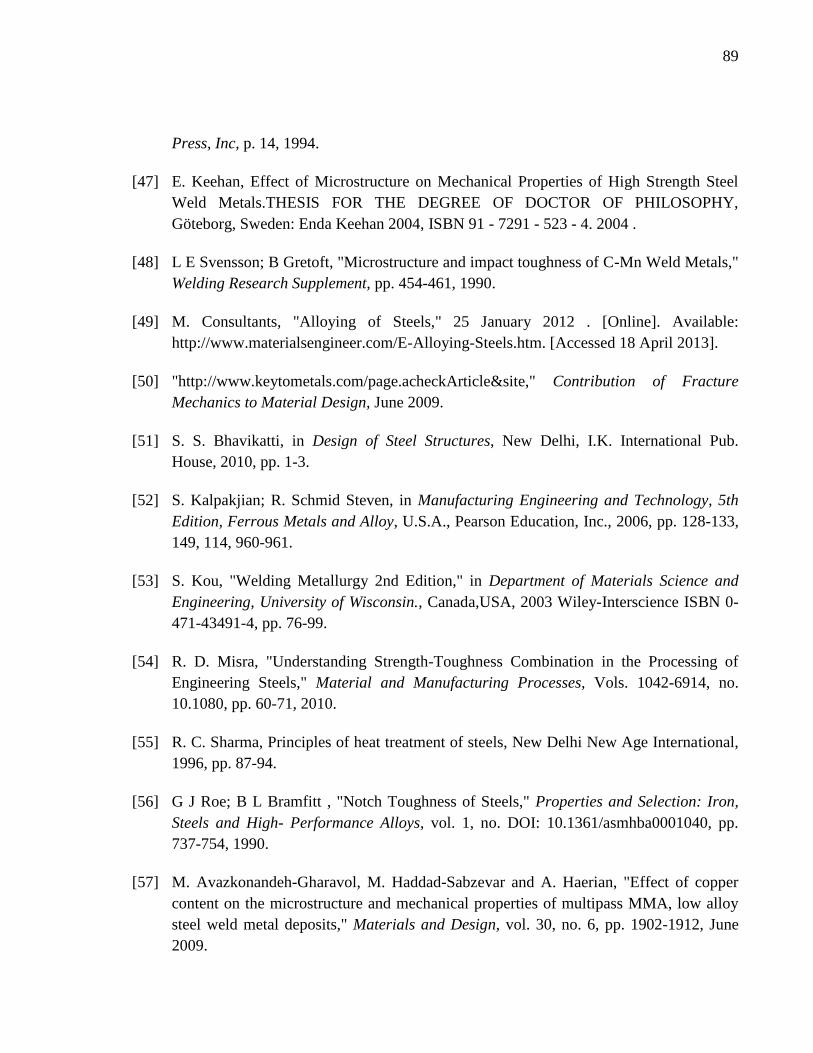
89
Press, Inc, p. 14, 1994.
[47] E. Keehan, Effect of Microstructure on Mechanical Properties of High Strength Steel
Weld Metals.THESIS FOR THE DEGREE OF DOCTOR OF PHILOSOPHY,
Göteborg, Sweden: Enda Keehan 2004, ISBN 91 - 7291 - 523 - 4. 2004 .
[48] L E Svensson; B Gretoft, "Microstructure and impact toughness of C-Mn Weld Metals,"
Welding Research Supplement, pp. 454-461, 1990.
[49] M. Consultants, "Alloying of Steels," 25 January 2012 . [Online]. Available:
http://www.materialsengineer.com/E-Alloying-Steels.htm. [Accessed 18 April 2013].
[50] "http://www.keytometals.com/page.acheckArticle&site," Contribution of Fracture
Mechanics to Material Design, June 2009.
[51] S. S. Bhavikatti, in Design of Steel Structures, New Delhi, I.K. International Pub.
House, 2010, pp. 1-3.
[52] S. Kalpakjian; R. Schmid Steven, in Manufacturing Engineering and Technology, 5th
Edition, Ferrous Metals and Alloy, U.S.A., Pearson Education, Inc., 2006, pp. 128-133,
149, 114, 960-961.
[53] S. Kou, "Welding Metallurgy 2nd Edition," in Department of Materials Science and
Engineering, University of Wisconsin., Canada,USA, 2003 Wiley-Interscience ISBN 0-
471-43491-4, pp. 76-99.
[54] R. D. Misra, "Understanding Strength-Toughness Combination in the Processing of
Engineering Steels," Material and Manufacturing Processes, Vols. 1042-6914, no.
10.1080, pp. 60-71, 2010.
[55] R. C. Sharma, Principles of heat treatment of steels, New Delhi New Age International,
1996, pp. 87-94.
[56] G J Roe; B L Bramfitt , "Notch Toughness of Steels," Properties and Selection: Iron,
Steels and High- Performance Alloys, vol. 1, no. DOI: 10.1361/asmhba0001040, pp.
737-754, 1990.
[57] M. Avazkonandeh-Gharavol, M. Haddad-Sabzevar and A. Haerian, "Effect of copper
content on the microstructure and mechanical properties of multipass MMA, low alloy
steel weld metal deposits," Materials and Design, vol. 30, no. 6, pp. 1902-1912, June
2009.
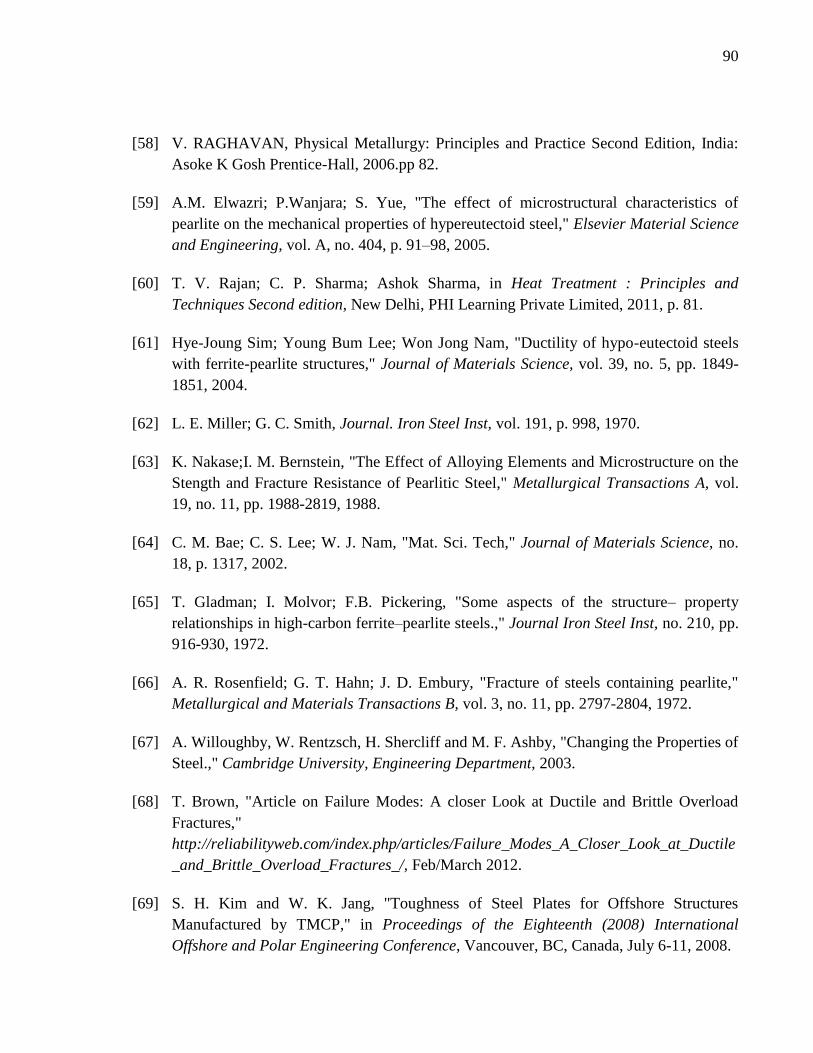
90
[58] V. RAGHAVAN, Physical Metallurgy: Principles and Practice Second Edition, India:
Asoke K Gosh Prentice-Hall, 2006.pp 82.
[59] A.M. Elwazri; P.Wanjara; S. Yue, "The effect of microstructural characteristics of
pearlite on the mechanical properties of hypereutectoid steel," Elsevier Material Science
and Engineering, vol. A, no. 404, p. 91–98, 2005.
[60] T. V. Rajan; C. P. Sharma; Ashok Sharma, in Heat Treatment : Principles and
Techniques Second edition, New Delhi, PHI Learning Private Limited, 2011, p. 81.
[61] Hye-Joung Sim; Young Bum Lee; Won Jong Nam, "Ductility of hypo-eutectoid steels
with ferrite-pearlite structures," Journal of Materials Science, vol. 39, no. 5, pp. 1849-
1851, 2004.
[62] L. E. Miller; G. C. Smith, Journal. Iron Steel Inst, vol. 191, p. 998, 1970.
[63] K. Nakase;I. M. Bernstein, "The Effect of Alloying Elements and Microstructure on the
Stength and Fracture Resistance of Pearlitic Steel," Metallurgical Transactions A, vol.
19, no. 11, pp. 1988-2819, 1988.
[64] C. M. Bae; C. S. Lee; W. J. Nam, "Mat. Sci. Tech," Journal of Materials Science, no.
18, p. 1317, 2002.
[65] T. Gladman; I. Molvor; F.B. Pickering, "Some aspects of the structure– property
relationships in high-carbon ferrite–pearlite steels.," Journal Iron Steel Inst, no. 210, pp.
916-930, 1972.
[66] A. R. Rosenfield; G. T. Hahn; J. D. Embury, "Fracture of steels containing pearlite,"
Metallurgical and Materials Transactions B, vol. 3, no. 11, pp. 2797-2804, 1972.
[67] A. Willoughby, W. Rentzsch, H. Shercliff and M. F. Ashby, "Changing the Properties of
Steel.," Cambridge University, Engineering Department, 2003.
[68] T. Brown, "Article on Failure Modes: A closer Look at Ductile and Brittle Overload
Fractures,"
http://reliabilityweb.com/index.php/articles/Failure_Modes_A_Closer_Look_at_Ductile
_and_Brittle_Overload_Fractures_/, Feb/March 2012.
[69] S. H. Kim and W. K. Jang, "Toughness of Steel Plates for Offshore Structures
Manufactured by TMCP," in Proceedings of the Eighteenth (2008) International
Offshore and Polar Engineering Conference, Vancouver, BC, Canada, July 6-11, 2008.
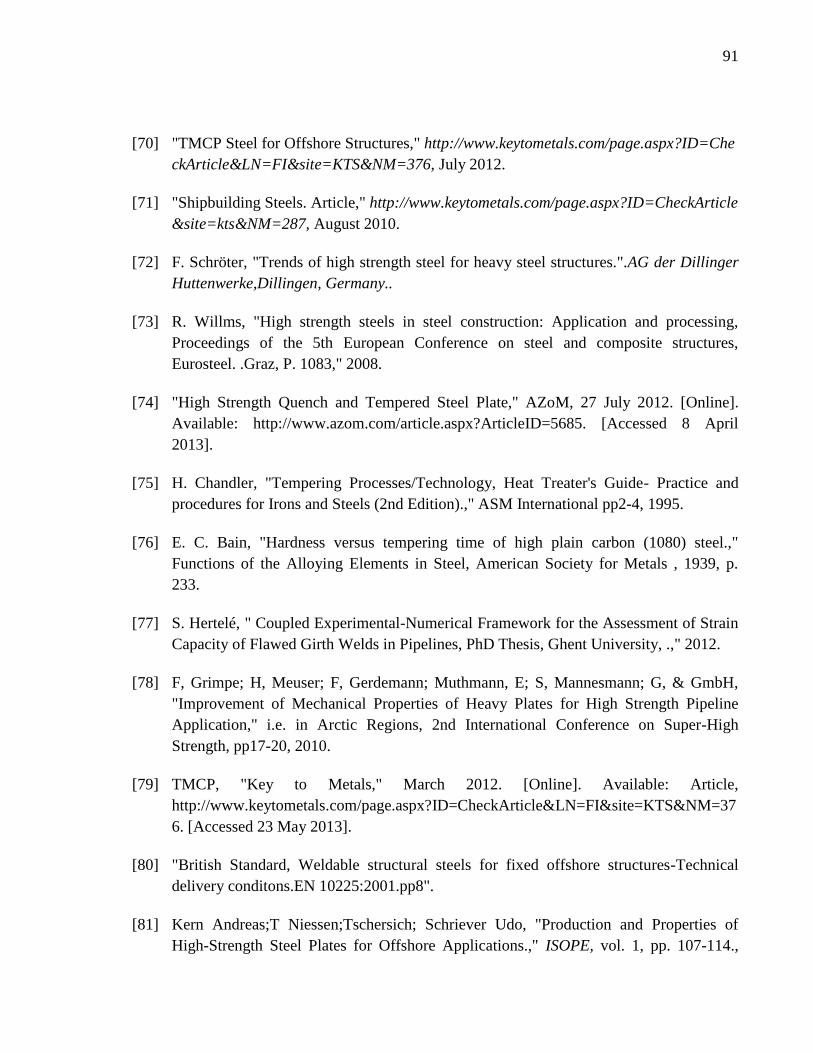
91
[70] "TMCP Steel for Offshore Structures," http://www.keytometals.com/page.aspx?ID=Che
ckArticle&LN=FI&site=KTS&NM=376, July 2012.
[71] "Shipbuilding Steels. Article," http://www.keytometals.com/page.aspx?ID=CheckArticle
&site=kts&NM=287, August 2010.
[72] F. Schröter, "Trends of high strength steel for heavy steel structures.".AG der Dillinger
Huttenwerke,Dillingen, Germany..
[73] R. Willms, "High strength steels in steel construction: Application and processing,
Proceedings of the 5th European Conference on steel and composite structures,
Eurosteel. .Graz, P. 1083," 2008.
[74] "High Strength Quench and Tempered Steel Plate," AZoM, 27 July 2012. [Online].
Available: http://www.azom.com/article.aspx?ArticleID=5685. [Accessed 8 April
2013].
[75] H. Chandler, "Tempering Processes/Technology, Heat Treater's Guide- Practice and
procedures for Irons and Steels (2nd Edition).," ASM International pp2-4, 1995.
[76] E. C. Bain, "Hardness versus tempering time of high plain carbon (1080) steel.,"
Functions of the Alloying Elements in Steel, American Society for Metals , 1939, p.
233.
[77] S. Hertelé, " Coupled Experimental-Numerical Framework for the Assessment of Strain
Capacity of Flawed Girth Welds in Pipelines, PhD Thesis, Ghent University, .," 2012.
[78] F, Grimpe; H, Meuser; F, Gerdemann; Muthmann, E; S, Mannesmann; G, & GmbH,
"Improvement of Mechanical Properties of Heavy Plates for High Strength Pipeline
Application," i.e. in Arctic Regions, 2nd International Conference on Super-High
Strength, pp17-20, 2010.
[79] TMCP, "Key to Metals," March 2012. [Online]. Available: Article,
http://www.keytometals.com/page.aspx?ID=CheckArticle&LN=FI&site=KTS&NM=37
6. [Accessed 23 May 2013].
[80] "British Standard, Weldable structural steels for fixed offshore structures-Technical
delivery conditons.EN 10225:2001.pp8".
[81] Kern Andreas;T Niessen;Tschersich; Schriever Udo, "Production and Properties of
High-Strength Steel Plates for Offshore Applications.," ISOPE, vol. 1, pp. 107-114.,
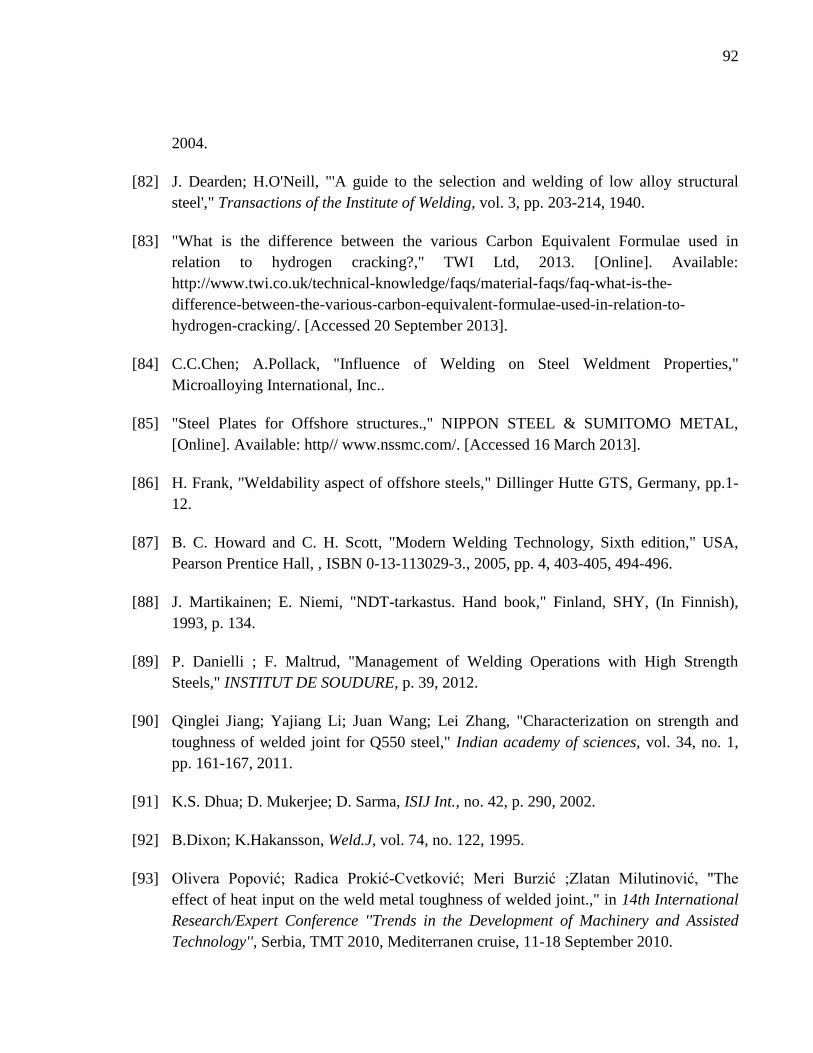
92
2004.
[82] J. Dearden; H.O'Neill, "'A guide to the selection and welding of low alloy structural
steel'," Transactions of the Institute of Welding, vol. 3, pp. 203-214, 1940.
[83] "What is the difference between the various Carbon Equivalent Formulae used in
relation to hydrogen cracking?," TWI Ltd, 2013. [Online]. Available:
http://www.twi.co.uk/technical-knowledge/faqs/material-faqs/faq-what-is-the-
difference-between-the-various-carbon-equivalent-formulae-used-in-relation-to-
hydrogen-cracking/. [Accessed 20 September 2013].
[84] C.C.Chen; A.Pollack, "Influence of Welding on Steel Weldment Properties,"
Microalloying International, Inc..
[85] "Steel Plates for Offshore structures.," NIPPON STEEL & SUMITOMO METAL,
[Online]. Available: http// www.nssmc.com/. [Accessed 16 March 2013].
[86] H. Frank, "Weldability aspect of offshore steels," Dillinger Hutte GTS, Germany, pp.1-
12.
[87] B. C. Howard and C. H. Scott, "Modern Welding Technology, Sixth edition," USA,
Pearson Prentice Hall, , ISBN 0-13-113029-3., 2005, pp. 4, 403-405, 494-496.
[88] J. Martikainen; E. Niemi, "NDT-tarkastus. Hand book," Finland, SHY, (In Finnish),
1993, p. 134.
[89] P. Danielli ; F. Maltrud, "Management of Welding Operations with High Strength
Steels," INSTITUT DE SOUDURE, p. 39, 2012.
[90] Qinglei Jiang; Yajiang Li; Juan Wang; Lei Zhang, "Characterization on strength and
toughness of welded joint for Q550 steel," Indian academy of sciences, vol. 34, no. 1,
pp. 161-167, 2011.
[91] K.S. Dhua; D. Mukerjee; D. Sarma, ISIJ Int., no. 42, p. 290, 2002.
[92] B.Dixon; K.Hakansson, Weld.J, vol. 74, no. 122, 1995.
[93] Olivera Popović; Radica Prokić-Cvetković; Meri Burzić ;Zlatan Milutinović, "The
effect of heat input on the weld metal toughness of welded joint.," in 14th International
Research/Expert Conference ''Trends in the Development of Machinery and Assisted
Technology'', Serbia, TMT 2010, Mediterranen cruise, 11-18 September 2010.
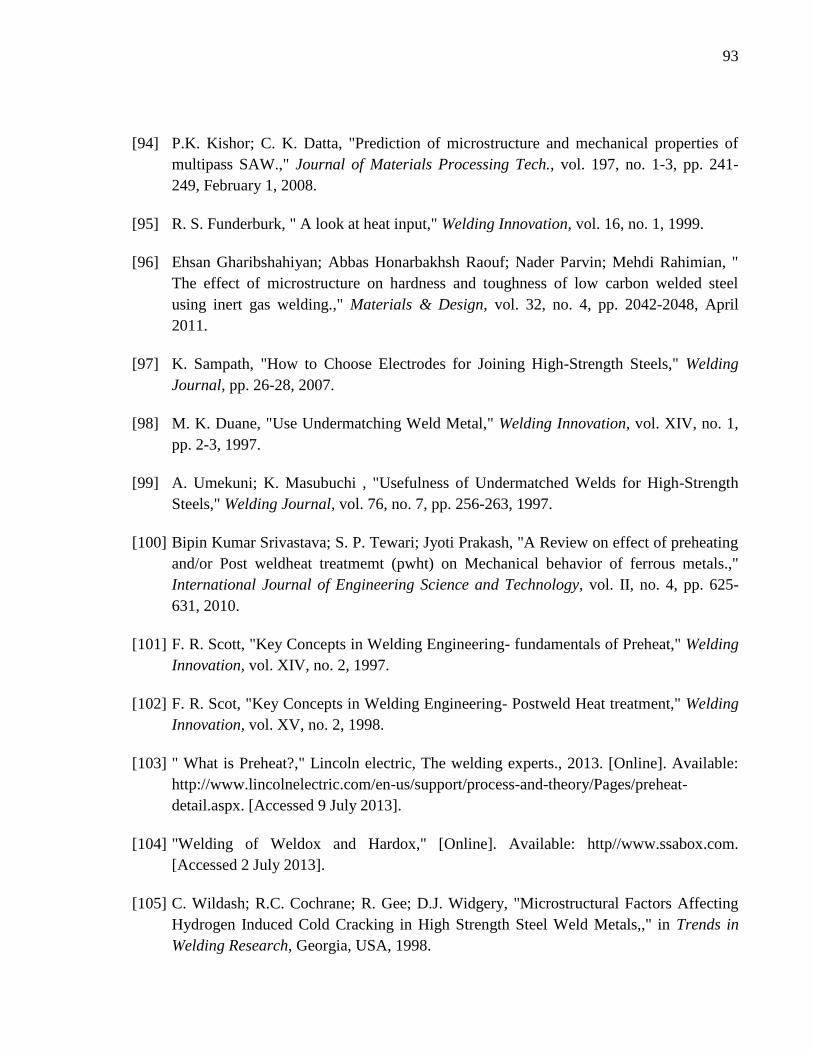
93
[94] P.K. Kishor; C. K. Datta, "Prediction of microstructure and mechanical properties of
multipass SAW.," Journal of Materials Processing Tech., vol. 197, no. 1-3, pp. 241-
249, February 1, 2008.
[95] R. S. Funderburk, " A look at heat input," Welding Innovation, vol. 16, no. 1, 1999.
[96] Ehsan Gharibshahiyan; Abbas Honarbakhsh Raouf; Nader Parvin; Mehdi Rahimian, "
The effect of microstructure on hardness and toughness of low carbon welded steel
using inert gas welding.," Materials & Design, vol. 32, no. 4, pp. 2042-2048, April
2011.
[97] K. Sampath, "How to Choose Electrodes for Joining High-Strength Steels," Welding
Journal, pp. 26-28, 2007.
[98] M. K. Duane, "Use Undermatching Weld Metal," Welding Innovation, vol. XIV, no. 1,
pp. 2-3, 1997.
[99] A. Umekuni; K. Masubuchi , "Usefulness of Undermatched Welds for High-Strength
Steels," Welding Journal, vol. 76, no. 7, pp. 256-263, 1997.
[100] Bipin Kumar Srivastava; S. P. Tewari; Jyoti Prakash, "A Review on effect of preheating
and/or Post weldheat treatmemt (pwht) on Mechanical behavior of ferrous metals.,"
International Journal of Engineering Science and Technology, vol. II, no. 4, pp. 625-
631, 2010.
[101] F. R. Scott, "Key Concepts in Welding Engineering- fundamentals of Preheat," Welding
Innovation, vol. XIV, no. 2, 1997.
[102] F. R. Scot, "Key Concepts in Welding Engineering- Postweld Heat treatment," Welding
Innovation, vol. XV, no. 2, 1998.
[103] " What is Preheat?," Lincoln electric, The welding experts., 2013. [Online]. Available:
http://www.lincolnelectric.com/en-us/support/process-and-theory/Pages/preheat-
detail.aspx. [Accessed 9 July 2013].
[104] "Welding of Weldox and Hardox," [Online]. Available: http//www.ssabox.com.
[Accessed 2 July 2013].
[105] C. Wildash; R.C. Cochrane; R. Gee; D.J. Widgery, "Microstructural Factors Affecting
Hydrogen Induced Cold Cracking in High Strength Steel Weld Metals,," in Trends in
Welding Research, Georgia, USA, 1998.
94
[106] W. A. Bruce, "A Simple Approach to Hot Tap and Repair Sleeve welding," in
International Pipeline Intergrity Conference, Welding Technology Institute of Australia,
Australia , 2005 pp. 43.
[107] "Charpy Impact Testing, Mechanical testing - notched bar or impact testing.," CMMOK
NDT & Inspection., 7 August 2011. [Online]. Available: http://www.scribd.com/doc/59
602072/Charpy-Testing. [Accessed 20 July 2013. pp. 5-17].
[108] "Mechanical Testing of Welds-Destructive Testing, Inspector’s Role, Charpy Impact
Testing," Heavy Engineering Research Association (HERA) Innovation in Metals, 2013.
[Online]. Available: http://www.hera.org.nz/Category?Action=View&Category_id=518.
[Accessed 18 July 2013].
[109] "Charpy Test - Determination of Impact Energy Using the Charpy Test," The "AZo
Journal of Materials Online"...AZoM.com, 11 June 2013. [Online]. Available:
AZoM.com, http://www.azom.com/article.aspx?ArticleID=2763. [Accessed 19 July
2013].
[110] J.G. Brnic; M.Turkalj; Canadija; D. Lanc; S. Krscanski, "Martensitic stainless steel AISI
420—mechanical properties, creep and fracture toughness," Mechanics of Time-
Dependent Materials, p. 341–352, 2011.
[111] R. Viswanathan, "Damage Mechanisms and Life Assessment of High Temperature
Components," USA, ASM International, 1995, p. 22.
[112] G. Mathers, "Job Knowledge: CTOD Testing. Article," TWI, May 2005. [Online].
Available: http://www.twi.co.uk/content/jk76.html.. [Accessed 24 July 2013].
[113] "Crack Tip Opening Displacement CTOD - A Fracture Mechanics Test Offered by
Element Materials Technology," The "AZo Journal of Materials Online"...AZoM.com,
11 June 2013. [Online]. Available: http://www.azom.com/article.aspx?ArticleID=3372#
_Crack_Tip_Opening_Displacement%20CTOD. [Accessed 24 July 2013].
[114] "The CTOD Test," Westmoreland Mechanical Testing & Research Inc. International ,
2007/2009. [Online]. Available: http://www.wmtr.com/Content/ctod.htm. [Accessed 25
July 2013].
[115] T. Wahono, "Crack Tip Opening Displacement Testing.," Materials review article, 11
March 2012. [Online]. Available: http://materialsreview.blogspot.fi/2012/03/crack-tip-
opening-displacement-testing.html. [Accessed 25 July 2013].
95
[116] KOBELCO, "CTOD," KOBELCO Welding today, vol. 8, no. 1, p. 9, January 2005.
[117] G. Mathers, "Compact tension and J integral tests, The Job Knowledge," 2005. [Online].
Available: http://www.twi.co.uk/technical-knowledge/job-knowledge/compact-tension-
and-j-integral-tests-077/. [Accessed 8 August 2013].
[118] "Drop Weight Test/Dynamic Tear Tests.ASTM E 436; E 604 & American Petroleum
Institute," INSTRON, USA.
[119] G. Mathers, "Job Knowledge:," Article on Compact tension and J integral tests, 2005.
[Online]. Available: http://www.twi.co.uk/technical knowledge/job knowledge/compact
-tension-and-j-integral-tests-077/.[Accessed 1 August 2013].
[120] "Introduction to mechanical testingtechniques. TWI Training & Examination Services,
TWI Ltd," 2013. [Online]. Available: http://www.twitraining.com/. [Accessed 13
August 2013].
[121] P. J. Keenan, "Thermal Insulation of Wet Shielded Metal Arc Weld.," Philadelphia,
Pennsylvania, 1993, p. 13.
[122] S.K. DHUA; D. MUKERJEE; D.S. SARMA, "Influence of Tempering on the
Microstructure and Mechanical properties of HSLA-100 Steel Plates,"
METALLURGICAL AND MATERIALS TRANSACTIONS A, vol. 32A, p. 2259—2270,
2001.

96