Embed Size (px)
DESCRIPTION
Pyrus elaeagnifolia Pallas. ssp. elaeagnifolia is a medicinal plant used in traditional medicine for the treatment of various diseases in Turkey. The leaves of Pyrus elaeagnifolia ssp. elaeagnifolia are a rich source of arbutin, which is a naturally occurring derivative of hydroquinone. It is found in various plant species belonging to diverse families, such as Lamiaceae, Ericaceae, Saxifragaceae and Rosaceae. It inhibits tyrosinase and has been employed as a cosmetic skin whitening agent. In this study, Response Surface Methodology (RSM) using a Box Behnken Design (BBD) was employed to optimize the condition for extraction of arbutin from the leaves of Pyrus elaeagnifolia ssp. elaeagnifolia. Three influencing factors; methanol concentration, period of ultrasoundassisted extraction and extraction temperature were investigated in the ultrasonic aqueous extraction.
Citation preview
Mehtap Donmez Sahin Int. Journal of Engineering Research and Applications www.ijera.com
ISSN: 2248-9622, Vol. 6, Issue 1, (Part - 4) January 2016, pp.79-89
www.ijera.com 79 | P a g e
Optimization of Ultrasound-Assisted Extraction of Arbutin from
Leaves of Pyrus elaeagnifolia Pallas ssp. elaeagnifolia (Rosaceae)
by Response Surface Methodology
Mehtap DONMEZ SAHIN*, Ibrahim BULDUK* * Uşak University, Health Care Education, Research and Application Center, 64200, Uşak, Turkey
(Email: [email protected])
(Email: [email protected])
ABSTRACT
Pyrus elaeagnifolia Pallas. ssp. elaeagnifolia is a medicinal plant used in traditional medicine for the treatment
of various diseases in Turkey. The leaves of Pyrus elaeagnifolia ssp. elaeagnifolia are a rich source of arbutin,
which is a naturally occurring derivative of hydroquinone. It is found in various plant species belonging to
diverse families, such as Lamiaceae, Ericaceae, Saxifragaceae and Rosaceae. It inhibits tyrosinase and has
been employed as a cosmetic skin whitening agent. In this study, Response Surface Methodology (RSM) using a
Box Behnken Design (BBD) was employed to optimize the condition for extraction of arbutin from the leaves of
Pyrus elaeagnifolia ssp. elaeagnifolia. Three influencing factors; methanol concentration, period of ultrasound-
assisted extraction and extraction temperature were investigated in the ultrasonic aqueous extraction. The
Response Surface Methodology was applied to optimize the extraction process focused on arbutin content with
respect to the above influencing factors. The best combination of each significant factor was determined by
RSM design and optimum pretreatment conditions for maximum arbutin content were established to be
methanol concentration of 48.54 %, extraction time of 39.32 min. And extraction temperature of 43.71 0C.
Under these conditions 5.37 % of arbutin content was observed experimentally, similar to the theoretical
prediction of 5.30 %.
Keywords - Arbutin, Extraction, Optimization, Pyrus elaeagnifolia ssp. elaeagnifolia, RSM.
I. INTRODUCTION Pyrus elaeagnifolia ssp. elaeagnifolia is a
species of pear that belongs to the plant family
Rosacea It is native to Albania, Bulgaria, Greece,
Romania, Turkey, and Ukraine's Crimea(1). The
plants are medium-sized trees that can reach 5 m in
height. The leaves are glosssy green and oval. The
pear leaves are useful for treatment of inflamation of
the bladder, bacteriuria, high blood pressure and
urinary stones. They also have diuretic properties(2).
The leaves of this tree contain a considerable
amount of arbutin (hydroquinone- ß-D-
glucopyranoside), a naturally occurring derivative of
hydroquinone (3). Arbutin is found in various plant
species belonging to diverse families, such as the
Ericaceae, Lamicaceae, Saxifragaceae and
Rosaceae(4). Its tyrosinase-inhibiting qualities have
made arbutin (4-hydroxyphenyl glucopyranoside) to
be widely used as a whitening agent in many
cosmetics(5–9) Arbutin inhibits tyrosinase and has
been employed as a cosmetic skin-whitening agent in
humans (10). It has been shown to have antioxidant
and free radical scavenging properties (11), as well as
bactericidal and antifungal effects (10). Extracting
arbutin from pear has recently attracked considerable
interest. Species and parts of pear from which arbutin
has been extracted are Pyrus pyrifolia Nakai (fruit
peel) (12) P. pyrifolia Niitaka (fruit peel),13) Pyrus
biossieriana Buhse (leaves)(14,15) four species of
oriental pear (Pyrus bretschnrideri, P. pyrifolia, Pyrus
ussuriensis, and Pyrus sinkiangensis), and one
species of occidental pear (the flowers, buds, and
young fruits of P. communis(16).
The content of arbutin was determined in plant
extracts by many methods: spectrophotometric (17),
capillary zone electrophoresis (18), densitometric
(19), GC/MS (20). Reversed-phase HPLC was found
to be the more suitable chromatographic method for
arbutin separation (21, 22, 17). To our knowledge,
there is no single validated HPLC method which was
developed for the quantification of arbutin in many
different plant extracts.
Many factors such as solvent composition,
extraction time, extraction temperature (23), solvent
to solid ratio (24) and extraction pressure (25),
among others, may significantly influence the
extraction efficacy. In general, optimization of a
process could be achieved by either empirical or
statistical methods; the former having limitations
toward complete optimization. The traditional one-
factor-at-a-time approach to process optimization is
time consuming. Moreover, the interactions among
RESEARCH ARTICLE OPEN ACCESS
Mehtap Donmez Sahin Int. Journal of Engineering Research and Applications www.ijera.com
ISSN: 2248-9622, Vol. 6, Issue 1, (Part - 4) January 2016, pp.79-89
www.ijera.com 80 | P a g e
various factors may be ignored hence the chance of
approaching a true optimum is very unlikely. Thus,
one-factor-at-a-time procedure assumes that various
parameters do not interact, thus the process response
is a direct function of the single varied parameter.
However, the actual response of the process results
from the interactive influence of various variables.
Unlike conventional optimization, the statistical
optimization procedures allow one to take interaction
of variables into consideration (26).
Response surface methodology (RSM),
originally described by Box and Wilson (27), enables
evaluation of the effects of several process variables
and their interactions on response variables. Thus,
RSM is a collection of statistical and mathematical
techniques that has been successfully used for
developing, improving and optimizing processes
(28). Response surface methodology has been
successfully used to model and optimize biochemical
and biotechnological processes related to food
systems (29, 30, 31, 32, 33 and 34) including
extraction of phenolic compounds from berries
(24 and 29) and evening primrose meal (23),
anthocyanins from black currants (24) and sunflower
hull (35) and vitamin E from wheat germ (36),
among others.
In present work, conditions of extraction and
chromatographic parameters have been combined in
order to establish a simpler, faster and cheaper
method fort the extraction and HPLC determination
of arbutin in a variety of raw material. Optimization
of experimental conditions that results in the highest
arbutin content of Pyrus elaeagnifolia ssp.
elaeagnifolia leaves extracts was conducted. The
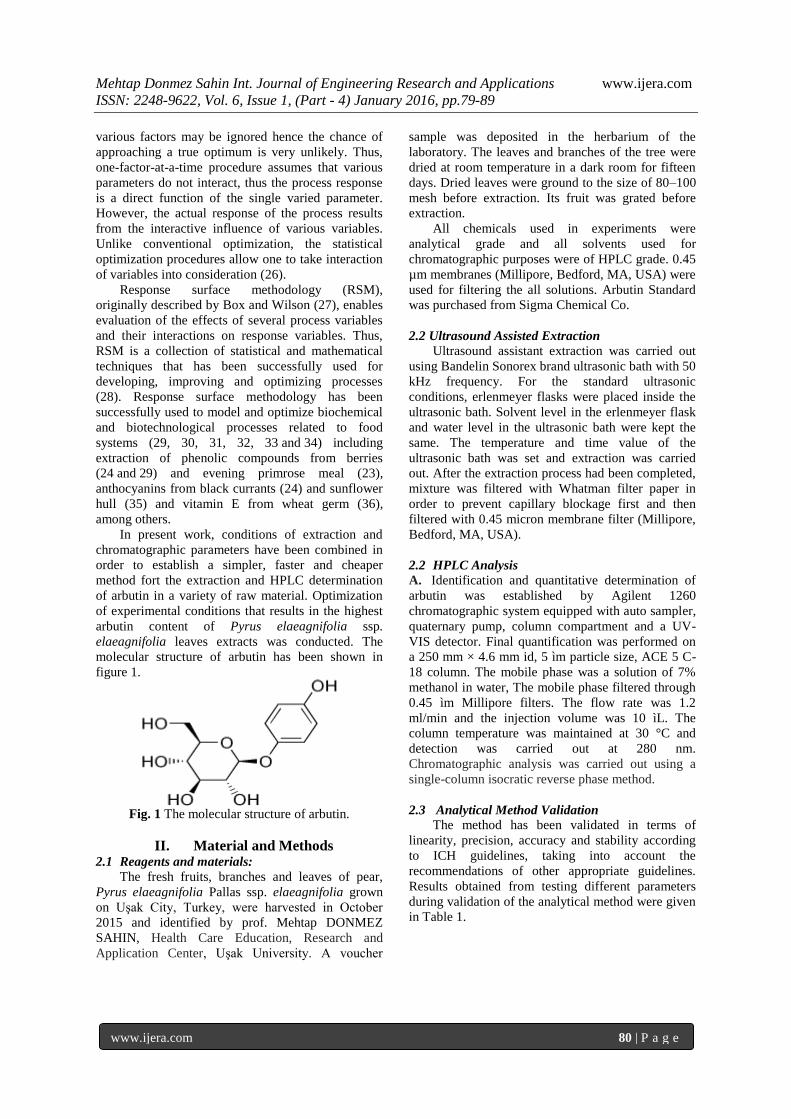
molecular structure of arbutin has been shown in
figure 1.
Fig. 1 The molecular structure of arbutin.
II. Material and Methods 2.1 Reagents and materials:
The fresh fruits, branches and leaves of pear,
Pyrus elaeagnifolia Pallas ssp. elaeagnifolia grown
on Uşak City, Turkey, were harvested in October
2015 and identified by prof. Mehtap DONMEZ
SAHIN, Health Care Education, Research and
Application Center, Uşak University. A voucher
sample was deposited in the herbarium of the
laboratory. The leaves and branches of the tree were
dried at room temperature in a dark room for fifteen
days. Dried leaves were ground to the size of 80–100
mesh before extraction. Its fruit was grated before
extraction.
All chemicals used in experiments were
analytical grade and all solvents used for
chromatographic purposes were of HPLC grade. 0.45
µm membranes (Millipore, Bedford, MA, USA) were
used for filtering the all solutions. Arbutin Standard
was purchased from Sigma Chemical Co.
2.2 Ultrasound Assisted Extraction
Ultrasound assistant extraction was carried out
using Bandelin Sonorex brand ultrasonic bath with 50
kHz frequency. For the standard ultrasonic
conditions, erlenmeyer flasks were placed inside the
ultrasonic bath. Solvent level in the erlenmeyer flask
and water level in the ultrasonic bath were kept the
same. The temperature and time value of the
ultrasonic bath was set and extraction was carried
out. After the extraction process had been completed,
mixture was filtered with Whatman filter paper in
order to prevent capillary blockage first and then
filtered with 0.45 micron membrane filter (Millipore,
Bedford, MA, USA).
2.2 HPLC Analysis
A. Identification and quantitative determination of
arbutin was established by Agilent 1260
chromatographic system equipped with auto sampler,
quaternary pump, column compartment and a UV-
VIS detector. Final quantification was performed on
a 250 mm × 4.6 mm id, 5 ìm particle size, ACE 5 C-
18 column. The mobile phase was a solution of 7%
methanol in water, The mobile phase filtered through
0.45 ìm Millipore filters. The flow rate was 1.2
ml/min and the injection volume was 10 ìL. The
column temperature was maintained at 30 °C and
detection was carried out at 280 nm.
Chromatographic analysis was carried out using a
single-column isocratic reverse phase method.
2.3 Analytical Method Validation
The method has been validated in terms of
linearity, precision, accuracy and stability according
to ICH guidelines, taking into account the
recommendations of other appropriate guidelines.
Results obtained from testing different parameters
during validation of the analytical method were given
in Table 1.
Mehtap Donmez Sahin Int. Journal of Engineering Research and Applications www.ijera.com
ISSN: 2248-9622, Vol. 6, Issue 1, (Part - 4) January 2016, pp.79-89
www.ijera.com 81 | P a g e
Table 1. Results obtained from testing different parameters during validation of the analytical method.
Parameters Arbutin
Specifity Peak Purity Ratio 0.0010
Linearity Concentration Range (ppm) 40-200
Correlation Coefficient 0.99987
Intercept 1.81524
Slope 1.60321
LOD ( ppm) 0.891
LOQ ( ppm) 2.972
Retention Time (min.) 4.580
2.3.1 Standard Solution and Calibration Curves
Standard stock solution in water of arbutin was
prepared at the final concentration of 1000 𝜇g/ml for
arbutin. Before calibration, the stock solution was
diluted with water. The standard curve was prepared
over a concentration range of 40-200 𝜇g/ml for
arbutin with five different concentration levels.
Linearity for arbutin was plotted using linear
regression of the peak area versus concentration. The
coefficient of correlation (R2) was used to judge the
linearity. The dedection limits (LOD) and
quantitation limits (LOQ) for tested compound were
determined by the signal to noise (S/N) ratio (Table
1).
2.4 Response Surface Methodology (RSM)
The RSM with the Box-Behnken design was
then employed to design the experiment to
investigate the influence of three independent
parameters, temperature, time and methanol
concentration on the extraction of arbutin. Optimal
ranges of temperature (30-60 0C), time (20-60 min)
and methanol concentration (25-75 %) were
determined based on preliminary experiments. The
independent variables and their code variable levels
are shown in Table 2. To express the arbutin content
as a function of the independent variables, a second
order polynomial equation was used as follows and
previously described by Vuong et al.
(1)
Where various Xi values are independent variables
affecting the response Y: β0, βi, βii and βij are the
regression coefficient fort he intercept and the linear,
quadratic and interaction terms, respectively and k is
the number of variables.
Table 2. Treatment variables and their coded and actual values used for optimization of arbutin extraction from
Pyrus elaeagnifolia ssp. elaeagnifolia by using Box-Behnken design.
Independent
Parameters
Units Symbols of
the parameters
Coded Levels
-1 0 1
Extraction Temp. 0C (X1) 30 45 60
Extraction Time min (X2) 20 40 60
Methanol Concentration % (X3) 25 50 75
2.5 Statistical analysis
Statistical analysis on the means of triplicate
experiments was carried out using the analysis of
variance (ANOVA) procedure of the Instat® software
version 3.0 (GraphPad, San Diego, CA, USA).
Anova test was applied to identify the interaction
between the variables and the response using Design-
Expert program. Three replication analyses were
carried out for each sample. ANOVA test was
applied for identifying the interaction between the
variables and the response by using Design-Expert
program. The results of HPLC analysis were
expressed as means of extraction efficiency.
III. FIGURES AND TABLES RESULTS AND DİSCUSSİONS 3.1 Effect of process variables on the UAE
performance
Experimental conditions of Box-Behnken design
runs designed with Design Expert 9 are shown in
Table 2. Table 3 also displays the effects of
extraction temperature, extraction time and methanol
concentration on the extraction efficiency obtained
by UAE.
Mehtap Donmez Sahin Int. Journal of Engineering Research and Applications www.ijera.com
ISSN: 2248-9622, Vol. 6, Issue 1, (Part - 4) January 2016, pp.79-89
www.ijera.com 82 | P a g e
Table 3. Box-Behnken Design of the independent variables (X1, X2, X3) and experimental results for the EY
Run Ext. Temperature Ext. Time
Methanol
Concentration Arbutin Yield
0C min % %
1 45 40 50 5.20
2 30 20 50 3.96
3 45 60 75 4.15
4 45 20 25 4.36
5 30 60 50 4.02
6 60 60 50 3.83
7 60 40 25 3.87
8 45 40 50 5.37
9 45 40 50 5.30
10 60 20 50 3.82
11 45 60 25 4.13
12 60 40 75 3.33
13 45 40 50 5.34
14 45 20 75 4.25
15 30 40 75 4.08
16 30 40 25 4.07
17 45 40 50 5.26
*Data are expressed as the mean (n=3) .
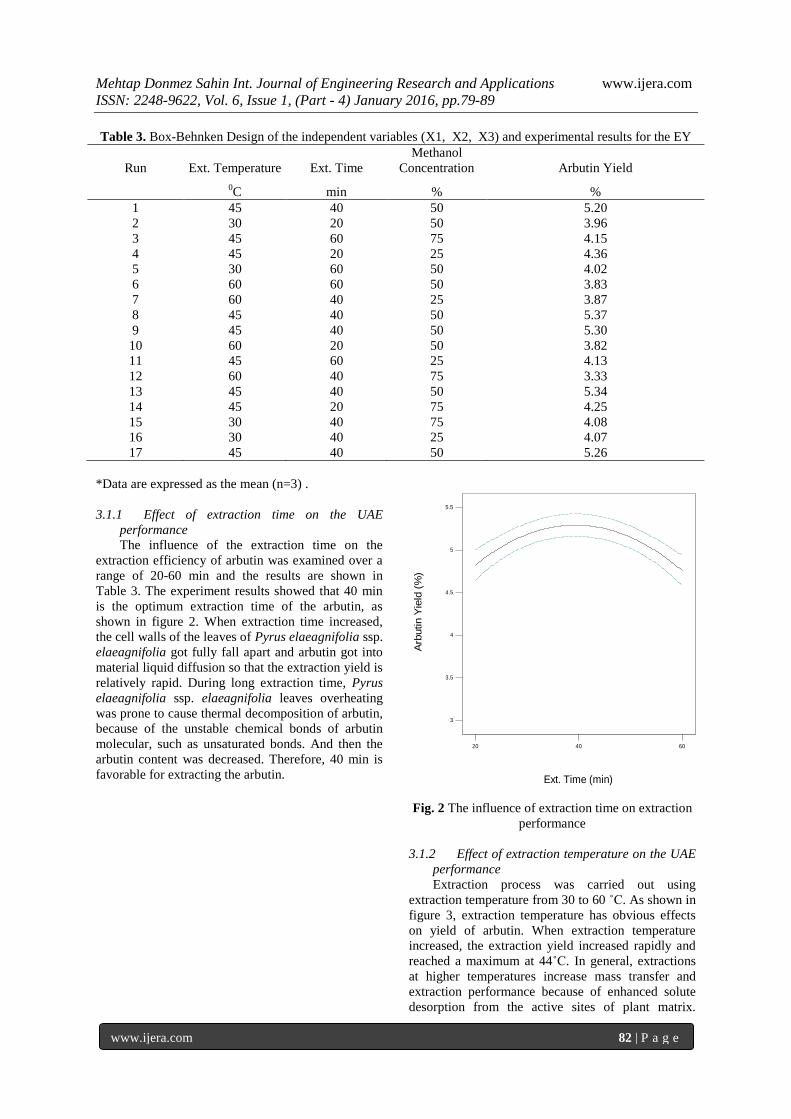
3.1.1 Effect of extraction time on the UAE
performance
The influence of the extraction time on the
extraction efficiency of arbutin was examined over a
range of 20-60 min and the results are shown in
Table 3. The experiment results showed that 40 min
is the optimum extraction time of the arbutin, as
shown in figure 2. When extraction time increased,
the cell walls of the leaves of Pyrus elaeagnifolia ssp.
elaeagnifolia got fully fall apart and arbutin got into
material liquid diffusion so that the extraction yield is
relatively rapid. During long extraction time, Pyrus
elaeagnifolia ssp. elaeagnifolia leaves overheating
was prone to cause thermal decomposition of arbutin,
because of the unstable chemical bonds of arbutin
molecular, such as unsaturated bonds. And then the
arbutin content was decreased. Therefore, 40 min is
favorable for extracting the arbutin.
Design-Expert® SoftwareFactor Coding: ActualArbutin Yield (%)
95% CI Bands
X1 = B: Ext. Time
Actual FactorsA: Ext. Temperature = 45.00C: Methanol Concentration = 50.00
Ext. Time (min)
20 40 60
Arb
utin Y
ield
(%
)
3
3.5
4
4.5
5
5.5
One Factor
Fig. 2 The influence of extraction time on extraction
performance
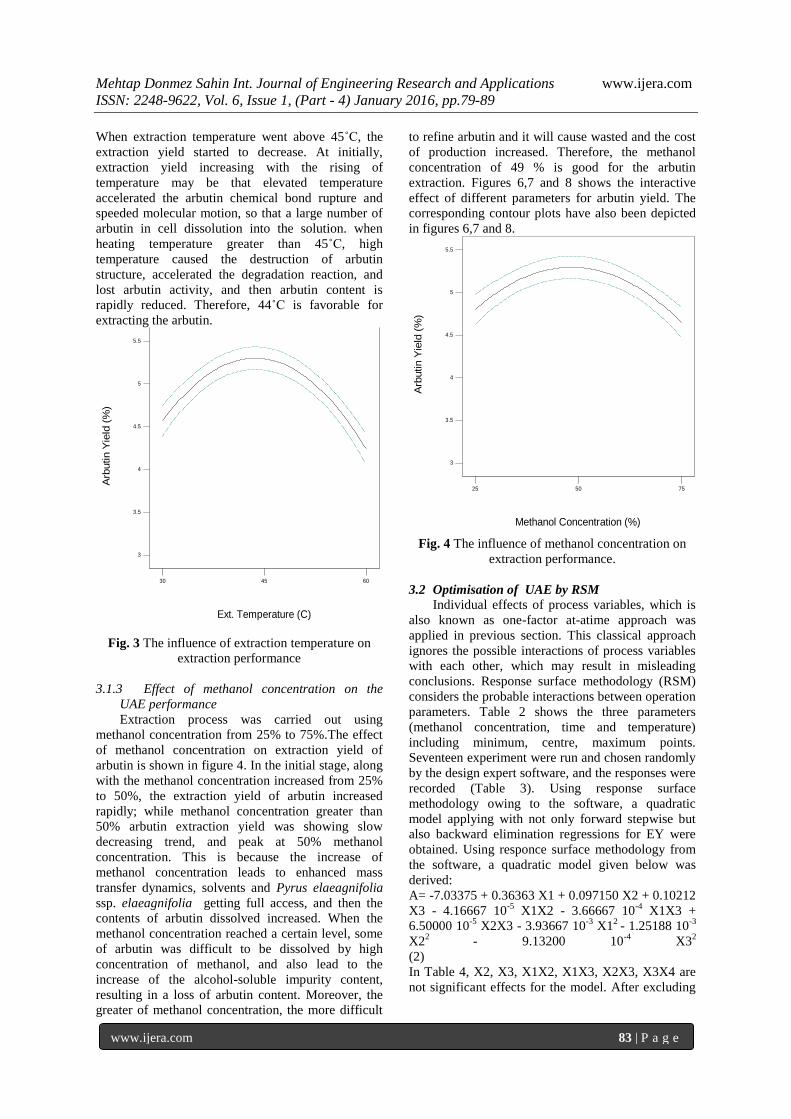
3.1.2 Effect of extraction temperature on the UAE
performance
Extraction process was carried out using
extraction temperature from 30 to 60 ˚C. As shown in
figure 3, extraction temperature has obvious effects
on yield of arbutin. When extraction temperature
increased, the extraction yield increased rapidly and
reached a maximum at 44˚C. In general, extractions
at higher temperatures increase mass transfer and
extraction performance because of enhanced solute
desorption from the active sites of plant matrix.
Mehtap Donmez Sahin Int. Journal of Engineering Research and Applications www.ijera.com
ISSN: 2248-9622, Vol. 6, Issue 1, (Part - 4) January 2016, pp.79-89
www.ijera.com 83 | P a g e
When extraction temperature went above 45˚C, the
extraction yield started to decrease. At initially,
extraction yield increasing with the rising of
temperature may be that elevated temperature
accelerated the arbutin chemical bond rupture and
speeded molecular motion, so that a large number of
arbutin in cell dissolution into the solution. when
heating temperature greater than 45˚C, high
temperature caused the destruction of arbutin
structure, accelerated the degradation reaction, and
lost arbutin activity, and then arbutin content is
rapidly reduced. Therefore, 44˚C is favorable for
extracting the arbutin. Design-Expert® SoftwareFactor Coding: ActualArbutin Yield (%)
95% CI Bands
X1 = A: Ext. Temperature
Actual FactorsB: Ext. Time = 40.00C: Methanol Concentration = 50.00
Ext. Temperature (C)
30 45 60
Arb
utin Y
ield
(%
)
3
3.5
4
4.5
5
5.5
One Factor
Fig. 3 The influence of extraction temperature on
extraction performance
3.1.3 Effect of methanol concentration on the
UAE performance
Extraction process was carried out using
methanol concentration from 25% to 75%.The effect
of methanol concentration on extraction yield of
arbutin is shown in figure 4. In the initial stage, along
with the methanol concentration increased from 25%
to 50%, the extraction yield of arbutin increased
rapidly; while methanol concentration greater than
50% arbutin extraction yield was showing slow
decreasing trend, and peak at 50% methanol
concentration. This is because the increase of
methanol concentration leads to enhanced mass
transfer dynamics, solvents and Pyrus elaeagnifolia
ssp. elaeagnifolia getting full access, and then the
contents of arbutin dissolved increased. When the
methanol concentration reached a certain level, some
of arbutin was difficult to be dissolved by high
concentration of methanol, and also lead to the
increase of the alcohol-soluble impurity content,
resulting in a loss of arbutin content. Moreover, the
greater of methanol concentration, the more difficult
to refine arbutin and it will cause wasted and the cost
of production increased. Therefore, the methanol
concentration of 49 % is good for the arbutin
extraction. Figures 6,7 and 8 shows the interactive
effect of different parameters for arbutin yield. The
corresponding contour plots have also been depicted
in figures 6,7 and 8. Design-Expert® SoftwareFactor Coding: ActualArbutin Yield (%)
95% CI Bands
X1 = C: Methanol Concentration
Actual FactorsA: Ext. Temperature = 45.00B: Ext. Time = 40.00
Methanol Concentration (%)
25 50 75
Arb
utin Y
ield
(%
)
3
3.5
4
4.5
5
5.5
One Factor
Fig. 4 The influence of methanol concentration on
extraction performance.
3.2 Optimisation of UAE by RSM
Individual effects of process variables, which is
also known as one-factor at-atime approach was
applied in previous section. This classical approach
ignores the possible interactions of process variables
with each other, which may result in misleading
conclusions. Response surface methodology (RSM)
considers the probable interactions between operation
parameters. Table 2 shows the three parameters
(methanol concentration, time and temperature)
including minimum, centre, maximum points.
Seventeen experiment were run and chosen randomly
by the design expert software, and the responses were
recorded (Table 3). Using response surface
methodology owing to the software, a quadratic
model applying with not only forward stepwise but
also backward elimination regressions for EY were
obtained. Using responce surface methodology from
the software, a quadratic model given below was
derived:
A= -7.03375 + 0.36363 X1 + 0.097150 X2 + 0.10212
X3 - 4.16667 10-5
X1X2 - 3.66667 10-4
X1X3 +
6.50000 10-5
X2X3 - 3.93667 10-3
X12
- 1.25188 10-3
X22
- 9.13200 10-4
X32
(2)
In Table 4, X2, X3, X1X2, X1X3, X2X3, X3X4 are
not significant effects for the model. After excluding
Mehtap Donmez Sahin Int. Journal of Engineering Research and Applications www.ijera.com
ISSN: 2248-9622, Vol. 6, Issue 1, (Part - 4) January 2016, pp.79-89
www.ijera.com 84 | P a g e
their regression coefficients, new model may be
given for better explanation of new condition.
A= -7.03375 + 0.36363 X1 - 3.93667 10-3
X12
-
1.25188 10-3
X22
- 9.13200 10-4
X32
(3)
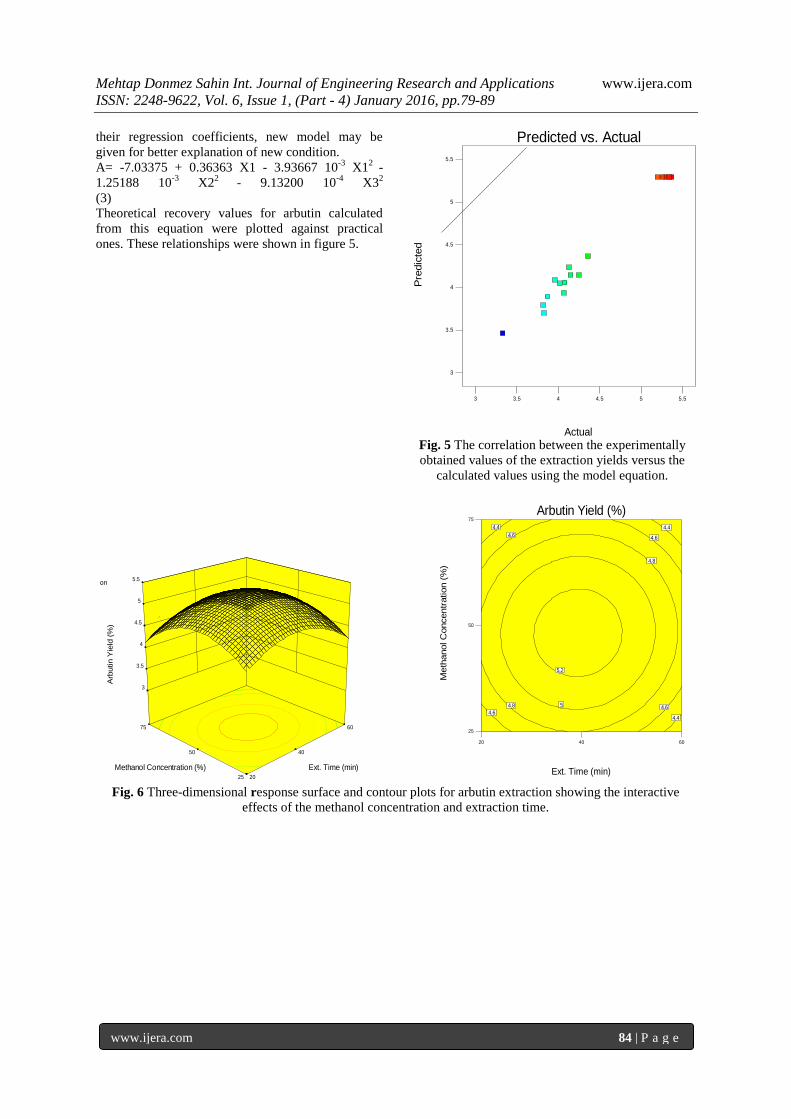
Theoretical recovery values for arbutin calculated
from this equation were plotted against practical
ones. These relationships were shown in figure 5.
Design-Expert® SoftwareArbutin Yield
Color points by value ofArbutin Yield:
5.37
3.33
Actual
Pre
dic
ted
Predicted vs. Actual
3
3.5
4
4.5
5
5.5
3 3.5 4 4.5 5 5.5
Fig. 5 The correlation between the experimentally
obtained values of the extraction yields versus the
calculated values using the model equation.
Design-Expert® SoftwareFactor Coding: ActualArbutin Yield (%)
5.37
3.33
X1 = B: Ext. TimeX2 = C: Methanol Concentration
Actual FactorA: Ext. Temperature = 45.00
25
50
75
20
40
60
3
3.5
4
4.5
5
5.5
Arb
utin Y
ield
(%
)
Ext. Time (min)Methanol Concentration (%)
Design-Expert® SoftwareFactor Coding: ActualArbutin Yield (%)
5.37
3.33
X1 = B: Ext. TimeX2 = C: Methanol Concentration
Actual FactorA: Ext. Temperature = 45.00
20 40 60
25
50
75
Arbutin Yield (%)
Ext. Time (min)
Meth
anol C
oncentr
ation (
%)
4.4
4.4 4.4
4.64.6
4.64.6
4.8
4.8
5
5.2
Fig. 6 Three-dimensional response surface and contour plots for arbutin extraction showing the interactive
effects of the methanol concentration and extraction time.
Mehtap Donmez Sahin Int. Journal of Engineering Research and Applications www.ijera.com
ISSN: 2248-9622, Vol. 6, Issue 1, (Part - 4) January 2016, pp.79-89
www.ijera.com 85 | P a g e
Design-Expert® SoftwareFactor Coding: ActualArbutin Yield (%)
5.37
3.33
X1 = A: Ext. TemperatureX2 = B: Ext. Time
Actual FactorC: Methanol Concentration = 50.00
20
40
60
30
45
60
3
3.5
4
4.5
5
5.5
Arb
utin Y
ield
(%
)
Ext. Temperature (C)Ext. Time (min)
Design-Expert® SoftwareFactor Coding: ActualArbutin Yield (%)
5.37
3.33
X1 = A: Ext. TemperatureX2 = B: Ext. Time
Actual FactorC: Methanol Concentration = 50.00
30 45 60
20
40
60
Arbutin Yield (%)
Ext. Temperature (C)
Ext
. T
ime (
min
)
4
4
4.5
4.5
4.5
5
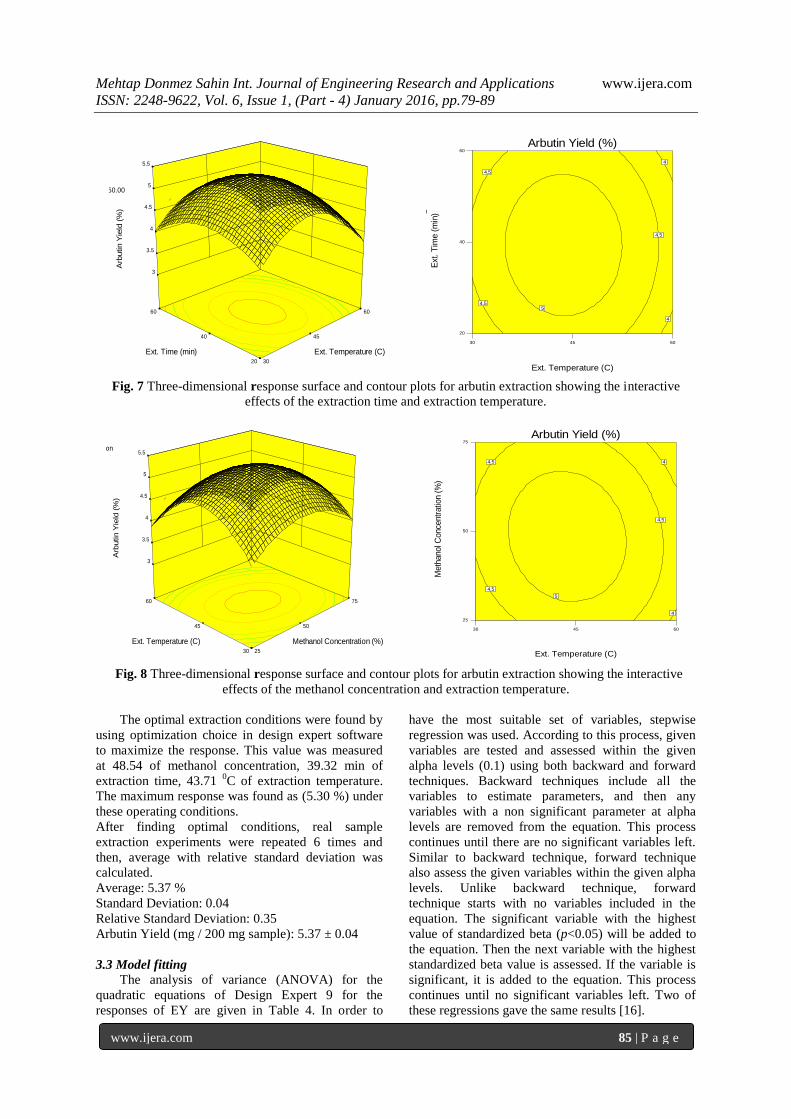
Fig. 7 Three-dimensional response surface and contour plots for arbutin extraction showing the interactive
effects of the extraction time and extraction temperature.
Design-Expert® SoftwareFactor Coding: ActualArbutin Yield (%)
5.37
3.33
X1 = C: Methanol ConcentrationX2 = A: Ext. Temperature
Actual FactorB: Ext. Time = 40.00
30
45
60
25
50
75
3
3.5
4
4.5
5
5.5
Arb
utin Y
ield
(%
)
Methanol Concentration (%)Ext. Temperature (C)
Design-Expert® SoftwareFactor Coding: ActualArbutin Yield (%)
5.37
3.33
X1 = A: Ext. TemperatureX2 = C: Methanol Concentration
Actual FactorB: Ext. Time = 40.00
30 45 60
25
50
75
Arbutin Yield (%)
Ext. Temperature (C)
Meth
anol C
once
ntr
atio
n (
%)
4
4
4.5
4.5
4.5
5
Fig. 8 Three-dimensional response surface and contour plots for arbutin extraction showing the interactive
effects of the methanol concentration and extraction temperature.
The optimal extraction conditions were found by
using optimization choice in design expert software
to maximize the response. This value was measured
at 48.54 of methanol concentration, 39.32 min of
extraction time, 43.71 0C of extraction temperature.
The maximum response was found as (5.30 %) under
these operating conditions.
After finding optimal conditions, real sample
extraction experiments were repeated 6 times and
then, average with relative standard deviation was
calculated.
Average: 5.37 %
Standard Deviation: 0.04
Relative Standard Deviation: 0.35
Arbutin Yield (mg / 200 mg sample): 5.37 ± 0.04
3.3 Model fitting
The analysis of variance (ANOVA) for the
quadratic equations of Design Expert 9 for the
responses of EY are given in Table 4. In order to
have the most suitable set of variables, stepwise
regression was used. According to this process, given
variables are tested and assessed within the given
alpha levels (0.1) using both backward and forward
techniques. Backward techniques include all the
variables to estimate parameters, and then any
variables with a non significant parameter at alpha
levels are removed from the equation. This process
continues until there are no significant variables left.
Similar to backward technique, forward technique
also assess the given variables within the given alpha
levels. Unlike backward technique, forward
technique starts with no variables included in the
equation. The significant variable with the highest
value of standardized beta (p<0.05) will be added to
the equation. Then the next variable with the highest
standardized beta value is assessed. If the variable is
significant, it is added to the equation. This process
continues until no significant variables left. Two of
these regressions gave the same results [16].
Mehtap Donmez Sahin Int. Journal of Engineering Research and Applications www.ijera.com
ISSN: 2248-9622, Vol. 6, Issue 1, (Part - 4) January 2016, pp.79-89
www.ijera.com 86 | P a g e
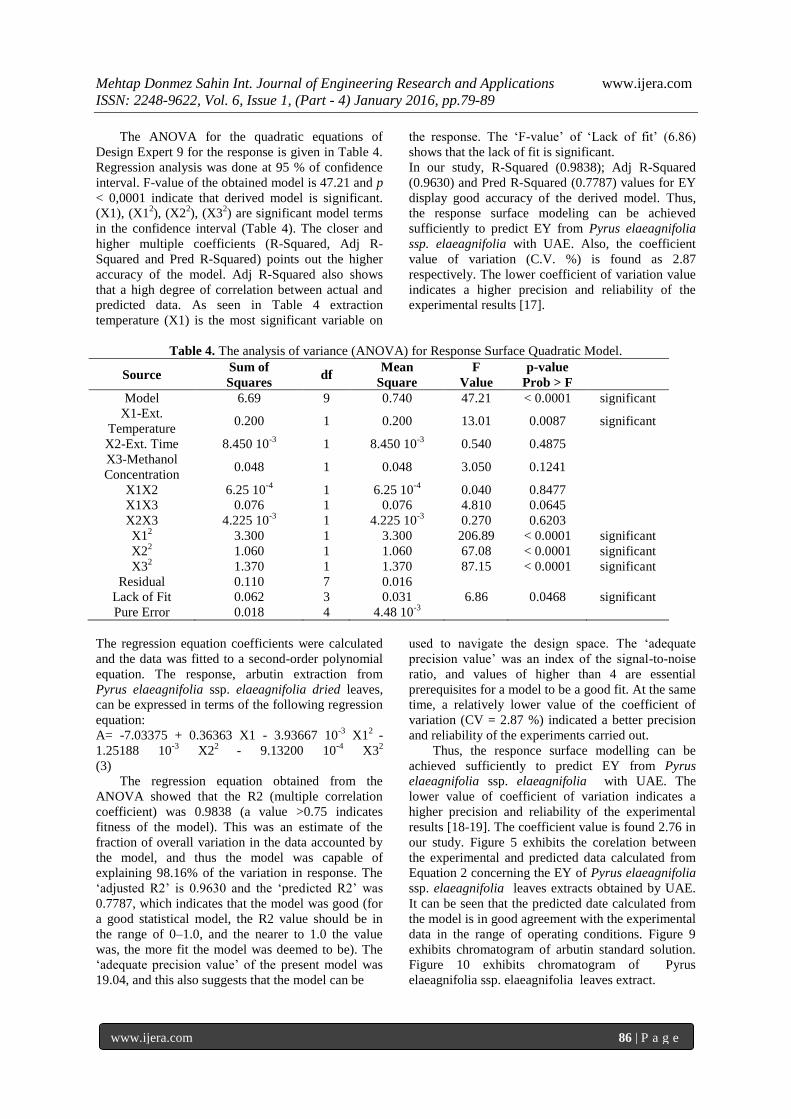
The ANOVA for the quadratic equations of
Design Expert 9 for the response is given in Table 4.
Regression analysis was done at 95 % of confidence
interval. F-value of the obtained model is 47.21 and p
< 0,0001 indicate that derived model is significant.
(X1), (X12), (X2
2), (X3
2) are significant model terms
in the confidence interval (Table 4). The closer and
higher multiple coefficients (R-Squared, Adj R-
Squared and Pred R-Squared) points out the higher
accuracy of the model. Adj R-Squared also shows
that a high degree of correlation between actual and
predicted data. As seen in Table 4 extraction
temperature (X1) is the most significant variable on
the response. The ‘F-value’ of ‘Lack of fit’ (6.86)
shows that the lack of fit is significant.
In our study, R-Squared (0.9838); Adj R-Squared
(0.9630) and Pred R-Squared (0.7787) values for EY
display good accuracy of the derived model. Thus,
the response surface modeling can be achieved
sufficiently to predict EY from Pyrus elaeagnifolia
ssp. elaeagnifolia with UAE. Also, the coefficient
value of variation (C.V. %) is found as 2.87
respectively. The lower coefficient of variation value
indicates a higher precision and reliability of the
experimental results [17].
Table 4. The analysis of variance (ANOVA) for Response Surface Quadratic Model.
Source Sum of
Squares df
Mean
Square
F
Value
p-value
Prob > F
Model 6.69 9 0.740 47.21 < 0.0001 significant
X1-Ext.
Temperature 0.200 1 0.200 13.01 0.0087 significant
X2-Ext. Time 8.450 10-3
1 8.450 10-3
0.540 0.4875
X3-Methanol
Concentration 0.048 1 0.048 3.050 0.1241
X1X2 6.25 10-4
1 6.25 10-4
0.040 0.8477
X1X3 0.076 1 0.076 4.810 0.0645
X2X3 4.225 10-3
1 4.225 10-3
0.270 0.6203
X12 3.300 1 3.300 206.89 < 0.0001 significant
X22 1.060 1 1.060 67.08 < 0.0001 significant
X32 1.370 1 1.370 87.15 < 0.0001 significant
Residual 0.110 7 0.016
Lack of Fit 0.062 3 0.031 6.86 0.0468 significant
Pure Error 0.018 4 4.48 10-3
The regression equation coefficients were calculated
and the data was fitted to a second-order polynomial
equation. The response, arbutin extraction from
Pyrus elaeagnifolia ssp. elaeagnifolia dried leaves,
can be expressed in terms of the following regression
equation:
A= -7.03375 + 0.36363 X1 - 3.93667 10-3
X12
-
1.25188 10-3
X22
- 9.13200 10-4
X32
(3)
The regression equation obtained from the
ANOVA showed that the R2 (multiple correlation
coefficient) was 0.9838 (a value >0.75 indicates
fitness of the model). This was an estimate of the
fraction of overall variation in the data accounted by
the model, and thus the model was capable of
explaining 98.16% of the variation in response. The
‘adjusted R2’ is 0.9630 and the ‘predicted R2’ was
0.7787, which indicates that the model was good (for
a good statistical model, the R2 value should be in
the range of 0–1.0, and the nearer to 1.0 the value
was, the more fit the model was deemed to be). The
‘adequate precision value’ of the present model was
19.04, and this also suggests that the model can be
used to navigate the design space. The ‘adequate
precision value’ was an index of the signal-to-noise
ratio, and values of higher than 4 are essential
prerequisites for a model to be a good fit. At the same
time, a relatively lower value of the coefficient of
variation (CV = 2.87 %) indicated a better precision
and reliability of the experiments carried out.
Thus, the responce surface modelling can be
achieved sufficiently to predict EY from Pyrus
elaeagnifolia ssp. elaeagnifolia with UAE. The
lower value of coefficient of variation indicates a
higher precision and reliability of the experimental
results [18-19]. The coefficient value is found 2.76 in
our study. Figure 5 exhibits the corelation between
the experimental and predicted data calculated from
Equation 2 concerning the EY of Pyrus elaeagnifolia
ssp. elaeagnifolia leaves extracts obtained by UAE.
It can be seen that the predicted date calculated from
the model is in good agreement with the experimental
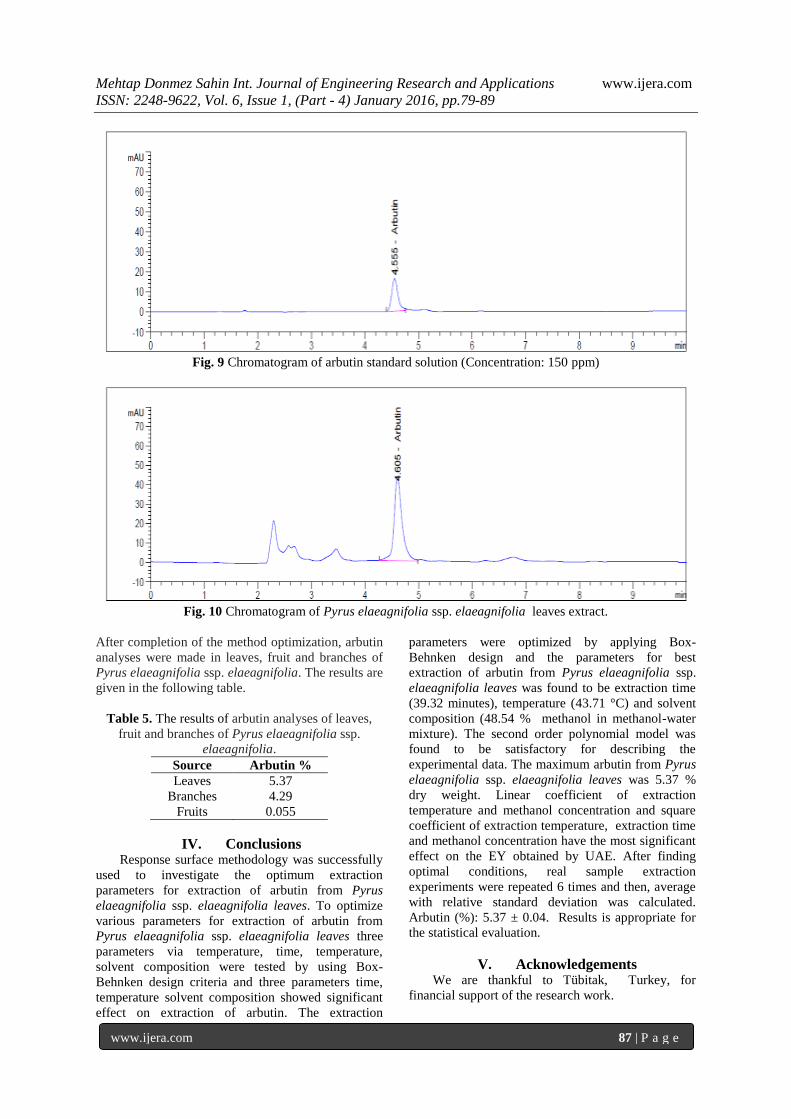
data in the range of operating conditions. Figure 9
exhibits chromatogram of arbutin standard solution.
Figure 10 exhibits chromatogram of Pyrus
elaeagnifolia ssp. elaeagnifolia leaves extract.
Mehtap Donmez Sahin Int. Journal of Engineering Research and Applications www.ijera.com
ISSN: 2248-9622, Vol. 6, Issue 1, (Part - 4) January 2016, pp.79-89
www.ijera.com 87 | P a g e
Fig. 9 Chromatogram of arbutin standard solution (Concentration: 150 ppm)
Fig. 10 Chromatogram of Pyrus elaeagnifolia ssp. elaeagnifolia leaves extract.
After completion of the method optimization, arbutin
analyses were made in leaves, fruit and branches of
Pyrus elaeagnifolia ssp. elaeagnifolia. The results are
given in the following table.
Table 5. The results of arbutin analyses of leaves,
fruit and branches of Pyrus elaeagnifolia ssp.
elaeagnifolia.
Source Arbutin %
Leaves 5.37
Branches 4.29
Fruits 0.055
IV. Conclusions Response surface methodology was successfully
used to investigate the optimum extraction
parameters for extraction of arbutin from Pyrus
elaeagnifolia ssp. elaeagnifolia leaves. To optimize
various parameters for extraction of arbutin from
Pyrus elaeagnifolia ssp. elaeagnifolia leaves three
parameters via temperature, time, temperature,
solvent composition were tested by using Box-
Behnken design criteria and three parameters time,
temperature solvent composition showed significant
effect on extraction of arbutin. The extraction
parameters were optimized by applying Box-
Behnken design and the parameters for best
extraction of arbutin from Pyrus elaeagnifolia ssp.
elaeagnifolia leaves was found to be extraction time
(39.32 minutes), temperature (43.71 °C) and solvent
composition (48.54 % methanol in methanol-water
mixture). The second order polynomial model was
found to be satisfactory for describing the
experimental data. The maximum arbutin from Pyrus
elaeagnifolia ssp. elaeagnifolia leaves was 5.37 %
dry weight. Linear coefficient of extraction
temperature and methanol concentration and square
coefficient of extraction temperature, extraction time
and methanol concentration have the most significant
effect on the EY obtained by UAE. After finding
optimal conditions, real sample extraction
experiments were repeated 6 times and then, average
with relative standard deviation was calculated.
Arbutin (%): 5.37 ± 0.04. Results is appropriate for
the statistical evaluation.
V. Acknowledgements We are thankful to Tübitak, Turkey, for
financial support of the research work.
Mehtap Donmez Sahin Int. Journal of Engineering Research and Applications www.ijera.com
ISSN: 2248-9622, Vol. 6, Issue 1, (Part - 4) January 2016, pp.79-89
www.ijera.com 88 | P a g e
Conflict of Interests
The authors declare that there is no conflict of
interests regarding the publication of this paper.
REFERENCES [1.] Grin. "Pyrus elaeagnifolia ssp. elaeagnifolia
Pall.". Taxonomy for Plants. National
Germplasm Resources Laboratory,
Beltsville, Maryland: USDA, ARS, National
Genetic Resources Program. Retrieved
January 29, 2014. (May 10,
2012).(https://en.wikipedia.org/wiki/Pyrus_
elaeagrifolia.15.01.2016)
[2.] Zargari, A. Medicinal plants (6th ed.).
Tehran: Tehran University Publications.
(1996).
[3.] Azadbakht, M., Marston, A., Hostettmann,
K., Ramezani, M., & Jahromi, MBiological
activity of leaf extract and phenolglycoside
arbutin of Pyrus boissieriana Buhse. Journal
of Medicinal Plants, 3, 9–14. (2004).
[4.] Rychlinska,İ., Nowak, S. ‘Quantitative
Determination of Arbutin and Hydroquinone
in Different Plant Materials by HPLC’
Notulae Botanicae Horti AgrobotaniciCluj-
Napoca, Not Bot Horti Agrobo, 40(2): 109-
113. 2012.
[5.] Funayama M, Arakawa H, Yamamoto R,
Nishino H, Shin T, Murao S. Effects of
alpha- and beta-arbutin on activiety of
tyrosinases from mushroom and mouse
melanoma. Biosci. Biotechnol. Biochem.
1995;59:143–144.
[6.] Nihei K, Kubo I. Identification of oxidation
product of arbutin in mushroom tyrosinase
assay system. Bioorg. Med. Chem. Lett.
2003;13:2409–2412.
[7.] Nishimura T, Kometani T, Okada S, Ueno
N, Yamamoto T. Inhibitory effects of
hydroquinone-alpha-glucoside on melanin
synthesis. Yakugaku Zasshi (in Japanese).
1995;115:626–632.
[8.] Sugimoto K, Nishimura T, Nomura K,
Sugimoto K, Kuriki T. Inhibitory effects of
alpha-arbutin on melanin synthesis in
cultured human melanoma cells and a three-
dimensional human skin model. Biol.
Pharm. Bull. 2004;27:510–514.
[9.] Tomita K, Fukuda M, Kawasai K.
Mechanism of arbutin inhibitory effect on
melanogenesis and effect on the human skin
with cosmetic use. Fragrance J. 1990;18:72–
77.
[10.] Petkou, D., Diamantidis, G., & Vasilakakis,
M. Arbutin oxidation by pear (Pyrus
elaeagnifolia ssp. elaeagnifolia L.)
peroxidases. Plant Science, 162(1), 115–
119. (2002).
[11.] Myagmar, B. E., Shinno, E., Ichiba, T., &
Aniya, Y. Antioxidant activity of medicinal
herb Rhodococcum vitis-idaea on
galactosamine-induced liver injury in rats.
Phytomedicine, 11(5), 416–423.(2004)
[12.] Cho JY, Park KY, Lee KH, Lee HJ, Lee SH,
Cho JA, Kim WS, Shin SC, Park KH, Moon
JH. Recovery of arbutin in high purity from
fuit peels of pear (Pyrus pyrifolia Nakai).
Food Sci. Biotechnol. 2011;20:801–807.
[13.] Lee BD, Eun JB. Optimum extraction
conditions for arbutin from asian pear peel
by supercritical fluid extraction (SFE) using
Box-Behnken design. J. Med. Plants Res.
2012;6:2348–2364.
[14.] Azadbakht M, Marstonm A, Hostettmann K,
Ramezani M, Jahromi M. Biological activity
of leaf extract and phenolglycoside arbutin
of Pyrus boissieriana Buhse. J. Med.
Plants.2004;3:9–14.
[15.] Shahaboddin ME, Pouramir M,
Moghadamnia AA, Parsian H, Lakzaei M,
Mir H. Pyrus biossieriana Buhse leaf
extract: An antioxidant, antihyperglycaemic
and antihyperlipidemic agent. Food Chem.
2011;126:1730–1733.
[16.] Cui T, Nakamura K, Ma L, Li JZ, Kayahara
H. Analyses of arbutin and chlorogenic acid,
the major phenolic constituents in oriental
pear. J. Agric. Food Chem. 2005;53:3882–
3887.
[17.] Pavlović R.D, Lakušić B, Došlov-Kokoruš
Z, Kovačević N. Arbutin content and
antioxidant activity of some Ericaceae
species. Pharmazie 64:656-659.2009
[18.] Glöckl I, Blaschke G, Veit M . Validated
methods for direct determination of
hydroquinone glucuronide and sulfate in
human urine after oral intake of bearberry
leaf extract by capillary zone
electrophoresis. J Chromatogr B: Biomed
Sci Appl 761(2):261-266.2001.
[19.] Pyka A, Bober K, Stolarczyk A
Densitometric determination of arbutinin
cowberry leaves (Vaccinium Vitis-idaeae).
Acta Pol Pharm 63(5):395-400.2007.
[20.] Lamien-Meda A, Lukas B, Schmiderer C,
Franz Ch, Novak J. Validation of a
quantitative assay of arbutin using gas
chromatography in Origanum Majorana and
Arctostaphylos uva-ursi extracts. Phytochem
Anal 20:416-420.2009.
[21.] Asaaf M, Ali A, Makboul M, Beck JP,
Anton R . Preliminary study of phenolic
glycosides from Origanum majorana;
quantitative estimation of arbutin; cytotoxic
activity of hydroquinone. Planta Med
53:343-345.1986.
Mehtap Donmez Sahin Int. Journal of Engineering Research and Applications www.ijera.com
ISSN: 2248-9622, Vol. 6, Issue 1, (Part - 4) January 2016, pp.79-89
www.ijera.com 89 | P a g e
[22.] Parejo I, Viladomat F, Bastida J, Codina C .
A single extraction step in the quantitative
analysis of arbutin in bearberry
(Arctostaphylos uva-ursi) leaves by HPLC.
Phytochem Anal 12(5):336-339.2001.
[23.] Wettasinghe, M., & Shahidi, F. Evening
primrose meal: A source of natural
antioxidants and scavenger of hydrogen
peroxide and oxygen-derived free radicals.
Journal of Agricultural and Food Chemistry,
47, 1801–1812. 1999.
[24.] Cacace, J. E., & Mazza, G. Optimization of
extraction of anthocyanins from black
currants with aqueous ethanol. Journal of
Food Science, 68, 240–248.2003a.
[25.] Cacace, J. E., & Mazza, G. Extraction of
anthocyanins and other phenolics from black
currants with sulfured water. Journal of
Agricultural and Food Chemistry, 50, 5939–
5946. 2002.
[26.] Haaland, P. O. Experimental design in
biotechnology. New York: Marcel
Dekker.1989.
[27.] Box, G. E. P., & Wilson, K. B. (1951). On
the experimental attainment of optimum
conditions. Journal of the Royal Statistical
Society, 13,1–45.1951.
[28.] Myers, R. H., & Montgomery, D. C.
Response surface methodology: Process and
product optimization using designed
experiments (2nd ed.). New York:
Wiley.2002.
[29.] Cacace, J. E., & Mazza, G. Mass transfer
process during extraction of phenolic
compounds from milled berries. Journal of
Food Engineering, 59, 379–389. (2003b).
[30.] Parajo, J. C., Santos, V., Dominguez, H., &
Vazquez, M. NH4OH-based pretreatment
for improving the nutritional quality of
single-cell protein (SCP). Applied
Biochemistry and Biotechnology, 55, 133–
150. (1995).
[31.] Senanayake, S. P. J. N., & Shahidi, F.
Enzyme-assisted acidolysis of borage
(Borage officinalis L) and evening primrose
(Oenothera biennis L) oils: Incorporation of
x-3 polyunsaturated fatty acids. Journal of
Agricultural and Food Chemistry, 47, 3105–
3112. (1999).
[32.] Senanayake, S. P. J. N., & Shahidi, F.
Lipase-catalyzed incorporation of
docosahexaenoic acid (DMA) into borage
oil: optimization using response surface
methodology. Food Chemistry, 77, 115–123.
(2002).
[33.] Telez-Luis, S. J., Moldes, A. B., Alonso, J.
L., & Vazquez, M. Optimization of lactic
acid production by Lactobacillus delbrueckii
through response surface methodology.
Journal of Food Science, 68, 1454–1458.
(2003).
[34.] Vasquez, M., & Martin, A. Optimization of
Phaffia rhodozyma continuous culture
through response surface methodology.
Biotechnology and Bioengineering, 57, 314–
320. (1998).
[35.] Gao, L., & Mazza, G. Extraction of
anthocyanin pigments from purple
sunflower hulls. Journal of Food Science,
61, 600–603. (1996).
[36.] Ge, Y., Ni, Y., Yan, H., Chen, Y., & Cai, T.
Optimization of the supercritical fluid
extraction of natural vitamin E from wheat
germ using response surface methodology.
Journal of Food Science, 67, 239–243.
(2002).