Embed Size (px)
Citation preview
1
OPTIMIZATION OF XYLOSE AND GLUCOSE YIELDS FROM NAPIER
GRASS (Pennisetum purpureum) USING HYBRID PRETREATMENT AND
ASSESSMENT FOR FERMENTATIVE HYDROGEN PRODUCTION
USING IMMOBILIZED CELLS
A dissertation submitted to the College of Agriculture, Engineering and Science, in fulfillment of
the academic requirements for the degree of
Master of Science
SIPHELELE MAFULEKA
Student number: 208515891
(BSc Hons, UKZN-PMB)
In the
School of Life Sciences
Discipline of Microbiology
University of KwaZulu-Natal, Private bag X01, Scottsville, 3209, Pietermaritzburg, South Africa
November 2014
i
DECLARATION BY STUDENT
Optimization of xylose and glucose yields from napier grass (Pennisetum purpureum) using
hybrid pretreatment and assessment for fermentative hydrogen production using immobilized
cells
I Siphelele Mafuleka hereby declare that:
1. The research reported in this dissertation, unless acknowledgement is made explicitly in
the text, is the result of my original work in the Discipline of Microbiology, School of
Life Sciences, University of KwaZulu-Natal, Pietermaritzburg.
2. This dissertation has not been submitted or concurrently submitted for any degree or
examination at any other university.
3. This thesis does not contain other authors’ data, pictures, graphs or other information,
unless duly acknowledged as being sourced from other authors.
Signed:
……………………………………………
Siphelele Mafuleka
Student
....……………………….
Dr E.B. Gueguim Kana
Supervisor
ii
DECLARATION BY SUPERVISOR
I hereby declare that I supervised this MSc student:
Student’s Full Name: Siphelele Mafuleka
Student Number: 208515891
Thesis Title: Optimization of xylose and glucose yields from napier grass (Pennisetum purpureum)
using hybrid pretreatment and assessment for fermentative hydrogen production using immobilized
cells
Regular consultation took place between the student and me throughout the duration of this
research. I advised the student to the best of my ability and approved the final document for
submission to the College of Agriculture, Engineering and Science Higher Degrees Office for
examination by the University appointed Examiners.
Signed:
………………………………
Dr E.B. Gueguim Kana
Supervisor
iii
COLLEGE OF AGRICULTURE, ENGINEERING AND SCIENCE
DECLARATION 1-PLAGIARISM
I Siphelele Mafuleka hereby declare that:
1. The research reported in this thesis unless otherwise indicated, is my original research.
2. This thesis has not been submitted for any degree or examination at any other university.
3. This thesis does not contain other authors’ data, pictures, graphs or other information, unless
duly acknowledged as being sourced from other authors.
4. This thesis does not contain other authors’ writing, unless duly acknowledged as being sourced
from other authors. Where other written sources have been quoted, then: Their words have
been re-written but the general information attributed to them has been referenced.
5. This thesis does not contain text; graphics or tables copied and pasted from the internet, unless
specifically acknowledged, and source being detailed in the thesis and in the references sections.
Signed:
……………………………………
Siphelele Mafuleka
Student
....……………………….
Dr E.B. Gueguim Kana
Supervisor
iv
DECLARATION 2 - MANUSCRIPTS SUBMITTED FOR
PUBLICATION
Publications forming part of this thesis include published and submitted manuscripts. The first
author (student) contributed in experimental work, data analysis and manuscript preparation,
guided by the second author (supervisor).
Publication 1
Mafuleka S, Gueguim Kana EB. (2015). Modelling and optimization of xylose and glucose
production from napier grass using hybrid pretreatment techniques. Biomass & Bioenergy 77, 200 –
208.
Manuscript 1
Mafuleka S, Gueguim Kana EB. Modeling and optimization of biohydrogen production from
napier grass (Pennisetum purpureum) using immobilized mixed microbial consortia – Preliminary
scale up. (Submitted to Applied Energy Journal)

v
CONFERENCE CONTRIBUTIONS
Mafuleka Siphelele. Modeling and optimization of xylose and glucose production from napier
grass (Pennisetum purpureum) using hybrid pretreatment techniques. College of Agriculture,
Engineering and Science; Postgraduate Research Day (2014). UKZN Westville campus, Durban. 27
October 2014. Oral presentation
vi
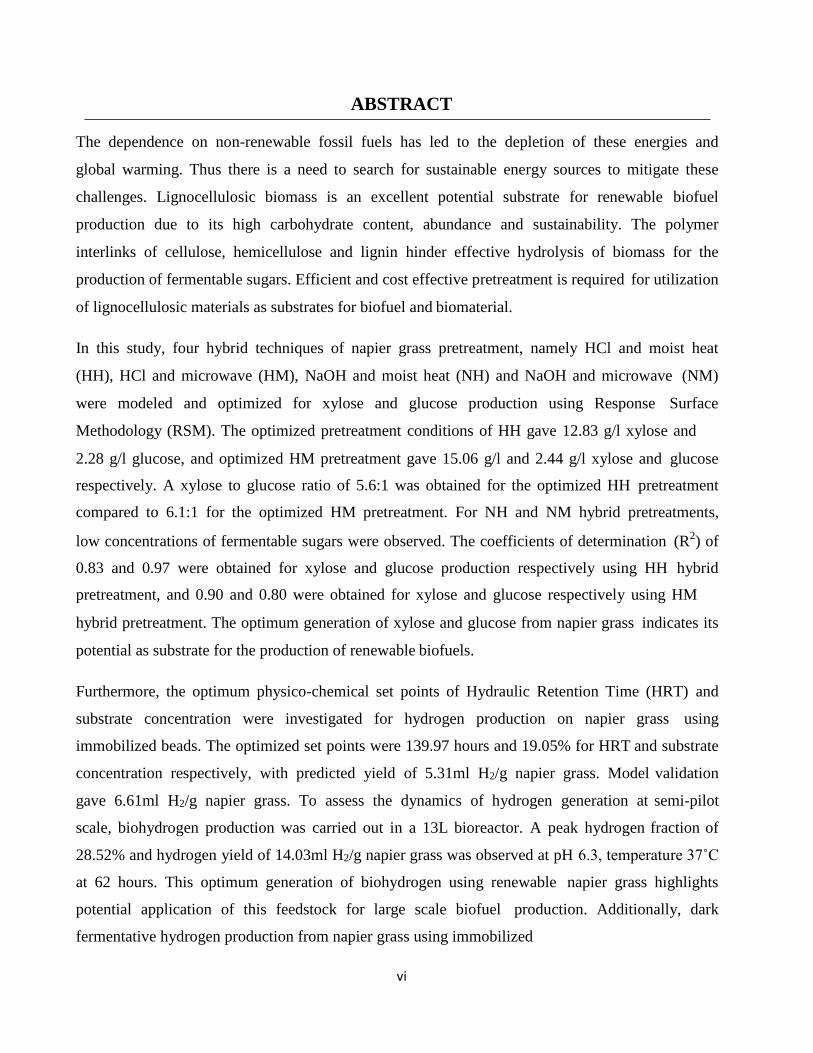
ABSTRACT
The dependence on non-renewable fossil fuels has led to the depletion of these energies and
global warming. Thus there is a need to search for sustainable energy sources to mitigate these
challenges. Lignocellulosic biomass is an excellent potential substrate for renewable biofuel
production due to its high carbohydrate content, abundance and sustainability. The polymer
interlinks of cellulose, hemicellulose and lignin hinder effective hydrolysis of biomass for the
production of fermentable sugars. Efficient and cost effective pretreatment is required for utilization
of lignocellulosic materials as substrates for biofuel and biomaterial.
In this study, four hybrid techniques of napier grass pretreatment, namely HCl and moist heat
(HH), HCl and microwave (HM), NaOH and moist heat (NH) and NaOH and microwave (NM)
were modeled and optimized for xylose and glucose production using Response Surface
Methodology (RSM). The optimized pretreatment conditions of HH gave 12.83 g/l xylose and
2.28 g/l glucose, and optimized HM pretreatment gave 15.06 g/l and 2.44 g/l xylose and glucose
respectively. A xylose to glucose ratio of 5.6:1 was obtained for the optimized HH pretreatment
compared to 6.1:1 for the optimized HM pretreatment. For NH and NM hybrid pretreatments,
low concentrations of fermentable sugars were observed. The coefficients of determination (R2) of
0.83 and 0.97 were obtained for xylose and glucose production respectively using HH hybrid
pretreatment, and 0.90 and 0.80 were obtained for xylose and glucose respectively using HM
hybrid pretreatment. The optimum generation of xylose and glucose from napier grass indicates its
potential as substrate for the production of renewable biofuels.
Furthermore, the optimum physico-chemical set points of Hydraulic Retention Time (HRT) and
substrate concentration were investigated for hydrogen production on napier grass using
immobilized beads. The optimized set points were 139.97 hours and 19.05% for HRT and substrate
concentration respectively, with predicted yield of 5.31ml H2/g napier grass. Model validation
gave 6.61ml H2/g napier grass. To assess the dynamics of hydrogen generation at semi-pilot
scale, biohydrogen production was carried out in a 13L bioreactor. A peak hydrogen fraction of
28.52% and hydrogen yield of 14.03ml H2/g napier grass was observed at pH 6.3, temperature 37˚C
at 62 hours. This optimum generation of biohydrogen using renewable napier grass highlights
potential application of this feedstock for large scale biofuel production. Additionally, dark
fermentative hydrogen production from napier grass using immobilized
vii
microbial consortia combined a cheap hydrogen production method with high unit volumetric
production rate thus positively impacting the bioprocess economics.
Keywords: Biohydrogen production, Napier grass, Lignocellulosic biomass, Modeling,
Optimization, Dark fermentation, Biofuels

viii
ACKNOWLEDGEMENTS
First and above all, I would like to thank God, the Almighty for the strength and the opportunity to
proceed successfully.
I would like to express my sincere gratitude to my supervisor Dr EB Gueguim Kana for his
continuous support, for his patience, motivation, enthusiasm, and immense knowledge. Your
guidance helped me in all the time of research and writing of this thesis. I could not have
imagined having a better supervisor and mentor for my MSc study.
Most importantly to my family especially my mom, this dissertation stands as a testament to your
unconditional love, support and encouragement. Thank you boNdinisa.
My sincere thanks also to Dr Terry Everson and Bab Ngcobo for the substrate recommendation and
processing, your inputs made this work a success. To Celeste Clark, thank you for your excellent
technical assistance in the Lab, particularly for your assistance with the YSI 2700 sugar analyzer.
I would like to thank my fellow lab mates in Lab 117: Funmi, Patrick, Balo, Efe, Yeshona,
Preshanthan, Joelle, Mariam, Kimberley, Noks and additional members Selisha and Jojozi for the
stimulating Friday meetings, sharing our limited resources, the noise and for all the fun we had.
Also I thank my friends Stha, Phindie, Dudu and Makhosi.
Finally I would like to thank Nkosana Ncube for bringing into my attention that there are two
things on this earth, namely science and Nkosana.
ix
TABLE OF CONTENTS
DECLARATION BY STUDENT .................................................................................................... i
DECLARATION BY SUPERVISOR ........................................................................................... ii
DECLARATION 1-PLAGIARISM ............................................................................................. iii
DECLARATION 2-PUBLICATIONS .......................................................................................... iv
CONFERENCE CONTRIBUTIONS............................................................................................. v
ABSTRACT ..................................................................................................................................... vi
ACKNOWLEDGEMENTS ........................................................................................................ viii
TABLE OF CONTENTS ............................................................................................................... ix
LIST OF FIGURES ..................................................................................................................... xiii
LIST OF TABLES ......................................................................................................................... xv
LIST OF ABBREVIATIONS ...................................................................................................... xvi
CHAPTER 1 - General introduction.............................................................................................. 1
1.1Fossil fuels and their negative impacts ............................................................................... 1
1.2 Hydrogen as an alternative energy ..................................................................................... 3
1.3 Potentials of lignocellulosic substrates for biohydrogen production ................................ 4
1.4 Challenges associated with the use of lignocellulosic substrates ....................................... 5
1.5 5 Problem statement ........................................................................................................... 7
1.6 Aims ................................................................................................................................... 8
1.7 References .......................................................................................................................... 9
CHAPTER 2 - Napier grass (Pennisetum purpureum): a potential substrate for fermentative
biohydrogen production- A review ............................................................................................. 13
2.1 Abstract ............................................................................................................................ 13
2.2 Introduction ...................................................................................................................... 14
2.3 Composition and production of napier grass .................................................................... 15
2.4 Factors limiting napier grass hydrolysis .......................................................................... 16
2.5 Pretreatment strategies to enhance microbial hydrolysis of napier grass ......................... 17
x
2.5.1 Chemical pretreatment .......................................................................................... 19
2.5.2 Physico-chemical pretreatment of napier grass .................................................... 21
2.5.3 Biological pretreatment of napier grass ................................................................ 22
2.5.4 Pretreatment combinations on napier grass hydrolysis ......................................... 23
2.6 Biohydrogen production from napier and other lignocellulosic substrates ..................... 26
2.6.1 Influences of pretreatment methods on fermentative sugars and hydrogen yields ... 26
2.7 Influences of process parameters on hydrogen fermentation .......................................... 27
2.7.1 Temperature ........................................................................................................... 27
2.7.2 pH .......................................................................................................................... 27
2.7.3 HRT ....................................................................................................................... 28
2.7.4 Inhibitory compounds ............................................................................................ 28
2.7.5 Biomass concentration ........................................................................................... 29
2.8 Batch versus continuous fermentative hydrogen production from pretreated napier grass
and other lignocellulosic substrates ...................................................................................... 30
2.9 Influence of microbial communities producing hydrogen from napier grass and other
lignocellulosic substrates ...................................................................................................... 31
2.9.1 Hydrogen production using pure cultures ................................................................. 31
2.9.2 Hydrogen production using mixed cultures .............................................................. 31
2.9.3 Hydrogen production using immobilized microbial cultures .................................... 32
2.10 Other biofuels and biomaterial from napier grass .......................................................... 32
2.11 Conclusion ..................................................................................................................... 33
2.12 References ...................................................................................................................... 34
CHAPTER 3 - Modeling and optimization of xylose and glucose production from napier
grass (Pennisetum purpureum) using hybrid pretreatment techniques. ................................. 45
3.1 Abstract ..................................................................................................................................... 45
3.2 Introduction ............................................................................................................................... 46
3.3 Materials and methods .............................................................................................................. 48
3.3.1 Lignocellulosic biomass ............................................................................................. 48
3.3.2 Experimental designs ................................................................................................ 48
3.3.3 Experimental set up ................................................................................................... 50
3.3.4 Analytical methods .................................................................................................... 50
xi
3.3.5 Preliminary assessment of pretreated napier on biohydrogen production ................... 51
3.3.5.1 Seed sludge......................................................................................... 51
3.3.5.2 Batch fermentation experiments ........................................................ 51
3.4 Results and discussion ................................................................................................................. 52
3.4.1 Composition of napier grass ...................................................................................... ...52
3.4.2 Modeling of HCl and moist heat hybrid pretreatment (HH) ........................................ 54
3.4.3 Modeling of HCl and microwave hybrid pretreatment (HM) ...................................... 58
3.4.4 Effect of hybrid pretreatment of NH and NM on production of xylose and glucose
from napier grass .................................................................................................................. 61
3.4.5 Linear effect of parameters on xylose and glucose production in hybrid
pretreatment…………………………………………………………………………… ……………………62
3.4.6 Interaction of experimental variables on xylose and glucose production in HH and
HM hybrid pretreatments ..................................................................................................... 63
3.4.7 Optimization of napier grass pretreatment using hybrid techniques of HH and HM on
xylose and glucose production……………………………………………………………..69
3.4.8 Preliminary assessment of the optimally pretreated napier grass for fermentative
biohydrogen production………………………………………………………………70
3.5 Conclusion………………………………………………………..…………………………… 70
3.6 References ................................................................................................................................... 71
CHAPTER 4 - Modeling and optimization of biohydrogen production from napier grass
(Pennisetum purpureum) using immobilized mixed microbial consortia – preliminary scale up
........................................................................................................................................................... 75
4.1 Abstract ................................................................................................................... ………75
4.2 Introduction ......................................................................................................................... 76
4.3 Materials and methods ........................................................................................................ 77
4.3.1 Inoculum preparation ................................................................................................... 77
4.3.2 Immobilization of mixed microbial consortia .............................................................. 78
4.3.3 Napier grass pretreatment ............................................................................................. 78
4.3.4 Experimental design ...................................................................................................... 78
4.3.5 Fermentation process set up .......................................................................................... 78
xii
4.3.6 Modelling and optimization of substrate concentration and HRT ............................. 79
4.3.7 Analytical procedures ................................................................................................ 79
4.3.8 Semi-pilot scale biohydrogen production using the pretreated napier grass ............. 80
4.3.9 Isolation and characterization of hydrogen producing bacteria ................................. 80
4.3.10 DNA extraction and 16S rRNA gene sequencing analysis ...................................... 80
4.4 Results and discussion ..................................................................................................... 81
4.4.1 Modeling and optimization of substrate concentration and HRT ............................. 81
4.4.2 Interaction of substrate concentration and HRT on biohydrogen production ........... 83
4.4.3 Optimization of biohydrogen production using the central composite design .......... 84
4.4.4 Semi-pilot scale biohydrogen production ................................................................. 86
4.4.4.1 Hydrogen production phases .............................................................................. 86
4.4.4.2 Carbon dioxide evolution ................................................................................... 88
4.4.5 Isolation and characterization of hydrogen producing bacteria ................................ 91
4.5 Conclusion ....................................................................................................................... 93
4.6 References ........................................................................................................................ 94
CHAPTER 5 - Conclusions and recommendations ................................................................... 99
5.1 Conclusions ...................................................................................................................... 99
5.2 Recommendations for future work ................................................................................ 100
Note: This thesis contains a compilation of manuscripts submitted for peer review, each
chapter is presented as an individual entity. Hence there is repetition between chapters.
xiii
LIST OF FIGURES
Figure 1.1 - The global estimates of proven fossil fuels reserves and consumption as appraised by
international agencies ..................................................................................................................... .. 2
Figure 1.2 - The global scale of main greenhouse gasses emissions ................................................. 3
Figure 2.1 -A schematic diagram of fermentative hydrogen production from napier grass and other
lignocellulosic biomass substrates ………………………………………………………………..18
Figure 3.1 - Three dimensional response surface graph showing the interaction of pretreatment
duration and HCl concentration on a. xylose production and b. glucose production using HH hybrid
pretreatment……………………………………………………………………………………….65
Figure 3.2 -Three dimensional response surface graph showing the interaction of pretreatment
temperature and HCl concentration on a. xylose production and b. glucose production using HH
hybrid pretreatment……………………………………………………………………………….66
Figure 3.3. Three dimensional response surface graph showing the interaction of pretreatment
temperature and pretreatment duration on a. xylose production and b. glucose production using HH
hybrid pretreatment………………………………………………………………………………..67
Figure 3.4. Three dimensional response surface graph showing the interaction of pretreatment
duration and HCl concentration on a. xylose production and b. glucose production using HH hybrid
pretreatment……………………………………………………………………………………….68
Figure 3.5 -Three dimensional response surface graph showing the interaction of microwave
intensity and HCl concentration on a. xylose production and b. glucose production using HH hybrid
pretreatment……………………………………………………………………………………….69
Figure 4.1 - Three dimensional response surface curve of substrate concentration and HRT
interaction on biohydrogen production……………………………………………………..……..85
Figure 4.2 - Contour map plot of surface concentration and HRT interaction on biohydrogen
production .................................................................................................................................... .. .86
Figure 4.3 - Time course of a. biogas evolution and b. sugar utilization during the semi-pilot scale
hydrogen production ................................................................................................................... .. …89
Figure 4.4 - Cumulative biogas evolution during fermentation process ....................................... ..90
Figure 4.5 - PCR profile of hydrogen producing bacteria: Lanes 1 to 15 represents PCR amplicons
of bacteria grown in DRCA and C represents the non-template control. A 1kb DNA Ladder (M)
GeneRulerTM
was used in a 1% (w/v) agarose gel to determine the sizes of the sizes of the
isolated DNA fragments (500bp)…………………………………………………………………92
xiv
LIST OF TABLES
Table 2.1 - Chemical composition of napier grass ........................................................................ .16
Table 2.2 - Reducing sugar production and hydrogen yields from napier grass and selected
lignocellulosic substrates using different pretreatment strategies .................................................... 25
Table 3.1 - Experimental conditions for HH and NH hybrid techniques ....................................... 49
Table 3.2 - Experimental conditions for HM and NM hybrid techniques ....................................... 49
Table 3.3 - Napier grass composition before and after pretreatment…… .................................... ..53
Table 3.4 - Xylose and glucose production from napier grass using HCl and moist heat hybrid
pretreatment...................................................................................................................................... 54
Table 3.5 - Analysis of variance for xylose and glucose production generated using hybrid
pretreatment...................................................................................................................................... 55
Table 3.6 - Coefficient of estimate of the mixture models and their confidence interval for xylose
production ........................................................................................................................................ 56
Table 3.7 - Coefficient of estimate of the hybrid models and thier confidence intervals for
glucose production ........................................................................................................................... 57
Table 3.8 - Xylose and glucose production from napier grass using HCl and microwave hybrid
pretreatment...................................................................................................................................... 58
Table 3.9 - Analysis of variance generated for xylose and glucose production from HM models
..........................................................................................................................................................59
Table 3.10 - Coefficient estimates of the mixture model and confidence intervals on xylose
production ........................................................................................................................................ 60
Table 3.11 - Coefficient estimate of the mixture model and confidence interval on glucose
production ........................................................................................................................................ 61
Table 4.1 - Biohydrogen production from pretreated napier grass under varied substrate
concentration and HRT .................................................................................................................... .82
Table 4.2 - Analysis of variance for biohydrogen production ...................................................... ...82
Table 4.3 - Coefficient of estimate of the model and the confidence interval for biohydrogen
production ........................................................................................................................................ .83
Table 4.4 - Affiliation of isolates to published species using 16rRNA sequences .......................... .93
xv
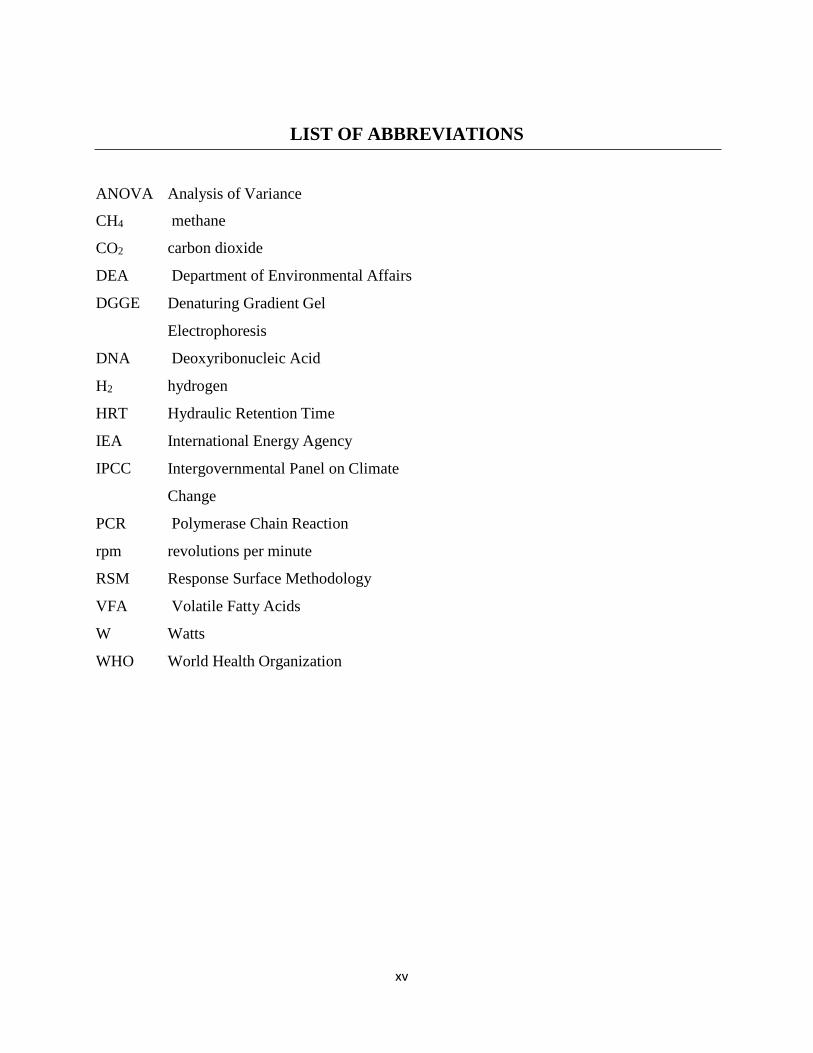
LIST OF ABBREVIATIONS
ANOVA Analysis of Variance
CH4 methane
CO2 carbon dioxide
DEA Department of Environmental Affairs
DGGE Denaturing Gradient Gel
Electrophoresis
DNA Deoxyribonucleic Acid
H2 hydrogen
HRT Hydraulic Retention Time
IEA International Energy Agency
IPCC Intergovernmental Panel on Climate
Change
PCR Polymerase Chain Reaction
rpm revolutions per minute
RSM Response Surface Methodology
VFA Volatile Fatty Acids
W Watts
WHO World Health Organization
1
CHAPTER 1
General introduction
1.1 Fossil fuels depletion and their negative impacts
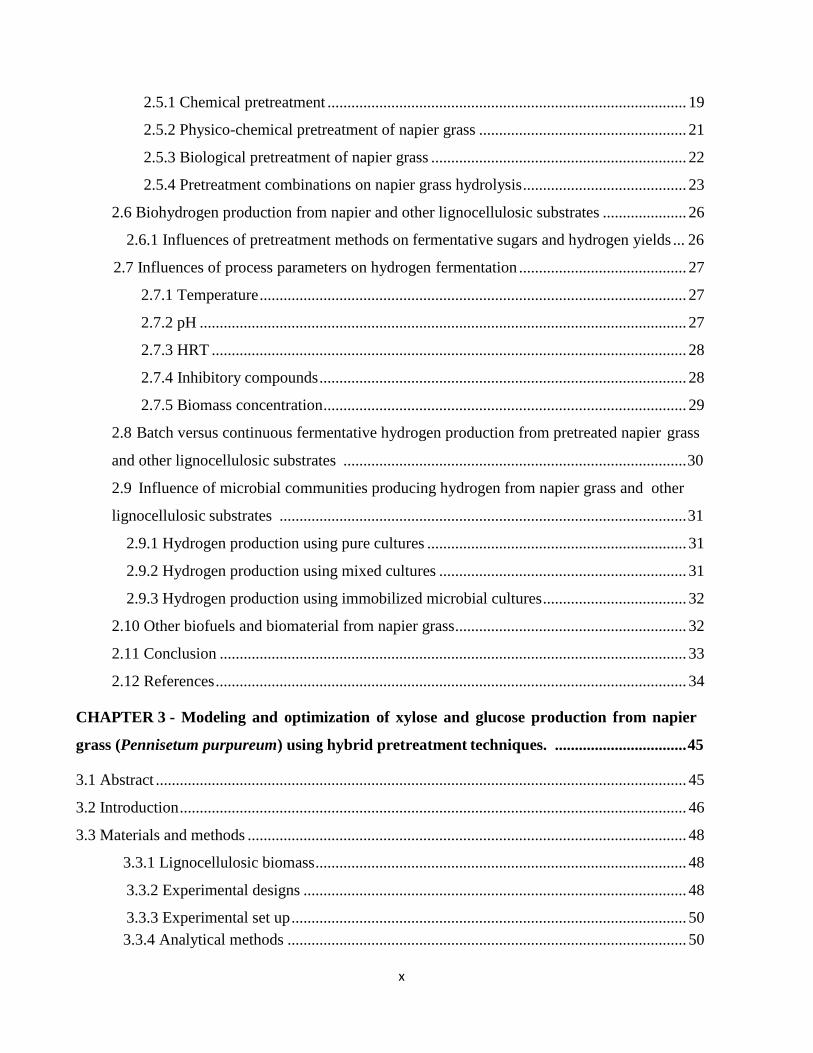
The excessive use of the exhaustible fossil fuels has led to its hasten depletion, abrupt climate
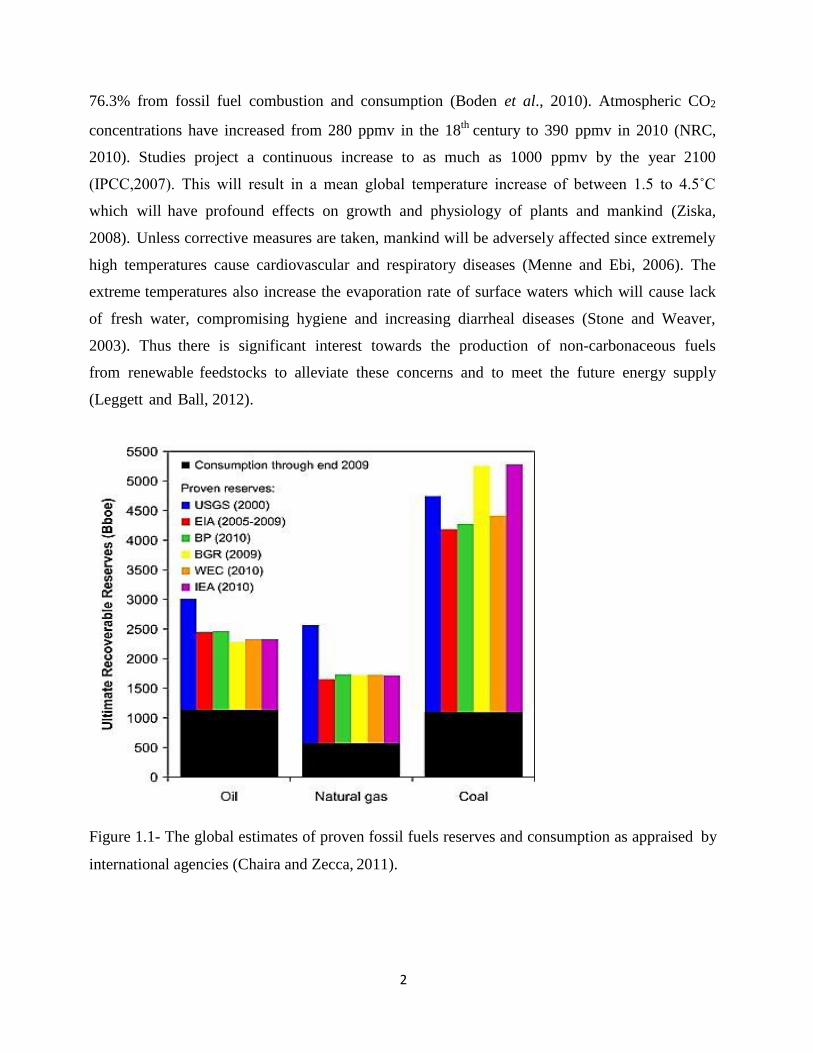
fluctuations and soaring concerns over environmental deterioration (Azwar et al., 2014). The
global estimates of proven fossil fuel reserves and consumption through the end of 2009 as
appraised by international agencies and energy corporations is shown in figure 1.1. Fossil fuels
have been the driving force for industrial revolution and economic growth. About 80% of the
world’s primary energy is fossil fuel derived with oil, coal and natural gas accounting for 32.8,
27.2 and 20.9% respectively (IEA, 2011). Annual production of fossil fuel derived energy has
grown from 1800 to about 10 000 million tons per year from the year 1800 to 2010 (Hook and
Tang, 2013). Projections show that conventional oil is fast approaching peak production. With
approximately 1100Bboe (billion barrels of oil equivalent) consumed from the year 1800 to 2009
which is almost half the proven oil reserves of approximately 2500Bboe (Figure 1.1).
Conventional oil consumption and demand is expected to increase with increasing population
growth and economic development (Leggett and Ball, 2012). Bentley et al. (2007) predicts peak
conventional oil production before 2030. These observations indicate a looming energy crisis.
The worlds proven coal reserves are judged sufficient to meet the projected growth for the next
107 years (Shafiee and Topal, 2009). However, its processing and consumption has brought
adverse environmental impacts. These include significant greenhouse gas emissions and acid
mine drainage (McCarthy and Pretorius, 2009). South Africa is the 15th
largest CO2 emitter at
global scale from coal combustion (DEAT, 2009). The global average CO2 emissions through
coal combustion are 4.28 ton CO2 per annum while that of South Africa is 7.22 ton CO2 per
annum (IEA, 2008).
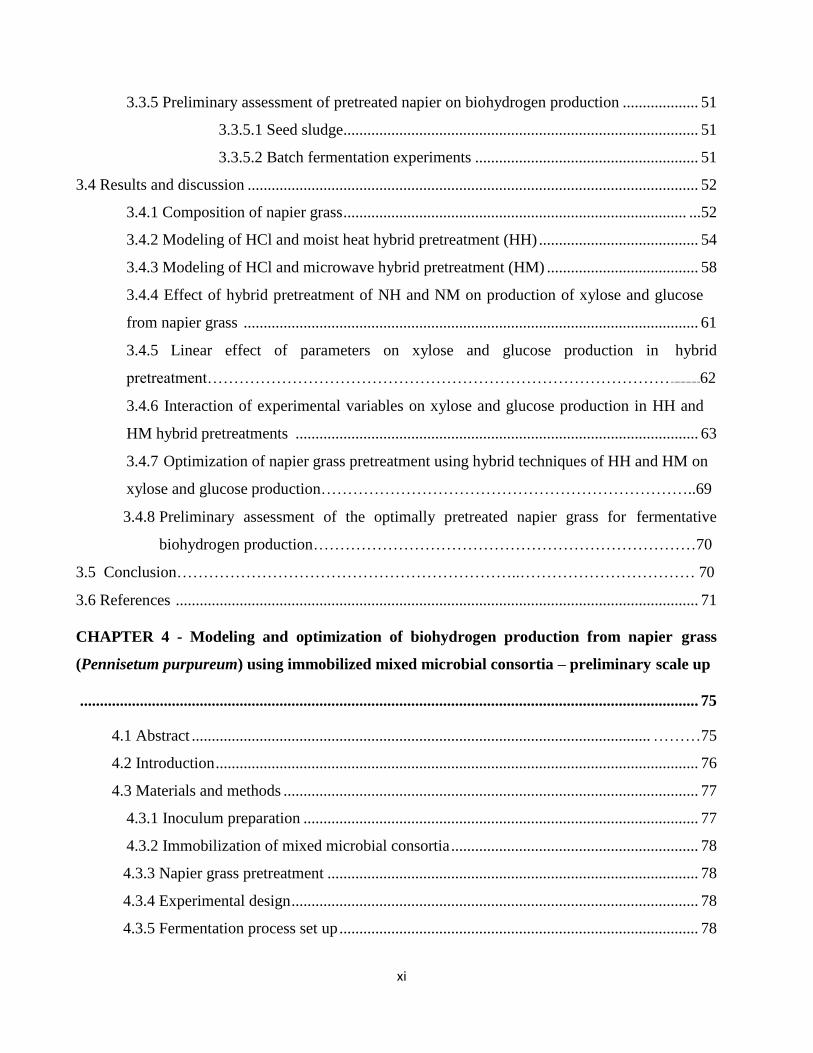
CO2 is the primary greenhouse gas and the main contributor to the global temperature increase
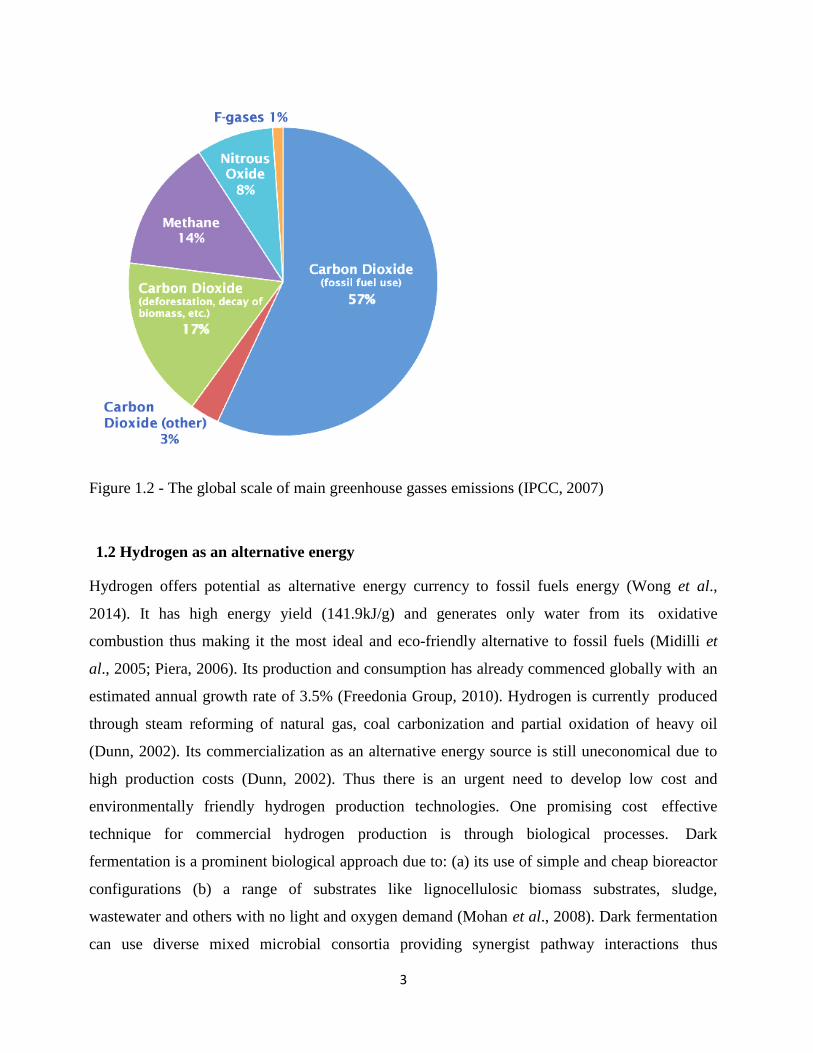
(Sathre, 2014). Figure 1.2 presents the main greenhouse gases emissions through to the end of
the year 2007. A significant amount of CO2 (57%) is emitted from fossil fuel combustion and
processing. In 2007, 8365 million metric tons of CO2 was emitted into the atmosphere with
2
76.3% from fossil fuel combustion and consumption (Boden et al., 2010). Atmospheric CO2
concentrations have increased from 280 ppmv in the 18th
century to 390 ppmv in 2010 (NRC,
2010). Studies project a continuous increase to as much as 1000 ppmv by the year 2100
(IPCC,2007). This will result in a mean global temperature increase of between 1.5 to 4.5˚C
which will have profound effects on growth and physiology of plants and mankind (Ziska,
2008). Unless corrective measures are taken, mankind will be adversely affected since extremely
high temperatures cause cardiovascular and respiratory diseases (Menne and Ebi, 2006). The
extreme temperatures also increase the evaporation rate of surface waters which will cause lack
of fresh water, compromising hygiene and increasing diarrheal diseases (Stone and Weaver,
2003). Thus there is significant interest towards the production of non-carbonaceous fuels
from renewable feedstocks to alleviate these concerns and to meet the future energy supply
(Leggett and Ball, 2012).
Figure 1.1- The global estimates of proven fossil fuels reserves and consumption as appraised by
international agencies (Chaira and Zecca, 2011).
3
Figure 1.2 - The global scale of main greenhouse gasses emissions (IPCC, 2007)
1.2 Hydrogen as an alternative energy
Hydrogen offers potential as alternative energy currency to fossil fuels energy (Wong et al.,
2014). It has high energy yield (141.9kJ/g) and generates only water from its oxidative
combustion thus making it the most ideal and eco-friendly alternative to fossil fuels (Midilli et
al., 2005; Piera, 2006). Its production and consumption has already commenced globally with an
estimated annual growth rate of 3.5% (Freedonia Group, 2010). Hydrogen is currently produced
through steam reforming of natural gas, coal carbonization and partial oxidation of heavy oil
(Dunn, 2002). Its commercialization as an alternative energy source is still uneconomical due to
high production costs (Dunn, 2002). Thus there is an urgent need to develop low cost and
environmentally friendly hydrogen production technologies. One promising cost effective
technique for commercial hydrogen production is through biological processes. Dark
fermentation is a prominent biological approach due to: (a) its use of simple and cheap bioreactor
configurations (b) a range of substrates like lignocellulosic biomass substrates, sludge,
wastewater and others with no light and oxygen demand (Mohan et al., 2008). Dark fermentation
can use diverse mixed microbial consortia providing synergist pathway interactions thus
4
improving substrate degradation and enhancing biohydrogen production (Kapdan and Kargi,
2006). Major limitations to implementation of fermentative hydrogen production at industrial
scale are high production costs and low substrates conversion efficiencies (Li and Fang, 2007).
The use of cheap and renewable feedstocks such as lignocellulosic biomass substrates could
significantly lower the hydrogen production cost thus making its production economically
feasible at industrial scale.
1.3 Potentials of lignocellulosic substrates for biohydrogen production
Lignocellulosic feedstocks are amenable for fermentative hydrogen production since the raw
material is abundant and sustainable. The global production of lignocellulosic biomass is
estimated above 220 billion tons per annum (Ren et al., 2009). These large quantities of
lignocellulosic biomass accumulate from agriculture, forestry and other agro-industries. Disposal
of these biomass substrates raises environmental concerns since these are resistant to natural
biodegradation by microorganisms and microbial enzymes (Howard et al., 2003). Thus, they
remain in landfill sites for years harboring rats, flies, snakes and breeds diseases vector insects.
A global phenomenon thus is to dispose lignocellulosic biomass from the environment by
burning (Howard et al., 2003). This practice however emits significant amounts of CO2 into the
atmosphere and poses an environmental pollution problem (Levin, 1996). Lignocellulosic
feedstock chemical properties make these substrates of enormous biotechnological value as cheap
sources of fermentable sugars. Thus, the large quantities of lignocellulosic biomass feedstocks
generally considered as “waste” could be converted into valuable biohydrogen, other biofuels
and value-added products. Lignocellulosic feedstock selection depends on fermentable sugars
content, availability and costs of the substrate (Kapdan and Kargi, 2006). In Africa, napier grass
(Pennisetum purpureum) holds potential as a competitive feedstock for biohydrogen production.
Napier grass is a C4 all season grass species that is native to and widely distributed in African
grass lands. It has high holocellulose content (up to 69%), high biomass yields (about 40 metric
ton/ha/year) and is rapid growing. Globally, Somerville et al. (2012) reported annual
cumulative dry matter napier grass yields of 85 tons per hectare, while Reddy et al. (2012)
reported an annual cumulative yield of 40 tons per hectare in South Africa. However, the
compositional and components interaction of cellulose, hemicellulose and lignin polymers in
napier grass limit the effective hydrolysis of biomass for fermentative hydrogen production
(Wongwatanapaiboon et al., 2012).
5
1.4 Challenges associated with the use of lignocellulosic substrates
Lignocellulosic biomass is composed of inter-linked cellulose, hemicellulose and lignin.
Cellulose is composed of thousands of β-glycosidic bond linked glucose molecules.
Hemicellulose consists of hexoses, pentoses and sugar acids, and it binds to cellulose molecules
in biomass. Lignin is made up of a framework of phenyl propane units namely coniferyl,
guaracyl, syringyl and syringyl alcohol. High concentrations of these phenyl propane units gives
biomass rigidity, protection against pathogen attacks, provides strength, water proof and
hindrance to hydrolysis by forming a steric barrier limiting enzymatic penetration (Kumar et al,
2008). Lignocellulosic biomass requires pretreatment or hydrolysis to break the lignin seal,
structure and chemical components of the feedstock prior to use for hydrogen fermentation.
Lignocellulosic biomass pretreatment allows easy access of microbial enzymes to fermentable
cellulose and hemicellulose thus improving substrate enzymatic digestibility. Furthermore, it
hydrolyses cellulose and hemicellulose to monomeric sugars predominantly xylose and glucose.
Ideally a pretreatment method should be low cost, efficient, have high sugar yields and produce
limited or no toxic byproducts such as phenolic compounds (Kapdan and Kargi, 2006).
The mechanical, physico-chemical, physical and chemical pretreatment procedures and
combinations have been used to pretreat lignocellulosic biomass substrates. These include steam
explosion, alkali and acid hydrolysis, wet oxidation, ammonia fiber explosion, biological and
microwave hydrolysis as some examples of biomass pretreatment strategies. The hydrolysis of
napier grass through steam explosion has been reported by Chang et al. (2011) under varied
temperature from 160 to 210˚C and a reaction time between 2 to 20 minutes. The authors
reported a significant reduction in glucan, xylan and lignin (67.3, 6.83 and 20.02% respectively)
at 210˚C for 20 minutes. Steam explosion however, results in xylan fraction destruction, toxic
and inhibitory phenolic compounds production, incomplete lignin-carbohydrate matrix disruption
and has high-energy requirements (Mackie et al., 1985). Biological pretreatment has been used to
hydrolyze lignocellulosic biomass (Zhang et al., 2008). This method uses fungal enzymes to
degrade lignin, hemicellulose and polyphenols. Industrial application of this method is limited by
slow degradation rate and microorganisms consuming some hydrolyzed carbohydrate fraction.
Acid pretreatment solubilizes lignin and hydrolyzes hemicellulose to xylose, thus making
cellulose accessible to enzymatic hydrolysis (Eggeman and Elander, 2005). This strategy is
inexpensive and efficient, however it causes corrosion to the bioreactor internal structures
6
(Lopez-Arenas et al., 2010). Alkaline pretreatment strategy disrupts the lignin structure of
biomass but also removes uronic acid substitutions on hemicellulose thus reducing accessibility
of hemicellulose to hydrolytic enzymes (Cardona and Sachnez, 2006). Microwave radiation and
thermal pretreatment strategies disrupt lignin, reduce degree of polymerization of biomass and
hydrolyze hemicellulose to xylose. These pretreatment strategies have high energy requirements
and are slow (require long process times) (Lopez-Arenas et al., 2010). Ammonia fiber explosion
uses hot liquid ammonia (˂90˚C) under high pressure for specific duration (˂30 minutes) to
delignify and solubilize hemicellulose (Cardona and Sachnez, 2006). This process is highly
efficient, however the costs of ammonia and recovery process make this pretreatment
economically unviable (Cardona and Sachnez, 2006). Thus, alternative more efficient and cost
effective biomass pretreatment approaches are investigated.
Studies have shown that each of the single pretreatment gives limited sugar yields due to
specific mode of action (namely HCl only targets hemicellulose primarily, but not lignin) and
intrinsic disadvantages. To overcome this, combined or hybridized pretreatment methods using
two or more pretreatment techniques on biomass are explored. The pretreatment combinations
have been reported to enhance sugar yields, reducing pretreatment duration and increasing
severity. However, their use could increase pretreatment costs. Hybrid pretreatment techniques
of steam explosion and dilute 1% H2SO4 on raw wheat straw have been reported with yield
improvement of 8 to 10g glucose/100g raw wheat straw compared to 6.4g glucose/100g wheat
straw obtained without acid addition (Lopez-Arenas et al., 2010).
An obstacle to the commercialization of biohydrogen produced from lignocellulosic feedstocks is
the low microbial unit production rate in dark fermentation. One approach to improving the
microbial unit production rate is through microbial biomass retention within a reactor using cell
immobilization processes. Immobilized cell systems allows better biomass retention at high
dilution rates, creates a local anaerobic environment and maintains high microbial cell densities
compared to suspended cells which increases hydrogen yields (Wu et al., 2003). Cell
immobilization uses methods such as adsorption of cells onto solid surfaces, biofilms, granules
and entrapment onto synthetic polymers for biomass immobilization (Fang and Liu, 2002; Palazzi
et al., 2000). Studies have reported better hydrogen yields from immobilized cells compared to
suspended cells using pure glucose and palm oil mill wastewater as substrates (Wu et al., 2003).
Fermentative hydrogen production using immobilized mixed microbial consortium on
7
lignocellulosic feedstocks is scantily reported.
1.5 Problem statement
Due to the looming energy crisis and the soaring concerns over environmental deterioration
owing to the anticipated fossil fuel depletion and fossil fuel combustion, a clean and sustainable
alternative energy is of urgent demand (Ren et al., 2009). Biohydrogen is emerging as a
promising energy carrier to alleviate the reliance on the exhaustible fossil fuels (Ho et al.,
2012). However, its high production cost is a major obstacle to commercialization. The use of
cheap and renewable feedstocks such as grasses could make hydrogen production
economically feasible. Grasses are attractive feedstocks due to their high carbohydrate content,
abundance, sustainability and local availability (Wongwatanapaiboon et al., 2012). Napier grass is
a promising feedstock for biohydrogen production because of its high cellulose content, rapid
growth, highly invasive nature, high adaptability and high biomass yields. Globally, annual
cumulative dry matter napier grass yields of 85 tons per hectare have been reported (Somerville
et al., 2012), with 40 tons per hectare in South Africa (Reddy et al., 2012). These large quantities
of napier grass accumulated yearly are disposed of by burning since the biomass is resistant to
natural biodegradation by microorganisms. This practice emits significant amounts of CO2 and
causes environmental pollution problem. This study investigates the potential of converting these
wastes into renewable biohydrogen energy.
8
1.6 Aims
This work aims to model and optimize biohydrogen production from pretreated napier grass
using immobilized mixed microbial consortium.
The specific objectives are:
1. Modeling and optimization of four hybrid pretreatment techniques for maximum release
of fermentable sugars namely xylose and glucose from napier grass
2. Modeling and optimization of biohydrogen production from the pretreated napier grass
using immobilized mixed microbial consortia
3. Semi-pilot scale biohydrogen production using napier grass substrate under optimized
process conditions.
4. Analysis of the microbial community structure involved in hydrogen production in the
semi-pilot scale reactor using 16rRNA gene sequencing analysis.
9
1.7 References
Azwar MY, Hussain MA, Abdul-Wahab AK. (2014). Development of biohydrogen production
by photo-biological, fermentation and electrochemical processes: A review. Renewable and
Sustainable Energy Reviews; 31: 158-73.
Bentley RW, Mannam SA, Wheeler SS. (2007). Assessing date of the global oil peak: The need
to use 2P reserves. Energy Policy; 35: 6364-6384
Boden TA, Marland G, Andres RJ. (2010). Global, Regional, and National Fossil-Fuel CO2
Emissions. Carbon Dioxide Information Analysis Center, Oak Ridge National Laboratory, U.S.
Department of Energy, Oak Ridge, Tenn., U.S.A. doi 10.3334/CDIAC/00001_V2010
Cardona CA, Sanchez OJ. (2006). Energy consumption analysis of integrated flowsheets for
production of fuel ethanol from lignocellulosic biomass. Journal of Energy; 31 : 2447-2459
Chang C-W, Yu W-C, Chen W-J, Chang R-F, Kao W-S. (2011). A study on the enzymatic
hydrolysis of steam exploded napiergrass with alkaline treatment using artificial neural networks
and regression analysis. Journal of the Taiwan Institute of Chemical Engineers; 42(6): 889-89
Chiara L, Zecca A. (2011). Constraints of fossil fuel depletion on global warming projections.
Energy Policy; 39: 5026-34
DEAT. (2009). Greenhouse Gas Inventory South Africa: 1990- 2000. Pretoria
Dunn S. (2002). Hydrogen futures: toward a sustainable energy system. International Journal
Hydrogen Energy; 27(3): 235-64.
Eggeman T, Elander RT. (2005). Process and economic analysis of pretreatment technologies.
Bioresource Technology 96:2019–25.
Fang HHP, Liu H. (2002). Characterization of a hydrogen-producing granular sludge.
Biotechnology and Bioengineering 78: 44-52.
Freedonia Group, Inc. (2010). World hydrogen demand and 2013 forecast. Journal of Arid
Environments; 6: 751-763
Ho Kuo-Lung, Lee Duu-Jong, Su Ay, Chang Jo-Shu. 2012. Biohydrogen from lignocellulosic
10
feedstock via one-step process. International Journal of Hydrogen Energy; 37: 15569-74
Hook M, Tang X. (2013). Depletion of fossil fuels and anthropogenic climate change- A review.
Energy Policy; 52: 797-809
Howard RL, Abotsi E, Jansen van Rensburg EL, Horward S. (2003). Lignocellulosic
biotechnology: issue of bioconversion and enzyme production. African Journal of
Biotechnology; 2: 602-619
IEA, (2008). World Energy Outlook. Available from http://www.worldenergyoutlook.org/.
Accessed 29 October 2014
IEA. (2011). Annual Energy Report. International Energy Agency. Paris, France. http://
www.iea.org pdf. Accessed 11 September 2014.
IPCC. Climate Change (2007): The Physical Science Basis. Contribution of Working Group I to
the Fourth Assessment Report of the Intergovernmental Panel on Climate Change. Cambridge,
UK: Cambridge University Press, 2007.
Kapdan IK, Kargi F. (2006). Biohydrogen production from waste materials. Enzymes and
Microbial Technology; 38: 569- 585
Kumar R, Singh S, Singh O. (2008). Bioconversion of lignocellulosic biomass: Biochemical and
molecular perspectives. Journal of Industrial Microbiology and Biotechnology; 35 (5): 377-391
Leggett LMW, Ball DA. (2012). The implication for climate change and peak fossil fuel of the
continuation of the current trend in wind and solar energy production. Energy Policy; 41: 610-
617
Levine JS. (1996). Biomass burning and global change. In: Levine JS (eds) (vol. 1) Remote
sensing and inventory development and biomass burning in Africa. The MIT Press, Cambridge,
Massachusetts, USA, pp 35.
Li C, and Fang HP. (2007). Fermentative hydrogen production from wastewater and solid wastes
by mixed cultures. Critical Review in Environmental Science& Technology; 37: 1-39.
Lopez-Arenas T, Punit R, Edgar RJ, Mauricio SC. (2010). Factors affecting the acid
pretreatment of lignocellulosic biomass: Batch and continuous process. 20th European
11
Symposium on Computer Aided Process Engineering – ESCAPE20
Mackie KL, Brownell HH, West KL, Saddler JN. (1985). Effect of sulphur dioxide and sulphuric
acid on steam exploded aspen. Journal of Wood Chemistry and Technology; 5: 405-426
McCarthy TS, Pretorius K. (2009). Coal mining on the Highveld and its implications for future
water quality in the Vaal system. IMWA Mine Water Forum, September, 19- 23, 2009, Pretoria.
Available from http://www.imwa.info/. Accessed 27 November 2014
Menne B, Ebi KL. (2006). In: Menne B, Ebi KL, eds. Climate change and adaptation strategies
for human health. Steinkopff Verlag, Darmstadt, 2006 (in press): 1-5.
Midilli A, Dincer AM ,Rosen MA. (2005). On hydrogen and hydrogen energy strategies: Current
status and needs. Renewable and Sustainable Energy Reviews; 9: 255-71
National Research Council (NRC). Advancing the Science of Climate Change. The National
Academies Press, Washington, DC, USA. (2010)
Palazzi E, Fabino B, Perego P. (2000). Process development of continuous hydrogen production
by Enterobacter aerogenes in a packed column reactor. Bioprocess Engineering; 22: 205- 213.
Piera M. (2006). Safety issues of nuclear production of hydrogen. Energy Conservation
Management; 47(17): 2732 -9.
Reddy KO, Maheswari CU, Shukla M, Rujulu AV. (2012). Chemical composition and structural
characterization of napier grass fibers 67:35-38
Ren N, Wang A, Cao G, Xu J, Gao L. (2009). Bioconversion of lignocellulosic biomass to
hydrogen: potential and challenges. Biotechnology Advances; 27(6): 1051-60
Sathre R. (2014). Comparing the heat of combustion of fossil fuels to the heat accumulated by
their lifecycle greenhouse gases. Fuel 115: 674-677.
Shafiee S, Topal E. (2009). When will fossil fuels be diminished? Energy Policy 37: 181-189
Somerville C, Youngs H, Taylor, C, Davis SC, Long SP. (2012). Feedstocks for lignocellulosic
biofuels. Journal of Science (Washington); 329(5993): 790-792
Stone D, Weaver A. (2003). Factors contributing to diurnal temperature range trends in twentieth
12
and twenty-first century simulations of the CCCma coupled model. Climate Dynamics; 20:435-
445
Suhardi VSH, Bijeta P, David S, Raj B. Evaluation of pretreatment methods for lignocellulosic
ethanol production from energy cane variety L 79-1002. International journal of biodeterioration
and biodegradation 2013: 85: 683–687
Wong YM, Ta YW, Joon CJ. 2014. A review of sustainable hydrogen production using seed
sludge via dark fermentation. Renewable and Sustainable Energy Reviews; 34: 471-482
Wongwatanapaiboon J, Vorakan B, Ratanavalee I, Pakorn W, Tikamporn Y, Warawut C. The
Potential of Cellulosic Ethanol Production from Grasses in Thailand. Journal of Biomedicine and
Biotechnology Volume 2012
Wu Shu-Yii, Lin Chi-Num, Chang Jo-Shu. 2003. Hydrogen production with immobilized
sewage sludge in three-phase fluidized-bed bioreactor. Biotechnological Progress; 19: 828-823
Zhang ML, Fan YT, Xing Y, Pan CM, Zhang GS, Lay JJ. (2008). Enhanced biohydrogen
production from Corn stalk wastes with acidification pretreatment by mixed anaerobic cultures.
Biomass Bioenergy; 31(4): 250-4
Ziska LH. Rising atmospheric carbon dioxide and plant biology: the overlooked paradigm. In
Controversies in Science and Technology, From Climate to Chromosomes. eds. Kleinman, D.L.,
Cloud-Hansen, K.A. et al. (New Rochele: Liebert, Inc. 2008) 379 - 400
13
CHAPTER 2
Napier grass (Pennisetum purpureum): a potential substrate for fermentative
biohydrogen production – A review
2.1 Abstract
The increasing energy demand and consumption has led to fossil fuels depletion, global warming
with alarming impacts on mankind. Biohydrogen is a potential clean energy carrier due to its high
energy content and non-polluting nature. Lignocellulosic substrates are amenable for
fermentative hydrogen production. Lignocellulosic napier grass holds potential as a valuable
source of fermentable sugars because of its high holocellulose content, high biomass yield and
the local availability. This review focuses on the potential of napier grass for fermentative
hydrogen production. Furthermore, the influences of different pretreatment strategies on reducing
sugar and hydrogen yields from pretreated feedstock are outlined. Finally, the effects of
different process parameters on fermentative hydrogen production from napier grass and other
lignocellulosic substrates are discussed.
Keywords: Napier grass, Biohydrogen, Pretreatment, Lignocellulose, Fermentation, Biomass
14
2.2 Introduction
The current reliance on fossil fuels derived energy has led to the depletion of fossil fuels reserves,
environmental pollution and increased carbon emissions at global scale (Lo et al., 2009a).
Global CO2 emissions are expected to increase from 31Gt in 2011 to reach approximately 37Gt by
2035 in response to increasing global energy demand (IPCC, 2013). Consequently global average
temperature increase could exceed 5°C (Stern, 2008). This will have disastrous impacts on
basic elements of human life affecting access to water supply, food production, human health
and the environment. According to the World Health Organization (WHO), millions of people
die yearly due to climate changes related causes (WHO, 2008). WHO predicts that between 2030
to 2050 climate changes will cause 250 000 additional deaths per year due to causes like
malnutrition, malaria, diarrhea and heat stress (WHO, 2008). These concerns have strengthened
the global search for renewable and environmentally friendly energy sources.
According to Dunn, (2002), hydrogen will play a major role in global renewable energy supply
by 2100. Biohydrogen is emerging as a promising alternative fuel due to its social, economic and
environmental benefits (Das and Veziroglu, 2001). Hydrogen can be produced through
physicochemical and biochemical processes. Dark fermentative hydrogen production is a
promising production route because it uses a wide range of substrates, simple reactor
configurations, has high hydrogen production rates and low energy input (Holladay et al., 2009;
Valdez-Vazquez et al., 2005; Wang and Wan, 2008). The commercialization of biohydrogen is
hindered by its high production costs (Cheng et al., 2011a). The use of lignocellulosic substrates
for fermentative biohydrogen production could lower the production costs since these feedstocks
are cheap, abundantly available and sustainable (Cheng et al., 2011b). Biomass selection for
fermentative hydrogen production depends on feedstock availability, fermentable sugars content
and cost feasibility (Kapdan and Kargi, 2006). Globally approximately 150 to 170 x109
tonnes of
lignocellulosic biomass is produced per annum (Pauly and Keegstra, 2008). South Africa
alone produces about 18 million tonnes (Mt) of lignocellulosic biomass per annum (Lynd et al.,
2003). Lignocellulosic substrates such as grasses have promising potential as feedstocks for
fermentative biohydrogen production (Morandim-Grannetti et al., 2013). Grasses have a
relatively low lignin content which is about 27%, high holocellulose content up to 66.56% and
are not key food sources for human consumption (Hamelinck et al., 2005).
15
Napier grass (Pennisetum purpureum) is a valuable source of fermentable sugars for microbial
conversion into biofuels and biomaterials (Wongwatanapaiboon et al., 2012). It is rapid growing,
invasive, C4 perennial, native and abundant in African grasslands, high biomass yielding crop
with high adaptability, pathogenic resistance abilities and high moister content (DiTomaso et al.,
2010; Smith et al., 2013). Globally, Somerville et al. (2010) reported annual cumulative dry
matter napier grass yields of 85 tons per hectare and an annual cumulative yield of 40 tons per
hectare has been recorded in South Africa (Reddy et al, 2012). The major advantages of napier
grass based fuel is the local availability of the biomass, renewability and the feasibility of
biomass conversion without high capital costs (Hoogwijk et al., 2003).
Napier grass is composed of cellulose, hemicellulose and lignin polymers tightly packed together
through ester, ether and hydrogen bonds (Nissila et al., 2014). These linkages limit biomass
hydrolysis for fermentable sugars release. Thus, napier grass requires preliminary pretreatment
for fermentable sugars solubilization prior to microbial hydrogen fermentation. Different
pretreatment strategies for napier grass hydrolysis for fermentable sugars and biohydrogen yields
have been assessed (Mosier et al., 2005).
This paper reviews the potential application of napier grass as a feedstock for fermentative
hydrogen production. The effects of different pretreatment methods on fermentable sugars and
hydrogen yields from the pretreated feedstock are discussed. Finally, the influences of process
parameters on dark fermentative hydrogen production from napier grass and other lignocellulosic
substrates are elaborated.
2.3 Composition and production of napier grass
Napier grass is composed of interlinked polymers of about 35-45% cellulose, 25-40%
hemicellulose and 20-35% lignin (Rekha and Aniruddha, 2013). Its composition varies from
place to place and seasonally. Its composition is also largely influenced by harvest times, crop
inputs, methods of analysis and analyzing extract-free napier grass (non-structural carbohydrates
are removed) or non-extract free biomass (Saxena et al., 2009). The chemical composition of
napier grass is presented in table1.
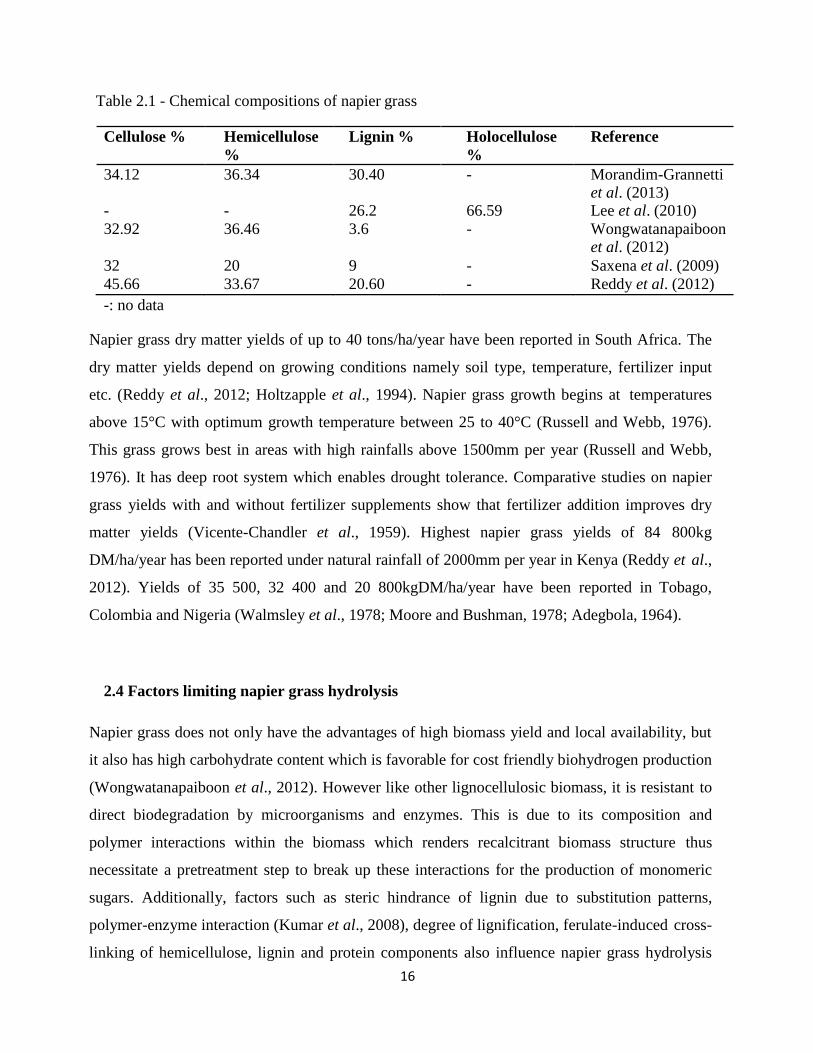
16
Table 2.1 - Chemical compositions of napier grass
Cellulose % Hemicellulose
%
Lignin % Holocellulose
%
Reference
34.12 36.34 30.40 - Morandim-Grannetti et al. (2013)
- - 26.2 66.59 Lee et al. (2010)
32.92 36.46 3.6 - Wongwatanapaiboon et al. (2012)
32 20 9 - Saxena et al. (2009)
45.66 33.67 20.60 - Reddy et al. (2012)
-: no data
Napier grass dry matter yields of up to 40 tons/ha/year have been reported in South Africa. The
dry matter yields depend on growing conditions namely soil type, temperature, fertilizer input
etc. (Reddy et al., 2012; Holtzapple et al., 1994). Napier grass growth begins at temperatures
above 15°C with optimum growth temperature between 25 to 40°C (Russell and Webb, 1976).
This grass grows best in areas with high rainfalls above 1500mm per year (Russell and Webb,
1976). It has deep root system which enables drought tolerance. Comparative studies on napier
grass yields with and without fertilizer supplements show that fertilizer addition improves dry
matter yields (Vicente-Chandler et al., 1959). Highest napier grass yields of 84 800kg
DM/ha/year has been reported under natural rainfall of 2000mm per year in Kenya (Reddy et al.,
2012). Yields of 35 500, 32 400 and 20 800kgDM/ha/year have been reported in Tobago,
Colombia and Nigeria (Walmsley et al., 1978; Moore and Bushman, 1978; Adegbola, 1964).
2.4 Factors limiting napier grass hydrolysis
Napier grass does not only have the advantages of high biomass yield and local availability, but
it also has high carbohydrate content which is favorable for cost friendly biohydrogen production
(Wongwatanapaiboon et al., 2012). However like other lignocellulosic biomass, it is resistant to
direct biodegradation by microorganisms and enzymes. This is due to its composition and
polymer interactions within the biomass which renders recalcitrant biomass structure thus
necessitate a pretreatment step to break up these interactions for the production of monomeric
sugars. Additionally, factors such as steric hindrance of lignin due to substitution patterns,
polymer-enzyme interaction (Kumar et al., 2008), degree of lignification, ferulate-induced cross-
linking of hemicellulose, lignin and protein components also influence napier grass hydrolysis
17
for fermentable monomeric sugars production (Liong et al., 2012; Mosier et al., 2005).
The lignin is made up of a framework of phenyl propane units namely coniferyl, guaracyl,
syringyl and syringyl alcohol. High concentrations of these phenyl propane units gives biomass
rigidity, protection against pathogen attacks, provides strength, water proof and hindrance to
hydrolysis by forming a steric barrier limiting enzymatic penetration (Kumar et al, 2008). The
lignin barrier also causes non-specific binding of cellulases thus reducing productive cellulose
hydrolysis of biomass due to low polymer-enzyme interactions (Kumar et al., 2012; Mood et al.,
2013). Ferulate-induced cross-linking of hemicellulose, lignin and protein components are
thought to limit degradation of napier grass, however unambiguous evidence is lacking (Faulds
et al., 2002). When napier grass was pretreated with ferulate cross-links cleaving chemicals,
hydrolysis was enhanced (Faulds et al., 2002). Correlative studies are limited due to high
variability of the ferulates incorporated into hemicellulose and lignin (Kumar et al., 2008).
Physico-chemical, physical, chemical and enzymatic strategies have been used for the
conversion of napier grass to fermentable monomeric sugars (Liong et al., 2012; Mosier et al.,
2005). Challenges in using napier grass as a fermentable feedstock include high costs of
hydrolytic enzymes (cellulases), inhibitory compounds production, internal reactor structure
corrosion, low sugar yields and high energy costs.
2.5 Pretreatment strategies to enhance microbial hydrolysis of napier grass
The pretreatment processes decompose polymeric components of lignocellulosic biomass thus
forming simple monomeric sugars (Zilliox and Debeire, 1998). This enhances the accessibility of
fermentable sugars to enzymatic hydrolysis (Kumar et al., 2009). An effective pretreatment
strategy must be economically feasible, reduce biomass particle size and have high yields of
fermentable sugars. Additionally, it must not produce toxic byproducts mostly phenolic
compounds that are inhibitory to downstream fermentation processes (Lynd et al., 1996; Wyman,
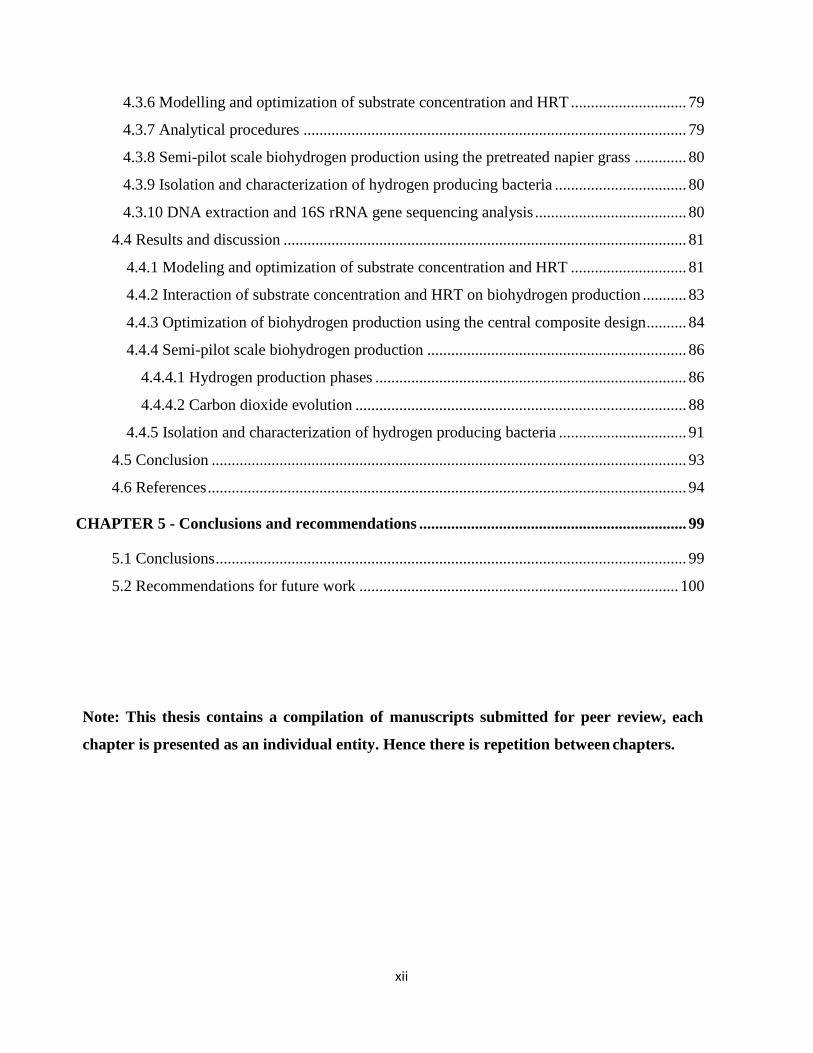
1995, 1996, 1999; Delgenes et al., 1996). Figure 2.1 illustrates the schematic diagram of
fermentative hydrogen production from napier grass and other lignocellulosic substrates. A
number of pretreatment strategies have been investigated for effective pretreatment of napier
grass for hydrogen and reducing sugar yields. Table 2.1 shows the hydrogen yields and
fermentable sugars production from napier grass and selected lignocellulosic feedstocks
pretreated using different strategies.
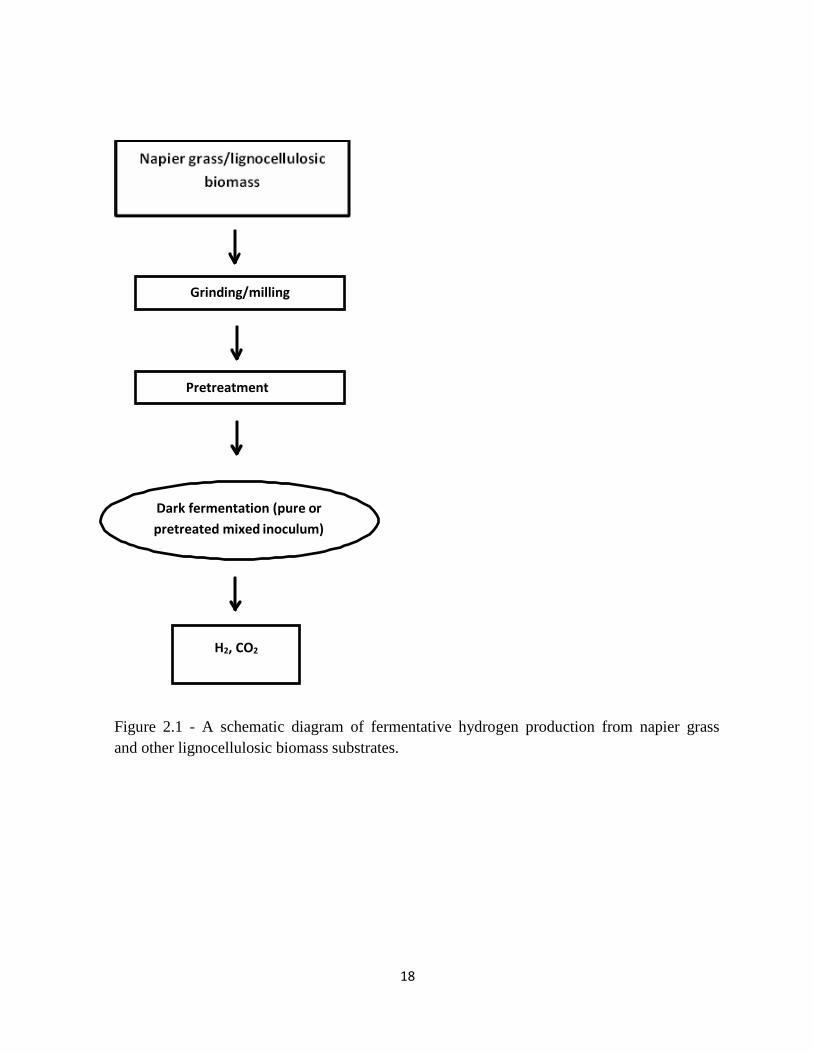
18
Figure 2.1 - A schematic diagram of fermentative hydrogen production from napier grass
and other lignocellulosic biomass substrates.
Grinding/milling
Pretreatment
H2, CO2
Dark fermentation (pure or
pretreated mixed inoculum)
19
2.5.1 Chemical pretreatment
Alkaline and acid pretreatment strategies are the most studied chemical pretreatment methods for
hydrolysis of napier grass and other lignocellulosic substrates. Alkaline pretreatment has been
used to effectively improve napier grass hydrolysis for biofuel production. Alkaline pretreatment
uses bases namely NaOH, Ca(OH)2, KOH and NH3.H2O to cleave lignin-carbohydrates linkages
and solubilize lignin for fermentable sugars release from lignocellulosic biomass (Zheng et al.,
2014). NaOH is the most studied base in alkaline pretreatment, it has been used to pretreat corn
stover, napier grass, wheat straw and sunflower stock (Zheng et al., 2014).
Rekha and Aniruddha, (2013) studied the effect of NaOH concentration (0.3 to 0.9%),
temperature (60 to 80˚C) and time (60 to 180 min) on biogas production from napier grass. The
authors observed significant increase of biogas and biomethane production (390ml/gTS and
171ml/gTS respectively) after napier grass pretreatment with 0.6%NaOH at 90˚C for 120min
compared to untreated napier grass where yields of 157ml/gTS and 46ml/gTS respectively were
reported. This indicates that NaOH pretreatment improved biogas yields from the biomass. A
comparative study of napier grass pretreated with NaOH and HCl has been reported by Cui and
Shen (2012). The pretreated and untreated substrates were used in dark fermentative hydrogen
production. A cumulative hydrogen volume of 19.25 ml was observed from the 0.5% NaOH
pretreated feedstock compared to 4.38 ml from untreated napier grass, thus a 4.39 fold increase
after pretreatment. For acid pretreatment a maximum cumulative volume of 72.21 ml was
observed when napier grass was treated using 4% HCl, thus a 16.72 folds increase to untreated
biomass. Further investigation showed that a 4% HCl had a 3.75 fold higher cumulative hydrogen
production than 0.5% NaOH, thus suggesting HCl as a better pretreatment strategy for napier
grass. Napier grass pretreatment with biological (using Phanerochaete chrysosporium) and
alkaline pretreatment methods for bioethanol production have been reported by Liong et al.,
2012. The biologically and alkaline pretreated feedstocks were comparatively used for bioethanol
production. The authors observed glucose yields of 0.74g glucose/g substrate and 0.43g
glucose/g substrate for 7% NaOH and Phanerochaete chrysosporium pretreated napier grass
respectively, thus a 0.31 higher glucose from alkaline pretreated napier grass. This suggests
alkaline pretreatment as a better pretreatment method for napier grass hydrolysis to biological
pretreatment.
Shamsuddin, (2013) optimized alkaline pretreatment conditions of napier grass for maximum
20
lignin solubilization. Napier grass was pretreated using 5 to 10% NaOH concentrations at
temperatures 20 to 60˚C for 30 to 90 minutes. A maximum lignin solubilization of 56.27% was
achieved using 7.29% NaOH at 43˚C for 75 minutes with 11.34mg/ml reducing sugar yield. This
implies that NaOH pretreatment improved solubilization of lignin from the biomass. Although
alkaline pretreatment of napier grass using NaOH is cost effective and efficient, it however
causes Na+
ion inhibition during anaerobic digestion for biohydrogen production. Furthermore,
disposal of Na+
containing effluent from fermentation systems could results to negative
environmental impacts such as water pollution and soil salinization.
Acid hydrolysis of biomass uses organic and inorganic acids namely HCl, H2SO4, HNO3, H3PO4
and maleic acid under varied concentrations ranging from 0.1 up to 70% to solubilize lignin for
fermentable sugars generation from biomass. The efficiency of acid pretreatment majorly
depends on the type of acid, concentration of acid, solid to liquid ratio, temperature and duration.
High acid concentrations (from 30% up to 70%) have been reported as most effective in lignin
solubilization however these concentrations are dangerous, toxic and result in bioreactor internal
structures corrosion (Behera et al., 2014). Therefore it is more economical to use dilute acid
(concentrations less than 10%) hence extensive research studies have been conducted using
dilute acid for biomass hydrolysis. Dilute acid pretreatment has been observed to generate lower
concentrations of inhibitory compounds namely phenols than concentrated acid pretreatment
(Behera et al., 2014). It is also less toxic, hazardous and corrosive (Sun and Cheng, 2002).
H2SO4 is the most commonly used acid for biomass pretreatment. Techno-economic analysis of
pretreatment strategies of lignocellulosic biomass suggested dilute acid pretreatment as most
economical and practical for industrial scale application (Eggeman and Elander, 2005). Dilute
acid pretreatment has also been observed to have consistent high release of fermentable sugars
and short residence times. Orozco et al. (2007) studied the influence of dilute acid pretreatment on
the hydrolysis of napier grass. Napier grass was pretreated with 2% H2SO4 at 90˚C for 90
minutes. A reduction in hemicellulose and lignin concentrations from 20.9 to 13.5% and from
19.4% to 13.4% respectively was observed after dilute acid pretreatment. Acid pretreatment
hydrolyzes mostly hemicellulose component of the biomass. Hemicellulose degradation releases
simple products namely xylose, mannose, galactose and acetic acid. Industrial processes
currently use pretreatment temperatures above 150°C, these high temperatures results in further
sugar degradation to furfural, hydroxymethyl furfural, levulinic acid and formic acid (Aguilar et
21
al., 2002; Cao et al., 2009). These compounds are inhibitory to downstream fermentative
biohydrogen production. Therefore quantification and removal of these compounds is necessary,
however this increases process costs (Aguilar et al., 2002).
2.5.2 Physico-chemical pretreatment methods of napier grass
Steam explosion is the only physico-chemical pretreatment strategy that has been investigated
for napier grass pretreatment. The efficiency of steam explosion is a function of pretreatment
duration (how long the steam/biomass interaction is maintained), temperature, particle size and
moisture content of lignocellulosic biomass (Duff and Murray, 1996). In steam explosion,
biomass is mixed with either water or catalyzed with acid or base and exposed to high
temperatures ranging from 160 to 260˚C, high pressure ranging from 0.69 to 4.83 MPa for a
short duration less than 30 min (Duff and Murray, 1996). The combination of high pressure,
temperature and short duration causes a disruption of the fibrous structure of biomass thus
improving biomass hydrolysis (Teymouri et al., 2005).
The study of enzymatic hydrolysis of steam exploded napier grass using Artificial neural network
(ANN) and regression analysis has been reported by Chang et al. (2011a). The input variables
were three steam explosion parameters namely temperature ranging from 160˚C to 210˚C,
reaction time from 2 to 20 minutes and particle size (1 and 5mm). The authors observed a
reduction in glucan, xylan and lignin (67.3, 6.83 and 20.02% respectively) at 210˚C for 20
minutes from 1mm particle size. A decrease in temperature and time to 160˚C for 2 minutes
resulted in a significant decrease in glucan, xylan and lignin components (47.3, 22.5 and 10.8%).
The results showed that steam explosion temperature was the most significant parameter among
the studied variables. Steam explosion however, results in xylan fraction destruction, inhibitory
phenolic compounds production, incomplete lignin-carbohydrate matrix disruption and has high
energy requirements (Mackie et al., 1985). Steam explosion coupled with acids or bases namely
H2SO4 and NaOH has been observed to generate inhibitory phenolic compounds derived from
carbohydrate degradation. These phenolic compounds have been reported as detrimental
compounds to biofuel producing microorganisms in anaerobic digestion phase. Thus suitable
detoxification strategies are necessary after biomass pretreatment preliminary to anaerobic
digestion.
22
2.5.3 Biological pretreatment of napier grass
Biological pretreatment uses microorganisms and their enzyme systems for the hydrolysis of
lignin from biomass to expose carbohydrates for enzymatic hydrolysis for biofuel and
biomaterial production. Compared to chemical and physico-chemical hydrolysis, enzymatic
pretreatment is more cost effective since it is conducted under mild conditions (at temperatures
less than 50°C and pH around 4.8) (Duff and Murray, 1996). Fungal and microbial species
hydrolyze cellulose using cellulases enzyme systems. The cellulases are composed of
endoglucanases, exoglucanases and cellobiases which work synergistically for cellulose
hydrolysis (Sun and Cheng, 2002). The endoglucanases cleave the β-1-4 glycosidic bonds of
cellulose thus creating free chain-ends in cellulose. The exoglucanases cleaves on the free chain-
ends to release cellobiose which is hydrolyzed by the cellobiases into glucose (Sun and Chen,
2002). Xylan hydrolysis which is the major polymer in hemicellulose is catalyzed by xylanase
enzyme systems. These xylanases are composed of endoxylanase, exoxylanase and xylosidase.
The endoxylanase hydrolyses the 1-4 bonds between D-xylose of heteroxylans and xylo-
oligosaccharides. The exoxylanases cleave the free chain-end of xylan thus releasing xylobiose
which is hydrolysed by xylobiase into xylose. The different substituted groups in xylans are
hydrolyzed by accessory enzymes namely the arabinofuranosidase, glucuronidase and acetylxylan
esterase (Saha, 2003). In many enzymatic biomass hydrolysis studies enzyme inhibition has been
observed to negatively affect the efficiency of enzymatic hydrolysis processes thus optimum
enzyme doses depending on the properties and concentration of each substrate must be
investigated and used.
Biological hydrolysis of napier grass has been studied and reported by Lo et al. (2009b). The
authors used thermophilic bacterial isolate (Clostridium strain TCW 1) for the hydrolysis of α
cellulose, napier grass and bagasse for biohydrogen production. After hydrolytic experiments,
the total reducing sugars concentrations of 1.22, 1.28 and 4.52 g/l were reported from napier
grass, bagasse and α cellulose respectively. Maximum hydrogen yields of 7.40, 6.94 and
2.79mmol H2/g reducing sugars were reported using pretreated hydrolyzates from napier grass,
bagasse and α cellulose as substrates for biohydrogen production by Clostridium butyricum
CGS5. Hence the biological pretreatment was observed efficient for reducing sugar yields and
biohydrogen production from napier grass, bagasse and α cellulose.
23
Wen et al. (2014), investigated the effect of biological pretreatment of napier grass by three
different microbial consortia through concurrent saccharification and anaerobic digestion.
Comparative analysis of the efficiencies of the three microbial consortia was made based on
degradation ability, sugars and biogas yields. The biomass pretreated using microbial consortia
from plant litter and soil (dominant species: Coprinus cinereus and Ochrobactrum sp.) gave
highest sugars and biogas yields 43.4% and 279ml/gVS respectively. This was 1.49 times higher
than the untreated control. These results suggested that biological pretreatment is capable of
significantly enhancing sugar and biogas yields from napier grass. Application of biological
pretreatment of biomass is however limited by the long pretreatment duration thus making it
unviable for commercial application. Research for industrial application of this pretreatment
strategy is still needed to address key concerns such as cost feasibility, improving sugar yields,
selectivity and efficiency (Zheng et al., 2014).
2.5.4 Pretreatment combinations on napier grass hydrolysis
Napier grass hydrolysis by physico-chemical, chemical and biological strategies has been
investigated. Studies revealed that each of the single pretreatment gives limited sugar yields due
to specific mode of action (namely HCl only targets hemicellulose primarily, but not lignin) and
intrinsic disadvantages. To overcome this, combined pretreatment methods which are the use of
two or more pretreatment techniques on biomass are now being explored. The pretreatment
combinations have been reported to be beneficial in enhancing sugar yields, reducing
pretreatment duration and increasing severity. However, their use could increase pretreatment
costs. Economic analysis is therefore key to assess biohydrogen production cost from napier
grass pretreated using combined pretreatment methods. Lo et al. (2009b) combined biological and
temperature-shift-enhanced pretreatment techniques for reducing sugar production from napier
grass. Reducing sugar yields of 0.184g/l were observed from napier grass hydrolyzates pretreated
using temperature shift strategy (35 to 45˚C) and Clostridium butyricum CGS5 compared to using
a constant temperature of 35˚C where 0.036g/l reducing sugars was obtained. Thus it was
concluded that pretreatment hybridization enhances reducing sugar production. Redding et al.
(2011) studied the influence of high temperature and dilute acid combination on bermuda grass
hydrolysis. Dilute H2SO4 concentration range 0.3 to 1.2%, high temperature range 120 to 180˚C
and pretreatment duration from 5 to 60 min was investigated for optimal reducing sugars
generation from bermuda grass. The authors observed maximum reducing sugar yield of 94%
24
using 1.2% H2SO4 at 140˚C for 30 minutes.
Yu et al. (2013) combined ozone and soaking aqueous ammonia for the pretreatment of lawn
grass for enhanced reducing sugar production. The ozonation reaction was performed under 5.3%
ozone (0.79g O3 /g TS) at a flow rate of 2000ml/min for 10min. The hydrolyzed mixture was
further soaked in 30% ammonia hydroxide solution at 50˚C for 24 hours. Maximum sugar
recovery of 89.63% reducing sugar was observed after the combined pretreatment compared to
48.50 and 56.71% reducing sugars observed after ozone and soaking aqueous ammonia
pretreatment respectively were applied. Bohorquez et al. (2014) studied the effect of peroxide
and enzymatic pretreatment combinations on the reducing sugar yields from napier grass. The
authors observed reducing sugar yields of 287.8mg/g and 245.81mg/g glucose and xylose
respectively. It was therefore concluded that peroxide and acid pretreatment combinations
enhanced the reducing sugar yields from napier grass.
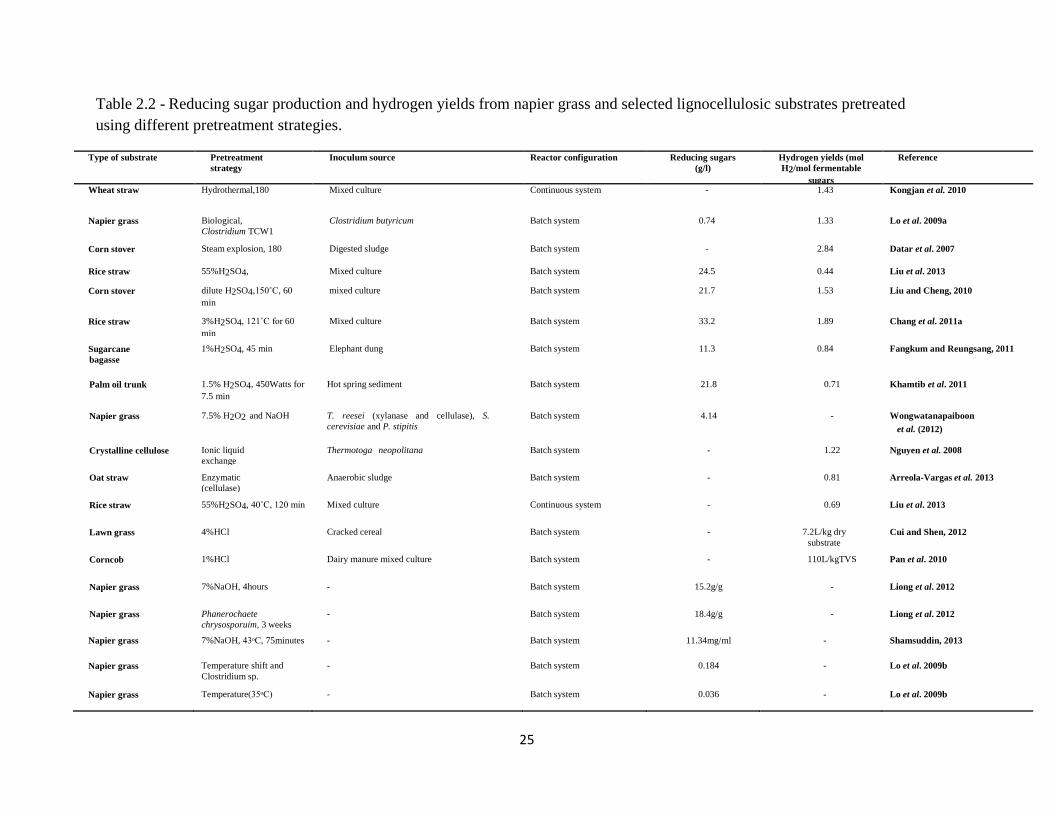
25
Table 2.2 - Reducing sugar production and hydrogen yields from napier grass and selected lignocellulosic substrates pretreated
using different pretreatment strategies.
Type of substrate Pretreatment
strategy
Inoculum source Reactor configuration Reducing sugars
(g/l)
Hydrogen yields (mol
H2/mol fermentable
sugars
Reference
Wheat straw Hydrothermal, 180 Mixed culture Continuous system - 1.43 Kongjan et al. 2010
Napier grass Biological,
Clostridium TCW1
Clostridium butyricum Batch system 0.74 1.33 Lo et al. 2009a
Corn stover Steam explosion, 180 Digested sludge Batch system - 2.84 Datar et al. 2007
Rice straw 55%H2SO4,
40˚C, 120 min
Mixed culture Batch system 24.5 0.44 Liu et al. 2013
Corn stover dilute H2SO4,150˚C, 60
min
mixed culture Batch system 21.7 1.53 Liu and Cheng, 2010
Rice straw 3%H2SO4, 121˚C for 60
min
Mixed culture Batch system 33.2 1.89 Chang et al. 2011a
Sugarcane
bagasse
1%H2SO4, 45 min Elephant dung Batch system 11.3 0.84 Fangkum and Reungsang, 2011
Palm oil trunk 1.5% H2SO4, 450Watts for
7.5 min
Hot spring sediment Batch system 21.8 0.71 Khamtib et al. 2011
Napier grass 7.5% H2O2 and NaOH T. reesei (xylanase and cellulase), S.
cerevisiae and P. stipitis
Batch system 4.14 - Wongwatanapaiboon
et al. (2012)
Crystalline cellulose Ionic liquid
exchange
Thermotoga neopolitana Batch system - 1.22 Nguyen et al. 2008
Oat straw Enzymatic
(cellulase)
Anaerobic sludge Batch system - 0.81 Arreola-Vargas et al. 2013
Rice straw 55%H2SO4, 40˚C, 120 min Mixed culture Continuous system - 0.69 Liu et al. 2013
Lawn grass 4%HCl Cracked cereal Batch system - 7.2L/kg dry
substrate
Cui and Shen, 2012
Corncob 1%HCl Dairy manure mixed culture Batch system - 110L/kgTVS Pan et al. 2010
Napier grass 7%NaOH, 4hours - Batch system 15.2g/g - Liong et al. 2012
Napier grass Phanerochaete
chrysosporuim, 3 weeks
- Batch system 18.4g/g - Liong et al. 2012
Napier grass 7%NaOH, 43ᵒC, 75minutes - Batch system 11.34mg/ml - Shamsuddin, 2013
Napier grass Temperature shift and
Clostridium sp.
- Batch system 0.184 - Lo et al. 2009b
Napier grass Temperature (35ᵒC) - Batch system 0.036 - Lo et al. 2009b
26
2.6 Biohydrogen production from napier and other lignocellulosic substrates
2.6.1 Influences of pretreatment methods on fermentable sugars and hydrogen yields
The effect of pretreatment strategies on fermentable sugars yields as well as hydrogen yields
from pretreated napier grass and other lignocellulosic substrates have been reported (Chandra et
al., 2007; Cheng et al., 2011). Direct biomass fermentation has low sugar and hydrogen yields
compared to pretreated biomass. Theoretical hydrogen yields from hexose sugars as the sole
carbon source are 4mol H2/mol hexose (Nissila et al., 2014). The highest documented hydrogen
yield on hexose sugar is 3mol H2/mol hexose from lignocellulosic corn stover pretreated using
hybrid pretreatments namely steam explosion and sulfuric acid (Datar et al., 2007). The highest
hydrogen yield reported from napier grass is 1.33mol H2/mol hexose when the biomass was
pretreated using moist heat and Clostridium TCW1 (Lo et al., 2009b). These yields are high and
cost competitive when compared to hydrogen yields observed from pure hexose (glucose) with
mixed cultures from digested sludge, cow manure and pure culture Caldicellulosiruptoc
saccharolyticum which gave 2.88, 2.56 and 3.60 mol H2/mol glucose respectively (Wang and
Wen, 2008; Yokoyama et al., 2007; de Vrije et al., 2007). Competitively high hydrogen yields
have also been reported from biomass pretreated using single hydrothermal pretreatment. This
strategy however has high energy demand thus is costly (Jung et al., 2011). Biological
pretreatments also have promising hydrogen yields however the long pretreatment durations and
optimization of growth conditions limit industrial feasibility of this strategy (Datar et al., 2007).
In contrast, low hydrogen yields with significant batch to batch variations have been reported
from biomass pretreated using single strategies such as ionic liquid, alkaline and concentrated
acid (Kapdan and Kargi, 2006). For the alkaline and concentrated acid pretreated biomass these
low yields are likely due to the formation of inhibitory compounds (Kapdan and Kargi, 2006).
The ionic liquid strategy still requires further studying and optimization for higher hydrogen
yields. Further studies on the optimization of pretreatment methods or combinations are necessary
for optimum fermentable sugars and hydrogen yields from napier grass and other
lignocellulosic substrates.
27
2.7 Influences of process parameters on hydrogen fermentation
The direct conversion of napier grass and other lignocellulosic feedstocks to hydrogen is hindered
by substrate composition limiting readily hydrolysis of biomass by microbial enzymes. This is
because the conditions for optimum lignocellulose hydrolysis are different from the
conditions for optimum hydrogen production. For example, optimum pH for efficient
lignocellulose hydrolysis has been reported near neutral while for hydrogen production the
reported optimum is between pH 5.0 to 5.5 (Calli et al., 2008; Li and Fang, 2007). The influences
of different physico-chemical parameters affecting hydrogen production for napier grass and
other lignocellulosic biomass are detailed.
2.7.1 Temperature
Hyperthermophilic (above 70°C), thermophilic (between 50 to 60°C) and mesophilic (between
20 to 40°C) microbial cultures have been studied for hydrogen production from fermentable
sugars from napier grass and other lignocellulosic substrates. Cakir et al. (2010) studied the
effect of temperature on hydrogen production from acid pretreated lignocellulosic wheat straw.
The authors observed that increasing temperature from the mesophillic to the thermophillic ranges
increases hydrogen yields and shortens the lag phase duration. Similar observations have been
made from lignocellulosic bagasse pretreated using a combination of moist heat and enzymatic
hydrolysis (Chairattanamakorn et al., 2009). A study by Nissila et al. (2012), reported highest
hydrogen yield from concentrated acid pretreated lignocellulosic pulp at 28°C. The authors
observed that a change in temperature to any value above or below 28°C, affected the
distribution of soluble metabolites thus resulted in low hydrogen yields.
2.7.2 pH
The optimal pH values for maximum hydrogen production from carbohydrates have been
reported to range from 5.2 to 7.0 (Lin and Fang, 2007). Initial pH values of 5 and 9 have been
observed to give low hydrogen yields. For each fermentation process the initial pH depends on
the hydrogen producing community used. Most studies have investigated the effect of initial pH
with no further pH control throughout the fermentation duration. For lignocellulosic biomass
fermentation initial pH values of 6.0 and 7 with mixed culture from anaerobic sludge and cow
compost respectively have been reported (Zhang et al., 2007; Fan et al., 2006). Optimum initial
28
pH values of 5.5 and 8.0 have also been reported with Clostridium butyricum and dairy manure
mixed bacterial culture respectively (Pattra et al., 2008; Pan et al., 2010). These initial pH values
only indicate suitable start pH regions; these however do not indicate optimum pH for hydrogen
production. Therefore, studies under controlled pH are necessary for optimum hydrogen yields.
2.7.3 Hydraulic retention time (HRT)
Hydraulic retention time (HRT) is an important parameter in hydrogen production from napier
grass and other lignocellulosic biomass. It determines utilization of the substrate. For continuous
hydrogen production from solubilized organic matter, HRT values ranging from 8 to 12 hours
have been reported suitable (Shin et al., 2004). Studies by Veeravalli et al. (2014) for optimizing
hydrogen production from steam exploded switch grass showed that lowering the HRT from 16
to 8 hours reduces the methanogenic population and increases the hydrogen producing
Clostridium sp. population in a continuous system of hydrogen production. In contrast, studies
by Won and Lau, (2011) and Lui et al. (2008) observed no significant change in the
methanogenic population when the HRT was decreased from 16 to 8 hours. The authors
concluded that lowering the HRT must be coupled with lowering pH for effective reduction in
the methanogenic bacterial population.
2.7.4 Inhibitory compounds
Subsequent to lignocellulosic biomass pretreatment through steam explosion, acid and alkaline
pretreatment methods compounds such as furfural, hydroxymethyl furfural (HMF) and carboxylic
acids have been observed to form. These are xylose and glucose oxidation products. Other
phenolic compounds from partial lignin degradation have also been reported (Cao et al., 2010).
These compounds have negative effects on dark fermentative hydrogen production. The furfural
and the HMF compounds lower microbial enzyme activity during dark fermentation. They also
inhibit RNA and protein synthesis while degrading microbial DNA molecules (Liu et al., 2004).
The phenolic compounds irreversibly disrupt microbial cell membranes (Quemeneur et al., 2012).
While carboxylic acids tend to diffuse into microbial cells thus lowering intracellular pH which
inhibits hydrogen production.
The influence of varying concentrations of furfural, HMF and other inhibitory compounds on
hydrogen production from xylose with Thermoanaerobacterium thermosaccharolyticu W16 has
been reported by Cao et al. (2010). The authors observed total hydrogen inhibition at furfural
29
and HMF concentrations above 1.5 and 2.0g/l respectively. Syringaldehyde inhibited hydrogen
production at 1.0g/l while acetic acid and vanillin at 10 and 2g/l respectively. For heat shock
pretreated anaerobic sludge, furfural concentration of 1,0g/l caused a significant decrease in
hydrogen yield from xylose (Quemeneur et al., 2012). The authors reported hydrogen yields of
0.51mol H2/mol hexose with added furfural compared to 1.67mol H2/mol hexose with no furfural
addition. The addition of phenolic compounds had a minor effect on hydrogen yield as 1.28mol
H2/mol hexose was observed with added phenolic compounds compared to 1.67mol H2/mol
hexose with no phenolic compounds addition.
Detoxification is necessary to remove these inhibitory compounds before downstream dark
fermentative hydrogen production. Total hydrogen inhibition was observed by Chang et al.
(2011b) when concentrated acid hydrolyzed rice straw was used as a feedstock for hydrogen
production. The authors then detoxified the pretreated rice straw with Ca(OH)2 to remove furfural
compounds and observed increased hydrogen yields. Detoxification uses chemical, physical and
biological methods namely charcoal, cation exchange resin, activated carbon, overliming and
yeast to remove inhibitory compounds after lignocellulosic biomass pretreatment (Sagnak et al.,
2011). Optimization of the detoxification conditions is essential for maximizing hydrogen yields
from napier grass and other lignocellulosic biomass.
2.7.5 Biomass concentration
The hydrogen yield and the rate of hydrogen production increases with increasing biomass
concentration however up to a certain concentration. Biomass concentrations above optimum set
point result to the accumulation of volatile fatty acids (VFAs) which are known to inhibit
hydrogen production (Sagnak et al., 2011). The accumulation of VFAs lowers the pH in the
fermentation medium to levels below optimum pH thus inhibiting microbial activity of hydrogen
producers (Fan et al., 2006). Furthermore, biomass concentrations above optimum tend to form
higher concentrations of inhibitory compounds (Kongjan et al., 2010). These also increase lag
phase duration, cause substrate inhibition and also increase hydrogen partial pressure thus
resulting to low hydrogen yields (Chu et al., 2011). The influences of biomass concentration on
hydrogen yield have been investigated in batch systems (Pan et al., 2010). These studies observed
at high substrate concentrations, the accumulation of VFAs, accelerated pH decrease, significant
increase in the hydrogen partial pressure and very low hydrogen yields (Pan et al., 2010). It is
therefore necessary to optimize substrate concentration for maximum hydrogen yields.
30
2.8 Batch versus continuous fermentative hydrogen production from pretreated napier
grass and other lignocellulosic substrates
Various studies on dark fermentative hydrogen production from napier grass and other
lignocellulosic substrates have been have been reported under batch mode. The batch systems
have the advantages of being easily operated and flexible over continuous system (Guo et al.,
2010). However, at an industrial scale context, continuous systems are recommended due to
economic considerations and waste stock management. Continuous hydrogen fermentations from
napier grass and other lignocellulosic substrates are scarcely reported. In the continuous and batch
hydrogen production systems from lignocellulosic biomass, the highest reported hydrogen yield
was 3.38mol H2/mol hexose obtained from Caldimonas taiwanensis pretreated starch (Chen et
al., 2009) and 3.00mol H2/mol hexose from steam exploded corn stover respectively (Datar,
2007). A study by Kongjan et al. (2010) observed low inhibitory compounds concentrations
in a continuous hydrogen production system from concentrated acid hydrolyzed lignocellulosic
wheat straw. Continuous hydrogen production systems give higher hydrogen yields than batch
production systems. Liu et al. (2013), reported a 1.5 times higher hydrogen yield from
concentrated acid pretreated rice straw in a continuous system than in batch system. Veeravalli
et al. (2014), studied the optimization of hydrogen production from steam-exploded switch grass
in an upflow anaerobic sludge blanket using a mixed anaerobic culture. The optimum pH and
HRT set points were 5 and 10 hours respectively with a hydrogen yield of 99.86ml/g TVS.
Microbial community analysis revealed a 50% reduction in the abundance of methanogenic
population when the HRT was lowered from 16 to 8 hours and pH decreased from 7 to 5. Thus
the higher hydrogen yields in continuous hydrogen production systems could also be attributed to
the suppression through washing-out of hydrogen consuming methanogens while retaining both
spore and non-spore forming hydrogen producing microorganisms at low pH and HRT values.
Further studies need to focus on the optimization of significant process variables for fermentative
hydrogen production from napier grass and other lignocellulosic substrate in continuous flow
reactor systems. These significant process variables include biomass concentration, process pH,
process temperature and HRT.
31
2.9 Influence of microbial communities producing hydrogen from napier grass and other
lignocellulosic substrates
Very few studies have reported the effect of microbial community composition on hydrogen and
sugar yields from napier grass and other lignocellulosic substrates.
2.9.1 Hydrogen production using pure cultures
Only a small fraction of microorganisms have the ability to directly convert napier grass and
other lignocellulosic biomass into hydrogen. A study by Wang et al. (2008) demonstrated that
Clostridium acetobutylicum X9 can ferment microcrystalline cellulose into hydrogen with a
reported hydrogen production of 6.4mmolH2/h/g dry cell. Levin et al. (2006) reported that
Clostridium thermocellum 27405 generated 1.0mol H2/mol glucose from delignified wood fibers.
Generally, the use of pure cultures for hydrogen production at industrial scale is not
recommended. This is because pure cultures require microbial strain isolation, culturing,
purification and characterization before use which can be time consuming and labor intensive.
Another major drawback is that only a small fraction of microorganisms can be cultured on
synthetic medium.
2.9.2 Hydrogen production using mixed cultures
Mixed microbial cultures have been reported to be able to convert napier and other lignocellulosic
biomass into biohydrogen (Lay, 2001; Ginkel et al., 2001). These have greater conversion rates
and utilize broad carbon sources compared to pure cultures (Fang et al., 2002). Mixed microbial
cultures exist in the environmental sources such as compost or anaerobic sludge. These are
excellent for cellulose hydrolysis. The highest hydrogen yield reported is 18mmol H2/g substrate
from microcrystalline cellulose feedstock using heat-shocked anaerobic sludge (Liu et al., 2003).
Wang et al. (2008) used co-cultures of C acetobutylicum X9 and Ethanoigenens harbinense B49
for simultaneous hydrolysis and hydrogen production from microcrystalline cellulose through
dark fermentation. The authors obtained a hydrogen yield of 16.2mg H2/g cellulose. Further
studies on the process dynamics revealed that E. harbinense rapidly consumes the reducing
sugars produced from cellulose hydrolysis by C. acetobutylicum. This enhanced the hydrolysis
of cellulose which led to improved hydrogen production rate and yield.
32
2.9.3 Hydrogen production using immobilized microbial cultures
Microbial cell immobilization has been observed to significantly enhance biomass retention and
hydrogen yields thus allowing optimum hydrogen production (Wu et al., 2005). In continuous
hydrogen production systems cell immobilization allows better hydrogen retention and stable
operation even at high dilution rates. Studies on the use microbial cell immobilization on
fermentative hydrogen production from napier grass and other lignocellulosic substrate are rarely
reported. Nomura et al. (2013) studied isolation and characterization of novel hydrogen
producing Clostridium sp. This hydrogen producing strain was immobilized onto copolymer
PEG-b-PPG, a maximum hydrogen yield of 2.91mol H2/mol glucose was observed. Thus a 6-
fold higher yield to the suspended isolate (0.45 molH2/mol glucose).
2.10 Other biofuels and biomaterials from napier grass
Lin et al. (2010) studied response surface optimization for ethanol production from napier grass
using Klebsiella oxytoca THLCO409. The effect of fermentation duration, initial pH, yeast
concentration and temperature on ethanol production from napier grass was evaluated.
Maximum ethanol concentration of 472ppm was observed after 11 days of fermentation, at pH 7,
7.0g/l yeast extracts concentration with a temperature set point at 31˚C. The optimal conditions
and ethanol concentration observed in this study are indicative for the potential application
of napier grass as a feedstock for ethanol production. Wongwatanapaiboon et al. (2012)
evaluated the use of 8 different grasses as feedstock for bioethanol production by Saccharomyces
cerevisiae and Pseudomonas stipites. The feedstocks were pretreated with 7.5% alkaline
peroxidase, pH 11.5 for 24 hours at 35˚C. Highest ethanol yield of 1.14g/l was observed from
vetiver grass while 0.97g/l was observed from napier grass. Considering dry matter yields,
napier grass was deemed a better feedstock since it has higher annual dry matter yields
2720.55L/ha/year compared to 1091.84L/ha/year for vetiver grass. Rekha and Aniruddha, (2013)
reported a methane yield of 0.158m3CH4/kgTS from napier grass pretreated using 0.6%NaOH,
thus a 3-fold higher yield than for untreated napier grass (0.047m3CH4/kgTS). These findings
suggest potential application of napier grass for biomethane production.
33
2.11 Conclusion
Dark fermentative hydrogen production from napier grass is an appealing method for renewable
hydrogen production. The direct use of napier grass and other lignocellulosic substrates is limited
by the recalcitrant nature of lignocellulosic biomass. Thus suitable pretreatment strategies are
necessary to hydrolyze biomass for fermentable sugars release. High fermentable sugars and
hydrogen yields have been reported for napier grass pretreated using biological pretreatment
method. This method however requires long pretreatment durations due to slow hydrolysis rate
of cellulolytic enzymes, thus it is not a viable method for commercial scale application.
Pretreatment combinations have the potential to enhance the yields of fermentable sugars, high
hydrolysis rates and hydrogen yields from napier grass and other lignocellulosic substrates.
Different combinations that are efficient and cost effective need to be investigated and
optimized for optimum sugar production and hydrogen yields from napier grass and other
lignocellulosic substrates. Different studies on napier grass and other lignocellulosic substrates
for fermentative hydrogen production showed that pH, temperature, pretreatment strategy,
biomass concentration and HRT are the most significant parameters on hydrogen yields. Studies
have shown that mixed microbial consortia immobilization significantly enhances hydrogen
yields. Future investigations should focus on the effects of pretreatment combinations on reducing
sugars and hydrogen yields from napier grass and other lignocellulosic substrates. The
fermentable sugars from napier grass and other lignocellulosic substrates can be channeled for the
production of other biofuels and biomaterials. The production of biohydrogen energy from napier
grass will have a significant contribution to the mitigation of environmental pollution.
34
2.12 References
Adegbola AA. (1964). Forage crop research and development in Nigeria. Nigeria Agricultural
Journal; 1: 34-39
Aguilar R, Ramirez JA, Garrote G, Vazquez M. (2002). Kinetic study of the acid hydrolysis of
sugarcane bagasse. Journal of Food Engineering; 55: 309-18.
Arreola-Vargas J, Celis LB, Buitron G, Razo-Flores E, Alatriste-Mondragon F. (2013) Hydrogen
production from acid and enzymatic oat straw hydrolysates in an anaerobic sequencing batch
reactor: performance and microbial population analysis. International Journal of Hydrogen
Energy; 38(32): 13884-94.
Behera S, Anora R, Nandhagopal N, Kumar S. (2014) Importance of chemical pretreatment for
bioconversion of lignocellulosic biomass. Renewable and Sustainable Energy Reviews; 36: 91–
106
Bohorquez C, Eliseo AG, Calderon Y. 2014. Effect of pretreatement dilute acid –peroxide on
napier grass (Pennisetum purpureum Schumach.) to enhance sugar yields by enzymatic
hydrolysis. Bioresources; In press
Cakir A, Ozmichi S, Kargi F. (2010). Comparison of bio-hydrogen production from hydrolyzed
wheat starch by mesophilic and thermophilic dark fermentation. International Journal of Hydrogen
Energy; 35(24): 13214-8.
Calli B, Schoenmaekers K, Vanbroekhoven K, Diels L. (2008). Dark fermentative H2 production
from xylose and lactose-effects of on-line pH control. International Journal of Hydrogen
Energy; 33: 522-30.
Cao G, Ren N, Wang A, Lee DJ ,Guo W, Liu B. (2009). Acid hydrolysis of corn stover for
biohydrogen production using Thermoanaerobacterium thermosac- charolyticum W16.
International Journal of Hydrogen Energy; 34: 7182-8
Cao GL, Ren NQ, Wang AJ, Guo WQ, Xu JF, Liu BF. (2010). Effect of lignocellulose-
derived inhibitors on growth and hydrogen production by Thermoanaerobacterium
thermosaccharolyticum W16. International Journal of Hydrogen Energy 35(24):13475-80
35
Chairattanamanokorn P, Penthamkeerat P, Reungsang A, Lo YC, Lu WB, Chang JS. (2009)
Production of biohydrogen from hydrolyzed bagasse with thermally preheated sludge.
International Journal of Hydrogen Energy 34(18):7612-7.
Chandra R, Bura R, Mabee W, Berlin A, Pan X, Saddler J. (2007). Substrate pretreatment: the
key to effective enzymatic hydrolysis of lignocellulosics? Advances in Biochemical Engineering
Biotechnology 108:67-93.
Chang ACC, Tu YH, Huang MH, Lay CH, Lin CY. (2011a) Hydrogen production by the
anaerobic fermentation from acid hydrolysed rice straw hydrolysate. International Journal of
Hydrogen Energy; 36(21): 14280-8.
Chang C-W, Yu W-C, Chen W-J, Chang R-F, Kao W-S. (2011b). A study on the enzymatic
hydrolysis of steam exploded napiergrass with alkaline treatment using artificial neural networks
and regression analysis. Journal of the Taiwan Institute of Chemical Engineers; 42(6): 889-89
Chen SD, Lo YC, Lee KS, Huang TI, Chang JS. (2009). Sequencing batch reactor enhances
bacterial hydrolysis of starch promoting continuous bio-hydrogen production from starch
feedstock. International Journal of Hydrogen Energy; 34(20): 8549-57
Cheng CL, Lo YC, Lee KS, Lee DJ, Lin CY, Chang JS. (2011a). Biohydrogen production
from lignocellulosic feedstock. Bioresource Technology 102(18):8514-23.
Cheng J, Su H, Zhou J, Song W, Cen K. (2011b). Hydrogen production by mixed bacteria
through dark and photo-fermentation. International Journal of Hydrogen energy; 36: 450-457
Chu Y, Wei Y, Yuan X, Shi X. (2011). Bioconversion of wheat stalk to hydrogen by dark
fermentation: effect of different mixed microflora on hydrogen yield and cellulose solubilization.
Bioresource Technology; 102: 3805-9.
Cui M, Chen J. (2012). Effects of acid and alkaline pretreatments on the biohydrogen production
from grass by anaerobic dark fermentation. International Journal of Hydrogen Energy;
37(1):1120-4.
Das, D., and Veziroglu, T.N. (2001). Hydrogen production by biological processes: a survey of
literature. International Journal of Hydrogen Energy 26, 13-28.
36
Datar R, Huang J, Maness PC, Mohagheghi A, Czernik S, Chornet E. (2007). Hydrogen
production from the fermentation of corn stover biomass pretreated with a steam-explosion
process. Internation Journal of Hydrogen Energy; 32(8):932-9.
de Vrije T, Mars AE, Budde MAW, Lai MH, Dijkema C, de Waard P. (2007). Glycolytic
pathway and hydrogen yield studies of the extreme thermophile Caldicellulosiruptor
saccharolyticum. Applied Microbiology and Biotechnology; 74(6): 1358-67.
Delgenes J P, Moletta R, Navarro J M. (1996). Effects of lignocellulose degradation products on
ethanol fermentations of glucose and xylose by Saccharomyces cerevisiae, Zymomonas
mobilis, Pichia stipitis, and Candida shehatae. Enzyme and Microbiological Technology 19: 220–
225.
DiTomaso JM, Reaser JK, Dionigi C P, Doering O C , Chilton E, Schardt J D. (2010).
Biofuel vs. bioinvasion: seeding policy priorities. Journal of Environmental Science &
Technology 44, pp. 6906–6910
Duff S J B, Murray W D. (1996) Bioconversion of forest products industry waste cellulosics to
fuel ethanol: A review. Journal of Bioresource Technology; 55: 1–33
Dunn S. (2002). Hydrogen futures: towards a sustainable energy system. International Journal of
Hydrogen energy 27: 235-264
Eggeman T, Elander RT. (2005). Process and economic analysis of pretreatment technologies.
Bioresource Technology 96:2019–25.
Fan YT, Zhang YH, Zhang SF, Hou HW, Ren BZ. (2006). Efficient conversion of wheat
straw wastes into biohydrogen gas by cow dung compost. Bioresource Technology; 97(3):
500-5
Fang HHP, Zhang T, Liu H. (2002). Effect of pH on biohydrogen production from glucose by
mixed culture. Bioresource Technology; 82: 87-93
Fangkum A, Reungsang A. (2011). Biohydrogen production from sugarcane bagasse hydrolysate
by elephant dung: Effects of initial pH and substrate concentration. International Journal of
Hydrogen Energy; 36 (14): 8687-8696
37
Faulds CB, Sancho AI, Bartolome B. (2002). Mono- and dimeric ferulic acid release from
brewer’s spent grain by fungal feruloyl esterases. Applied Microbial Biotechnology; 60: 489- 493.
Ginkel SV, Sung SW, Lay JJ. (2001). Biohydrogen production as a function of pH and
substrate concentration. Environmental Science Technology; 35: 4726-4730
Guo XM, Trably E, Latrille E, Carrere H, Steyer JP. (2010). Hydrogen production from
agricultural waste by dark fermentation: A review. International Journal of Hydrogen Energy; 35
(19): 10660-73
Hamelinck CN, van Hooijdonk G, Faaij APC. (2005). Ethanol from lignocellulosic biomass:
Techno-economic performance in short-, middle-, and long-term. Journal of Biomass and
Bioenergy 28: 384-410
Holladay JD, Hu J, King DL, Wang Y. (2009). An overview of hydrogen production
technologies. Catal Today; 139(4):244-60.
Holtzapple, M.T., Ripley, E.P., Nikolaou, M. (1994). Saccharification, fermentation, and protein
recovery from low-temperature AFEX-treated coastal Bermuda grass. Biotechnology and
Bioengineering 44 (9), 1122–1131.
Hoogwijk M, Faaij A, van den Broek R, Berndes G, Gielen D, Turkenburg W. (2003).
Exploration of the ranges of the global potential of biomass for energy. Biomass Bioenergy
2003; 25(2):119-23.
IPCC, Intergovernmental panel on climate change, (2013). Climate Change 2013 – The Physical
Science Basis
Jung KW, Kim DH, Shin HS. (2011). Fermentative hydrogen production from Laminaria
japonica and optimization of thermal pretreatment conditions. Bioresource Technology; 102(3):
2745-50
Kapdan IK, Kargi F. (2006). Bio-hydrogen production from waste materials. Enzyme Microbial
Technology 38(5):569-82.
Khamtib S, Plangklang P, Reungsang A. (2011). Optimization of fermentative hydrogen
production from hydrolysate of microwave assisted sulfuric acid pretreated oil palm trunk by hot
38
spring enrichment culture. International Journal of Hydrogen Energy; 36(21): 14204-16
Kongjan P, Angelidaki I. (2010). Extreme thermophilic biohydrogen production from wheat straw
hydrolysate using mixed culture fermentation: effect of reactor configuration. Bioresource
Technology 101(20):7789-96.
Kumar L. Arantes V, Chandra R, Saddler J. (2012). The lignin present in steam pretreated
softwood binds enzymes and limits cellulose accessibility. Bioresource Technology; 103:
201–208.
Kumar R, Singh S, Singh O. (2008). Bioconversion of lignocellulosic biomass: Biochemical and
molecular perspectives. Journal of Industrial Microbiology and Biotechnology; 35 (5): 377-391
Kumar R, Wyman CE. (2009). Effects of cellulase and xylanase enzymes on the
deconstruction of solids from pretreatment of poplar by leading technologies. Biotechnology
Progress; 25, 302–314.
Lay JJ. 2001. Biohydrogen generation by mesophilic anaerobic fermentation of microcrystalline
cellulose. Biotechnology and Bioengineering; 74: 281-287
Lee M-K, Tsai W-T, Tsai Y-L, Lin S-H. (2010). Pyrolysis of napier grass in an induction-
heating reactor. Journal of Analytical and Applied Pyrolysis 88(2): 110-116
Levin DB, Islam R, Cicek N, Sparling R. (2006). Hydrogen production by Clostridium
thermocellum 27405 from cellulosic biomass substrate. International Journal of Hydrogen
Energy; 31(11): 1496-1503
Lin C, Fang HHP. (2007). Fermentative hydrogen production from wastewater and solid
wastes by mixed cultures. Critical Reviews in Environmental Science and Technology; 37: 1- 39.
Liong YY, Halis R, Lai OM, Mohamed R. (2012). Conversion of lignocellulosic biomass
from grass to bioethanol using material pretreated with alkali and the white rot fungus
Phanerochaete chrysosporium. Bioresource 7(4):5500-5513
Liu CM, Chu CY, Lee WY, Li YC, Wu SY, Chou YP. (2013). Biohydrogen production
evaluation from rice straw hydrolysate by concentrated acid pretreatment in both batch and
continuous systems. International Journal of Hydrogen Energy; 38(35): 15823-9
39
Liu C-Z, Cheng X-Y. (2010). Improve hydrogen production via thermophilic fermentation of
corn stover by microwave-assisted acid pretreatment. Journal of Hydrogen Energy; 35(17):
8945-8952
Liu H, Zhang T, Fang HPP. (2003). Thermophilic hydrogen production from cellulose containing
wastewater. Biotechnology Letters; 24(4): 365-369
Liu ZL, Slininger PJ, Dien BS, Berhow MA, Kurtzman CP, Gorsich SW. (2004). Adaptive
response of yeasts to furfural and 5-hydroxymethylfurfural and new chemical evidence for
HMF conversion to 2,5-bis-hydroxymethylfuran. Journal of Industrial Microbiology and
Biotechnology; 31(8): 345-52.
Lo YC, Huang CY, Fu TN, Chen CY, Chang JS. (2009a). Fermentative hydrogen production
from hydrolyzed cellulosic feedstock prepared with a thermophilic anaerobic bacterial isolate.
International Journal of Hydrogen Energy; 34(15): 6189-200.
Lo YC, Su YC, Chen CY, Chen WM, Lee KS, Chang JS. (2009b). Biohydrogen production from
cellulosic hydrolysate produced via temperature-shift-enhanced bacterial cellulose hydrolysis.
Bioresource Technology; 100(23): 5802-7
Lui DW, Zeng RJ, Angelidaki I. (2008). Effects of pH and hydraulic retention time on
hydrogen production versus methanogenesis during anaerobic fermentation of organic
household solid waste under extreme-thermophilic temperature (70 °C). Biotechnology and
Bioengineering 100:1108-14
Lynd LR, Elander RT, Wyman CE. (1996). Likely features and costs of mature biomass
ethanol technology. Applied Biochemistry and Biotechnology 57/58, 741-761.
Lynd LR, H Von Blottnitz, B Tait, J De Boer, IS Pretorius, K Rumbold, WH Van Zyl.
(2003). Plant Biomass Conversion to Fuels and Commodity Chemicals in South Africa: A
Third Chapter South African Journal of Science 99:499 -507.
Mackie KL, Brownell HH, West KL, Saddler JN. (1985). Effect of sulphur dioxide and
sulphuric acid on steam exploded aspen. Journal of Wood Chemistry and Technology; 5:
405-426
40
Mood SH, Golfeshan AH, Tabatabaei M, Jouzani GS, Najafi GH, Gholami M, Ardjmand M.
(2013). Lignocellulosic biomass to bioethanol, a comprehensive review with a focus on
pretreatment. Renewable and sustainable energy reviews; 27: 77-93
Moore CP, Bushman DH. (1978). Potential beef production on intensively managed elephant
grass. In: Beef production on intensively managed elephant grass. Centro de Agriculture
Tropical (CIAT); pp 335-341
Morandim-Giannetti de Araujo, Andrela Albuquerque, Tiago Santos de Carvalho, Renata Kobal
Campos, Araujo, Ramires Menez Silva Magnabosco, Rodrigo. (2013). Study of “napier grass”
delignification for production of cellulosic derivatives. Carbohydrate Polymers 92(1): 849-855.
Mosier N, Wyman C, Dale B, Elander R, Lee YY, Holtzapple M, Ladisch M. (2005). Features of
promising technologies for pretreatment of lignocellulosic biomass. Bioresource Technology; 96:
673-686
Nguyen TAD, Han SJ, Kim JP, Kim MS, Oh YK, Sim SJ. (2008). Hydrogen production by the
hyperthermophilic eubacterium, Thermotoga neapolitana, using cellulose pretreated by ionic
liquid. International Journal of Hydrogen Energy; 33(19): 5161-8
Nissila ME, Lay C-H, Puhakka JA. (2014). Dark fermentative hydrogen production from
lignocellulosic hydrolyzates- A review. Biomass and Bioenergy 67: 145-159
Nomura T, Asano H, Takayama T, Naimen A, Tokumoto H, Konishi Y. (2013). Isolation of
hydrogen-producing bacteria suitable for immobilization from anaerobic sludge. Advanced
Materials Research; 722: 849-54
Orozco A, Ahmad M, Rooney D, Walker G. (2007). Dilute acid hydrolysis of cellulose and
cellulosic biowaste using a microwave reactor system. Journal of Process Safety and
Environmental Protection; 85: 446-9.
Pan C, Zhang S, Fan Y, Hou H. (2010). Bioconversion of corncob to hydrogen using anaerobic
mixed microflora. Int J Hydrogen Energy; 35(7): 2663-9
Pattra S, Sangyoka S, Boonmee M, Reungsang A. (2008). Biohydrogen production from the
fermentation of sugarcane bagasse hydrolysate by Clostridium butyricum. Int J Hydrogen
41
Energy 33:5256-65.
Pauly M, Keegstra K (2008) Cell wall carbohydrates and their modification as a resource for
biofuels. Plant Journal; 54(4): 559-68
Quemeneur M, Hamelin J, Barakat A, Steyer JP, Carrere H, Trably E. (2012). Inhibition of
fermentative hydrogen production by lignocellulose-derived compounds in mixed cultures.
International Journal of Hydrogen Energy 37(4): 3150-9.
Redding AP, Wang Z, Keshwani DR, Cheng JJ. 2011. High temperature dilute acid pretreatment
of coastal Bermuda grass for enzymatic hydrolysis. Bioresource Technology; 102 : 1415-1424
Reddy KO, Maheswari CU, Shukla M, Rujulu AV. (2012). Chemical composition and structural
characterization of napier grass fibers. 67: 35-38
Rekha B N, Aniruddha B P. (2013). Performance enhancement of batch anaerobic digestion of
Napier grass by alkali pretreatment. International Journal of Chemical Technology Research;
5(2): 558-564
Russell J, Webb HR. (1976). Climatic range of grasses and legumes used in pastures. Results of a
survey conducted at the 11th
International Grassland Congress. Journal of the Australian Institute
of Agricultural Science
Sagnak R, Kapdan IK, Kargi F. (2011). Dark fermentation of acid hydrolyzed ground wheat
starch for bio-hydrogen production by periodic feeding and effluent removal. Int J Hydrogen
Energy; 35(18): 9630-6
Saha BC. (2003). Hemicellulose conversion. Journal of Industrial Microbiology and
Biotechnology; 30(5): 279-291
Saxena RC, Adhikari DK, Goyal HB. (2009). Biomass-based energy fuel through biochemical
routes: a review. Renew Sustain Energy Rev; 13(1): 167-78.
Shamsuddin S F B. (2013). Optimization of alkaline pretreatment of napier grass using response
surface methodology. MSc Thesis, Universiti Teknologi Malaysia June 2013
Shin H-S, Young J-H, Kim S-H. (2004). Hydrogen production from waste in anaerobic
mesophilic and thermophilic acidogenesis. Journal of Hydrogen energy; 29(13): 1355-1363
42
Smith A L, Klenk N, Wood S, Hewitt N, Henriques I, Yan N, Bazely D R. (2013). Second
generation biofuels and bioinvasions: An evaluation of invasive risks and policy responses in the
United States and Canada. Renewable and Sustainable Energy Reviews 27(0): 30-42
Somerville C, Youngs H, Taylor, C, Davis SC, Long SP. (2010). Feedstocks for lignocellulosic
biofuels. Journal of Science (Washington); 329(5993): 790-792
Stern, N. (2008). The economics of climate change. The American Economic Review; 98: 1- 37.
Sun Y, Cheng J. (2002). Hydrolysis of lignocellulosic materials for ethanol production: a review.
Bioresource Technology; 83 (1): 1–11.
Teymouri F, Laureano-Perez L, Alizadeh H, Dale BE. (2005). Optimization of the ammonia fiber
explosion (AFEX) treatment parameters for enzymatic hydrolysis of corn stover. Bioresource
Technology; 96 (18): 2014–2018.
Valdez-Vazquez I, Rios Leal E, Esparza-Garcia F, Cecchi F, Poggi-Varaldo HM. (2005).
Semi-continuous solid substrate anaerobic reactors for H2 production from organic waste:
mesophilic versus thermophilic regime. International Journal of Hydrogen Energy; 30:1383- 91
Veeravalli SS, Chaganti SR, Lalman JA, Heath DD. (2014). Optimizing hydrogen production
from switchgrass steam exploded liquir using a mixed anaerobic culture in an upflow anaerobic
sludge blanket reactor. International Journal of Hydrogen Energy; 39(7): 3160- 3175
Vicente-Chandler J, Silva S, Figarella J. (1959). The effect of nitrogen fertilization and
frequency of cutting on the yield and composition of three tropical grasses. Agronomy Journal;
51(4): 202-206
Walmsley D, Sargeent VAL. (1978). Effect of fertilizer on growth and composition of elephant
grass (Pennisetum purpureum) in Tobago West Indies. Tropical Agriculture; 55(4): 329-334
Wang A, Ren N, Shi Y, Lee D-J. (2008). Bioaugumented hydrogen production from
microcrystalline cellulose using co-cultures of Clostridium acetobytlicum X9 and Ethanoigenens
harbinense B49. Journal of Hydrogen Energy; 33(2): 912-917.
Wang JL, Wan W. (2008). The effect of substrate concentration on biohydrogen production by
using kinetic models. Scientific China Ser B-Chem; 51(11): 1110-7
43
Wen B, Yuan X, Li QX, Lui J, Ren J, Wang X, Cui Z. (2014). Comparison and evaluation of
concurrent saccharification and anaerobic digestion of napier grass after pretreatment by
three microbial consortia. Bioresource Technology; 17: 102-111
WHO (2008). Protecting Health from Climate Change. World Health Day 2008. World Health
Organization, Geneva, Switzerland. http://www.who.int/globalchange/publications. Accessed 13
October 2014
Won SG, Lau AK. (2011). Effects of key operational parameters on biohydrogen production via
anaerobic fermentation in a sequencing batch reactor. Journal of Bioresource Technology 102:
6876-83.
Wongwatanapaiboon J K, Kunn B, Vorakan I, Ratanavalee W, Pakorn Y, Tikamporn C W.
(2012). The Potential of Cellulosic Ethanol Production from Grasses in Thailand. Journal of
Biomedicine and Biotechnology: 10
Wu Z, Wang Y, Xing Z. (2005). Study on degrading phenol by immobilized Ralstonia
metallidurans CH34. Microbiology; 32(4): 31–36.
Wyman, C.E., (1995). Economic fundamentals of ethanol production from lignocellulosic
biomass. In: Saddler, J.N., Penner, M.H. (Eds.), Enzymatic Degradation of Insoluble
Carbohydrates, ACS Symposium Series, vol. 618. American Chemical Society, Washington, DC,
pp. 272-290.
Wyman, C.E., (1996). Ethanol production from lignocellulosic biomass: overview. In: Wyman,
C.E. (Ed.), Handbook on Bioethanol, Production and Utilization. Taylor & Francis, Washington,
DC (Chapter 1).
Wyman, C.E., (1999). Biomass ethanol: technical progress, opportunities, and commercial
challenges. Annual Review of Energy and the Environment 24, 189-226.
Yokoyama H, Moriya N, Ohmori H, Waki M, Ogino A, Tanaka Y. (2007) Community
analysis of hydrogen-producing extreme thermophilic anaerobic microflora enriched from cow
manure with five substrates. Applied Microbiology and Biotechnology; 77(1): 213-22
Yu L, Ma J, Zhao Q, Frear C, Chen S. (2013). Enhance volatile fatty acid (VFA) and
biomethane productivity by pretreatment of lawn grass. Doi :http://dx.doi.org/10.13031
44
Zhang ML, Fan YT, Xing Y, Pan CM, Zhang GS, Lay JJ. (2007). Enhanced biohydrogen
production from Corn stalk wastes with acidification pretreatment by mixed anaerobic cultures.
Biomass Bioenergy; 31(4): 250-4
Zheng Y, Zhao J, Xu F, Li Y. (2014). Pretreatment of lignocellulosic biomass for enhanced
biogas production. Progress in Energy and Combustion Science; 42: 35-53
Zilliox C, Debeire P. Hydrolysis of wheat straw by a thermostable endox-ylanase: adsorption and
kinetic studies. Enzyme Microbial Technology; 1998(22): 58–63.
45
CHAPTER 3
Modeling and Optimization of Xylose and Glucose Production from Napier grass
(Pennisetum purpureum) using Hybrid Pretreatment Techniques.
3.1 Abstract
Lignocellulosic biomass is an excellent potential substrate for renewable biofuel production.
However its conversion into fermentable sugars is hindered by the interlinked polymers of
cellulose, hemicellulose and lignin. Thus an efficient and cost effective pretreatment is required.
This work models and optimizes four hybrid techniques of napier grass pretreatment for xylose
and glucose production namely HCl and moist heat (HH), HCl and microwave (HM), NaOH and
moist heat (NH) and NaOH and microwave (NM) using Response Surface Methodology (RSM).
The coefficients of determination (R2) of 0.83 and 0.97 were obtained for xylose and glucose
production respectively using HH hybrid pretreatment, and 0.90 and 0.80 were obtained for
xylose and glucose respectively using HM hybrid pretreatment. The optimized pretreatment
conditions of HH gave 12.83g/l xylose and 2.28g/l glucose and HM optimized pretreatment gave
15.06g/l and 2.44g/l xylose and glucose. A xylose to glucose ratio of 5.6:1 was obtained for the
optimized HH pretreatment compared to 6.1:1 for the optimized HM pretreatment. For NH and
NM hybrid pretreatments, low concentration of fermentable sugars was observed (˂0.5g/l). The
findings indicate that xylose and glucose production from napier grass can be enhanced by an
optimal combination of pretreatments of HCl and moist heat at 4.39% HCl, 93.07˚C for 180
min, or using a combination of microwave and HCl at 5% HCl, 500 W for 30 min. The optimum
generation of xylose and glucose from napier grass leverages its potential as substrate for the
production of renewable biofuels and biomaterials.
Keywords: Napier grass, Lignocellulosic biomass, Lignocellulosic biomass pretreatment,
process modeling and optimization, Biohydrogen production.
46
3.2 Introduction
Global climate change, escalating fuel prices, high global energy demand and depletion of fossil
fuel reserves are driving the search for alternative energy sources. High dependency on non-
renewable fossil fuel has resulted in a negative environmental impact through greenhouse gas
emission, excessive climate change (Azwar et al., 2014) and the depletion of the energy reserves
at high pace (Fiddaman, 2002). Lignocellulosic biomass is gaining importance as a cleaner,
readily available and renewable energy source (Fiddaman, 2002; Iroba et al., 2013). About 200
billion tonnes of biomass are produced worldwide per annum (Zhang, 2008). Lignocellulosic
biomass is a source of mixed fermentable sugars that can be used for biofuel and biomaterial
production (Iroba et al., 2013). It is composed of interlinked polymers of about 35-45% cellulose,
25-40% hemicellulose and 20-35% lignin (Rekha and Aniruddha, 2013). These interlinks of
chemical bonds give biomass structural support, impermeability and resistance to oxidative
stress and microbial attack (Kumar et al., 2009). However, this limits the use of biomass as
feedstock in biofuel and biomaterial production (Iranmahboon et al., 2005). Hence efficient
pretreatment procedures are required to disrupt these interlinks and expose cellulose and
hemicellulose to hydrolytic enzymes for fermentable sugar release.
Steam explosion, alkali and acid hydrolysis, wet oxidation, ammonia fiber explosion, biological
and microwave hydrolysis are some examples of biomass pretreatment strategies (Prakasham et
al., 2009). Steam explosion uses high temperature ranging from 160 to 260˚C and a pressure
ranging from 0.69 to 4.83MPa is rapidly applied to lignocellulosic biomass for a short duration
(to promote hemicellulose hydrolysis) after which, the system undergoes explosive
decomposition (Ramos et al., 1992). The hydrolysis of napier grass through steam explosion has
been reported by Chang et al. (2011) under varied temperature from 160 to 210˚C and a reaction
time between 2 to 20 mins. The author reported a significant reduction in glucan, xylan and
lignin (67.3, 6.83 and 20.02% respectively) at 210˚C for 20 mins. Steam explosion however,
results in xylan fraction destruction, toxic and inhibitory phenolic compounds production,
incomplete lignin-carbohydrate matrix disruption and has high-energy requirements (Mackie et
al., 2005). Biological pretreatment has been applied to hydrolyze lignocellulosic biomass (Zhang,
2008). This method uses fungal enzymes to degrade lignin, hemicellulose and polyphenols.
Industrial application of this method is limited by slow degradation rate and
47
microorganisms consuming some hydrolyzed carbohydrate fraction. Acid pretreatment
solubilizes lignin and hydrolyzes hemicellulose to xylose, thus making cellulose accessible to
enzymatic hydrolysis (Eggeman and Elander, 2005). This strategy is inexpensive and efficient,
however it causes corrosion to the bioreactor internal structures (Lopez-Arenas et al., 2010).
Alkaline pretreatment strategy disrupts the lignin structure of biomass but also removes uronic
acid substitutions on hemicellulose thus reducing accessibility of hemicellulose to hydrolytic
enzymes (Cardona and Sachnez, 2006). Microwave radiation and thermal pretreatment strategies
disrupt lignin, reduce degree of polymerization of biomass and hydrolyze hemicellulose to
xylose. These pretreatment strategies have high energy requirements and are slow (require long
process times) (Lopez-Arenas et al., 2010). Ammonia fiber explosion uses hot liquid ammonia
(˂90˚C) under high pressure for specific duration (˂30 min) to delignify and solubilize
hemicellulose (Cardona and Sachnez, 2006). This process is highly efficient, however the costs of
ammonia and recovery process make this pretreatment economically unviable (Cardona and
Sachnez, 2006). Thus, more efficient and cost effective alternative biomass pretreatment
approaches are investigated.
Hybrid pretreatment techniques of steam explosion and dilute 1% H2SO4 as preimpregnation
agent on raw wheat straw have been reported, with yield improvement of 8 to 10g glucose/100g
raw wheat straw compared to 6.4g glucose/100g wheat straw obtained without acid addition
(Lopez-Arenas et al., 2010). Ideally, biomass pretreatment strategy should be cost effective,
economically viable, free from inhibitory by-products and be practical at large scale (Aden and
Foust, 2009). Suhardi et al. (2013) combined biologic and dilute acid pretreatment strategies on
energy cane hydrolysis for ethanol production, 3055mg/L ethanol yield was observed compared
to 1725 and 1266mg/L ethanol observed for fungal and 2% H2SO4 treated energy cane.
The Response Surface Methodology (RSM) is a modeling and optimization technique that
evaluates the interactive and synergistic effects of all input variables on the process to achieve a
maximum output (Muthuvelayudham and Viruthagiri, 2010). RSM has been successful used in
optimization of various bioprocesses (Hu et al., 2004; Yue et al., 2007), but its application for
the determination of optimal set points for biomass pretreatment using hybrid techniques is
scantily reported.
48
Napier grass (Pennisetum purpureum) has high cellulose content (36.46%) (Saxena et al., 2009),
rapid growth, invasive nature, high biomass yield (up to 40 metric ton/ha/year) and high
adaptability (Chang et al., 2011; Smith et al., 2013; DiTomaso et al., 2010). It is a C4 perennial
grass species widely distributed and native to African grasslands with high light, water and
nitrogen utilizing efficiency (Somerville et al., 2012). Napier grass has been recognized as an
opportunistic weed outcompeting native vegetation in Central America. About $22.5 million was
spent by Florida government in 2005 for napier grass growth control (FDEP, 2005).
This work models and optimizes four hybrid pretreatment techniques for xylose and glucose
production from napier grass namely HCl and heat (HH), HCl and microwave (HM), NaOH and
heat (NH) and NaOH and microwave (NM). It further studies the interactive effects of
pretreatment duration, pretreatment temperature and chemical concentration on xylose and
glucose yields. Additionally, a preliminary assessment of fermentative hydrogen production using
the optimally pretreated napier grass is carried out.
3.3 Materials and methods
3.3.1 Lignocellulosic biomass
The napier grass used as a substrate in this study was harvested at 6 months old from Grassland
Science tunnels in the University of KwaZulu-Natal Pietermaritzburg campus, South Africa. It
was dried at 60˚C for 72 hours and reduced to particle size of 1mm using a centrifugal mill
(Retsch ZM-1, Durban South Africa).
3.3.2 Experimental designs
Based on reported literatures on efficient biomass pretreatment techniques, HCl (0.1 to 5%),
NaOH (0.1 to 5%), moist heat (60 to 100˚C) and microwave intensity (500-1000 W) pretreatments
were selected (Tables 3.1 and 3.2). Four hybrid techniques were considered, namely HCl and heat
(HH), HCl and microwave (HM), NaOH and heat (NH), and NaOH and microwave (NM). Box-
behnken design was used to generate seventeen experimental runs with varied input parameters for
each of the hybridized procedure, thus a total 68 experimental runs were carried out in
duplicate.
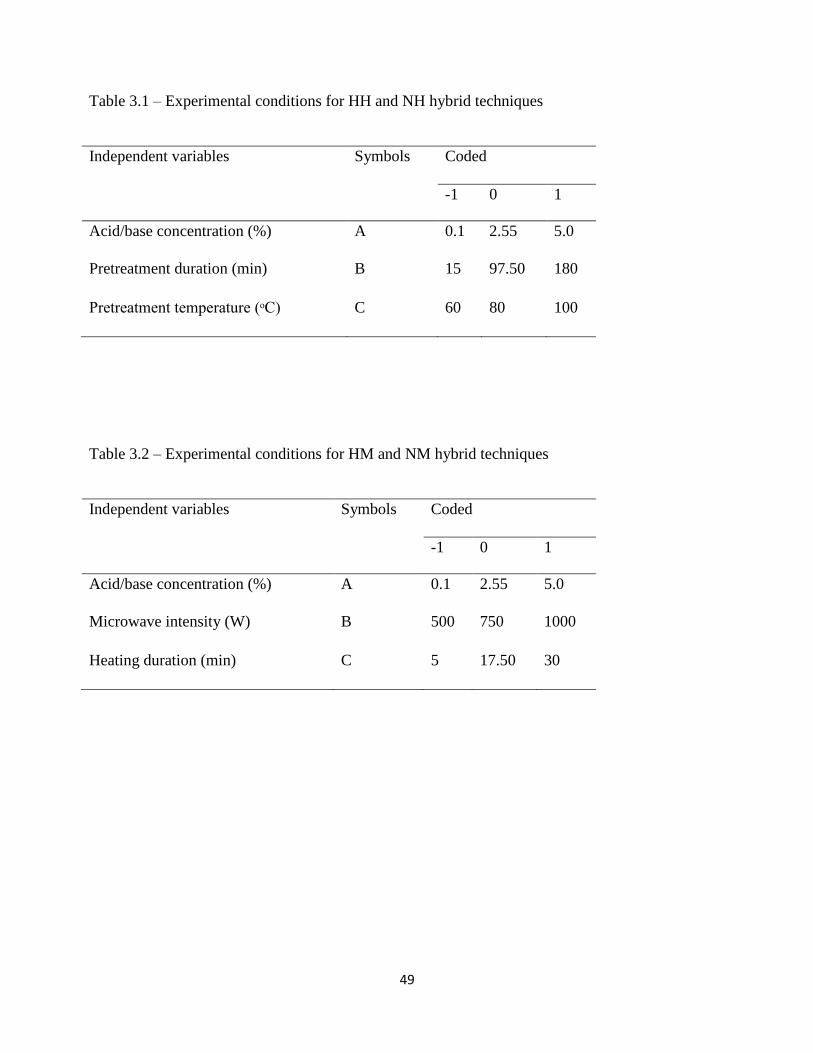
49
Table 3.1 – Experimental conditions for HH and NH hybrid techniques
Independent variables Symbols Coded
-1 0 1
Acid/base concentration (%) A 0.1 2.55 5.0
Pretreatment duration (min) B 15 97.50 180
Pretreatment temperature (ᵒC) C 60 80 100
Table 3.2 – Experimental conditions for HM and NM hybrid techniques
Independent variables Symbols Coded
-1 0 1
Acid/base concentration (%) A 0.1 2.55 5.0
Microwave intensity (W) B 500 750 1000
Heating duration (min) C 5 17.50 30
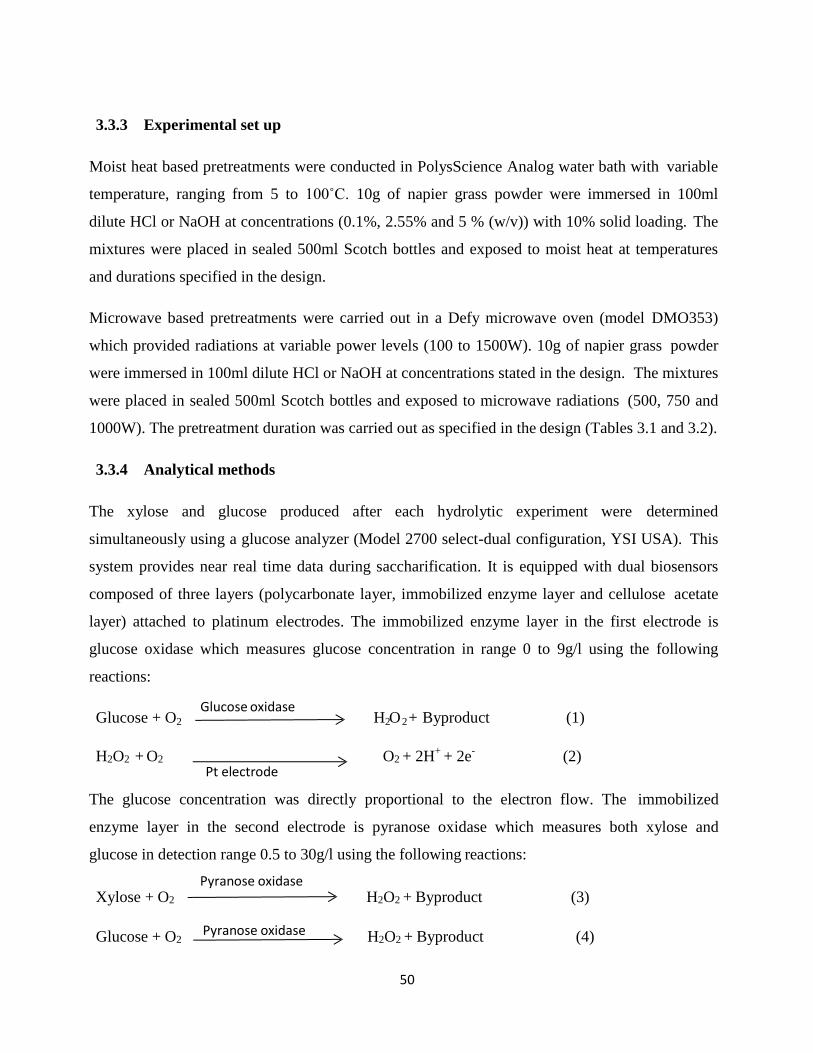
50
2 2 2
3.3.3 Experimental set up
Moist heat based pretreatments were conducted in PolysScience Analog water bath with variable
temperature, ranging from 5 to 100˚C. 10g of napier grass powder were immersed in 100ml
dilute HCl or NaOH at concentrations (0.1%, 2.55% and 5 % (w/v)) with 10% solid loading. The
mixtures were placed in sealed 500ml Scotch bottles and exposed to moist heat at temperatures
and durations specified in the design.
Microwave based pretreatments were carried out in a Defy microwave oven (model DMO353)
which provided radiations at variable power levels (100 to 1500W). 10g of napier grass powder
were immersed in 100ml dilute HCl or NaOH at concentrations stated in the design. The mixtures
were placed in sealed 500ml Scotch bottles and exposed to microwave radiations (500, 750 and
1000W). The pretreatment duration was carried out as specified in the design (Tables 3.1 and 3.2).
3.3.4 Analytical methods
The xylose and glucose produced after each hydrolytic experiment were determined
simultaneously using a glucose analyzer (Model 2700 select-dual configuration, YSI USA). This
system provides near real time data during saccharification. It is equipped with dual biosensors
composed of three layers (polycarbonate layer, immobilized enzyme layer and cellulose acetate
layer) attached to platinum electrodes. The immobilized enzyme layer in the first electrode is
glucose oxidase which measures glucose concentration in range 0 to 9g/l using the following
reactions:
Glucose + O Glucose oxidase
H O + Byproduct (1)
H2O2 + O2 O2 + 2H+
+ 2e-
(2) Pt electrode
The glucose concentration was directly proportional to the electron flow. The immobilized
enzyme layer in the second electrode is pyranose oxidase which measures both xylose and
glucose in detection range 0.5 to 30g/l using the following reactions:
Pyranose oxidase Xylose + O2 H2O2 + Byproduct (3)
Glucose + O2 Pyranose oxidase H2O2 + Byproduct (4)

51
1
1 3
H2O2 + O2 O2 + 2H+
+ 2e-
(5) Pt electrode
Xylose and glucose concentrations were directly proportional to the electrons flow. Prior to
measurements the machine was calibrated with 20g/l and 2.5g/l of xylose and glucose calibrator
solutions respectively. The system calculated the xylose and glucose sensitivities and used the
compensation equations to subtract interfering analytes.
The experimental data obtained were used to fit four different polynomial model equations
relating xylose and glucose to the process input treatment conditions in hybrids pretreatment of
HH and HM. The general form of the model is shown in Equation 6.
Y=α0 + α1x1 + α2x2 + α3x3 + α11x 2 + α22x2
2 + α33x3
2 + α12x1 x2 + α13x1 x3 + α23x2 x3 (6)
Where Y represents response output (glucose or xylose), α0 is the intercept, α1x1 to α3x3 are the
linear coefficients, α11x 2 to α33x
2 are quadratic coefficients and α12x1 x2 to α23x2 x3 represents
the interaction of coefficients. The significance of the model was assessed by Analysis Of
Variance (ANOVA) using Design Expert software, (Stat Ease, Inc.). The optimum experimental
set points for maximum xylose and glucose production in the hybrid pretreatment of HH and HM
were obtained by solving the model equations and were subsequently validated.
3.3.5 Preliminary assessment of pretreated napier on biohydrogen production
3.3.5.1 Seed sludge
Anaerobic sludge obtained from the Darville wastewater treatment plant in Pietermaritzburg
South Africa was used as the inoculum in the study. The sludge was stored at 4˚C in the
laboratory before use.
3.3.5.2 Batch fermentation experiments
Anaerobic sludge was boiled at 100˚C for 30 min in a hot plate to inactivate the hydrogen
consuming microorganisms and preserve the spore forming hydrogen producing bacteria.
Fermentation experiments were carried out in duplicate in 250ml Erlenmeyer flasks. The flasks
were inoculated with 25ml of the treated sludge and fed with 100ml of the optimally pretreated
napier grass substrate and 125ml mineral salt solution to a total working volume of 250ml. The
mineral salt contained (g/l): NH4Cl 0.5, KH2PO4 0.5, K2HPO4 0.5, NaHCO3 4.0, FeCl2.2H2O
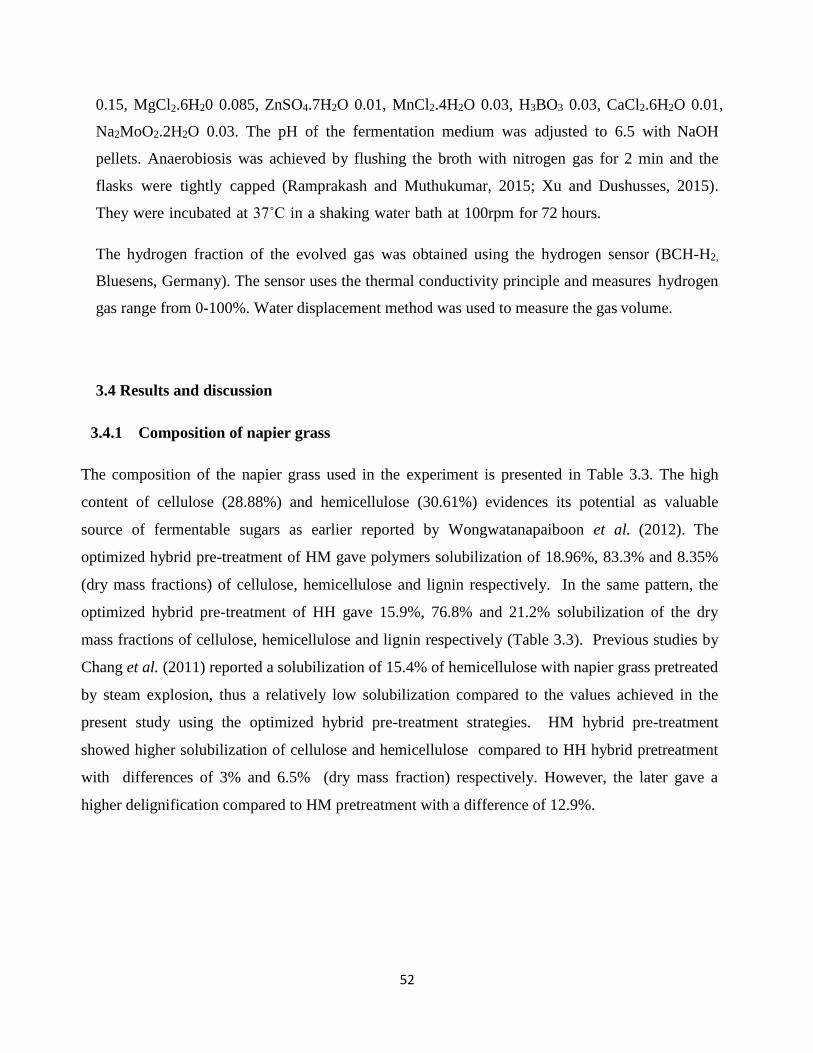
52
0.15, MgCl2.6H20 0.085, ZnSO4.7H2O 0.01, MnCl2.4H2O 0.03, H3BO3 0.03, CaCl2.6H2O 0.01,
Na2MoO2.2H2O 0.03. The pH of the fermentation medium was adjusted to 6.5 with NaOH
pellets. Anaerobiosis was achieved by flushing the broth with nitrogen gas for 2 min and the
flasks were tightly capped (Ramprakash and Muthukumar, 2015; Xu and Dushusses, 2015).
They were incubated at 37˚C in a shaking water bath at 100rpm for 72 hours.
The hydrogen fraction of the evolved gas was obtained using the hydrogen sensor (BCH-H2,
Bluesens, Germany). The sensor uses the thermal conductivity principle and measures hydrogen
gas range from 0-100%. Water displacement method was used to measure the gas volume.
3.4 Results and discussion
3.4.1 Composition of napier grass
The composition of the napier grass used in the experiment is presented in Table 3.3. The high
content of cellulose (28.88%) and hemicellulose (30.61%) evidences its potential as valuable
source of fermentable sugars as earlier reported by Wongwatanapaiboon et al. (2012). The
optimized hybrid pre-treatment of HM gave polymers solubilization of 18.96%, 83.3% and 8.35%
(dry mass fractions) of cellulose, hemicellulose and lignin respectively. In the same pattern, the
optimized hybrid pre-treatment of HH gave 15.9%, 76.8% and 21.2% solubilization of the dry
mass fractions of cellulose, hemicellulose and lignin respectively (Table 3.3). Previous studies by
Chang et al. (2011) reported a solubilization of 15.4% of hemicellulose with napier grass pretreated
by steam explosion, thus a relatively low solubilization compared to the values achieved in the
present study using the optimized hybrid pre-treatment strategies. HM hybrid pre-treatment
showed higher solubilization of cellulose and hemicellulose compared to HH hybrid pretreatment
with differences of 3% and 6.5% (dry mass fraction) respectively. However, the later gave a
higher delignification compared to HM pretreatment with a difference of 12.9%.
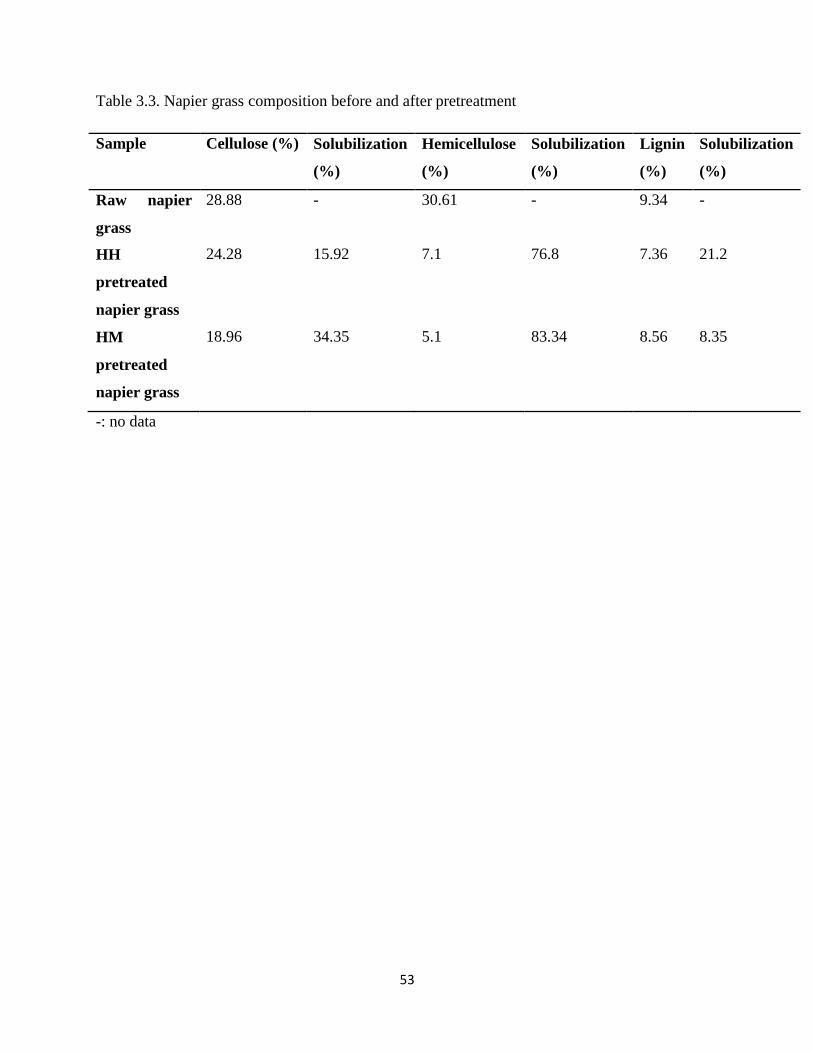
53
Table 3.3. Napier grass composition before and after pretreatment
Sample Cellulose (%) Solubilization
(%)
Hemicellulose
(%)
Solubilization
(%)
Lignin
(%)
Solubilization
(%)
Raw napier
grass
28.88 - 30.61 - 9.34 -
HH
pretreated
napier grass
24.28 15.92 7.1 76.8 7.36 21.2
HM
pretreated
napier grass
18.96 34.35 5.1 83.34 8.56 8.35
-: no data
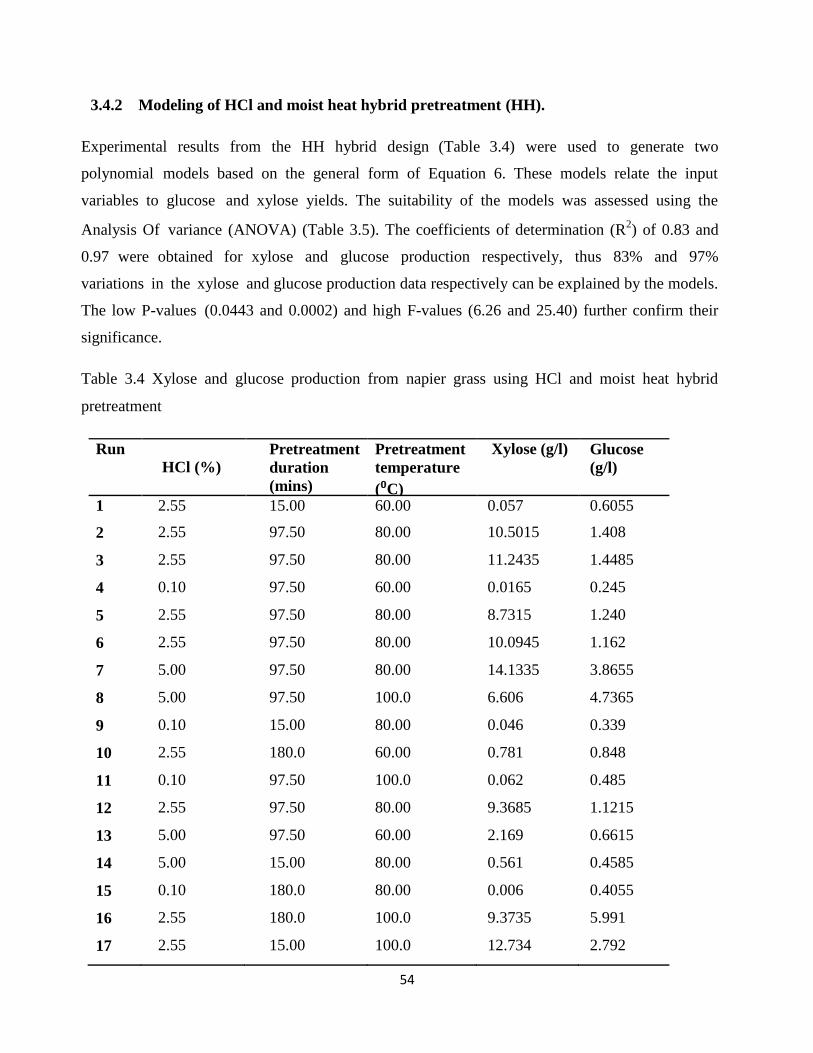
54
3.4.2 Modeling of HCl and moist heat hybrid pretreatment (HH).
Experimental results from the HH hybrid design (Table 3.4) were used to generate two
polynomial models based on the general form of Equation 6. These models relate the input
variables to glucose and xylose yields. The suitability of the models was assessed using the
Analysis Of variance (ANOVA) (Table 3.5). The coefficients of determination (R2) of 0.83 and
0.97 were obtained for xylose and glucose production respectively, thus 83% and 97%
variations in the xylose and glucose production data respectively can be explained by the models.
The low P-values (0.0443 and 0.0002) and high F-values (6.26 and 25.40) further confirm their
significance.
Table 3.4 Xylose and glucose production from napier grass using HCl and moist heat hybrid
pretreatment
Run
HCl (%) Pretreatment
duration
(mins)
Pretreatment
temperature
(⁰C)
Xylose (g/l) Glucose
(g/l)
1 2.55 15.00 60.00 0.057 0.6055
2 2.55 97.50 80.00 10.5015 1.408
3 2.55 97.50 80.00 11.2435 1.4485
4 0.10 97.50 60.00 0.0165 0.245
5 2.55 97.50 80.00 8.7315 1.240
6 2.55 97.50 80.00 10.0945 1.162
7 5.00 97.50 80.00 14.1335 3.8655
8 5.00 97.50 100.0 6.606 4.7365
9 0.10 15.00 80.00 0.046 0.339
10 2.55 180.0 60.00 0.781 0.848
11 0.10 97.50 100.0 0.062 0.485
12 2.55 97.50 80.00 9.3685 1.1215
13 5.00 97.50 60.00 2.169 0.6615
14 5.00 15.00 80.00 0.561 0.4585
15 0.10 180.0 80.00 0.006 0.4055
16 2.55 180.0 100.0 9.3735 5.991
17 2.55 15.00 100.0 12.734 2.792
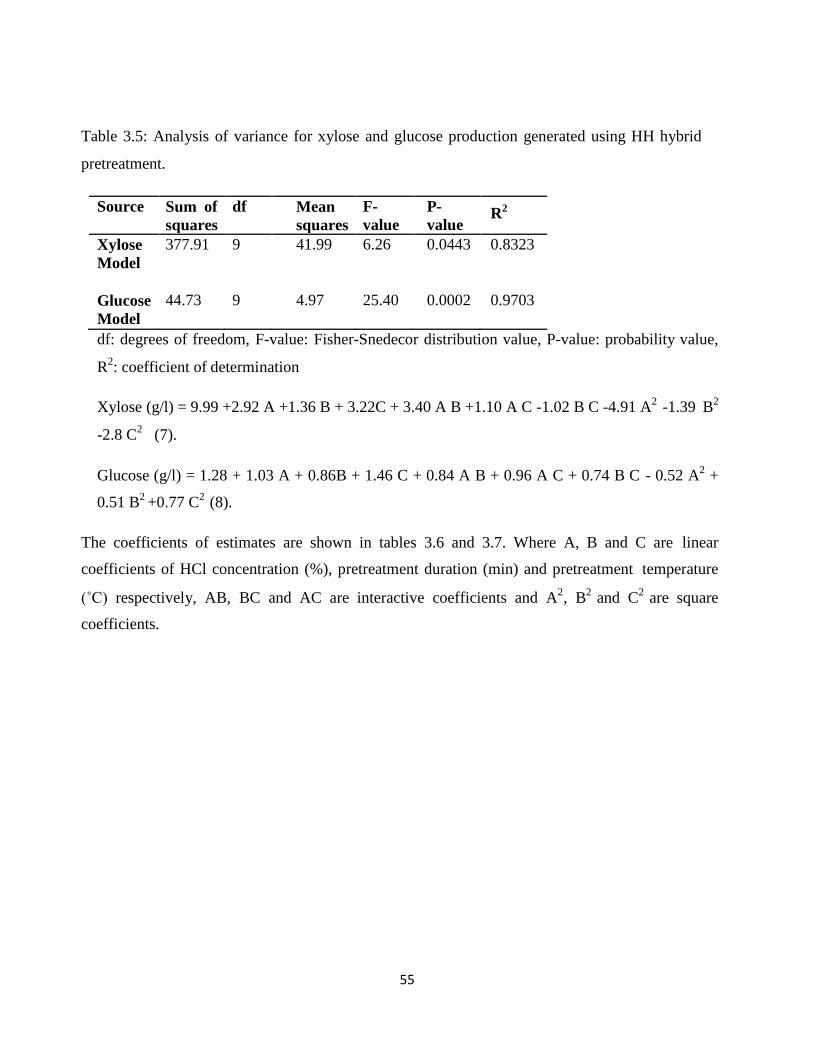
55
Table 3.5: Analysis of variance for xylose and glucose production generated using HH hybrid
pretreatment.
Source Sum of
squares
df Mean
squares
F-
value
P-
value R2
Xylose
Model
377.91 9 41.99 6.26 0.0443 0.8323
Glucose
Model
44.73 9 4.97 25.40 0.0002 0.9703
df: degrees of freedom, F-value: Fisher-Snedecor distribution value, P-value: probability value,
R2: coefficient of determination
Xylose (g/l) = 9.99 +2.92 A +1.36 B + 3.22C + 3.40 A B +1.10 A C -1.02 B C -4.91 A2
-1.39 B2
-2.8 C2
(7).
Glucose (g/l) = 1.28 + 1.03 A + 0.86B + 1.46 C + 0.84 A B + 0.96 A C + 0.74 B C - 0.52 A2
+
0.51 B2
+0.77 C2
(8).
The coefficients of estimates are shown in tables 3.6 and 3.7. Where A, B and C are linear
coefficients of HCl concentration (%), pretreatment duration (min) and pretreatment temperature
(˚C) respectively, AB, BC and AC are interactive coefficients and A2, B
2 and C
2 are square
coefficients.
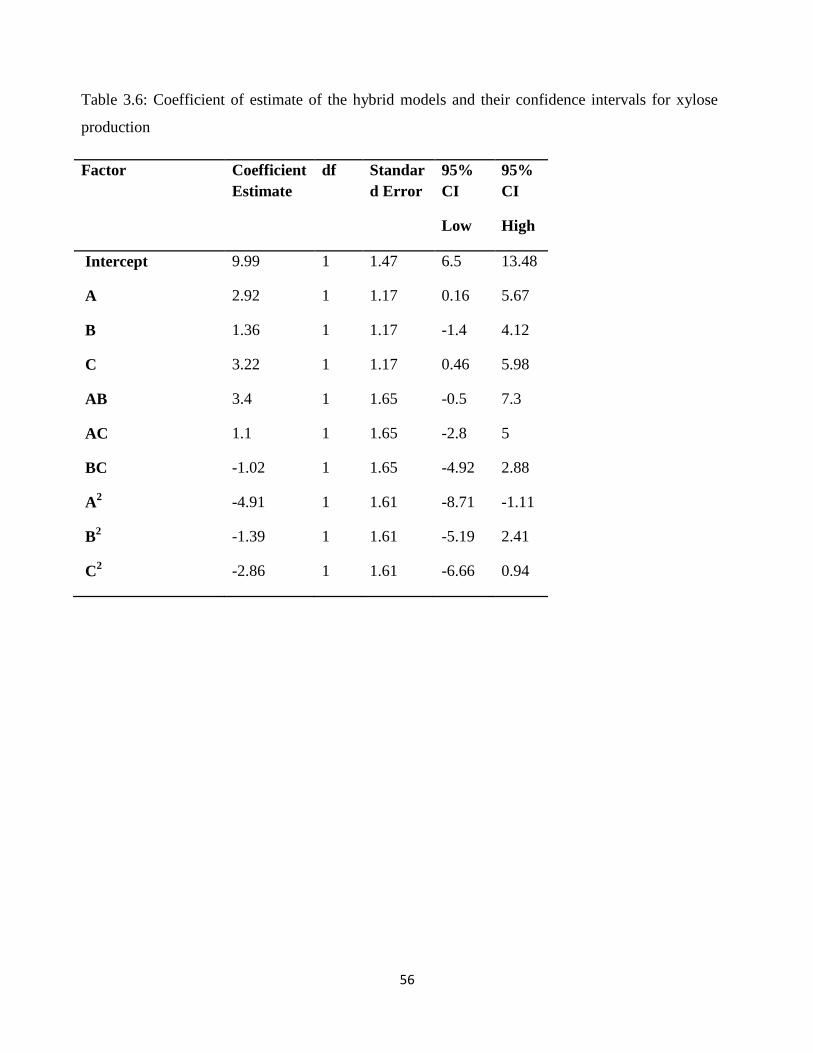
56
Table 3.6: Coefficient of estimate of the hybrid models and their confidence intervals for xylose
production
Factor Coefficient
Estimate
df Standar
d Error
95%
CI
Low
95%
CI
High
Intercept 9.99 1 1.47 6.5 13.48
A 2.92 1 1.17 0.16 5.67
B 1.36 1 1.17 -1.4 4.12
C 3.22 1 1.17 0.46 5.98
AB 3.4 1 1.65 -0.5 7.3
AC 1.1 1 1.65 -2.8 5
BC -1.02 1 1.65 -4.92 2.88
A2 -4.91 1 1.61 -8.71 -1.11
B2 -1.39 1 1.61 -5.19 2.41
C2 -2.86 1 1.61 -6.66 0.94
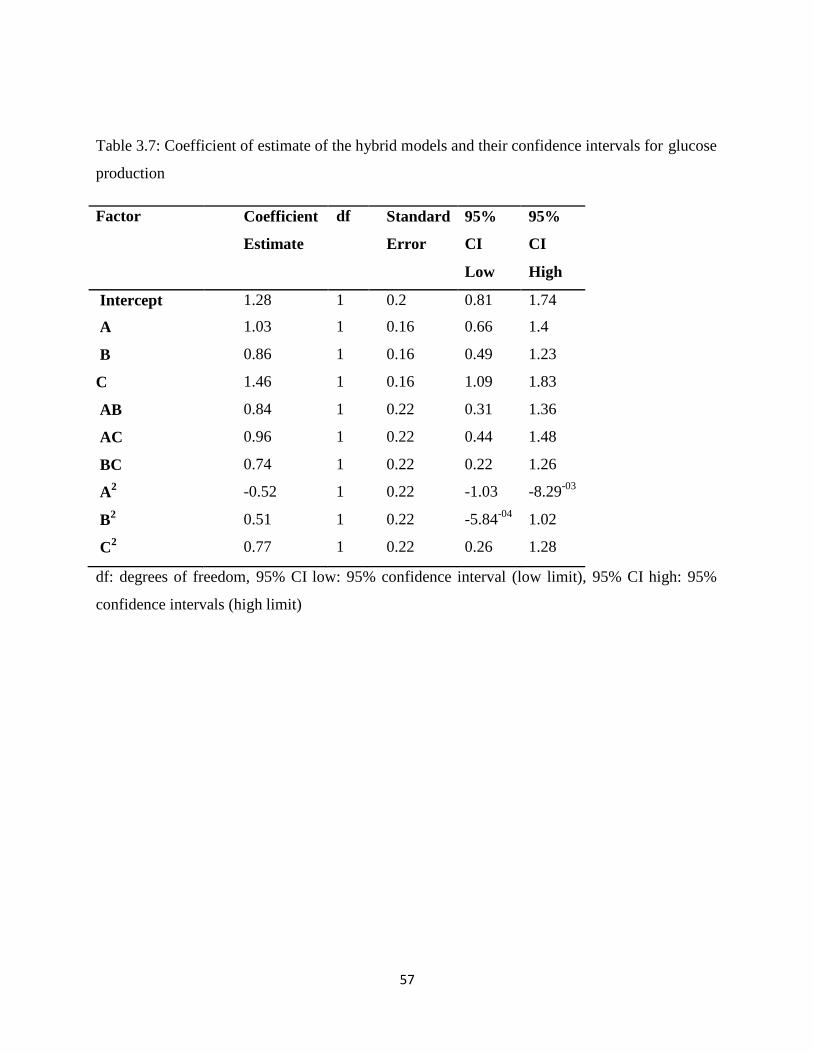
57
Table 3.7: Coefficient of estimate of the hybrid models and their confidence intervals for glucose
production
Factor Coefficient
Estimate
df Standard
Error
95%
CI
Low
95%
CI
High
Intercept 1.28 1 0.2 0.81 1.74
A 1.03 1 0.16 0.66 1.4
B 0.86 1 0.16 0.49 1.23
C 1.46 1 0.16 1.09 1.83
AB 0.84 1 0.22 0.31 1.36
AC 0.96 1 0.22 0.44 1.48
BC 0.74 1 0.22 0.22 1.26
A2 -0.52 1 0.22 -1.03 -8.29
-03
B2 0.51 1 0.22 -5.84
-04 1.02
C2 0.77 1 0.22 0.26 1.28
df: degrees of freedom, 95% CI low: 95% confidence interval (low limit), 95% CI high: 95%
confidence intervals (high limit)
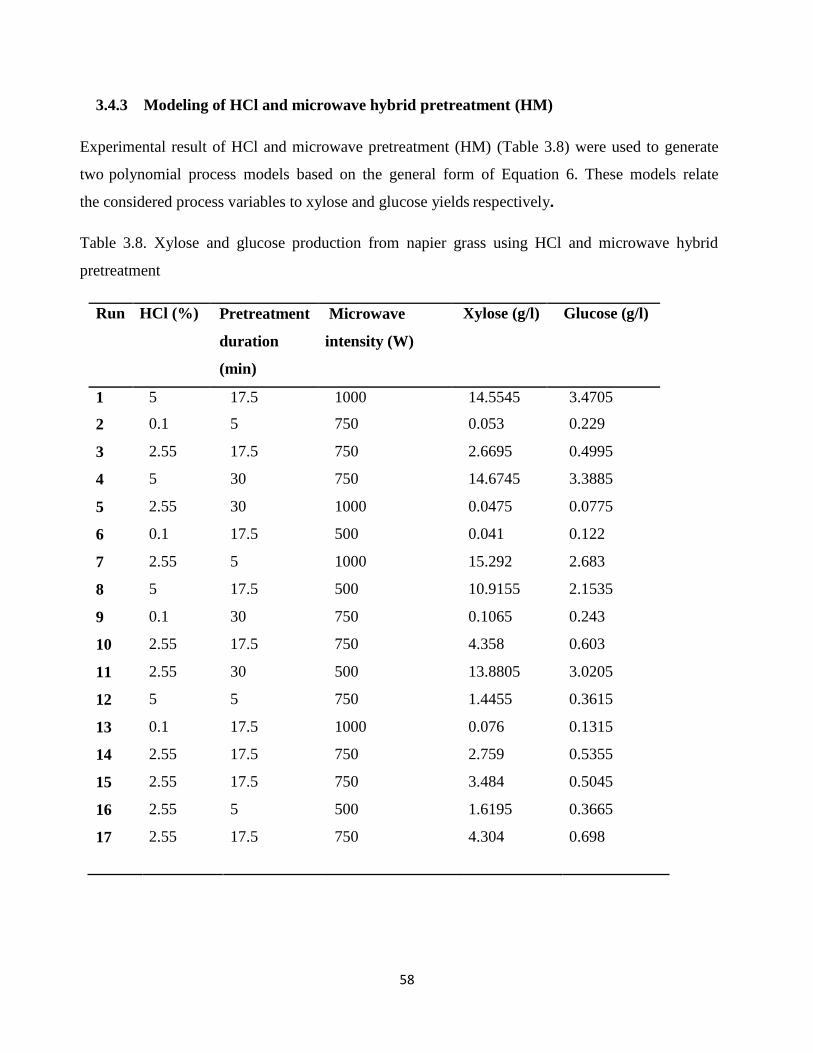
58
3.4.3 Modeling of HCl and microwave hybrid pretreatment (HM)
Experimental result of HCl and microwave pretreatment (HM) (Table 3.8) were used to generate
two polynomial process models based on the general form of Equation 6. These models relate
the considered process variables to xylose and glucose yields respectively.
Table 3.8. Xylose and glucose production from napier grass using HCl and microwave hybrid
pretreatment
Run HCl (%) Pretreatment
duration
(min)
Microwave
intensity (W)
Xylose (g/l) Glucose (g/l)
1 5 17.5 1000 14.5545 3.4705
2 0.1 5 750 0.053 0.229
3 2.55 17.5 750 2.6695 0.4995
4 5 30 750 14.6745 3.3885
5 2.55 30 1000 0.0475 0.0775
6 0.1 17.5 500 0.041 0.122
7 2.55 5 1000 15.292 2.683
8 5 17.5 500 10.9155 2.1535
9 0.1 30 750 0.1065 0.243
10 2.55 17.5 750 4.358 0.603
11 2.55 30 500 13.8805 3.0205
12 5 5 750 1.4455 0.3615
13 0.1 17.5 1000 0.076 0.1315
14 2.55 17.5 750 2.759 0.5355
15 2.55 17.5 750 3.484 0.5045
16 2.55 5 500 1.6195 0.3665
17 2.55 17.5 750 4.304 0.698
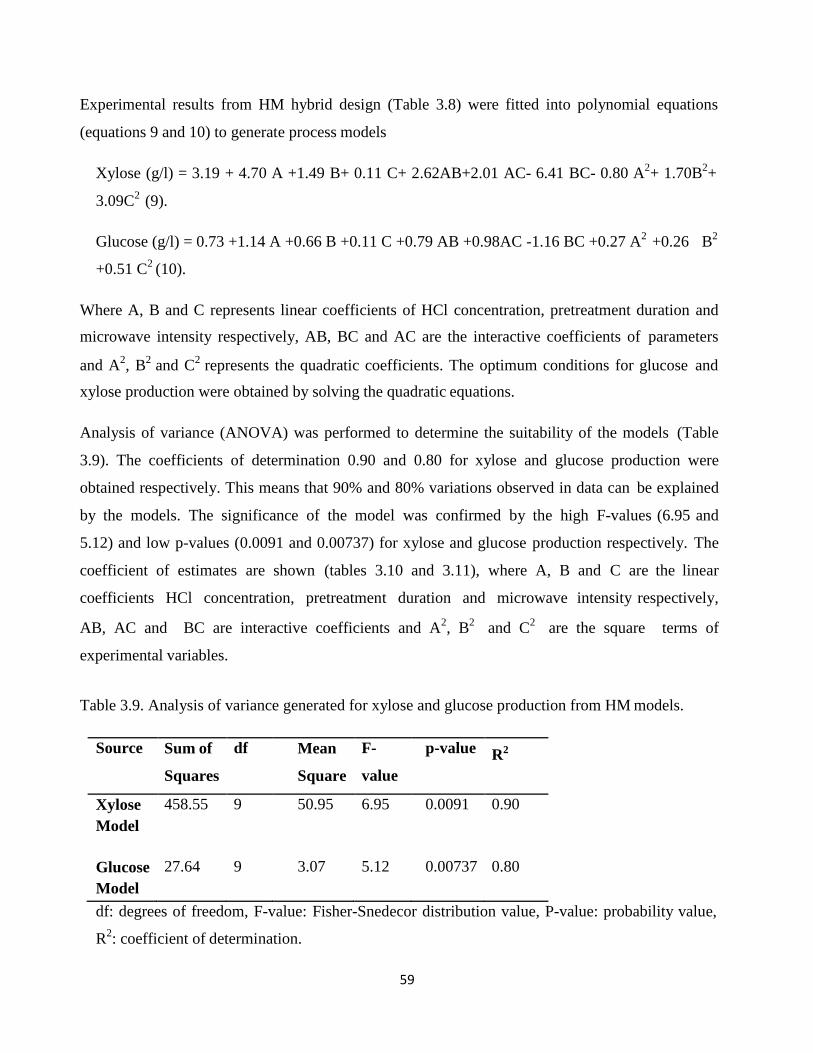
59
Experimental results from HM hybrid design (Table 3.8) were fitted into polynomial equations
(equations 9 and 10) to generate process models
Xylose (g/l) = 3.19 + 4.70 A +1.49 B+ 0.11 C+ 2.62AB+2.01 AC- 6.41 BC- 0.80 A2+ 1.70B
2+
3.09C2
(9).
Glucose (g/l) = 0.73 +1.14 A +0.66 B +0.11 C +0.79 AB +0.98AC -1.16 BC +0.27 A2
+0.26 B2
+0.51 C2
(10).
Where A, B and C represents linear coefficients of HCl concentration, pretreatment duration and
microwave intensity respectively, AB, BC and AC are the interactive coefficients of parameters
and A2, B
2 and C
2 represents the quadratic coefficients. The optimum conditions for glucose and
xylose production were obtained by solving the quadratic equations.
Analysis of variance (ANOVA) was performed to determine the suitability of the models (Table
3.9). The coefficients of determination 0.90 and 0.80 for xylose and glucose production were
obtained respectively. This means that 90% and 80% variations observed in data can be explained
by the models. The significance of the model was confirmed by the high F-values (6.95 and
5.12) and low p-values (0.0091 and 0.00737) for xylose and glucose production respectively. The
coefficient of estimates are shown (tables 3.10 and 3.11), where A, B and C are the linear
coefficients HCl concentration, pretreatment duration and microwave intensity respectively,
AB, AC and BC are interactive coefficients and A2, B
2 and C
2 are the square terms of
experimental variables.
Table 3.9. Analysis of variance generated for xylose and glucose production from HM models.
Source Sum of
Squares
df Mean
Square
F-
value
p-value R2
Xylose
Model
458.55 9 50.95 6.95 0.0091 0.90
Glucose
Model
27.64 9 3.07 5.12 0.00737 0.80
df: degrees of freedom, F-value: Fisher-Snedecor distribution value, P-value: probability value,
R2: coefficient of determination.
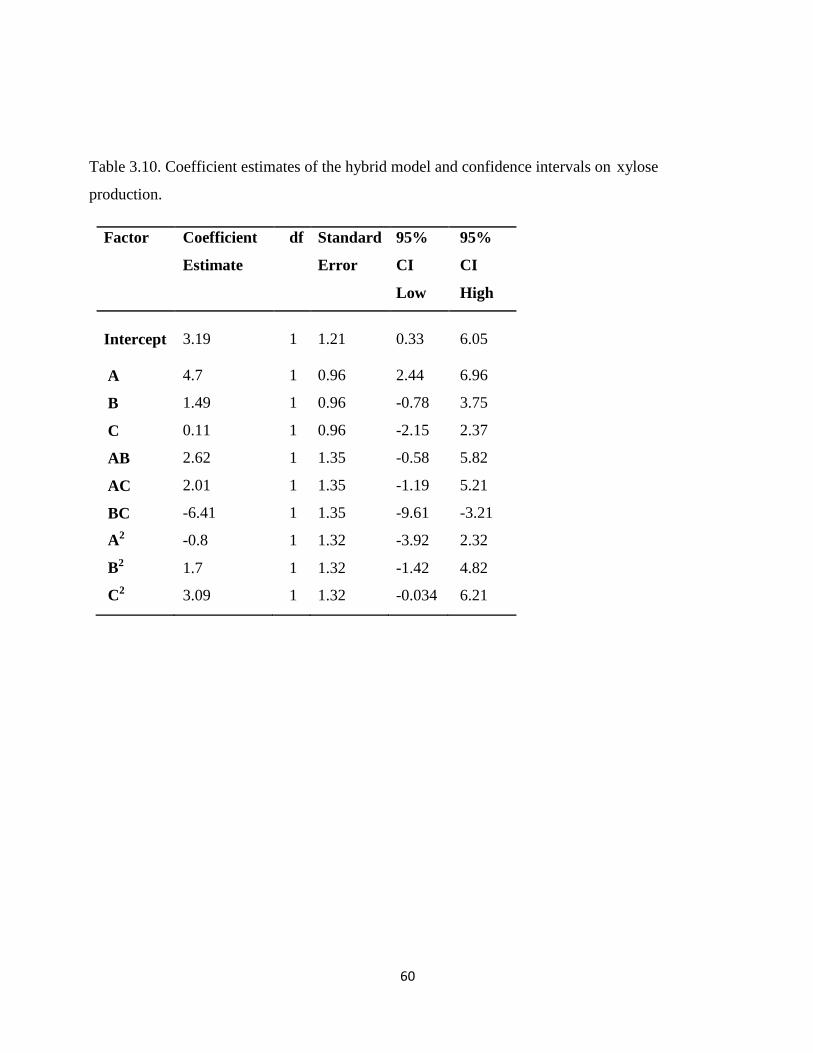
60
Table 3.10. Coefficient estimates of the hybrid model and confidence intervals on xylose
production.
Factor Coefficient
Estimate
df Standard
Error
95%
CI
Low
95%
CI
High
Intercept 3.19
1
1.21
0.33
6.05
A 4.7 1 0.96 2.44 6.96
B 1.49 1 0.96 -0.78 3.75
C 0.11 1 0.96 -2.15 2.37
AB 2.62 1 1.35 -0.58 5.82
AC 2.01 1 1.35 -1.19 5.21
BC -6.41 1 1.35 -9.61 -3.21
A2 -0.8 1 1.32 -3.92 2.32
B2 1.7 1 1.32 -1.42 4.82
C2 3.09 1 1.32 -0.034 6.21
Intercept
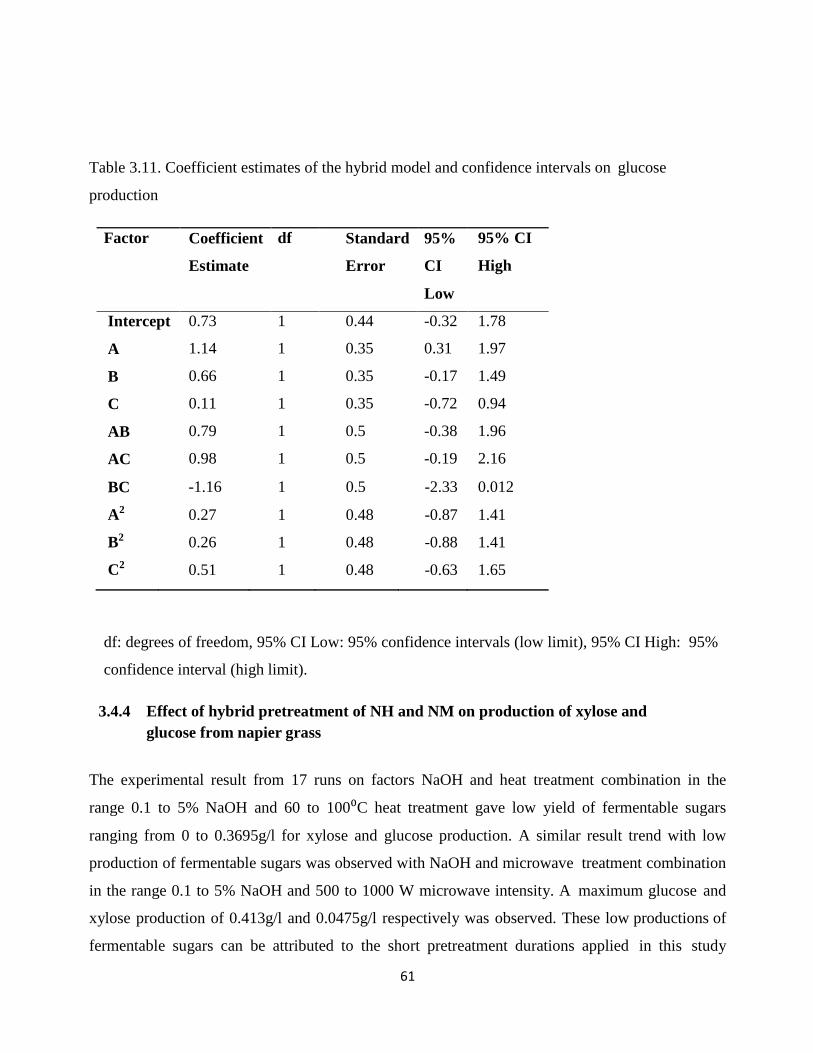
61
Table 3.11. Coefficient estimates of the hybrid model and confidence intervals on glucose
production
Factor Coefficient
Estimate
df Standard
Error
95%
CI
Low
95% CI
High
Intercept 0.73 1 0.44 -0.32 1.78
A 1.14 1 0.35 0.31 1.97
B 0.66 1 0.35 -0.17 1.49
C 0.11 1 0.35 -0.72 0.94
AB 0.79 1 0.5 -0.38 1.96
AC 0.98 1 0.5 -0.19 2.16
BC -1.16 1 0.5 -2.33 0.012
A2 0.27 1 0.48 -0.87 1.41
B2 0.26 1 0.48 -0.88 1.41
C2 0.51 1 0.48 -0.63 1.65
df: degrees of freedom, 95% CI Low: 95% confidence intervals (low limit), 95% CI High: 95%
confidence interval (high limit).
3.4.4 Effect of hybrid pretreatment of NH and NM on production of xylose and
glucose from napier grass
The experimental result from 17 runs on factors NaOH and heat treatment combination in the
range 0.1 to 5% NaOH and 60 to 100⁰C heat treatment gave low yield of fermentable sugars
ranging from 0 to 0.3695g/l for xylose and glucose production. A similar result trend with low
production of fermentable sugars was observed with NaOH and microwave treatment combination
in the range 0.1 to 5% NaOH and 500 to 1000 W microwave intensity. A maximum glucose and
xylose production of 0.413g/l and 0.0475g/l respectively was observed. These low productions of
fermentable sugars can be attributed to the short pretreatment durations applied in this study
62
(maximum 3 hours) and low alkaline concentrations (maximum 5% NaOH). These findings
differ from the report of Liong et al. (2012) who observed glucose yield of 7.3g/l from napier grass
pretreated with 7% NaOH for 4 hours at 35˚C. Yasuda et al. (2013) observed 807mg xylose
yield when 100g napier grass was pretreated with low-moisture anhydrous ammonia (LMAA) at
room temperature for 4 weeks. Wongwatanapaiboon et al. (2012) reported 4.14g/l total reducing
sugar yield after napier grass was treated with 7.5% alkaline peroxide at 35˚C for 24 hours.
According to Moiser et al. (2005), alkaline pretreatment yields high sugar concentrations under
long resident time (measured in days) at ambient temperature. It is postulated that long process
times are necessary because alkaline causes chemical swelling of cellulose fibers in which
saponification (base hydrolysis) reaction occurs thus causing disruption of hemicellulose cross
links and increasing porosity of biomass (Ogawa et al., 2008).
3.4.5 Linear effect of parameters on xylose and glucose production in hybrid
pretreatments
The xylose and glucose yields from the HH and the HM hybrid pretreatments are shown in tables
3.4 and 3.8 respectively. The xylose and glucose yields were greatly influenced by the
pretreatment duration, pretreatment temperature, microwave intensity and acid concentration. The
production of fermentable sugars and their ratios (xylose to glucose) in the hybrid pretreatments
of napier grass is well sensitive to the concentration of HCl. For example, as shown in HH
hybrid pretreatment (Table 3.4 runs 2 and 7), at constant pretreatment temperature (80˚C) and
treatment duration of 97.50 min, a concentration of 5% HCl gave 14.13g/l xylose and 3.86g/l
glucose whereas a concentration of 2.55% HCl gave 10.50g/l xylose and 1.41g/l glucose
respectively. The observed xylose to glucose ratios were 7:2 and 7:1 respectively. A similar
trend was observed for HM hybrid pretreatment at microwave intensity of 750W and duration
of 30 min, as a concentration of 5% and 0.1% HCl gave reducing sugar concentrations 14.67 g/l
xylose and 3.39g/l glucose, 0.11g/l xylose and 0.24g/l glucose respectively (Table 3.8 runs 4 and
9). Cui and Shen (2012), reported a total reducing sugar yields of 350mg/g substrate when raw
beer lees was treated with 4% HCl compared to 250mg/g substrate when 0.5% HCl was used.
Raw beer lees biomass analysis showed significant reduction in hemicellulose content (43.54%)
after 0.5% and 4% HCl pretreatment, to 6.08% and 1.72% respectively. Thus it is apparent that,
high HCl concentration improves reducing sugar yields through increased hemicellulose
hydrolysis rate (Idrees et al., 2013).
63
The microwave intensity of 1000 W gave 14.5g/l xylose and 3.40g/l glucose whereas at 500 W
only 10.9g/l xylose and 2.10g/l glucose were obtained at constant HCl concentration (5%) and
pretreatment duration (17.5 min) (Table 3.8, runs 1 and 8). This is attributed to increased
microwave energy causing increased interactions between hydrogen bonds in cellulose layers
which results in freedom of movement and polarisability of groups within cellulose molecules
thus reducing crystallinity of biomass and increasing reducing sugar released (Paul et al., 2014).
Similarly, Chartchalerm et al. (2007) reported gradual increase in densities of wheat straw and
barley straw when the microwave intensity was increased. This implies that, a high
microwave intensity disintegrates lignocellulosic biomass and dissolves components. At a
constant HCl concentration of 5% HCl and pretreatment duration 97.50 min, a high temperature
(100˚C) gave a yield of 6.61g/l and 4.30g/l of xylose glucose respectively while low temperature
(60˚C) gave 2.17g/l and 0.662g/l xylose and glucose yields respectively. A xylose to glucose
ratio of 3:2 was obtained at 100˚C compared to a 3.1 ratio at 60˚C (Table 3.4, runs 3 and 8).
Idrees et al. (2013) reported that low temperature pretreated biomass had a high hemicellulose
content and low total reducing sugars while high temperature pretreated biomass had low
hemicellulose content and high total reducing sugars. At constant HCl concentration of 5% and
pretreatment temperature of 80˚C, a long pretreatment duration of 180 min gave high xylose and
glucose yields (14.6g/l and 3.8g/l respectively) compared to a short pretreatment duration of 15
min, where 1.45g/l and 0.361g/l xylose and glucose yields respectively were observed. A xylose
to glucose ratio of 5:1 was obtained at 180 min compared to a 4.1 ratio at 15 min. These findings
are similar to observations by Ogawa et al. (2008) and Chartchalerm et al. (2007). These
differences in the observed xylose to glucose ratios evidence that pretreatment duration,
pretreatment temperature, microwave intensity and acid concentration influence the pattern of
release of these sugars. However, xylose concentration exceeded glucose concentration under the
various conditions investigated.
3.4.6 Interaction of experimental variables on xylose and glucose production in HH and
HM hybrid pretreatments
The large variation in fermentable sugar yield observed in HH hybrid pretreatment (0.006 to
14.134 g/l and 0.245 to 5.991g/l for xylose and glucose respectively) illustrates the high
susceptibility of these processes on the considered input variables (Table 3.4). A similar pattern of
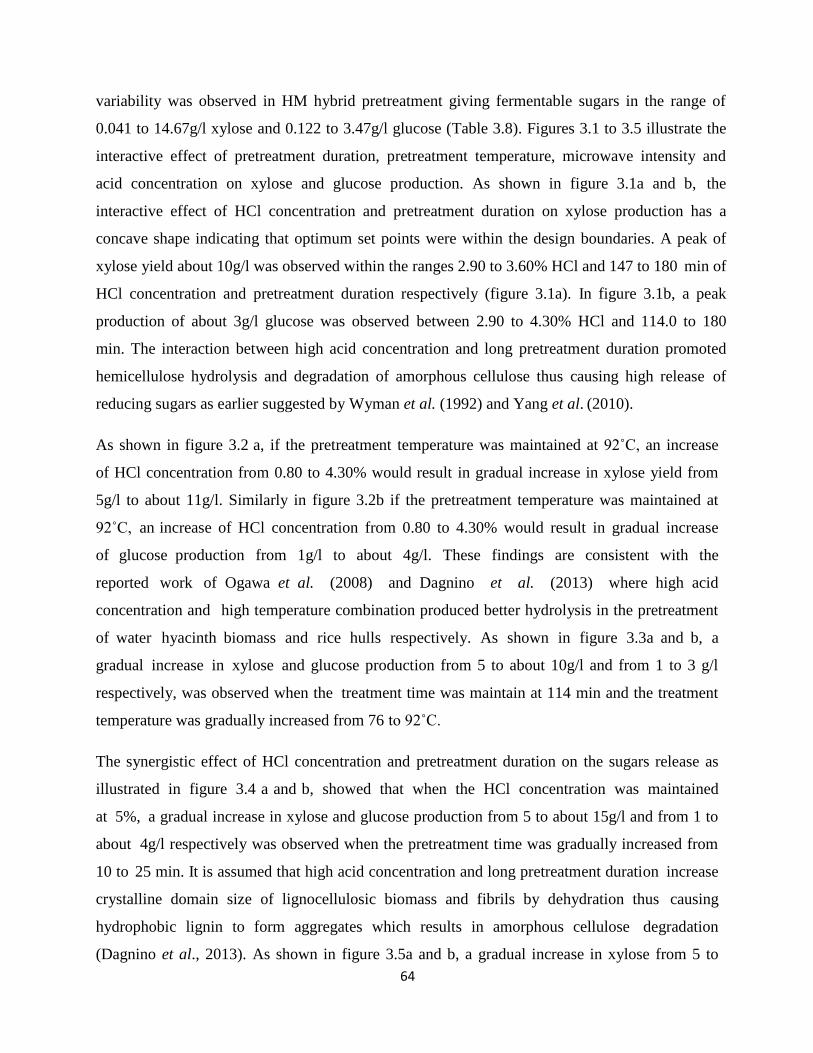
64
variability was observed in HM hybrid pretreatment giving fermentable sugars in the range of
0.041 to 14.67g/l xylose and 0.122 to 3.47g/l glucose (Table 3.8). Figures 3.1 to 3.5 illustrate the
interactive effect of pretreatment duration, pretreatment temperature, microwave intensity and
acid concentration on xylose and glucose production. As shown in figure 3.1a and b, the
interactive effect of HCl concentration and pretreatment duration on xylose production has a
concave shape indicating that optimum set points were within the design boundaries. A peak of
xylose yield about 10g/l was observed within the ranges 2.90 to 3.60% HCl and 147 to 180 min of
HCl concentration and pretreatment duration respectively (figure 3.1a). In figure 3.1b, a peak
production of about 3g/l glucose was observed between 2.90 to 4.30% HCl and 114.0 to 180
min. The interaction between high acid concentration and long pretreatment duration promoted
hemicellulose hydrolysis and degradation of amorphous cellulose thus causing high release of
reducing sugars as earlier suggested by Wyman et al. (1992) and Yang et al. (2010).
As shown in figure 3.2 a, if the pretreatment temperature was maintained at 92˚C, an increase
of HCl concentration from 0.80 to 4.30% would result in gradual increase in xylose yield from
5g/l to about 11g/l. Similarly in figure 3.2b if the pretreatment temperature was maintained at
92˚C, an increase of HCl concentration from 0.80 to 4.30% would result in gradual increase
of glucose production from 1g/l to about 4g/l. These findings are consistent with the
reported work of Ogawa et al. (2008) and Dagnino et al. (2013) where high acid
concentration and high temperature combination produced better hydrolysis in the pretreatment
of water hyacinth biomass and rice hulls respectively. As shown in figure 3.3a and b, a
gradual increase in xylose and glucose production from 5 to about 10g/l and from 1 to 3 g/l
respectively, was observed when the treatment time was maintain at 114 min and the treatment
temperature was gradually increased from 76 to 92˚C.
The synergistic effect of HCl concentration and pretreatment duration on the sugars release as
illustrated in figure 3.4 a and b, showed that when the HCl concentration was maintained
at 5%, a gradual increase in xylose and glucose production from 5 to about 15g/l and from 1 to
about 4g/l respectively was observed when the pretreatment time was gradually increased from
10 to 25 min. It is assumed that high acid concentration and long pretreatment duration increase
crystalline domain size of lignocellulosic biomass and fibrils by dehydration thus causing
hydrophobic lignin to form aggregates which results in amorphous cellulose degradation
(Dagnino et al., 2013). As shown in figure 3.5a and b, a gradual increase in xylose from 5 to
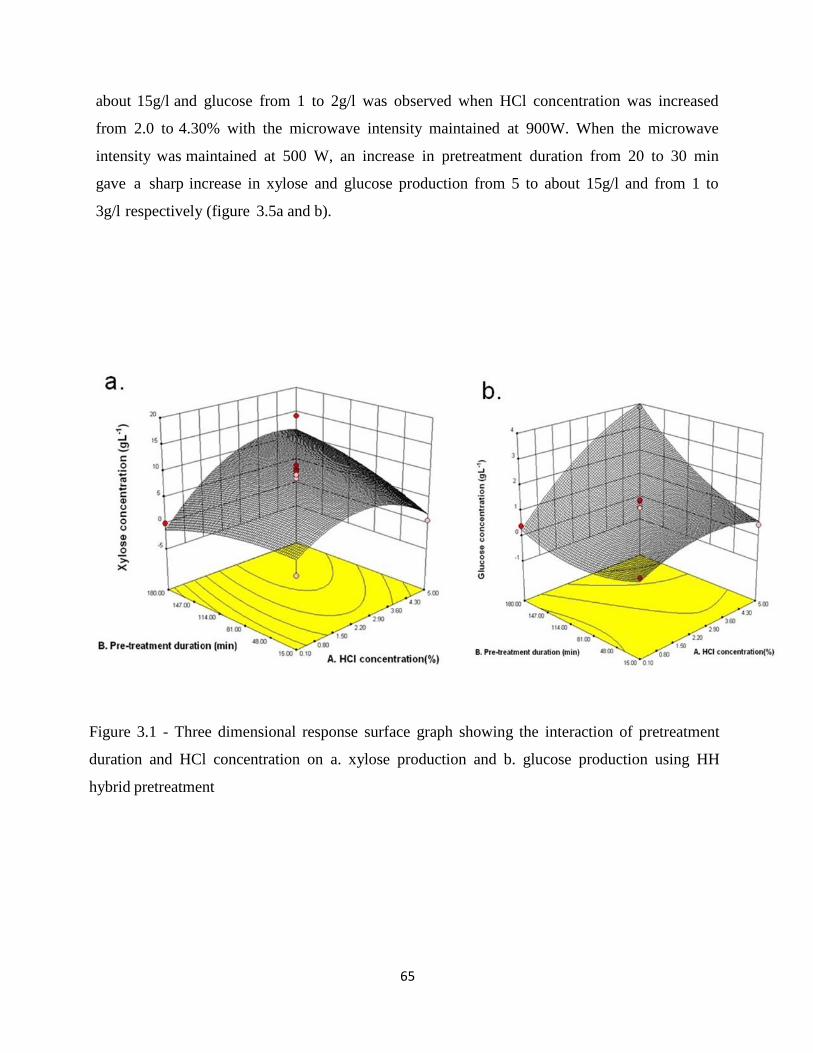
65
about 15g/l and glucose from 1 to 2g/l was observed when HCl concentration was increased
from 2.0 to 4.30% with the microwave intensity maintained at 900W. When the microwave
intensity was maintained at 500 W, an increase in pretreatment duration from 20 to 30 min
gave a sharp increase in xylose and glucose production from 5 to about 15g/l and from 1 to
3g/l respectively (figure 3.5a and b).
Figure 3.1 - Three dimensional response surface graph showing the interaction of pretreatment
duration and HCl concentration on a. xylose production and b. glucose production using HH
hybrid pretreatment
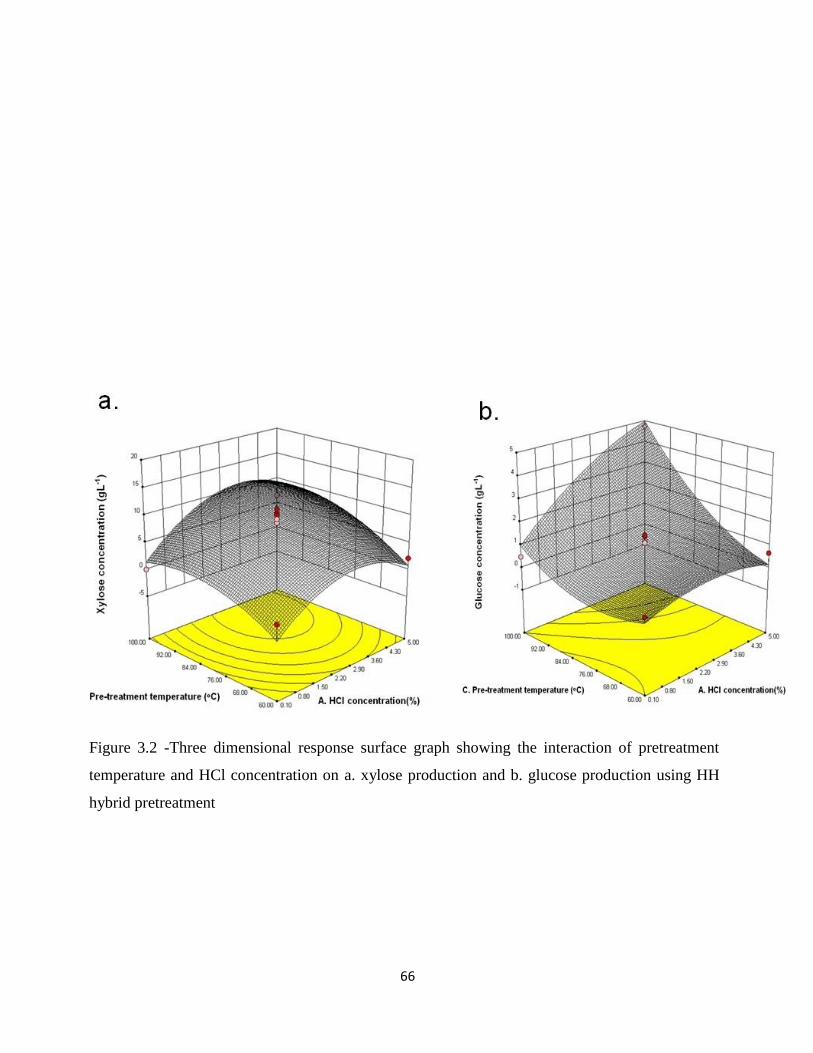
66
Figure 3.2 -Three dimensional response surface graph showing the interaction of pretreatment
temperature and HCl concentration on a. xylose production and b. glucose production using HH
hybrid pretreatment
67
Figure 3.3. Three dimensional response surface graph showing the interaction of pretreatment
temperature and pretreatment duration on a. xylose production and b. glucose production using
HH hybrid pretreatment
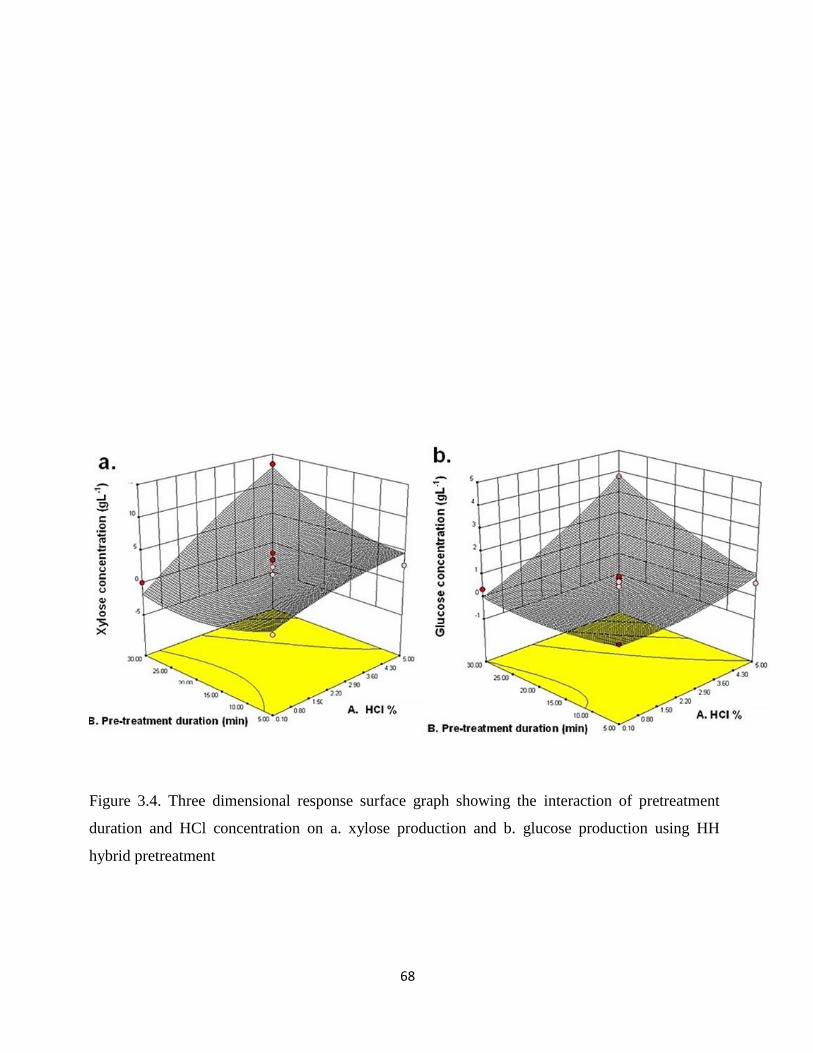
68
Figure 3.4. Three dimensional response surface graph showing the interaction of pretreatment
duration and HCl concentration on a. xylose production and b. glucose production using HH
hybrid pretreatment
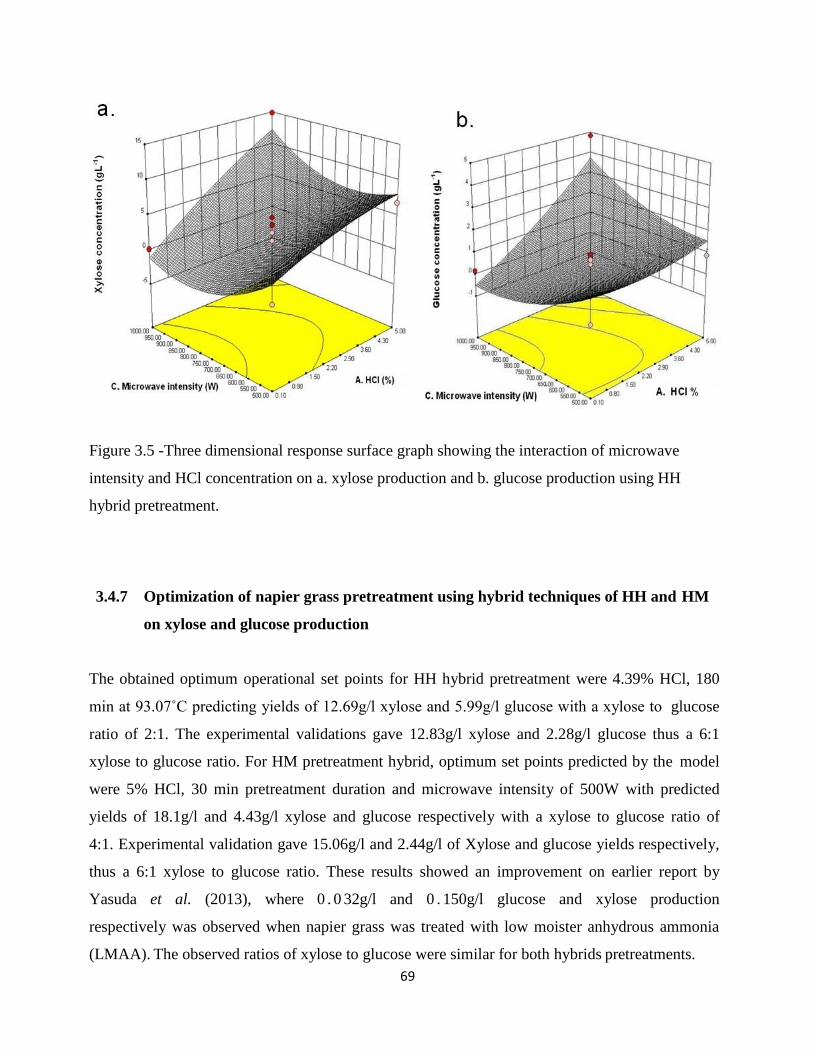
69
Figure 3.5 -Three dimensional response surface graph showing the interaction of microwave
intensity and HCl concentration on a. xylose production and b. glucose production using HH
hybrid pretreatment.
3.4.7 Optimization of napier grass pretreatment using hybrid techniques of HH and HM
on xylose and glucose production
The obtained optimum operational set points for HH hybrid pretreatment were 4.39% HCl, 180
min at 93.07˚C predicting yields of 12.69g/l xylose and 5.99g/l glucose with a xylose to glucose
ratio of 2:1. The experimental validations gave 12.83g/l xylose and 2.28g/l glucose thus a 6:1
xylose to glucose ratio. For HM pretreatment hybrid, optimum set points predicted by the model
were 5% HCl, 30 min pretreatment duration and microwave intensity of 500W with predicted
yields of 18.1g/l and 4.43g/l xylose and glucose respectively with a xylose to glucose ratio of
4:1. Experimental validation gave 15.06g/l and 2.44g/l of Xylose and glucose yields respectively,
thus a 6:1 xylose to glucose ratio. These results showed an improvement on earlier report by
Yasuda et al. (2013), where 0 . 0 32g/l and 0 . 150g/l glucose and xylose production
respectively was observed when napier grass was treated with low moister anhydrous ammonia
(LMAA). The observed ratios of xylose to glucose were similar for both hybrids pretreatments.
70
3.4.8 Preliminary assessment of the optimally pretreated napier for fermentative
biohydrogen production
The biohydrogen production experiment was carried out in duplicates using hydrolyzed napier
grass substrate pretreated with the earlier optimized HH and HM hybrid methods. For HH and
HM pretreated napier grass, the cumulative hydrogen gas volume of 8.57ml and 25.06 ml
respectively were observed. Optimization of this process on key physico-chemical variables such
as organic loading rate, hydraulic retention time, operational temperature and pH can significantly
improve the hydrogen yield. These findings are of special interest for biohydrogen production
scale up since this raw material is sustainable and abundantly available and it is regarded as
waste.
3.5 Conclusion
The modeling and optimization of set points of hybrid pretreatment techniques for maximum
xylose and glucose production from napier grass was evaluated. The findings indicate that
fermentable xylose and glucose production from napier grass can be enhanced by combining
pretreatments of HCl and moist heat at 4.39% HCl, 93.07˚C for 180 min or using a combination
of microwave and HCl at 500 W, 5% HCl for 30 min. Additionally, during the hydrolysis of
napier grass with the optimized hybrid pretreatments, the ratio of xylose to glucose remained
relatively similar (6:1). The optimum generation of xylose and glucose from napier grass
significantly leverages its potential as substrate for the production of renewable biomaterials and
biofuels such as biohydrogen.
71
3.6 References
Aden A, Foust T. (2009). Technoeconomic analysis of the dilute sulfuric acid and enzymatic
hydrolysis process for the conversion of corn stover to ethanol. Journal of Cellulose; 16:535- 545.
Azwar MY, Hussain MA, Abdul-Wahab AK. (2014). Development of biohydrogen production by
photobiological, fermentation and electrochemical processes: A review. Renewable and
Sustainable Energy Reviews; (31): 158–173
Cardona CA, Sanchez OJ. (2006). Energy consumption analysis of integrated flowsheets for
production of fuel ethanol from lignocellulosic biomass. Journal of Energy; 31: 2447-2459
Chang CW, Yu WC, Chen WJ, Chang RF, Kao WS. (2011). A study on the enzymatic hydrolysis
of steam exploded napiergrass with alkaline treatment using artificial neural networks and
regression analysis. Journal of the Taiwan Institute of Chemical Engineers; 42(6): 889-894
Chartchalerm I, Tanawut T, Thikamporn K, Ponpitak P, Virapong P. (2007). Appropriate
technology for the bioconversion of water hyacinth (Eichhornia crassipes) to liquid ethanol.
Future prospects for community strengthening and sustainable development. EXCLI J ; (61): 67-
76.
Cui M, Shen J. (2012). Effects of acid and alkaline pretreatments on the biohydrogen production
from grass by anaerobic dark fermentation. International Journal of Hydrogen Energy; (37):
1120-1124
Dagnino EP, Chamorroa ER, Romanob SD, Felissia FE, Areac MC. (2013). Optimization of the
acid pretreatment of rice hulls to obtain fermentable sugars for bioethanol production.
Industrial Crops and Products; (42): 363– 368
DiTomaso JM, Reaser JK, Dionigi C P, Doering O C, Chilton E, Schardt J D. (2010). Biofuel vs.
bioinvasion: seeding policy priorities. Journal of Environmental Science & Technology; 44:
6906–6910
Eggeman T, Elander RT. (2005). Process and economic analysis of pretreatment technologies.
Bioresource Technology; (96):2019–2025
Fiddaman TS. (2002). Exploring Policy Options with a Behavioral Climate-Economy Model.
System Dynamics Review; 18 (2): 243-268
72
Florida Department of Environmental Protection (FDEP). (2005). Status of the Aquatic Plant
Maintenance Program in Florida Public Waters, Annual Report Fiscal Year 2004-2005. Bureau of
Invasive Plant Management, Tallahassee, FL.
Hu ZH, Gang W, Han-Qing Y. (2004). Anaerobic degradation of cellulose by rumen
microorganisms at various pH values. Biochemical Engineering Journal; (21): 59–62
Idrees M, Ahmad A and Fahim AQ. (2013). Optimization of Sulfide/Sulfite Pretreatment of
Lignocellulosic Biomass for Lactic Acid Production. Biomedical Research International, 2013
Iranmahboob J, Nadim F, Monemi S. (2005). Optimizing acid hydrolysis: A critical step for
production of ethanol from mixed wood chip. Biomass and Bioenergy; 22(5): 401-404
Iroba KL, Tabil LG, Dumonceaux T, Baik OD. (2013). Effect of alkaline pretreatment on
chemical composition of lignocellulosic biomass using radio frequency heating. Biosystems
engineering; (116): 385-398
Kumar P, Barrett DM, Delwiche MJ, Stroeve P. (2009). Methods for pretreatment of
lignocellulosic biomass for efficient hydrolysis and biofuel production. Industrial and
Engineering Chemistry Research; 48(8):3713-3729.
Liong YY, Rasmina H, Oi ML, Rozi M. (2012). Conversion of lignocellulosic biomass from
grass to bioethanol using material pretreated with alkali and white rot fungus, Phanerochaete
Chrysosporium, Journal of Bioresources; 7(4):5500-5513
Lopez-Arenas T, Punit R, Edgar RJ, Mauricio SC. (2010). Factors affecting the acid pretreatment
of lignocellulosic biomass: Batch and continuous process. 20th European Symposium on
Computer Aided Process Engineering – ESCAPE20
Mackie KL, Brownell HH, West KL, Saddler JN. (2005). Effect of sulphur dioxide and
sulphuric acid on steam explosion of aspen wood. Journal of Wood Chemistry Technology; 5:
405–425.
Mosier N, Wyman C, Dale B, Elander R, Lee YY, Holtzapple M, Ladisch M. (2005). Features of
promising technologies for pretreatment of lignocellulosic biomass. Bioresource Technology; 96:
673–686.
73
Muthuvelayudham R, Viruthagiri T. (2010). Application of central composite design based
response surface methodology in parameter optimization and on cellulase production using
agricultural waste. International Journal of Chemical and Biological Engineering; 3(2): 97– 104.
Ogawa M, Ishida YU, Naoto U. (2008). Ethanol production from the water hyacinth Eichhornia
crassipes by yeast isolated from various hydrospheres. African Journal of Microbiology
Resources; (2): 110-13.
Paul L, Loukas P, Hugh MO, Sai V P, Marcus F, Yoshiharu N, Roland S, Benjamin L,
Hanson BL, Shane H, William TH, Volker U, Evans BR, Gnanakaran S, Ragauskas AJ, Smith JC,
Davison BH. (2014). Common processes drive the thermochemical pretreatment of lignocellulosic
biomass. Green Chemistry; (16)63
Prakasham RS, Rao RS, Hobbs PJ. (2009). Current trends in biotechnological production of
xylitol and future prospects. Current Trends in Biotechnology and Pharmacy; 3(1): 8–36.
Ramos LP, Breuil C, Saddler JN. (1992). Comparison of steam pretreatment of eucalyptus,
aspen, and spruce wood chips and their enzymatic hydrolysis. Applied Biochemistry and
Biotechnology; 34(35): 37–48.
Ramprakash B, Muthukumar K. (2015). Comparative study on the performance of various
pretreatment and hydrolysis for the production of biohydrogen using Enterobacter aerogened
RM08 from rice mill wastewater. International Journal of Hydrogen Energy; 40 (30): 9106 - 9112
Rekha BN, Aniruddha BP. (2013). Performance enhancement of batch anaerobic digestion of
Napier grass by alkali pretreatment. International Journal of Chemical Technology Research;
5(2): 558-564
Saxena RC, Adhikari DK, Goyal HB. (2009). Biomass-based energy fuel through biochemical
routes: A review. Renewable and Sustainable Energy Reviews; 13(1): 167-178.
Smith AL, Klenk N, Wood S, Hewitt N, Henriques I, Yan N, Bazely DR. (2013). Second
generation biofuels and bioinvasions: An evaluation of invasive risks and policy responses in the
United States and Canada. Renewable and Sustainable Energy Reviews; 27(0): 30-42.
Somerville C, Youngs H, Taylor, C, Davis S C, Long S P. (2012). Feedstocks for lignocellulosic
biofuels. Journal of Science(Washington); 329(5993): 790-792
74
Suhardi VSH, Bijeta P, David S, Raj B. (2013). Evaluation of pretreatment methods for
lignocellulosic ethanol production from energy cane variety L 79-1002. International journal of
biodeterioration and biodegradation; 85: 683–687
Wongwatanapaiboon J Vorakan B, Ratanavalee I, Pakorn W,Tikamporn Y, Warawut C. (2012).
The Potential of Cellulosic Ethanol Production from Grasses in Thailand. Journal of Biomedicine
and Biotechnology Volume 2012
Wyman CE, Spindler DD, Grohmann K. (1992). Simultaneous saccharification and fermentation
of several lignocellulosic feedstocks to fuel ethanol. Biomass Bioenergy; (3): 301-307.
Xu J, Deshusses MA. (2015). Fermentation of swine wastewater derived duckweed for
biohydrogen production. International Journal of Hydrogen Energy; 40 (22): 7028 - 7036
Yang M, Li W, Liu B, Li Q, Xing J. (2010). High-concentration sugars production from corn
stover based on combined pretreatments and fed-batch process. Bioresource Technology;
(101): 4884–4888.
Yasuda M, Keisuke T, Hayato N, Takuya U, Toshifumi Y, Tomoko M, Yasuyuki I, Kazuyoshi
O. (2013). Enhancement of Ethanol Production from Napiergrass (Pennisetum purpureum
Schumach) by a Low-Moisture Anhydrous Ammonia Pretreatment. Journal of Sustainable
Bioenergy Systems; 3: 179-185
Yue ZB, Han-Qing Y, Zhi-Liang W. (2007). Anaerobic digestion of cattail with rumen
culture in the presence of heavy metals. Bioresource Technology; (98): 781–786
Zhang YH. (2008). Reviving the carbohydrate economy via multiproduct lignocellulose
biorefineries. Journal of Industrial Microbiology and Biotechnology; (35): 367-375
75
CHAPTER 4
Modeling and optimization of biohydrogen production from napier grass (Pennisetum
purpureum) using immobilized mixed microbial consortia – Preliminary scale up
4.1 Abstract
The modeling and optimization of biohydrogen production from pretreated napier grass using
immobilized mixed microbial consortia is reported. The optimum set points of substrate
concentration and Hydraulic Retention Time (HRT) were investigated using the Response
Surface Methodology (RSM). A coefficient of determination (R2) of 0.79 was obtained and the
optimum operational conditions of 19.05% and 139.97 hours for substrate concentration and HRT
respectively were obtained, predicting hydrogen yield of 5.31ml H2/g napier grass. Model
validation gave 6.61ml H2/g napier grass. A semi-pilot scale biohydrogen production in a 13L
bioreactor using pretreated napier grass and immobilized mixed microbial consortia was carried
out under the optimum operational conditions. A maximum hydrogen fraction of 28.52% and
hydrogen yield of 14.03ml H2/g napier grass was observed at pH 6.3, temperature 37˚C after 62
hours of fermentation. This optimum generation of biohydrogen using renewable napier grass
highlights potential application of this feedstock towards large scale development of an
economical and sustainable hydrogen economy. Additionally, dark fermentative hydrogen
production from napier grass using immobilized microbial consortia combines a cheap hydrogen
production method with high unit volumetric production rate which further substantiates
practicability of economical commercial scale hydrogen production.
Keywords: Biohydrogen production, Immobilized beads, Napier grass, Semi-pilot scale,
Modeling, Optimization.
76
4.2 Introduction
The current heavy reliance on fossil fuels as a primary energy source has led to lamentable
problems (Ramprakash and Muthukumar, 2009). Fossil fuels combustion has contributed
significantly to greenhouse gasses emissions causing environmental pollution and global
warming (Azwar et al., 2014). Hydrogen has attracted increasing global attention as an
alternative to conventional fossil fuels because it has high energy yield (142 kJ/g), renewable
and non-polluting in nature (Das and Veziroglu, 2001). Commercial scale hydrogen production
is costly (Chong et al., 2009). The use of cheap substrates and renewable substrates could
significantly lower the hydrogen production cost thus making its production economically
feasible at industrial scale.
Lignocellulosic substrates are amenable for fermentative hydrogen production as these are
abundant, low cost and sustainable biomass feedstocks (Liu, 2011). Among other lignocellulosic
substrates, napier grass (Pennisetum purpureum) is a promising feedstock because of its high
cellulose content, rapid growth, highly invasive nature, high adaptability and high biomass yields
(up to 40 metric ton/ha/year) (Liong et al., 2012; Smith et al., 2013). Its high cellulose (28.88%)
and hemicellulose (30.61%) content leverages its potential as valuable source of fermentable
sugars (Wongwatanapaiboon et al., 2012). It is a C4 all season grass species that is widely
distributed and native to African grass lands (Smith et al., 2013). Globally, Somerville et al.
(2012) reported annual cumulative dry matter napier grass yields of 85 tons per hectare while
Reddy et al. (2012) reported an annual cumulative yield of 40 tons per hectare for South Africa
alone. Major advantages of napier grass based hydrogen are the local availability of the biomass,
renewability and the feasibility of biomass conversion without high capital costs (Hoogwijk et
al., 2003).
There is renewed interest to optimize hydrogen production technologies for high production
rates, low energy demands, ease in operation and sustainability (Fang et al., 2002). Improving
the microbial substrate conversion rate and unit volumetric production rate are considered key
aspects to optimization of hydrogen production (Wu et al., 2006; Zhang et al., 2007). Microbial
substrate conversion rate improvement can be achieved through the optimization of key
operational parameters while production rate through biomass retention such as microbial cells
immobilization (Wu et al., 2006).
77
Cells immobilization to synthetic polymers and supporting carriers has been observed to retain
high biomass concentrations compared to suspended cells (Fang et al., 2002). It provides high
cell densities and preserve hydrogen generation activity, thus enhancing production efficiency
(Wu et al., 2006). Immobilization of microorganisms for hydrogen production in sodium cellulose
sulfate macro-capsules has been reported to increased hydrogen production by more than 30%
compared to using suspended culture cells (Sheng and Cheng, 2010). Similarly Vincenzini et
al. (1982) observed a fourfold increase in hydrogen production using immobilized
Rhodopseudomonas sp. compared to when suspended cells were used. Immobilized bacteria have
also been observed to be advantageous over suspended cells because they can be re-used
while still maintaining high production efficiency (Han and Shin, 2004). Though studies have
shown that mixed microbial consortia immobilization enhances hydrogen yields, immobilized
mixed cultures have been rarely reported for hydrogen production from lignocellulosic feedstocks.
Dark fermentative hydrogen production from napier grass using immobilized microbial consortia
could be a low cost hydrogen production technology with high unit volumetric production rate.
This study models and optimizes biohydrogen production from pretreated napier grass on input
parameters of substrate concentration and HRT using immobilized mixed microbial consortia.
Furthermore, it investigates a semi-pilot scale biohydrogen production at optimum substrate
concentration and HRT.
4.3 Materials and methods
4.3.1 Inoculum preparation
The anaerobic sludge containing mixed hydrogen-producing consortia was obtained from the
Darville Wastewater treatment plant (Pietermaritzburg, South Africa). The sludge was transferred
to the laboratory and kept at 4˚C prior to use. It was heated for 30 minutes at 100°C to deactivate
non-endospore forming hydrogen consuming bacteria while preserving the endospore forming
hydrogen producing bacteria.
78
4.3.2 Immobilization of mixed microbial consortia
For the cells immobilization, 3% sodium alginate was prepared and mixed with pretreated sludge
in a 1:1 ratio. The mixture was homogenized for 4 minutes at 60 rpm and transferred drop
wise into sterile 2 % CaCl2 using a peristaltic pump (LKB BROMMA 2120 , USA) to form 1.0
to 1.5 mm biocatalyst beads.
4.3.3 Napier grass pretreatment
The napier grass used as a substrate in this study was harvested at 6 months old from Grassland
Science tunnels in the University of KwaZulu-Natal, Pietermaritzburg campus, South Africa. It
was dried at 60˚C for 72 hours and reduced to particle size of 1mm using a centrifugal mill
(Retsch ZM-1, Durban South Africa). Varied concentrations of napier grass powder as specified
by the design (Table 4.1) were immersed in 100ml dilute HCl, after which the mixture was treated
with moist heat in a waterbath under the optimum pretreatment conditions of 93.07oC for 180
minutes previously established (Mafuleka and Gueguim-Kana, 2015).
4.3.4 Experimental design
The RSM Central composite design was used to determine the optimum set points for napier
grass concentration and HRT. The independent variables consisted of napier grass concentration
and HRT in the ranges 5 to 35% and 23 to 193 hours respectively. A total of thirteen experimental
runs (Table 4 .1) were generated with varied conditions and the center points were replicated
three times.
4.3.5 Fermentation process set up
Fermentation processes were conducted in 250ml flask bioreactors. The flasks were fed with
80ml of pretreated napier grass and supplemented with 100ml inorganic salts medium (g/l ):
NH4Cl 0.5; KH2PO4 0.5; K2HPO4 0.5; NaHCO3 4.0; FeCl2.2H2O 0.15;
MgCl2.6H20 0.085;ZnSO4.7H2O 0.01; MnCl2.4H2O 0.03; H3BO3 0.03; CaCl2.6H2O 0.01;
Na2MoO2.2H2O 0.03. Each flask was inoculated with 40g microbial beads and flushed with
nitrogen gas for 2 minutes to create anaerobic conditions. The initial pH was adjusted to 6.5
and the flasks were incubated at 35°C in a shaking water bath at 100rpm. The HRT was
79
varied according to the experimental design.
4.3.6 Modeling and optimization of substrate concentration and HRT
The experimental data recorded from the experimental runs (Table 4 .1) were used in a
multiple regression analysis to generate a quadratic model that relates hydrogen production to
substrate concentration and HRT. The model fitness was assessed using the Analysis of Variance
(ANOVA). The optimum set points of substrate concentration and HRT for maximum hydrogen
generation were obtained by solving the quadratic equation using the method of Myers and
Montgomery (1995). The experimental data were used to develop a second-order polynomial
model (Equation 11):
Y=α0 + α1x1 + α2x2 + α11x12 + α22x2
2 + + α12x1 x2 (11)
Where Y represents the response output, α0 is the intercept, α1x1 and α2x2 are linear coefficients,
α11x12
and α22x2 are the quadratic coefficients and α12x1 x2 represents the interactive coefficient.
4.3.7 Analytical procedures
The volume of evolving biogas fractions of hydrogen, carbon dioxide and methane were
continuously monitored using the F-Lab Biogas software described by Gueguim Kana et al.
(2013). The sampling rate was set to 1 min and the sensors used were the BCP-H2, BCP-CO2
and BCP-CH4 sensors (Bluesens GmbH, Germany), all with measuring range of 0 to
100%.m
Cumulative biogas volumes was recursively computed by the software using CO2, H2 and CH4
gas fractions and volumes at each sampling interval according to Equation 12
VHi = VHi-1 + CHi(VGi - VGi-1)+ VH(CHi – CHi-1) (12)
Where VHi and VHi-1 represent cumulative hydrogen gas volume at current (i) and previous (i-1)
time interval, VGi and VGi-1 represent biogas volumes in current and previous time intervals, CHi
and CHi-1 represent the fraction of hydrogen gas in the headspace of the bioreactor in the current
and previous time intervals and VH represents the total volume of headspace in the bioreactor.
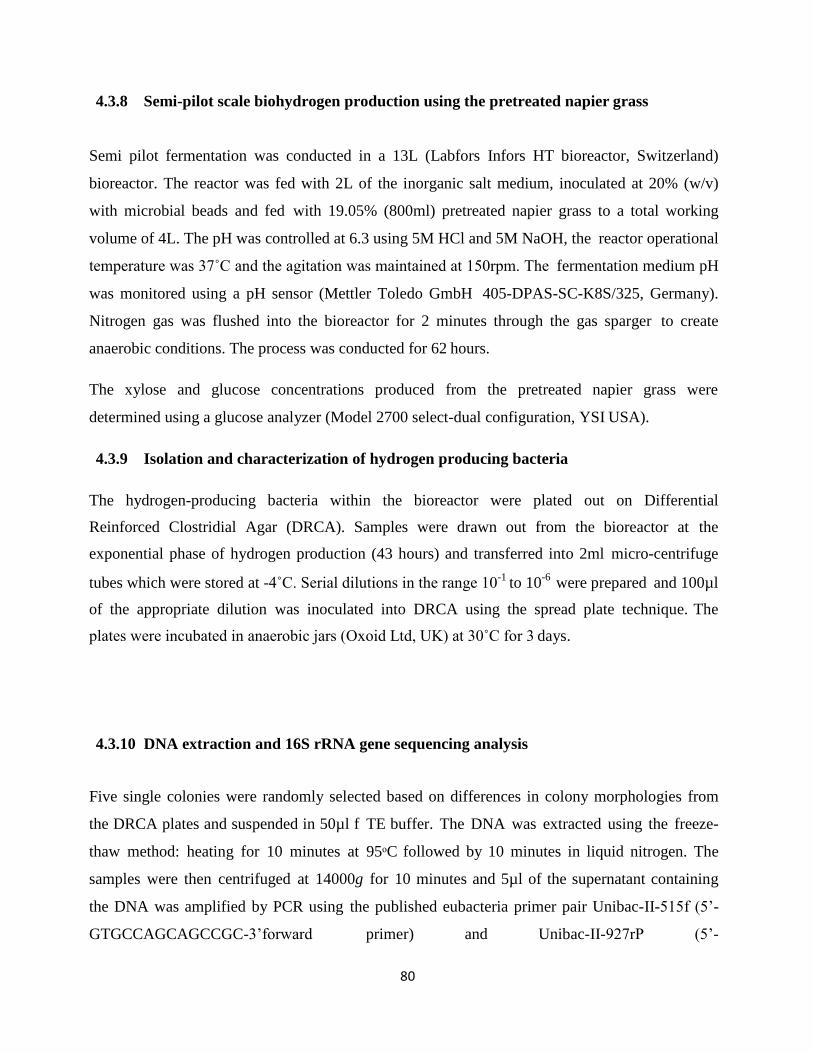
80
4.3.8 Semi-pilot scale biohydrogen production using the pretreated napier grass
Semi pilot fermentation was conducted in a 13L (Labfors Infors HT bioreactor, Switzerland)
bioreactor. The reactor was fed with 2L of the inorganic salt medium, inoculated at 20% (w/v)
with microbial beads and fed with 19.05% (800ml) pretreated napier grass to a total working
volume of 4L. The pH was controlled at 6.3 using 5M HCl and 5M NaOH, the reactor operational
temperature was 37˚C and the agitation was maintained at 150rpm. The fermentation medium pH
was monitored using a pH sensor (Mettler Toledo GmbH 405-DPAS-SC-K8S/325, Germany).
Nitrogen gas was flushed into the bioreactor for 2 minutes through the gas sparger to create
anaerobic conditions. The process was conducted for 62 hours.
The xylose and glucose concentrations produced from the pretreated napier grass were
determined using a glucose analyzer (Model 2700 select-dual configuration, YSI USA).
4.3.9 Isolation and characterization of hydrogen producing bacteria
The hydrogen-producing bacteria within the bioreactor were plated out on Differential
Reinforced Clostridial Agar (DRCA). Samples were drawn out from the bioreactor at the
exponential phase of hydrogen production (43 hours) and transferred into 2ml micro-centrifuge
tubes which were stored at -4˚C. Serial dilutions in the range 10-1
to 10-6
were prepared and 100µl
of the appropriate dilution was inoculated into DRCA using the spread plate technique. The
plates were incubated in anaerobic jars (Oxoid Ltd, UK) at 30˚C for 3 days.
4.3.10 DNA extraction and 16S rRNA gene sequencing analysis
Five single colonies were randomly selected based on differences in colony morphologies from
the DRCA plates and suspended in 50µl f TE buffer. The DNA was extracted using the freeze-
thaw method: heating for 10 minutes at 95ᵒC followed by 10 minutes in liquid nitrogen. The
samples were then centrifuged at 14000g for 10 minutes and 5µl of the supernatant containing
the DNA was amplified by PCR using the published eubacteria primer pair Unibac-II-515f (5’-
GTGCCAGCAGCCGC-3’forward primer) and Unibac-II-927rP (5’-
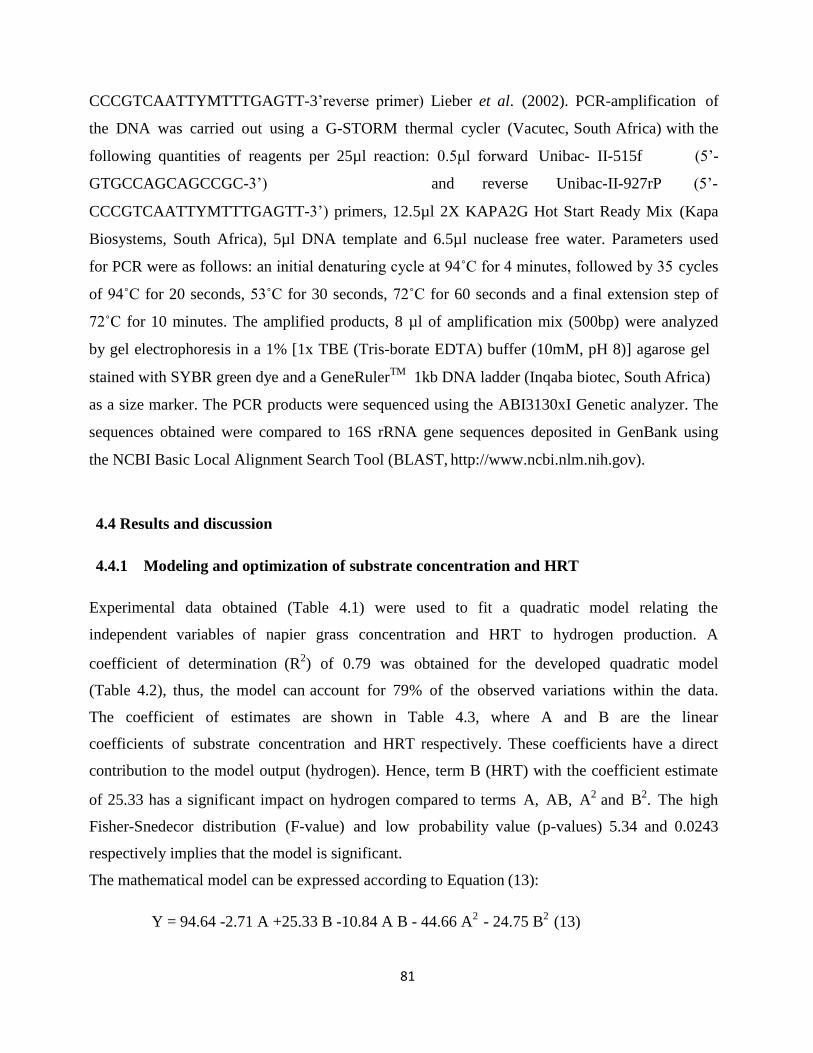
81
CCCGTCAATTYMTTTGAGTT-3’reverse primer) Lieber et al. (2002). PCR-amplification of
the DNA was carried out using a G-STORM thermal cycler (Vacutec, South Africa) with the
following quantities of reagents per 25µl reaction: 0.5μl forward Unibac- II-515f (5’-
GTGCCAGCAGCCGC-3’) and reverse Unibac-II-927rP (5’-
CCCGTCAATTYMTTTGAGTT-3’) primers, 12.5µl 2X KAPA2G Hot Start Ready Mix (Kapa
Biosystems, South Africa), 5µl DNA template and 6.5µl nuclease free water. Parameters used
for PCR were as follows: an initial denaturing cycle at 94˚C for 4 minutes, followed by 35 cycles
of 94˚C for 20 seconds, 53˚C for 30 seconds, 72˚C for 60 seconds and a final extension step of
72˚C for 10 minutes. The amplified products, 8 µl of amplification mix (500bp) were analyzed
by gel electrophoresis in a 1% [1x TBE (Tris-borate EDTA) buffer (10mM, pH 8)] agarose gel
stained with SYBR green dye and a GeneRulerTM
1kb DNA ladder (Inqaba biotec, South Africa)
as a size marker. The PCR products were sequenced using the ABI3130xI Genetic analyzer. The
sequences obtained were compared to 16S rRNA gene sequences deposited in GenBank using
the NCBI Basic Local Alignment Search Tool (BLAST, http://www.ncbi.nlm.nih.gov).
4.4 Results and discussion
4.4.1 Modeling and optimization of substrate concentration and HRT
Experimental data obtained (Table 4.1) were used to fit a quadratic model relating the
independent variables of napier grass concentration and HRT to hydrogen production. A
coefficient of determination (R2) of 0.79 was obtained for the developed quadratic model
(Table 4.2), thus, the model can account for 79% of the observed variations within the data.
The coefficient of estimates are shown in Table 4.3, where A and B are the linear
coefficients of substrate concentration and HRT respectively. These coefficients have a direct
contribution to the model output (hydrogen). Hence, term B (HRT) with the coefficient estimate
of 25.33 has a significant impact on hydrogen compared to terms A, AB, A2
and B2. The high
Fisher-Snedecor distribution (F-value) and low probability value (p-values) 5.34 and 0.0243
respectively implies that the model is significant.
The mathematical model can be expressed according to Equation (13):
Y = 94.64 -2.71 A +25.33 B -10.84 A B - 44.66 A2
- 24.75 B2
(13)
82
Where Y is the H2 production volume in ml. A and B are linear coefficients of substrate
concentration and HRT respectively, AB are interactive coefficients and A2
and B2
are square
coefficients.
Table 4.1. Biohydrogen production from pretreated napier grass under varied substrate
concentration and HRT
Run Substrate
(%)
HRT
(hours)
hydrogen
(ml)
1 30 168 2.57
2 20 192.85 108.99
3 20 23.15 0
4 20 108 102.43
5 20 108 134.19
6 30 48 0
7 20 108 76.32
8 34.14 108 27.65
9 20 108 89.47
10 20 108 70.77
11 10 168 53.41
12 5.86 108 1.71
13 10 48 7.49
Table 4.2: Analysis of variance for biohydrogen production
Source Sum of
Squares
df Mean
Square
F-
value
p-
value
R2
Model 22068.92 5 4413.78 5.34 0.0243 0.79
df: degrees of freedom, F-value: Fisher-Snedecor distribution value, p-value: probability value,
R2: coefficient of determination
83
Table 4.3: Coefficient of estimate of the model and the confidence intervals for biohydrogen
production
Factor Coefficient
estimate
df Standard
Error
95%
CI
Low
95%
CI
High
Intercept 94.64 1 12.85 64.24 125.03
A -2.71 1 10.16 -26.73 21.32
B 25.33 1 10.16 1.3 49.35
AB -10.84 1 14.37 -44.82 23.14
A2 -44.66 1 10.9 -70.42 -18.89
B2 -24.75 1 10.9 -50.52 1.01
df: degrees of freedom, 95% CI Low: 95% confidence intervals (low limit), 95% CI High: 95%
confidence interval (high limit)
4.4.2 Interaction of substrate concentration and HRT on biohydrogen production
Table 4.1 illustrates the hydrogen production from the varied substrate concentration and HRT.
The hydrogen production obtained from the varied substrate concentrations and HRT ranged
from 0 to 134.19 ml (Table 4.1). This wide range indicates the sensitivity of biohydrogen
fermentation to substrate concentration and HRT. Figures 4.1 and 4.2 show the three dimensional
response surface and contour map plot respectively of substrate concentration and HRT
interaction on biohydrogen production. In figure 4.1, the interactive effect of these parameters on
hydrogen production showed a concave shape which indicates that their optimum set points were
within the boundaries of the search range. A peak hydrogen volume of 100 ml was observed
within the ranges 15-20% and 138-168hours of substrate concentration and HRT respectively.
Fan et al. (2006), noticed significant increase in hydrogen yields with increasing substrate
concentration from 5 to 20g/l. With an HRT of 108 hours, an increase in substrate concentration
from 25 to 30% caused a decrease in hydrogen production from 80 to 20 ml (as shown in figures
4.1 and 4.2). The decrease in hydrogen production was presumably due to the accumulation of
volatile fatty acids (VFAs). These have been reported to occur at very high substrate
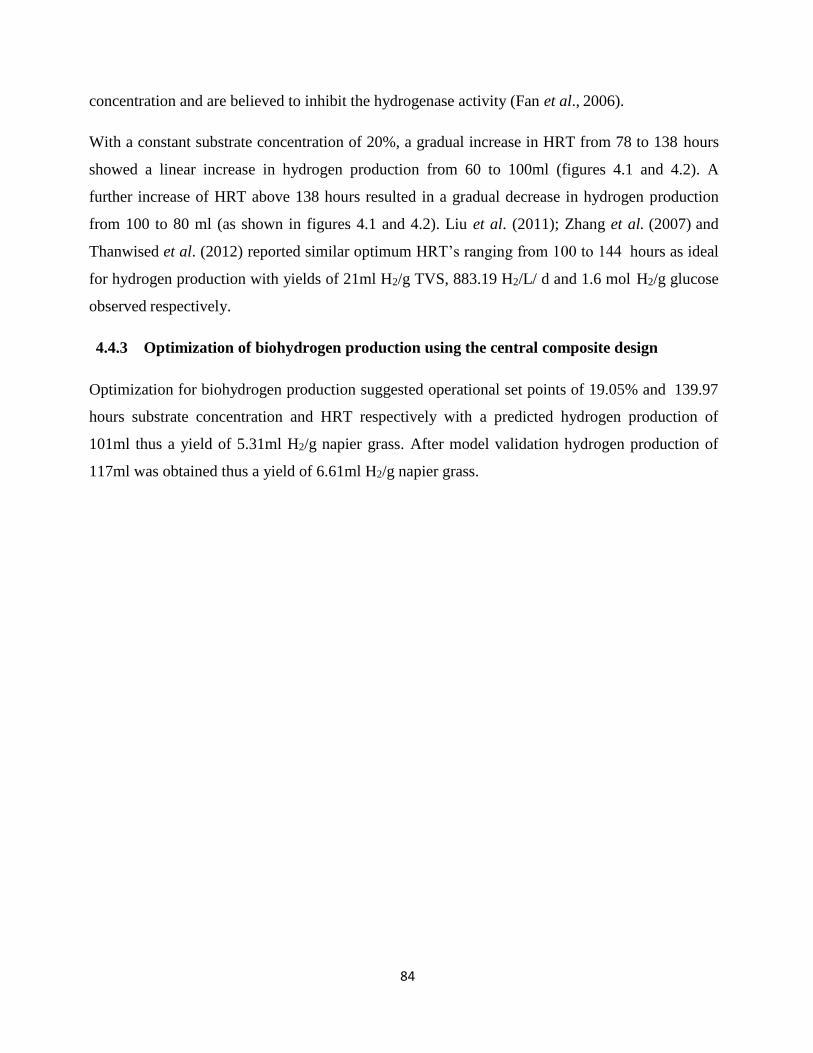
84
concentration and are believed to inhibit the hydrogenase activity (Fan et al., 2006).
With a constant substrate concentration of 20%, a gradual increase in HRT from 78 to 138 hours
showed a linear increase in hydrogen production from 60 to 100ml (figures 4.1 and 4.2). A
further increase of HRT above 138 hours resulted in a gradual decrease in hydrogen production
from 100 to 80 ml (as shown in figures 4.1 and 4.2). Liu et al. (2011); Zhang et al. (2007) and
Thanwised et al. (2012) reported similar optimum HRT’s ranging from 100 to 144 hours as ideal
for hydrogen production with yields of 21ml H2/g TVS, 883.19 H2/L/ d and 1.6 mol H2/g glucose
observed respectively.
4.4.3 Optimization of biohydrogen production using the central composite design
Optimization for biohydrogen production suggested operational set points of 19.05% and 139.97
hours substrate concentration and HRT respectively with a predicted hydrogen production of
101ml thus a yield of 5.31ml H2/g napier grass. After model validation hydrogen production of
117ml was obtained thus a yield of 6.61ml H2/g napier grass.
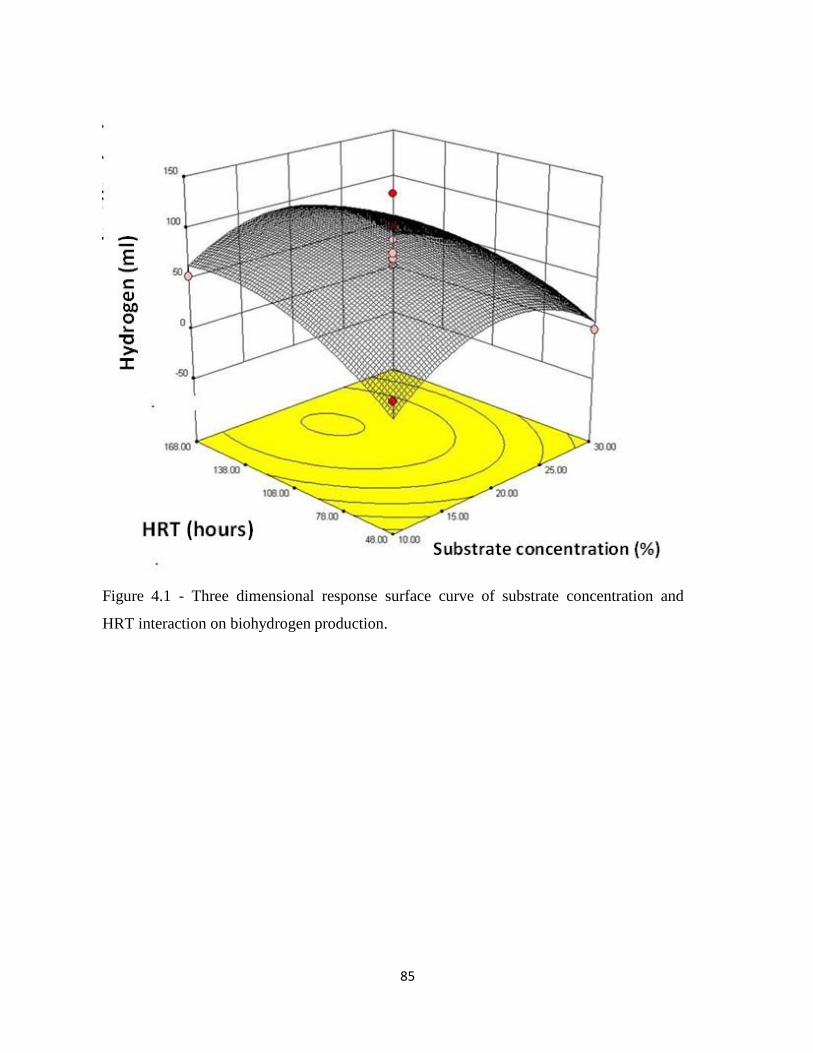
85
Figure 4.1 - Three dimensional response surface curve of substrate concentration and
HRT interaction on biohydrogen production.
86
Figure 4.2 - Contour map plot of substrate concentration and HRT interaction on
biohydrogen production
4.4.4 Semi-pilot scale biohydrogen production
4.4.4.1 Hydrogen production phases
Figure 4 .3 a and b shows the biogas evolution and sugar consumption over the fermentation
duration at semi-pilot scale biohydrogen production. Hydrogen production started after 24
hours of fermentation (figure 4.3 a). This long lag phase could be attributed to the slow uptake
87
of sugar and nutrients by the immobilized hydrogen producing bacteria since immobilization of
microorganisms into synthetic polymers has been observed to alter spatial organizations at
molecular level thus slowing down microbial metabolism (Kraemer and Bagley, 2007). As shown
in figure 4.3, xylose and glucose concentrations remained constant during the first 24 hours of
fermentation. Papadikis et al. (2010) augmented the retention time from 4 to 24 hours to increase
immobilized cell permeability thus enhancing the uptake of nutrients and substrates into
microbial cells. A similar lag phase duration of 21 hours has been reported by Lee and Chang
(2010) using cellulosic food waste in a two-stage pilot scale process for biohydrogen production.
Figure 4.4 shows cumulative biogas evolution during the fermentation process. Exponential phase
of hydrogen production was observed from 24 hours to 60 hours with a maximum hydrogen
fraction of 28.52% and cumulative volume of 596.09ml thus a maximum hydrogen yield of
14.03ml H2/g napier grass at 44 hours (figures 4.3 a and 4.4). This lengthy exponential phase
(36 hours) is characteristic of immobilized inoculum. Vasavi et al. (2014) reported a 5 fold
increase in hydrogen production from immobilized Rhodopseudomonas rutila compared to
suspended cells using glucose as a carbon source. The authors observed retention of exponential
phase for 24 hours using immobilized cells compared to 6 hours using suspended cells. The
retention of exponential biohydrogen production phase may be due to high biomass retention,
even distribution of biomass throughout the reactor volume and high substrate conversion rates
in the immobilization matrices (Kumar and Das, 2001; Hu et al., 2007).
An increase in hydrogen fraction corresponded to a decrease in xylose and glucose concentrations
(from 24 to 60 hours) (figure 3.4 a and b). Xylose and glucose concentrations decreased from 7.13
to 0.005g/l and 3.02 to 0.011g/l respectively, which indicates that xylose and glucose utilization
by the immobilized consortia were channeled for hydrogen production. Carbohydrates are
essential substrates and can also be a limiting factor for hydrogen producing microorganisms
affecting both cell growth and hydrogen production (Fabiano and Perego, 2012). Hydrogen is
produced in the acidogenic phase through the hydrolysis of carbohydrates via either acetate or
butyrate fermentation reaction (Khanal et al., 2004; Hung et al., 2007).
The lengthy exponential phase could also be attributed to pH control of the fermentation medium
at 6.3 (Hung et al., 2007). The control of pH at optimum set point balances the uptake of protons
by hydrogenases thus preventing metabolic shifts and suppresses hydrogen consumption by the
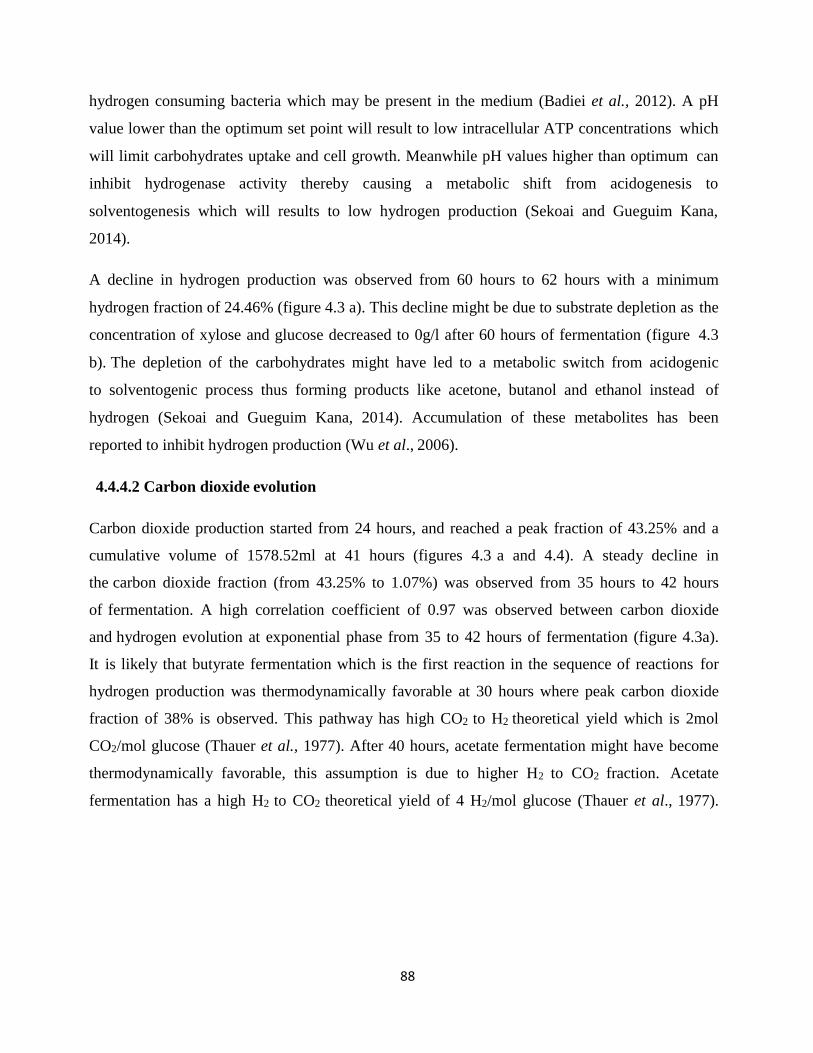
88
hydrogen consuming bacteria which may be present in the medium (Badiei et al., 2012). A pH
value lower than the optimum set point will result to low intracellular ATP concentrations which
will limit carbohydrates uptake and cell growth. Meanwhile pH values higher than optimum can
inhibit hydrogenase activity thereby causing a metabolic shift from acidogenesis to
solventogenesis which will results to low hydrogen production (Sekoai and Gueguim Kana,
2014).
A decline in hydrogen production was observed from 60 hours to 62 hours with a minimum
hydrogen fraction of 24.46% (figure 4.3 a). This decline might be due to substrate depletion as the
concentration of xylose and glucose decreased to 0g/l after 60 hours of fermentation (figure 4.3
b). The depletion of the carbohydrates might have led to a metabolic switch from acidogenic
to solventogenic process thus forming products like acetone, butanol and ethanol instead of
hydrogen (Sekoai and Gueguim Kana, 2014). Accumulation of these metabolites has been
reported to inhibit hydrogen production (Wu et al., 2006).
4.4.4.2 Carbon dioxide evolution
Carbon dioxide production started from 24 hours, and reached a peak fraction of 43.25% and a
cumulative volume of 1578.52ml at 41 hours (figures 4.3 a and 4.4). A steady decline in
the carbon dioxide fraction (from 43.25% to 1.07%) was observed from 35 hours to 42 hours
of fermentation. A high correlation coefficient of 0.97 was observed between carbon dioxide
and hydrogen evolution at exponential phase from 35 to 42 hours of fermentation (figure 4.3a).
It is likely that butyrate fermentation which is the first reaction in the sequence of reactions for
hydrogen production was thermodynamically favorable at 30 hours where peak carbon dioxide
fraction of 38% is observed. This pathway has high CO2 to H2 theoretical yield which is 2mol
CO2/mol glucose (Thauer et al., 1977). After 40 hours, acetate fermentation might have become
thermodynamically favorable, this assumption is due to higher H2 to CO2 fraction. Acetate
fermentation has a high H2 to CO2 theoretical yield of 4 H2/mol glucose (Thauer et al., 1977).
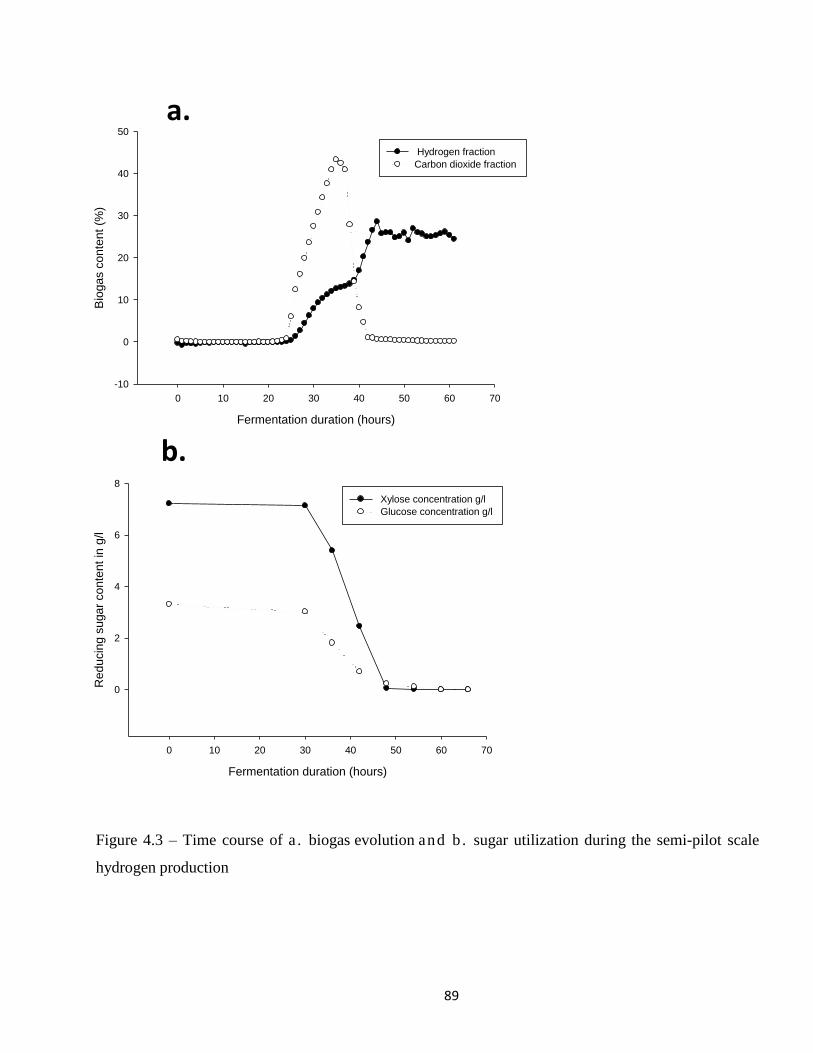
89
Fermentation duration (hours)
0 10 20 30 40 50 60 70
Bio
gas c
onte
nt
(%)
-10
0
10
20
30
40
50
Hydrogen fraction
Carbon dioxide fraction
Fermentation duration (hours)
0 10 20 30 40 50 60 70
Reducin
g s
ugar
conte
nt
in g
/l
0
2
4
6
8
Xylose concentration g/l
Glucose concentration g/l
Figure 4.3 – Time course of a . biogas evolution and b . sugar utilization during the semi-pilot scale
hydrogen production
a.
b.
90
1800
1600
1400
1200
1000
800
600
400
200
0
-200
0 10 20 30 40 50 60 70
Fermentation duration (hours)
Figure 4.4 – Cumulative biogas evolution during fermentation process
Cu
mu
lativ
e b
iog
as
volu
me (
ml)
91
4.4.5 Isolation and characterization of hydrogen producing bacteria
PCR profile of hydrogen producing bacteria is presented in figure 4.5. In lanes 1 to 15, the
PCR amplicons of bacteria grown on DRCA can be observed as major bands. Studies on
microbial characterization of hydrogen producers in digested sludge use DRCA for the
cultivation and enrichment of spore-forming Clostridium species (Eigruber and Reuter, 1995;
Byrne et al., 2008; Liu and Tay, 2002).
The sequences obtained for the isolates showed high similarity of 99, 98, 98, 98 and 98% to
Enterobacter aerogenes, Streptococcus thermophilus, Streptococcus thermophilus, Enterobacter
aerogenes and Streptococcus thermophilus respectively (shown in Table 4.4). Ma et al. (2012)
also reported the presence of Enterobacter aerogenes in the study of hydrogen producing sludge.
Facultative anaerobe E. aerogenes metabolizes carbohydrates through the Embden-Meyerhoff
pathway for hydrogen production (Tanisho and Ishiwata, 1995). Enterobacter species are known
to produce carbon dioxide and hydrogen in the ratio 2:1 at 37˚C (Rachman et al., 1998). Kim et
al. (2006) observed non-spore-forming Enterobacter species after heat shock pretreatment of
hydrogen producing sludge. Survival of these bacterial species might be due to the solid matter
in the sludge which has been observed to harbor vegetative cells and non-endospore-formers thus
enabling most bacterial species to survive high temperatures (Lu et al., 2009).
The absence of Clostridia growth could be attributed to possible presence of oxygen during
cultivation. It has been observed that smallest quantities of oxygen inhibit the growth of this
bacterium specie through lowering the adenylate charge thus causing cell death. Studies suggest
the use of anaerobic chambers for the inoculation and cultivation of these species (Hung et al.,
2011). This could also be due to the short incubation time of 3 days which might have led to
growth of the facultative anaerobic and fast growing bacterial strains outcompeting fastidious
strict anaerobic Clostridia (Badiei et al., 2012). Badiei et al. (2012), analyzed the microbial
community of hydrogen producing sludge after heat shock pretreatment at 85°C for 60 minutes
using DGGE. Their findings revealed 50% isolates were members of the Streptococci species,
30% were Lactobacillus species and only 20% were Clostridium species. The authors presumed
that Clostridium species were either present as spores or the active cells were too small to be
detected on DGGE.
Although Streptococci species have been identified in hydrogen producing sludge, their role in

92
hydrogen production is still unclear (Liu and Tay, 2002; Hung et al., 2011). It is believed that
these microbial species help in aggregation of hydrogen producing microorganisms.
Streptococcus species produce extracellular polysaccharides which promote granulation by
agglomeration of bacterial cells thus enabling the population to withstand heat shock and long
HRT’s, therefore can survive in the reactor (Hung et al., 2011). Chu et al. (2011) reported that
the presence of Streptococci species also helps maintain high hydrogen yielding microorganisms
in the net like biological granules. Streptococci species are facultative anaerobic microorganisms
that can tolerate high NaCl concentration (Lavilla Lerma et al., 2014). These microbial species
are found in gastrointestinal tract of humans, soil and in waste and can tolerate temperatures up
to 65˚C (Lavilla Lerma et al., 2014).
Figure 4.5 - PCR profile of hydrogen producing bacteria: Lanes 1 to 15 represents the PCR
aplicons of bacteria grown in DRCA and C represents the non-template control. A 1kb DNA
Ladder (M) GeneRulerTM
was used in a 1% (w/v) agarose gel to determine the sizes of the
isolated DNA fragments (500bp).
1 2 3 4 5 6 7 8 9 10 11 12 13 14 15 C M
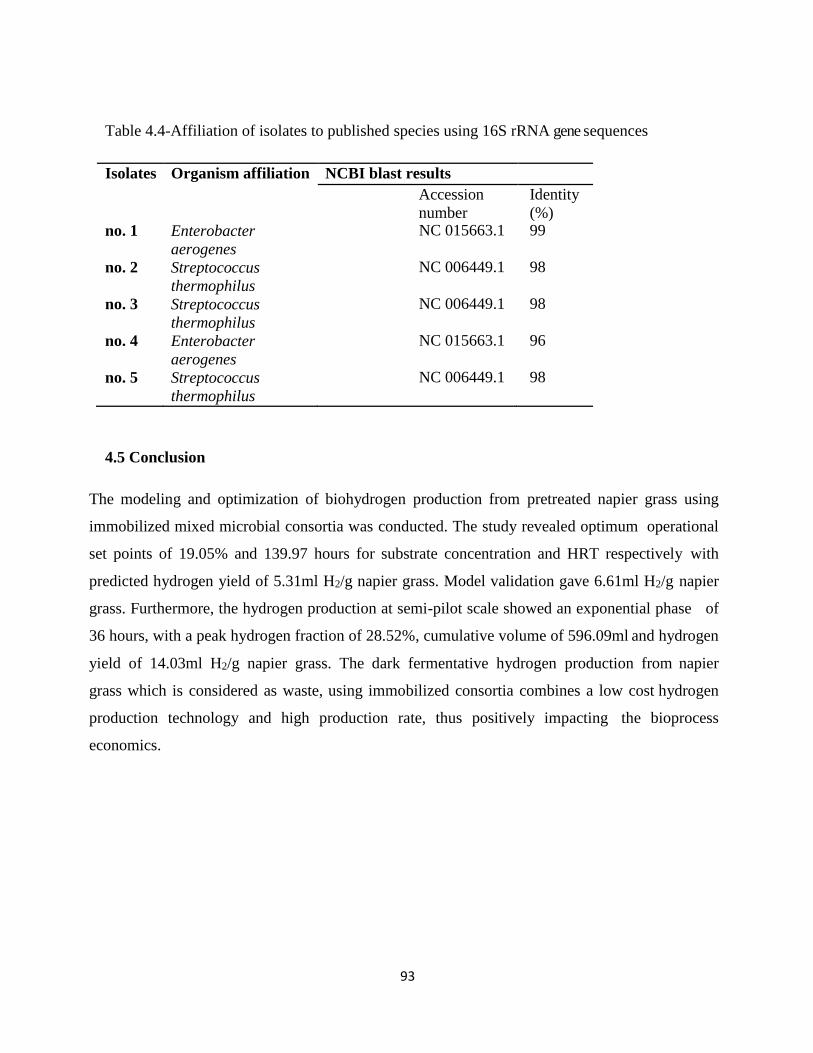
93
Table 4.4-Affiliation of isolates to published species using 16S rRNA gene sequences
Isolates Organism affiliation NCBI blast results
Accession
number
Identity
(%) no. 1 Enterobacter
aerogenes
NC 015663.1 99
no. 2 Streptococcus
thermophilus
NC 006449.1 98
no. 3 Streptococcus
thermophilus
NC 006449.1 98
no. 4 Enterobacter
aerogenes
NC 015663.1 96
no. 5 Streptococcus
thermophilus
NC 006449.1 98
4.5 Conclusion
The modeling and optimization of biohydrogen production from pretreated napier grass using
immobilized mixed microbial consortia was conducted. The study revealed optimum operational
set points of 19.05% and 139.97 hours for substrate concentration and HRT respectively with
predicted hydrogen yield of 5.31ml H2/g napier grass. Model validation gave 6.61ml H2/g napier
grass. Furthermore, the hydrogen production at semi-pilot scale showed an exponential phase of
36 hours, with a peak hydrogen fraction of 28.52%, cumulative volume of 596.09ml and hydrogen
yield of 14.03ml H2/g napier grass. The dark fermentative hydrogen production from napier
grass which is considered as waste, using immobilized consortia combines a low cost hydrogen
production technology and high production rate, thus positively impacting the bioprocess
economics.
94
4.6 References
Azwar MY, Hussain MA, Abdul-Wahab AK. (2014). Development of biohydrogen production
by photobiological, fermentation and electrochemical processes: A review. Renewable and
Sustainable Energy Reviews; (31): 158-173
Badiei M, Jamaliah MJ, Nurina A, Siti RSA, Lim SS, Mohd AK. (2012). Microbial community
analysis of mixed anaerobic microflora in suspended sludge of ASBR producing hydrogen from
palm oil mill effluent. International Journal of Hydrogen Energy; (37) :3169-3176
Byrne B, Scannell A, Lyng J, Bolton D. (2008). An evaluation of Clostridium perfringens media.
Food Control; 19: 1091-1095.
Chong M-L, Vikineswary S, Yoshihito S, Moh AH. (2009). Biohydrogen production from
biomass and industrial wastes by dark fermentation. International journal of hydrogen energy;
34: 3277-3287
Chu CY, Wu SY, Wu YC, Sen B, Hung CH, Cheng CH. (2011). Phase holdups and microbial
community in high-rate fermentative hydrogen bioreactors. International Journal of Hydrogen
Energy; 36: 364-73
Das D, Veziroglu TN. (2001) Hydrogen production by biological processes: a survey of
literature. International Journal of Hydrogen Energy; 26: 13-28.
Eisgruber H, Reuter G. (1995). A selective medium for the detection and enumeration of
mesophilic sulphite-reducing clostridia in food monitoring programs. Food Research
International; 28, 219-226.
Fabiano B, Perego P. (2012). Thermodynamic study and optimization of hydrogen production by
Enterobacter aerogenes. International Journal of Hydrogen Energy; 27: 149-156
Fan YT, Zhang YH, Zhang SF, Hou RBZ. (2006). Efficient conversion of wheat straws wastes
into biohydrogen gas by cow dung compost. Bioresource Technology; 97: 500-5.
Fang HHP, Liu H, Zhang T. (2002). Characterization of a hydrogen-producing granular sludge.
Biotechnology and Bioengineering; 78: 44-52.
Gueguim Kana EB, Schmidts S, Azanfack Kenfack RH. (2013). A webenabled software for real-
95
time biogas fermentation monitoring-assessment of dark fermentations for correlations between
medium conductivity and biohydrogen evolution. International Journal of Hydrogen Energy;
38(25): 10235-44.
Han SK, Shin H-S. (2004). Biohydrogen production by anaerobic fermentation of food waste.
International Journal of Hydrogen Energy; 29: 569-577
Hoogwijk M, Faaij A, van den Broek R, Berndes G, Gielen D, Turkenburg W. (2003).
Exploration of the ranges of the global potential of biomass for energy. Biomass Bioenergy;
25(2): 119-23.
Hu B, Liu Y, Chi Z, Chen S. (2007). Biological Hydrogen Production via Bacteria Immobilized
in Calcium Alginate Gel Beads. Biological Engineering. In Press, Corrected Proof
Hung CH, Cheng CH, Guan DW, Whang ST, Hsu SC, Liang CM. (2011). Interaction between
Clostridium sp. and other facultative anaerobes in a self-formed granular sludge hydrogen
producing bioreactor. International Journal of Hydrogen Energy; 36: 8704-11
Hung CH, Lee KS, Cheng LH, Huang YH, Lin PJ, Chang JS. (2007). Quantitative analysis of a
high-rate hydrogen-producing microbial community in anaerobic agitated granular sludge bed
bioreactors using glucose as substrate. Applied Microbiology and Biotechnology; 75: 693-701.
Khanal SK, Chen W-H, Ling L, Shihwu S. (2004). Biological hydrogen production: effects of
pH and intermediate products. International Journal of Hydrogen Energy; 29: 1123-131
Kim SH, Han SK, Shin HS. (2006). Effect of substrate concentration on hydrogen production
and 16S rDNA-based analysis of the microbial community in a continuous fermenter. Process
Biochemistry; 41(1):199–207
Kraemer JT, Bagley DM. (2007). Improving the yield from fermentative hydrogen production.
Biotechnology Let; 29: 685-95.
Kumar, N. and Das, D. (2001) Electron microscopy of hydrogen producing immobilized E-
cloacae IIT-BT 08 on natural polymers. International Journal of Hydrogen Energy 26: 1155-
1163.
Lavilla Lerma L, Benomar N, Valenzuela AS, Munoz MCC, Galvez A, Abrioule H. (2014). Role
96
of EfrAB efflux pump in biocide tolerance and antibiotic resistance of Enterococcus faecalis and
Enterococcus faecium isolated from traditional fermented foods and the effect of EDTA as
EfrAB inhibitor. Food Microbiology; 44: 249-257
Lee YW, Chung J. (2010). Bioproduction of hydrogen from food waste by pilot-scale combined
hydrogen/methane fermentation. International Journal of Hydrogen Energy; 35(21): 11746-55
Lieber A, Kiesel B & Babel W. (2002). Microbial diversity analysis of soil by SSCP
fingerprinting technique using TGGE Maxi System. Borkheider Seminar zur O¨kophysiologie
des Wurzelraumes (Merbach W, H¨utsch BW & Augustin J, eds), pp. 61–65. Teubner, Leipzig
Liong YY, Rasmina H, Oi ML, Rozi M. (2012). Conversion of lignocellulosic biomass from
grass to bioethanol using material pretreated with alkali and white rot fungus, Phanerochaete
Chrysosporium, Journal of Bioresource; 7(4): 5500-5513
Liu Q, Zhang X, Zhou Y, Chen S, Qian G, Xu ZP. (2011). Optimization of fermentative
biohydrogen production by response surface methodology using fresh leachate as nutrient
supplement. Bioresource Technology; 102: 8661-8.
Liu YQ, Tay JH. (2002). The essential role of hydrodynamic shear force in the formation of
biofilm and granular sludge. Water Research vol. 36, pp. 1653–1665.
Lu Y, Zhao HX, Zhang C, Lai QH, Xing XH. (2009). Perturbation of formate pathway for
hydrogen production by expressions of formate hydrogen lyase and its transcriptional activator in
wild Enterobacter aerogenes and its mutants. International Journal of Hydrogen Energy; 34:
5072-9
Ma K, Zhao H, Zhang C, Lu Y, Xing X-H. (2012). Impairment of NADH dehydrogenase for
increased hydrogen. International Journal of Hydrogen Energy 37: 15875-15885
Mafuleka S, Gueguim Kana EB. (2015). Modelling and optimization of xylose and glucose
production from napier grass using hybrid pretreatment techniques. Biomass & Bioenergy 77, 200
– 208.
Myers RH, Montgomery DC. (1995). Response surface methodology: process and product
optimization using designed experiments. 1st ed. Wiley- Interscience, USA.
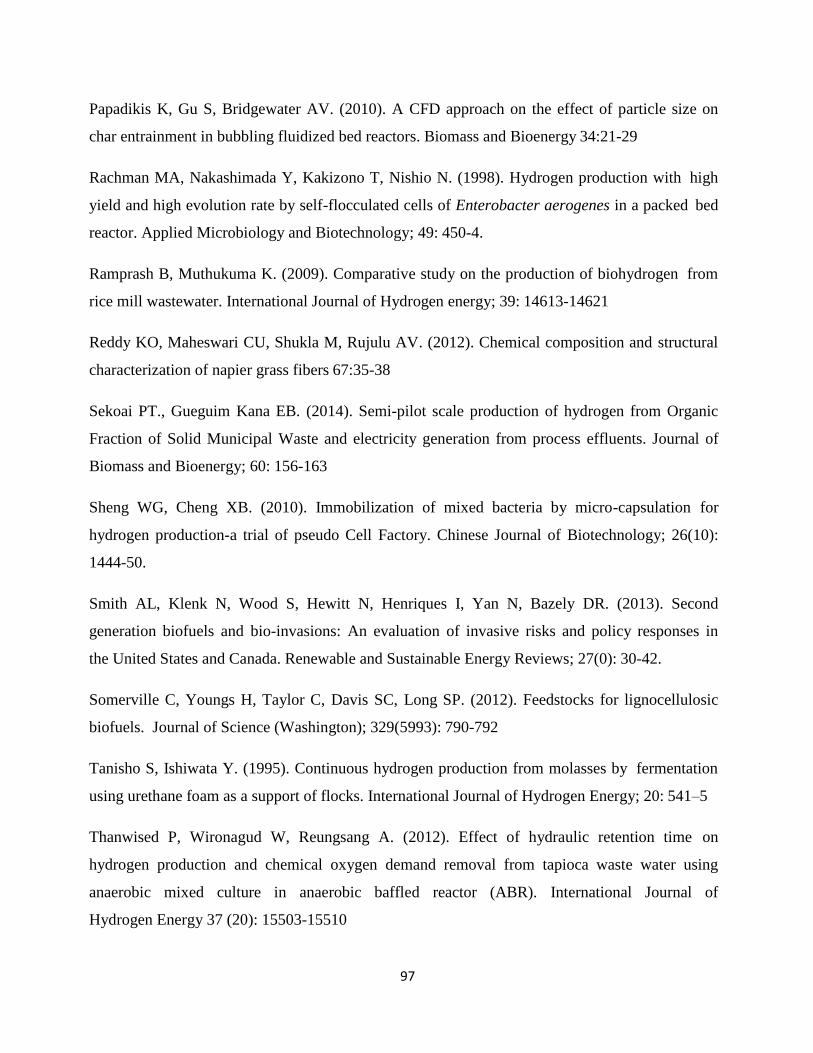
97
Papadikis K, Gu S, Bridgewater AV. (2010). A CFD approach on the effect of particle size on
char entrainment in bubbling fluidized bed reactors. Biomass and Bioenergy 34:21-29
Rachman MA, Nakashimada Y, Kakizono T, Nishio N. (1998). Hydrogen production with high
yield and high evolution rate by self-flocculated cells of Enterobacter aerogenes in a packed bed
reactor. Applied Microbiology and Biotechnology; 49: 450-4.
Ramprash B, Muthukuma K. (2009). Comparative study on the production of biohydrogen from
rice mill wastewater. International Journal of Hydrogen energy; 39: 14613-14621
Reddy KO, Maheswari CU, Shukla M, Rujulu AV. (2012). Chemical composition and structural
characterization of napier grass fibers 67:35-38
Sekoai PT., Gueguim Kana EB. (2014). Semi-pilot scale production of hydrogen from Organic
Fraction of Solid Municipal Waste and electricity generation from process effluents. Journal of
Biomass and Bioenergy; 60: 156-163
Sheng WG, Cheng XB. (2010). Immobilization of mixed bacteria by micro-capsulation for
hydrogen production-a trial of pseudo Cell Factory. Chinese Journal of Biotechnology; 26(10):
1444-50.
Smith AL, Klenk N, Wood S, Hewitt N, Henriques I, Yan N, Bazely DR. (2013). Second
generation biofuels and bio-invasions: An evaluation of invasive risks and policy responses in
the United States and Canada. Renewable and Sustainable Energy Reviews; 27(0): 30-42.
Somerville C, Youngs H, Taylor C, Davis SC, Long SP. (2012). Feedstocks for lignocellulosic
biofuels. Journal of Science (Washington); 329(5993): 790-792
Tanisho S, Ishiwata Y. (1995). Continuous hydrogen production from molasses by fermentation
using urethane foam as a support of flocks. International Journal of Hydrogen Energy; 20: 541–5
Thanwised P, Wironagud W, Reungsang A. (2012). Effect of hydraulic retention time on
hydrogen production and chemical oxygen demand removal from tapioca waste water using
anaerobic mixed culture in anaerobic baffled reactor (ABR). International Journal of
Hydrogen Energy 37 (20): 15503-15510

98
Thauer RK, Jungermann K, Decker K. (1977). Energy conservation in chemotrophic anaerobic
bacteria. Bacteriology Review; 41(1): 100-180.
Vasavia D, Ramchander M, Girisham S and Reddy SM. (2014). Hydrogen Production by Free
and Immobilized Cells of Rhodopseudomonas rutila isolated from paper mill effluents.
International Journal of Research in Environmental Science and Technology; 4(2): 71-75
Wongwatanapaiboon J Vorakan B, Ratanavalee I, Pakorn W, Tikamporn Y, Warawut C. (2012).
The Potential of Cellulosic Ethanol Production from Grasses in Thailand. Journal of Biomedicine
and Biotechnology Volume 2012
Wu SY, Hung CH, Lin CN, Chen HW, Lee AS, Chang JS. (2006). Fermentative hydrogen
production and bacterial community structure in high‐rate anaerobic bioreactors containing
silicone‐immobilized and self‐flocculated sludge. Biotechnology and Bioengineering 93, 934-
946
Zhang ML, Fan YT, Xing Y, Pan CM, Zhang GS, Lay JJ. (2007). Enhanced biohydrogen
production from cornstalk wastes with acidification pretreatment by mixed anaerobic cultures.
Biomass and Bioenergy 31; 250-254.
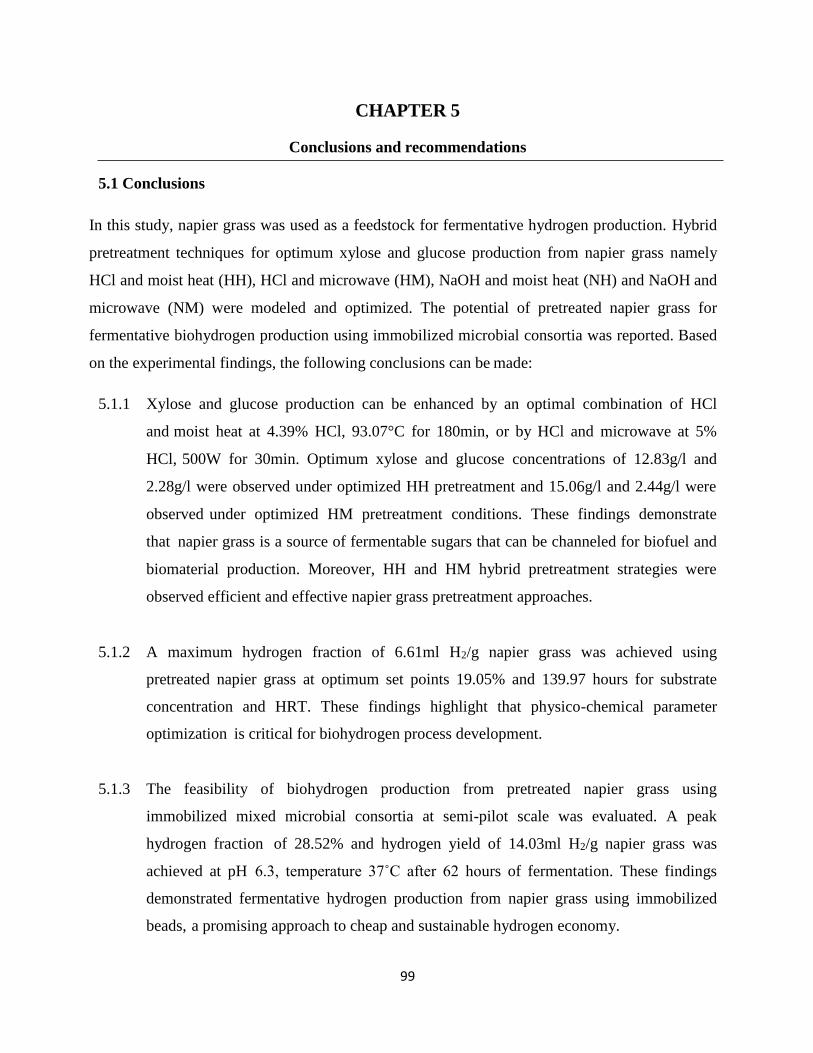
99
CHAPTER 5
Conclusions and recommendations
5.1 Conclusions
In this study, napier grass was used as a feedstock for fermentative hydrogen production. Hybrid
pretreatment techniques for optimum xylose and glucose production from napier grass namely
HCl and moist heat (HH), HCl and microwave (HM), NaOH and moist heat (NH) and NaOH and
microwave (NM) were modeled and optimized. The potential of pretreated napier grass for
fermentative biohydrogen production using immobilized microbial consortia was reported. Based
on the experimental findings, the following conclusions can be made:
5.1.1 Xylose and glucose production can be enhanced by an optimal combination of HCl
and moist heat at 4.39% HCl, 93.07°C for 180min, or by HCl and microwave at 5%
HCl, 500W for 30min. Optimum xylose and glucose concentrations of 12.83g/l and
2.28g/l were observed under optimized HH pretreatment and 15.06g/l and 2.44g/l were
observed under optimized HM pretreatment conditions. These findings demonstrate
that napier grass is a source of fermentable sugars that can be channeled for biofuel and
biomaterial production. Moreover, HH and HM hybrid pretreatment strategies were
observed efficient and effective napier grass pretreatment approaches.
5.1.2 A maximum hydrogen fraction of 6.61ml H2/g napier grass was achieved using
pretreated napier grass at optimum set points 19.05% and 139.97 hours for substrate
concentration and HRT. These findings highlight that physico-chemical parameter
optimization is critical for biohydrogen process development.
5.1.3 The feasibility of biohydrogen production from pretreated napier grass using
immobilized mixed microbial consortia at semi-pilot scale was evaluated. A peak
hydrogen fraction of 28.52% and hydrogen yield of 14.03ml H2/g napier grass was
achieved at pH 6.3, temperature 37˚C after 62 hours of fermentation. These findings
demonstrated fermentative hydrogen production from napier grass using immobilized
beads, a promising approach to cheap and sustainable hydrogen economy.
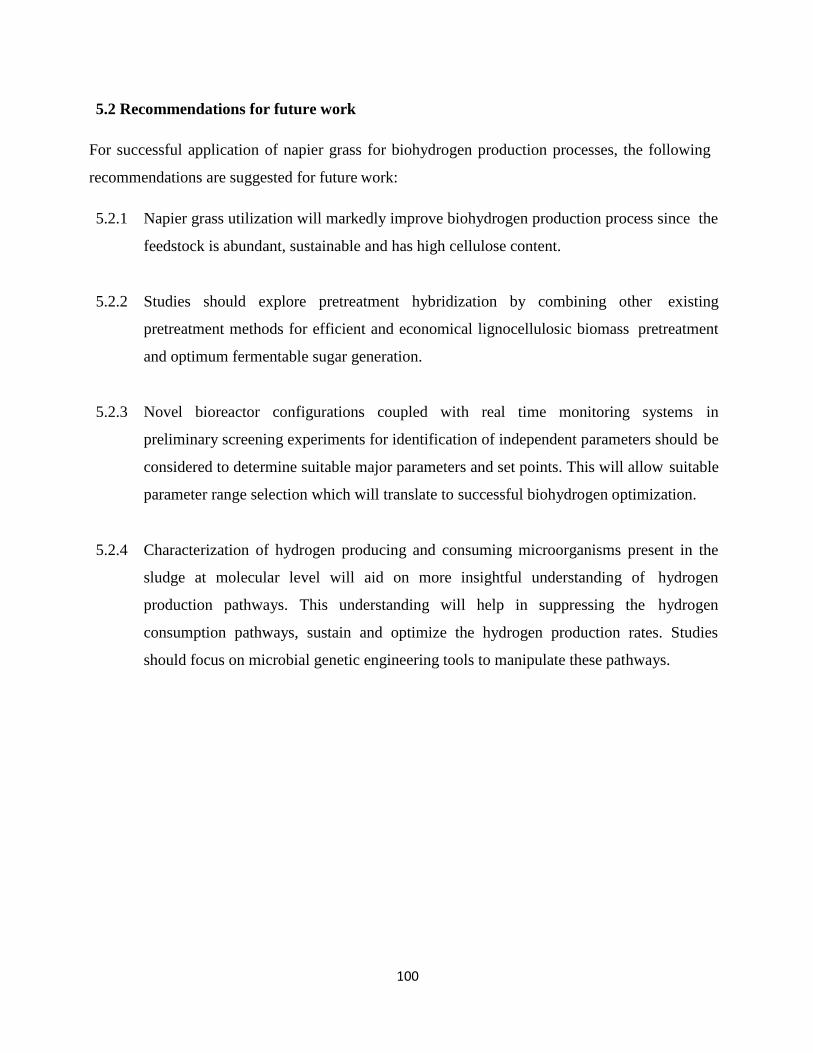
100
5.2 Recommendations for future work
For successful application of napier grass for biohydrogen production processes, the following
recommendations are suggested for future work:
5.2.1 Napier grass utilization will markedly improve biohydrogen production process since the
feedstock is abundant, sustainable and has high cellulose content.
5.2.2 Studies should explore pretreatment hybridization by combining other existing
pretreatment methods for efficient and economical lignocellulosic biomass pretreatment
and optimum fermentable sugar generation.
5.2.3 Novel bioreactor configurations coupled with real time monitoring systems in
preliminary screening experiments for identification of independent parameters should be
considered to determine suitable major parameters and set points. This will allow suitable
parameter range selection which will translate to successful biohydrogen optimization.
5.2.4 Characterization of hydrogen producing and consuming microorganisms present in the
sludge at molecular level will aid on more insightful understanding of hydrogen
production pathways. This understanding will help in suppressing the hydrogen
consumption pathways, sustain and optimize the hydrogen production rates. Studies
should focus on microbial genetic engineering tools to manipulate these pathways.

101
Appendix A: Publication