Embed Size (px)
Citation preview
Gas Well Deliquification Workshop
Sheraton Downtown Denver Hotel
Denver, Colorado
February 18 - 20, 2013
Optimize and Troubleshoot
Plunger Lift Wells
David Cosby, P.E.
Shale Tec LLC
Why optimize
Planning
Line-out and optimize
Detect & troubleshoot
Sustain peak production
CONTENTS
2 February 18 – 20, 2013
2013 Gas Well Deliquification Workshop
Denver, Colorado
3 February 18 – 20, 2013
2013 Gas Well Deliquification Workshop
Denver, Colorado
0
200
400
600
800
1,000
1,200
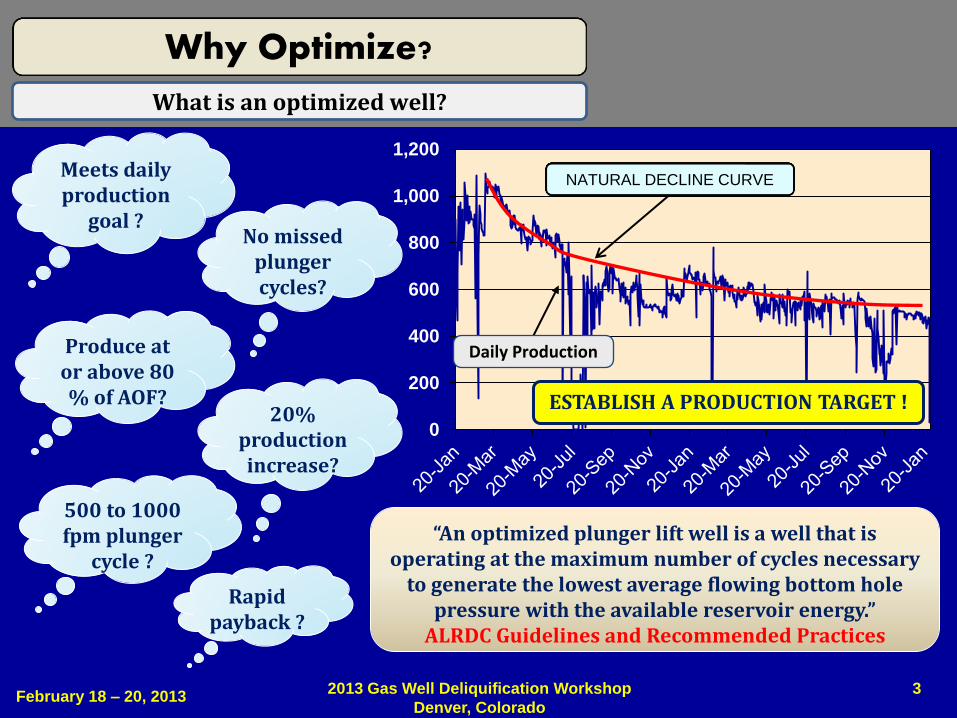
Daily Production
NATURAL DECLINE CURVE
No missed plunger cycles?
Meets daily production
goal ?
Produce at or above 80 % of AOF?
500 to 1000 fpm plunger
cycle ?
20% production increase?
Rapid payback ?
What is an optimized well?
Why Optimize?
ESTABLISH A PRODUCTION TARGET !
“An optimized plunger lift well is a well that is operating at the maximum number of cycles necessary
to generate the lowest average flowing bottom hole pressure with the available reservoir energy.”
ALRDC Guidelines and Recommended Practices
0
200
400
600
800
1,000
1,200
1,400
1,600
0
200
400
600
800
1,000
1,200
20
-Ja
n
20
-Fe
b
20
-Ma
r
20
-Ap
r
20
-Ma
y
20
-Ju
n
20
-Ju
l
20
-Au
g
20
-Se
p
20
-Oct
20
-No
v
20
-De
c
20
-Ja
n
20
-Fe
b
20
-Ma
r
20
-Ap
r
20
-Ma
y
20
-Ju
n
20
-Ju
l
20
-Au
g
20
-Se
p
20
-Oct
20
-No
v
20
-De
c
20
-Ja
n
4
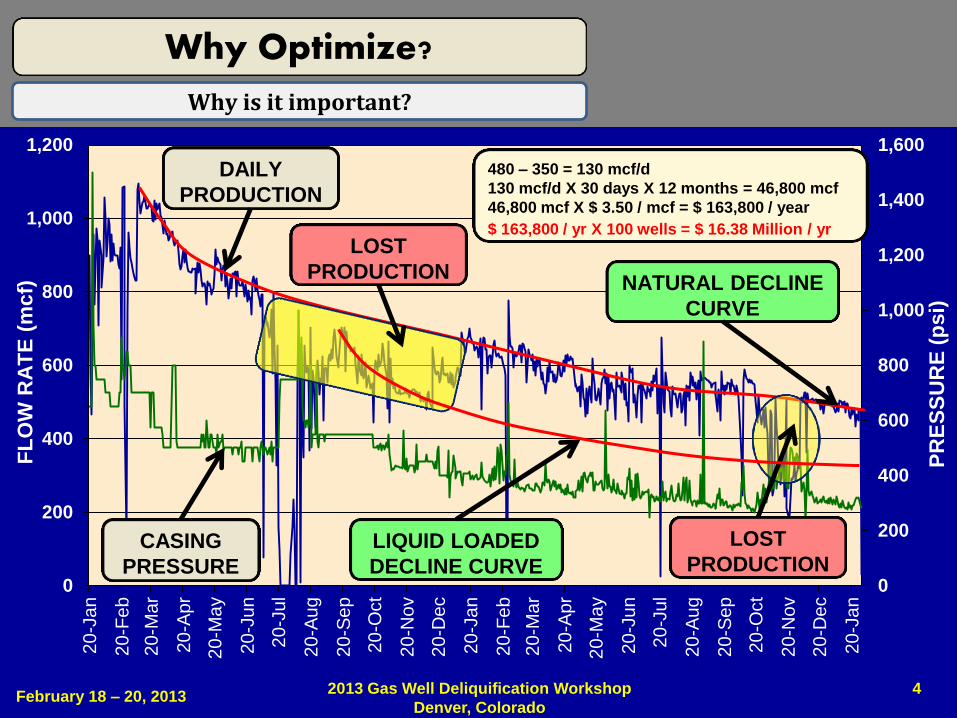
DAILY
PRODUCTION
CASING
PRESSURE
NATURAL DECLINE
CURVE
LOST
PRODUCTION
FL
OW
RA
TE
(m
cf)
PR
ES
SU
RE
(p
si)
LIQUID LOADED
DECLINE CURVE
480 – 350 = 130 mcf/d
130 mcf/d X 30 days X 12 months = 46,800 mcf
46,800 mcf X $ 3.50 / mcf = $ 163,800 / year
$ 163,800 / yr X 100 wells = $ 16.38 Million / yr
LOST
PRODUCTION
February 18 – 20, 2013 2013 Gas Well Deliquification Workshop
Denver, Colorado
Why Optimize?
Why is it important?
0
50
100
150
200
250
0 20 40 60 80 100 120 140
Flo
win
g P
ress
ure
(P
si)
Flow Rate (Mscf / D)
5
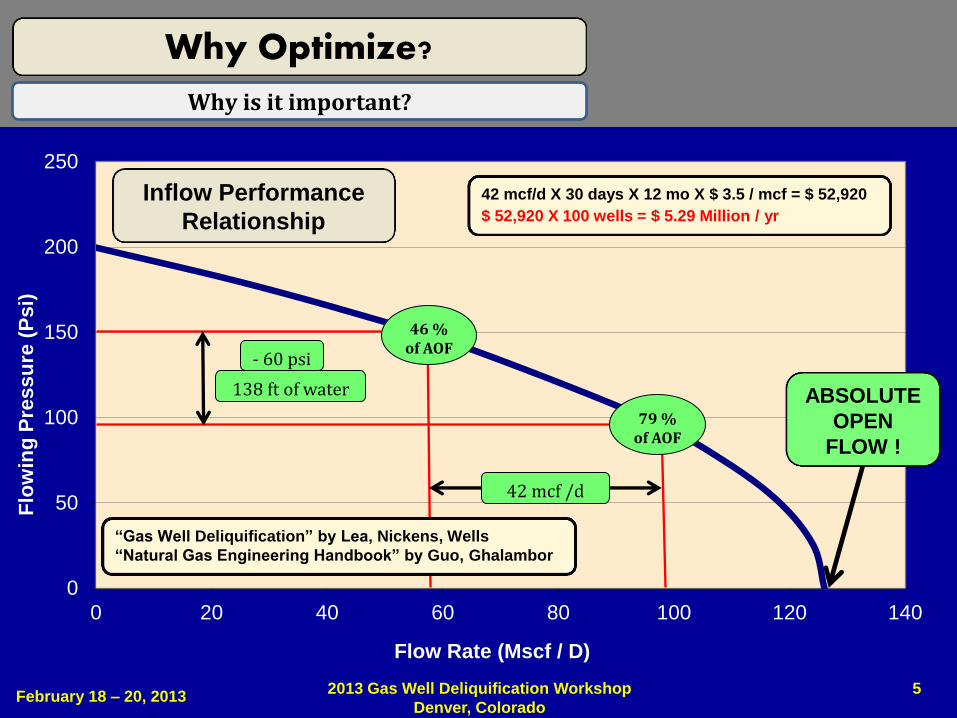
ABSOLUTE
OPEN
FLOW !
Inflow Performance
Relationship
46 % of AOF
- 60 psi
42 mcf /d
138 ft of water
February 18 – 20, 2013 2013 Gas Well Deliquification Workshop
Denver, Colorado
Why Optimize?
Why is it important?
42 mcf/d X 30 days X 12 mo X $ 3.5 / mcf = $ 52,920
$ 52,920 X 100 wells = $ 5.29 Million / yr
“Gas Well Deliquification” by Lea, Nickens, Wells
“Natural Gas Engineering Handbook” by Guo, Ghalambor
79 % of AOF
6 February 18 – 20, 2013
2013 Gas Well Deliquification Workshop
Denver, Colorado
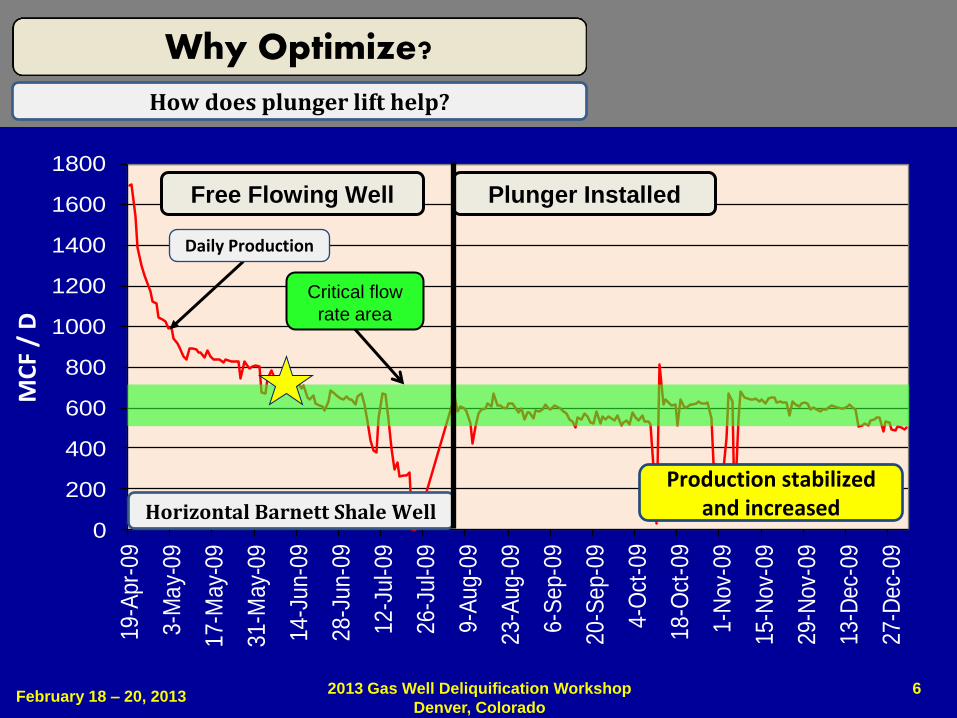
0
200
400
600
800
1000
1200
1400
1600
1800
19-A
pr-
09
3-M
ay-
09
17-M
ay-
09
31-M
ay-
09
14-J
un-0
9
28-J
un-0
9
12-J
ul-09
26-J
ul-09
9-A
ug-0
9
23-A
ug-0
9
6-S
ep-0
9
20-S
ep-0
9
4-O
ct-0
9
18-O
ct-0
9
1-N
ov-
09
15-N
ov-
09
29-N
ov-
09
13-D
ec-
09
27-D
ec-
09
Free Flowing Well Plunger Installed
Daily Production
MC
F /
D
How does plunger lift help?
Why Optimize?
Critical flow
rate area
Horizontal Barnett Shale Well
Production stabilized and increased
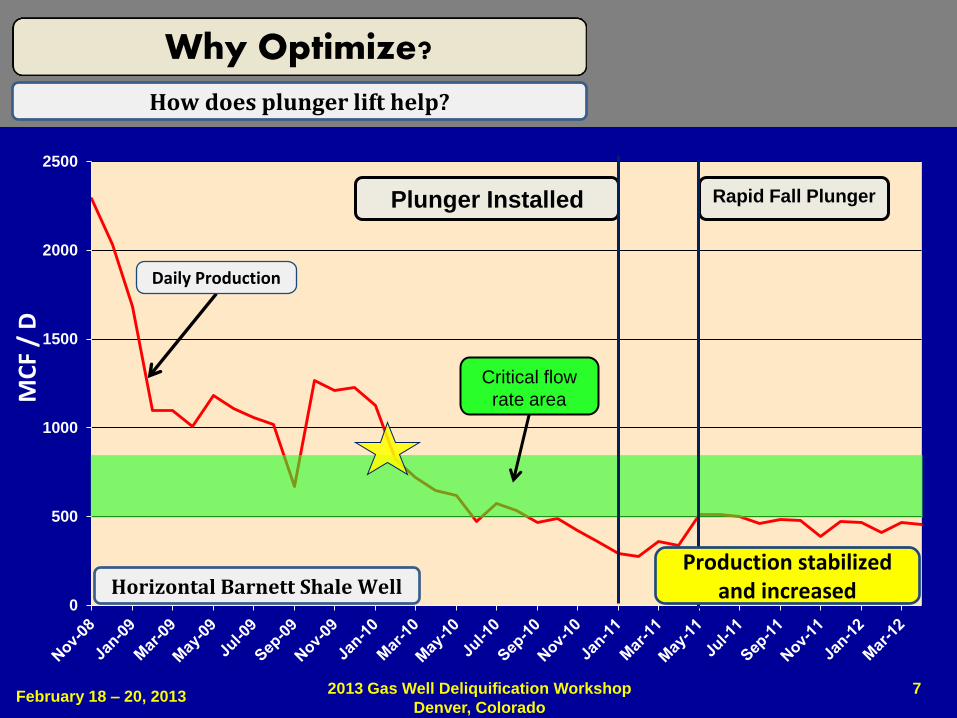
0
500
1000
1500
2000
2500
Why Optimize? M
CF
/ D
Critical flow
rate area
How does plunger lift help?
Horizontal Barnett Shale Well
Plunger Installed Rapid Fall Plunger
Daily Production
7 February 18 – 20, 2013
2013 Gas Well Deliquification Workshop
Denver, Colorado
Production stabilized and increased
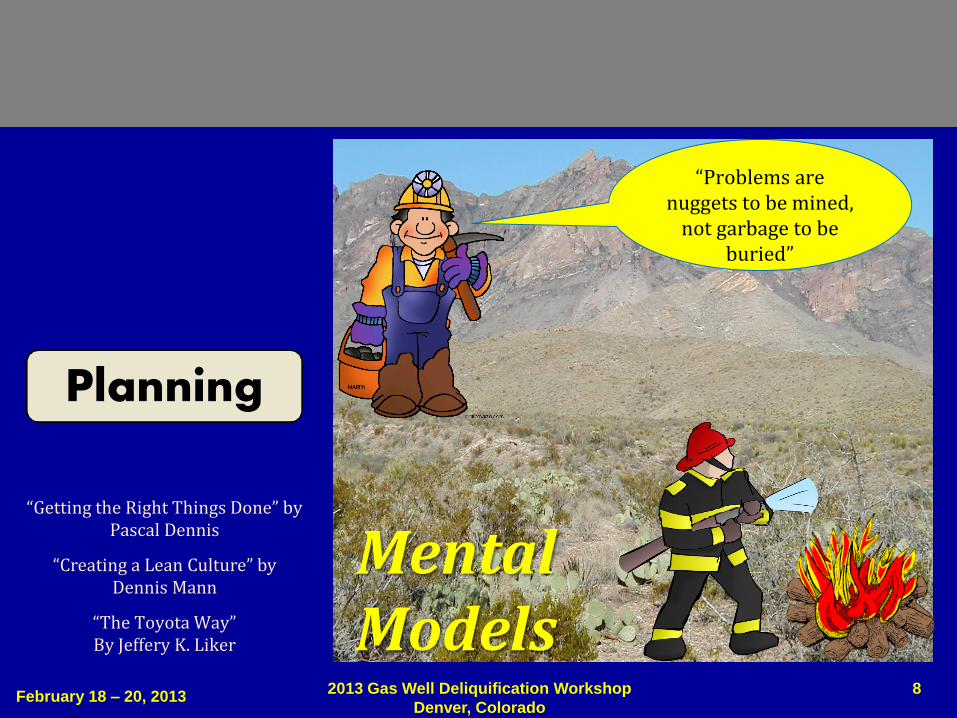
Planning
8 February 18 – 20, 2013
2013 Gas Well Deliquification Workshop
Denver, Colorado
“Problems are nuggets to be mined,
not garbage to be buried”
Mental Models
“Getting the Right Things Done” by Pascal Dennis
“Creating a Lean Culture” by Dennis Mann
“The Toyota Way” By Jeffery K. Liker
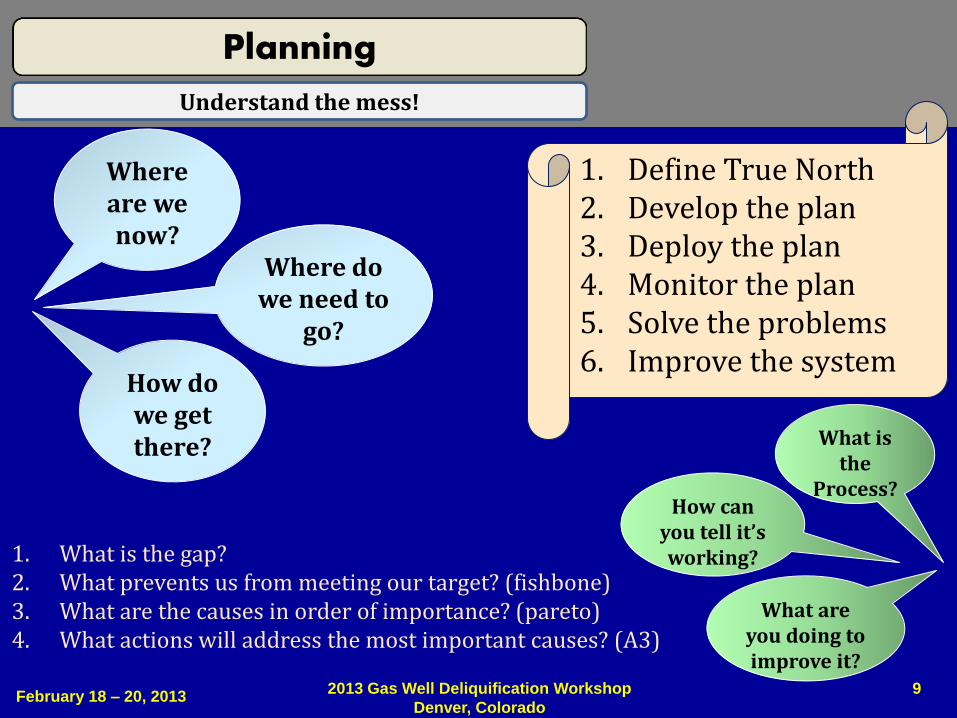
Where are we now?
Where do we need to
go?
How do we get there?
1. Define True North 2. Develop the plan 3. Deploy the plan 4. Monitor the plan 5. Solve the problems 6. Improve the system
Planning
Understand the mess!
1. What is the gap? 2. What prevents us from meeting our target? (fishbone) 3. What are the causes in order of importance? (pareto) 4. What actions will address the most important causes? (A3)
9 February 18 – 20, 2013
2013 Gas Well Deliquification Workshop
Denver, Colorado
What is the
Process? How can
you tell it’s working?
What are you doing to improve it?
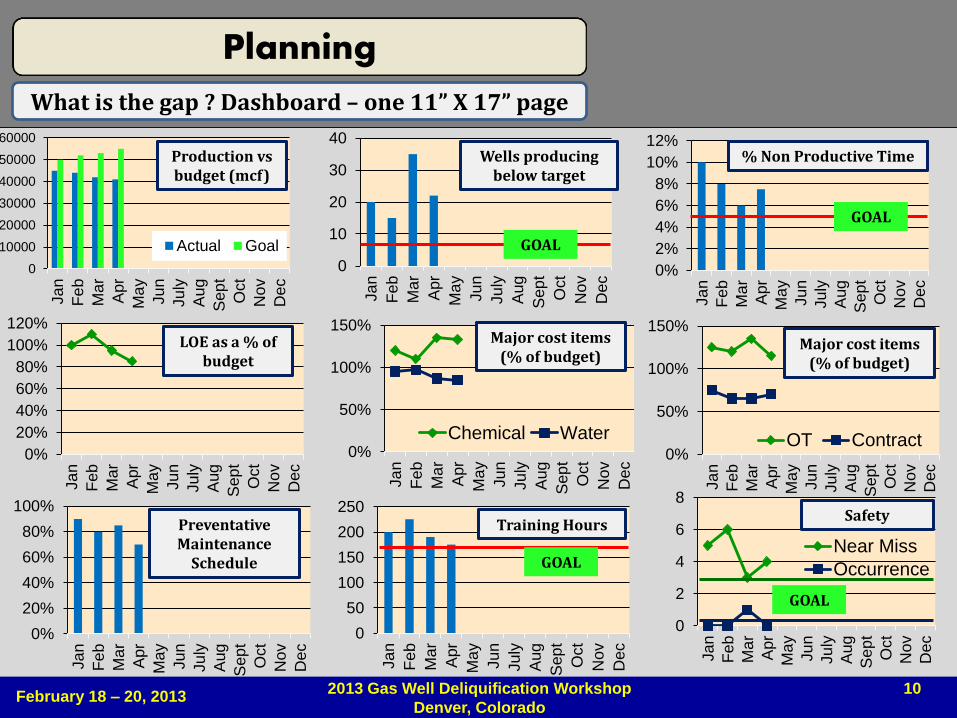
What is the gap ? Dashboard – one 11” X 17” page
Planning
0%
20%
40%
60%
80%
100%
120%
Ja
n
Feb
Ma
r
Apr
Ma
y
Ju
n
Ju
ly
Aug
Sep
t
Oct
Nov
Dec
LOE as a % of budget
0%
50%
100%
150%
Ja
n
Feb
Ma
r
Apr
Ma
y
Ju
n
Ju
ly
Aug
Sep
t
Oct
Nov
Dec
Chemical Water
Major cost items (% of budget)
0%
20%
40%
60%
80%
100%
Ja
n
Fe
b
Ma
r
Apr
Ma
y
Ju
n
Ju
ly
Aug
Sep
t
Oct
No
v
De
c
Preventative Maintenance
Schedule
0
10000
20000
30000
40000
50000
60000
Ja
n
Fe
b
Ma
r
Apr
Ma
y
Ju
n
Ju
ly
Aug
Sep
t
Oct
Nov
Dec
Actual Goal
Production vs budget (mcf)
0%
2%
4%
6%
8%
10%
12%
Ja
n
Feb
Ma
r
Apr
Ma
y
Ju
n
Ju
ly
Aug
Sep
t
Oct
Nov
Dec
% Non Productive Time
GOAL
10 February 18 – 20, 2013
2013 Gas Well Deliquification Workshop
Denver, Colorado
0
10
20
30
40
Ja
n
Feb
Ma
r
Apr
Ma
y
Ju
n
Ju
ly
Aug
Sep
t
Oct
Nov
Dec
Wells producing below target
GOAL
0%
50%
100%
150%
Ja
n
Feb
Ma
r
Apr
Ma
y
Ju
n
Ju
ly
Aug
Sep
t
Oct
Nov
Dec
OT Contract
Major cost items (% of budget)
0
50
100
150
200
250
Ja
n
Fe
b
Ma
r
Apr
Ma
y
Ju
n
Ju
ly
Aug
Sep
t
Oct
No
v
De
c
Training Hours
GOAL
0
2
4
6
8
Ja
n
Fe
b
Ma
r
Apr
Ma
y
Ju
n
Ju
ly
Aug
Sep
t
Oct
No
v
De
c
Near Miss
Occurrence
Safety
GOAL
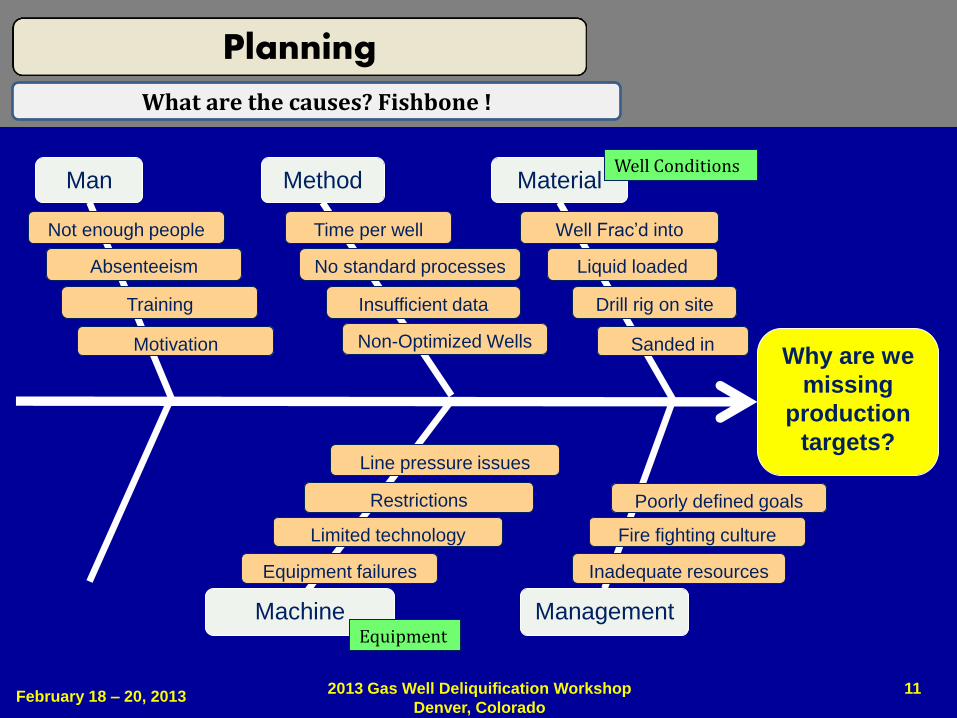
Why are we
missing
production
targets?
Machine
Method Material Man
Well Frac’d into
Management
Time per well
Liquid loaded
Drill rig on site
Not enough people
Limited technology
No standard processes
11 February 18 – 20, 2013
2013 Gas Well Deliquification Workshop
Denver, Colorado
What are the causes? Fishbone !
Planning
Insufficient data
Restrictions
Sanded in
Absenteeism
Training
Motivation
Equipment failures
Line pressure issues
Well Conditions
Equipment
Inadequate resources
Fire fighting culture
Poorly defined goals
Non-Optimized Wells
12 February 18 – 20, 2013
2013 Gas Well Deliquification Workshop
Denver, Colorado
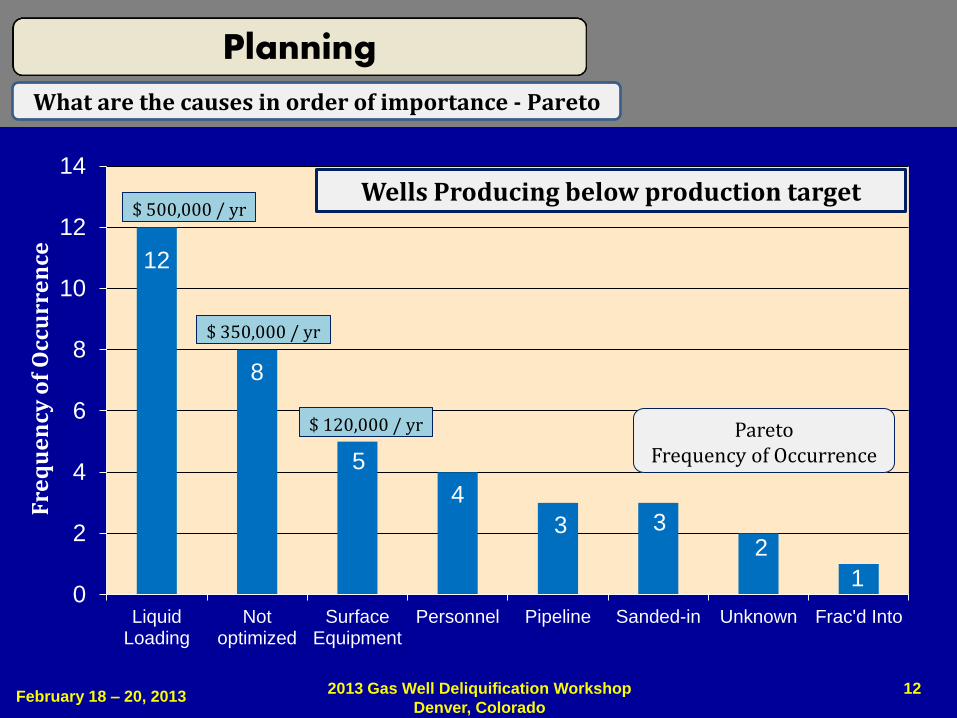
What are the causes in order of importance - Pareto
Planning
12
8
5
4
3 3 2
1 0
2
4
6
8
10
12
14
LiquidLoading
Notoptimized
SurfaceEquipment
Personnel Pipeline Sanded-in Unknown Frac'd Into
Wells Producing below production target
Pareto Frequency of Occurrence
$ 500,000 / yr
$ 350,000 / yr
$ 120,000 / yr
Fre
qu
en
cy o
f O
ccu
rre
nce
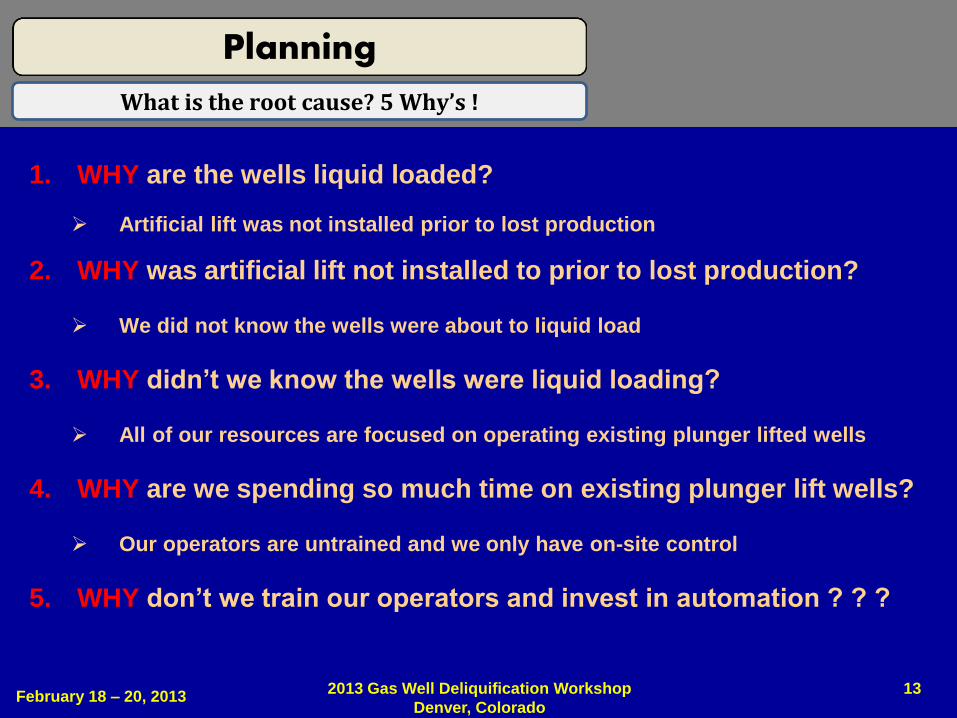
1. WHY are the wells liquid loaded?
Artificial lift was not installed prior to lost production
2. WHY was artificial lift not installed to prior to lost production?
We did not know the wells were about to liquid load
3. WHY didn’t we know the wells were liquid loading?
All of our resources are focused on operating existing plunger lifted wells
4. WHY are we spending so much time on existing plunger lift wells?
Our operators are untrained and we only have on-site control
5. WHY don’t we train our operators and invest in automation ? ? ?
13 February 18 – 20, 2013
2013 Gas Well Deliquification Workshop
Denver, Colorado
What is the root cause? 5 Why’s !
Planning
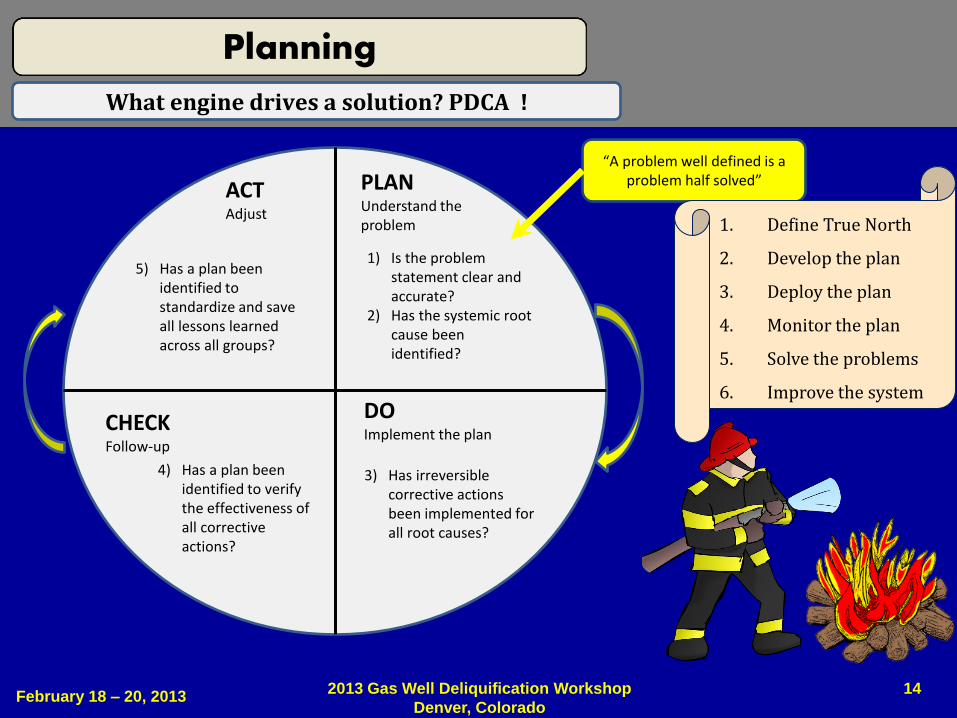
PLAN Understand the problem
“A problem well defined is a problem half solved”
1) Is the problem statement clear and accurate?
2) Has the systemic root cause been identified?
DO Implement the plan
3) Has irreversible corrective actions been implemented for all root causes?
CHECK Follow-up
4) Has a plan been identified to verify the effectiveness of all corrective actions?
ACT Adjust
5) Has a plan been identified to standardize and save all lessons learned across all groups?
14 February 18 – 20, 2013
2013 Gas Well Deliquification Workshop
Denver, Colorado
What engine drives a solution? PDCA !
Planning
1. Define True North
2. Develop the plan
3. Deploy the plan
4. Monitor the plan
5. Solve the problems
6. Improve the system
15 February 18 – 20, 2013
2013 Gas Well Deliquification Workshop
Denver, Colorado
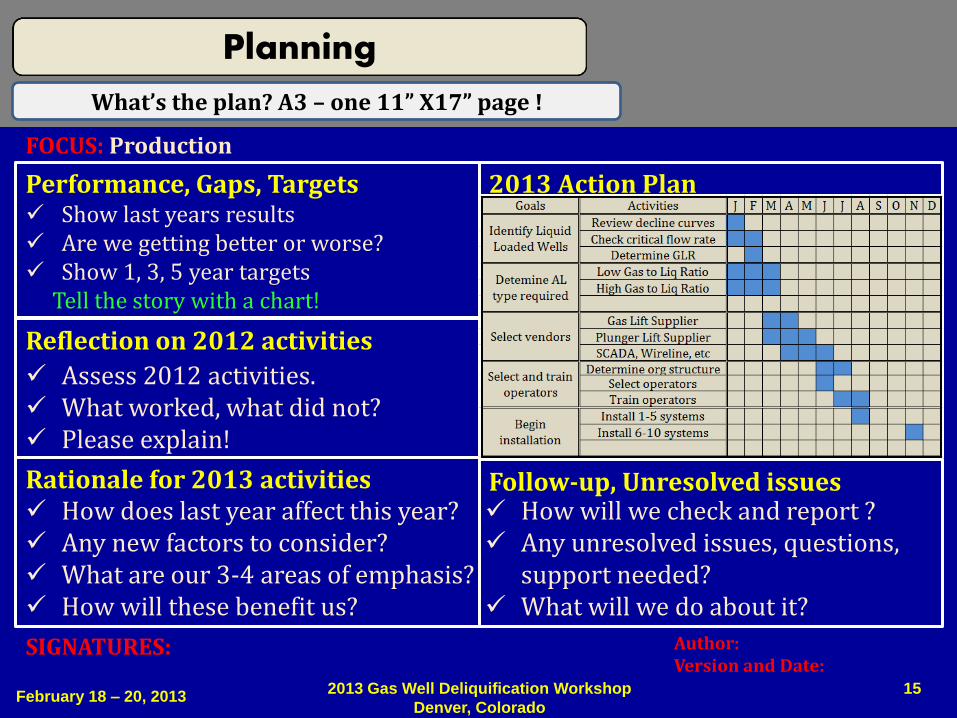
What’s the plan? A3 – one 11” X17” page !
Planning
Performance, Gaps, Targets Show last years results Are we getting better or worse? Show 1, 3, 5 year targets Tell the story with a chart!
FOCUS: Production
SIGNATURES: Author: Version and Date:
Reflection on 2012 activities
Assess 2012 activities. What worked, what did not? Please explain!
Rationale for 2013 activities How does last year affect this year? Any new factors to consider? What are our 3-4 areas of emphasis? How will these benefit us?
Follow-up, Unresolved issues How will we check and report ? Any unresolved issues, questions,
support needed? What will we do about it?
2013 Action Plan
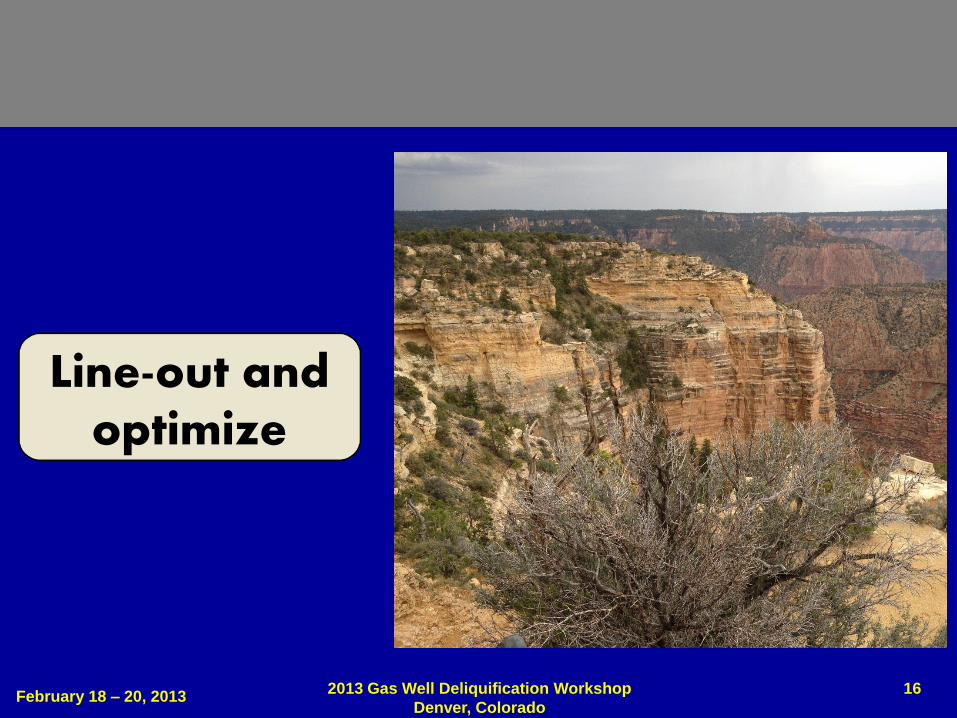
Line-out and optimize
16 February 18 – 20, 2013
2013 Gas Well Deliquification Workshop
Denver, Colorado
17
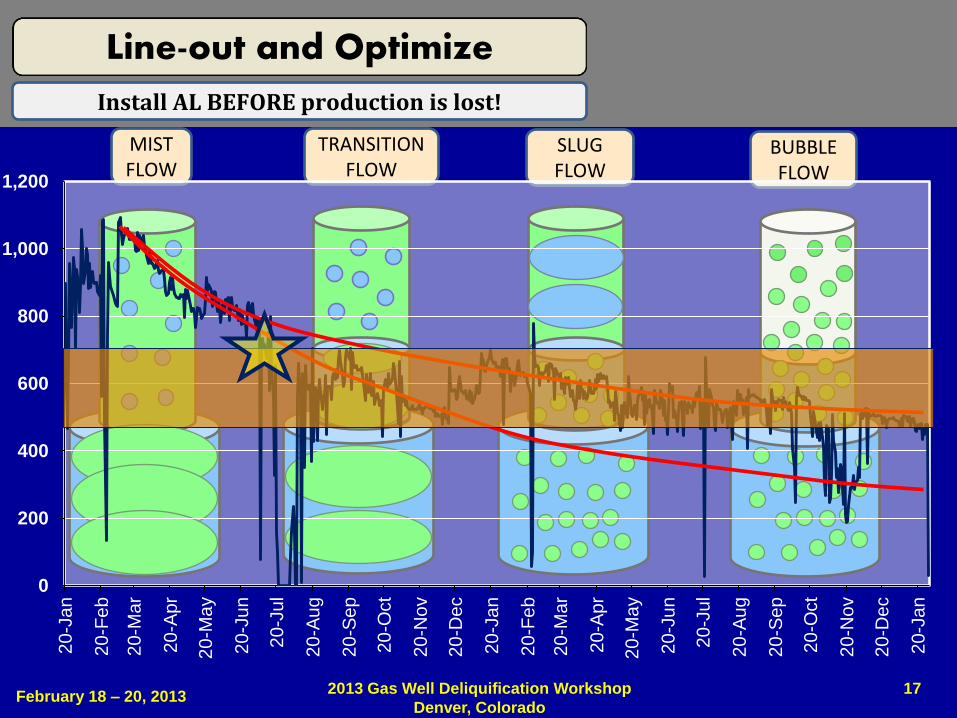
MIST FLOW
TRANSITION FLOW
BUBBLE FLOW
SLUG FLOW
February 18 – 20, 2013 2013 Gas Well Deliquification Workshop
Denver, Colorado
0
200
400
600
800
1,000
1,200
20
-Ja
n
20
-Fe
b
20
-Ma
r
20
-Ap
r
20
-Ma
y
20
-Ju
n
20
-Ju
l
20
-Au
g
20-S
ep
20-O
ct
20
-No
v
20
-De
c
20
-Ja
n
20
-Fe
b
20
-Ma
r
20
-Ap
r
20
-Ma
y
20
-Ju
n
20
-Ju
l
20
-Au
g
20
-Se
p
20
-Oct
20
-No
v
20
-De
c
20
-Ja
n
Line-out and Optimize
Install AL BEFORE production is lost!
18 February 18 – 20, 2013
2013 Gas Well Deliquification Workshop
Denver, Colorado
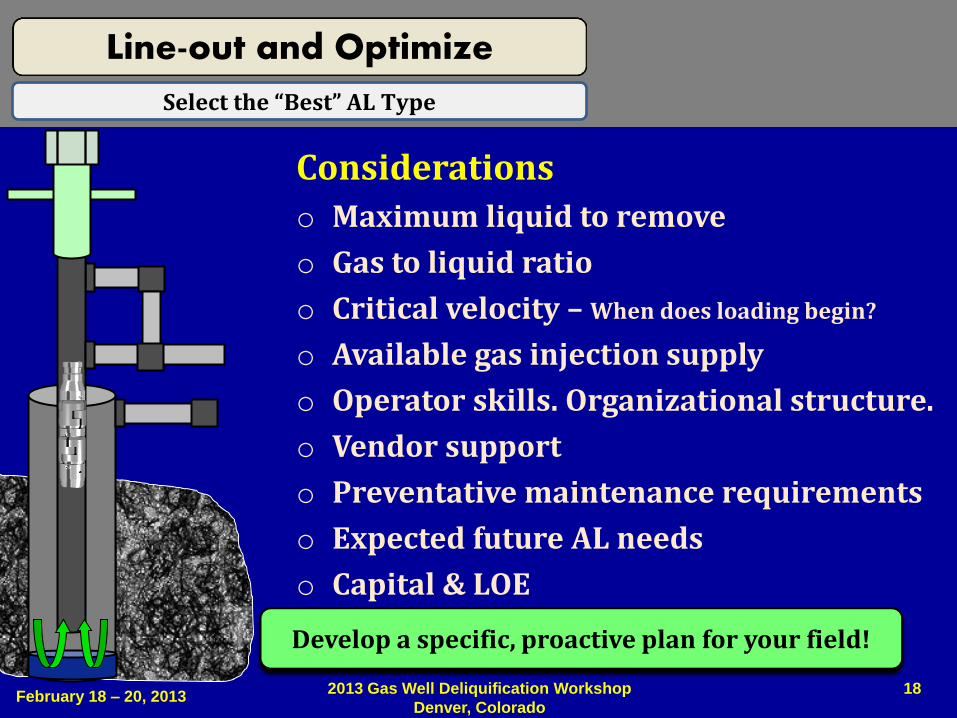
Line-out and Optimize
Select the “Best” AL Type
Considerations
o Maximum liquid to remove
o Gas to liquid ratio
o Critical velocity – When does loading begin?
o Available gas injection supply
o Operator skills. Organizational structure.
o Vendor support
o Preventative maintenance requirements
o Expected future AL needs
o Capital & LOE
Develop a specific, proactive plan for your field!
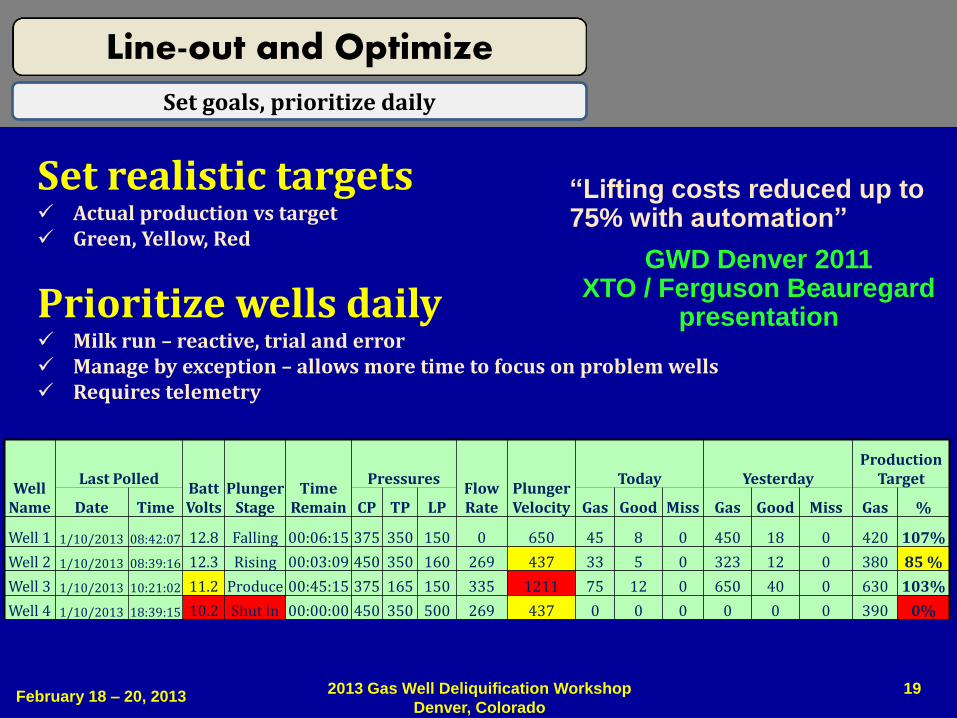
Set realistic targets Actual production vs target Green, Yellow, Red
Prioritize wells daily Milk run – reactive, trial and error Manage by exception – allows more time to focus on problem wells Requires telemetry
19 February 18 – 20, 2013
2013 Gas Well Deliquification Workshop
Denver, Colorado
Line-out and Optimize
Well Name
Last Polled Batt Volts
Plunger Stage
Time Remain
Pressures Flow Rate
Plunger Velocity
Today Yesterday Production
Target
Date Time CP TP LP Gas Good Miss Gas Good Miss Gas %
Well 1 1/10/2013 08:42:07 12.8 Falling 00:06:15 375 350 150 0 650 45 8 0 450 18 0 420 107%
Well 2 1/10/2013 08:39:16 12.3 Rising 00:03:09 450 350 160 269 437 33 5 0 323 12 0 380 85 %
Well 3 1/10/2013 10:21:02 11.2 Produce 00:45:15 375 165 150 335 1211 75 12 0 650 40 0 630 103%
Well 4 1/10/2013 18:39:15 10.2 Shut in 00:00:00 450 350 500 269 437 0 0 0 0 0 0 390 0%
“Lifting costs reduced up to 75% with automation”
GWD Denver 2011 XTO / Ferguson Beauregard
presentation
Set goals, prioritize daily
20 February 18 – 20, 2013
2013 Gas Well Deliquification Workshop
Denver, Colorado
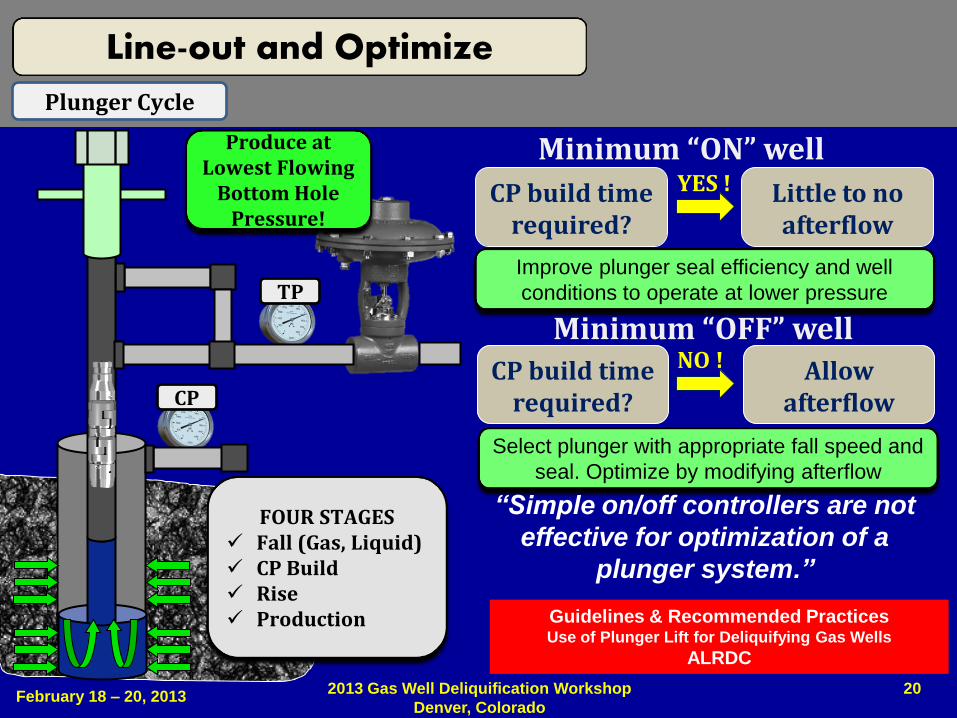
CP
TP
Produce at Lowest Flowing
Bottom Hole Pressure!
Improve plunger seal efficiency and well
conditions to operate at lower pressure
Guidelines & Recommended Practices Use of Plunger Lift for Deliquifying Gas Wells
ALRDC
Line-out and Optimize
FOUR STAGES Fall (Gas, Liquid) CP Build Rise Production
Plunger Cycle
CP build time required?
Little to no afterflow
CP build time required?
Allow afterflow
YES !
NO !
Select plunger with appropriate fall speed and
seal. Optimize by modifying afterflow
“Simple on/off controllers are not
effective for optimization of a
plunger system.”
Minimum “ON” well
Minimum “OFF” well
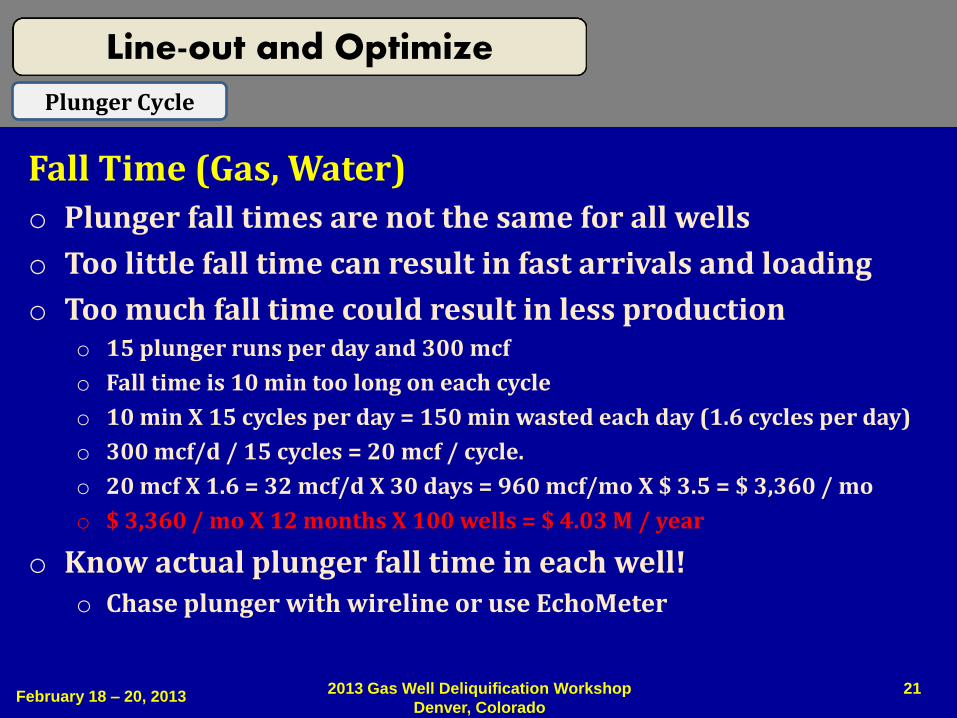
Fall Time (Gas, Water)
o Plunger fall times are not the same for all wells
o Too little fall time can result in fast arrivals and loading
o Too much fall time could result in less production o 15 plunger runs per day and 300 mcf
o Fall time is 10 min too long on each cycle
o 10 min X 15 cycles per day = 150 min wasted each day (1.6 cycles per day)
o 300 mcf/d / 15 cycles = 20 mcf / cycle.
o 20 mcf X 1.6 = 32 mcf/d X 30 days = 960 mcf/mo X $ 3.5 = $ 3,360 / mo
o $ 3,360 / mo X 12 months X 100 wells = $ 4.03 M / year
o Know actual plunger fall time in each well! o Chase plunger with wireline or use EchoMeter
Line-out and Optimize
21 February 18 – 20, 2013
2013 Gas Well Deliquification Workshop
Denver, Colorado
Plunger Cycle
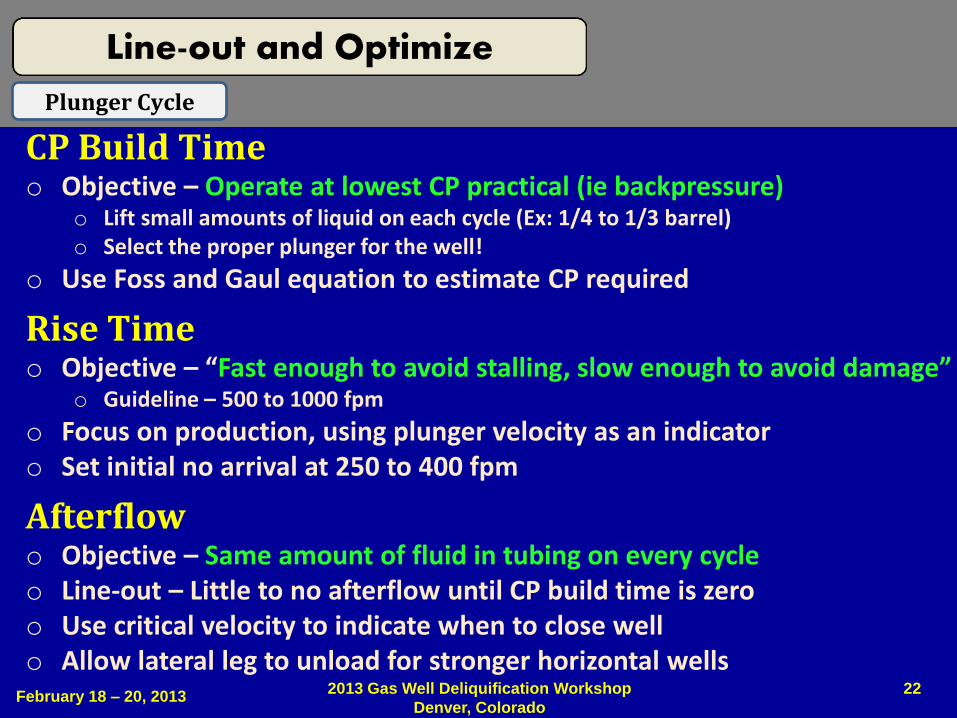
CP Build Time o Objective – Operate at lowest CP practical (ie backpressure)
o Lift small amounts of liquid on each cycle (Ex: 1/4 to 1/3 barrel) o Select the proper plunger for the well!
o Use Foss and Gaul equation to estimate CP required
Rise Time o Objective – “Fast enough to avoid stalling, slow enough to avoid damage”
o Guideline – 500 to 1000 fpm
o Focus on production, using plunger velocity as an indicator o Set initial no arrival at 250 to 400 fpm
Afterflow o Objective – Same amount of fluid in tubing on every cycle o Line-out – Little to no afterflow until CP build time is zero o Use critical velocity to indicate when to close well o Allow lateral leg to unload for stronger horizontal wells
Line-out and Optimize
22 February 18 – 20, 2013
2013 Gas Well Deliquification Workshop
Denver, Colorado
Plunger Cycle
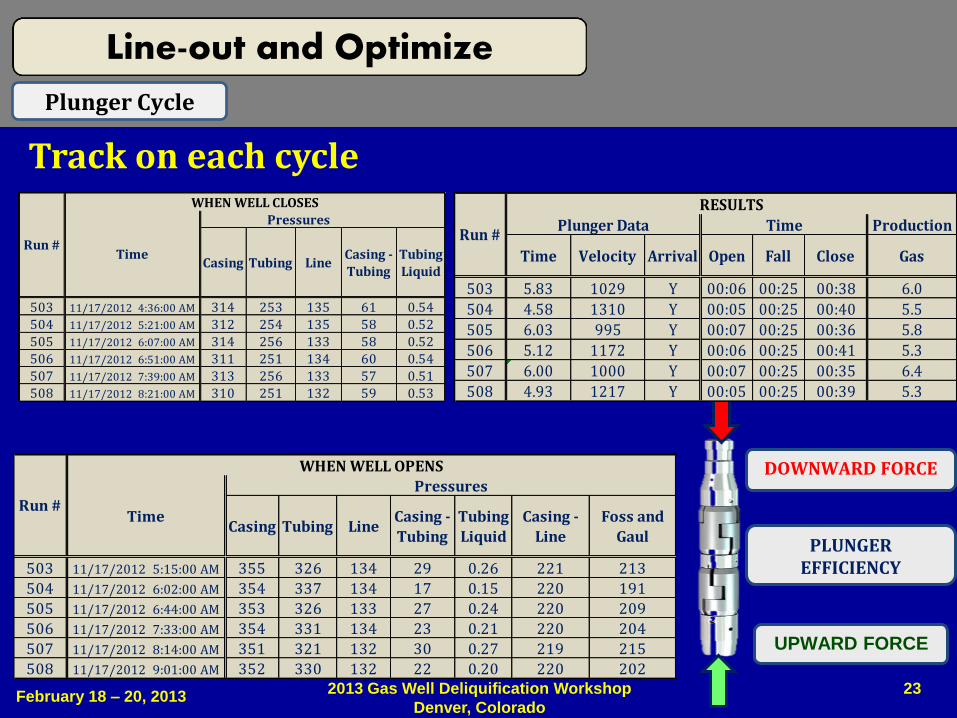
Track on each cycle
Line-out and Optimize
23 February 18 – 20, 2013
2013 Gas Well Deliquification Workshop
Denver, Colorado
Plunger Cycle
Casing Tubing LineCasing -
Tubing
Tubing
Liquid
503 11/17/2012 4:36:00 AM 314 253 135 61 0.54
504 11/17/2012 5:21:00 AM 312 254 135 58 0.52
505 11/17/2012 6:07:00 AM 314 256 133 58 0.52
506 11/17/2012 6:51:00 AM 311 251 134 60 0.54
507 11/17/2012 7:39:00 AM 313 256 133 57 0.51
508 11/17/2012 8:21:00 AM 310 251 132 59 0.53
Time
Pressures
Run #
WHEN WELL CLOSES
Casing Tubing LineCasing -
Tubing
Tubing
Liquid
Casing -
Line
Foss and
Gaul
503 11/17/2012 5:15:00 AM 355 326 134 29 0.26 221 213
504 11/17/2012 6:02:00 AM 354 337 134 17 0.15 220 191
505 11/17/2012 6:44:00 AM 353 326 133 27 0.24 220 209
506 11/17/2012 7:33:00 AM 354 331 134 23 0.21 220 204
507 11/17/2012 8:14:00 AM 351 321 132 30 0.27 219 215
508 11/17/2012 9:01:00 AM 352 330 132 22 0.20 220 202
Time
PressuresRun #
WHEN WELL OPENS
PLUNGER EFFICIENCY
DOWNWARD FORCE
UPWARD FORCE
Production
Time Velocity Arrival Open Fall Close Gas
503 5.83 1029 Y 00:06 00:25 00:38 6.0
504 4.58 1310 Y 00:05 00:25 00:40 5.5
505 6.03 995 Y 00:07 00:25 00:36 5.8
506 5.12 1172 Y 00:06 00:25 00:41 5.3
507 6.00 1000 Y 00:07 00:25 00:35 6.4
508 4.93 1217 Y 00:05 00:25 00:39 5.3
Run #
RESULTS
Plunger Data Time
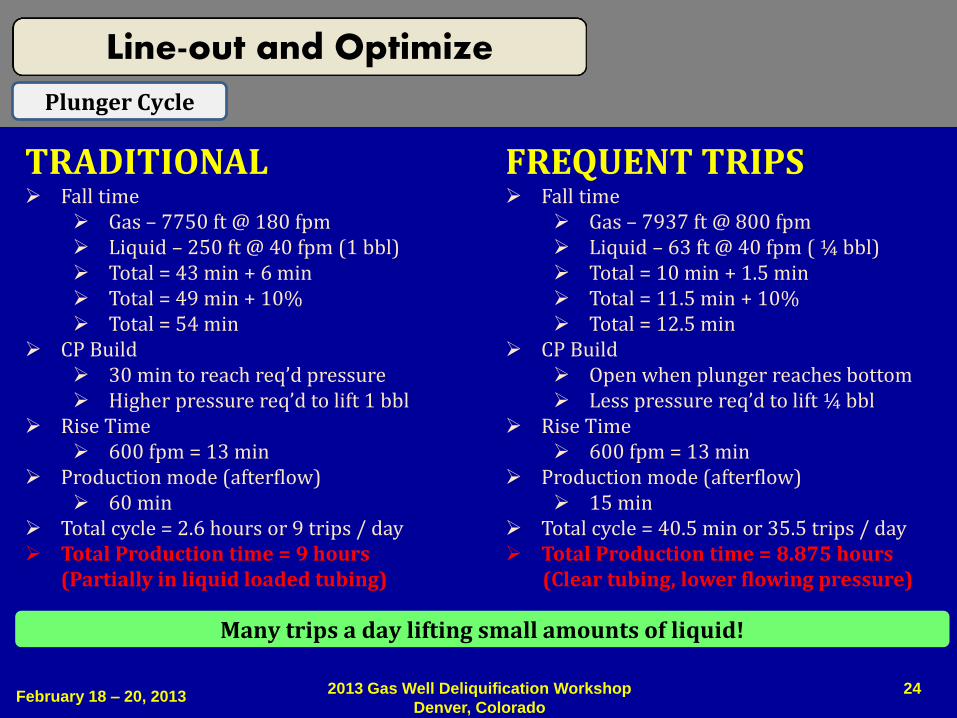
TRADITIONAL Fall time
Gas – 7750 ft @ 180 fpm Liquid – 250 ft @ 40 fpm (1 bbl) Total = 43 min + 6 min Total = 49 min + 10% Total = 54 min
CP Build 30 min to reach req’d pressure Higher pressure req’d to lift 1 bbl
Rise Time 600 fpm = 13 min
Production mode (afterflow) 60 min
Total cycle = 2.6 hours or 9 trips / day Total Production time = 9 hours
(Partially in liquid loaded tubing)
FREQUENT TRIPS Fall time
Gas – 7937 ft @ 800 fpm Liquid – 63 ft @ 40 fpm ( ¼ bbl) Total = 10 min + 1.5 min Total = 11.5 min + 10% Total = 12.5 min
CP Build Open when plunger reaches bottom Less pressure req’d to lift ¼ bbl
Rise Time 600 fpm = 13 min
Production mode (afterflow) 15 min
Total cycle = 40.5 min or 35.5 trips / day Total Production time = 8.875 hours (Clear tubing, lower flowing pressure)
24 February 18 – 20, 2013
2013 Gas Well Deliquification Workshop
Denver, Colorado
Line-out and Optimize
Plunger Cycle
Many trips a day lifting small amounts of liquid!
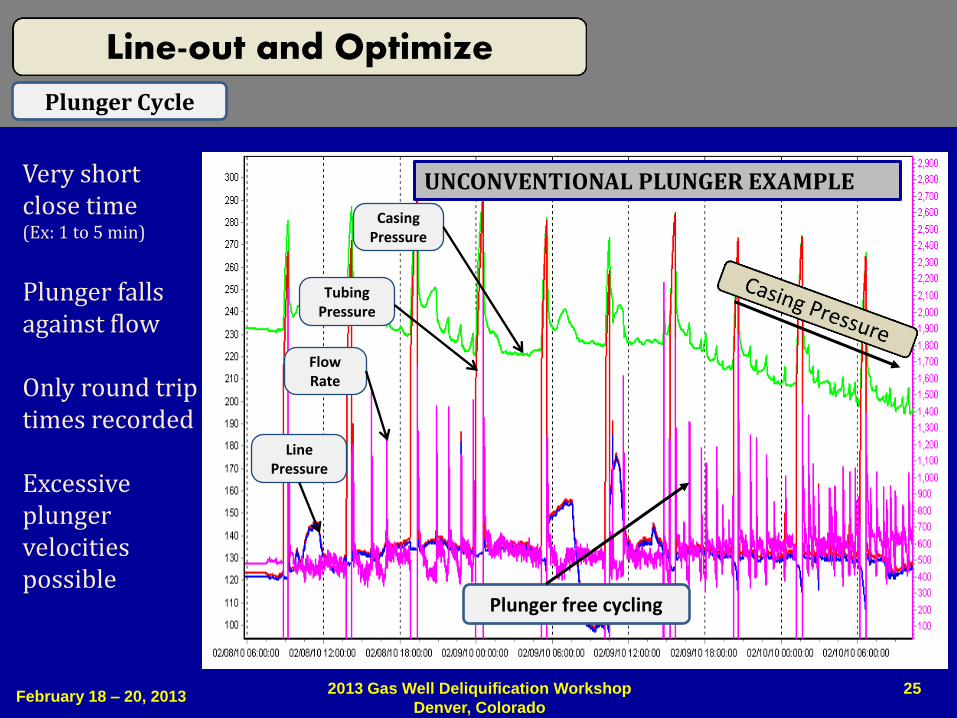
Plunger free cycling
Casing Pressure
Tubing Pressure
Line Pressure
Flow Rate
UNCONVENTIONAL PLUNGER EXAMPLE Very short close time (Ex: 1 to 5 min)
Plunger falls against flow Only round trip times recorded Excessive plunger velocities possible
25 February 18 – 20, 2013
2013 Gas Well Deliquification Workshop
Denver, Colorado
Line-out and Optimize
Plunger Cycle
Troubleshoot
26 February 18 – 20, 2013
2013 Gas Well Deliquification Workshop
Denver, Colorado
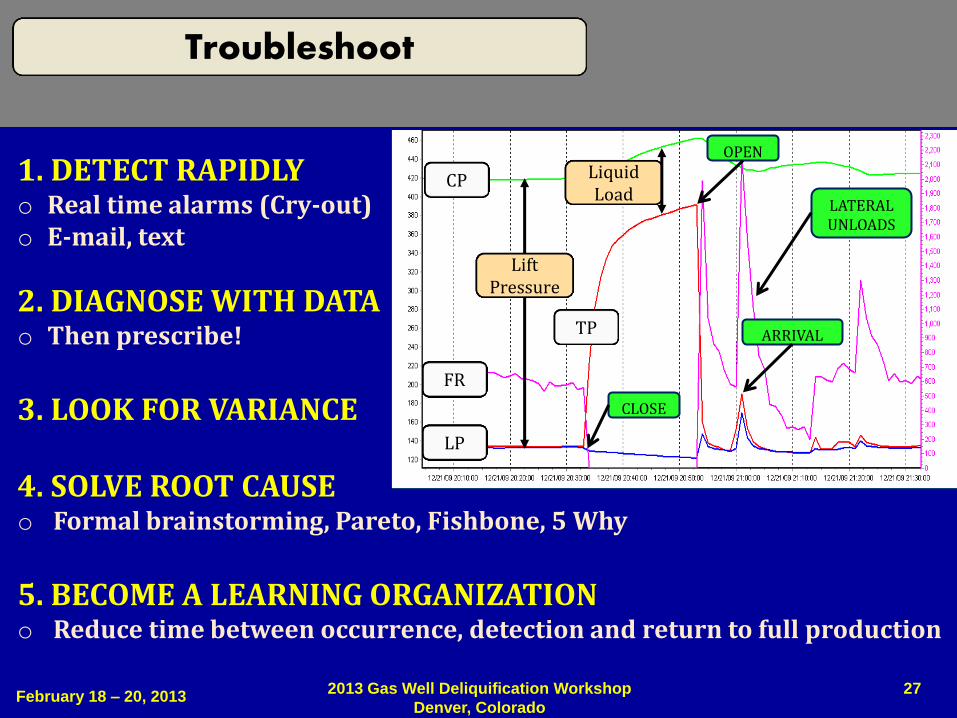
1. DETECT RAPIDLY o Real time alarms (Cry-out) o E-mail, text
2. DIAGNOSE WITH DATA o Then prescribe!
3. LOOK FOR VARIANCE 4. SOLVE ROOT CAUSE o Formal brainstorming, Pareto, Fishbone, 5 Why
5. BECOME A LEARNING ORGANIZATION o Reduce time between occurrence, detection and return to full production
27 February 18 – 20, 2013
2013 Gas Well Deliquification Workshop
Denver, Colorado
Troubleshoot
CP
LP
FR
Lift Pressure
Liquid Load
CLOSE
OPEN
ARRIVAL
LATERAL UNLOADS
TP
28 February 18 – 20, 2013
2013 Gas Well Deliquification Workshop
Denver, Colorado
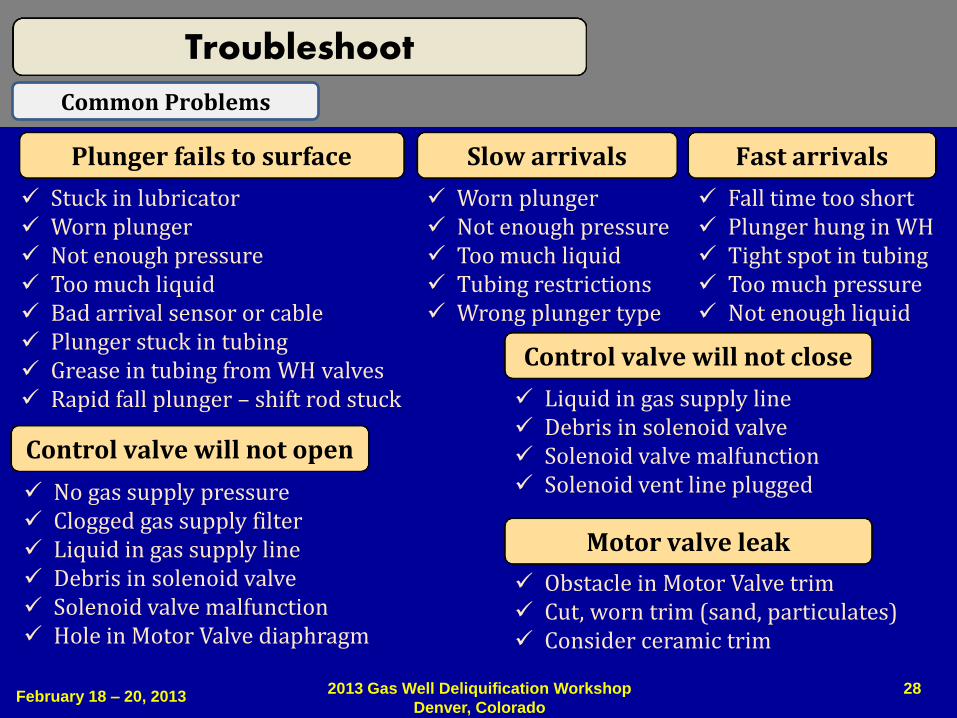
Troubleshoot
Common Problems
Plunger fails to surface
Stuck in lubricator Worn plunger Not enough pressure Too much liquid Bad arrival sensor or cable Plunger stuck in tubing Grease in tubing from WH valves Rapid fall plunger – shift rod stuck
Slow arrivals
Worn plunger Not enough pressure Too much liquid Tubing restrictions Wrong plunger type
Fast arrivals
Fall time too short Plunger hung in WH Tight spot in tubing Too much pressure Not enough liquid
Control valve will not open
Motor valve leak
Liquid in gas supply line Debris in solenoid valve Solenoid valve malfunction Solenoid vent line plugged
Control valve will not close
No gas supply pressure Clogged gas supply filter Liquid in gas supply line Debris in solenoid valve Solenoid valve malfunction Hole in Motor Valve diaphragm
Obstacle in Motor Valve trim Cut, worn trim (sand, particulates) Consider ceramic trim
29 February 18 – 20, 2013
2013 Gas Well Deliquification Workshop
Denver, Colorado
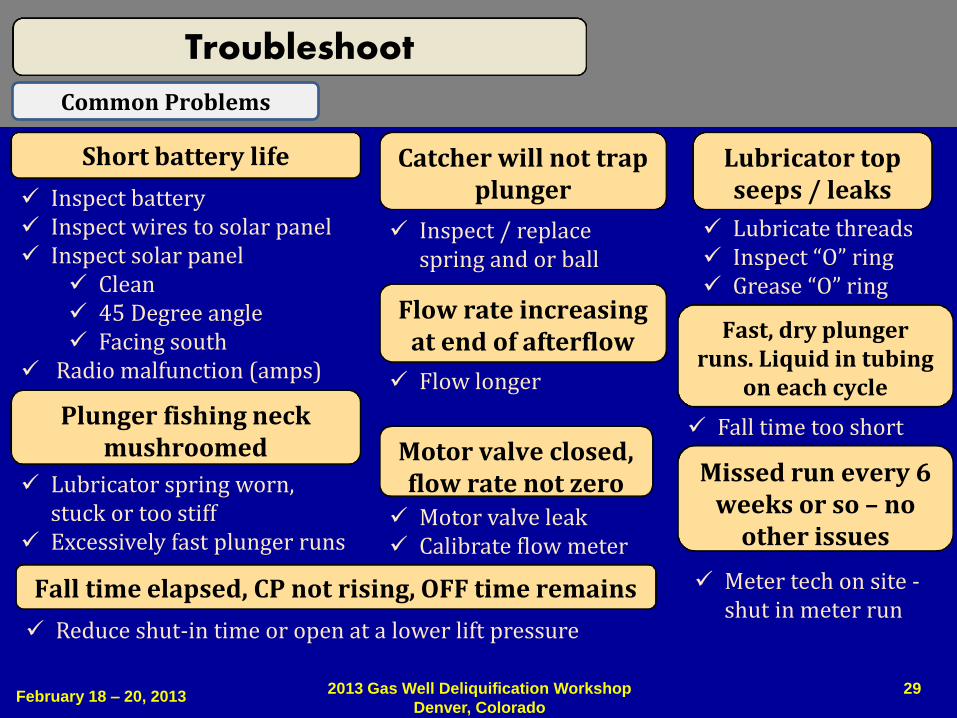
Troubleshoot
Common Problems
Short battery life
Inspect battery Inspect wires to solar panel Inspect solar panel
Clean 45 Degree angle Facing south
Radio malfunction (amps)
Catcher will not trap plunger
Inspect / replace spring and or ball
Plunger fishing neck mushroomed
Lubricator spring worn, stuck or too stiff
Excessively fast plunger runs
Flow longer
Motor valve closed, flow rate not zero
Motor valve leak Calibrate flow meter
Lubricator top seeps / leaks
Lubricate threads Inspect “O” ring Grease “O” ring
Flow rate increasing at end of afterflow
Fall time elapsed, CP not rising, OFF time remains
Reduce shut-in time or open at a lower lift pressure
Fast, dry plunger runs. Liquid in tubing
on each cycle
Fall time too short
Missed run every 6 weeks or so – no
other issues
Meter tech on site - shut in meter run
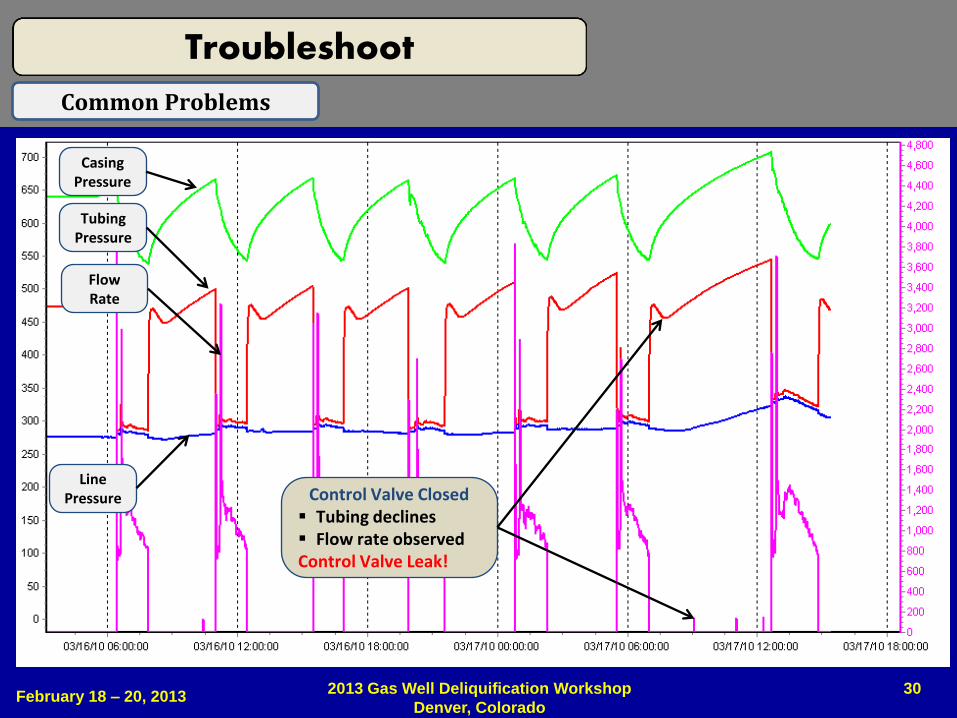
Casing Pressure
Tubing Pressure
Line Pressure
Flow Rate
Control Valve Closed Tubing declines Flow rate observed Control Valve Leak!
30 February 18 – 20, 2013
2013 Gas Well Deliquification Workshop
Denver, Colorado
Troubleshoot
Common Problems
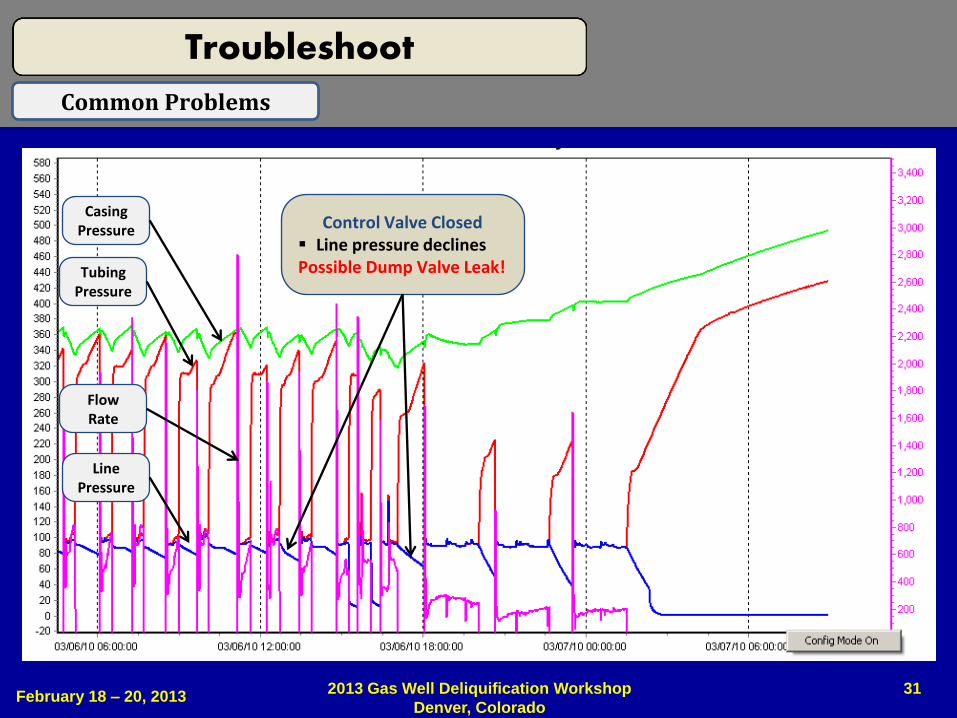
Casing Pressure
Tubing Pressure
Line Pressure
Flow Rate
Control Valve Closed Line pressure declines Possible Dump Valve Leak!
31 February 18 – 20, 2013
2013 Gas Well Deliquification Workshop
Denver, Colorado
Troubleshoot
Common Problems
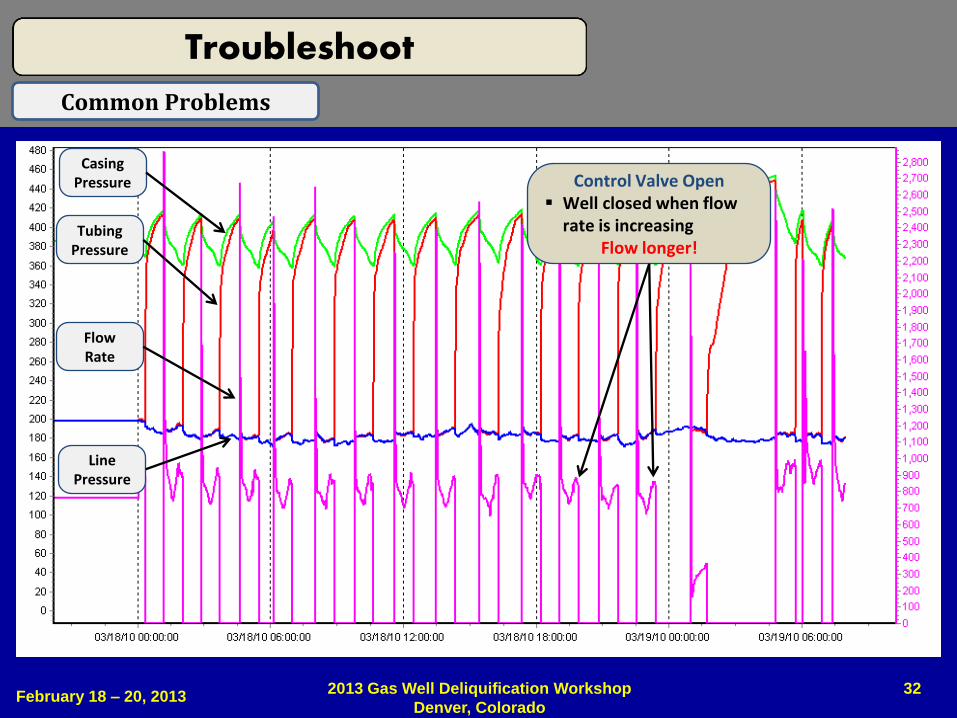
Casing Pressure
Tubing Pressure
Line Pressure
Flow Rate
Control Valve Open Well closed when flow
rate is increasing Flow longer!
32 February 18 – 20, 2013
2013 Gas Well Deliquification Workshop
Denver, Colorado
Troubleshoot
Common Problems
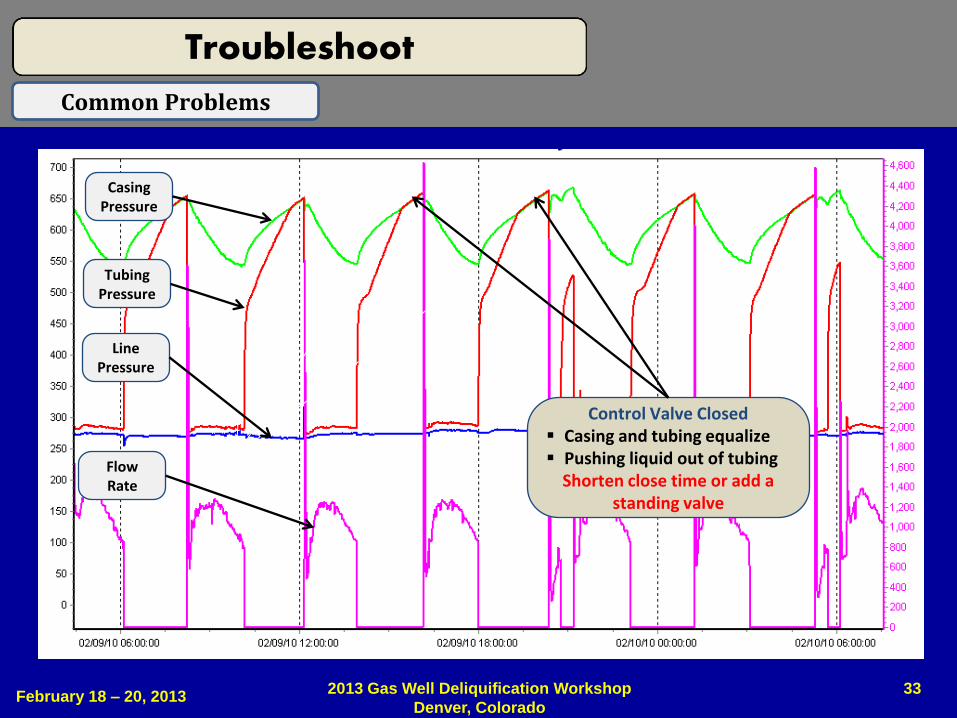
Casing Pressure
Tubing Pressure
Line Pressure
Flow Rate
Control Valve Closed Casing and tubing equalize Pushing liquid out of tubing
Shorten close time or add a standing valve
33 February 18 – 20, 2013
2013 Gas Well Deliquification Workshop
Denver, Colorado
Troubleshoot
Common Problems
34 February 18 – 20, 2013
2013 Gas Well Deliquification Workshop
Denver, Colorado
Sustain peak production
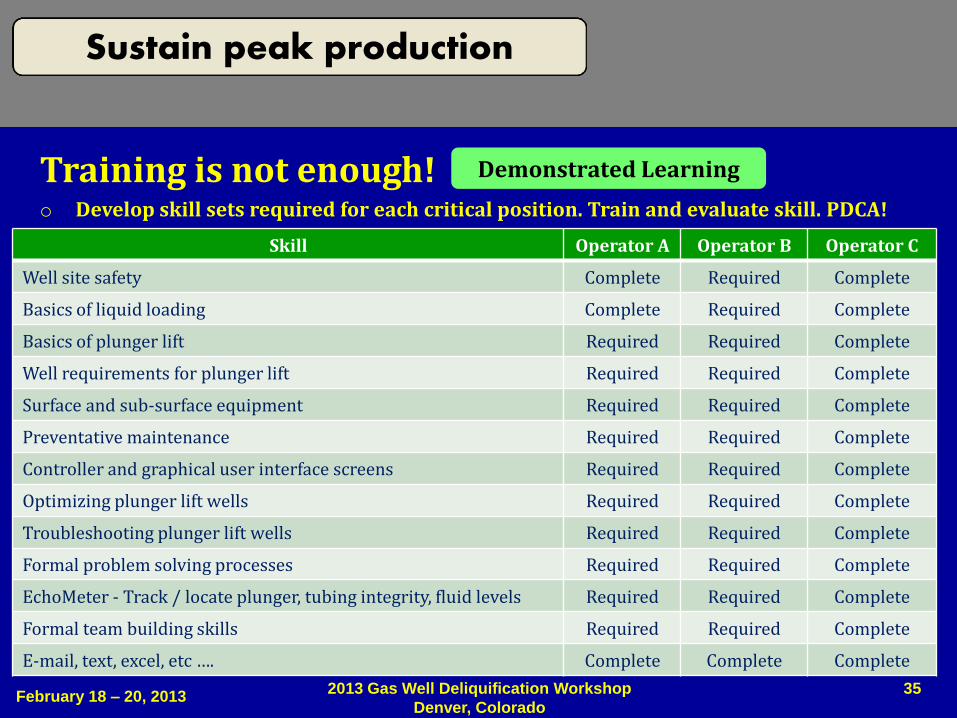
Training is not enough! o Develop skill sets required for each critical position. Train and evaluate skill. PDCA!
Sustain peak production
35 February 18 – 20, 2013
2013 Gas Well Deliquification Workshop
Denver, Colorado
Demonstrated Learning
Skill Operator A Operator B Operator C
Well site safety Complete Required Complete
Basics of liquid loading Complete Required Complete
Basics of plunger lift Required Required Complete
Well requirements for plunger lift Required Required Complete
Surface and sub-surface equipment Required Required Complete
Preventative maintenance Required Required Complete
Controller and graphical user interface screens Required Required Complete
Optimizing plunger lift wells Required Required Complete
Troubleshooting plunger lift wells Required Required Complete
Formal problem solving processes Required Required Complete
EchoMeter - Track / locate plunger, tubing integrity, fluid levels Required Required Complete
Formal team building skills Required Required Complete
E-mail, text, excel, etc …. Complete Complete Complete
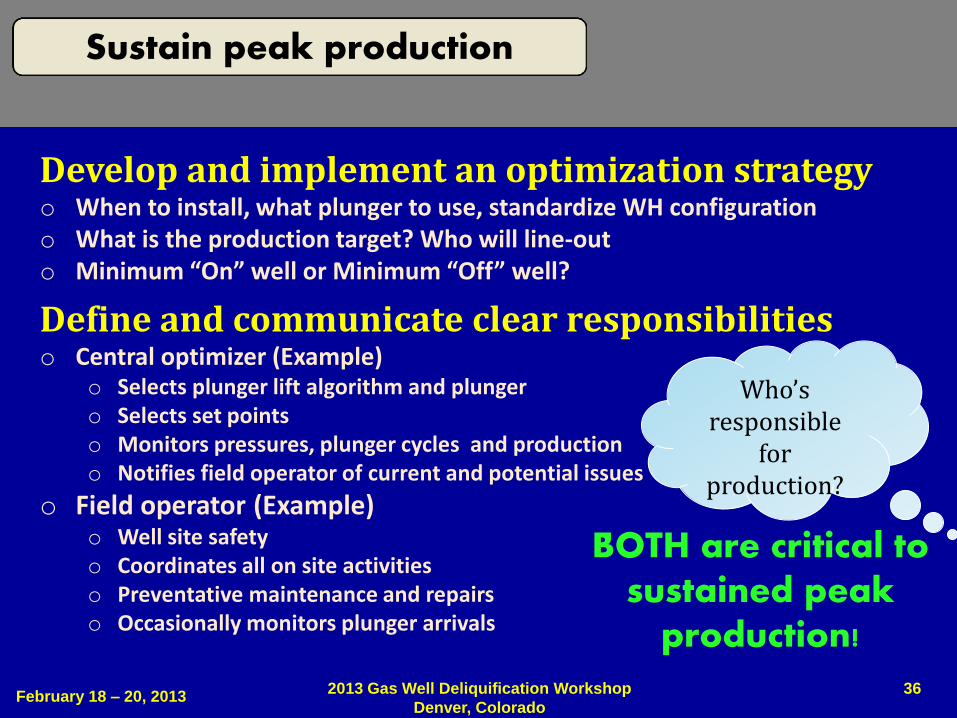
Develop and implement an optimization strategy o When to install, what plunger to use, standardize WH configuration o What is the production target? Who will line-out o Minimum “On” well or Minimum “Off” well?
Define and communicate clear responsibilities o Central optimizer (Example)
o Selects plunger lift algorithm and plunger o Selects set points o Monitors pressures, plunger cycles and production o Notifies field operator of current and potential issues
o Field operator (Example) o Well site safety o Coordinates all on site activities o Preventative maintenance and repairs o Occasionally monitors plunger arrivals
Sustain peak production
36 February 18 – 20, 2013
2013 Gas Well Deliquification Workshop
Denver, Colorado
BOTH are critical to sustained peak
production!
Who’s responsible
for production?
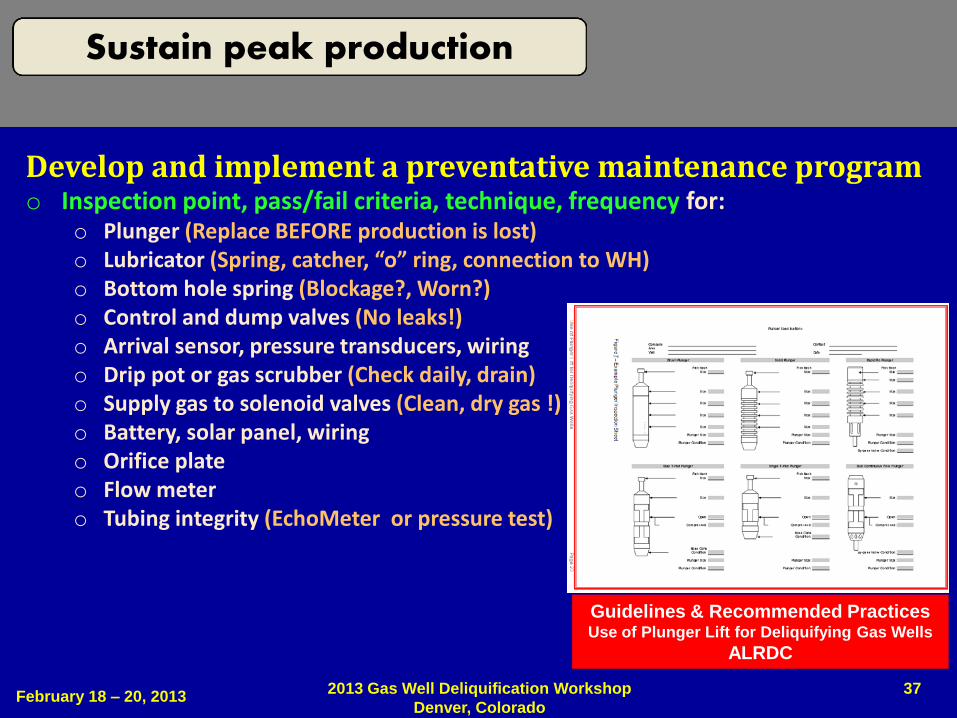
Develop and implement a preventative maintenance program o Inspection point, pass/fail criteria, technique, frequency for:
o Plunger (Replace BEFORE production is lost) o Lubricator (Spring, catcher, “o” ring, connection to WH) o Bottom hole spring (Blockage?, Worn?) o Control and dump valves (No leaks!) o Arrival sensor, pressure transducers, wiring o Drip pot or gas scrubber (Check daily, drain) o Supply gas to solenoid valves (Clean, dry gas !) o Battery, solar panel, wiring o Orifice plate o Flow meter o Tubing integrity (EchoMeter or pressure test)
Sustain peak production
37 February 18 – 20, 2013
2013 Gas Well Deliquification Workshop
Denver, Colorado
Guidelines & Recommended Practices Use of Plunger Lift for Deliquifying Gas Wells
ALRDC
Linkedin Group
“Plunger Lifted Gas Wells”
Sustain peak production
38 February 18 – 20, 2013
2013 Gas Well Deliquification Workshop
Denver, Colorado
“Good To Great: Why Some Companies Make the Leap …. And Others Don’t”
by Jim Collins
“Problems are nuggets to be
mined, not garbage to be
buried”
Copyright
Rights to this presentation are owned by the company(ies) and/or author(s) listed on the title page. By submitting this presentation to the Gas Well Deliquification Workshop, they grant to the Workshop, the Artificial Lift Research and Development Council (ALRDC), and the Southwestern Petroleum Short Course (SWPSC), rights to:
– Display the presentation at the Workshop.
– Place it on the www.alrdc.com web site, with access to the site to be as directed by the Workshop Steering Committee.
– Place it on a CD for distribution and/or sale as directed by the Workshop Steering Committee.
Other use of this presentation is prohibited without the expressed written permission of the author(s). The owner company(ies) and/or author(s) may publish this material in other journals or magazines if they refer to the Gas Well Deliquification Workshop where it was first presented.
Disclaimer
The following disclaimer shall be included as the last page of a Technical Presentation or Continuing Education Course. A similar disclaimer is included on the front page of the Gas Well Deliquification Web Site.
The Artificial Lift Research and Development Council and its officers and trustees, and the Gas Well Deliquification Workshop Steering Committee members, and their supporting organizations and companies (here-in-after referred to as the Sponsoring Organizations), and the author(s) of this Technical Presentation or Continuing Education Training Course and their company(ies), provide this presentation and/or training material at the Gas Well Deliquification Workshop "as is" without any warranty of any kind, express or implied, as to the accuracy of the information or the products or services referred to by any presenter (in so far as such warranties may be excluded under any relevant law) and these members and their companies will not be liable for unlawful actions and any losses or damage that may result from use of any presentation as a consequence of any inaccuracies in, or any omission from, the information which therein may be contained.
The views, opinions, and conclusions expressed in these presentations and/or training materials are those of the author and not necessarily those of the Sponsoring Organizations. The author is solely responsible for the content of the materials.
The Sponsoring Organizations cannot and do not warrant the accuracy of these documents beyond the source documents, although we do make every attempt to work from authoritative sources. The Sponsoring Organizations provide these presentations and/or training materials as a service. The Sponsoring Organizations make no representations or warranties, express or implied, with respect to the presentations and/or training materials, or any part thereof, including any warrantees of title, non-infringement of copyright or patent rights of others, merchantability, or fitness or suitability for any purpose.