Embed Size (px)
Citation preview
Calhoun: The NPS Institutional Archive
Theses and Dissertations Thesis Collection
2005-03
Optimizing cost versus time shipping of U.S. Navy
retrograde materiel
Colbert, Charles W.
Monterey California. Naval Postgraduate School
http://hdl.handle.net/10945/2303

NAVAL
POSTGRADUATE SCHOOL
MONTEREY, CALIFORNIA
THESIS
Approved for public release; distribution is unlimited
OPTIMIZING COST VERSUS TIME SHIPPING OF U.S. NAVY RETROGRADE MATERIEL
by
Charles W. Colbert
March 2005
Thesis Advisor: Robert F. Dell Second Reader: Johannes O. Royset
i
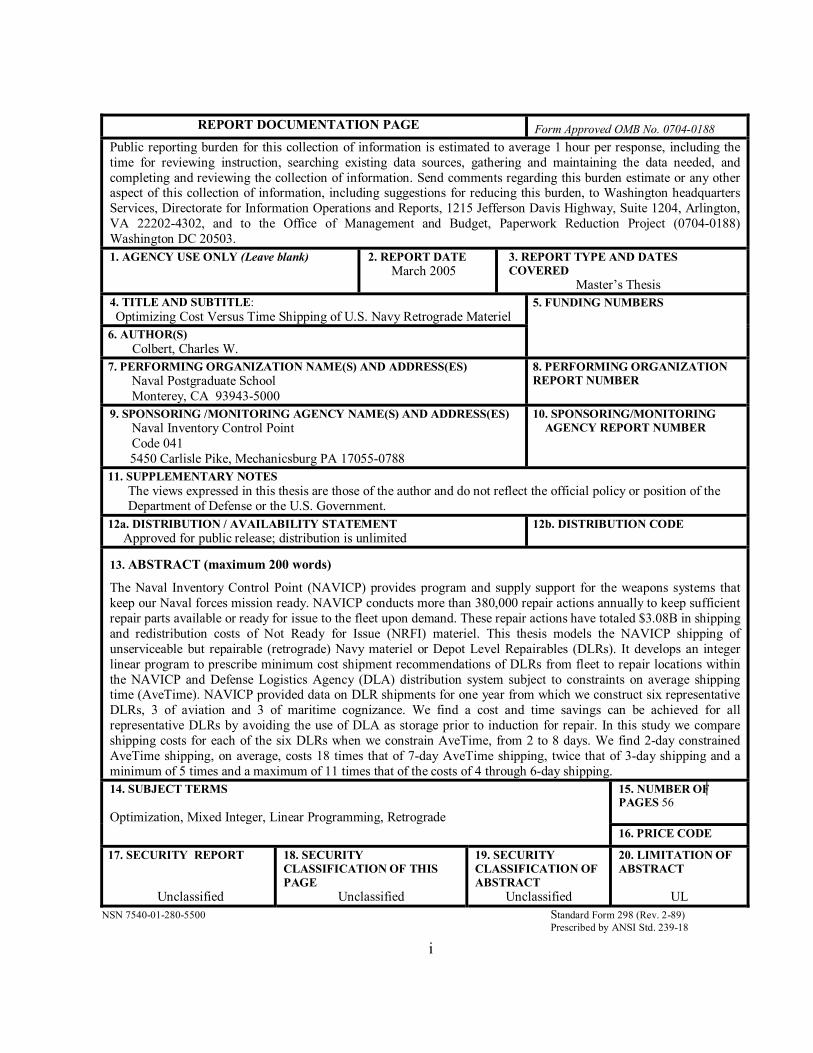
REPORT DOCUMENTATION PAGE Form Approved OMB No. 0704-0188
Public reporting burden for this collection of information is estimated to average 1 hour per response, including the time for reviewing instruction, searching existing data sources, gathering and maintaining the data needed, and completing and reviewing the collection of information. Send comments regarding this burden estimate or any other aspect of this collection of information, including suggestions for reducing this burden, to Washington headquarters Services, Directorate for Information Operations and Reports, 1215 Jefferson Davis Highway, Suite 1204, Arlington, VA 22202-4302, and to the Office of Management and Budget, Paperwork Reduction Project (0704-0188) Washington DC 20503. 1. AGENCY USE ONLY (Leave blank)
2. REPORT DATE March 2005
3. REPORT TYPE AND DATES COVERED
Master’s Thesis 4. TITLE AND SUBTITLE:
Optimizing Cost Versus Time Shipping of U.S. Navy Retrograde Materiel 6. AUTHOR(S) Colbert, Charles W.
5. FUNDING NUMBERS
7. PERFORMING ORGANIZATION NAME(S) AND ADDRESS(ES) Naval Postgraduate School Monterey, CA 93943-5000
8. PERFORMING ORGANIZATION REPORT NUMBER
9. SPONSORING /MONITORING AGENCY NAME(S) AND ADDRESS(ES) Naval Inventory Control Point Code 041
5450 Carlisle Pike, Mechanicsburg PA 17055-0788
10. SPONSORING/MONITORING AGENCY REPORT NUMBER
11. SUPPLEMENTARY NOTES The views expressed in this thesis are those of the author and do not reflect the official policy or position of the Department of Defense or the U.S. Government. 12a. DISTRIBUTION / AVAILABILITY STATEMENT Approved for public release; distribution is unlimited
12b. DISTRIBUTION CODE
13. ABSTRACT (maximum 200 words)
The Naval Inventory Control Point (NAVICP) provides program and supply support for the weapons systems that keep our Naval forces mission ready. NAVICP conducts more than 380,000 repair actions annually to keep sufficient repair parts available or ready for issue to the fleet upon demand. These repair actions have totaled $3.08B in shipping and redistribution costs of Not Ready for Issue (NRFI) materiel. This thesis models the NAVICP shipping of unserviceable but repairable (retrograde) Navy materiel or Depot Level Repairables (DLRs). It develops an integer linear program to prescribe minimum cost shipment recommendations of DLRs from fleet to repair locations within the NAVICP and Defense Logistics Agency (DLA) distribution system subject to constraints on average shipping time (AveTime). NAVICP provided data on DLR shipments for one year from which we construct six representative DLRs, 3 of aviation and 3 of maritime cognizance. We find a cost and time savings can be achieved for all representative DLRs by avoiding the use of DLA as storage prior to induction for repair. In this study we compare shipping costs for each of the six DLRs when we constrain AveTime, from 2 to 8 days. We find 2-day constrained AveTime shipping, on average, costs 18 times that of 7-day AveTime shipping, twice that of 3-day shipping and a minimum of 5 times and a maximum of 11 times that of the costs of 4 through 6-day shipping.
15. NUMBER OF PAGES 56
14. SUBJECT TERMS Optimization, Mixed Integer, Linear Programming, Retrograde
16. PRICE CODE
17. SECURITY REPORT
Unclassified
18. SECURITY CLASSIFICATION OF THIS PAGE
Unclassified
19. SECURITY CLASSIFICATION OF ABSTRACT
Unclassified
20. LIMITATION OF ABSTRACT
UL
NSN 7540-01-280-5500 Standard Form 298 (Rev. 2-89) Prescribed by ANSI Std. 239-18

ii
THIS PAGE INTENTIONALLY LEFT BLANK

iii
Approved for public release; distribution is unlimited
OPTIMIZING COST VERSUS TIME SHIPPING OF U.S. NAVY RETROGRADE MATERIEL
Charles W. Colbert
Lieutenant Commander, Supply Corps, United States Navy B.A, Hampton University, 1992
Submitted in partial fulfillment of the
requirements for the degree of
MASTER OF SCIENCE IN OPERATIONS RESEARCH
from the
NAVAL POSTGRADUATE SCHOOL March 2005
Author: Charles W. Colbert Approved by: Robert F. Dell
Thesis Advisor
Johannes O. Royset Second Reader James Eagle Chairman, Department of Operations Research

iv
THIS PAGE INTENTIONALLY LEFT BLANK
v
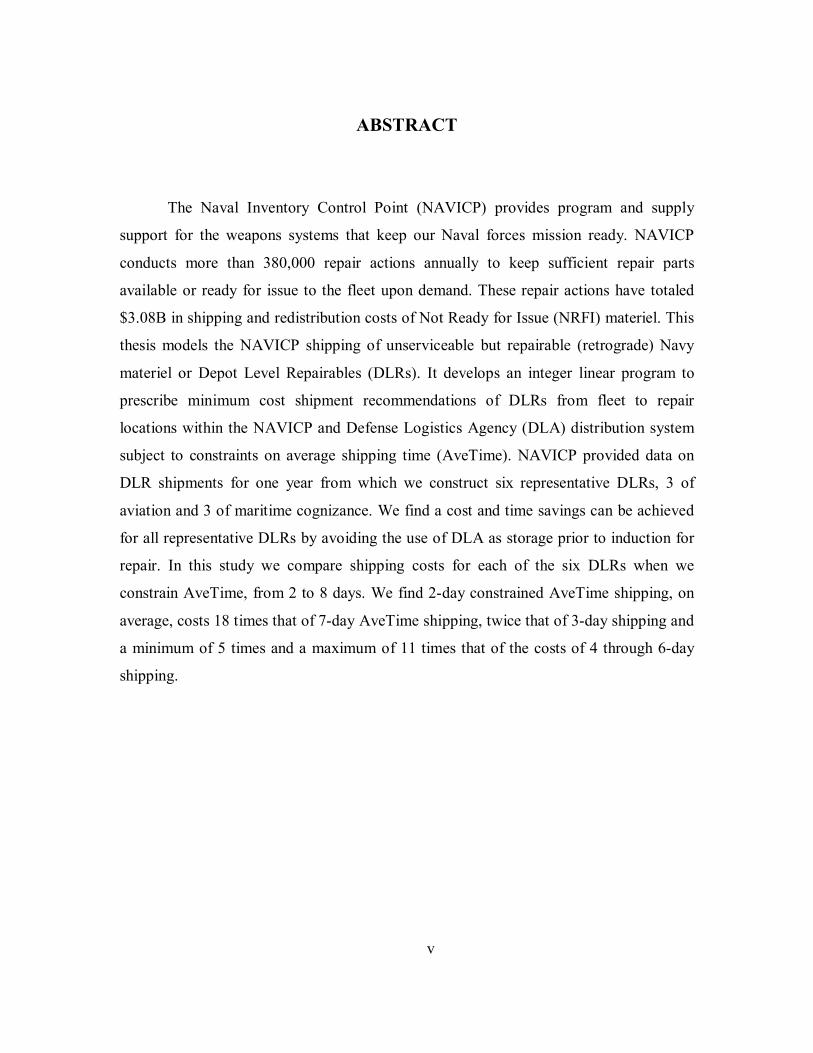
ABSTRACT
The Naval Inventory Control Point (NAVICP) provides program and supply
support for the weapons systems that keep our Naval forces mission ready. NAVICP
conducts more than 380,000 repair actions annually to keep sufficient repair parts
available or ready for issue to the fleet upon demand. These repair actions have totaled
$3.08B in shipping and redistribution costs of Not Ready for Issue (NRFI) materiel. This
thesis models the NAVICP shipping of unserviceable but repairable (retrograde) Navy
materiel or Depot Level Repairables (DLRs). It develops an integer linear program to
prescribe minimum cost shipment recommendations of DLRs from fleet to repair
locations within the NAVICP and Defense Logistics Agency (DLA) distribution system
subject to constraints on average shipping time (AveTime). NAVICP provided data on
DLR shipments for one year from which we construct six representative DLRs, 3 of
aviation and 3 of maritime cognizance. We find a cost and time savings can be achieved
for all representative DLRs by avoiding the use of DLA as storage prior to induction for
repair. In this study we compare shipping costs for each of the six DLRs when we
constrain AveTime, from 2 to 8 days. We find 2-day constrained AveTime shipping, on
average, costs 18 times that of 7-day AveTime shipping, twice that of 3-day shipping and
a minimum of 5 times and a maximum of 11 times that of the costs of 4 through 6-day
shipping.

vi
THIS PAGE INTENTIONALLY LEFT BLANK

vii
TABLE OF CONTENTS
I. INTRODUCTION .................................................................................1 A. THESIS OUTLINE ......................................................................................1 B. OVERVIEW OF NAVY RETROGRADE INVENTORY SYSTEM.........1
1. Naval Supply Systems Command (NAVSUP) .................................2 2. Naval Inventory Control Point (NAVICP) ......................................2 3. Repairables Management (UICP Database)....................................3 4. Defense Logistics Agency (DLA) ......................................................4 5. Advance Traceability and Control (ATAC) ....................................5
C. CURRENT ISSUE........................................................................................6 D. OVERVIEW OF RETROGRADE NETWORK.........................................7
1. Ships/Naval Stations/End Users (Node Type 1)...............................8 2. ATAC Nodes (Node Type 2).............................................................8 3. ATAC Hubs (Node Type 3) ..............................................................8 4. DLA Depots (Node Type 4) ..............................................................9 5. Overhaul/Repair Facilities (Node Type 5) .....................................10
II. RELATED STUDIES ..........................................................................11 A. PREVIOUS STUDIES OF DISTRIBUTION NETWORKS....................11
1. DLA Related ...................................................................................11 2. NAVICP Related.............................................................................12 3. Other Studies ..................................................................................13
III. OPTIMIZATION MODEL.................................................................15 A. INTEGER LINEAR PROGRAM..............................................................15 B. DESCRIPTION OF EQUATIONS............................................................16
IV. COMPUTATIONAL EXPERIENCE.................................................19 A. DATA CHARACTERISTICS AND ASSUMPTIONS .............................19
1. Database..........................................................................................19 2. Transportation Methods, Times and Costs....................................19
a. Air Mobility Command (AMC) ..........................................20 b. FEDEX.................................................................................20 c. DLA Contract Ground Shipping ........................................20
B. DATABASE COMPLETION ....................................................................21 C. REPRESENTATIVE ITEMS AND NETWORK CONSTRAINTS ........24 D. RESULTS ...................................................................................................26
V. CONCLUSIONS AND RECOMMENDATIONS..............................33
LIST OF REFERENCES ..............................................................................35
INITIAL DISTRIBUTION LIST..................................................................37

viii
THIS PAGE INTENTIONALLY LEFT BLANK

ix
LIST OF FIGURES
Figure 1.1: Naval Supply System Command Team...........................................................2 Figure 1.2: Navy Repairables Management Cycle ............................................................3 Figure 1.3: Listing of 25 DLA’s Distribution Depot locations ..........................................5 Figure 1.4 Shows all 18 worldwide locations of the ATAC system..................................6 Figure 1.5: NAVICP retrograde distribution network for aviation and maritime
materiel. .........................................................................................................7 Figure 1.6: DLR shipping from an ATAC to a DDD or a DOP.........................................8 Figure 1.7: Map Of DLA’s Defense Distribution Depot Locations ...................................9 Figure 1.8: Picture of NRFI DLRs at a DDD prior to shipment to a DOP for repair. .........9 Figure 4.1: Snapshot of raw data from database received from NAVICP. .......................21 Figure 4.2: Snapshot data after conversion into MS Access for population. ....................22 Figure 4.3: Websites used to find network data...............................................................23 Figure 4.4: AvgTime shipping costs of a T56 Turbo Prop Nozzle Assembly through
network. .......................................................................................................26 Figure 4.5: AvgTime shipping costs of a Helo Pressure Indicator through network.........28 Figure 4.6: AvgTime shipping costs of an Electronic Warfare Housing Assembly
through network. ..........................................................................................29 Figure 4.7: AvgTime shipping costs of an AC Motor through network...........................30 Figure 4.8: AvgTime shipping costs of a Circuit Card Assembly through network. ........31 Figure 4.9: AvgTime shipping costs of a Communications Antenna through network.....32

x
THIS PAGE INTENTIONALLY LEFT BLANK
xi
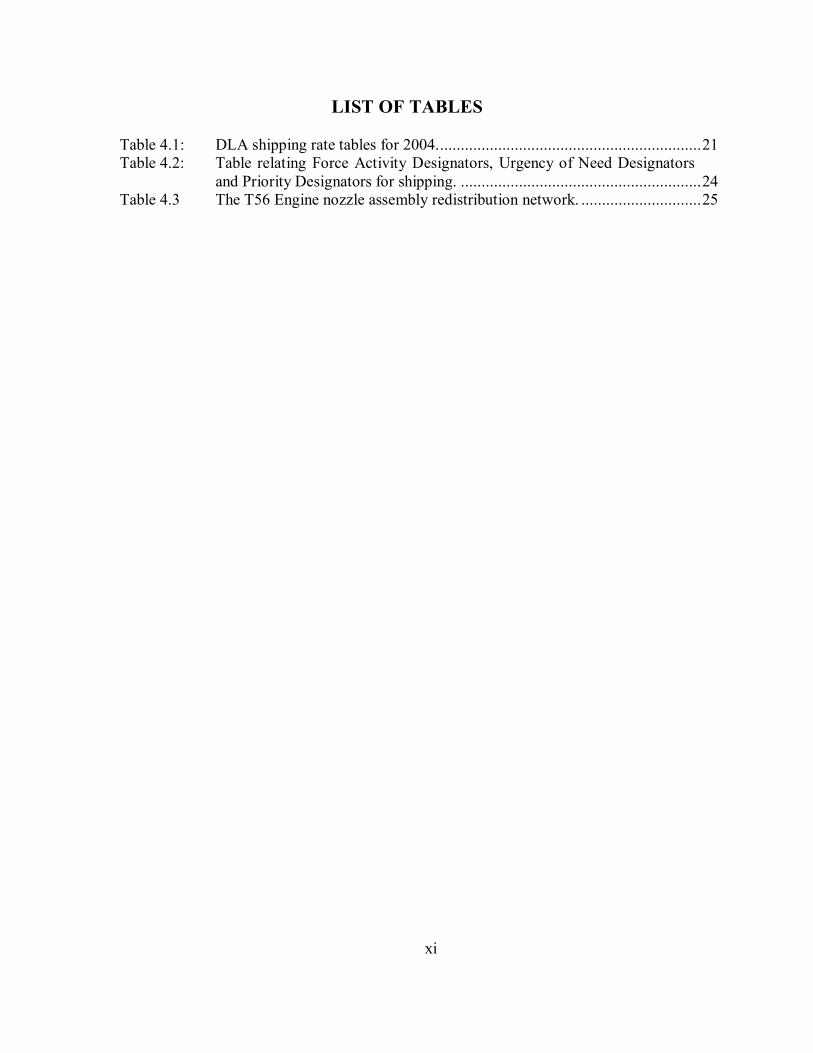
LIST OF TABLES
Table 4.1: DLA shipping rate tables for 2004................................................................21 Table 4.2: Table relating Force Activity Designators, Urgency of Need Designators
and Priority Designators for shipping. ..........................................................24 Table 4.3 The T56 Engine nozzle assembly redistribution network. .............................25

xii
THIS PAGE INTENTIONALLY LEFT BLANK
xiii
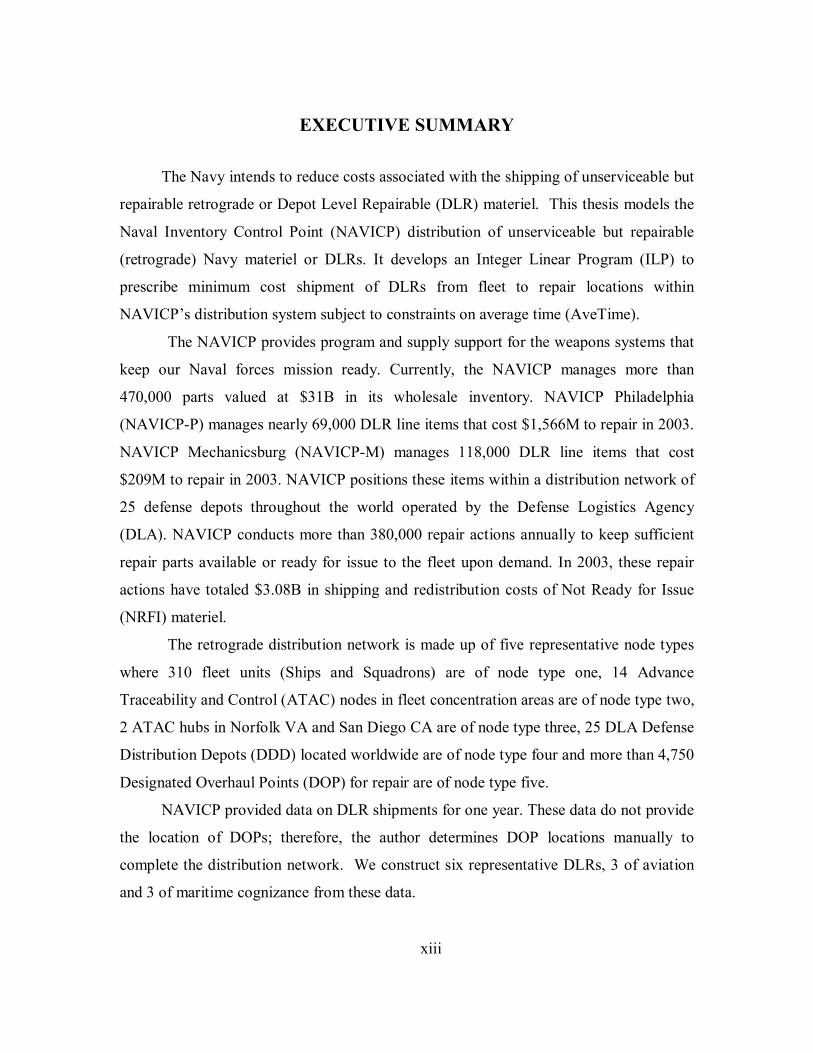
EXECUTIVE SUMMARY
The Navy intends to reduce costs associated with the shipping of unserviceable but
repairable retrograde or Depot Level Repairable (DLR) materiel. This thesis models the
Naval Inventory Control Point (NAVICP) distribution of unserviceable but repairable
(retrograde) Navy materiel or DLRs. It develops an Integer Linear Program (ILP) to
prescribe minimum cost shipment of DLRs from fleet to repair locations within
NAVICP’s distribution system subject to constraints on average time (AveTime).
The NAVICP provides program and supply support for the weapons systems that
keep our Naval forces mission ready. Currently, the NAVICP manages more than
470,000 parts valued at $31B in its wholesale inventory. NAVICP Philadelphia
(NAVICP-P) manages nearly 69,000 DLR line items that cost $1,566M to repair in 2003.
NAVICP Mechanicsburg (NAVICP-M) manages 118,000 DLR line items that cost
$209M to repair in 2003. NAVICP positions these items within a distribution network of
25 defense depots throughout the world operated by the Defense Logistics Agency
(DLA). NAVICP conducts more than 380,000 repair actions annually to keep sufficient
repair parts available or ready for issue to the fleet upon demand. In 2003, these repair
actions have totaled $3.08B in shipping and redistribution costs of Not Ready for Issue
(NRFI) materiel.
The retrograde distribution network is made up of five representative node types
where 310 fleet units (Ships and Squadrons) are of node type one, 14 Advance
Traceability and Control (ATAC) nodes in fleet concentration areas are of node type two,
2 ATAC hubs in Norfolk VA and San Diego CA are of node type three, 25 DLA Defense
Distribution Depots (DDD) located worldwide are of node type four and more than 4,750
Designated Overhaul Points (DOP) for repair are of node type five.
NAVICP provided data on DLR shipments for one year. These data do not provide
the location of DOPs; therefore, the author determines DOP locations manually to
complete the distribution network. We construct six representative DLRs, 3 of aviation
and 3 of maritime cognizance from these data.
xiv
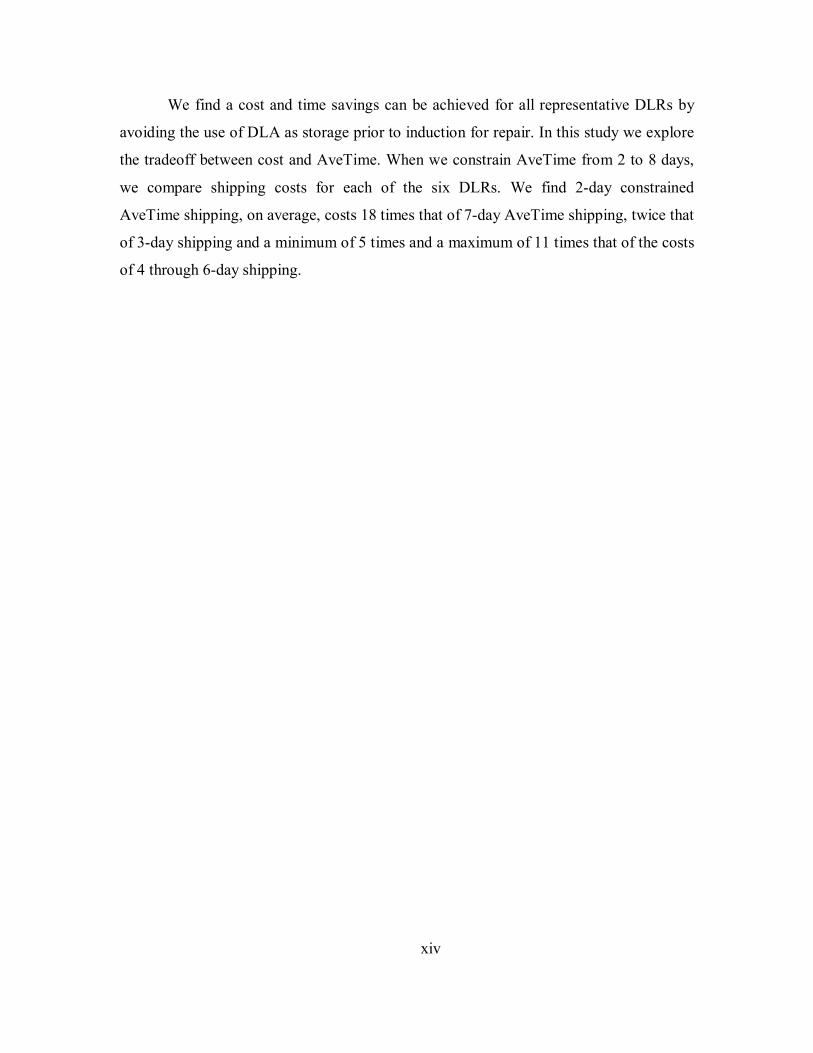
We find a cost and time savings can be achieved for all representative DLRs by
avoiding the use of DLA as storage prior to induction for repair. In this study we explore
the tradeoff between cost and AveTime. When we constrain AveTime from 2 to 8 days,
we compare shipping costs for each of the six DLRs. We find 2-day constrained
AveTime shipping, on average, costs 18 times that of 7-day AveTime shipping, twice that
of 3-day shipping and a minimum of 5 times and a maximum of 11 times that of the costs
of 4 through 6-day shipping.
xv
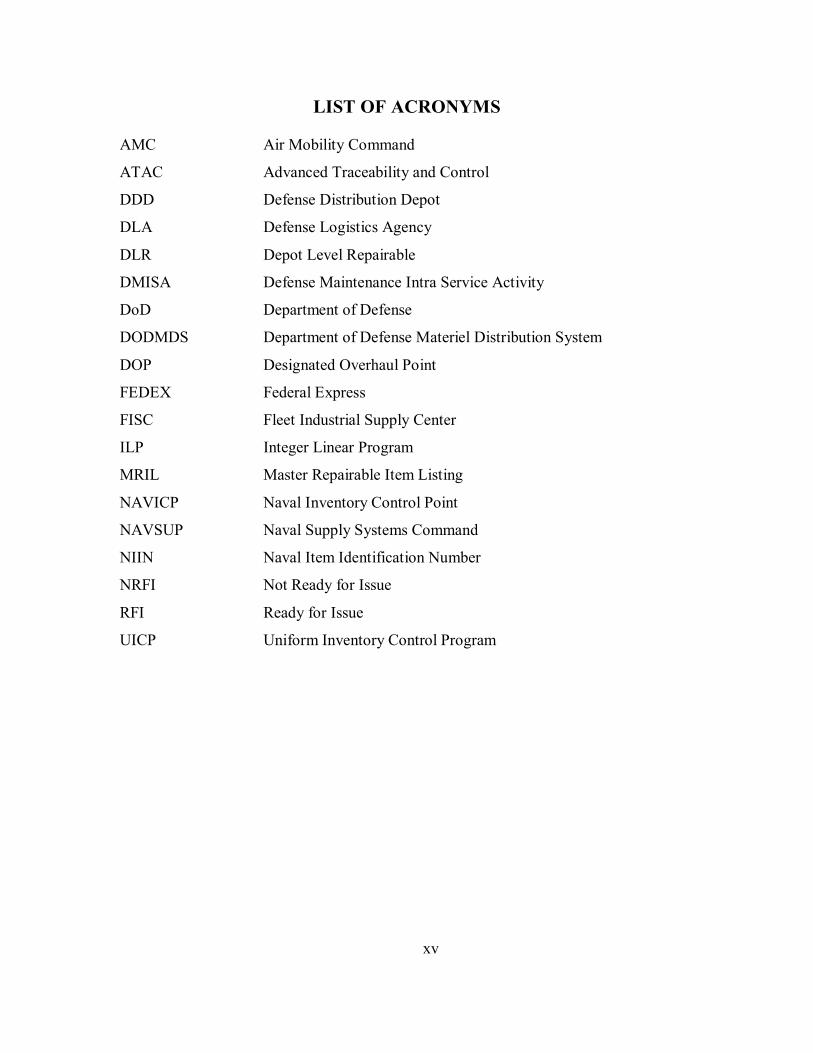
LIST OF ACRONYMS AMC Air Mobility Command
ATAC Advanced Traceability and Control
DDD Defense Distribution Depot
DLA Defense Logistics Agency
DLR Depot Level Repairable
DMISA Defense Maintenance Intra Service Activity
DoD Department of Defense
DODMDS Department of Defense Materiel Distribution System
DOP Designated Overhaul Point
FEDEX Federal Express
FISC Fleet Industrial Supply Center
ILP Integer Linear Program
MRIL Master Repairable Item Listing
NAVICP Naval Inventory Control Point
NAVSUP Naval Supply Systems Command
NIIN Naval Item Identification Number
NRFI Not Ready for Issue
RFI Ready for Issue
UICP Uniform Inventory Control Program

xvi
THIS PAGE INTENTIONALLY LEFT BLANK

xvii
ACKNOWLEDGMENTS I am thankful to Professor Robert Dell, CDR Glenn Lintz and Professor Johannes
Royset, U.S. Naval Postgraduate School for their unwavering support and academic
contributions throughout the thesis topic development, research, model formulation,
computation of data and proofreading processes which enabled the publication of this
product.
I would like to thank the officers of NAVICP Mechanicsburg and Philadelphia:
CAPT Joe Kenny, CDR Kent Michaelis, CDR Aaron Stanley, CDR Doug Noble, LCDR
Jonathan Haynes, LCDR Eric Schoh. Additionally the following NAVICP personnel
were instrumental in providing logistical support during my thesis tour in acquiring the
data set(s) used for this analysis: Deborah Thompson (ICP-M041), Beverly Thomas,
Steven Enck, Louis Koplin, Robert Sax and Keith MacMillian.
I would also like to thank my mother, my wife Carrie and family for their
encouragement and moral support throughout my studies at the Naval Postgraduate
School.

xviii
THIS PAGE INTENTIONALLY LEFT BLANK

1
I. INTRODUCTION
The Naval Inventory Control Point (NAVICP) provides program and supply
support for the weapons systems that keep U.S. Naval forces mission ready. Currently,
the NAVICP manages more than 470,000 parts valued at $31 billion in its wholesale
inventory. Nearly 190,000 of those parts are Depot Level Repairable (DLR) worth $23
billion [NAVICP, 2004a]. NAVICP stores these items using a distribution network of 25
Defense Distribution Depots (DDDs) throughout the world operated by the Defense
Logistics Agency (DLA). NAVICP contracts for repairs of more than 380,000 parts
annually to keep sufficient parts available or ready for issue (RFI) to the fleet upon
demand. These repair actions have totaled $3.08B in shipping and redistribution costs
[Smoak, 2004].
A. THESIS OUTLINE
This thesis models the NAVICP distribution system of unserviceable but
repairable Navy DLRs requiring more than 384,000 repair actions from June 2003 to
May 2004. It develops an Integer Linear Program (ILP) to help recommend the best way
to ship retrograde materiel.
The remaining parts of this chapter present an overview of the DLA and Navy
inventory management system. Chapter II addresses related U.S. military and commercial
studies of distribution systems. Chapter III introduces the ILP model. Chapter IV
highlights the computational experience and includes characteristics of the test data set
used for this analysis. Chapter V provides conclusions and recommendations.
B. OVERVIEW OF NAVY RETROGRADE INVENTORY SYSTEM
This section contains basic information regarding the Naval Retrograde Inventory
System. The system is made up of five entities: (1) the Naval Supply Systems Command
(NAVSUP), (2) the NAVICP organization and (3) its Repairables Management program,
(4) the 25 DLA DDDs that provide storage prior to induction into a Designated Overhaul
2
Point (DOP) for repair and (5) the Advanced Traceability and Control (ATAC)
organization that streamlines the DLR returns to the repair cycle.
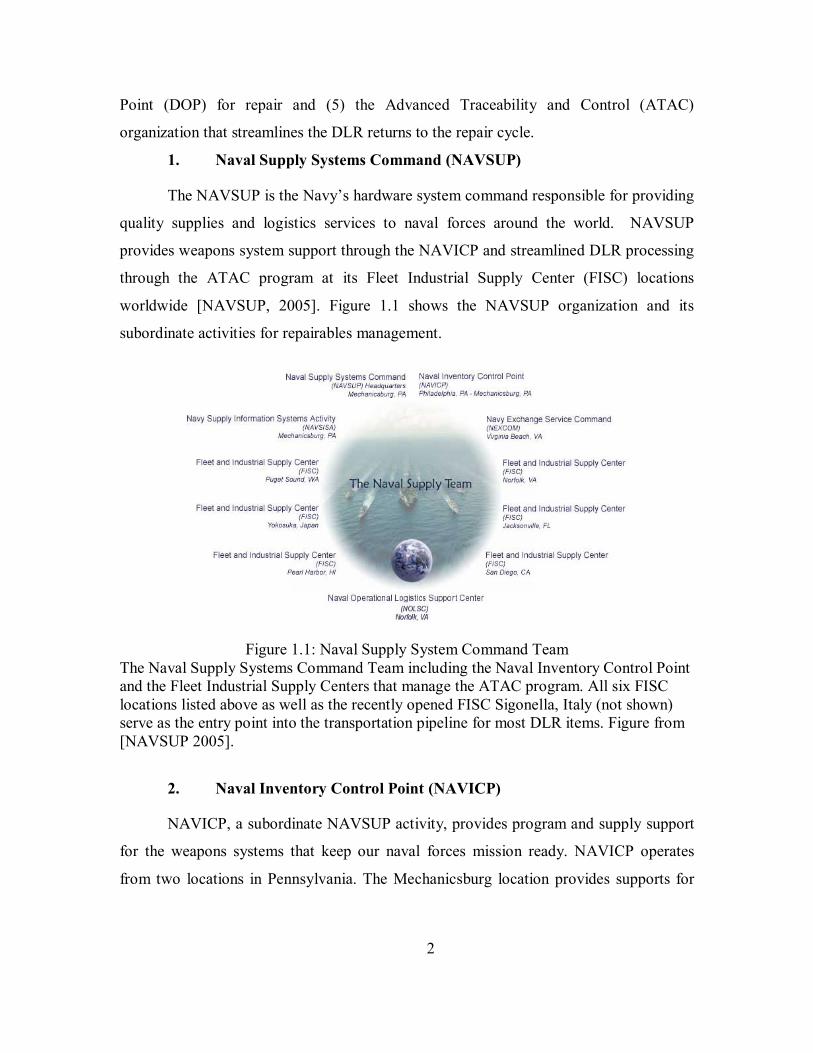
1. Naval Supply Systems Command (NAVSUP)
The NAVSUP is the Navy’s hardware system command responsible for providing
quality supplies and logistics services to naval forces around the world. NAVSUP
provides weapons system support through the NAVICP and streamlined DLR processing
through the ATAC program at its Fleet Industrial Supply Center (FISC) locations
worldwide [NAVSUP, 2005]. Figure 1.1 shows the NAVSUP organization and its
subordinate activities for repairables management.
Figure 1.1: Naval Supply System Command Team
The Naval Supply Systems Command Team including the Naval Inventory Control Point and the Fleet Industrial Supply Centers that manage the ATAC program. All six FISC locations listed above as well as the recently opened FISC Sigonella, Italy (not shown) serve as the entry point into the transportation pipeline for most DLR items. Figure from [NAVSUP 2005].
2. Naval Inventory Control Point (NAVICP)
NAVICP, a subordinate NAVSUP activity, provides program and supply support
for the weapons systems that keep our naval forces mission ready. NAVICP operates
from two locations in Pennsylvania. The Mechanicsburg location provides supports for
3
maritime parts and Philadelphia provides support for aviation parts. A supply corps Rear
Admiral serves as the commander of both locations [NAVICP, 2004b].
NAVICP, the Navy’s only inventory control point, maintains worldwide control
and visibility over Navy wholesale stock. NAVICP manages more than 470,000 line
items valued at more than $31B. NAVICP Philadelphia (NAVICP-P) manages nearly
69,000 DLR line items that cost $1,566M to repair in 2003 [NAVICP, 2004b]. NAVICP
Mechanicsburg (NAVICP-M) manages 118,000 DLR line items that cost $209M to
repair in 2003 [Haynes, 2004].
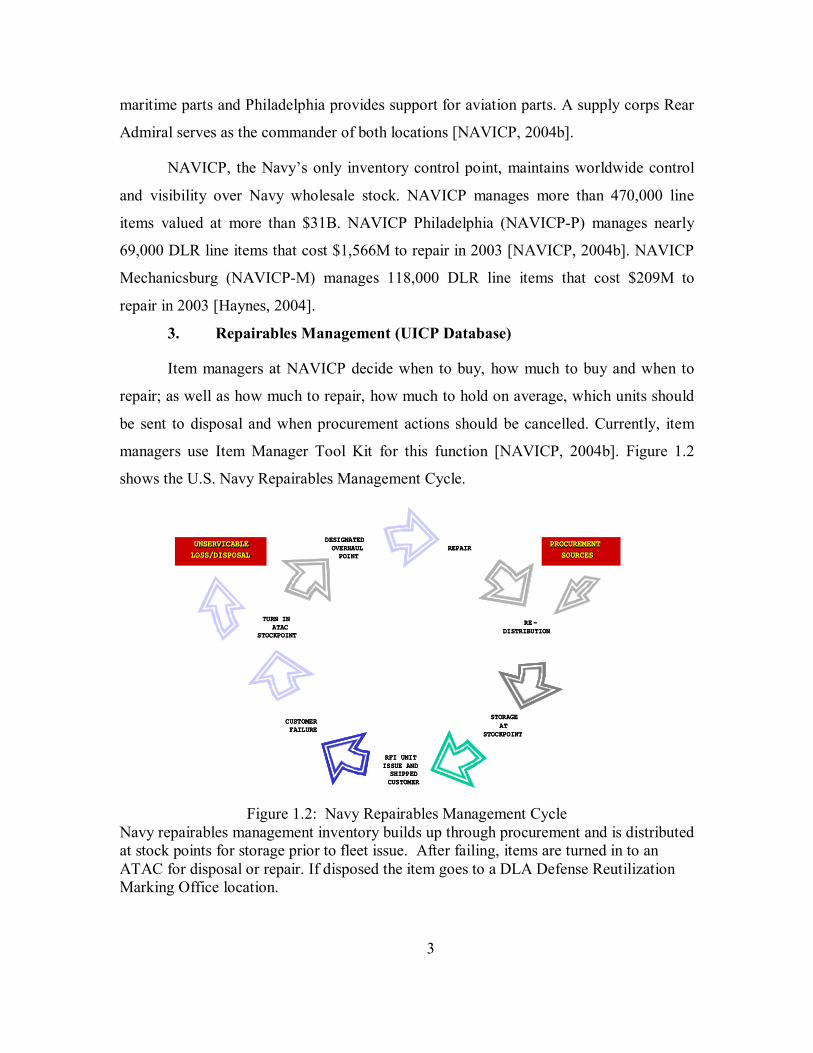
3. Repairables Management (UICP Database)
Item managers at NAVICP decide when to buy, how much to buy and when to
repair; as well as how much to repair, how much to hold on average, which units should
be sent to disposal and when procurement actions should be cancelled. Currently, item
managers use Item Manager Tool Kit for this function [NAVICP, 2004b]. Figure 1.2
shows the U.S. Navy Repairables Management Cycle.
DESIGNATED OVERHAULPOINT
TURN IN ATAC
STOCKPOINT
CUSTOMER FAILURE
RFI UNIT ISSUE AND SHIPPEDCUSTOMER
STORAGEAT
STOCKPOINT
RE-DISTRIBUTION
REPAIRUNSERVICABLE UNSERVICABLE LOSS/DISPOSAL LOSS/DISPOSAL
PROCUREMENTPROCUREMENTSOURCES SOURCES
DESIGNATED OVERHAULPOINT
TURN IN ATAC
STOCKPOINT
CUSTOMER FAILURE
RFI UNIT ISSUE AND SHIPPEDCUSTOMER
STORAGEAT
STOCKPOINT
RE-DISTRIBUTION
REPAIRUNSERVICABLE UNSERVICABLE LOSS/DISPOSAL LOSS/DISPOSAL
PROCUREMENTPROCUREMENTSOURCES SOURCES
Figure 1.2: Navy Repairables Management Cycle
Navy repairables management inventory builds up through procurement and is distributed at stock points for storage prior to fleet issue. After failing, items are turned in to an ATAC for disposal or repair. If disposed the item goes to a DLA Defense Reutilization Marking Office location.

4
Item managers use the Uniform Inventory Control Program (UICP) in conjunction
with Item Manager Tool Kit to determine repair workload levels. Workload forecasting
and emergent requirements at DOPs serve as the driving factors for shipping and
redistributions of retrograde materiel prior to repair. The UICP minimizes the annual
variable cost equation composed of ordering costs, holding costs and shortage costs
[NAVSUP, 1992]. “UICP is a highly automated, integrated system that, except for
provisioning, provides automated applications software support for nearly the full range
of NAVICP functions, including procurement and financial control” [NAVSUP, 1996].
4. Defense Logistics Agency (DLA)
The DDDs of DLA provide a single, unified materiel distribution system for the
Department of Defense (DoD) under DLA management. The DDD located in New
Cumberland, Pennsylvania is the lead center of the 25 DDD around the world. The DDDs
store 4.0 million stock numbers in 327 million square feet of storage space and process
over 23 million transactions annually. Clothing and textiles, electronics, industrial,
general and construction supplies, subsistence, medical materiel and the military services’
principle end items are among the commodities for which DLA is responsible.
Responsibilities include receipt, storage, issue, packing, preservation, worldwide
transportation, in transit visibility and redirecting enroute of all items placed under its
accountability by the DLA and the military services. Figure 1.3 lists the names of the
DDDs worldwide. [DLA, 2005]

5
Figure 1.3: Listing of 25 DLA’s Distribution Depot locations
5. Advance Traceability and Control (ATAC)
Developed in 1985, the ATAC system was implemented to minimize system
design losses of failed DLRs or retrograde items and streamlines carcass return for these
items [Ships Parts Control Center, 1994]. Specifically, ATAC hubs and nodes serve as
the Navy centralized transportation system of Navy DLRs. ATAC provides tracking of
retrograde DLRs returned to the supply system as an exchange for RFI materiel or as
turn-ins for credit [NAVSUP, 1999].
ATAC is the Navy's first logistics pipeline to couple logistics and transportation
into a single physical distribution system. DLRs are collected, identified, packed, and
shipped from the Hub and satellite locations, known as nodes, where fleet activities are
concentrated. [NAVSUP, 2005]
Prior to shipment, using the Master Repairable Identification List (MRIL),
NAVICP determines whether to repair, stow, or dispose of the asset. DLRs to be repaired
or stowed are then shipped to the appropriate site. DLRs designated for disposal are sent
to the nearest Defense Reutilization & Marketing Office. Current ATAC policy mandates
that NRFI DLR materiel slated for repair is first sent from the end user to an ATAC for
processing and then forwarded directly to the DDD for storage at a facility adjacent to the
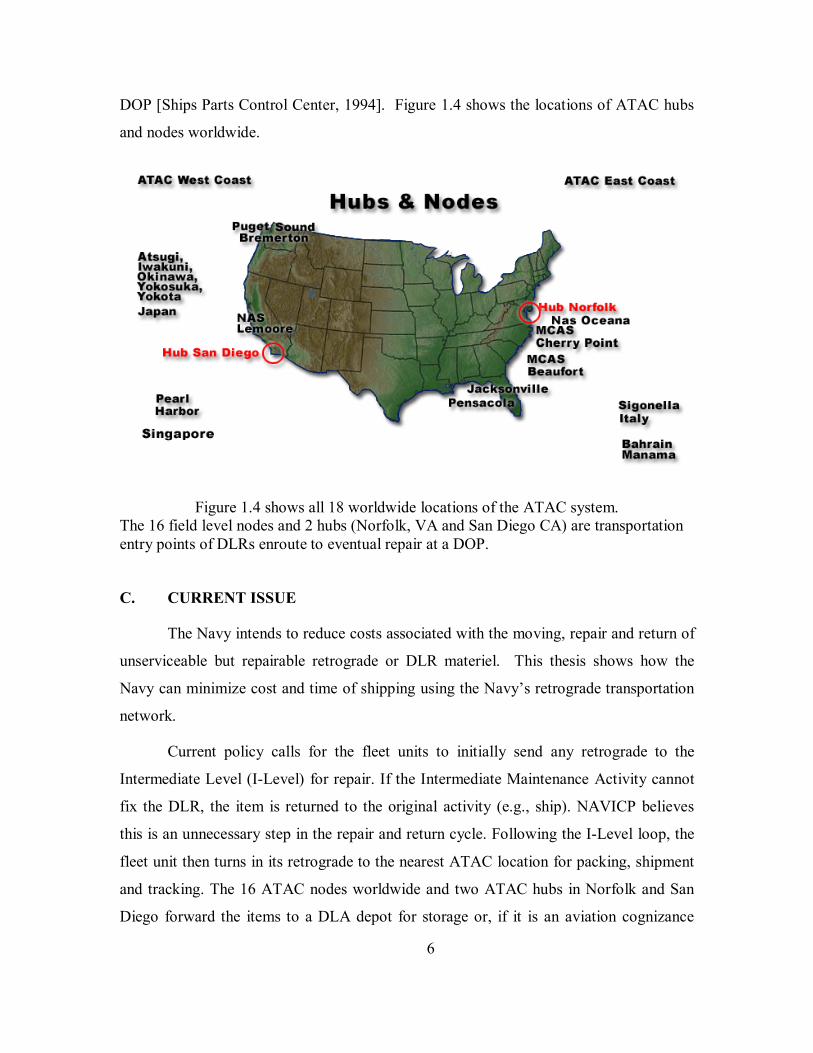
6
DOP [Ships Parts Control Center, 1994]. Figure 1.4 shows the locations of ATAC hubs
and nodes worldwide.
Figure 1.4 shows all 18 worldwide locations of the ATAC system.
The 16 field level nodes and 2 hubs (Norfolk, VA and San Diego CA) are transportation entry points of DLRs enroute to eventual repair at a DOP.
C. CURRENT ISSUE
The Navy intends to reduce costs associated with the moving, repair and return of
unserviceable but repairable retrograde or DLR materiel. This thesis shows how the
Navy can minimize cost and time of shipping using the Navy’s retrograde transportation
network.
Current policy calls for the fleet units to initially send any retrograde to the
Intermediate Level (I-Level) for repair. If the Intermediate Maintenance Activity cannot
fix the DLR, the item is returned to the original activity (e.g., ship). NAVICP believes
this is an unnecessary step in the repair and return cycle. Following the I-Level loop, the
fleet unit then turns in its retrograde to the nearest ATAC location for packing, shipment
and tracking. The 16 ATAC nodes worldwide and two ATAC hubs in Norfolk and San
Diego forward the items to a DLA depot for storage or, if it is an aviation cognizance

7
item, they forward the item directly to a designated overhaul repair facility. Most
maritime retrograde materiel remains at the nearest continental U.S. DDD owned by
DLA. The materiel is then redistributed, preferably in mass, to the DOP when a repair
requirement arises. Following D-Level maintenance, the item is deemed RFI and is then
sent to its designated DDD for eventual issuance back to the fleet operating units. Figure
1.5 summarizes the flow of retrograde materiel.
1
6 5
32
Supply DemandReviewSDR
7
4
I Level Maint (IMA)
Ship/Units
D Level Maint
Procurement
ATAC NodesWorldwide
ATAC Norfolk/San Diego
DLA (DDD) Overhaul Facility
Figure 1.5: NAVICP retrograde distribution network for aviation and maritime materiel.
Node One represents 310 ships and squadrons, node two represents one of the 16 ATAC field turn-in locations, node three represents the 2 fleet ATAC locations, node four 25 Defense Distribution Depots and node five represents the 4,726 Commercial, 21 DoD intra-service and 43 Navy (Organic) repair facilities. Not addressed in this thesis are procurement to make up for demand not met at repair facilities and I Level Maintenance (IMA) that NAVICP believes is an unnecessary step.
D. OVERVIEW OF RETROGRADE NETWORK
This study conducts analysis on cost and time transshipment within the DLR
materiel distribution network. Below is the identification and description of the DLR
retrograde network analyzed in this thesis.

8
1. Ships/Naval Stations/End Users (Node Type 1)
Node type one consists of fleet level ships, squadrons and Naval and Marine
Corps air stations.
2. ATAC Nodes (Node Type 2)
There are 14 fleet level ATAC nodes represented by node type two. ATAC nodes
are located at fleet concentration areas, USN and USMC air stations or USAF airbases
and serve as the initial receipt and transshipment points for NRFI DLR retrograde items
enroute to its eventual repair location or DOP. Figure 1.6 shows DLRs being loaded at an
ATAC for surface shipment using a DLA contracted truck for shipment to a DDD or a
DOP.
Figure 1.6: DLR shipping from an ATAC to a DDD or a DOP.
3. ATAC Hubs (Node Type 3)
There are 2 ATAC hubs that make up node type three. ATAC Hub Norfolk, VA
and ATAC Hub San Diego, CA. ATAC hubs serve as a transshipment point for DLRs
prior to the items going into storage within the DDD system or before direct induction
into for repair action at a DOP.
9
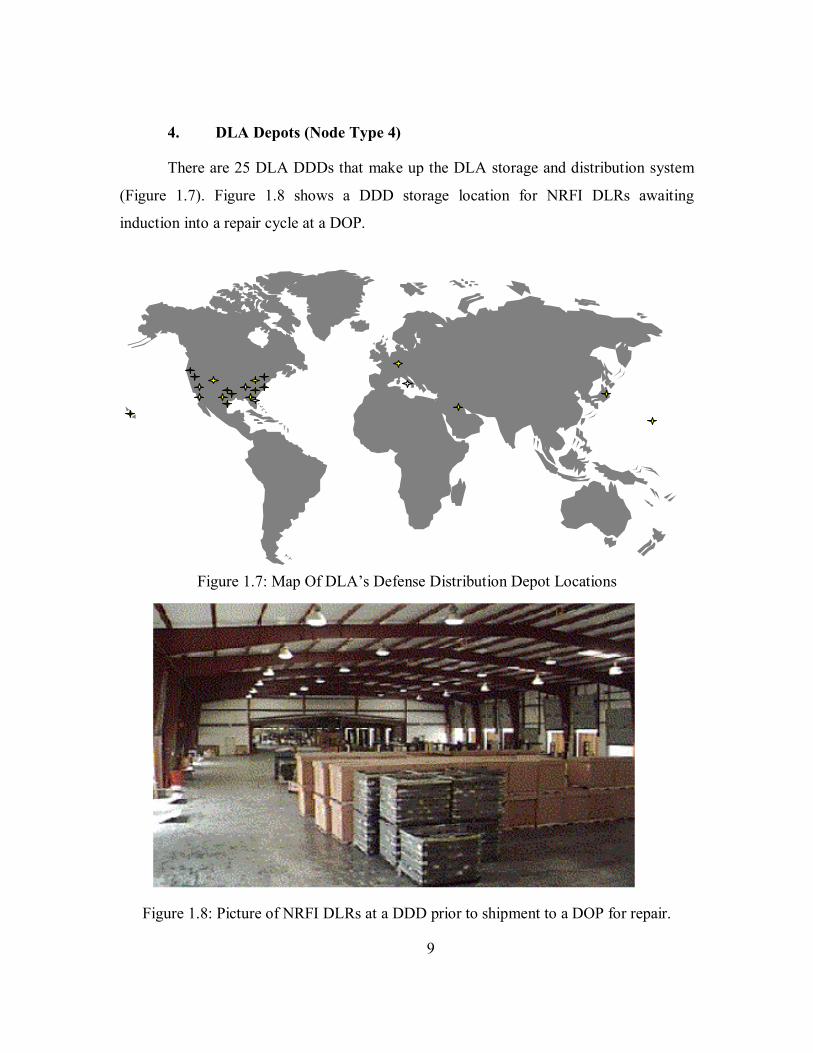
4. DLA Depots (Node Type 4)
There are 25 DLA DDDs that make up the DLA storage and distribution system
(Figure 1.7). Figure 1.8 shows a DDD storage location for NRFI DLRs awaiting
induction into a repair cycle at a DOP.
Figure 1.7: Map Of DLA’s Defense Distribution Depot Locations
Figure 1.8: Picture of NRFI DLRs at a DDD prior to shipment to a DOP for repair.
10
5. Overhaul/Repair Facilities (Node Type 5)
NAVICP operates 3 types of overhaul repair facilities. Commercial, Defense
Intra-service (DMISA) and Organic or Navy owned. DMISA facilities are U.S. military
repair facilities that operate under the four military services. For example, the T-56
turboprop engine used on the C-130 Hercules aircraft is flown by the Navy, Marine
Corps and Air Force aviation units. Consequently Hill AFB, Utah has been designated
the lead repair agent and serves as the DMISA facility designated to repair the T-56
turboprop and any of its major components. Organic overhaul locations are operated and
resourced by the U.S. Navy. Specifically, the 3 Naval Aviation Depots in North Island
CA, Cherry Point NC, and Jacksonville FL are the Navy's organic aviation overhaul
locations. Maritime organic repair sites are referred to as Ships Intermediate Maintenance
Activities. There are approximately 40 Ships Intermediate Maintenance Activities located
worldwide for the U.S. Navy. In 2004, there were 4726 commercial, 21 DMISA repair
facilities and 43 organic [NAVICP, 2004b].
11
II. RELATED STUDIES
While there are no previous studies of retrograde distribution networks, this
section presents previous studies of distribution network design for RFI materiel.
A. PREVIOUS STUDIES OF DISTRIBUTION NETWORKS
Ballou [1992] and Magae, Capacino and Rosenfield [1985] provide textbook
discussion of strategic network planning to determine the number, location, product
assignments and capacities of distribution centers or node types. In this section, we
review several DoD strategic network studies related to DLA, NAVICP and general
distribution network design.
1. DLA Related
The DODMDS study following the Vietnam War analyzed the materiel,
maintenance and storage distribution system of four military services within the
continental U.S. This study excludes perishable subsistence, industrial plant equipment,
ammunition, bulk petroleum, chemical, biological and radiological as well as major end
use items [DODMDS, 1978]. The conclusions of the study suggest major savings
upward a $100 million a year could be realized through the closures of nine depots and
repositioning of certain categories of materiel closer to its customers [DODMDS, 1978].
Supporting this conclusion are extensive studies using two models of analysis. The first a
mixed integer linear program was used to minimize depot and transportation costs. The
other a simulation model that evaluates depot capacity and responsiveness to customers
needs.
The Holmes study analyzes the DLA distribution network and proposes depot
closure candidates in order to support a 1995 budget reduction [Holmes 1994]. In 1994,
DLA operated 28 depots and supplied more than 45,000 customers with an excess of
three million products procured from 10,000 suppliers. Holmes investigates 29 aggregate
products, 113 aggregate customers and uses a commercial optimization-based decision
support system, Strategic Analysis of Integrated Logistics System, for all his analysis.
12
Reich [1999] analyzes the DLA distribution network and proposes utilizing
distribution points which are not collocated with Navy activities. Reich derives a
simplified six node transportation scheme and aggregated customers for 57 depot level
repairable items by using techniques suggested by the DODMDS and Holmes studies.
The Reich study implies that, (a) a privately owned Premium Transportation Facility is
more often the low-cost solution, (b) low weight items are not good candidates to store in
a premium transportation facility; (c) and deleting DLA depots from the network barely
affects the operating costs, while the associated customer wait time decreases
significantly. Reich suggests that NAVICP should reposition more items into premium
transportation facilities. [Reich 1999]
This study differs from the aforementioned studies in that it does not evaluate
depot capacity nor the usage of a privately owned Premium Transportation Facility in
determining optimal positioning of Navy Item Identification Numbers (NIINs).
Additionally, there is no aggregation of end users or customers.
2. NAVICP Related
Kaplan [2000] analyzes the Navy’s wholesale inventory distribution network
which operates within the DLA’s distribution network and strategic positioning of Navy
inventory with respect to meeting customer demands. Kaplan developed a heuristic
algorithm that positions 35,521 line items to serve historical requisitions by Navy units
over an 18-month period. The set includes 126 aggregated customers and 22 defense
depots. The Kaplan [2000] study utilizes demand aggregation techniques suggested by
the DODMDS and Holmes studies to reduce the scope of effort required to prepare
demand-related data.
Kaplan’s study shares much in common with the prior reviewed DLA studies. Its
focus is on satisfying RFI customer demand not on the NRFI repair as we do in this
study.
13
3. Other Studies
Within the last 25 years, many studies have been conducted on distribution
network design, including, Geoffrion [1976]; Magae, Capacino and Rosenfield [1985];
Geoffrion and Powers [1995]; Anderson Consulting [1994]. These studies propose a
variety of models to reduce costs. As with Magae, Copacino and Rosenfield [1985 p.
307], Geoffrin and Powers [1995] suggest that these studies resolve the following basic
distribution network questions:
• How many distribution centers should there be and where should they be
located?
• What size should each distribution center be and what products should it
carry?
• What distribution center (depot) should service each customer?
• Should all stocking points carry all products or specialize by product line?
• How should each plant’s output be allocated among distribution plants or
customers?
• For a given level of customer service, what is the cost savings for the
proposed system?
This study does not investigate network distribution size nor the types of products
carried. The study utilizes the DLA and NAVICP retrograde distribution network already
in place and recommends shipping based on cost and time.

14
THIS PAGE INTENTIONALLY LEFT BLANK

15
III. OPTIMIZATION MODEL
This chapter presents a model (hereafter referred to as the “ILP”) which evaluates
DLR retrograde slated for repair based on a cost versus time tradeoff within a distribution
network. The ILP determines transportation modes to use within the distribution network
to reduce the overall costs of shipment prior to repair. The model does not assume
capacity constraints for each item and there are no item interactions; therefore, each item
is run independently.
For each NIIN, costs are minimized from end users through the network to DOPs
subject to constraints on average shipping time (AveTime).
A. INTEGER LINEAR PROGRAM
Indices:
r NIINS (r = 1, 2, 3,.....80,000 items)
i,j Node (i or j = 310 shipfield unit, 14 atac nodes, 2 atac hubs, 25
defense depots, 3 designated overhaul points for each NIIN r);
m Mode of shipment (m = FEDEX 1-day, FEDEX 5-day, FEDEX
International 2-day, FEDEX International 5-day, AMC 7-day,
DLA surface 7-day)
Sets:
A Set of all arcs (i,j or j,i)
Data:
shipcostr,i,j,m Cost associated with shipping NIIN r from node i to node j using
shipment mode m.

16
shiptimer,i,j,m Time associated with shipping NIIN r from node i to node j using
shipment mode m.
br,i Demand of NIIN r at node i.
avgtimer Maximum average permitted time of shipping NIIN r from a fleet
unit to a DOP.
Nonnegative Variables:
Xr,i,j,m Units of NIIN r shipped from node i to node j by shipment mode m
for a specified NIIN.
Formulation: (For a given NIIN r)
Minimize r,i,j,m r,i,j,m(i,j) A,m
shipcost X∈∑
Subject to the following constraints:
r,j,i,m r,i,j,m r,i(j,i) A,m (i,j) A,m
X X b∈ ∈
− =∑ ∑ i∀ (1)
r,i
r,i,j,m r,i,j,m r r,i(i,j) A,m i:b 0
Shiptime X avgtime b∈ >
≤∑ ∑ (2)
r,j,i,mX 0≥ (i,j) A,m∀ ∈ (3)
B. DESCRIPTION OF EQUATIONS
The objective function evaluates the shipping costs. Constraint (1) ensures
conservation of flow at each node. Constraint (2) ensures a maximum average shipping
time through the network. Because we are evaluating a time and cost tradeoff, this

17
constraint could have been stated as a separate objective function. We elected to state it
as a constraint and vary the value of AveTime to obtain the tradeoff. Constraint (3)
ensures nonnegative flow.

18
THIS PAGE INTENTIONALLY LEFT BLANK
19
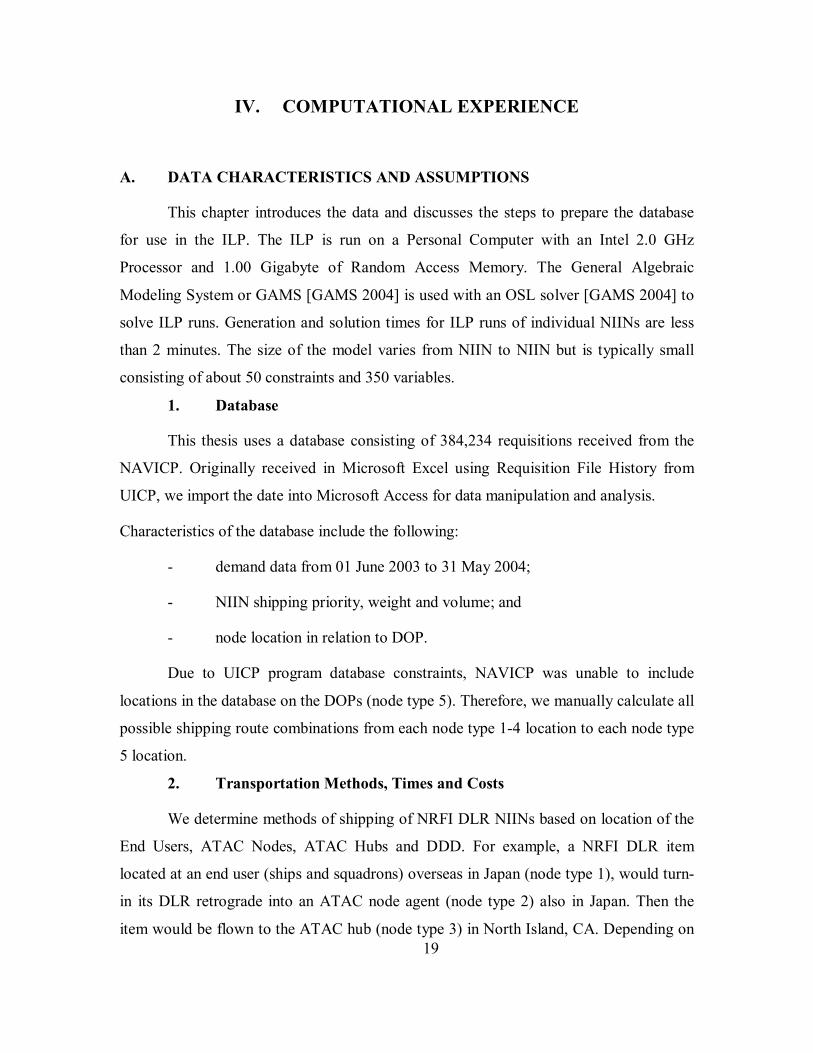
IV. COMPUTATIONAL EXPERIENCE
A. DATA CHARACTERISTICS AND ASSUMPTIONS
This chapter introduces the data and discusses the steps to prepare the database
for use in the ILP. The ILP is run on a Personal Computer with an Intel 2.0 GHz
Processor and 1.00 Gigabyte of Random Access Memory. The General Algebraic
Modeling System or GAMS [GAMS 2004] is used with an OSL solver [GAMS 2004] to
solve ILP runs. Generation and solution times for ILP runs of individual NIINs are less
than 2 minutes. The size of the model varies from NIIN to NIIN but is typically small
consisting of about 50 constraints and 350 variables.
1. Database
This thesis uses a database consisting of 384,234 requisitions received from the
NAVICP. Originally received in Microsoft Excel using Requisition File History from
UICP, we import the date into Microsoft Access for data manipulation and analysis.
Characteristics of the database include the following:
- demand data from 01 June 2003 to 31 May 2004;
- NIIN shipping priority, weight and volume; and
- node location in relation to DOP.
Due to UICP program database constraints, NAVICP was unable to include
locations in the database on the DOPs (node type 5). Therefore, we manually calculate all
possible shipping route combinations from each node type 1-4 location to each node type
5 location.
2. Transportation Methods, Times and Costs
We determine methods of shipping of NRFI DLR NIINs based on location of the
End Users, ATAC Nodes, ATAC Hubs and DDD. For example, a NRFI DLR item
located at an end user (ships and squadrons) overseas in Japan (node type 1), would turn-
in its DLR retrograde into an ATAC node agent (node type 2) also in Japan. Then the
item would be flown to the ATAC hub (node type 3) in North Island, CA. Depending on

20
the DLA holding location of that item, it would either be sent using commercially
contracted trucking (surface) or flown to the DLA location (node type 4) using
commercial air Federal Express (FEDEX). Once at the DDD, the item is held in storage
until it is inducted into repair at the overhaul point or DOP (node type 5). We find all
possible shipping routes of a given NRFI DLR NIIN.
a. Air Mobility Command (AMC)
The DoD utilizes cargo aircraft of the U.S. Air Force Air Mobility Command
(AMC) to ship its medium to low priority repair parts and supplies from overseas
locations to the U.S. and back. These channel flights provide the DoD the opportunity to
move assets to and from its concentrated overseas locations and avoid commercial
transportation costs. Shipping times associated with AMC service are 5 days or greater.
b. FEDEX
Commercial shipping is generally viewed as the most expedient and reliable from
of freight shipping. FEDEX, DHL and United Parcel Service are the primary means of
domestic and international shipping for DoD units. They are part of the AMC World
Wide Express (WWX) transportation website [AMC, 2005]. For this study, we use
shipping rates from the FEDEX U.S. Government contract guide [FEDEX, 2004] for
transportation costs of RFI DLRs from overseas and domestic locations to DOP
locations.
c. DLA Contract Ground Shipping
DLA ground shipping involves dedicated trucks that pickup and deliver RFI and
NRFI parts to and from the DDD. Table 4.1 shows DLA ground shipping rates to and
from DDD locations. Note how the shipper pays a higher price per mile for shorter
distances and a lower price per mile for longer distances within a weight class.

21
Distance
(Miles)
<251 <651 <1501 <3001
<499 $0.20 $0.16 $0.13 $0.12
Weight (LBS) <999 $0.30 $0.24 $0.20 $0.17
<1999 $0.45 $0.36 $0.31 $0.27
<4999 $0.62 $0.50 $0.42 $0.37
Table 4.1: DLA shipping rate tables for 2004. DLA shipping rates per mile are based on distance to ship and weight (lbs). Greater distances experience lower costs per mile within a particular weight class.
B. DATABASE COMPLETION
Figure 4.1 is a snapshot of the database received in MS Excel format. Each month
is identified in Microsoft Excel at the bottom. In total, more than 380,000 transactions are
provided by NAVICP.
Figure 4.1: Snapshot of raw data from database received from NAVICP.
22
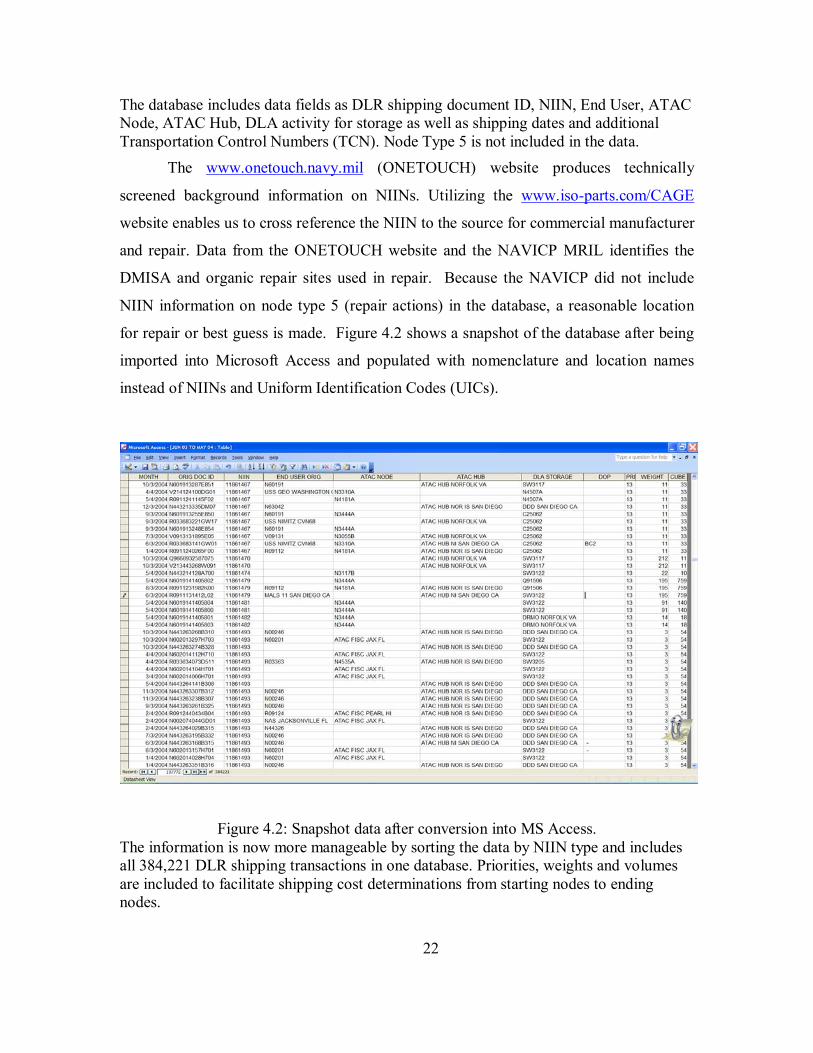
The database includes data fields as DLR shipping document ID, NIIN, End User, ATAC Node, ATAC Hub, DLA activity for storage as well as shipping dates and additional Transportation Control Numbers (TCN). Node Type 5 is not included in the data.
The www.onetouch.navy.mil (ONETOUCH) website produces technically
screened background information on NIINs. Utilizing the www.iso-parts.com/CAGE
website enables us to cross reference the NIIN to the source for commercial manufacturer
and repair. Data from the ONETOUCH website and the NAVICP MRIL identifies the
DMISA and organic repair sites used in repair. Because the NAVICP did not include
NIIN information on node type 5 (repair actions) in the database, a reasonable location
for repair or best guess is made. Figure 4.2 shows a snapshot of the database after being
imported into Microsoft Access and populated with nomenclature and location names
instead of NIINs and Uniform Identification Codes (UICs).
Figure 4.2: Snapshot data after conversion into MS Access. The information is now more manageable by sorting the data by NIIN type and includes all 384,221 DLR shipping transactions in one database. Priorities, weights and volumes are included to facilitate shipping cost determinations from starting nodes to ending nodes.
23
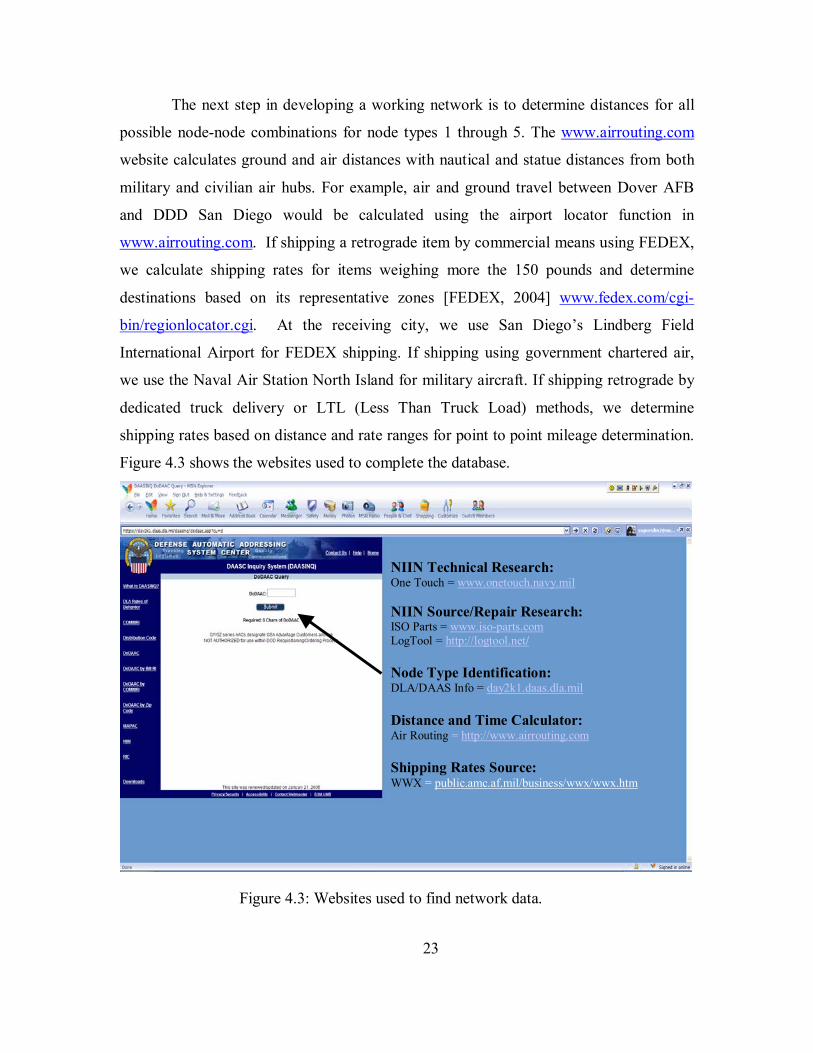
The next step in developing a working network is to determine distances for all
possible node-node combinations for node types 1 through 5. The www.airrouting.com
website calculates ground and air distances with nautical and statue distances from both
military and civilian air hubs. For example, air and ground travel between Dover AFB
and DDD San Diego would be calculated using the airport locator function in
www.airrouting.com. If shipping a retrograde item by commercial means using FEDEX,
we calculate shipping rates for items weighing more the 150 pounds and determine
destinations based on its representative zones [FEDEX, 2004] www.fedex.com/cgi-
bin/regionlocator.cgi. At the receiving city, we use San Diego’s Lindberg Field
International Airport for FEDEX shipping. If shipping using government chartered air,
we use the Naval Air Station North Island for military aircraft. If shipping retrograde by
dedicated truck delivery or LTL (Less Than Truck Load) methods, we determine
shipping rates based on distance and rate ranges for point to point mileage determination.
Figure 4.3 shows the websites used to complete the database.
Figure 4.3: Websites used to find network data.
NIIN Technical Research: One Touch = www.onetouch.navy.mil NIIN Source/Repair Research: ISO Parts = www.iso-parts.com LogTool = http://logtool.net/ Node Type Identification: DLA/DAAS Info = day2k1.daas.dla.mil Distance and Time Calculator: Air Routing = http://www.airrouting.com Shipping Rates Source: WWX = public.amc.af.mil/business/wwx/wwx.htm

24
C. REPRESENTATIVE ITEMS AND NETWORK CONSTRAINTS
Due to the need to manually obtain shipping costs for each node-node
combination, we select a test set of six NIINs (3 aviation and 3 maritime). We choose
items with various weights to capture representative shipping routes. We also utilize six
modes of shipping. Items weighing 150lbs or less are considered packages. Items
weighing 151 pounds or greater are consider freight. AMC, DLA and FEDEX charge
different rate for freight and non-freight shipments.
Priority designators 01, 02, 03, 07 and 08 we equate to FEDEX (U.S. and
international) high priority shipping in 1 to 2 days ship time. Priority designators 04, 05,
06, 09 and 10 we equate to FEDEX (U.S. and international) medium priority in 3 to 4
days ship time. Priority designators 11, 12, 13, 14 and 15 we designate with Government
shipping low priority in 5 days or greater ship time. See Table 4.2 below listing priorities
of shipping [NAVSUP, 1992].
Table 4.2: Table relating Force Activity Designators, Urgency of Need Designators and Priority Designators for shipping.
We use six modes of shipping based on three priorities, low, medium and high;
we also separate the modes into two types, Commercial and Government. Commercial is
Force Activity DesignatorUrgency of Need Designator I II III IV V Priority Designator A UNABLE TO PERFORM 01 02 03 07 08 B PERFORMANCE IMPAIRED 04 05 06 09 10 C ROUTINE 11 12 13 14 15
25
listed as medium and high priority or 3-4 days and 1-2 days respectively. Government is
listed as low priority or 5 days or greater. We utilize FEDEX for commercial service,
AMC for low priority international government air and DLA contracted trucking for
surface shipping U.S. through government channels.
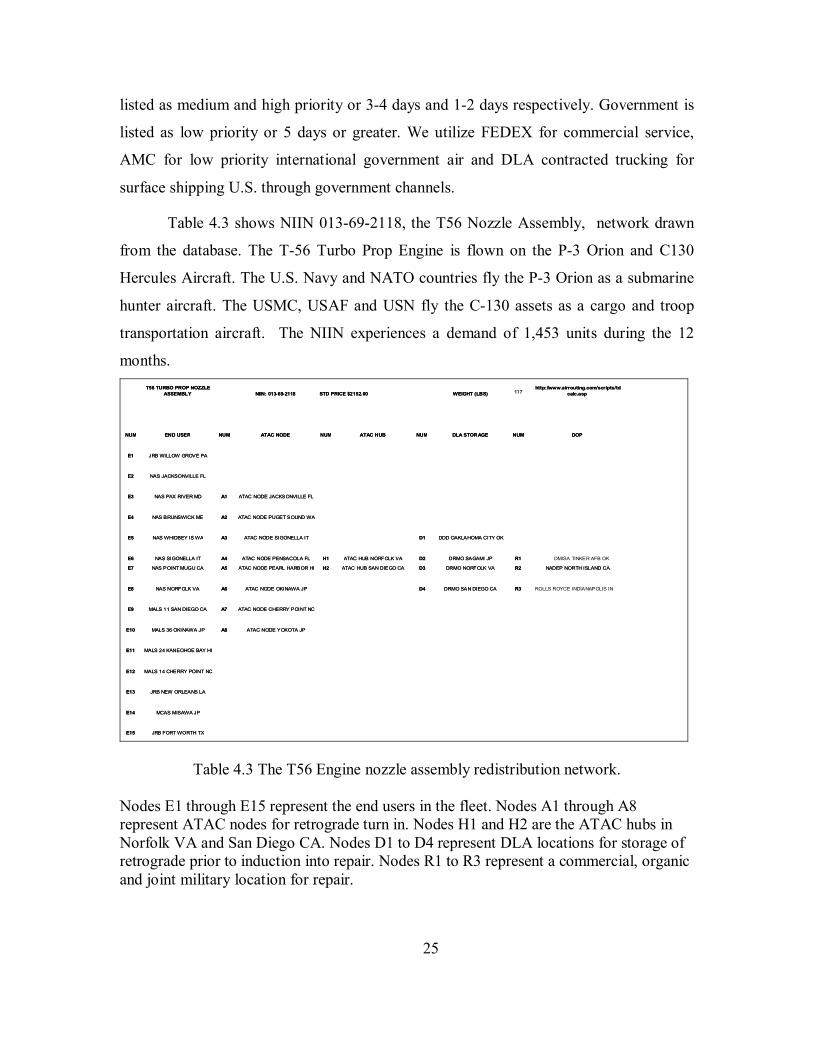
Table 4.3 shows NIIN 013-69-2118, the T56 Nozzle Assembly, network drawn
from the database. The T-56 Turbo Prop Engine is flown on the P-3 Orion and C130
Hercules Aircraft. The U.S. Navy and NATO countries fly the P-3 Orion as a submarine
hunter aircraft. The USMC, USAF and USN fly the C-130 assets as a cargo and troop
transportation aircraft. The NIIN experiences a demand of 1,453 units during the 12
months.
JRB FORT WORTH TX E15 MCAS MISAWA JPE14
JRB NEW ORLEANS LA E13 MALS 14 CHERRY POINT NC E12 MALS 24 KANEOHOE BAY HI E11
ATAC NODE YOKOTA JPA8 MALS 36 OKINAWA JPE10 ATAC NODE CHERRY POINT NC A7 MALS 11 SAN DIEGO CA E9
ROLLS ROYCE INDIANAPOLIS IN R3DRMO SAN DIEGO CAD4ATAC NODE OKINAWA JPA6 NAS NORFOLK VA E8 NADEP NORTH ISLAND CA R2DRMO NORFOLK VAD3ATAC HUB SAN DIEGO CAH2ATAC NODE PEARL HARBOR HI A5 NAS POINT MUGU CA E7
DMISA TINKER AFB OK R1DRMO SAGAMI JPD2ATAC HUB NORFOLK VAH1ATAC NODE PENSACOLA FL A4 NAS SIGONELLA IT E6 DDD OAKLAHOMA CITY OKD1ATAC NODE SIGONELLA IT A3 NAS WHIDBEY IS WAE5
ATAC NODE PUGET SOUND WA A2 NAS BRUNSWICK ME E4 ATAC NODE JACKSONVILLE FL A1 NAS PAX RIVER MD E3
NAS JACKSONVILLE FL E2 JRB WILLOW GROVE PA E1
DOP NUMDLA STORAGENUMATAC HUBNUMATAC NODE NUM END USER NUM
http://www.airrouting.com/scripts/td calc.asp WEIGHT (LBS)STD PRICE $2152.00NIIN: 013 -69 -2118 T56 TURBO PROP NOZZLE
ASSEMBLY
JRB FORT WORTH TX E15 MCAS MISAWA JPE14
JRB NEW ORLEANS LA E13 MALS 14 CHERRY POINT NC E12 MALS 24 KANEOHOE BAY HI E11
ATAC NODE YOKOTA JPA8 MALS 36 OKINAWA JPE10 ATAC NODE CHERRY POINT NC A7 MALS 11 SAN DIEGO CA E9
R3DRMO SAN DIEGO CAD4ATAC NODE OKINAWA JPA6 NAS NORFOLK VA E8 NADEP NORTH ISLAND CA R2DRMO NORFOLK VAD3ATAC HUB SAN DIEGO CAH2ATAC NODE PEARL HARBOR HI A5 NAS POINT MUGU CA E7
R1DRMO SAGAMI JPD2ATAC HUB NORFOLK VAH1ATAC NODE PENSACOLA FL A4 NAS SIGONELLA IT E6 DDD OAKLAHOMA CITY OKD1ATAC NODE SIGONELLA IT A3 NAS WHIDBEY IS WAE5
ATAC NODE PUGET SOUND WA A2 NAS BRUNSWICK ME E4 ATAC NODE JACKSONVILLE FL A1 NAS PAX RIVER MD E3
NAS JACKSONVILLE FL E2 JRB WILLOW GROVE PA E1
DOP NUMDLA STORAGENUMATAC HUBNUMATAC NODE NUM END USER NUM
http://www.airrouting.com/scripts/td calc.asp WEIGHT (LBS)STD PRICE $2152.00NIIN: 013 -69 -2118 T56 TURBO PROP NOZZLE
ASSEMBLY 177
Table 4.3 The T56 Engine nozzle assembly redistribution network.
Nodes E1 through E15 represent the end users in the fleet. Nodes A1 through A8 represent ATAC nodes for retrograde turn in. Nodes H1 and H2 are the ATAC hubs in Norfolk VA and San Diego CA. Nodes D1 to D4 represent DLA locations for storage of retrograde prior to induction into repair. Nodes R1 to R3 represent a commercial, organic and joint military location for repair.

26
D. RESULTS
It takes at least two days to get an item to a repair facility from an overseas end
user. So, all results listed below use a minimum of two days.
T-56 Engine Nozzle Assembly:
The T-56 has an annual demand of 1,453 units. Figure 4.4 shows optimal shipping
costs when AveTime is constrained from 2 to 8 days. 2-day shipping for the T-56 Nozzle
Assembly is possible using mode 3 (FEDEX U.S. 1-day shipping) and mode 5 (FEDEX
International 1-2 day shipping).
T-56 Engine Nozzle Assy
$958,100
$635,545
$1,413,877
$383,774
$278,811 $253,665$253,665
$0.00
$200,000.00
$400,000.00
$600,000.00
$800,000.00
$1,000,000.00
$1,200,000.00
$1,400,000.00
$1,600,000.00
AvgTime 2 AvgTime 3 AvgTime 4 AvgTime 5 AvgTime 6 AvgTime 7 AvgTime 8
A verag e T ime in D ays
Figure 4.4: AvgTime shipping costs of a T56 Nozzle Assembly through network.
Shipping the T-56 Nozzle Assembly through the network with an AveTime of 2
through 8 days produces a variety of recommended shipping routes. The cost when
AveTime is restricted to be no more than 2-days is found to be six times the cost when
AveTime is allowed to be seven days or more. When AveTime can be no more than 5
days, it costs four times less than that of 2-day shipping.
27
When demanding 2-day AveTime, only direct shipment from end users to DOPs
using high priority mode of shipping is possible. When AveTime equals 6 and 7 days, the
ILP recommends shipping to all ATAC nodes and hubs using five of the six shipping
methods. When having higher AveTime, we find that the lower cost AMC is used in
place of FEDEX international economy (low priority). In all cases (AveTime of 2
through 8 days), the ILP does not recommend shipping the T-56 Nozzle Assembly to any
of the DLA locations for storage due to the additional time and transportation costs.
Helo Fuel Pressure Indicator Valve:
The Helo Fuel Pressure Valve has an annual demand of 14 units. Shipping the
Helo Fuel Pressure Indicator Valve through the network with an AveTime of 2 through 8
days produces a variety of recommended shipping routes. Figure 4.5 shows optimal
shipping costs of AveTime of 2 through 8 days. The cost when AveTime is restricted to
be no more than 2-days is found to be four times the cost when AveTime is allowed to be
seven days or more. When AveTime can be no more than 5 days, it costs two times less
than that of 2-day shipping.
As we found with the T-56, only direct shipment from end users to DOPs using
high priority mode of shipping is possible when requiring 2-day AveTime. When
AveTime equals 6 and 7 days, the ILP recommends shipping to all ATAC nodes and
hubs using four of the six shipping methods. When having higher AveTime, we find that
the lower cost AMC is used in place of FEDEX international economy (low priority). We
again find, the ILP does not recommend shipping to any of the DLA locations.

28
Helo Pressure Indicator Valve
$4,571
$2,684
$2,291
$1,914$1,546
$1,278 $1,259
$0.00
$500.00
$1,000.00
$1,500.00
$2,000.00
$2,500.00
$3,000.00
$3,500.00
$4,000.00
$4,500.00
$5,000.00
AvgTime 2 AvgTime 3 AvgTime 4 AvgTime 5 AvgTime 6 AvgTime 7 AvgTime 8Average Time in Days
Figure 4.5: AvgTime shipping costs of a Helo Pressure Indicator through network.
Electronic Warfare Housing Assembly:
The Electronic Warfare Housing Assembly has an annual demand of 97 units.
Shipping the Electronic Warfare Housing Assembly through the network with an
AveTime of 2 through 8 days produces a variety of recommended shipping routes. Figure
4.6 shows optimal shipping costs of AveTime of 2 through 8 days. The cost when
AveTime is restricted to be no more than 2-days is found to be 32 times the cost when
AveTime is allowed to be seven days or more. When AveTime can be no more than 5
days, it costs 19 times less than that of 2-day shipping.
As we found with the T-56, only direct shipment from end users to DOPs using
high priority mode of shipping is possible when requiring 2-day AveTime. When
AveTime equals 6 and 7 days, the ILP recommends shipping to all ATAC nodes and
hubs using five of the six shipping methods. When having higher AveTime, we find that
the lower cost AMC is used in place of FEDEX international economy (low priority). We
again find, the ILP does not recommend shipping to any of the DLA locations.

29
Electronic Warfare Housing Assemly
$732,433
$263,093
$66,588 $38,249 $26,296 $22,597 $18,431
$0.00
$100,000.00
$200,000.00
$300,000.00
$400,000.00
$500,000.00
$600,000.00
$700,000.00
$800,000.00
AvgTime 2 AvgTime 3 AvgTime 4 AvgTime 5 AvgTime 6 AvgTime 7 AvgTime 8
Average Time in Days
Figure 4.6: AvgTime shipping costs of an EW Housing Assembly through network.
Alternate Current Motor:
The Alternate Current (AC) Motor has an annual demand of 64 units. Shipping
the Alternate Current Motor through the network with an AveTime of 2 through 8 days
produces a variety of recommended shipping routes. Figure 4.7 shows optimal shipping
costs of AveTime of 2 through 8 days. The cost when AveTime is restricted to be no
more than 2-days is found to be nine times the cost when AveTime is allowed to be seven
days or more. When AveTime can be no more than 4 days, it costs two times less than
that of 2-day shipping.
As we found with the T-56, only direct shipment from end users to DOPs using
high priority mode of shipping is possible when requiring 2-day AveTime. When
AveTime equals 7 days, the ILP recommends shipping to all ATAC nodes and hubs
using all six shipping methods. When having higher AveTime, we find that the lower cost
AMC is used in place of FEDEX international economy (low priority). We again find, the
ILP does not recommend shipping to any of the DLA locations.
30
AC Motor
$72,319.71
$56,983.00
$21,483.00
$19,037.00
$19,037.00$28,923.00
$39,812.00
$0.00
$10,000.00
$20,000.00
$30,000.00
$40,000.00
$50,000.00
$60,000.00
$70,000.00
$80,000.00
AvgTime 2 AvgTime 3 AvgTime 4 AvgTime 5 AvgTime 6 AvgTime 7 AvgTime 8
A verage T ime in D ays
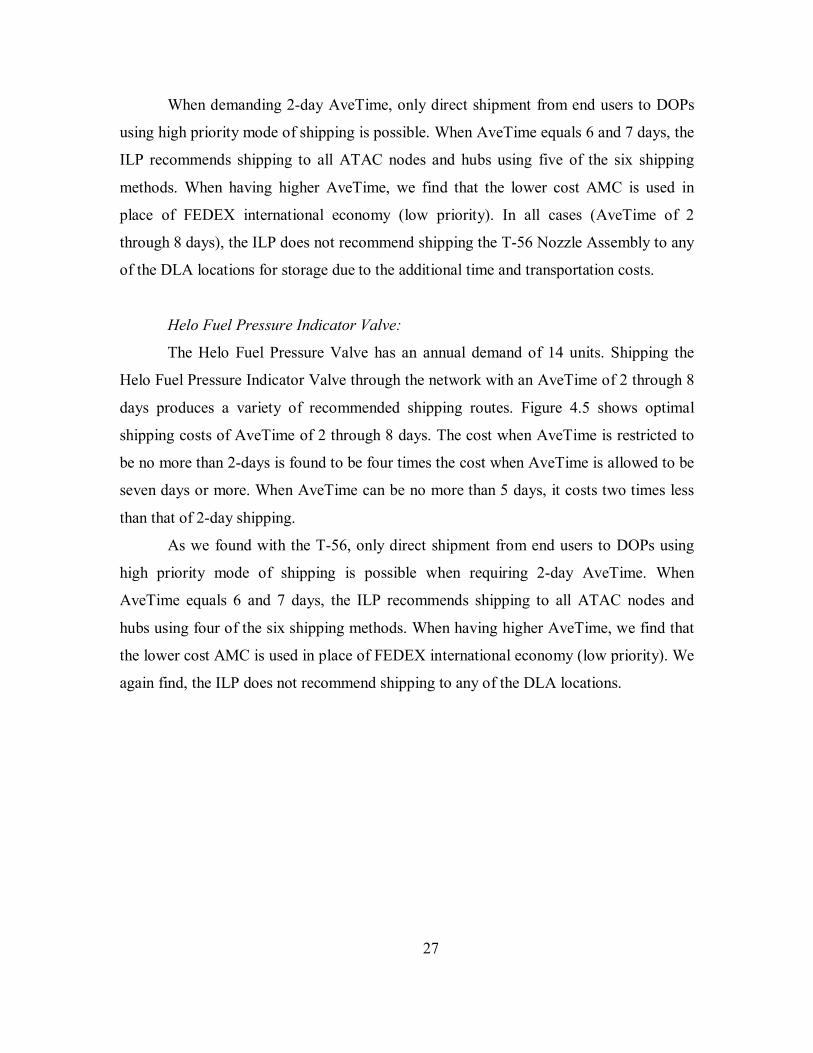
Figure 4.7: AvgTime shipping costs of an AC Motor through network.
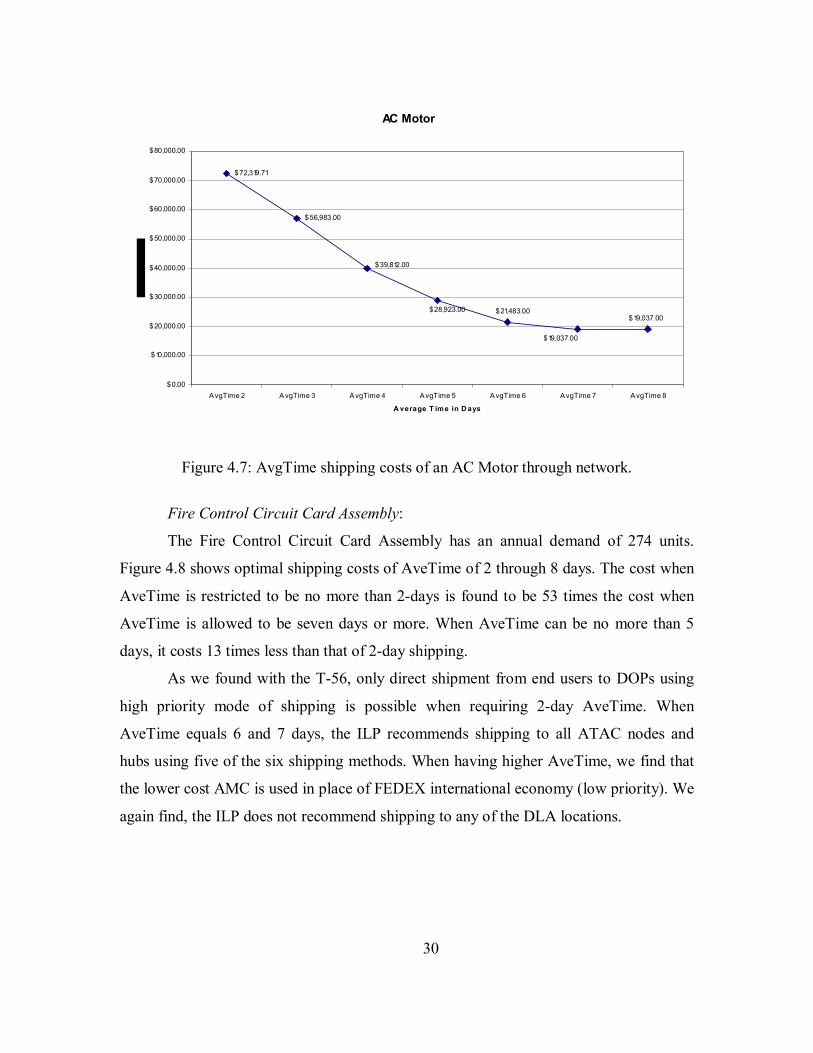
Fire Control Circuit Card Assembly:
The Fire Control Circuit Card Assembly has an annual demand of 274 units.
Figure 4.8 shows optimal shipping costs of AveTime of 2 through 8 days. The cost when
AveTime is restricted to be no more than 2-days is found to be 53 times the cost when
AveTime is allowed to be seven days or more. When AveTime can be no more than 5
days, it costs 13 times less than that of 2-day shipping.
As we found with the T-56, only direct shipment from end users to DOPs using
high priority mode of shipping is possible when requiring 2-day AveTime. When
AveTime equals 6 and 7 days, the ILP recommends shipping to all ATAC nodes and
hubs using five of the six shipping methods. When having higher AveTime, we find that
the lower cost AMC is used in place of FEDEX international economy (low priority). We
again find, the ILP does not recommend shipping to any of the DLA locations.
31
Circuit Card Assembly
$4,993.46
$2,446.23
$93.46
$693.18 $397.03$269.15 $93.46
$0.00
$1,000.00
$2,000.00
$3,000.00
$4,000.00
$5,000.00
$6,000.00
AvgTime 2 AvgTime 3 AvgTime 4 AvgTime 5 AvgTime 6 AvgTime 7 AvgTime 8
A veT ime in D ays
Figure 4.8: AvgTime shipping costs of a Circuit Card Assembly through network.
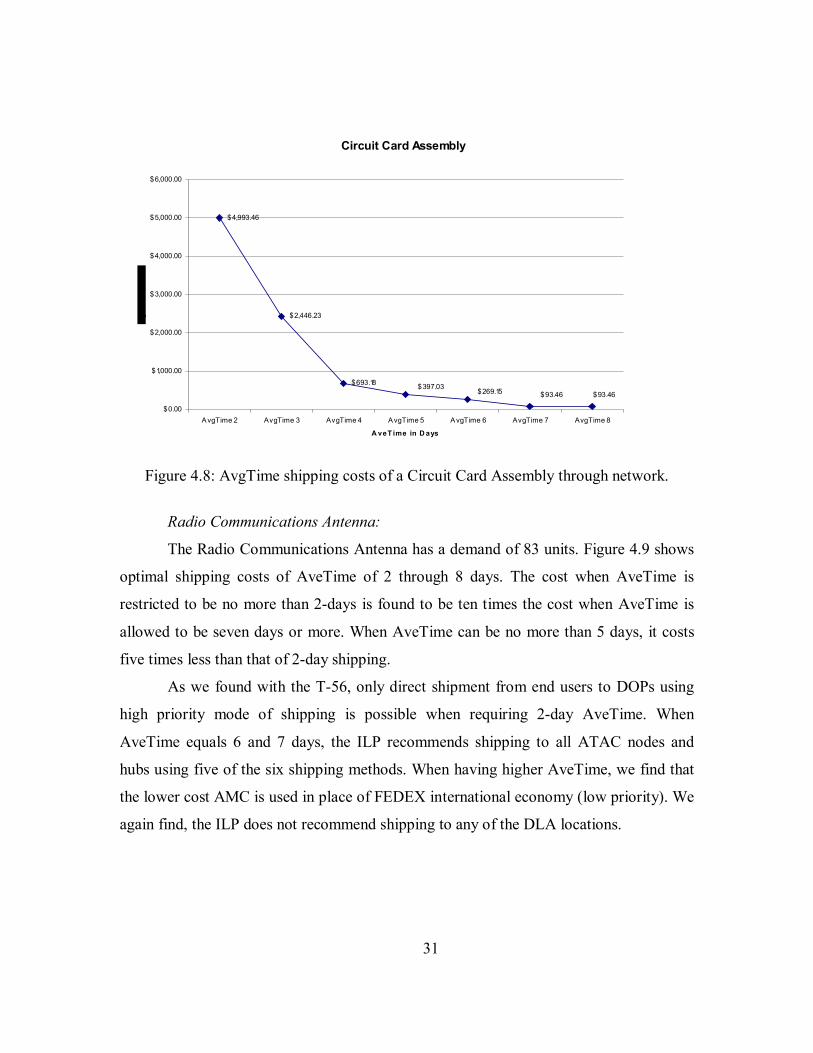
Radio Communications Antenna:
The Radio Communications Antenna has a demand of 83 units. Figure 4.9 shows
optimal shipping costs of AveTime of 2 through 8 days. The cost when AveTime is
restricted to be no more than 2-days is found to be ten times the cost when AveTime is
allowed to be seven days or more. When AveTime can be no more than 5 days, it costs
five times less than that of 2-day shipping.
As we found with the T-56, only direct shipment from end users to DOPs using
high priority mode of shipping is possible when requiring 2-day AveTime. When
AveTime equals 6 and 7 days, the ILP recommends shipping to all ATAC nodes and
hubs using five of the six shipping methods. When having higher AveTime, we find that
the lower cost AMC is used in place of FEDEX international economy (low priority). We
again find, the ILP does not recommend shipping to any of the DLA locations.

32
Radio Communications Antenna
$34,187.46
$17,941.09
$8,295.16$5,927.95
$4,204.72 $3,487.57$3,487.57
$0.00
$5,000.00
$10,000.00
$15,000.00
$20,000.00
$25,000.00
$30,000.00
$35,000.00
$40,000.00
AvgTime 2 AvgTime 3 AvgTime 4 AvgTime 5 AvgTime 6 AvgTime 7 AvgTime 8
A veT ime in D ays
Figure 4.9: AvgTime shipping costs of a Communications Antenna through network.
33
V. CONCLUSIONS AND RECOMMENDATIONS
This thesis models the NAVICP shipping of unserviceable but repairable
(retrograde) Navy materiel or Depot Level Repairables (DLRs). It develops an integer
linear program to prescribe minimum cost shipment recommendations of DLRs from
fleet to repair locations within the NAVICP and Defense Logistics Agency (DLA)
distribution system subject to constraints on average shipping time (AveTime NAVICP
provided data on DLR shipments for one year from which we construct six representative
DLRs, 3 of aviation and 3 of maritime cognizance. The analysis shows:
a. When constraining AveTime, we find that on average, 2-day shipping is 18
times that of 7-day and 8-day AveTime shipping. Likewise, 2-day shipping
resulted in costs that were twice that of 3-day shipping and 5 times to 11 times
that of the costs of 4 through 6 day shipping respectively.
b. The ILP recommends shipping through ATAC Nodes and Hubs and the use of
different shipping modes for AveTime of 5 days or greater.
c. Shipping through DLA storage locations is not recommended for any of the
scenarios.
Due to the limited nature of this study and the lack readily available data, we
manually calculate shipping costs from FEDEX, AMC and DLA shipping charts. This
data provides relative relationships between shipping costs between nodes in the network.
Therefore we recommend that NAVICP and DLA identify and utilize exact shipping
costs.

34
THIS PAGE INTENTIONALLY LEFT BLANK
35
LIST OF REFERENCES
Air Mobility Command, website, World Wide Express (WWX) Price Estimator, www.amc.af.mil, accessed January 2005. Anderson Consulting, Robeson, J. and Copacino, W. (editors), The Logistics Handbook, The Free Press, New York, N.Y., 1994. Ballou, R., Business Logistics Management, Prentice Hall, Englewood Cliffs, New Jersey, 1992. Defense Logistics Agency, website, Defense Distribution Center, www.dla.mil/ddc, accessed January 2005. Department of Defense, Study, Department of Defense Materiel Distribution System, Vol. I, 1978. Federal Express Corporation, FA4428-04-D-0030, Federal Express International Government Contract Service Guide, Shipping Contract between Air Mobility Command and Federal Express Co, 2004. General Algebraic Modeling System, www.gams.com, accessed November 2004. Geoffrion, A.M., “Better Distribution Planning With Computer Models,” Harvard Business Review, July 1976 Geoffrion, A.M. and Powers, R.F., Twenty Years of Strategic Distribution System Design: An Evolutionary Perspective, Interfaces 25, 5, 105-127, September-October 1995. Haynes, J. T., Electronic Mail between Author and LCDR Haynes, stationed at NAVICP Mechanicsburg Code M0412, 17 July 2004. Holmes, R. D., A Multi-Commodity Network Design for the Defense Logistics Agency, Master’s Thesis in Operations Research, Naval Postgraduate School, 1994. ISO Parts, website, Stocking Distributor for Military and Aviation Parts, www.iso-parts.com, accessed November 2004. Kaplan, C. A., Optimizing Positioning of Navy Wholesale Inventory, Master’s Thesis in Operations Research, Naval Postgraduate School, 2000. Magae, J., Capacino, W., and Rosenfield, D., Modern Logistics Management, John Wiley and Sons, New York, NY, 1985.
36
Naval Inventory Control Point, website, www.navicp.navy.mil, accessed December 2004a. Naval Inventory Control Point, Brief, Command Overview, Mechanicsburg PA, 22 April 2004b Naval Supply Systems Command, Publication 553, Inventory Management, Washington D.C., June 1992. Naval Supply Systems Command, Publication 542, Uniform Inventory Control Program Reference Document, 15 December 1996.
Naval Supply Systems Command, Publication 485, Afloat Supply Procedures, July 1999. Naval Supply Systems Command, website, www.navsup.navy.mil, accessed January 2005. Naval Supply Systems Command, website, www.onetouch.navy.mil, accessed February 2005 Reich, W. F., Optimizing Navy Wholesale Inventory Positioning, Master’s Thesis in Operations Research, Naval Postgraduate School, 1999.
Ships Parts Control Center, ALRAND Working Memorandum 602, Movement or Positioning of “F” Condition DLR Materiel – Closest to repair sites versus distant or central storage,1994. Smoak, D. T., Conversation between Author and CAPT Smoak, SC, USN, NAVICP Philadelphia Code OA, 26 May 2004.

37
INITIAL DISTRIBUTION LIST
1. Defense Technical Information Center Ft. Belvoir, Virginia
2. Dudley Knox Library
Naval Postgraduate School Monterey, California
3. Professor Robert Dell GSOIS/ Code OR
Naval Postgraduate School Monterey, CA
4. Johannes O. Royset
GSOIS/ Code OR Naval Postgraduate School Monterey, CA
5. Naval Inventory Control Point
Code 041 Mechanicsburg, PA
6. Dr Barbara H. G. Colbert
1914 Cherry Hill Road #125 College Park, MD
7. LCDR and Mrs. Charles W Colbert 7 Bradford Court Mechanicsburg, PA