Embed Size (px)
Citation preview
Optimizing Internet Transit Routingfor Content Delivery Networks
Faraz Ahmed∗, Zubair Shafiq†, Amir Khakpour‡, Alex X. Liu∗∗Department of Computer Science and Engineering, Michigan State University. {farazah, alexliu}@cse.msu.edu
†Department of Computer Science, The University of Iowa. [email protected]‡Verizon Digital Media Services. [email protected]
Abstract—Content Distribution Networks (CDNs) maintainmultiple transit routes from content distribution servers toeyeball ISP networks which provide Internet connectivity toend users. Due to the dynamics of varying performance andpricing on transit routes, CDNs need to implement a transit routeselection strategy to optimize performance and cost tradeoffs.In this paper, we formalize the transit routing problem usinga multi-attribute objective function to simultaneously optimizeend-to-end performance and cost. Our approach allows CDNsto navigate the cost and performance tradeoff in transit rout-ing through a single control knob. We evaluate our approachusing real-world measurements from CDN servers located at19 geographically distributed IXPs. Using our approach, CDNscan reduce transit costs on average by 57% without sacrificingperformance.
I. INTRODUCTION
Content publishers usually rely on third-party Content Dis-tribution Networks (CDNs) for efficiently delivering contentto end users. A significant fraction of web content on theInternet is served by CDNs. Cisco estimates that the shareof Internet video traffic served by CDNs will increase from61% in 2015 to 73% by 2020 [5]. Two major considerationsfor CDNs are cost and performance of delivering content toend users. CDNs maintain copies of content at cache serversthat are deployed at carefully selected geographical locations.CDNs also maintain multiple transit routes from cache serversto access ISPs (or “eyeball networks”) which provide Internetconnectivity to end users. When a user requests an object, therequest is redirected to a nearby cache server containing therequested object. The cache server sends the object to the enduser via one of multiple transit routes. Since the performanceof transit routes changes over time, end-to-end performanceachieved by a CDN is dependent on the choice of transitroute [32]. Furthermore, the price of Internet transit also variesfrom one transit provider to another. Thus, a major challengefaced by CDNs is to develop a transit routing strategy tosimultaneously optimize cost and performance.
The dynamic nature of transit pricing and performancemakes it challenging to optimize the cost and performancetradeoff. There are thousands of eyeball ISPs which arereachable via different transit routes and different geographicallocations. Each choice of transit route for a particular eyeballISP and geographical location has distinct cost and perfor-mance characteristics, which makes the problem of developinga transit routing strategy challenging. Therefore, it is importantfor CDNs to carefully design and adopt a transit route selection
strategy by analyzing the dynamically changing cost andperformance tradeoffs.
To the best of our knowledge, the problem of optimalInternet transit routing for CDNs considering both cost andperformance tradeoffs is not addressed in prior literature. Priorwork on route selection has studied multi-homed access net-works [11], [13], [37]. Unlike multi-homed access networks,CDNs have multi-homed servers at IXPs (via multiple transitproviders) which provide explicit control over content routing.The state of the art for transit routing at IXPs by CDNs doesnot use a fully automated approach. CDN operators mostlyconfigure routing strategies manually to optimize cost andperformance. Due to performance dynamics across thousandsof access ISPs and numerous transit routes, it is practicallyimpossible for CDN operators to manually achieve an optimaltradeoff between cost and performance.
In this paper, we present measurement, analysis, design,and evaluation of optimal transit route selection for CDNs.First, we present an approach to measure end-to-end per-formance across multiple transit routes simultaneously. Wemeasure end-to-end performance as the delay between theCDN server located at an IXP and the end user. Second,we analyze the temporal and spatial dynamics of perfor-mance differences between multiple transit routes. Measuringperformance differences across multiple transit routes allowsus to characterize performance dynamics of Internet transit.Finally, we present our proposed approach for optimal transitrouting. We formulate the transit route selection problem asusing a multi-attribute objective function that optimizes costand performance simultaneously. Using linear programming,we obtain tradeoff curves between cost and performance forvarious routing strategies. Our results show that CDNs canachieve significant cost and performance benefits using ourmeasurement and optimization approach.
We face two key technical challenges in optimizing Internettransit routing. The first challenge is to obtain simultaneousperformance measurements across multiple transit routes. Thisis necessary because performance at each transit route isdependent on multiple external factors. Performance differ-ences between transit routes can vary due to congestion at theISP-transit interconnections or congestion at intra-ISP links.Furthermore, performance can vary due to traffic engineeringpolicies of customer ISPs. To solve this challenge, we capturethe dynamics in performance differences by exploiting the
2016 IEEE 24th International Conference on Network Protocols (ICNP)
1978-1-5090-3281-5/16/$31.00 ©2016 IEEE
multi-homing capability of CDN servers. Specifically, weimplement a client-side performance measurement JavaScriptthat is embedded in client-requested web pages by the CDN.The JavaScript downloads multiple copies of a pixel tagsimultaneously via multiple transit routes. This measurementmethodology allows us to capture user perceived end-to-endperformance via multiple transit routes.
The second challenge is to obtain a transit routing strategythat provides an optimal tradeoff between cost and perfor-mance. For each IXP location, thousands of destination ISPsare reachable and for each destination ISP there are numeroustransit routes. We solve this challenge by formulating the In-ternet transit routing problem as a multi-objective optimizationproblem. The objective function computes the utility of aparticular routing strategy and optimizes it over all possiblestrategies. We describe utility as the sum of overall costincurred to a CDN and performance weighted by a factor γ.By varying values of γ, we obtain various selection strategies.We obtain an optimal strategy by looking at the tradeoffsbetween cost and performance for different γ values. Theability to analyze and automatically control transit routinghas significant cost and performance benefits for CDNs. Ourapproach allows CDN operators to analyze cost-performancetradeoffs and accordingly choose an optimal routing strategy.
We summarize our key contributions below.
• First, we characterize Internet transit performance frommultiple IXP vantage points. Our comparative analysisof two transit providers reveals that one transit routesignificantly outperforms the other for more than 50%users at a European IXP and more than 30% of users ata North American IXP.
• Second, we propose an optimization approach that allowsCDN operators to navigate cost and performance trade-offs in transit routing through a control knob. Our resultsshow that CDNs can reduce their transit costs on averageby 57% without incurring any performance degradation.
II. BACKGROUND
A. Architecture
CDN caching infrastructure consists of servers locatedat multiple geographically distributed locations. A contentprovider pushes copies of its content to the CDN. The CDNmaintains copies of the content at geographically distributedcache servers. The client requests for content are typicallydirected to suitable CDN cache servers based on geographicproximity using DNS redirection or anycast [21].
There are two common server deployment strategies em-ployed by most commercial CDNs [18]. CDNs either deployservers inside many access ISPs that are closer to users (enter-deep strategy) or deploy servers at a few carefully chosengeographical locations (bring-home strategy). For example,Akamai has adopted the enter-deep deployment strategy, andhas deployed 100,000+ servers across thousands of ASes[1], [31]. Several major content providers have also adoptedthe enter-deep deployment strategy. For example, Netflix’sOpen Connect Appliance (OCA) servers are deployed at ISPs
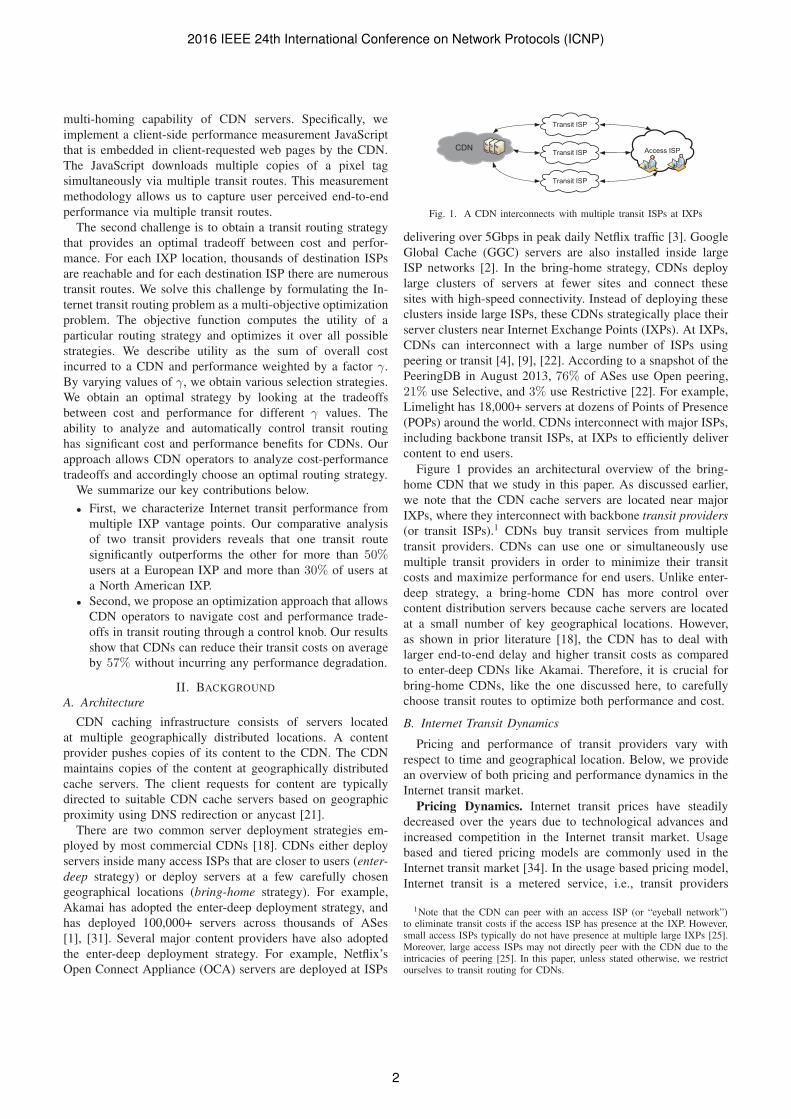
Fig. 1. A CDN interconnects with multiple transit ISPs at IXPs
delivering over 5Gbps in peak daily Netflix traffic [3]. GoogleGlobal Cache (GGC) servers are also installed inside largeISP networks [2]. In the bring-home strategy, CDNs deploylarge clusters of servers at fewer sites and connect thesesites with high-speed connectivity. Instead of deploying theseclusters inside large ISPs, these CDNs strategically place theirserver clusters near Internet Exchange Points (IXPs). At IXPs,CDNs can interconnect with a large number of ISPs usingpeering or transit [4], [9], [22]. According to a snapshot of thePeeringDB in August 2013, 76% of ASes use Open peering,21% use Selective, and 3% use Restrictive [22]. For example,Limelight has 18,000+ servers at dozens of Points of Presence(POPs) around the world. CDNs interconnect with major ISPs,including backbone transit ISPs, at IXPs to efficiently delivercontent to end users.
Figure 1 provides an architectural overview of the bring-home CDN that we study in this paper. As discussed earlier,we note that the CDN cache servers are located near majorIXPs, where they interconnect with backbone transit providers(or transit ISPs).1 CDNs buy transit services from multipletransit providers. CDNs can use one or simultaneously usemultiple transit providers in order to minimize their transitcosts and maximize performance for end users. Unlike enter-deep strategy, a bring-home CDN has more control overcontent distribution servers because cache servers are locatedat a small number of key geographical locations. However,as shown in prior literature [18], the CDN has to deal withlarger end-to-end delay and higher transit costs as comparedto enter-deep CDNs like Akamai. Therefore, it is crucial forbring-home CDNs, like the one discussed here, to carefullychoose transit routes to optimize both performance and cost.
B. Internet Transit Dynamics
Pricing and performance of transit providers vary withrespect to time and geographical location. Below, we providean overview of both pricing and performance dynamics in theInternet transit market.
Pricing Dynamics. Internet transit prices have steadilydecreased over the years due to technological advances andincreased competition in the Internet transit market. Usagebased and tiered pricing models are commonly used in theInternet transit market [34]. In the usage based pricing model,Internet transit is a metered service, i.e., transit providers
1Note that the CDN can peer with an access ISP (or “eyeball network”)to eliminate transit costs if the access ISP has presence at the IXP. However,small access ISPs typically do not have presence at multiple large IXPs [25].Moreover, large access ISPs may not directly peer with the CDN due to theintricacies of peering [25]. In this paper, unless stated otherwise, we restrictourselves to transit routing for CDNs.
2016 IEEE 24th International Conference on Network Protocols (ICNP)
2
charge their customers by measuring the amount of traffic sentor received during the billing period. Some transit providersmay charge customers differently based on traffic volumeand destination. In the tiered pricing model, transit providerscharge customers based on geographical region, traffic commitlevels, type of traffic i.e, on-net vs off-net, etc. [34]. Thecustomers who commit higher bandwidths are able to negotiatelower per-Mbps costs as compared to the customers whocommit lower bandwidths [24]. The most commonly usedpricing scheme in the Internet transit market is called 95th-percentile pricing [30]. In this scheme, usage over a fixedbilling period (typically one month) is measured on a megabitper second basis using the 95th percentile value. Unlike cappedor fixed billing, where customers pay a fixed amount regardlessof usage, 95th percentile charging is flexible. The serviceproviders do not have to implement various charging policiesand the customers pay only for what they utilize. Note thatcustomers with bursty traffic are likely to pay higher costs thancustomers with consistent bandwidth utilization, even thoughoverall traffic volume transferred by bursty customers maybe less than the consistent ones. When considering the costsincurred due to effects of bursty traffic on traffic engineeringpolicies, 95th percentile charging method balances the tradeoffbetween flexibility and the amount charged to customers.
Performance Dynamics. There are several factors thatcause performance differences across transit routes. For in-stance, a transit route may simply be longer (more IP hops)than others, resulting in consistently higher propagation de-lays. A CDN can easily identify such cases when a transitroute is consistently worse than others. Transit performanceis also affected by congestion at ISP-transit interconnectionsor congestion at intra-ISP links resulting in larger queue-ing delays and packet losses due to buffer overflows. Thecongestion can be temporary (e.g., during peak hours) orlong-lasting indicting link under-provisioning. Such changesin transit performance are not in control of CDNs becausecontractual agreements between ISPs and changes in inter-and intra-domain routing policies are considered confidentialinformation. From a CDN’s perspective, it is important to con-tinually monitor performance across different transit providersand choose transit routes accordingly to optimize end-to-endperformance.
Overall, in addition to optimizing performance, CDNs alsohave to consider financial aspects of Internet transit rout-ing. Different transit providers may charge differently, usedifferent pricing models, and set up contractual agreementswith/without performance SLAs. Thus, CDNs have to navigatethe cost-performance tradeoff. A CDN can choose the cheapesttransit route by sacrificing performance or can pay more forbetter performance. In this paper, our goal is to understand thecost performance tradeoff from the perspective of CDNs.
III. PERFORMANCE MEASUREMENTS & ANALYSIS
A. Measurement MethodologyIn this section, we discuss our methodology to measure
and analyze performance of transit providers. To measure the
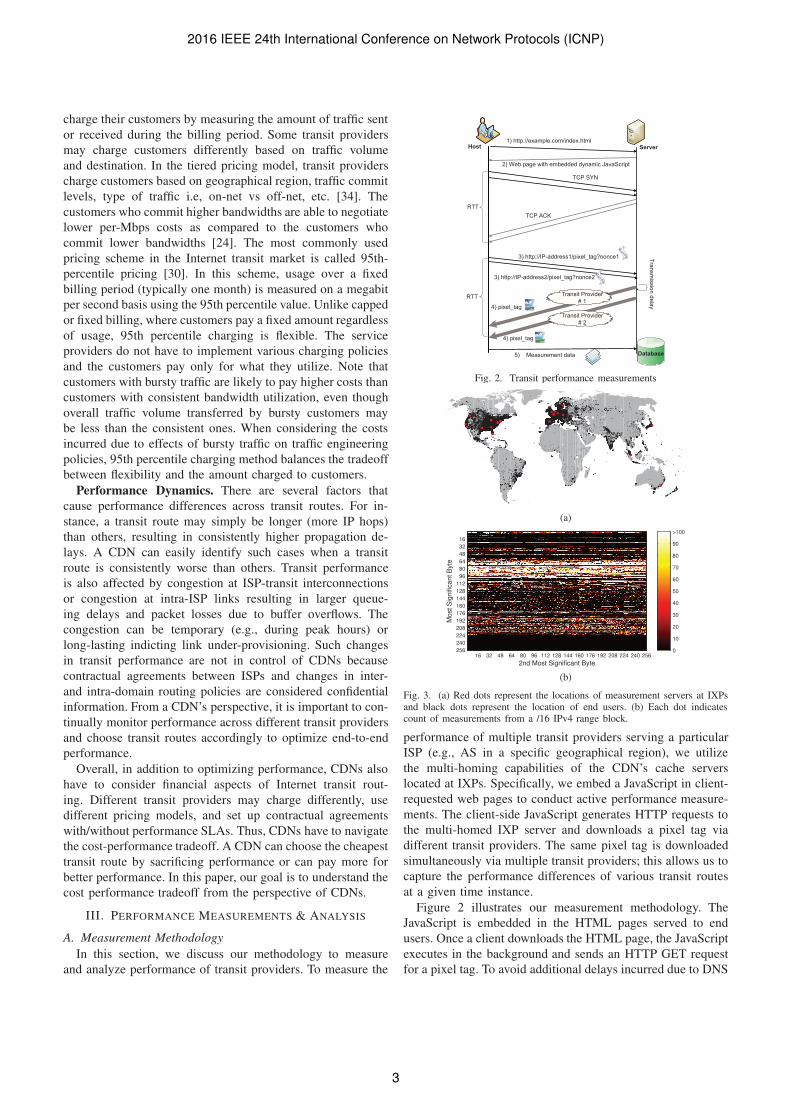
Fig. 2. Transit performance measurements
(a)
Mos
t Sig
nific
ant B
yte
2nd Most Significant Byte
16 32 48 64 80 96 112 128 144 160 176 192 208 224 240 256
163248648096
112128144160176192208224240256 0
10
20
30
40
50
60
70
80
90
>100
(b)
Fig. 3. (a) Red dots represent the locations of measurement servers at IXPsand black dots represent the location of end users. (b) Each dot indicatescount of measurements from a /16 IPv4 range block.
performance of multiple transit providers serving a particularISP (e.g., AS in a specific geographical region), we utilizethe multi-homing capabilities of the CDN’s cache serverslocated at IXPs. Specifically, we embed a JavaScript in client-requested web pages to conduct active performance measure-ments. The client-side JavaScript generates HTTP requests tothe multi-homed IXP server and downloads a pixel tag viadifferent transit providers. The same pixel tag is downloadedsimultaneously via multiple transit providers; this allows us tocapture the performance differences of various transit routesat a given time instance.
Figure 2 illustrates our measurement methodology. TheJavaScript is embedded in the HTML pages served to endusers. Once a client downloads the HTML page, the JavaScriptexecutes in the background and sends an HTTP GET requestfor a pixel tag. To avoid additional delays incurred due to DNS
2016 IEEE 24th International Conference on Network Protocols (ICNP)
3
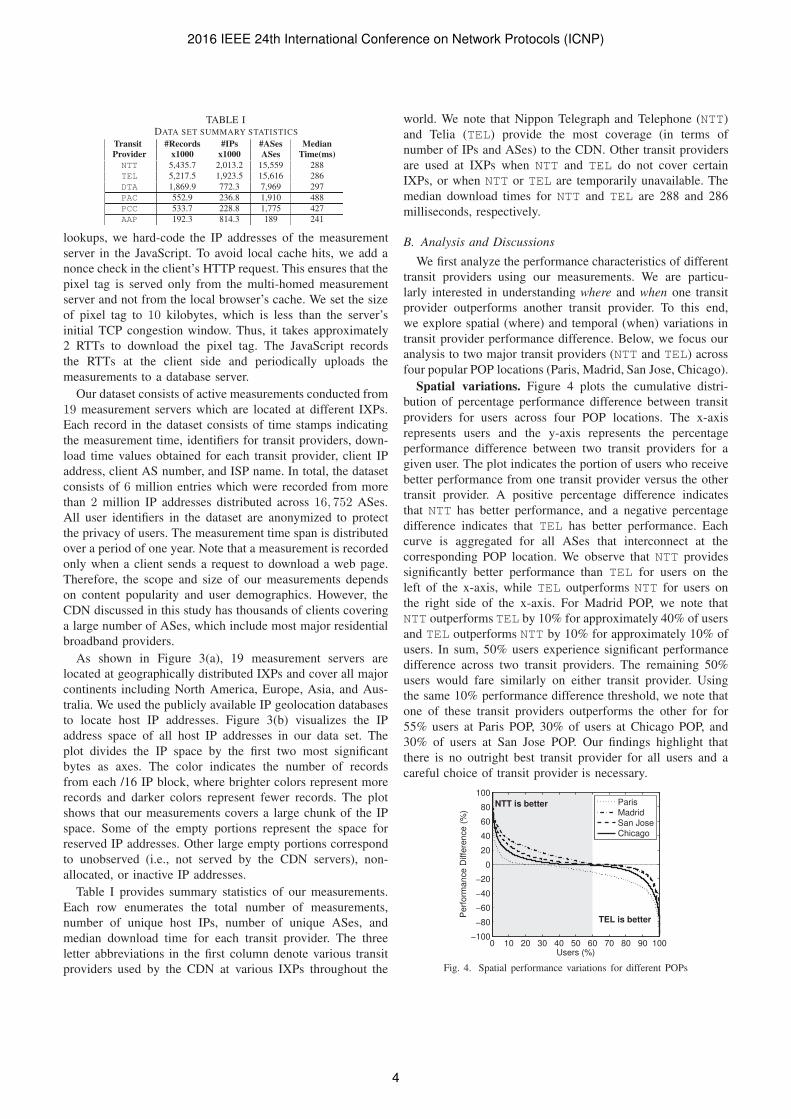
TABLE IDATA SET SUMMARY STATISTICS
Transit #Records #IPs #ASes MedianProvider x1000 x1000 ASes Time(ms)NTT 5,435.7 2,013.2 15,559 288TEL 5,217.5 1,923.5 15,616 286DTA 1,869.9 772.3 7,969 297PAC 552.9 236.8 1,910 488PCC 533.7 228.8 1,775 427AAP 192.3 814.3 189 241
lookups, we hard-code the IP addresses of the measurementserver in the JavaScript. To avoid local cache hits, we add anonce check in the client’s HTTP request. This ensures that thepixel tag is served only from the multi-homed measurementserver and not from the local browser’s cache. We set the sizeof pixel tag to 10 kilobytes, which is less than the server’sinitial TCP congestion window. Thus, it takes approximately2 RTTs to download the pixel tag. The JavaScript recordsthe RTTs at the client side and periodically uploads themeasurements to a database server.
Our dataset consists of active measurements conducted from19 measurement servers which are located at different IXPs.Each record in the dataset consists of time stamps indicatingthe measurement time, identifiers for transit providers, down-load time values obtained for each transit provider, client IPaddress, client AS number, and ISP name. In total, the datasetconsists of 6 million entries which were recorded from morethan 2 million IP addresses distributed across 16, 752 ASes.All user identifiers in the dataset are anonymized to protectthe privacy of users. The measurement time span is distributedover a period of one year. Note that a measurement is recordedonly when a client sends a request to download a web page.Therefore, the scope and size of our measurements dependson content popularity and user demographics. However, theCDN discussed in this study has thousands of clients coveringa large number of ASes, which include most major residentialbroadband providers.
As shown in Figure 3(a), 19 measurement servers arelocated at geographically distributed IXPs and cover all majorcontinents including North America, Europe, Asia, and Aus-tralia. We used the publicly available IP geolocation databasesto locate host IP addresses. Figure 3(b) visualizes the IPaddress space of all host IP addresses in our data set. Theplot divides the IP space by the first two most significantbytes as axes. The color indicates the number of recordsfrom each /16 IP block, where brighter colors represent morerecords and darker colors represent fewer records. The plotshows that our measurements covers a large chunk of the IPspace. Some of the empty portions represent the space forreserved IP addresses. Other large empty portions correspondto unobserved (i.e., not served by the CDN servers), non-allocated, or inactive IP addresses.
Table I provides summary statistics of our measurements.Each row enumerates the total number of measurements,number of unique host IPs, number of unique ASes, andmedian download time for each transit provider. The threeletter abbreviations in the first column denote various transitproviders used by the CDN at various IXPs throughout the
world. We note that Nippon Telegraph and Telephone (NTT)and Telia (TEL) provide the most coverage (in terms ofnumber of IPs and ASes) to the CDN. Other transit providersare used at IXPs when NTT and TEL do not cover certainIXPs, or when NTT or TEL are temporarily unavailable. Themedian download times for NTT and TEL are 288 and 286milliseconds, respectively.
B. Analysis and Discussions
We first analyze the performance characteristics of differenttransit providers using our measurements. We are particu-larly interested in understanding where and when one transitprovider outperforms another transit provider. To this end,we explore spatial (where) and temporal (when) variations intransit provider performance difference. Below, we focus ouranalysis to two major transit providers (NTT and TEL) acrossfour popular POP locations (Paris, Madrid, San Jose, Chicago).
Spatial variations. Figure 4 plots the cumulative distri-bution of percentage performance difference between transitproviders for users across four POP locations. The x-axisrepresents users and the y-axis represents the percentageperformance difference between two transit providers for agiven user. The plot indicates the portion of users who receivebetter performance from one transit provider versus the othertransit provider. A positive percentage difference indicatesthat NTT has better performance, and a negative percentagedifference indicates that TEL has better performance. Eachcurve is aggregated for all ASes that interconnect at thecorresponding POP location. We observe that NTT providessignificantly better performance than TEL for users on theleft of the x-axis, while TEL outperforms NTT for users onthe right side of the x-axis. For Madrid POP, we note thatNTT outperforms TEL by 10% for approximately 40% of usersand TEL outperforms NTT by 10% for approximately 10% ofusers. In sum, 50% users experience significant performancedifference across two transit providers. The remaining 50%users would fare similarly on either transit provider. Usingthe same 10% performance difference threshold, we note thatone of these transit providers outperforms the other for for55% users at Paris POP, 30% of users at Chicago POP, and30% of users at San Jose POP. Our findings highlight thatthere is no outright best transit provider for all users and acareful choice of transit provider is necessary.
Users (%)
Per
form
ance
Diff
eren
ce (
%)
0 10 20 30 40 50 60 70 80 90 100−100
−80
−60
−40
−20
0
20
40
60
80
100ParisMadridSan JoseChicago
NTT is better
TEL is better
Fig. 4. Spatial performance variations for different POPs
2016 IEEE 24th International Conference on Network Protocols (ICNP)
4
Users (%)
Per
form
ance
Diff
eren
ce (
%)
0 10 20 30 40 50 60 70 80 90 100−100
−80
−60
−40
−20
0
20
40
60
80
100JanuaryFebruaryOctober
NTT is better
TEL is better
(a) Paris
Users (%)
Per
form
ance
Diff
eren
ce (
%)
0 10 20 30 40 50 60 70 80 90 100−100
−80
−60
−40
−20
0
20
40
60
80
100FebruaryMaySeptember
NTT is better
TEL is better
(b) Madrid
Users (%)
Per
form
ance
Diff
eren
ce (
%)
0 10 20 30 40 50 60 70 80 90 100−100
−80
−60
−40
−20
0
20
40
60
80
100JulyAugustNovember
NTT is better
TEL is better
(c) San Jose
Users (%)
Per
form
ance
Diff
eren
ce (
%)
0 10 20 30 40 50 60 70 80 90 100−100
−80
−60
−40
−20
0
20
40
60
80
100JulyAugustNovember
NTT is better
TEL is better
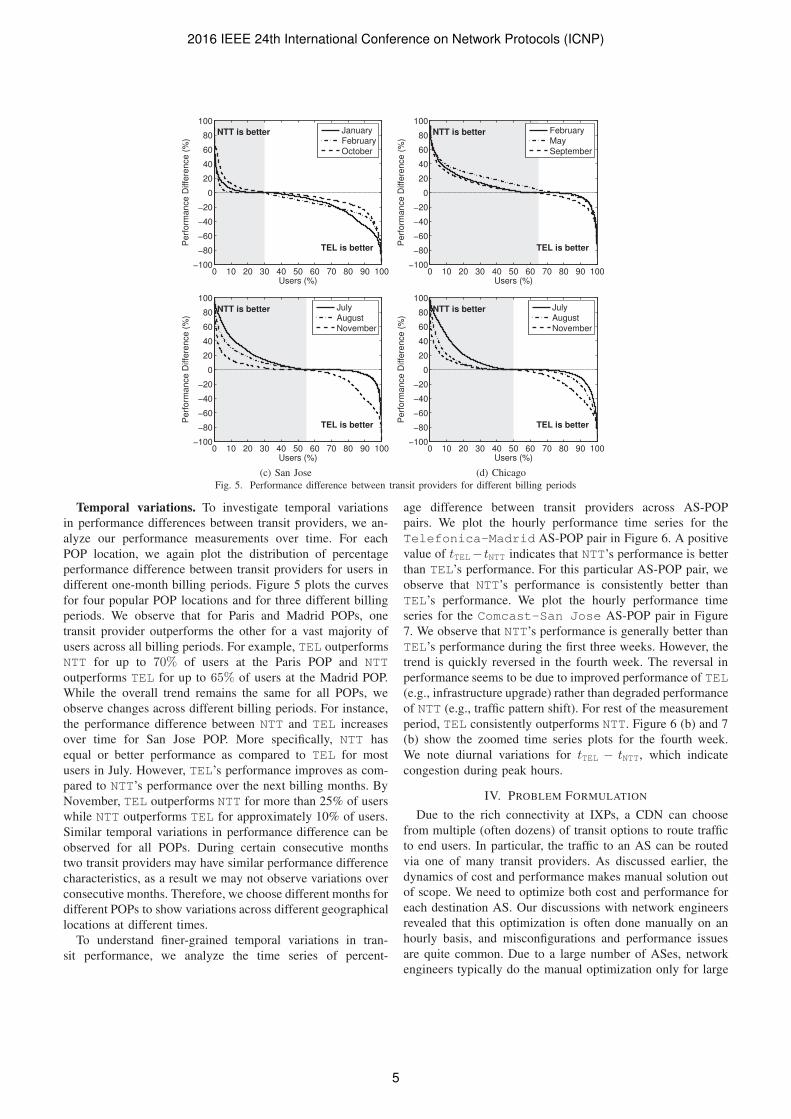
(d) ChicagoFig. 5. Performance difference between transit providers for different billing periods
Temporal variations. To investigate temporal variationsin performance differences between transit providers, we an-alyze our performance measurements over time. For eachPOP location, we again plot the distribution of percentageperformance difference between transit providers for users indifferent one-month billing periods. Figure 5 plots the curvesfor four popular POP locations and for three different billingperiods. We observe that for Paris and Madrid POPs, onetransit provider outperforms the other for a vast majority ofusers across all billing periods. For example, TEL outperformsNTT for up to 70% of users at the Paris POP and NTToutperforms TEL for up to 65% of users at the Madrid POP.While the overall trend remains the same for all POPs, weobserve changes across different billing periods. For instance,the performance difference between NTT and TEL increasesover time for San Jose POP. More specifically, NTT hasequal or better performance as compared to TEL for mostusers in July. However, TEL’s performance improves as com-pared to NTT’s performance over the next billing months. ByNovember, TEL outperforms NTT for more than 25% of userswhile NTT outperforms TEL for approximately 10% of users.Similar temporal variations in performance difference can beobserved for all POPs. During certain consecutive monthstwo transit providers may have similar performance differencecharacteristics, as a result we may not observe variations overconsecutive months. Therefore, we choose different months fordifferent POPs to show variations across different geographicallocations at different times.
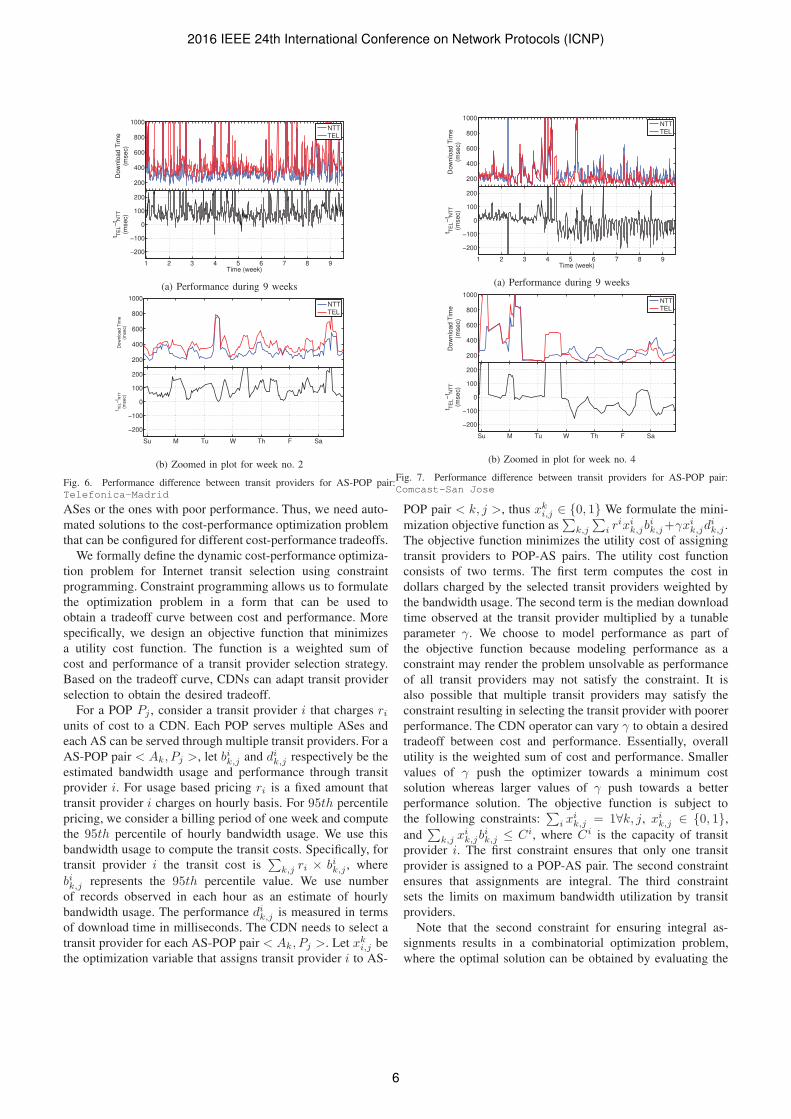
To understand finer-grained temporal variations in tran-sit performance, we analyze the time series of percent-
age difference between transit providers across AS-POPpairs. We plot the hourly performance time series for theTelefonica-Madrid AS-POP pair in Figure 6. A positivevalue of tTEL− tNTT indicates that NTT’s performance is betterthan TEL’s performance. For this particular AS-POP pair, weobserve that NTT’s performance is consistently better thanTEL’s performance. We plot the hourly performance timeseries for the Comcast-San Jose AS-POP pair in Figure7. We observe that NTT’s performance is generally better thanTEL’s performance during the first three weeks. However, thetrend is quickly reversed in the fourth week. The reversal inperformance seems to be due to improved performance of TEL(e.g., infrastructure upgrade) rather than degraded performanceof NTT (e.g., traffic pattern shift). For rest of the measurementperiod, TEL consistently outperforms NTT. Figure 6 (b) and 7(b) show the zoomed time series plots for the fourth week.We note diurnal variations for tTEL − tNTT, which indicatecongestion during peak hours.
IV. PROBLEM FORMULATION
Due to the rich connectivity at IXPs, a CDN can choosefrom multiple (often dozens) of transit options to route trafficto end users. In particular, the traffic to an AS can be routedvia one of many transit providers. As discussed earlier, thedynamics of cost and performance makes manual solution outof scope. We need to optimize both cost and performance foreach destination AS. Our discussions with network engineersrevealed that this optimization is often done manually on anhourly basis, and misconfigurations and performance issuesare quite common. Due to a large number of ASes, networkengineers typically do the manual optimization only for large
2016 IEEE 24th International Conference on Network Protocols (ICNP)
5
200
400
600
800
1000D
ownl
oad
Tim
e(m
sec)
NTTTEL
1 2 3 4 5 6 7 8 9
−200
−100
0
100
200
t TE
L−t N
TT
(mse
c)
Time (week)
(a) Performance during 9 weeks
200
400
600
800
1000
Dow
nloa
d T
ime
(mse
c)
NTTTEL
Su M Tu W Th F Sa
−200
−100
0
100
200
t TE
L−t N
TT
(mse
c)
(b) Zoomed in plot for week no. 2
Fig. 6. Performance difference between transit providers for AS-POP pair:Telefonica-Madrid
200
400
600
800
1000
Dow
nloa
d T
ime
(mse
c)
NTTTEL
1 2 3 4 5 6 7 8 9
−200
−100
0
100
200
t TE
L−t N
TT
(mse
c)
Time (week)
(a) Performance during 9 weeks
200
400
600
800
1000
Dow
nloa
d T
ime
(mse
c)
NTTTEL
Su M Tu W Th F Sa
−200
−100
0
100
200
t TE
L−t N
TT
(mse
c)(b) Zoomed in plot for week no. 4
Fig. 7. Performance difference between transit providers for AS-POP pair:Comcast-San Jose
ASes or the ones with poor performance. Thus, we need auto-mated solutions to the cost-performance optimization problemthat can be configured for different cost-performance tradeoffs.
We formally define the dynamic cost-performance optimiza-tion problem for Internet transit selection using constraintprogramming. Constraint programming allows us to formulatethe optimization problem in a form that can be used toobtain a tradeoff curve between cost and performance. Morespecifically, we design an objective function that minimizesa utility cost function. The function is a weighted sum ofcost and performance of a transit provider selection strategy.Based on the tradeoff curve, CDNs can adapt transit providerselection to obtain the desired tradeoff.
For a POP Pj , consider a transit provider i that charges riunits of cost to a CDN. Each POP serves multiple ASes andeach AS can be served through multiple transit providers. For aAS-POP pair < Ak, Pj >, let bik,j and dik,j respectively be theestimated bandwidth usage and performance through transitprovider i. For usage based pricing ri is a fixed amount thattransit provider i charges on hourly basis. For 95th percentilepricing, we consider a billing period of one week and computethe 95th percentile of hourly bandwidth usage. We use thisbandwidth usage to compute the transit costs. Specifically, fortransit provider i the transit cost is
∑k,j ri × bik,j , where
bik,j represents the 95th percentile value. We use numberof records observed in each hour as an estimate of hourlybandwidth usage. The performance dik,j is measured in termsof download time in milliseconds. The CDN needs to select atransit provider for each AS-POP pair < Ak, Pj >. Let xk
i,j bethe optimization variable that assigns transit provider i to AS-
POP pair < k, j >, thus xki,j ∈ {0, 1} We formulate the mini-
mization objective function as∑
k,j
∑i r
ixik,jb
ik,j+γxi
k,jdik,j .
The objective function minimizes the utility cost of assigningtransit providers to POP-AS pairs. The utility cost functionconsists of two terms. The first term computes the cost indollars charged by the selected transit providers weighted bythe bandwidth usage. The second term is the median downloadtime observed at the transit provider multiplied by a tunableparameter γ. We choose to model performance as part ofthe objective function because modeling performance as aconstraint may render the problem unsolvable as performanceof all transit providers may not satisfy the constraint. It isalso possible that multiple transit providers may satisfy theconstraint resulting in selecting the transit provider with poorerperformance. The CDN operator can vary γ to obtain a desiredtradeoff between cost and performance. Essentially, overallutility is the weighted sum of cost and performance. Smallervalues of γ push the optimizer towards a minimum costsolution whereas larger values of γ push towards a betterperformance solution. The objective function is subject tothe following constraints:
∑i x
ik,j = 1∀k, j, xi
k,j ∈ {0, 1},and
∑k,j x
ik,jb
ik,j ≤ Ci, where Ci is the capacity of transit
provider i. The first constraint ensures that only one transitprovider is assigned to a POP-AS pair. The second constraintensures that assignments are integral. The third constraintsets the limits on maximum bandwidth utilization by transitproviders.
Note that the second constraint for ensuring integral as-signments results in a combinatorial optimization problem,where the optimal solution can be obtained by evaluating the
2016 IEEE 24th International Conference on Network Protocols (ICNP)
6
objective function over all possible assignments. We can utilizeopenly available Mixed-Integer Programming (MIP) solversto obtain the optimal assignment. However, in practice eachPOP connects to thousands of ASes through multiple transitproviders. Since MIP is NP-hard, it is not feasible to solve itfor large input sizes. Thus, we relax the constraint to allowfractional assignments i.e., xk
i,j ∈ [0, 1]. This relaxation allowsus to obtain optimal solution with fractional assignments inlinear time using standard Linear Programming (LP). Follow-ing lemmas state the relationships between solution obtainedthrough LP relaxation and Integer LP (ILP) [28], [35].
Lemma 4.1: Let SLP be set of feasible solutions in theLP and let SILP be set of feasible solutions in ILP. Allfeasible solutions in ILP are also feasible solutions in LP;i.e., SILP ⊂ SLP . For the minimization problem, solutionobtained through relaxed LP has smaller value than the solu-tion obtained through original ILP i.e., min(LP)≤ min(ILP).An optimal solution in LP may be found at the boundaries ofthe convex hull formed by the linear constraints. However,the feasible solutions in ILP are given by a set of pointsinside the convex hull formed by the linear constraints. Theseset of points do not form a convex set. Hence, value of theoptimal solution in a minimization problem in LP is less thanor equal to the value of an ILP optimal solution. Followingthe inequality in Lemma 4.1, we next state the condition underwhich both optimal solutions for LP and ILP are equal.
Lemma 4.2: Let Xo denote the optimal solution of theoriginal ILP problem. Let X l denote the optimal solutionobtained from LP. If the optimization variable xk
i,j of theLP takes integral values in X l, then it is also an optimalsolution for ILP and hence the optimal solution for the originalproblem; i.e, X l = Xo.Optimal solution of a LP as stated in the lemma generallydoes not exist. Several heuristics have been proposed inthe literature to obtain an integral solution from the relaxedLP [10]. In this paper, we use the relaxed version of theminimization problem. For our empirical evaluation, we obtaina small percentage of fractional values in the solution tothe relaxed version of the original problem. The fractionalassignments can be dealt heuristically through randomizedrounding or greedy assignments [27]. Another approach to dealwith fractional assignments is to employ fractional routing,which can be realized by hash-based splitting or through multi-homing agents [6], [23].
V. RESULTS
In this section, we discuss the cost and performance benefitsof our proposed optimization approach for transit selection byCDNs. For pricing, we use usage-based and 95th percentilepricing models to compute costs incurred by the CDN in usingvarious transit providers. On an hourly basis, we compute themedian bandwidth usage for each AS-POP pair. For usage-based pricing, we study transit provider selection for twodifferent scenarios; first, when all transit providers chargeequal pricing rates (per Mbps), and second when all transitproviders charge different pricing rates. The optimization
framework works on hourly basis, and the optimization worksfor each PoP independently over all ASes and transit providers.Therefore, differences in pricing for different POP locations(which is very common) does not impact transit providersacross POPs. For 95th percentile charging, we use one week asthe billing period in our experiments. 95th percentile chargingis based on 95th percentile of all measurements over thebilling period. Therefore, the optimization framework workson weekly basis under this charging model. For performance,we use download time of active measurements over a yearas input to the optimization problem. For bandwidth, we usenumber of records observed in each hour as an estimateof bandwidth usage in that hour. As number of records aredependent on clients requesting the pixel tags, larger numberof requests indicate greater bandwidth usage, therefore, weuse number of records as an estimate for bandwidth usage.Specifically, we compute the median download time in everyhour for all transit providers for each POP-AS pair. For a giventransit provider, our system records several measurements foreach AS-POP pair during a particular hour. We use the medianvalue of these measurements in our experiments. We usean open source implementation of Embedded Conic Solver(ECOS) for solving the optimization problem. Given the solveroutput, we can compute the performance and cost of traffic viatransit providers. While our optimization framework is scalablefor more than two transit providers, we limit our analysis totwo transit providers (namely NTT and TEL) for simplicity.
A. Tradeoff analysis
We first study the tradeoffs between cost and performancein the Internet transit selection. By varying γ, we obtain atradeoff curve between cost and performance for each POP.For each hour, we compute the cost and download timeusing the first and second terms of our objective function,respectively. We repeat this process for different γ valuesand obtain a tradeoff curve between total cost and averagedownload time per AS. Each point on the tradeoff curverepresents a transit provider selection strategy for all ASesserved by the POP. We solve the optimization problem everyhour and use average to obtain a tradeoff curve.
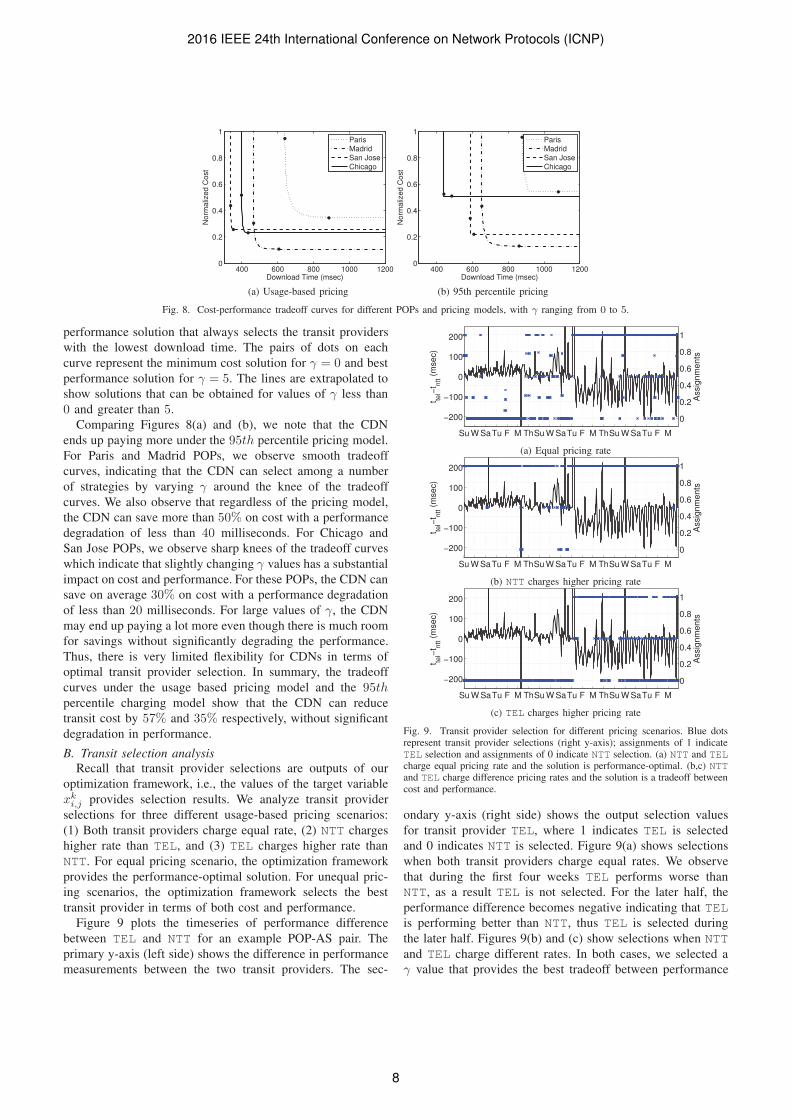
Figure 8 plots the cost-performance tradeoff curves forselection between two transit providers at four POP locations.We plot the tradeoff curves for usage-based pricing modelsand 95th percentile pricing models in Figures 8(a) and (b),respectively. The x-axis is the average download time perAS (in milliseconds) and the y-axis represents the incurredtransit costs (in dollars). Each point on the curve representsthe average cost and performance over a period of one monthfor a given γ value. To plot the tradeoff curves, we varythe values of γ from 0 to 5 with an increment of 0.1. Forsmaller values of γ, we obtain solutions with lower costs butworse performance. For γ = 0, we get the lowest cost solutionthat selects transit providers with minimum costs irrespectiveof their performance. As we increase the value of γ, wegive higher weight to performance and we obtain higher costsolutions with better performance. For γ = 5, we get the best
2016 IEEE 24th International Conference on Network Protocols (ICNP)
7
400 600 800 1000 12000
0.2
0.4
0.6
0.8
1
Download Time (msec)
Nor
mal
ized
Cos
t
ParisMadridSan JoseChicago
(a) Usage-based pricing
400 600 800 1000 12000
0.2
0.4
0.6
0.8
1
Download Time (msec)
Nor
mal
ized
Cos
t
ParisMadridSan JoseChicago
(b) 95th percentile pricing
Fig. 8. Cost-performance tradeoff curves for different POPs and pricing models, with γ ranging from 0 to 5.
performance solution that always selects the transit providerswith the lowest download time. The pairs of dots on eachcurve represent the minimum cost solution for γ = 0 and bestperformance solution for γ = 5. The lines are extrapolated toshow solutions that can be obtained for values of γ less than0 and greater than 5.
Comparing Figures 8(a) and (b), we note that the CDNends up paying more under the 95th percentile pricing model.For Paris and Madrid POPs, we observe smooth tradeoffcurves, indicating that the CDN can select among a numberof strategies by varying γ around the knee of the tradeoffcurves. We also observe that regardless of the pricing model,the CDN can save more than 50% on cost with a performancedegradation of less than 40 milliseconds. For Chicago andSan Jose POPs, we observe sharp knees of the tradeoff curveswhich indicate that slightly changing γ values has a substantialimpact on cost and performance. For these POPs, the CDN cansave on average 30% on cost with a performance degradationof less than 20 milliseconds. For large values of γ, the CDNmay end up paying a lot more even though there is much roomfor savings without significantly degrading the performance.Thus, there is very limited flexibility for CDNs in terms ofoptimal transit provider selection. In summary, the tradeoffcurves under the usage based pricing model and the 95thpercentile charging model show that the CDN can reducetransit cost by 57% and 35% respectively, without significantdegradation in performance.
B. Transit selection analysisRecall that transit provider selections are outputs of our
optimization framework, i.e., the values of the target variablexki,j provides selection results. We analyze transit provider
selections for three different usage-based pricing scenarios:(1) Both transit providers charge equal rate, (2) NTT chargeshigher rate than TEL, and (3) TEL charges higher rate thanNTT. For equal pricing scenario, the optimization frameworkprovides the performance-optimal solution. For unequal pric-ing scenarios, the optimization framework selects the besttransit provider in terms of both cost and performance.
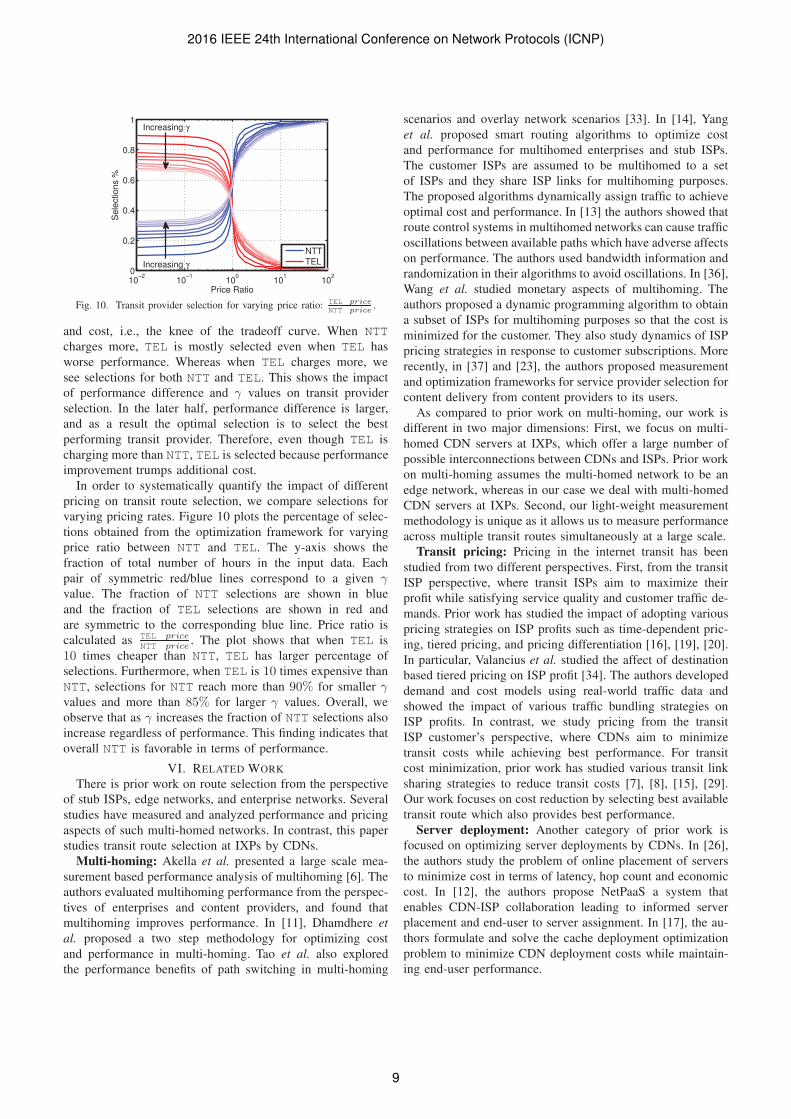
Figure 9 plots the timeseries of performance differencebetween TEL and NTT for an example POP-AS pair. Theprimary y-axis (left side) shows the difference in performancemeasurements between the two transit providers. The sec-
−200
−100
0
100
200
t tel−
t ntt (
mse
c)Su W SaTu F M ThSu W SaTu F M ThSu W SaTu F M
0
0.2
0.4
0.6
0.8
1
Ass
ignm
ents
(a) Equal pricing rate
−200
−100
0
100
200
t tel−
t ntt (
mse
c)
Su W SaTu F M ThSu W SaTu F M ThSu W SaTu F M
0
0.2
0.4
0.6
0.8
1
Ass
ignm
ents
(b) NTT charges higher pricing rate
−200
−100
0
100
200
t tel−
t ntt (
mse
c)
Su W SaTu F M ThSu W SaTu F M ThSu W SaTu F M
0
0.2
0.4
0.6
0.8
1
Ass
ignm
ents
(c) TEL charges higher pricing rate
Fig. 9. Transit provider selection for different pricing scenarios. Blue dotsrepresent transit provider selections (right y-axis); assignments of 1 indicateTEL selection and assignments of 0 indicate NTT selection. (a) NTT and TELcharge equal pricing rate and the solution is performance-optimal. (b,c) NTTand TEL charge difference pricing rates and the solution is a tradeoff betweencost and performance.
ondary y-axis (right side) shows the output selection valuesfor transit provider TEL, where 1 indicates TEL is selectedand 0 indicates NTT is selected. Figure 9(a) shows selectionswhen both transit providers charge equal rates. We observethat during the first four weeks TEL performs worse thanNTT, as a result TEL is not selected. For the later half, theperformance difference becomes negative indicating that TELis performing better than NTT, thus TEL is selected duringthe later half. Figures 9(b) and (c) show selections when NTTand TEL charge different rates. In both cases, we selected aγ value that provides the best tradeoff between performance
2016 IEEE 24th International Conference on Network Protocols (ICNP)
8
10−2
10−1
100
101
102
0
0.2
0.4
0.6
0.8
1
Price Ratio
Sel
ectio
ns %
NTTTELIncreasing γ
Increasing γ
Fig. 10. Transit provider selection for varying price ratio: TEL price
NTT price.
and cost, i.e., the knee of the tradeoff curve. When NTTcharges more, TEL is mostly selected even when TEL hasworse performance. Whereas when TEL charges more, wesee selections for both NTT and TEL. This shows the impactof performance difference and γ values on transit providerselection. In the later half, performance difference is larger,and as a result the optimal selection is to select the bestperforming transit provider. Therefore, even though TEL ischarging more than NTT, TEL is selected because performanceimprovement trumps additional cost.
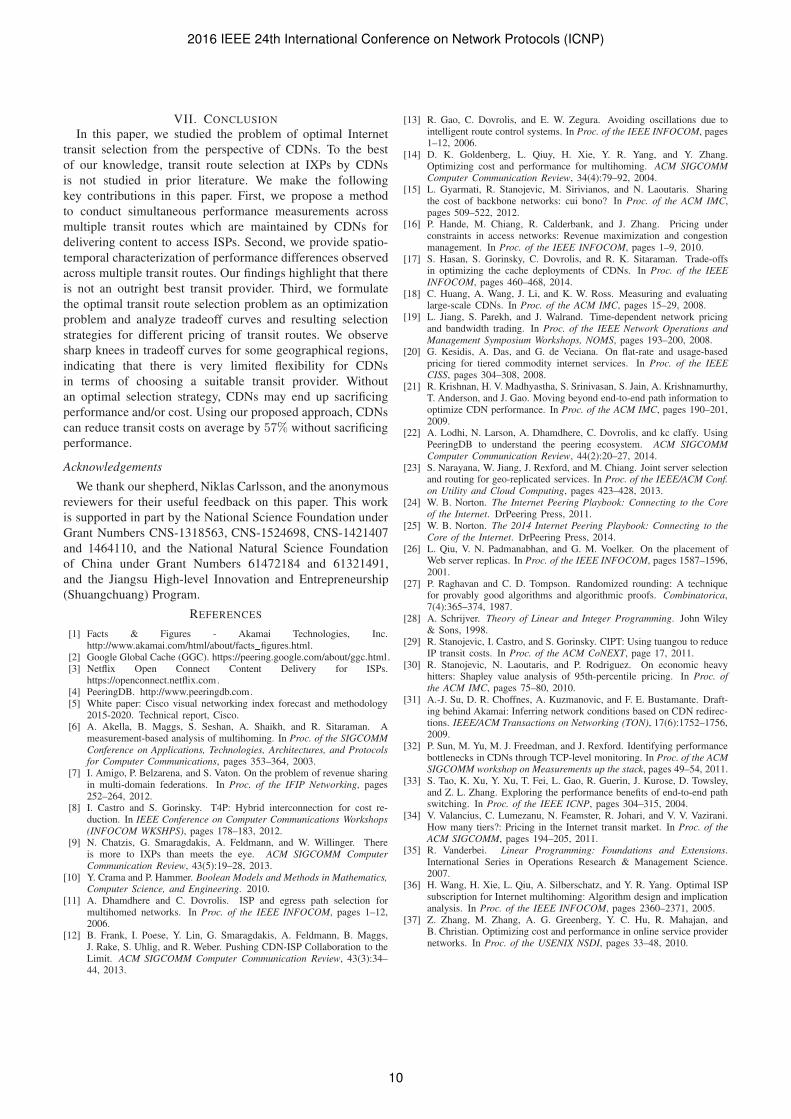
In order to systematically quantify the impact of differentpricing on transit route selection, we compare selections forvarying pricing rates. Figure 10 plots the percentage of selec-tions obtained from the optimization framework for varyingprice ratio between NTT and TEL. The y-axis shows thefraction of total number of hours in the input data. Eachpair of symmetric red/blue lines correspond to a given γ
value. The fraction of NTT selections are shown in blueand the fraction of TEL selections are shown in red andare symmetric to the corresponding blue line. Price ratio iscalculated as TEL price
NTT price. The plot shows that when TEL is
10 times cheaper than NTT, TEL has larger percentage ofselections. Furthermore, when TEL is 10 times expensive thanNTT, selections for NTT reach more than 90% for smaller γ
values and more than 85% for larger γ values. Overall, weobserve that as γ increases the fraction of NTT selections alsoincrease regardless of performance. This finding indicates thatoverall NTT is favorable in terms of performance.
VI. RELATED WORK
There is prior work on route selection from the perspectiveof stub ISPs, edge networks, and enterprise networks. Severalstudies have measured and analyzed performance and pricingaspects of such multi-homed networks. In contrast, this paperstudies transit route selection at IXPs by CDNs.
Multi-homing: Akella et al. presented a large scale mea-surement based performance analysis of multihoming [6]. Theauthors evaluated multihoming performance from the perspec-tives of enterprises and content providers, and found thatmultihoming improves performance. In [11], Dhamdhere etal. proposed a two step methodology for optimizing costand performance in multi-homing. Tao et al. also exploredthe performance benefits of path switching in multi-homing
scenarios and overlay network scenarios [33]. In [14], Yanget al. proposed smart routing algorithms to optimize costand performance for multihomed enterprises and stub ISPs.The customer ISPs are assumed to be multihomed to a setof ISPs and they share ISP links for multihoming purposes.The proposed algorithms dynamically assign traffic to achieveoptimal cost and performance. In [13] the authors showed thatroute control systems in multihomed networks can cause trafficoscillations between available paths which have adverse affectson performance. The authors used bandwidth information andrandomization in their algorithms to avoid oscillations. In [36],Wang et al. studied monetary aspects of multihoming. Theauthors proposed a dynamic programming algorithm to obtaina subset of ISPs for multihoming purposes so that the cost isminimized for the customer. They also study dynamics of ISPpricing strategies in response to customer subscriptions. Morerecently, in [37] and [23], the authors proposed measurementand optimization frameworks for service provider selection forcontent delivery from content providers to its users.
As compared to prior work on multi-homing, our work isdifferent in two major dimensions: First, we focus on multi-homed CDN servers at IXPs, which offer a large number ofpossible interconnections between CDNs and ISPs. Prior workon multi-homing assumes the multi-homed network to be anedge network, whereas in our case we deal with multi-homedCDN servers at IXPs. Second, our light-weight measurementmethodology is unique as it allows us to measure performanceacross multiple transit routes simultaneously at a large scale.
Transit pricing: Pricing in the internet transit has beenstudied from two different perspectives. First, from the transitISP perspective, where transit ISPs aim to maximize theirprofit while satisfying service quality and customer traffic de-mands. Prior work has studied the impact of adopting variouspricing strategies on ISP profits such as time-dependent pric-ing, tiered pricing, and pricing differentiation [16], [19], [20].In particular, Valancius et al. studied the affect of destinationbased tiered pricing on ISP profit [34]. The authors developeddemand and cost models using real-world traffic data andshowed the impact of various traffic bundling strategies onISP profits. In contrast, we study pricing from the transitISP customer’s perspective, where CDNs aim to minimizetransit costs while achieving best performance. For transitcost minimization, prior work has studied various transit linksharing strategies to reduce transit costs [7], [8], [15], [29].Our work focuses on cost reduction by selecting best availabletransit route which also provides best performance.
Server deployment: Another category of prior work isfocused on optimizing server deployments by CDNs. In [26],the authors study the problem of online placement of serversto minimize cost in terms of latency, hop count and economiccost. In [12], the authors propose NetPaaS a system thatenables CDN-ISP collaboration leading to informed serverplacement and end-user to server assignment. In [17], the au-thors formulate and solve the cache deployment optimizationproblem to minimize CDN deployment costs while maintain-ing end-user performance.
2016 IEEE 24th International Conference on Network Protocols (ICNP)
9
VII. CONCLUSION
In this paper, we studied the problem of optimal Internettransit selection from the perspective of CDNs. To the bestof our knowledge, transit route selection at IXPs by CDNsis not studied in prior literature. We make the followingkey contributions in this paper. First, we propose a methodto conduct simultaneous performance measurements acrossmultiple transit routes which are maintained by CDNs fordelivering content to access ISPs. Second, we provide spatio-temporal characterization of performance differences observedacross multiple transit routes. Our findings highlight that thereis not an outright best transit provider. Third, we formulatethe optimal transit route selection problem as an optimizationproblem and analyze tradeoff curves and resulting selectionstrategies for different pricing of transit routes. We observesharp knees in tradeoff curves for some geographical regions,indicating that there is very limited flexibility for CDNsin terms of choosing a suitable transit provider. Withoutan optimal selection strategy, CDNs may end up sacrificingperformance and/or cost. Using our proposed approach, CDNscan reduce transit costs on average by 57% without sacrificingperformance.
Acknowledgements
We thank our shepherd, Niklas Carlsson, and the anonymousreviewers for their useful feedback on this paper. This workis supported in part by the National Science Foundation underGrant Numbers CNS-1318563, CNS-1524698, CNS-1421407and 1464110, and the National Natural Science Foundationof China under Grant Numbers 61472184 and 61321491,and the Jiangsu High-level Innovation and Entrepreneurship(Shuangchuang) Program.
REFERENCES
[1] Facts & Figures - Akamai Technologies, Inc.http://www.akamai.com/html/about/facts figures.html.
[2] Google Global Cache (GGC). https://peering.google.com/about/ggc.html.[3] Netflix Open Connect Content Delivery for ISPs.
https://openconnect.netflix.com.[4] PeeringDB. http://www.peeringdb.com.[5] White paper: Cisco visual networking index forecast and methodology
2015-2020. Technical report, Cisco.[6] A. Akella, B. Maggs, S. Seshan, A. Shaikh, and R. Sitaraman. A
measurement-based analysis of multihoming. In Proc. of the SIGCOMMConference on Applications, Technologies, Architectures, and Protocolsfor Computer Communications, pages 353–364, 2003.
[7] I. Amigo, P. Belzarena, and S. Vaton. On the problem of revenue sharingin multi-domain federations. In Proc. of the IFIP Networking, pages252–264, 2012.
[8] I. Castro and S. Gorinsky. T4P: Hybrid interconnection for cost re-duction. In IEEE Conference on Computer Communications Workshops(INFOCOM WKSHPS), pages 178–183, 2012.
[9] N. Chatzis, G. Smaragdakis, A. Feldmann, and W. Willinger. Thereis more to IXPs than meets the eye. ACM SIGCOMM ComputerCommunication Review, 43(5):19–28, 2013.
[10] Y. Crama and P. Hammer. Boolean Models and Methods in Mathematics,Computer Science, and Engineering. 2010.
[11] A. Dhamdhere and C. Dovrolis. ISP and egress path selection formultihomed networks. In Proc. of the IEEE INFOCOM, pages 1–12,2006.
[12] B. Frank, I. Poese, Y. Lin, G. Smaragdakis, A. Feldmann, B. Maggs,J. Rake, S. Uhlig, and R. Weber. Pushing CDN-ISP Collaboration to theLimit. ACM SIGCOMM Computer Communication Review, 43(3):34–44, 2013.
[13] R. Gao, C. Dovrolis, and E. W. Zegura. Avoiding oscillations due tointelligent route control systems. In Proc. of the IEEE INFOCOM, pages1–12, 2006.
[14] D. K. Goldenberg, L. Qiuy, H. Xie, Y. R. Yang, and Y. Zhang.Optimizing cost and performance for multihoming. ACM SIGCOMMComputer Communication Review, 34(4):79–92, 2004.
[15] L. Gyarmati, R. Stanojevic, M. Sirivianos, and N. Laoutaris. Sharingthe cost of backbone networks: cui bono? In Proc. of the ACM IMC,pages 509–522, 2012.
[16] P. Hande, M. Chiang, R. Calderbank, and J. Zhang. Pricing underconstraints in access networks: Revenue maximization and congestionmanagement. In Proc. of the IEEE INFOCOM, pages 1–9, 2010.
[17] S. Hasan, S. Gorinsky, C. Dovrolis, and R. K. Sitaraman. Trade-offsin optimizing the cache deployments of CDNs. In Proc. of the IEEEINFOCOM, pages 460–468, 2014.
[18] C. Huang, A. Wang, J. Li, and K. W. Ross. Measuring and evaluatinglarge-scale CDNs. In Proc. of the ACM IMC, pages 15–29, 2008.
[19] L. Jiang, S. Parekh, and J. Walrand. Time-dependent network pricingand bandwidth trading. In Proc. of the IEEE Network Operations andManagement Symposium Workshops, NOMS, pages 193–200, 2008.
[20] G. Kesidis, A. Das, and G. de Veciana. On flat-rate and usage-basedpricing for tiered commodity internet services. In Proc. of the IEEECISS, pages 304–308, 2008.
[21] R. Krishnan, H. V. Madhyastha, S. Srinivasan, S. Jain, A. Krishnamurthy,T. Anderson, and J. Gao. Moving beyond end-to-end path information tooptimize CDN performance. In Proc. of the ACM IMC, pages 190–201,2009.
[22] A. Lodhi, N. Larson, A. Dhamdhere, C. Dovrolis, and kc claffy. UsingPeeringDB to understand the peering ecosystem. ACM SIGCOMMComputer Communication Review, 44(2):20–27, 2014.
[23] S. Narayana, W. Jiang, J. Rexford, and M. Chiang. Joint server selectionand routing for geo-replicated services. In Proc. of the IEEE/ACM Conf.on Utility and Cloud Computing, pages 423–428, 2013.
[24] W. B. Norton. The Internet Peering Playbook: Connecting to the Coreof the Internet. DrPeering Press, 2011.
[25] W. B. Norton. The 2014 Internet Peering Playbook: Connecting to theCore of the Internet. DrPeering Press, 2014.
[26] L. Qiu, V. N. Padmanabhan, and G. M. Voelker. On the placement ofWeb server replicas. In Proc. of the IEEE INFOCOM, pages 1587–1596,2001.
[27] P. Raghavan and C. D. Tompson. Randomized rounding: A techniquefor provably good algorithms and algorithmic proofs. Combinatorica,7(4):365–374, 1987.
[28] A. Schrijver. Theory of Linear and Integer Programming. John Wiley& Sons, 1998.
[29] R. Stanojevic, I. Castro, and S. Gorinsky. CIPT: Using tuangou to reduceIP transit costs. In Proc. of the ACM CoNEXT, page 17, 2011.
[30] R. Stanojevic, N. Laoutaris, and P. Rodriguez. On economic heavyhitters: Shapley value analysis of 95th-percentile pricing. In Proc. ofthe ACM IMC, pages 75–80, 2010.
[31] A.-J. Su, D. R. Choffnes, A. Kuzmanovic, and F. E. Bustamante. Draft-ing behind Akamai: Inferring network conditions based on CDN redirec-tions. IEEE/ACM Transactions on Networking (TON), 17(6):1752–1756,2009.
[32] P. Sun, M. Yu, M. J. Freedman, and J. Rexford. Identifying performancebottlenecks in CDNs through TCP-level monitoring. In Proc. of the ACMSIGCOMM workshop on Measurements up the stack, pages 49–54, 2011.
[33] S. Tao, K. Xu, Y. Xu, T. Fei, L. Gao, R. Guerin, J. Kurose, D. Towsley,and Z. L. Zhang. Exploring the performance benefits of end-to-end pathswitching. In Proc. of the IEEE ICNP, pages 304–315, 2004.
[34] V. Valancius, C. Lumezanu, N. Feamster, R. Johari, and V. V. Vazirani.How many tiers?: Pricing in the Internet transit market. In Proc. of theACM SIGCOMM, pages 194–205, 2011.
[35] R. Vanderbei. Linear Programming: Foundations and Extensions.International Series in Operations Research & Management Science.2007.
[36] H. Wang, H. Xie, L. Qiu, A. Silberschatz, and Y. R. Yang. Optimal ISPsubscription for Internet multihoming: Algorithm design and implicationanalysis. In Proc. of the IEEE INFOCOM, pages 2360–2371, 2005.
[37] Z. Zhang, M. Zhang, A. G. Greenberg, Y. C. Hu, R. Mahajan, andB. Christian. Optimizing cost and performance in online service providernetworks. In Proc. of the USENIX NSDI, pages 33–48, 2010.
2016 IEEE 24th International Conference on Network Protocols (ICNP)
10