Embed Size (px)
Citation preview

D I S C U S S I O N P A P E R
M A R C H 2 0 1 8
Catalina Gutiérrez Fernando Lavadenz Claudia Macías Janka Petravic Luis Lavadenz
OPTIMIZING INVESTMENTS IN THE NATIONAL HIV RESPONSE OF MEXICO
Pub
lic D
iscl
osur
e A
utho
rized
Pub
lic D
iscl
osur
e A
utho
rized
Pub
lic D
iscl
osur
e A
utho
rized
Pub
lic D
iscl
osur
e A
utho
rized


OPTIMIZING INVESTMENTS IN THE NATIONAL HIV RESPONSE OF MEXICO
Catalina Gutiérrez, Fernando Lavadenz, Claudia Macías, Janka Petravic, and Luis Lavadenz
March 2018

ii
Health, Nutrition and Population (HNP) Discussion Paper This series is produced by the Health, Nutrition, and Population Global Practice of the World Bank. The papers in this series aim to provide a vehicle for publishing preliminary results on HNP topics to encourage discussion and debate. The findings, interpretations, and conclusions expressed in this paper are entirely those of the author(s) and should not be attributed in any manner to the World Bank, to its affiliated organizations or to members of its Board of Executive Directors or the countries they represent. Citation and the use of material presented in this series should take into account this provisional character. The World Bank does not guarantee the accuracy of the data included in this work. The boundaries, colors, denominations, and other information shown on any map in this work do not imply any judgment on the part of The World Bank concerning the legal status of any territory or the endorsement or acceptance of such boundaries. For information regarding the HNP Discussion Paper Series, please contact the Editor, Martin Lutalo at [email protected] or Erika Yanick at [email protected].
Rights and Permissions The material in this work is subject to copyright. Because The World Bank encourages dissemination of its knowledge, this work may be reproduced, in whole or in part, for noncommercial purposes as long as full attribution to this work is given. Any queries on rights and licenses, including subsidiary rights, should be addressed to World Bank Publications, The World Bank Group, 1818 H Street NW, Washington, DC 20433, USA; fax: 202-522-2625; e-mail: [email protected]. © 2018 The International Bank for Reconstruction and Development / The World Bank 1818 H Street, NW Washington, DC 20433 All rights reserved.
iii
Health, Nutrition and Population (HNP) Discussion Paper
Optimizing Investments in the National HIV Response of Mexico
Catalina Gutierreza Fernando Lavadenzb Claudia Macíasc Janka Petravicd Luis Lavadenze
a Health, Nutrition and Population Global Practice, World Bank, Washington, DC, United States
b Health, Nutrition and Population Global Practice, World Bank, Washington, DC, United States
c Health, Nutrition and Population Global Practice, World Bank, Washington, DC, United States
d The Macfarlane Burnet Institute, Melbourne, Australia
e Development Economics, Maryland University, Maryland, United States
World Bank, Washington, DC, March 2018
Finance by UNAIDS Unified Budget, Results and Accountability Framework (UBRAF) - (TF013420) Abstract: Despite a substantial improvement in controlling new infections of HIV over the last ten years, Mexico is experiencing a low-level epidemic with approximately 180,000 people living with HIV (Spectrum, 2013), making it the fourth ranking country in Latin America with regards to the number of people with the disease (PLHIV). The objective of increasing coverage and reducing inequality in the country is reflected in the objectives of the Specific Action Program (PAE) for the national response to HIV, AIDS and STI of 2013-2018 (Secretaria de salud), which seeks to decrease the effect of HIV and STIs, implement prevention strategies and provide comprehensive care for vulnerable population groups and those living in poverty. The possibility of achieving the objectives of the PAE is closely related to the total amount of resources that Mexico can commit to fighting HIV and the way these resources are allocated. In the hopes of assisting the Government of Mexico in further strengthening its HIV investment, the authors try to answer the question “How can HIV funding be optimally allocated to the combination of HIV response interventions that will yield the highest impact in the shortest period”. The study found that despite the overall greater costs of treatment with ART, this is the most cost-effective program. ART not only reduces deaths but is an effective measure to prevent new infections due to the reduction of viral load to undetectable levels. As such, the most cost-effective allocation – with no additional resources of current Program funds, is to scale up treatment, by about 4-8 percent, to maximize ART coverage while slightly reducing overall allocations to general population prevention.

iv
This slight increase would avert 4,235 deaths and 3,371 new infections, and improve health outcomes by around 6 percent. To increase the value-for-money of existing resources, allocation efficiency would also require the strengthening of CENSIDA´s stewardship role, to ensure that the funds transferred are invested as they were initially earmarked. Keywords: Optima HIV model, HIV/AIDS, HIV Epidemic, allocative efficiency, HIV financing, cost of treatment, ART coverage, health expenditure, health financing. Disclaimer: The findings, interpretations and conclusions expressed in the paper are entirely those of the authors, and do not represent the views of the World Bank, its Executive Directors, or the countries they represent. Correspondence Details: Fernando Lavadenz, The World Bank, 1818 H Street, NW Washington, DC 20433 USA, 202-473-1463, email: [email protected], website: http://www.worldbank.org/

v
Table of Contents ACKNOWLEDGMENTS .............................................................................................. VI
ACRONYMS ................................................................................................................. VII
1. INTRODUCTION....................................................................................................... 11
1.1 Allocative Efficiency in HIV and Health ........................................................ 11
2. OBJECTIVES OF THE ANALYSIS ........................................................................ 12
3. MEXICO’S HUMAN DEVELOPMENT, HEALTH AND FINANCIAL CONTEXT ....................................................................................................................... 14
3.1 Human Development, Health and Burden of Disease ............................... 14 3.2 Health Status .................................................................................................... 15 3.3 HIV/AIDS Burden of Disease in Mexico ....................................................... 15 3.4 Overview of the HIV Epidemic ....................................................................... 17 3.5 Health and HIV Financing ............................................................................... 18 3.6 Source of HIV and STI Funding ..................................................................... 21 3.6 Allocation by Program ..................................................................................... 24 3.7 Allocation by Federative State ....................................................................... 25 3.8 Cost of Treatment ............................................................................................ 27 3.9 ART Coverage .................................................................................................. 27 3.10 Cost of ART .................................................................................................... 28
3.10.1 Cost of First-line Treatment................................................................... 32 3.10.2 Cost of Second-line Treatment ............................................................. 33
4. METHODOLOGY ..................................................................................................... 35
4.1 The OPTIMA-HIV Model ................................................................................. 35 4.2 Data Collection, Populations and Programs ................................................ 35 4.3 Calibration ......................................................................................................... 37 4.4 HIV Prevalence ................................................................................................. 37 4.5 Diagnoses, Treatment and Deaths ............................................................... 40 4.6 New infections .................................................................................................. 41
5. RESULTS .................................................................................................................... 41
5.1 Optimizations .................................................................................................... 41 5.2 What is the Minimum Number of Deaths and New Infections that Can be Achieved at Current and Scaled up Budgets? ................................................... 42 5.3 What is the Minimum Amount of Funding Required to Halve New Infections and Deaths by 2030 if Funds are Allocated Optimally? ................. 44 5.4 Other Simulations: How Much Would it Cost to Achieve 90-90-90? ....... 45 5.5 Other Opportunities and Challenges in ART Drug Procurement ............. 45 5.6 Viability and Sustainability .............................................................................. 49
6. CONCLUSIONS ......................................................................................................... 50
7. BIBLIOGRAPHY ....................................................................................................... 53

vi
ACKNOWLEDGMENTS
This work is the product of a team effort integrating international and national contributors, in close collaboration with the Ministry of Health of Mexico. The report was prepared by Catalina Gutierrez; Fernando Lavadenz and Claudia Macías from the World Bank; Janka Petravic from the Optima Consortium for Decision Science of the University of New South Wales, and Luis Lavadenz from the University of Maryland. The study includes inputs from the commissioned background paper: Spending on HIV in Mexico (2016) developed by James Cercone and Michal Pothuis (Sanigest International). Many of the modeling analyses contained in this report were carried out using the Optima HIV tool (v1.0). The Optima HIV tool was designed and developed by the Optima Consortium for Decision Science with support from the World Bank. We gratefully acknowledge the software developers (v1.0 team: Cliff Kerr, Robyn Stuart, David Kedziora, Anna Nachesa), as well as the members of the Optima group who provided analytic support in using the tool for this study (Janka Petravic and Iyanoosh Reporter). Our sincere gratitude goes to all the people who contributed to this report. Francisco Posadas, Director of Operational Research, and María del Pilar Rivera Reyes, who was the Under Director of Monitoring at the moment of the preparation of the report, provided valuable comments, which were vital for the completion of the study. We would like to give special thanks to Dra Patricia Uribe, Director of the National Center for Prevention and Control of HIV/AIDS for her leadership and critical insights into the study. Finally, the authors are grateful to the peer reviewers, Eliana Zeballos, Andre Medici, Christine Lao Pena and Amparo Gordillo Tobar (World Bank), for the valuable comments and recommendations provided to improve the final report.

vii
ACRONYMS
ABC
Abacavir
AE
Allocative efficiency
AFASPE Acuerdo para el Fortalecimiento de Acciones de Salud Pública en las Entidades Federativas/ State’s Agreement to Strengthen Public Health Actions in Federative Entities
AIDS
Acquired Immunodeficiency Syndrome
ART
Antiretroviral therapy
ARV
Antiretroviral
ATV
Atazanavir
ATV/r
Atazanavir/ritonavir
AZT
Zidovudine
CAUSES
Universal Health Services Catalog
CCPNM
Comisión Coordinadora para la Negociación de Precios de Medicamentos/ Coordinating Commission for Negotiating the Price of Medicines and other Health Inputs
CENSIDA
Centro Nacional para la Prevención y Control del VIH/SIDA/ National Centre for HIV Prevention and Control
CONEVAL Concejo Nacional de Evaluación de Políticas de Desarrollo Social/ National Council for the Evaluation of Social Development Policy
COPD
Chronic obstructive pulmonary disease
DdI
Didanosine
DGIS
Dirección General de Información en Salud/ General Directorate of Health Information
EFV
Efavirenz
ETV
Etravirine
FDC
Fixed-dose-combination
FPGC
Fondo de Protección contra Gasto Catastróficos/ Fund for Catastrophic Expenses

viii
FTC
Emtricitabine
FSW
Female sex workers
GARPR
Global AIDS Response Progress
GDP
Gross Domestic Product
GF
Global Fund
GNI
Gross National Income
GPRM
Global Price Reporting Mechanism
HIV
Human Immunodeficiency Virus
HTA
Health technology assessment
HTC
Health testing and counseling
IMSS
Instituto Mexicano de Seguros Sociales (Mexican Social Security Institute)
ISSFAM
Social Security Institute of the Armed Forces
ISSSTE
Instituto de Seguros Sociales de Trabajadores del Estado (Institute for Social Security and Services for State Workers)
LAC
Latin America and the Caribbean
LPV
Lopinavir
LPV/r
Lopinavir/ritonavir
MEGAS
Medición del Gasto en SIDA/ Report on AIDS Spending
MSM
Men who have sex with men
MSW
Male sex workers
NAFTA
North American Free Trade Agreement
NVP
Nevirapine
OECD
Organization for Economic Co-operation and Development
OMMS
Maternal Mortality Monitoring Center in Mexico
OST
Opium substitution therapy
PAE Programa de Acción Específico/ Specific Action Program

ix
PAHO
Pan-American Health Organization
PEMEX Petróleos Mexicanos Medical Services
PLHIV Person living with HIV
PMTCT
Prevention of mother to child transmission
PND
Plan Nacional de Desarrollo/National Development Plan
PQR
Global Fund Price and Quality Reporting
PSI Population Services International
PWID Person who injects drugs
RTV Ritonavir SALVAR
Sistema de Administración, Logística y Vigilancia de ARV/ ARV Management, Logistics and Surveillance System
SIAFFASPE Sistema de Información para la Administración del Fondo para el Fortalecimiento de Acciones de Salud Pública en las Entidades Federativas/ Information System for the Management of the Fund to Strengthen Public Health Actions in Federative Entities
SICUENTA Sistema de Cuentas Nacionales y Estatales/ National and State Accounts System
SPSS SQV
Social Protection in Health or Seguro Popular Saquinavir
SS
Social Security
SSA Secretaria de Salud/Ministry of Health
STI
Sexually transmitted infection
3TC
Lamivudine
TDF
Tenofavir
THE
Total health expenditure
TRIPS Trade-related aspects of intellectual property rights
UID
Users of injected drugs
UMIC Upper-middle income countries

x
UNAIDS
United Nations Program on HIV/AIDS
UNDP
United Nations Development Program
UNSW
University of Southern Wales
WHO
World Health Organization

11
1. INTRODUCTION
In the past, HIV responses in many countries around the world have attempted to provide a broad range of services using multiple approaches. At a time of increasing resources for HIV Control, this comprehensive approach provided useful lessons from different interventions and delivery modalities. However, it also led to fragmentation of responses and thereby limited opportunity for scaling up the highest-impact programs. Today, in an environment of limited resources, focused HIV responses are essential to ensure that programs can do more with less. This means using the available knowledge regarding the effectiveness of different programs to deliver a more targeted and effective investment. Therefore, HIV responses are faced with the need to scale up prevention and provide antiretroviral therapy (ART), care and support to a larger number of eligible people living with HIV than ever before. A shift towards investment optimization in the design of HIV responses has been agreed on and is now promoted by UNAIDS and co-sponsors globally, so as to maximize the impact and realize the long-term health and economic benefits of HIV programs. Investment cases are currently being developed by a number of countries to understand HIV epidemics as well as to design, deliver and sustain effective HIV responses. In support of HIV investment cases, a group of countries in Latin America have decided to conduct allocative efficiency analyses. In 2015, these types of analyses were carried out in Argentina, Colombia, Peru and Mexico. 1.1 Allocative Efficiency in HIV and Health The concept of allocative efficiency refers to the maximization of health outcomes with the least costly mix of health interventions. HIV allocative efficiency studies are generally trying to answer the question: “How can HIV funding be optimally allocated to the combination of HIV response interventions that will yield the highest impact in the shortest period?” There is wide consensus that better outcomes could be achieved in many settings with a given amount of HIV funds, or given outcomes could be achieved with less HIV funds, if the resources are distributed optimally or technically used in the most efficient way. One way to do this is by using mathematical modeling to determine the optimal HIV resource allocation. The HIV allocative efficiency (AE) analysis in this study was carried out through an application of the Optimization & Analysis Tool (OPTIMA-HIV). OPTIMA-HIV is a mathematical model of HIV transmission and disease progression, which uses an integrated analysis of epidemic, program and cost data to determine an optimal distribution of investment to better serve the needs of HIV and health decision-makers and planners.

12
2. OBJECTIVES OF THE ANALYSIS
Mexico’s 2013-2018 National Development Plan (NDP) seeks (among its strategic objectives) to have an inclusive Mexico to guarantee the effective exercise of every Mexican’s social rights. Special emphasis is on the provision of a social protection network to guarantee every Mexican’s right to access health services and avoid unexpected health problems. The HIV/AIDS and Sexually Transmitted Infection (STI) Specific Action Program (PAE-2013-2018) is fully aligned with the NDP and Health Sector Plan to achieve the national objective of an inclusive Mexico and has established the following key impact targets (Secretaria de Salud de México, 2014):
• Keep HIV prevalence stable in all populations: adult population <0.4 percent; men who have sex with men (MSM), 17 percent; male sex workers (MSW) 18.2 percent; female sex workers (FSW) <1 percent; users of injected drugs (UID) 5.8 percent; and transgender people, 20 percent.
• Keep the percentage of persons that are alive 12 months after starting ART, and for which there is a record of complete adherence above 90 percent.
• At least 80 percent of the population living with HIV have access to ART. • At least 80 percent of people report using condoms in their last sexual contact. • Increase the percentage of persons that report having had a test for HIV in the
last 12 months and that know their results. • Increase to 60 percent, the rate of users of injected drugs (UID) that report
having used sterile equipment in their last injection. • Reduce the proportion of persons whose first CD4 count was below 200 cells per
muL to 30 percent or less. • Reduce mother-to-child transmission (MTCT) cases by 84.6 percent.
Given the limited resources available, additional prioritization based on in-depth AE analysis was conducted to redefine program coverage targets for maximum impact with different scenarios of resource availability, and to support further operational planning and budgeting. The findings of this study will assist the Government of Mexico to increase the effectiveness of its HIV investments and define corresponding priorities, strategies and impacts of the response. The national HIV AE study was designed to answer the following main questions:
1. What is the minimum number of deaths and new infections that can be achieved: a. With the current volume of funding, allocated according to current
expenditure? b. With the current volume of funding, allocated optimally to reduce the
number of deaths and new infections as much as possible by 2018?
2. What is the epidemiological impact if available resources are scaled up by 50 percent and 100 percent of current levels and allocated optimally to reduce the number of deaths and new infections as much as possible by 2018?

13
3. What is the minimum amount of funding required to have no new infections and deaths by 2030 if funds are allocated optimally?

14
3. MEXICO’S HUMAN DEVELOPMENT, HEALTH AND FINANCIAL CONTEXT
3.1 Human Development, Health and Burden of Disease Mexico is an upper middle-income country, with a per capita gross national income (GNI) of 16,056 (2011 US$PPP), making it the second largest and wealthiest (in per capita income) economy in the LAC region. Its human development index of 0.756 is considered high, and it ranks 74th globally (among 188 countries) (United Nations Human Development Program). Mexico’s life expectancy at birth is above the 75-year average for LAC at 76.8 years. Its population has an average of 13.1 years of schooling. Income inequality, as measured by the Gini coefficient, is slightly lower than regional average of inequality at a rate of 0.34 (United Nations Human Development Program). Mexico’s National Development Plan 2013-2018 (PND) sets out five goals: (i) Mexico in Peace, (ii) Inclusive Mexico, (iii) Mexico with Quality Education, (iv) Prosperous Mexico, and (v) Mexico with Global Responsibility. The second objective, an Inclusive Mexico, guarantees the effective exercise of every Mexican’s social rights, with special focus on the provision of a social protection network to guarantee every Mexican’s right to access health services and avoid unexpected health problems. In spite of the growing social expenditures, approximately half of the population still lives below the national poverty line at 53 percent in 2014 (The World Bank, 2016) and 9.5 percent remains below the extreme poverty line according to the National Council for Evaluation of Social Development Policy (CONEVAL) (OECD, 2016). Indigenous populations constitute 16 percent of Mexico’s population and continue to face discrimination, lack of access to services, and generalized poverty. In fact, small municipalities in rural sectors that comprise higher percentages of indigenous populations, like those in Chiapas, Guerrero, Oaxaca and Tlaxcala, were the poorest regions with a GDP per capita lower than US$ PPP 10,000; whereas Nuevo Leon, Tabasco, Distrito Federal and Campeche were the richest regions with GDP per capita of US$ PPP 28,000, and lower percentage of indigenous population. This inequality is also reflected in unequal access to health services across population groups, difference in services across sub-systems and ultimately, inequalities in health status across regions. (OECD, 2016). A system for Social Protection in Health (SPSS), known as Seguro Popular, was established in 2004 with the aim of providing financial protection to the sectors of the population that were not covered by social security agencies. This protection included extending ART drug coverage beyond those provided by social security institutions which covered workers of the formal sector. Despite advances in access to health care services in the public sector through SPSS, survey data shows that some 21.5 percent of Mexicans continue to lack health coverage (CONEVAL, 2012), which is related to the dispersion of the population and social determinants of health. The objective of increasing coverage and reducing inequality in the country is reflected in the objectives of the Specific Action Program (PAE) for the national response to HIV, AIDS and STI of 2013-2018, aligned with the PND and the Health Sector Program (PROSESA), seeking

15
to decrease the effect of HIV and STIs, implement prevention strategies and provide comprehensive care for vulnerable population groups and those living in poverty (Secretaría de Salud, 2013). The possibility of achieving the objective of the specific PAE at a national level is closely related to the total amount of resources that Mexico can commit to fighting HIV and the manner in which these resources are allocated. The following sections include an overview of the domestic HIV spending in Mexico, followed by a review of the sources of internal and external funding, the allocation of spending according to programs and the allocation of public resources across federative entities. The section on the cost of treatment compares Mexico’s average cost for SPSS patients with LAC median prices for the most common first and second-line regiments, the challenges and opportunities the country has regarding antiretroviral medication procurement, the coverage of this treatment and the main concerns regarding the financial sustainability of the HIV national response in Mexico. 3.2 Health Status Table 1.1 shows other health indicators for Mexico, and compares them with the LAC average. Most indicators are close to the regional average except for maternal mortality ratios, which are well below the average, and immunization rates, which are slightly below the regional average. Between 1990 and 2010, Mexico saw a decline of 60 percent in under five child mortality (Institute for Health Metrics and Evaluation, 2010), and a decline of 45 percent in maternal mortality rates. Despite significant improvements in reducing the spread of AIDS, and the fact that Mexico is close to reaching some Millennium Development Goals (MDGs), those related to maternal mortality are still far from being met.
Table 1.1: Mexico Health Indicators
Source: Authors’ calculation based on data from UNDP Human Development Index. http://hdr.undp.org/en/content/human-development-index-hdi 3.3 HIV/AIDS Burden of Disease in Mexico Mexico has one of the ten highest HIV/AIDS burdens in the LAC region. Table 1.2 presents general characteristics of the HIV/AIDS burden among the top ten countries, where about 81 percent of the total HIV/AIDS burden is concentrated. Among these, Brazil, United States, Haiti, Mexico, and Colombia constitute 75.4 percent of the total burden and, 75.9 percent of the total deaths. Haiti has the highest burden with 3,509 DALYs per 100,000 people equivalent to 361 thousand DALYs. Guyana has the second highest HIV/AIDS burden per 100,000 people (2,136), followed by The Bahamas (1,112), Suriname (921), and Trinidad and Tobago (833).

16
Table 1.2: Top Ten Countries with the Highest Burden and Concentration of HIV/AIDS in
the Region, 2013
Source: Authors based on data from UNDP Human Development data. http://hdr.undp.org/en/content/human-development-index-hdi In 2013, Brazil had the highest number of DALYs in the region (469,263), followed by the United States (462,754), Haiti (361,383), and Mexico (171,553). However, Brazil, the United States, and Mexico presented some of the lowest concentrations of HIV/AIDS (234, 146 and 140 DALYs per 100,000 people respectively). Mexico had the fourth largest burden in the LAC region (IHME, 2016).
Figure 1.1: Total Number of DALYs
Source: Author’s calculation based on data from IHME, database, year 2016.
Country Percentage
of Total DALYs
Percentage Change 1990-2000
Percentage
Change from
2000 to 2013
Percentage of total DALYs of HIV/AIDS
Percentage of total deaths of HIV/AIDS
DALYs per 100,000 people
Deaths per
100,000 people
Brazil 0.90% 16.00% -24.40% 22.60% 23.40% 234 5
United States 0.50% -61.90% -33.10% 22.30% 23.30% 146 3
Haiti 8.00% 82.00% -56.20% 17.40% 16.30% 3,509 69
Mexico 0.60% 168.80% -51.90% 8.30% 8.20% 140 3
Colombia 0.80% 1573.20% -28.60% 4.70% 4.70% 201 4
Argentina 0.70% 133.50% -22.80% 3.80% 3.70% 190 4
Guyana 5.70% 980.10% -25.50% 0.80% 0.80% 2,136 43
Trinidad and Tobago 2.50% 229.40% -28.20% 0.50% 0.50% 833 18
Suriname 2.80% 938.50% -38.20% 0.20% 0.20% 921 20
The Bahamas 3.70% 177.30% -54.30% 0.20% 0.20% 1,112 24

17
That same year, Brazil had the highest number of deaths due to HIV/AIDS in the region (10,217), followed by the United States (10,197), Haiti (7,113), and Mexico (3,590). Nonetheless, Brazil, the United States, and Mexico presented some of the lowest death rates by 2013 due to HIV/AIDS (5, 3, and 3 deaths per 100,000 people, respectively). Haiti had the third highest number of deaths and showed the highest death rates due to HIV/AIDS with 69 deaths per 100,000 people. Since 1990, Mexico has been reducing its Burden of Disease (BoD) for HIV/AIDS in a sustained way. The country has gone from having one of the largest (top 15) HIV/AIDS BoD in the LAC region, to having one of the lowest BoD in a twenty-year period. 3.4 Overview of the HIV Epidemic Mexico has a concentrated and relatively stable epidemic. It is considered as a ‘low prevalence, high risk’ country for HIV/AIDS (Brouwer, et al., 2006), it is ranked fourth in Latin America with regards to the number of people living with HIV/AIDS (PLHIV). In 2013, according to a recent estimation using Spectrum 5.03, there were approximately 180,000 people living with HIV in the country. The total estimated prevalence for people aged 15 to 49 is around 0.23 percent. After a rapid increase in prevalence between the first reported case of HIV in 1983 and 1999, prevalence has stabilized, with approximately 9,000 new annual HIV diagnoses (Centro Nacional para la Prevencion y el Control del VIH y el Sida (CENSIDA), 2014). Mexico’s epidemic is predominantly concentrated in populations of men that have sex with men (MSM), male sex workers (MSW) and UIDs. The number of new cases imposes a significant challenge on the delivery system as the increased detection efforts and universal access to ART will represent a growing strain on government resources. The data from the 2013 surveys presented in the last National Progress Report on the HIV Response (2015) show that although HIV prevalence is relatively low among the general population in Mexico (0.2 percent) (UNAIDS, 2014), compared to the regional average of 0.4 percent, the prevalence of HIV is significantly higher among high-risk populations. Key populations in Mexico include MSM who register a 17.3 percent prevalence, UIDs (2.5 percent), MSW (24.1 percent), female sex workers (FSW) (0.67 percent), and transgender sex workers (15.5 percent). These rates are consistent with the regional tendencies, where prevalence of MSM ranges from 7 to 20 percent, and prevalence amongst transgender women is from 16 to 32 percent and, for MSW prevalence is of 8 to 69 percent (CENSIDA, 2015). The number of PLHIV is expected to continue increasing due to greater availability of testing and early diagnosis as a result of the implementation of the 2014 Mexican clinical guidelines, which expanded the eligibility for antiretroviral treatment to all persons diagnosed with HIV regardless of CD4 threshold or clinical symptoms (Chaumont, et al., 2015). A reduction in mortality due to HIV/AIDS from 4.8 to 4.0 per 100,000 inhabitants, can be observed as a tangible outcome of the program according to the National Centre for HIV Prevention and Control (CENSIDA). This reduction in mortality has contributed to the increase in the number of patients under medical management. Moreover, the adoption of the recent UNAIDS/ PAHO ’90-90-90’ targets will require an expansion of current diagnostic and treatment efforts in order for:
18
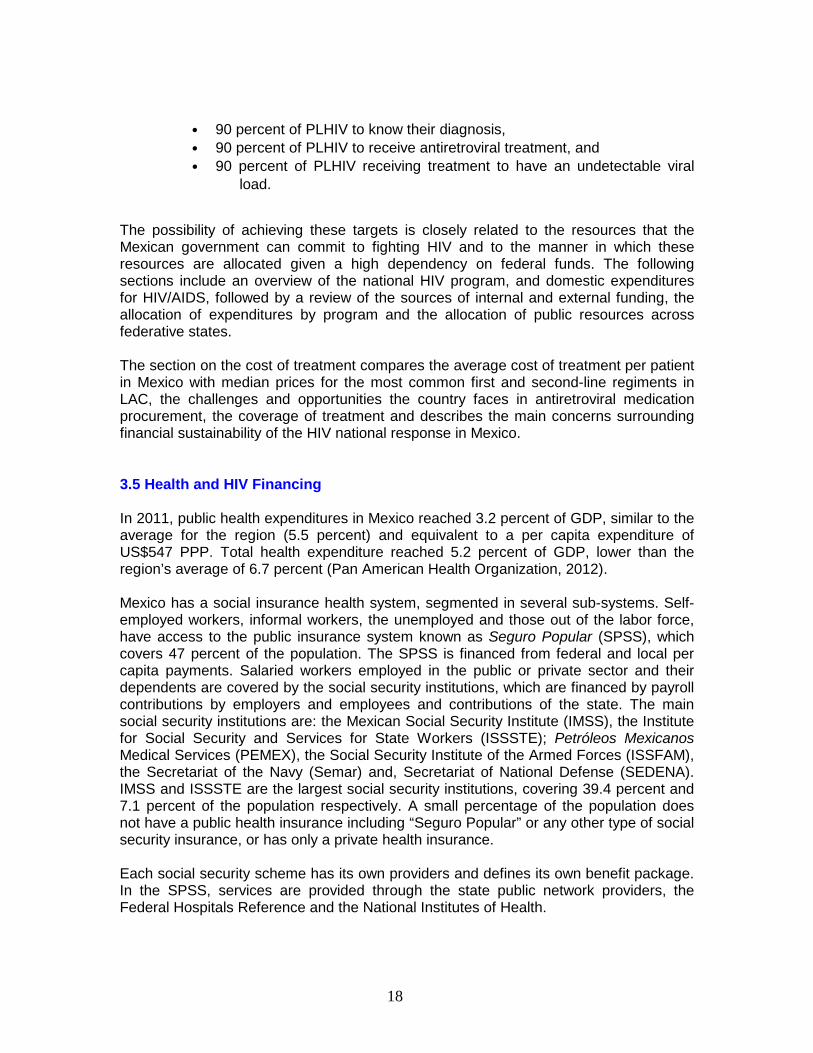
• 90 percent of PLHIV to know their diagnosis, • 90 percent of PLHIV to receive antiretroviral treatment, and • 90 percent of PLHIV receiving treatment to have an undetectable viral
load.
The possibility of achieving these targets is closely related to the resources that the Mexican government can commit to fighting HIV and to the manner in which these resources are allocated given a high dependency on federal funds. The following sections include an overview of the national HIV program, and domestic expenditures for HIV/AIDS, followed by a review of the sources of internal and external funding, the allocation of expenditures by program and the allocation of public resources across federative states. The section on the cost of treatment compares the average cost of treatment per patient in Mexico with median prices for the most common first and second-line regiments in LAC, the challenges and opportunities the country faces in antiretroviral medication procurement, the coverage of treatment and describes the main concerns surrounding financial sustainability of the HIV national response in Mexico. 3.5 Health and HIV Financing In 2011, public health expenditures in Mexico reached 3.2 percent of GDP, similar to the average for the region (5.5 percent) and equivalent to a per capita expenditure of US$547 PPP. Total health expenditure reached 5.2 percent of GDP, lower than the region’s average of 6.7 percent (Pan American Health Organization, 2012). Mexico has a social insurance health system, segmented in several sub-systems. Self-employed workers, informal workers, the unemployed and those out of the labor force, have access to the public insurance system known as Seguro Popular (SPSS), which covers 47 percent of the population. The SPSS is financed from federal and local per capita payments. Salaried workers employed in the public or private sector and their dependents are covered by the social security institutions, which are financed by payroll contributions by employers and employees and contributions of the state. The main social security institutions are: the Mexican Social Security Institute (IMSS), the Institute for Social Security and Services for State Workers (ISSSTE); Petróleos Mexicanos Medical Services (PEMEX), the Social Security Institute of the Armed Forces (ISSFAM), the Secretariat of the Navy (Semar) and, Secretariat of National Defense (SEDENA). IMSS and ISSSTE are the largest social security institutions, covering 39.4 percent and 7.1 percent of the population respectively. A small percentage of the population does not have a public health insurance including “Seguro Popular” or any other type of social security insurance, or has only a private health insurance. Each social security scheme has its own providers and defines its own benefit package. In the SPSS, services are provided through the state public network providers, the Federal Hospitals Reference and the National Institutes of Health.

19
The members of the SPSS are entitled to an explicit benefits plan with two components: The Universal Health Services Catalog (CAUSES) and the Fund for Protection Against Catastrophic Expenses. Other social security institutions have no explicit payable plans; each institution decides on coverage, but no institution offers anything beyond a broad and general national list of pharmaceuticals and medical services. The CAUSES benefits were selected based on their cost-effectiveness and according to their priority in terms of addressing the main burdens of disease and causes of mortality. In addition to CAUSES, the SPSS has a package that covers expensive and catastrophic diseases (Fondo de Protección contra Gastos Catastróficas (FPGC)). It is through FPGC that members of the SPSS have free access to antiretroviral therapies. ISSTE and IMSS also provide full coverage of HIV and AIDS treatment to its insured (Secretaria de Salud de México, 2014). Mexico has a fragmented health system that consists of a set of vertically integrated health care providers/insurers that constitute the National Health System (NHS), each serving different segments of the population. HIV services are provided at the state level through clinics and hospitals run by the State Health Services (SSA) and social security institute providers, as well as private providers, NGOs and other vertical HIV programs. Ambulatory units for the Prevention and Attention to HIV-AIDS and Other Sexually Transmitted Infections (CAPASITS, by its Spanish acronym) provide prevention services and treatment for HIV patients and those with sexually transmitted infections. CENSIDA, a regulatory body is responsible for preventing sexual, blood and perinatal transmission, promoting appropriate measures for medical/psychological support for those living with HIV, and conducting research to understand the epidemiological, biomedical and behavioral characteristics of the disease. To address the epidemic, Mexico spent approximately US $535 million in 2011. Most recently, the federal government committed an estimated US $58 million in 2014 for Branch 12 of health1. The amount increases to US $201 million when all resources earmarked for the HIV and STI Specific Action Program transferred to the federative states are added, accounting for an estimated 0.3 percent of total health expenditures (THE) and 0.5 percent of public health spending. HIV programs across the country are currently dependent on federal funding. According to the most recent assessment of spending on HIV for 2011, 90 percent of HIV spending, which totals almost US $535 million, was financed through public funds (CENSIDA 2012). This amounted to approximately US $4.3 per capita. Aran-Matero et. al (2011) estimated that LAC countries spent US $9.1 per capita on HIV, which is skewed upwards by smaller countries (mostly Caribbean countries), while larger countries have a lower per capita cost, such as US $3.8 in Brazil and US $2.9 in Venezuela. It is worth noting that this is a purely numerical indicator, which needs to be contextualized by the type of epidemic of each country. Since Mexico has a concentrated and stable HIV epidemic, investment is strategically focused on key population groups.
1 Branch 12 of Health is meant for subsidy programs, personal services, current and operating expenses
and infrastructure. It also includes financial resources and supplies disbursed by way of CAUSES/CASSCO, Annex 4 and the Fund for Catastrophic Expenses (FPGC).

20
According to data of the General Directorate of Health Information (DGIS)2, THE totaling US $76 billion in Mexico, has increased as a percentage of GDP from 5.7 percent in 2006 to 6.2 percent in 2013, which is significantly lower than the OECD average of 8.9 percent (OECD 2016). Furthermore, the growth rate of THE as a percentage of GDP was approximately one percentage point lower than the LAC growth rate (6.8 percent to 7.7 percent those same years according to World Bank data). THE in Mexico had an average growth rate of 6 percent since 2000, but this has slowed down since 2012. Public health expenditures as a percentage of GDP grew at a slower rate to 3.2 percent in 2014, after a 2.6 percent increase in the year 2000 (Mexican Government, 2013). Public health expenditure represented 15 percent of general government expenditures, decreasing from a peak of 17.6 percent in 2004 to 15 percent in 2014, with slight increases in 2010 and 2012, reaching 15.6 and 15.8 percent, respectively (DGIS 2015). The proportion of THE from public sources has increased in the last decade. Public health expenditures represented 43.4 percent of THE in 2005, compared to almost 52 percent in 2014. This increase has been accompanied by a decrease in the per capita private health expenditures over the past 7 years, which went from $331 in 2008 to $304 in 2014 (DGIS 2015), and an overall increase of per capita THE from US $609 to US$ 664 between 2011 and 2013 (The World Bank 2016), showing how public spending increases displaced out-of-pocket spending.
Figure 1.2: Public and Private Health Expenditures (2004-2014)
44.043.4 44.0
44.745.6
47.1
48.6
50.8 50.951.8 51.9
$304
$315 $319
$329 $330$328
$321
$303
$318
$310
$304
$285
$290
$295
$300
$305
$310
$315
$320
$325
$330
$335
38
40
42
44
46
48
50
52
54
2004 2005 2006 2007 2008 2009 2010 2011 2012 2013 2014
Perc
enta
ge o
f THE
Public THE as % THE Private HE per cápita
Source: DGIS (2015) HIV expenditures in 2011 represented less than 1 percent of THE (0.7 percent). If we make an assumption, based on a conservative estimate that the percentage of expenditures on HIV continue to be 0.7 percent of THE, national expenditure on HIV would amount to US $547 million (in constant 2013 USD values). The Government HIV and STI Action Program has increased in both nominal and real terms, from almost US $61 million in 2009 to over US $206 million in 2014 (in constant 2013 USD values,) a compound annual growth rate of 28 percent. Additionally, the budget allocated to the
2 All DGIS data showed that spending remained constant 2013USD values. Adjustments were made to
data from other sources in order to make the amounts comparable using CPI from the Bank of Mexico Website.

21
PAE, according to the State’s Agreement to Strengthen Public Health Actions in Federative Entities (AFASPE), as a percentage of THE, increased from 0.1 percent to almost 0.3 percent of THE in 2014, more than a 200 percent increase in real terms, which represented almost a 300 percent increase in nominal terms.
Figure 1.3: Resources Allocation to the HIV and STI PAE (2009-2014) (2013 US$)
$61
$170$207
$0
$50
$100
$150
$200
$250
0.0%
0.1%
0.1%
0.2%
0.2%
0.3%
0.3%
2009 2012 2014M
illio
ns o
f US$
Perc
enta
ge o
f THE
PAE Budget (2013USD)
PAE as % of THE
Sources: Author estimation based on SPPS (2015) and DGIS (2015)
3.6 Source of HIV and STI Funding In many low income and lower middle-income countries, the expenditures on HIV initiatives rely heavily on international funding, which may represent more than 75 percent of HIV related spending. Middle and upper-middle income countries, such as Mexico, face the challenge of filling the gap left by international development agencies and donor funding when their rising economic output makes them ineligible for further funding (UNAIDS 2013). UNAIDS reports an upward trend in domestic HIV funding in upper-middle income countries, with an average of 6 percent increase, reaching 88 percent of costs associated with HIV activities, over 80 percent in average in Latin America. Similar to other upper-middle income countries, Mexico has a low level of dependency on external funding for resources dedicated to HIV. Between 2008 and 2011, public funds accounted for an average of 90 percent of national HIV expenditures. The two largest sources of financing are social security and federal government funds, which make up 42 percent and 31 percent of total funds, respectively (Figure 1.4).

22
Figure 1.4: Distribution of Expenses on HIV Response by Type of Fund (2011 in USD million)
External Funds, $12 , 2%
Private Funds, $39 , 7%
Central , $165 , 31%
State, $89 , 17%
Loans, $4 , 1%
Social Security, $225 , 42%
Public, $483 , 91%
External Funds Private Funds Central State Loans Social Security
Source: Author estimation based CENSIDA (2012)3 Over a third of public funds originate from the federal government, and have decreased as a proportion of total funds by almost a half (48 percent) in 2010 (Figure 1.5). This decrease was accompanied by an increase in the proportion of funds originating from state governments, which increased from US $28 million in 2008 to over US $85 million in 2011 (in constant 2013 USD), representing 4 percent and increasing to 18 percent of total public funds.
Figure 1.5: Distribution of Public Funds for HIV
48% 45%33% 34%
4% 6%17% 18%3%
27% 28% 26% 25%
7% 7% 7% 7%
14% 14% 15% 15%
0%
10%
20%
30%
40%
50%
60%
70%
80%
90%
100%
2008 2009 2010 2011
Government transfer to SocialSecurity
Employee contributions
Employer contributions
Loans
State Governments
Central Government
Source: Author estimation based on CENSIDA (2012)
The main source of external funding in 2008 was the United Nations Population Fund (UNFPA) (28 percent), followed by Health Alliance International (26 percent) and the Ford Foundation (14 percent) for a total of US$ 1.6 million, while the rest represented 9 percent or less. The matrix of external funding shifted by 2011, where the Global Fund (GF) resources represented almost 83 percent of external funding and Population Services International (PSI) represented 10 percent for a total of US$ 12 million.
3 Social security includes contribution and government transfers to social security.

23
The importance of the GF resources should be further noted, given that 2011 marked the beginning of what was meant to be a 5-year project focused on key populations including MSM, MSW, transgender women and UIDs ending in 2015. The project came to an end in 2013 and totaled approximately US$ 36 million (see Figure 6). If external funding remains similar in years to follow, one could expect the GF resource to represent a less significant percentage of external sources and of HIV resources, since it already represented almost 2 percent of total HIV spending in 2011. With the end of the project, the government will need to increase domestic resources to continue providing the supplies, services and capacity building formerly provided by the GF financed projects.

24
Figure 1.6: Distribution of Funds for Round 9 of the Global Fund in Mexico
Source: Based on Fernandez, Ortiz R., and Gomez O. (2012) and interviews
3.6 Allocation by Program Most of the resources spent on HIV related activities in Mexico have been allocated to treatment and care. The most recent data on total HIV spending for 2011 shows that the country spent almost US $535 million in total, with 65.5 percent directed towards treatment and care, including ambulatory and inpatient care.
Table 1.3: National Expenditures on HIV by Intervention Category (2011 US$ million)
Category Amount of expense % of Total Prevention $168 31.4%
Care and Treatment $350 65.5% Programs management $11 2.1%
Human Resources Incentives $3 0.5% Favorable environment $1 0.2%
Research $2 0.4% TOTAL $535 100%
Source: CENSIDA (2012)
Within treatment and care, ART for adults and children has required the greatest proportion of resources, at an average of 75 percent between 2008 and 2011, whereas the monitoring of specific HIV-related laboratory tests represented 15 percent of spending. Mother-to-child-transmission prevention activities, however, remained the main focus of resources among preventive activities, representing 40 percent of spending. Comparatively, male condom provision in the public sector totaled 20 percent, indicating a 32 percent decrease in spending since 2008. The following figure provides an overview of the main categories of national spending on HIV over the past years for which national data was available.

25
Figure 1.7: Distribution HIV Spending 2008-2011
23%
26%
31%
31%
73%
72%
66%
65%
4%
3%
2%
3%
0% 20% 40% 60% 80% 100%
2008
2009
2010
2011
Prevention Treatment and Care Other
Source: Author estimations based on (CENSIDA 2012)
There is a similar distribution when the analysis is restricted to resources allocated to the PAE. For the 2008-2009 year, almost 70 percent of funds were destined to treatment and care, 27 percent to prevention and approximately 1 percent to management. In 2010-2011, a larger share of funds was spent on antiretroviral (ARV) drugs (88 percent), while 13 percent went to CD4 and viral load testing for 37,204 patients (Secretaria de Salud 2013). Moreover, the PAE 2013-2018 report indicates that 61.7 percent of the funds for the HIV and STI PAE were managed by CENSIDA, 61.7 percent of which went to ART and 11.7 percent to CD4 and viral load tests for the care of 43,898 patients. 3.7 Allocation by Federative State The federal expenses on the national response to HIV and STI by way of the PAE4 almost tripled between 2009 and 2012, while having a 7 percent increase in the last two years. A similar growth rate applies to the average amount of funds per capita for the federative entities, which had a 3 percent increase over the last 2 years.
Table 1.4: Federal expenses on PAE 2009 and 2014 in USD USD 2009 2014
Total federal fund $67,607,316 $201,043,044 Average per state $2,112,729 $6,282,595
Average funds per capita $0.58 $1.69 Average funds per PLHIV $3,280 $5,745
Source: Estimation based on SPPS (2015), CONAPO (2014) and CENSIDA (2014)
The national per capita amount represents approximately half of national expenditures and is higher than the cost in other countries, when comparing different federative
4 There is no parallel monitoring system to gather regular information about spending on HIV by Social
Security or private institutions, which represent approximately half of the financing sources, based on the last report on AIDS spending (MEGAS) in 2001.

26
states. Still, the amount of funds does not seem directly related to the general population size or the identified PLHIV. When funds are controlled for population size, as in Figure 1.8, there is no direct correlation between the federal funds per capita and the size of the population, which may vary if controlling for the size of key populations and programs. For example, Quintana Roo received a larger amount of federal funds per capita than Jalisco, even though the latter has a greater number of inhabitants. Given that the federal funds are expected to cover education, prevention and treatment costs, a larger population size would be expected to have a higher amount of funds to cover prevention and detection for the general population.
Figure 1.8: PAE Federal Funds Per Capita Compared to PLHIV (2014)5
0
2
4
6
8
10
12
14
16
18
$-
$0.50
$1.00
$1.50
$2.00
$2.50
$3.00
$3.50
Sono
raCo
ahui
laZa
cate
cas
Hida
lgo
Nue
vo L
eón
Mic
hoac
ánDu
rang
oGu
anaj
uato
Esta
do d
e M
exic
oSi
nalo
aAg
uasc
alie
ntes
San
Luis
Poto
síQ
ueré
taro
Pueb
laBa
ja C
alifo
rnia
Sur
Oax
aca
Chih
uahu
aGu
erre
roJa
listo
Mor
elos
Nay
arit
Chia
pas
Baja
Cal
iforn
iaTa
mau
lipas
Cam
pech
eTl
axca
laYu
catá
nTa
basc
oCo
lima
Vera
cruz
Qui
ntan
a Ro
oDi
strit
o Fe
dera
l
Num
ber o
f inh
abita
ntsM
illio
ns
Curr
ent U
S $
Federal Contribution per capita Average funds per capita Mid-Year Population 2014
Source: Authors estimation based on SPPS (2015), CENSIDA (2014), CONAPO (2014) and IRS (2015)
Similarly, the same disparities can be seen when estimating the amount of federal funds per PLHIV. The following figure illustrates that in this case, the amount of funds federative states are receiving is also disproportionate. As an example, most other federative entities are receiving a greater amount of funds per PLHIV than Yucatán, although there is a smaller number of diagnosed PLHIV. Considering that ART represents a significant percentage of all HIV expenses, the number of ARV drugs should be more closely related to the number of PLHIV.6
5 At the time of the report, CENSIDA reported problems with the indicators on the progress of the HIV
program in Veracruz due to investment and government administration. 6 With the exception of expenditures on ARTs and monitoring tests (CD4 and viral load), the federal budget
transferred to the states is considered only an additional support for the carrying out of key actions. The allocation of this budget is not directly related to the total population in each state or PLHIV, because in order to make the transfers, it is necessary for the federal entities to have documented financial resources of previous years. If they had, the resource allocation is made based on certain population sizes depending on the type of activity to be performed.

27
Figure 1.9: PAE Federal Funds Per PLHIV Compared to Number of PLHIV (2014)
0
2000
4000
6000
8000
10000
12000
$-
$5,000
$10,000
$15,000
$20,000
$25,000
Colim
aCo
ahui
laH
idal
goSo
nora
Yuca
tán
Dis
trito
Fed
eral
Qui
ntan
a Ro
oN
uevo
Leó
nBa
ja C
alifo
rnia
Sur
Vera
cruz
Taba
sco
Oax
aca
Sina
loa
Que
réta
roTa
mau
lipas
Baja
Cal
iforn
iaCa
mpe
che
Pueb
laZa
cate
cas
Mic
hoac
ánG
uana
juat
oJa
listo
Agua
scal
ient
esD
uran
goSa
n Lu
is P
otos
íM
orel
osN
ayar
itG
uerr
ero
Esta
do d
e M
exic
oTl
axca
laCh
ihua
hua
Chia
pas
Num
ber o
f PLH
IV
Curr
ent U
S $
Federal contribution per PLHIV Average funds per PLHIV PLHIV 2014
Source: Authors estimation based on SPPS (2015), CENSIDA (2014), CONAPO (2014) and IRS (2015) 3.8 Cost of Treatment In 2003, the government of Mexico made the decision to provide universal access to HIV treatment with ART. As a result, the country has made considerable efforts to provide ART treatment and medicines to PLHIV, who currently have access to ARV medication free-of-charge. According to the 2014 Global AIDS Response Progress Reporting (GARPR) guidelines, 51.1 percent of all adults and children living with HIV were receiving ART in 2013, which differs from past estimations which considered the percentage of eligible PLHIV who were receiving ART (CENSIDA 2014). Nonetheless, this indicator is not comparable to past years since Mexico expanded eligibility criteria for ART. 3.9 ART Coverage According to the most recent WHO data, Mexico has achieved over 80 percent coverage of ARV among those eligible for ART (WHO 2015), which makes it one of the best performers of the LAC region, compared to 43 percent of PLHIV in Latin America who were on ART in 2013, 64 percent of children and 44 percent of adults (PAHO 2014). In addition to the overall coverage of ART for eligible PLHIV, important factors determining the efficiency of the national HIV and STI response, as well as the financial cost it represents to the country, is the availability of rapid test and early detection, and the adherence to treatment and provision of the most efficient treatment. Countries in LAC have been improving their information systems and data analysis to obtain a better understanding of the HIV continuum of care. Preliminary estimates are included in Figure 2.010, and show that Mexico was below the average of other LAC country in most indicators considered within this cascade of health care, ranking 5 percentage points higher in terms of coverage (PAHO 2014).

28
Figure 2.010: Examples of HIV Continuum of Care Cascade in Latin America (2012-2013)
63
5449
33
71
44
34
80
61
4840
70
55
36
6761
4740
69
3026
18
0
10
20
30
40
50
60
70
80
90
100
Persons with HIV Persons with HIV thatknow their diagnosis
Retained in care On ART With suppresed viralload
Mexico LAC Brazil Argentina Costa Rica Paraguay
Source: Authors estimation based on PAHO (2014)
According to the UNSW OPTIMA-HIV estimations, under the low prevalence scenario, dedication of an additional 10 percent of resources to the national HIV response ART coverage would potentially increase full coverage to 86 percent and resources by 50 percent. With a higher prevalence, 25 percent more resources would be needed to reach 90 percent treatment coverage and 200 percent increase of funds to achieve full coverage. These estimates were made under the assumption that unit treatment costs remained the same since 2011. If lower prices were obtained for antiretroviral medication, higher coverage rates could be expected with the existing resources. 3.10 Cost of ART ARV treatment provision represents approximately 50 percent of national spending on HIV (CENSIDA 2012). In the public sector, SPSS beneficiaries’ treatment is funded through the Fund for Catastrophic Expenses (FPGC). This fund was created after the General Health Law reform in Mexico in 2003 to financially support the care for high-cost diseases, which includes interventions for breast cancer, cancer in children, acute lymphoblastic leukemia and chronic renal failure. Spending on ART alone accounted for 38 percent of the total FPGC and is predicted to consume it entirely by 2019 (OECD 2016). Overall, financing for the provider response is dependent on state health systems or social security networks. In 2011, ARV was financed in almost equal parts by resources administered by CENSIDA and public social security (CENSIDA 2012). Prior to 2008, a comparative analysis of per unit price of ARVs performed by Adesina, Wirtz, & Dratler (2013) showed that Mexico paid 46 times the per unit price for lamivudine (3TC). Additionally, the separate negotiations and purchase of ARV by SSA and IMSS resulted in price difference for some ARVs of more than 20 percent (Adesina, Wirtz, & Dratler, 2013). This led to the issuance of a decree by the Government in 2008 for the creation of the Coordinating Commission for Negotiating the Price of Medicines and other Health Inputs (CCPNM), tasked with coordinating price negotiations for patented medicines and medical devices on behalf of the major health systems and with providing guidance to improve drug supply chains. This entity is charged with the centralized procurement of ARV, seeking to reduce costs through economies of scale.
29
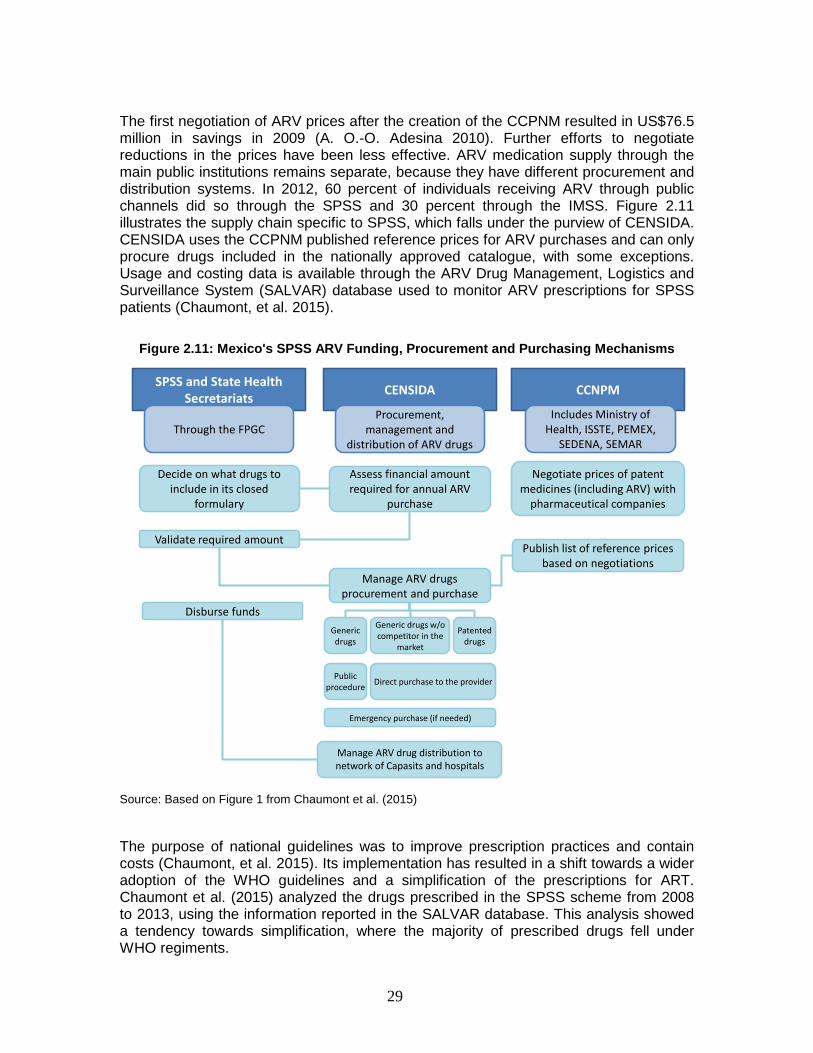
The first negotiation of ARV prices after the creation of the CCPNM resulted in US$76.5 million in savings in 2009 (A. O.-O. Adesina 2010). Further efforts to negotiate reductions in the prices have been less effective. ARV medication supply through the main public institutions remains separate, because they have different procurement and distribution systems. In 2012, 60 percent of individuals receiving ARV through public channels did so through the SPSS and 30 percent through the IMSS. Figure 2.11 illustrates the supply chain specific to SPSS, which falls under the purview of CENSIDA. CENSIDA uses the CCPNM published reference prices for ARV purchases and can only procure drugs included in the nationally approved catalogue, with some exceptions. Usage and costing data is available through the ARV Drug Management, Logistics and Surveillance System (SALVAR) database used to monitor ARV prescriptions for SPSS patients (Chaumont, et al. 2015).
Figure 2.11: Mexico's SPSS ARV Funding, Procurement and Purchasing Mechanisms
SPSS and State Health Secretariats CENSIDA CCNPM
Through the FPGCProcurement,
management and distribution of ARV drugs
Includes Ministry of Health, ISSTE, PEMEX,
SEDENA, SEMAR
Decide on what drugs to include in its closed
formulary
Assess financial amount required for annual ARV
purchase
Negotiate prices of patent medicines (including ARV) with
pharmaceutical companies
Validate required amount
Manage ARV drugs procurement and purchase
Publish list of reference prices based on negotiations
Disburse fundsGeneric drugs
Generic drugs w/o competitor in the
market
Patented drugs
Public procedure Direct purchase to the provider
Emergency purchase (if needed)
Manage ARV drug distribution to network of Capasits and hospitals
Source: Based on Figure 1 from Chaumont et al. (2015)
The purpose of national guidelines was to improve prescription practices and contain costs (Chaumont, et al. 2015). Its implementation has resulted in a shift towards a wider adoption of the WHO guidelines and a simplification of the prescriptions for ART. Chaumont et al. (2015) analyzed the drugs prescribed in the SPSS scheme from 2008 to 2013, using the information reported in the SALVAR database. This analysis showed a tendency towards simplification, where the majority of prescribed drugs fell under WHO regiments.

30
In 2008, over ten thousand patients (representing 37 percent of the total universe) received prescriptions classified as “other drug combinations”, which decreased to 10 percent in 2013. Even though most of the first-line regiments for adults complied with WHO recommended guidelines, the distribution of regiments changed since 2008, where the fixed-dose-combination (FDC) of Tenofovir, Emtricitabine and Efavirenz (recommended by 2013 WHO guidelines) introduced in 2012 represented 42 percent of all regiments by 2013. This differs from the trend in the region, where 12 percent of all patients on first-line regiment in 2013 were receiving ‘TDF + FTC + EFV’, which includes TDF/TFC/EFV and TDF/FTC + EFV (PAHO 2013). When comparing SALVAR data to the most recent Global AIDS Response Progress Report for Mexico, the analysis is restricted to nine regiments used in 2014 for first-line treatment of adults, which accounted for 70 percent of patients over the age of 10 and were not used for second line treatment. As Figure 12 shows, most SPSS patients on first line treatment received the 3-component FDC of TDF/TFC/EFV but did not receive the regiment with 2-component FDC of TDF/TFC + EFV. In contrast with the LAC trend, less than 3 percent of adult patients received the regiment composed of AZT/3TC + EFV, which was used by 35 percent of patients in LAC in 2013, and less than 1 percent received AZT/3TC + NVP under SPSS in 2014, which was prescribed to 10 percent of patients in LAC in 2013. Overall, there are a greater number of TDF-based first line regiments being prescribed to SPSS patients, in contrast to AZT-based regiments in the region.
Figure 12: Adult First-line ART Regiments Prescribed Under the SPSS System (2008-2013)7
* WHO-preferred regiment
Sources: Authors’ estimations based on Chaumont, et al. (2015) and CENSIDA (2015)
7 This analysis only include prescription that have only been used in 2014 for adult (>10 YOA) first line
treatment in order to not include regiments that are used in both first and second line treatment or for other age groups. The graph includes 9 of a total of 17 regiments, including those classified as other in CENSIDA(2015).

31
There are a larger variety of regiments when the information is restricted to second-line treatment for adults (Figure 2.13). In contrast to the region, where 86 percent of patient received one of the four most common second-line ART (PAHO 2014), around 44 percent of adult received two of these under SPSS in 2014 (AZT/3TC + LPV/r and AZT/3TC + ATV + RTV8) and none received the TDF + 3TC regiments. Most second-line regiment patients received treatments composed of TDF/FTC + LPV/r (or ATV + RTV).
Figure 2.13: Adult ART Regiments Prescribed Under SPSS System (2008-2013) 9
13% 14% 15% 13% 11% 9% 6% 4%5%
21% 15% 12% 13% 14% 8% 13% 8% 25%
8%
8%4% 5% 6% 7% 10%
9%19%6% 8%
10%3%
35%35% 34% 33% 31% 30%
30%
22%
2%
22% 25% 28% 28% 29% 29% 34%22%
3%
0%
10%
20%
30%
40%
50%
60%
70%
80%
90%
100%
2008 2009 2010 2011 2012 2013 2014 2014(2nd line)
LAC
TDF/FTC + ATV + RTV
TDF/FTC + LPV/r
ABC/3TC + LPV/r†
ABC/3TC + ATV + RTV*
AZT + TDF + LPV/r†
ABC + TDF + LPV/r
AZT/3TC + LPV/r*
ABC + DDl + LPV/r
TDF/FTC + SQV + RTV
AZT + TDF + ATV + RTV†
* WHO-preferred regiment
Sources: Sources: Authors estimations based on Chaumont, et al. (2015) and CENSIDA (2015)
Although there has been some consolidation of the number of regiments, by 2014 there were 14 regiments, notwithstanding those categorized as other. The latter were prescribed to 27 percent of SPSS adults and adolescent patients aged 10 years and older receiving second-line treatment. Given the cost of ART, additional consolidation would allow for a reduction in the number of ARV drugs, while increasing the volume of each drug that is available, which in turn would increase the potential negotiation power when procuring the drugs. The impact of increased negotiation power is further explained in the following sections.
8 The 2015 GARPR report for Mexico includes two 5 component regiments, one of which is AZT/3TC + TDF
+ ATV+ RTV that in this case is compared to the WHO-preferred regiment of AZT/3TC + ATV/r by excluding TDF.
9 The treatments that have a ‘†’ symbol are those that were used exclusively for second-line treatment in 2014, while the rest included regimes that were used for both first and second line. The column denominated ‘2014’ adds the number SPSS patients for both 10 regimes used in first and second line treatment for adult in 2014, while the next column only includes that year’s adult second line treatments.

32
3.10.1 Cost of First-line Treatment According to the 2011 AIDS spending report, first-line treatment of adults and children represented 51 percent of all ART costs, 51 percent of adult ART and 37 percent of pediatric ART. In Mexico, the cost of the two most common WHO-preferred first-line treatment regiments, provided free of cost through SPSS, range from just under US $2 thousand to US $8 thousand. The first-line ARV regiment composed of Zidovudine/Lamivudine (300 mg/150 mg) + Efavirenz (600 mg) (AZT + 3TC + EFV), used by 35 percent of patient in LAC and 3 percent of SPSS patients in 2013, has a per person-year cost of US $8 thousand. The second most common regiment in the region (used by 18 percent of patients), but most widely used in Mexico, is composed of Tenofovir /Emtricitabine (300/200mg) + Efavirenz (600mg) (TDF/FTC + EFV) and amounts to US $2.5 thousand per person-year cost, while a fixed-dose combination of Tenofovir/Emtricitabine/Efavirenz (TDF/FTC/EFV) equals US $2.4 thousand per person-year cost (PAHO, 2014 and CENSIDA, 2015). Compared to the median prices of upper-middle income and LAC countries, Mexico is spending between 10 and 24 times more on first line treatment TDF/FTC + EFV, and between 15 to 19 times more on the fixed-dose regiment. In 2013, first line treatment of TDF/FTC + EFV cost a median of US $159 per person-year across upper middle-income countries. The variation in ARV drug cost in the regions, according to the PAHO (2013) report, ranged from US $119 to US $4.4 thousand, with a median of US$ 774, where the main cost driver is the cost of TDF/FTC component. Within the sample of countries included in Figure 214, Mexico spent 20 times more on the FTC first-line regiment than Belize, and 3 times more than the median.
Figure 214: Annual Cost Per Patient of TDF/FTC/EFV (2012)
0.1 0.2 0.3 0.7 0.8
2.4 2.9
3.2
4.4
0.8
1.7
- 0.5 1.0 1.5 2.0 2.5 3.0 3.5 4.0 4.5 5.0
US
$ pe
r pat
ient
-yea
r
Thou
sand
s
Source: Author recreation based on Figure 2 of PAHO (2013)
The price differentiation of the FDC of three components for the above mentioned first-line treatment places a strain on the government’s resources. In 2014, 87 percent of HIV positive adults over the age of 10 were receiving first-line treatment (CENSIDA 2015). If the FDC continues on as the most common first-line treatment, ART will take up a

33
greater proportion of the FPGC to treat SPSS patients at the expense of other high-cost diseases. Unless the cost per patient decreases, the necessary budget will increase if the epidemic grows or even if it remains stable. 3.10.2 Cost of Second-line Treatment Expenses on second-line treatment in Mexico accounted for slightly over a third of total ARV spending in 2011. Among adults, 17 percent of funds were spent on this category, while among children second-line treatment costs represented 41 percent of overall children ART, a larger percentage than the 41 percent spent on first-line treatment. Similarly, a greater percentage of resources dedicated to children’s ART was spent on third-line treatment after the failure of the second-line treatment (17 percent) compared to adult ART (7 percent). The analysis will focus on adults since ART for that age group represented 63 percent of total ARV expenses. Even though prices of both lines of treatment continue to decline due to greater competition and availability of WHO-prequalified generic drugs, the price of newer drugs remain very high. The cost per patient per year of the WHO preferential second line treatment (WHO 2013), composed of Zidovudine/Lamivudine (300 mg/150 mg) and Lopinavir/Ritonavir (200 mg/50 mg) (AZT/3TC + LPV/r), was of over US $10 thousand for 2015 (CENSIDA 2015). This was also the most common regiment in LAC in 2013, prescribed to 13 percent of SPSS patients in 2013. An alternative second-line regiment (2 percent of patients in LAC) composed of Tenofovir/Emtricitabine (300/200mg) + Lopinavir/Ritonavir (200 mg/50 mg) (TDF/FTC + LPV/r), was the most common among SPSS patients in 2013 (9 percent of all prescription and 40 percent of second line treatments). The cost of this treatment amounts to almost US $5 thousand per person-year in Mexico. The second most commonly prescribed second-line treatment in Mexico was composed of Tenofovir/Emtricitabine (300/200mg) + Atazanavir 300 mg + Ritonavir 100 mg (bottle) costs over US $5 thousand (PAHO, 2014; CENSIDA, 2015; Chaumont, et al., 2015). As shown in Figure 15, Mexico has a significantly higher cost per patient for second line treatment for the prefered option, at three times higher than the median in 2012. Prices of second-line regiments declined between 2010-2013 overall, where lower to middle income countries were able to access second-line ART at US $330 per person per year. The main cost drive was Lopinavir/Ritonavir (LPV/r) (WHO 2014), which for Mexico represented 73 percent of the estimated total cost in 2015 of almost $4 thousand for AZT (200 mg) + 3TC (150 mg) + (LPV/r (200/50 mg) with 2015 prices of ARV.

34
Figure 15: Annual Cost Per Patient of AZT/3TC + LPV/r (2012)*
Source: Authors estimation based on Figure 3 of PAHO (2013)
The comparison to regional prices is different for the alternative second-line treatment most included in the PAHO (2013) report and most commonly prescribed to SPSS patients (Figure 16). In this case, Mexico had a 58 percent higher than average cost per patient-year in 2012 and 46 percent above the sample median.
Figure 16: Annual Cost Per Patient of TDF/FTC + LPV/r (2012)
0.3 0.6 0.8 1.0
3.13.6
4.5
5.56.2
3.1 2.8
0.0
1.0
2.0
3.0
4.0
5.0
6.0
7.0
US
$ pe
r pat
ient
-yea
r
Thou
sand
s
Source: Authors estimation based on Figure 4 of PAHO (2013)
Reducing the per person cost of HIV treatment will be a key aspect in the financial sustainability of the HIV and STI national response. Given that ARV treatment represents approximately half of total expenditures in HIV, lower drug prices of ARV represent a great savings opportunity. The fall in drug prices in all regions is the result of greater competition between manufacturers, economies of scale, adjustments in tender specifications and reduction in logistical expenses (WHO 2014). Mexico has challenges

35
with regards to the procurement of ARV medication at more competitive prices like similar other countries. This report will explore some of the opportunities the country faces, based on its current structure and regulations.10
4. METHODOLOGY In this section we describe the model, parameters, populations and programs that were used to estimate the allocation that could reduce most new HIV infections and deaths. 4.1 The OPTIMA-HIV Model The results of the Allocative Efficiency Analysis presented here were developed using the OPTIMA-HIV model, which is a mathematical model of HIV transmission and disease progression integrated with an economic and program analysis framework. The epidemiological module uses evidence-based biological transmission probabilities and sexual and drug-injecting behaviors in the population to project the evolution of the epidemic. The costing and optimization module parameterizes relationships between the cost of HIV intervention programs, the coverage level attained by these programs and the resulting outcomes. Using these relationships in combination with the epidemic module, OPTIMA-HIV can calculate how incremental changes in the level of funding allocated to each program will impact overall epidemic outcomes. In addition, by using a mathematical optimization algorithm, OPTIMA-HIV is able to determine an allocation of funding across different HIV programs that leads to the best outcomes, or the minimal amount of total funding to achieve chosen outcome targets in a given timeframe. 4.2 Data Collection, Populations and Programs Our epidemiological projections and allocative efficiency analyses in Mexico are based on the country-specific epidemiological, demographic, behavioral and programmatic data. Spectrum output was used to inform prevalence and population size estimates for certain populations in OPTIMA-HIV. Medición del Gasto en SIDA (MEGAS) files, Global AIDS Response Progress Reporting (GARPR) publications, and assumptions made by Centro Nacional para la Prevención y el Control del VIH/SIDA (CENSIDA) in collaboration with Sanigest informed the programmatic data. OPTIMA-HIV, is a flexible model allowing the user to decide which populations, programs, timeframes and funding levels to consider in a country analysis. Populations modelled are not the same as in Spectrum and thus, calibrations are not directly comparable. Those used in the OPTIMA-HIV analysis are summarized in Table 2.6.
10 Given its importance, the GoM has undertaken a number of efforts to reduce the cost of ARVs. For more
information, see: http://www.censida.salud.gob.mx/descargas/transparencia/Flexibilidad_en_el_marco_juridico1.pdf http://www.censida.salud.gob.mx/descargas/transparencia/Flexibilidad_en_el_marco_juridico2.pdf

36
Clients are defined as a separate population to account for their riskier behavior, as are children, allowing for a more robust treatment of PMTCT.
Table 1.5: Populations Used in the Program
Populations defined in the model
Description/ assumptions Comments
Female sex workers Clients of sex workers
Men who have sex with men and
bisexual men Male sex workers
People who inject drugs Prisoners Children
Male adults Female adults
Older men
Older females
Females, aged 15-49 Males, aged 15-49
Males, aged 15-49
Males, aged 15-49 Males, aged 15-49 Males, aged 15-49
Males and females aged 0-14 Males, aged 15-49
Females, aged 15-49 Males, aged 50+
Females, aged 50+
Not defined in Spectrum
analysis MSM and bisexual men separate in Spectrum
Not defined in Spectrum analysis
Not defined in Spectrum
analysis Not defined in Spectrum
analysis

37
Table 1.6 outlines the programs included in the analysis. In the absence of coverage data being provided, ‘HIV testing and counseling’ (HTC) is treated as a fixed cost. This is considered a reasonable assumption given the fixed infrastructure and laboratory costs generally account for a major component of such programs and outreach to promote testing generally occurs as part of other (prevention) programs (as indicated in Table 1.5). Additional programs treated as fixed costs and not included in optimization are HIV care; diagnosis and treatment of STI; other prevention; management; and other costs.
Table 1.6: Programs Defined in Model and Included in Optimization Analysis
Program Description/ assumptions Programs for sex workers Condom distribution, promotion of HIV testing, HIV related
education Programs for men who have sex with
men Condom distribution, promotion of HIV testing, HIV related
education Programs for people who inject drugs Condom distribution, promotion of HIV testing, HIV related
education Opiate substitution therapy Provision of medication and related counselling
Prevention for prisoners Condom distribution, promotion of HIV testing, HIV related education
General population prevention (SBCC/condoms) and testing
Condom distribution, promotion of HIV testing, HIV related education
Antiretroviral therapy Antiretroviral drugs, related laboratory monitoring and clinical visits
Prevention of Mother to Child Transmission
HIV testing of pregnant women, counselling and provision of antiretroviral prophylaxis for women living with HIV
The current available annual resource envelope is estimated at $657,474,985 with 16 percent of the budget accounted for by fixed-cost programs. These are programs without a direct measurable impact on the behavioral outcomes that directly affect the epidemic and therefore excluded from the optimization, leaving 84 percent of the HIV budget available for reallocation. 4.3 Calibration HIV transmission dynamics were calibrated to data on prevalence by population group; general population, female sex workers, injecting drug users, men who have sex with men, and ART coverage. In lieu of feedback from regional or country experts, overall PLHIV, prevalence, new infections and deaths were calibrated with particular sensitivity to Spectrum estimates, accounting for differences in populations being considered. 4.4 HIV Prevalence The calibration for Mexico reflects a low endemic concentrated epidemic with overall prevalence of around 0.1-0.2 percent in 2014. Overall prevalence remains stable despite a changing response to the epidemic and increasing ART coverage. The total number of PLHIV is slowly increasing proportionally with the population size.
38
Calibration results for HIV prevalence in different population groups are shown in Figure 16. Prevalence is highest in the key populations, with greatest prevalence in MSW (20 percent), MSM (9 percent) and PWID (4 percent) as at 2014. Other at-risk populations that have higher estimated prevalence than the general population include: FSW at 1.3 percent, prisoners at 1 percent and clients of sex workers at 0.3 percent. HIV prevalence is estimated to be much lower in the general population. The increasing trend in prevalence for the 50+ population is consistent with increased survival of PLHIV on ART while scattered data for females 15-49 suggests a stable prevalence around 0.05 percent. Prevalence data for males aged 15-49 years were based on Spectrum input data, ranging from 0.05 - 0.11 percent over the period 2000-2005. We note that Spectrum estimates prevalence levels three-fold higher, at 0.3 percent. In the absence of guidance on the judgement behind these estimates, two options were considered (Figure 17):
• Lower Male 15-49 prevalence that fits with the Male 15-49 data. This option results in overall prevalence and numbers of PLHIV that are significantly lower than Spectrum estimates.
• Higher Male 15-49 prevalence is calibrated to closer match Spectrum. Male 15-49 prevalence is estimated at around 0.2 percent, in between the survey data and Spectrum estimates, with the general population contributing two thirds of new infections and over half of deaths in recent years.
Dots represent input data for prevalence in population. Spectrum estimates, represented by the red line are only available for the period of 2005 to 2014.

39
Figure 17: Calibrations Results
There are an estimated 145,000-185,000 (low and high calibrations respectively) PLHIV in Mexico, broadly in line with Spectrum estimates but with a more gradual rise since 2000 (Figure 1.8). MSM account for less than 1 percent of the total population but nearly half (40-50 percent) of PLHIV, while the general population account for 96 percent of the total population but 35-50 percent of the PLHIV burden.

40
Figure 18: PLHIV Estimates. a. Comparison of OPTIMA-HIV and Spectrum; b. PLHIV Composition in OPTIMA-HIV “high” Calibration, c. PLHIV Composition in
OPTIMA-HIV “low” Composition.
4.5 Diagnoses, Treatment and Deaths The significantly higher prevalence in MSM and MSW is consistent with relatively high historical testing rates, diagnoses and, subsequently, treatment coverage (Figure 1.9). Testing rates are around 50 percent for MSM and MSW and of less than 5 percent for males in the general population with treatment coverage estimated at around 65-80 percent for MSM and MSW, considerably higher than the 30-40 percent estimated for males in the general population. Consequently, HIV-related deaths in MSM, MSW and FSW have fallen at a faster rate than in the general population, decreasing three-fold in MSM and halving in the general population between 2000 and 2015.
Figure 19: New Diagnoses, Profile of PLHIV on ART and HIV-related Deaths (Higher Prevalence Setting)

41
4.6 New infections
Figure 20: New Infections (Higher Prevalence Setting)
Historically, the MSM population was the largest contributor to new infections but a four-fold decline between 2000 and 2015, alongside a more gradual halving of deaths in the general population over the same period, now sees general population males as the largest contributor to new infections (Figure 20). The OPTIMA-HIV calibration suggest that the epidemic in Mexico HIV epidemic has changed with decreases in incidence among MSM. Spectrum calibration from 2005 to 2014 shows a similar rate of decline in new infections, and a slower decrease in AIDS-related deaths.
5. RESULTS
In this section, we describe the results of the optimizations and an additional simulation. The purpose of the simulations is to understand how to best allocate resources to reduce new infections and deaths. 5.1 Optimizations The optimizations address the following key policy questions:
1. What is the minimum number of deaths and new infections that can be achieved? a. With the current volume of funding, allocated according to current
expenditure? b. With the current volume of funding, allocated optimally?

42
2. What is the epidemiological impact if available resources are scaled up by 50 percent and 100 percent of current levels and allocated optimally?
3. What is the minimum amount of funding required for halving new infections and deaths by 2030 if funds are allocated optimally?
All analyses were performed under the assumption of universal ART eligibility for all PLHIV, which was introduced in Mexico in 2014, and with the ethical constraint that nobody on OST, PMTCT or ART can be taken off treatment, except through natural attrition. 5.2 What is the Minimum Number of Deaths and New Infections that Can be Achieved at Current and Scaled up Budgets? Optimization analyses under the most recent year of reported budget of $657,474,985 were run over the period 2016-2030 with the objective of minimizing cumulative deaths and cumulative new infections by 2030. The analysis considered that around 86 percent of the budget is available to direct program spending and can be potentially reallocated (16 percent accounted for by fixed-cost programs). We apply the ethical constraint that no one who initiates ART or OST is to stop receiving treatment. Under both calibrations, a key message is that ART is of high priority and should be scaled up further within the available resource envelope (Figure 21). If more resources are available then the results are clear that ART is the program that should be prioritized over other programs. ART is the most cost-effective intervention. With around 35,000 diagnosed but not yet on treatment and a further around 35,000 undiagnosed, the OPTIMA-HIV results suggest that it is most efficient to first link the diagnosed pool to treatment before scaling up testing in the general population. Under the higher general population setting (Figure 21 and 22) the results indicate that:
• With no extra resources, the optimal allocation would avert 4,235 deaths, and 3,371 new infections, an improvement of health outcomes by around 6 percent.
• ART coverage would increase by about 4-8 percent at the small expense of other programs, but overall this would be a better use of limited resources.
• If an additional 50 percent funding were to become available then ART again is prioritized and other programs would remain roughly at their current levels. This would allow treatment coverage to reach 90 percent and would result in an estimated 50,000 new infections and 40,000 deaths being averted. If additional resources become available above a 50 percent increase, then once key population prevention reaches a natural saturation point, funds should best be allocated to PMTCT and general population prevention and testing.

43
Figure 21: Optimal Funding Allocation with Current and Increasing Budgets – higher General Population Prevalence Setting
Figure 22: Summary Results – Higher General Population Prevalence Setting
We also produced sensitivity analyses according to assumptions that the prevalence in the general population is actually lower than Spectrum estimates and aligns with the available data. Under this scenario:
• We observe similar results with ART being the most important program to scale up.
• The lower overall burden means that treatment coverage of around 80 percent is achievable with available funds.
• With an additional 50 percent of resources, full coverage of treatment and considerably large scale-up of priority prevention is possible, with around 26,000 infections and 23,000 deaths averted. With these 50 percent additional resources, it is also possible to scale-up PMTCT and general population prevention within the overall programmatic mix in a way that is most cost-effective overall.

44
Figure 23: Optimal Funding Allocation with Current and Increasing Budgets – Lower General Population Prevalence Setting
Figure 24: Summary Results – Lower General Population Prevalence Setting
5.3 What is the Minimum Amount of Funding Required to Halve New Infections and Deaths by 2030 if Funds are Allocated Optimally? Optimization analyses were run over the period 2016-2030 with the objective to halve annual incidence and AIDS-related deaths by 2030. In the scenario of assuming higher Male 15-49 prevalence a 50 percent reduction in annual HIV incidence and AIDS-related deaths can be achieved with 25 percent additional resources if most efficiently used to fund a scale up of ART (Figure 24a). This would result in increase of ART coverage from 52 percent to 80 percent. In the scenario of assuming lower Male 15-49 prevalence: The same outcomes can be achieved with only 10 percent additional resources, if most efficiently used to fund a

45
scale up of ART, which would lead to a rise in ART coverage from 70 percent to 86 percent11 (Figure 25).
Figure 25: Minimum Funding Required to Achieve 50% Reduction in HIV Incidence and
AIDS-related Deaths by 2030.
As would be expected, results differ between the higher and lower general population prevalence settings, particularly at higher levels of funding. More recent data on the overall size and composition of the HIV budget as well as unit costs of programs would be valuable. Any change in the size or composition of the HIV budget since 2011 would flow through to optimization results and estimated epidemiological impacts. 5.4 Other Simulations: How Much Would it Cost to Achieve 90-90-90? To evaluate the feasibility of 90-90-90 properly, we would require more information to estimate the cost of reaching PLHIV through different outreach methods. However, we found that if the prevalence in the general population is towards the lower bound of our assumptions then the target is achievable even with available resources or moderate increases, if they are allocated optimally. Under the higher general population prevalence scenario, an additional 25-50 percent of funds could make 90-90-90 possible. 5.5 Other Opportunities and Challenges in ART Drug Procurement The initial result of the creation of the Commission in 2009 was a reduction in the total expenditures on ARV of 45 percent of ARV costs, equaling savings of US $76.5 million (Adesina, Wirtz and Dratler 2013). However, according to the estimates made by Adesina, Wirtz and Dratler (2013) using GPRM data of upper-middle income countries (UMIC), Mexico would have saved US $128 million if the Commission had achieved the median prices. The country’s public sector would have saved more money if the Commission could achieve the median prices reported in the GPRM for upper-middle
11 This trend will be reviewed in consultation with the Government of Mexico.
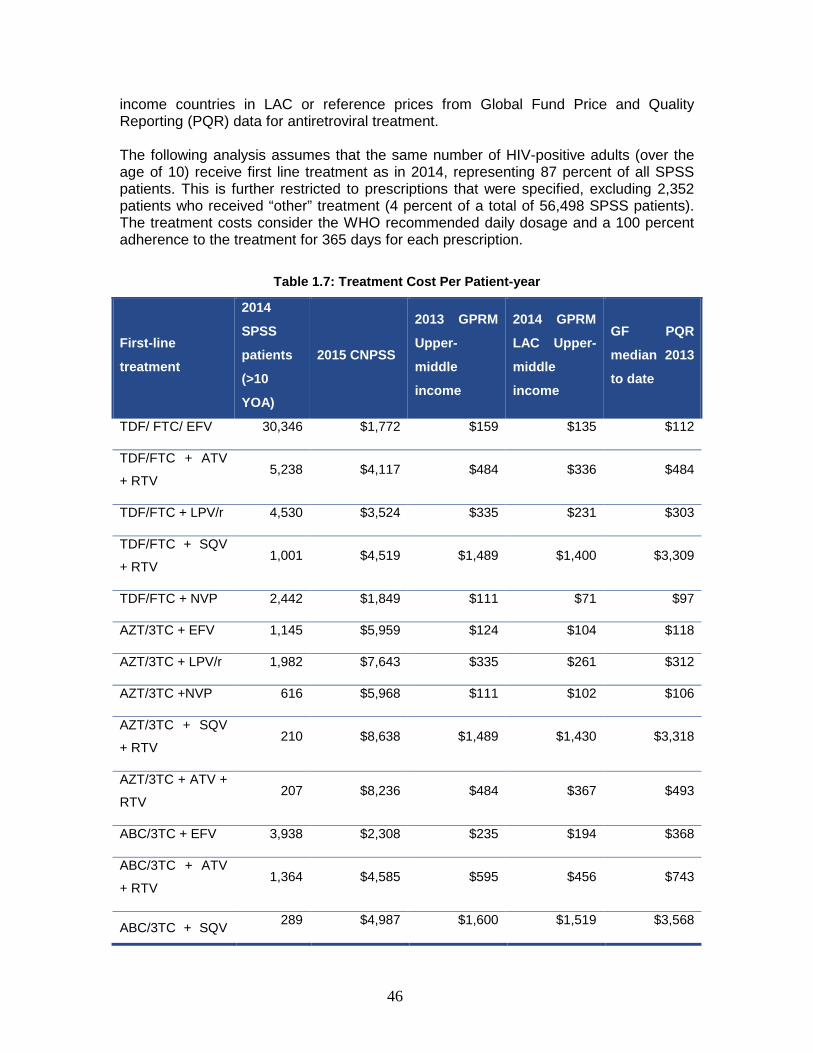
46
income countries in LAC or reference prices from Global Fund Price and Quality Reporting (PQR) data for antiretroviral treatment. The following analysis assumes that the same number of HIV-positive adults (over the age of 10) receive first line treatment as in 2014, representing 87 percent of all SPSS patients. This is further restricted to prescriptions that were specified, excluding 2,352 patients who received “other” treatment (4 percent of a total of 56,498 SPSS patients). The treatment costs consider the WHO recommended daily dosage and a 100 percent adherence to the treatment for 365 days for each prescription.
Table 1.7: Treatment Cost Per Patient-year
First-line
treatment
2014
SPSS
patients
(>10
YOA)
2015 CNPSS
2013 GPRM
Upper-
middle
income
2014 GPRM
LAC Upper-
middle
income
GF PQR
median 2013
to date
TDF/ FTC/ EFV 30,346 $1,772 $159 $135 $112
TDF/FTC + ATV
+ RTV 5,238 $4,117 $484 $336 $484
TDF/FTC + LPV/r 4,530 $3,524 $335 $231 $303
TDF/FTC + SQV
+ RTV 1,001 $4,519 $1,489 $1,400 $3,309
TDF/FTC + NVP 2,442 $1,849 $111 $71 $97
AZT/3TC + EFV 1,145 $5,959 $124 $104 $118
AZT/3TC + LPV/r 1,982 $7,643 $335 $261 $312
AZT/3TC +NVP 616 $5,968 $111 $102 $106
AZT/3TC + SQV
+ RTV 210 $8,638 $1,489 $1,430 $3,318
AZT/3TC + ATV +
RTV 207 $8,236 $484 $367 $493
ABC/3TC + EFV 3,938 $2,308 $235 $194 $368
ABC/3TC + ATV
+ RTV 1,364 $4,585 $595 $456 $743
ABC/3TC + SQV 289 $4,987 $1,600 $1,519 $3,568

47
First-line
treatment
2014
SPSS
patients
(>10
YOA)
2015 CNPSS
2013 GPRM
Upper-
middle
income
2014 GPRM
LAC Upper-
middle
income
GF PQR
median 2013
to date
+ RTV
ABC/3TC + NVP 644 $2,317 $222 $191 $356
ABC + ddl +
LPV/r 101 $2,789 $630 $407 $542
ABC + TDF +
LPV/r 93 $3,779 $446 $347 $412
Sources: Author estimation based on CENSIDA (2015), The Global Fund (2016) and WHO (2013)
Based on the volume of patients and the estimated annual treatment costs per patient, the potential savings for this group of patients would range from US $132 million to almost US $137 million.
Figure 26: Potential Savings on Adult First-line Treatment Using Median Prices
$148
$16 $14 $12
$132 $134 $137
$0
$20
$40
$60
$80
$100
$120
$140
$160
Mexico 2015 GF PQR LAC UMIC(GFRM)
UMIC (GFRM)
Mill
ions
Savings
Total Cost
Source: Author estimation based on CENSIDA (2015), The Global Fund (2016) and WHO (2013)
The ability of the CCPNM to achieve better prices when negotiating with pharmaceutical manufacturers and distributors will depend on the institutional structure, market power of the sellers (manufacturers) and buyer, market segmentation due to price-responsiveness and the potential for arbitrage (Frank 2001). In this regard, the disjointed HIV response in Mexico, where each social security scheme has its own supply chain, creates inefficiencies in the system and decreases the country’s bargaining power. Potential changes to the purchasing structure in Mexico include the
48
strengthening of the CCPNM and CENSIDA’s monitoring and regulating roles, beginning with the availability of information on local costs and international prices for ARV (Hitz, et al. 2014). As shown by this report, presently the only detailed information available on ARV provision, regiments and costs is for SPSS patients, which limits the situational analysis and financial projections. The seller market power is currently enhanced by the existence of a series of international treaties and local regulation that limit Mexican institutions’ flexibility in negotiating ARV prices. The relevant international treaties signed by Mexico include the Agreement on Trade-Related Aspects of Intellectual Property rights (TRIPS) and the North American Free Trade Agreement (NAFTA). The first requires the introduction of 20-year patents in all fields of technology. Any flexibility that could be gained from this treaty is limited by the NAFTA’s restraint on generic manufacturers to produce and market affordable version of patent drugs (Chaumont, et al. 2015). This is reflected in the fact that approximately half of the ARV drugs purchased by CENSIDA through the FPGC between 2010 and 2012 were patented (17 of 35 drugs) “Patented drugs represented 83 percent of total expenditures for the period, and only eight patented drugs represented 78 percent” (Chaumont, et al. 2015). Looking at first-line treatment prescriptions, TDF/FTC + EFV represented 32 percent of expenditures in that period, while in 2012 the FDC of TDF/FTC/EFV was already 17 percent of expenditures. The purchase of generic drugs is further limited by local regulations related to patent linkages, which do not allow for drug imports from providers outside Mexico except from patent owners or authorized licensee, thus restricting the import from other countries that purchase the same drug at a cheaper price. Additionally, Mexico cannot benefit from the patent drugs purchased through the PAHO strategic fund. Moreover, the Bolar Clause does not allow companies to access clinical trials results for 5 years, so any new company would have to perform new trials, limiting competition and benefiting patent drugs (Chaumont, et al. 2015). Given the regulatory limitations placed on policy makers when controlling ARV prices, spending control could be influenced through the improvement of prescription practices (Chaumont, et al. 2015). CCPNM’s bargaining power and CENSIDA’s buyer power could be increased first by through the alignment of the procurement calendars between CENSIDA and other public institutions, and secondly, through convergence of the schemes by explicitly defining the HIV services and medications by social security (SS) schemes. The alignment of calendars would allow for greater economies of scale, while the creation of a catalogue would allow for greater demand price elasticity by allowing Mexico to redirect flow of drug sales within a therapeutic category (Frank 2001), increasing the buyer power. As an example of this increase in buyer power, the ability of the Department of Veteran Affairs of moving the market share from one manufacturer’s product to another through the closure of classes resulted in price concessions of 16-41 percent (Frank 2001). Most OECD countries have a nationally established list of medications covered by the insurance schemes. In Mexico, this should parallel a national positive list of HIV interventions that apply to both SPSS and other social security affiliates (OECD 2016). This would require the revision of the approved national closed formulary to align with all social security schemes, even if a very restrictive formulary may not be politically feasible (OECD 2016).

49
Other short-term measures that could be implemented to increase to ARV markets and generics include:
• Strengthening of mechanisms guiding intellectual property implementation to prevent pharmaceutical companies’ practices such as “ever greening12”,
• Reducing the data exclusivity period length, • Tightening economic criteria for commercial registration of new drugs
(Chaumont, et al. 2015).
An important aspect in the generation of a consolidated catalogue includes the strengthening of the health technology assessment (HTA) process, which would examine the value for money of both new and existing drugs and prescriptions across all SS schemes (Chaumont, et al. 2015) and potentially further simplify the prescription across the systems. An alternative short-term measure to be implemented to control for rising ARV drug costs includes the introduction of targeted co-payments, with appropriate exemptions. Since international evidence indicates that co-pays should be applied sparingly, if applied, these should be accompanied with smart targeting, close monitoring of impacts and coupled with other initiatives to reduce spending on ARV drugs. (OECD 2016). Indirect, short-term and long-term measures should not be applied as stand-alone policies in order to be effective and sustainable. Portugal’s successful reform targeted at decreasing pharmaceutical expenditures was composed of a series of complementary initiatives that included a national catalogue, electronic prescriptions, mandatory generic prescriptions since 2012 (external referencing to lowest purchase price for each drug), tax on pharmaceutical sales, regulations regarding availability of cheapest option and clinic guidelines (OECD 2016). 5.6 Viability and Sustainability The sustainability of the national response to HIV and continuation of the government’s different initiatives to accomplish development as well as health-related objectives will significantly depend on the availability and predictability of funds, which are not exclusive of internal funds. Mexico has had low dependency (0-5 percent according to PAHO standards) on external funding for its national HIV spending for more than 5 years. The sustainability will further depend on the harmonization and alignment with country priorities (WHO 2014), which in this case should also be aligned with federative state-specific priorities, as the amount of funds budgeted and spent as part of the PAE at federative state level do not seem to have a straight forward correlation with the size of the general population or the number of PLHIV. Although there is a low dependency on external funding, federative state programs have a high dependency on federal government funds. The most recently available information on national AIDS spending shows an increase in state resources destined to
12 Through this practice, “pharmaceutical companies operate minor variations to their products to extend patent monopolies and prevent the entry of competitors into the market.” (Chaumont, et al., 2015: S180)

50
the HIV-related activities. The continuation and sustainability of these state level funds will be critical in moving forward, since the government will increasingly face demand for funds to cover other non-communicable diseases, among others, which are covered by the same fund as the ARV. As epidemiological priorities change, the different federal and federative state governments will need to find innovative ways to both decrease cost (of ARV) and increase funding for the most cost-effective interventions.
6. CONCLUSIONS
Mexico is experiencing a low-level epidemic with high prevalence in specific populations. There has been a substantial improvement in controlling new infections over the last ten years, and this is primarily due to reductions in incidence among MSM. Prevention programs should be maintained, as they are relatively inexpensive. However, despite the overall greater costs of ART, it is the most effective and cost-effective program. ART not only reduces deaths but is an effective measure to prevent new infections, if treatment manages to reduce viral load to undetectable levels. As such, the most cost-effective allocation of current funds is to scale up treatment to maximize ART coverage while slightly reducing overall allocations to general prevention. With around 35,000 diagnosed but not yet on treatment and a further around 35,000 undiagnosed, the OPTIMA-HIV results suggest that it is most efficient to link the diagnosed pool to treatment first, and only then scale up testing in the general population. With no additional resources, the optimal allocation suggests increasing ART coverage by about 4-8 percent at the small expense of other programs. Despite this slight increase, this optimal allocation would avert 4,235 deaths, and 3,371 new infections and, an improvement of health outcomes by around 6 percent. Nevertheless, the rising expenditure in ART suggested by the optimal allocation still falls short of the reaching 90 percent target coverage in treatment, stated in the 90-90-90 targets. Getting close to the 90-90-90 will require an increase in resources allocated to HIV by at least 25 percent. An increase of 50 percent would allow coverage rate of ART of 99 percent. After reaching >80 percent ART coverage, increased funding should be allocated to scaling up primary prevention towards saturation (where the yield is no longer as easy to obtain) and then scale up promotion of more PMTCT programs and prevention for the general population. The review of the current government response plan to the HIV epidemic and the amount of resources spent on the various initiatives aimed at achieving national and international HIV-related objectives raise a few concerns regarding the budgeting and allocation processes. The existence of a disjointed system has resulted in the implementation of public policies that are not always aligned in a fragmented investment system. This causes unequal levels of resources across the different sub-systems, where per capita spending per person without social security was US $258 in 2013, compared to US $264 for IMSS and US $297 for ISSSTE affiliates. (OECD 2016). The fragmentation has also resulted in a lack of consistent and timely information from the social security system and providers to aid in the decision-making process.

51
As mentioned previously, the most important intervention in the OPTIMA-HIV exercise, regardless of the amount of resources, was the provision of antiretroviral drugs, which could even be scaled up with the current budget, and should be a priority with additional resources (second scenario with higher prevalence). Moreover, under both scenarios, if additional resources where made available, these should be allocated to further testing pregnant women for PMTCT. To improve the decision-making process, efficiency, effectiveness, and transparency in the management of public funds allocated, AFASPE was created in 2008 with its corresponding IT application to manage the funds (SIAFFASPE). This platform presents the budget by budgetary item, showing the amounts by programs, strategies, lines of action, activities, indicators, interventions, funding sources, and catalogs (Rodriguez Soriano, Freyermuth Enciso and Argüello Avedaño 2011). The existing system provides a model to standardize the visualization of information and improve accountability of funds earmarked for the PAEs. The resources allocated to the different federative states as part of AFASPE to finance activities, services and supplies provided by the public health care system are estimated based on public health needs with guidance of past budgets. The evaluation done by the Maternal Mortality Monitoring Centre in Mexico (OMMS) in the states of Guerrero, Oaxaca and Veracruz, showed a lack of understanding about AFASPE and the planning process among some staff. The report also identified some lack of coordination between the areas involved in the planning, non-compliance in the delivery of trimestral reports and delay in the transfer of funds. Besides the need to continue strengthening the planning and reporting processes, the allocation of resources can be further improved by considering both the number of PLHIV and the size of vulnerable population groups when defining the objectives and estimating costs for each federative state. Further defining the target populations and key parameters to model resource allocation should be the next step towards improving the current performance-based budgeting in line with the type of HIV epidemic in Mexico. As mentioned earlier, currently there is no unified effort to gather this information in a consistent and standardized manner at a federal entity level. To increase the value-for-money of existing resources, allocation efficiency would also require the strengthening of CENSIDA´s stewardship role to ensure that the funds transferred are invested as they were initially earmarked. Ideally, funds should be invested according to the local epidemiological and socio-economic needs in the most cost-effective manner. The current monitoring system Caminando a la Excelencia, for example, is a result of fifteen years of strengthening, adjusting and consolidating monitoring efforts of public health, which has allowed for great advances in the improvements of several programs. HIV-specific indicators include: (1) coverage of ART among HIV-positive pregnant women, (2) percentage of people with HIV diagnosis, (3) percentage with late onset of ART, and (4) percentage of STI consultations. As mentioned before, the monitoring process would be further strengthened by including indicators related to the size of the target population, which would be required in order to fortify performance-based budgeting and evaluate the cost-effectiveness of different programs. Coordination and cooperation of the national entities has reduced the risks

52
associated with the lack of information. It is an on-going effort between institutions to achieve an integrated health care system.

53
7. BIBLIOGRAPHY Adesina, A. O.O. 2010. The Role of Forecasting Price Negotiations and Procurement
Management in Determining Availability of Antiretroviral Medicines (ARV) in Mexico. UC Berkely.
Adesina, A., Wirtz, V. J., and Dratler, S. 2013. „Reforming Antiretroviral Price
Negotiations and Public Procurement: The Mexican Experience.“ Health Policy and Planning, 28(1), 1-10. doi:10.1093/heapol/czs015
American Cancer Society. 2014. Avoiding and Treating Hepatitis Infections. Retrieved
from American Cancer Society.
_____. 2015. American Cancer Society. Von Childhood Acute Lymphoblastic Leukemia Treatment (PDQ®): http://www.cancer.gov/types/leukemia/patient/child-all-treatment-pdq abgerufen
Amnesty International. 2014. El Salvador: On the Brink of Death: Violence Against Women and the Abortion Ban in El Salvador. Retrieved from https://www.amnesty.org/en/documents/AMR29/003/2014/en/ Amy Y. Vittor. 2016. Explainer: Where did Zika Virus Come From and Why is it a
Problem in Brazil? Von University of Florida: http://theconversation.com/explainer-where-did-zika-virus-come-from-and-why-is-it-a-problem-in-brazil-53425 abgerufen
Aran-Matero, D., Amico, P., Aran-Fernandez, C., Gobet, B., Izazola-Licea, J., and Avila-
Figueroa, C. 2011. "Levels of Spending and Resource Allocation to HIV Programs and Services in Latin America and the Caribbean.“ (A. M. Noor, Hrsg.) PLoS ONE, 6(7 PMID), e22373. doi:10.1371/journal.pone.0022373
Banco de Mexico. 2016. Inflation. Von Banco de Mexico:
http://www.banxico.org.mx/portal-inflacion/inflation.html abgerufen
Brouwer, K. C., Strathdee, S. A., Magis-Rodriguez, C., Bravo-Garcia, E., Gayet, C., Patterson, T. L., and Hogg, R. S. 2006. Estimated Numbers of Men and Women Infected with HIV/AIDS in Tijuana, Mexico. Journal of Urban Health, 83(2), 299-307. doi:10.1007/s115
CENSIDA. 2012. Medicion del Gasto en SIDA: MEGAS. Von CENSIDA:
http://www.censida.salud.gob.mx/interior/cifras_megas.html abgerufen
_____. 2014. Informacion Financiera del CENSIDA. Retrieved January 12, 2016, from CENSIDA: http://www.censida.salud.gob.mx/interior/transparencia/info_financiera.html
_____. 2014. Informe Nacional de Avances en la Respuesta al VIH y el SIDA.
Secretaria de Salud.

54
_____. 2014. Vigilancia Epidemiologica de casos de VIH/SIDA en Mexico: Registro Nacional de Casos de SIDA Actualizacion al cierre de 2014. Secretaria de Salud.
_____. 2015. Atencion Integral: Precios ARV. Von CENSIDA:
http://www.censida.salud.gob.mx/descargas/arv.pdf abgerufen CENSIDA. (2015). Informe Nacional de Avance en la Respuesta al VIH y el SIDA.
Secretaría de Salud. CENSIDA-UNAIDS. 2013. Mexico HIV/AIDS Estimation with Spectrum 4.47. Mexico
D.F.: CENSIDA.
Chaumont, C., Bautista A., S., Calva, J. J., Bahena G., R., Hitz, G., Gonzalez de Araujo, A., & Hernandez-Avila, M. 2015. Antiretroviral Purchasing and Prescription Practices in Mexico: Constraints, Challenges and Opportunities. Salud Publica de Mexico, 57(2), 171-182.
CONAPO. 2014. Proyecciones de la Poblacion de las Entidades Federativas 2010-
2030. Abgerufen am 12. December 2013 von Proyecciones de la Poblacion 2010-2050: http://www.conapo.gob.mx/es/CONAPO/Proyecciones_Datos
DGIS. 2015. Gasto en Salud en el Sistema Nacional de Salud. Retrieved January 4,
2016, from Estadisticas: Recursos Financieros: http://www.dgis.salud.gob.mx/contenidos/sinais/gastoensalud.html
DIGESTYC. 2005. Direccion General de Estadistica y Censos. Retrieved from El
Salvador: Estimaciones y Proyecciones de Población: http://www.digestyc.gob.sv/index.php/novedades/avisos/540-el-salvador-estimaciones-y-proyecciones-de-poblacion.html
DSyETS. 2014. Boletin Sobre el VIH-SIDA en Argentina.
EHPM. 2013. Encuenta de Hogares y Propositos Multiples. El Salvador.
Fernandez, E., Ortiz, R., Maryori, Gomez, O., and Jaqueline, J. 2012. Informe de
Evaluacion del Programa de Accion Especifico 2007-2012 en Respuesta del VIH/Sida e ITS y Evaluacion de Resultados del Proyecto Mexico de Lucha Contra el Sida, Ronda 9 financiado por el Fondo Mundial. Mexico DF: FUNSALUD.
Frank, R. G. 2001. “Prescription Drug Prices: Why Do Some Pay More Than Others
Do?” Health Affairs, 20(2), 115-128. doi:10.1377/hlthaff.20.2.115
Gabriel Lara and Helena Hofbauer. 2004. Gabri VIH/SIDA y Derechos Humanos: El presupuesto publico para la epidemia en Argentina, Chile, Ecuador, Mexico y Nicaragua.
Global Burden of Disease Study (GBD). (2015)..
_____. 2015. Von Institute of Health Metrics. Abgerufen

55
Government of the Republic of Mexico. 2013. Plan Nacional de Desarrollo 2013-2018. Hitz, G., Gonzalez de Araujo, A., Charvel Orozco, S., Cobo, F., Chaumont, C., Calva, J.,
. . . Hernandez Avila, M. (2014). Legal options for ARV price reduction in Mexico. 20th International AIDS Conference. Melbourne. Abgerufen am 2016 von http://pag.aids2014.org/EPosterHandler.axd?aid=6704
INDEC y MSN. 2013. Encuesta Nacional sobre Salud Sexual y Reproductiva (ENSSyR).
INDEC.
IRS. 2015. Yearly Averge Currency Exchange Rates for Converting Foreign Currencies into U.S. dollars. Abgerufen am 11. January 2016 von IRS: International Taxpayers: https://www.irs.gov/Individuals/International-Taxpayers/Yearly-Average-Currency-Exchange-Rates
Maria, A. Pando. 2010. Aportes a la Epidemiologia del HIV en Argentina. Prevalencia e
Incidencia en grupos vulnerables.
MINSA. 2010. Dirección General de Epidemiología. . Von Análisis de la Situación de Salud del Peru.: http://www.dge.gob.pe/publicaciones/pub_asis/asis25.pdf abgerufen
_____. 2011. Dirección General de Epidemiología. . Von Análisis de Situación de Salud
de la Provincia de Lima.: http://www.dge.gob.pe/publicaciones/pub_asis/asis29.pdf abgerufen
_____. 2013. Direccion de Epidemiologia. Von Vigilancia de VIH/SIDA. Abgerufen
OECD. 2016. OECD Reviews of Health Systems: Mexico 2016. Paris: OECD
Publishing. Von http://dx.doi.org/10.1787/9789264230491-en abgerufen
PAHO. 2013. Antiretroviral Treatment in the Spotlight: A Public Helath Analysis in Latin America and the Caribbean 2013. Washington, DC: PAHO.
_____. 2014. Antiretroviral Treatment in the Spotlight: a Public Health Analysis in Latin
America and the Caribbean 2014. Washington, DC: PAHO.
Reyes Tepach, M. 2015. El Presupuesto Public Federal para la FUNCION SALUD, 2014-2015. Mexico D.F.: Camara de Diputados.
Rodriguez Soriano, D., Freyermuth Enciso, M., & Argüello Avedaño, H. (2011). Acuerdo
para el Fortalecimiento de las Acciones de Salud Pública en los Estados (AFASPE). In Monitoreos al Acuerdo para el Fortalecimiento de las Acciones de Salud Pública en los Estados y al Convenio General de Colaboración Interinstitucional para la Atención de la Emergencia Obstétrica: Un Ejercicio de Contraloría Social (S. 11-95). Mexico D.F.: Observatorio de Mortalidad Materna en México.
Salomon. 2005. Determinacion de Seroincidencia y Resistencia de VIH en Poblaciones
de Hombres qeu Tienen Sexo con Hombres, Trabajadoras Sexuales, Usuarios de Drogas y Emabarazadas.

56
Secretaria de Salud. 2013. Programa de Accion Especifico: Respuesta al VIH, SIDA e
ITS 2013-2018. Secretaria de Salud.
SPPS. 2015. Convenios AFASPE 2009-2015. Von Secretaria de Prevencion y Promocion de la Salud: http://www.spps.gob.mx/convenios-afaspe.html abgerufen
The Global Fund. 2016. Medicine prices: Anti-Retroviral. Retrieved February 11, 2016,
from The Globla Fund PQR: http://bi-ext.theglobalfund.org/analytics/saw.dll?Dashboard
World Bank. 2006. Health Service Interventions for Cancer Control in Developing
Countries. In S. J. Martin L. Brown, Disease Control Priorities in Developing Countries. Washington (DC).
_____. 2016. Data: Mexico. Retrieved January 11, 2016, from The World Bank:
http://data.worldbank.org/country/mexico?display=default
UNAIDS. 2011. UNAIDS Terminology Guidelines (January 2011) . UNAIDS.
_____. 2013. Global Report: UNAIDS Report on the Global AIDS Epidemic 2013. UNAIDS.
_____. 2014. Indicators: Mexico. Abgerufen am 11. January 2015 von AIDSinfo:
http://aidsinfo.unaids.org/#
WHO. 2004. Cancer Prevention. Retrieved from World Health Organization: http://www.who.int/cancer/prevention/en/
_____. 2008-2013. Action Plan for the Global Strategy for the Prevention and Control of
Non-communicable diseases. Retrieved from World Health Organization: http://www.who.int/nmh/publications/ncd_action_plan_en.pdf
_____. 2013. Consolidated Guidelines on the Use of Antiretroviral Drugs for Treating
and Preventing HIV Infection: Recommendations for a Public Health Approach. Geneva: WHO.
_____. 2013. Transaction Prices for Antiretroviral Medicines from 2010 to 2013: WHO
AIDS Medicines and Diagnostic Services: Global Price Reporting Mechanism: Summary Report. Geneva: WHO.
_____. 2013-2020. Global Action Plan for the Prevention and Control of NCDs.
Retrieved from World Health Organization: http://www.who.int/nmh/events/ncd_action_plan/en/
_____. 2014. Global Reporting Mechanism (GPRM): HIV. Abgerufen am 14. 1 2016 von
WHO: http://apps.who.int/hiv/amds/price/hdd/Default2.aspx
57
_____. 2014. Global Update on the Health Sector Response to HIV, 2014. Geneva: The World Health Organization.
_____. 2015. Global Tuberculosis Report 2015.
_____. 2015. HIV and TB. Von http://www.who.int/hiv/topics/tb/about_tb/en/ abgerufen
_____. 2015. Summary Statistics: Mexico. Von WHO Data. abgerufen


Despite a substantial improvement in controlling new infections of HIV over the last ten years, Mexico is experiencing a low-level epidemic with approximately 180,000 people living with HIV (Spectrum, 2013), making it the fourth ranking country in Latin America with regards to the number of people with the disease (PLHIV). The objective of increasing coverage and reducing inequality in the country is reflected in the objectives of the Specific Action Program (PAE) for the national response to HIV, AIDS and STI of 2013-2018 (Secretaria de salud), which seeks to decrease the effect of HIV and STIs, implement prevention strategies and provide comprehensive care for vulnerable population groups and those living in poverty. The possibility of achieving the objectives of the PAE is closely related to the total amount of resources that Mexico can commit to fighting HIV and the way these resources are allocated. In the hopes of assisting the Government of Mexico in further strengthening its HIV investment, the authors try to answer the question “How can HIV funding be optimally allocated to the combination of HIV response interventions that will yield the highest impact in the shortest period”. The study found that despite the overall greater costs of treatment with ART, this is the most cost-effective program. ART not only reduces deaths but is an effective measure to prevent new infections due to the reduction of viral load to undetectable levels. As such, the most cost-effective allocation – with no additional resources of current Program funds, is to scale up treatment, by about 4-8 percent, to maximize ART coverage while slightly reducing overall allocations to general population prevention. This slight increase would avert 4,235 deaths and 3,371 new infections, and improve health outcomes by around 6 percent. To increase the value-for-money of existing resources, allocation efficiency would also require the strengthening of CENSIDA´s stewardship role, to ensure that the funds transferred are invested as they were initially earmarked
ABOUT THIS SERIES: This series is produced by the Health, Nutrition, and Population Global Practice of the World Bank. The papers in this series aim to provide a vehicle for publishing preliminary results on HNP topics to encourage discussion and debate. The findings, interpretations, and conclusions expressed in this paper are entirely those of the author(s) and should not be attributed in any manner to the World Bank, to its affiliated organizations or to members of its Board of Executive Directors or the countries they represent. Citation and the use of material presented in this series should take into account this provisional character. For free copies of papers in this series please contact the individual author/s whose name appears on the paper. Enquiries about the series and submissions should be made directly to the Editor Martin Lutalo (mlutalo@ worldbank.org) or HNP Advisory Service ([email protected], tel 202 473-2256). For more information, see also www.worldbank.org/hnppublications.
1818 H Street, NW Washington, DC USA 20433 Telephone: 202 473 1000 Facsimile: 202 477 6391 Internet: www.worldbank.org E-mail: [email protected]