Embed Size (px)
Citation preview

Optimizing OCR Accuracy on Older Documents: A Study of Scan Mode, File Enhancement, and
Software Products
Jon M. Booth Jeremy Gelb
Office of Innovation and New Technology U.S. Government Printing Office, Washington, DC
Revised June 2006
v2.0
1.0 Background
As part of the GPO’s new Digital Conversion Services (DCS), we had been tasked to suggest methods to improve Optical Character Recognition (OCR) accuracy rates on older documents, evaluate the performance of these document enhancement techniques, and select an OCR software product. A minimum OCR accuracy rate of 99% was established as a requirement by the Meeting of the Experts on Digital Preservation, and can be referenced in that document. This report gives a summary of the recommendations made, and a summary of the performance of the testing that we performed.
For the selection of an OCR software product, a Pugh Matrix was used. This tool allows a structured comparison of potential software products, based on a user-defined set of measurable attributes. A further refinement of this tool is the ability to define the relative level of importance for each attribute, using a system of “weighting.” The end result is a quantified product ranking, in which the top candidate is selected use in production.
Several approaches can be used to evaluate the performance of file enhancement. The first approach would be to measure the accuracy of the OCR output from the resulting image (for instance, average character accuracy). The second approach is much more subjective, which is to visually assess the performance of the enhancements. Because the sole purpose of file enhancement is to improve OCR output accuracy, the first approach will be used to measure the success of file enhancement.
2.0 OCR Software Product Selection
Before selecting the products to be tested, the attributes against which they would be measured have to be defined. The first attribute was the accuracy requirement, provided by the Meeting of the Experts on Digital Preservation. Of course, with increased accuracy, the product cost is expected to increase as well. Thus, the other initial attribute is the overall cost of the product.
2.1 Attribute Refinement
The initial pair of measure attributes is refined to reflect the varying components that make up each of these broad categories. The cost attribute is dissolved into 2 parts: Initial cost, and Total Cost of ownership (TCO). The Accuracy attribute is defined as uncorrected accuracy; this will test the quality of the OCR conversion engines, without the included spell-checkers.

Several other attributes need to be added as well, that aren’t directly related to cost or accuracy. Ease of Implementation and Ease of Use are 2 important attributes to consider for technology feasibility purposes. Processing Time (cycle time per page), and Product Scalability are necessary to determine schedule feasibility and efficiency. Fig. 1 shows the Finalized list of attributes which are used to test the OCR products.
2.2 Initial Product Selection
A listing of all the currently commercially available OCR software products first needs to be created. From this list, products can be eliminated based on non-compliance with our given list of product requirements. Based on requirements for operating system compatibility, input file format, output file format, and price, the list was reduced to three software products. The remaining products are to be rigorously tested against the previously defined attributes.
2.3 Baseline
After the initial group of products is selected, one of the products is selected (at random) to be the “baseline” against which the others are compared. The selection of a particular product will not affect the outcome of the comparison results.
2.4 Attribute Weighting
The relative importance of the attributes in relation to each other can be established as well. This is not a required part of the Pugh selection tool, but it helps to strengthen the validity of the results, especially if the attributes are not of approximately equal importance. See Fig. 2. The attributes are placed in rows and columns, allowing for direct comparison between each possible combination of attributes. An ‘r’ is used if the row is more important, and a ‘c’ is used for column. The number of ‘r’ and ‘c’ characters for each attribute are computed as a percentage of the total number of attribute combinations.
2.5 Final Selection
With all the input data in place, each product is compared to the ‘baseline’ product, scoring it better, equal, or worse than the baseline product. In the case of the OCR software selection, a number scale of 1-5 is used, with ‘3’ being equal to the baseline product. The data used to make these scorings are gathered from product literature, sales representatives, and internal product testing. As Fig. 3 shows, the resultant scores for Products A, B, and C are shown in the bottom row of the table. Product C is scored highest, followed by products A and B, respectively. Based on this data, Product C is selected to be used for production within DCS.
3.0 File Enhancement Testing Processes
Preparing the documents to be tested is a two-step process: physical material scanning and controlled file enhancement. The physical material is scanned according to DCS specifications, which state that a resolution of 400 dpi to be used for color and grayscale documents, and 600 dpi for bitonal documents.
3.1 Initial Testing
Unfortunately, the DCS scanning specifications can result in unacceptable scanned images,

similar to the one shown on the left side of Fig. 4. Many older documents such as Fig. 4 are completely unreadable when scanned in bitonal mode; others exhibit reduced readability and clarity of text. The result is significantly lower OCR accuracy. Fig. 5 shows the comparison between bitonal, grayscale, and RGB scanning modes as they relate to OCR accuracy for many older documents. The resulting bitonal accuracy is unacceptable; grayscale and color accuracy rates are essentially equal.
For this test, all images are scanned in RGB mode, because the scope of documents to which file enhancement will be applied are “older” documents; these documents are yellowed, stained, wrinkled, and faded. Scanning these in RGB mode is the only way to capture this extra data, which can allow for further improvement of OCR accuracy. See the bitonal vs. color scan comparison in Fig. 4. Additionally, more types of file enhancements are available to documents scanned in RGB mode than those scanned in a grayscale mode.
3.2 File Enhancement Selections
The types of file enhancements to be tested are chosen from a list of all the available types of file enhancements possible; the initial selection only eliminates the enhancement types that are known to have no effect.
These initial enhancements are individually applied to images, which are then run through the initial round of OCR tests, and compared to a control group of images’ OCR results. Any enhancement types found to significantly reduce the OCR accuracy from the control group level will be eliminated. The second round of tests will include the remaining file enhancement types, using a different sample of images, but a similar sample size.
3.3 Definition of Character Errors
Character recognition is typically measured by standard character accuracy. Although many characters in a document's text have no role in search retrievability (punctuation, hyphenation, characters in stop words), all standard ASCII characters will be considered when testing for accuracy. However, the font style will not be considered (bold, italic, underline, font size, subscript, superscript, font faces), nor will extraneous spaces in the document, as these don’t affect character retrievability, only character presentation. Testing for the correct font style would also add significantly to the resources required to complete the testing, without adding any significant value.
3.3.1 Types of Character Errors OCR software typically uses multiple “engines” to achieve a high accuracy level. Each engine attempts to identify the characters in a document. The results of these engines are compared in a process called Voting, in which different OCR engines compare results for character identification. By using a process called voting, a software package is able to increase its accuracy to levels above a 99% Accuracy Rating (AR).
Substitution Rate (SR): This is the percentage of all characters with confidence levels above the OCR software’s acceptance threshold, but are wrongly recognized. It is also known as “false positive rate” or error rate. This percentage determines the quality of an OCR engine as these results cannot be corrected unless some data validation rules are

applied.
Rejection Rate (RR): This is the percentage of all characters with confidence levels below the OCR software’s acceptance threshold (the software marks them as errors). These characters are usually displayed in a dialog box or window for verification or correction.
Accuracy Rate (AR): This is the percentage of all characters with confidence levels above the acceptance threshold level and correctly recognized. This percentage rate is determined by the formula as follows: AR = 100 % - SR – RR
The testing process utilized all three of these concepts to standardize character accuracy computations across many documents and file enhancement types. An added benefit of using a common set of definitions is the reduction of the chance of errors in data gathering and data analysis. A standard testing process, described below, further reduces the chance of errors.
3.4 Image testing process
A group of images is processed through the selected OCR software. This is done without using any of its internal image correction or spell checking features, to isolate reduce the number of variables that may affect the final outcome. The raw OCR output is saved as a Rich-text format (.rtf) document, and compared to the original physical document. The number of errors in the digital document are then tabulated, and a percentage is calculated based on the total number of characters in the document. A sample of the data table is given in Fig. 6, which was used to tabulate the data and automatically compute the results using programmed calculations, to further reduce the risk of errors.
3.5 Application of File Enhancements
The initial selection of file enhancements included Contrast adjustment, Threshold adjustment, Unsharp Mask, Paper Color Removal, and Image Resolution Downsampling. These were all tested using the industry standard Adobe Photoshop CS software, at three different levels of intensity (0.1, 0.2, and 0.3), with the exception of Downsampling, which was only tested at two levels (300 dpi and 200 dpi).
Based on the accuracy results derived from these file enhancements, the selection was reduced. The final selection of file enhancements included Contrast adjustment and Unsharp Mask, at the three levels of intensity (0.1, 0.2, and 0.3).
4.0 Results of File Enhancement Performance
The initial round of testing demonstrated that the Threshold adjustment, Paper Color Removal, and Image Resolution Downsampling enhancements actually reduced the usable quality of the images. The OCR results derived from these three groups of images were significantly less accurate than the control group. See Fig. 7.
The second round of testing used only the Contrast Adjustment and Unsharp Mask enhancements, at
the three intensity levels. Using a different sampling of images, the results from the initial round were confirmed – these enhancements didn’t reduce OCR accuracy rates, but they didn’t significantly improve OCR accuracy rates either.
4.1 Statistical Analysis
The technical part of this testing is due to the way the data is analyzed. In order to determine whether a group’s results were significantly different from the control group results, statistical analysis had to be employed. In this capacity, the term significant doesn’t imply importance, but only reliability. For this test, significance was tested at the 95% confidence level (α = 0.05), a standard level at which to test reliability. The other important parameter is sample size. Generally, to use statistical analysis, a sample size of at least 30 (n=30) must be used. For practicality, this test used the minimum sample size of 30, due to the resource intensive analysis this kind of testing required (manually counting characters on a page, over 30 pages for each enhancement type).
The average and standard deviation was calculated for the control set of data as well. The confidence interval is calculated using the standard deviation, confidence level (α=0.05), and sample size (n=30). From this point, an upper and lower confidence interval can be obtained. Using these parameters, the UCL (Upper Confidence Limit), LCL (Lower Confidence Limit), and STD DEV (Standard Deviation) are all calculated by the automated formulas in Microsoft Excel. This is shown in Fig. 6. Any results that fall within these upper and lower boundaries are considered to be the same as the control group.
5.0 Summary
A graphical representation of the results of these studies is given in Fig. 8. There are several things that can be concluded from the testing and results of this study:
1. Older and discolored documents must be scanned in RGB mode to capture all the image data, and to maximize OCR accuracy.
2. The character accuracy produced by scanning older documents in RGB mode meets (GPO’s meeting of the experts) 99% OCR accuracy requirement, even without applying file enhancement.
3. No single type of file enhancement, applied individually, improves character recognition rates for OCR.
4. Specifically, the Downsampling enhancement type does not improve character recognition rates, despite OCR software manufacturers’ claims that a 300dpi is optimal for recognition rates.
In conclusion, the combination of these facts demonstrate that file enhancement is not needed, because the recognition rates are already at an acceptable level, and more importantly, it does not improve the character recognition rates for OCR.

Appendix
A. Figures
Fig. 1:
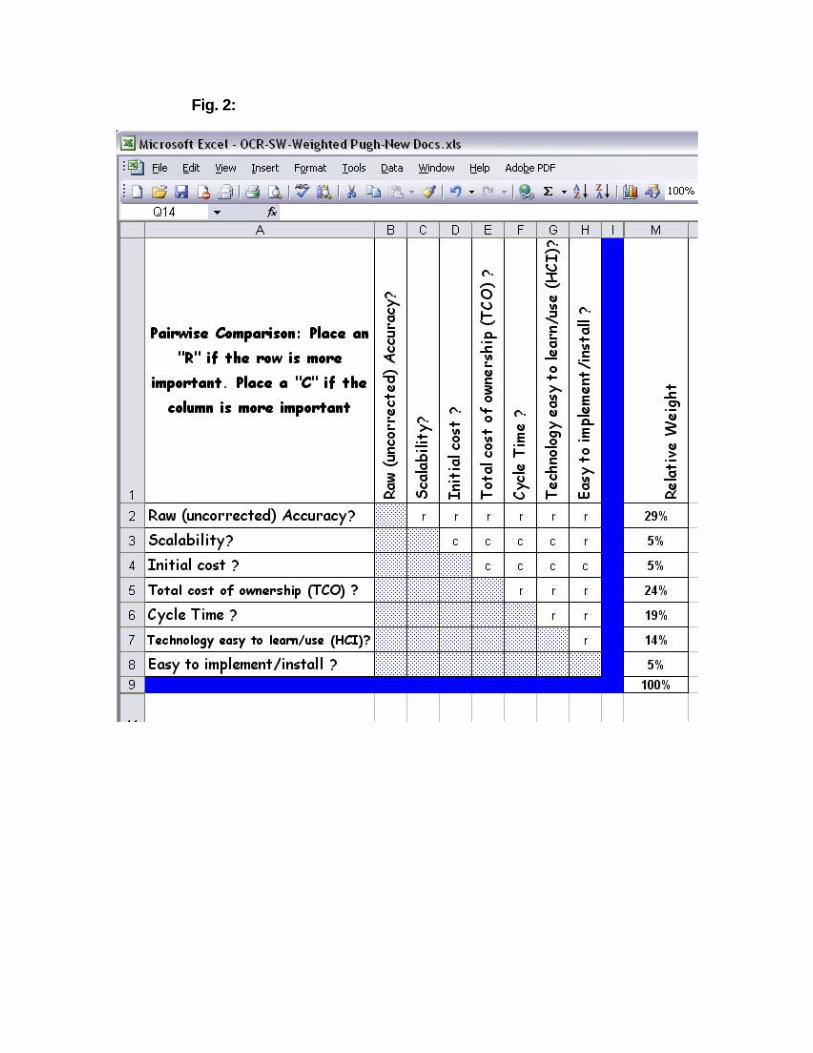
Fig. 2:
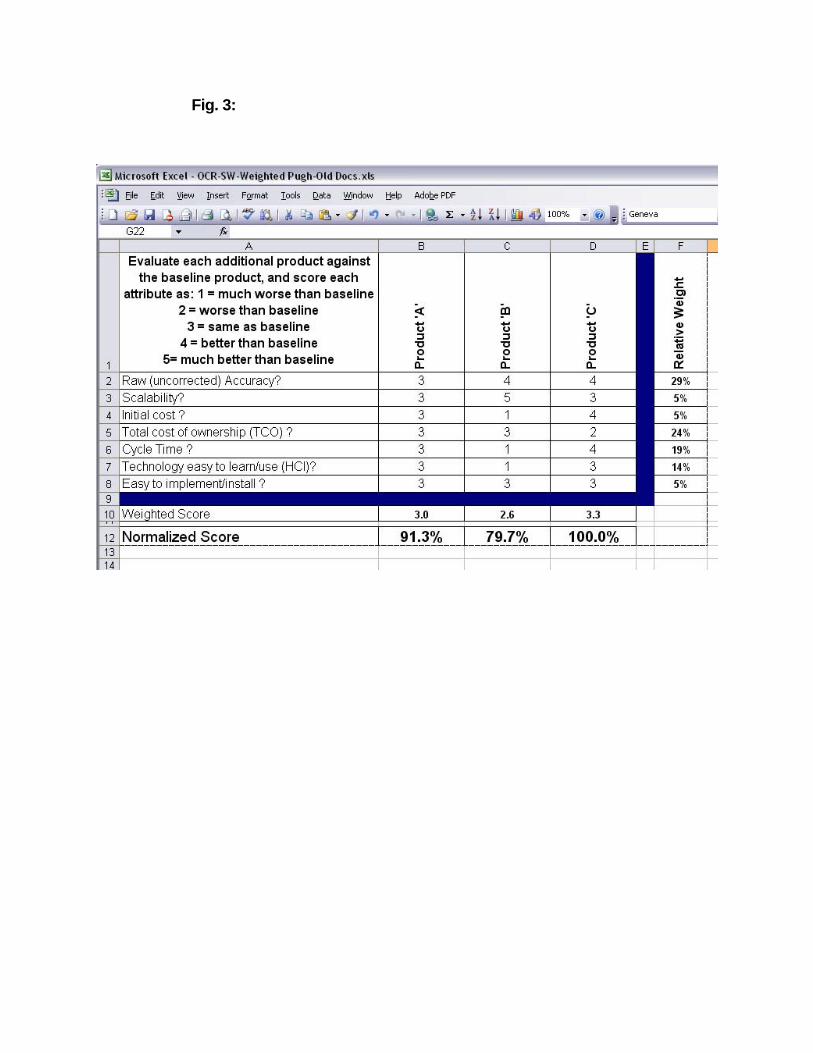
Fig. 3:
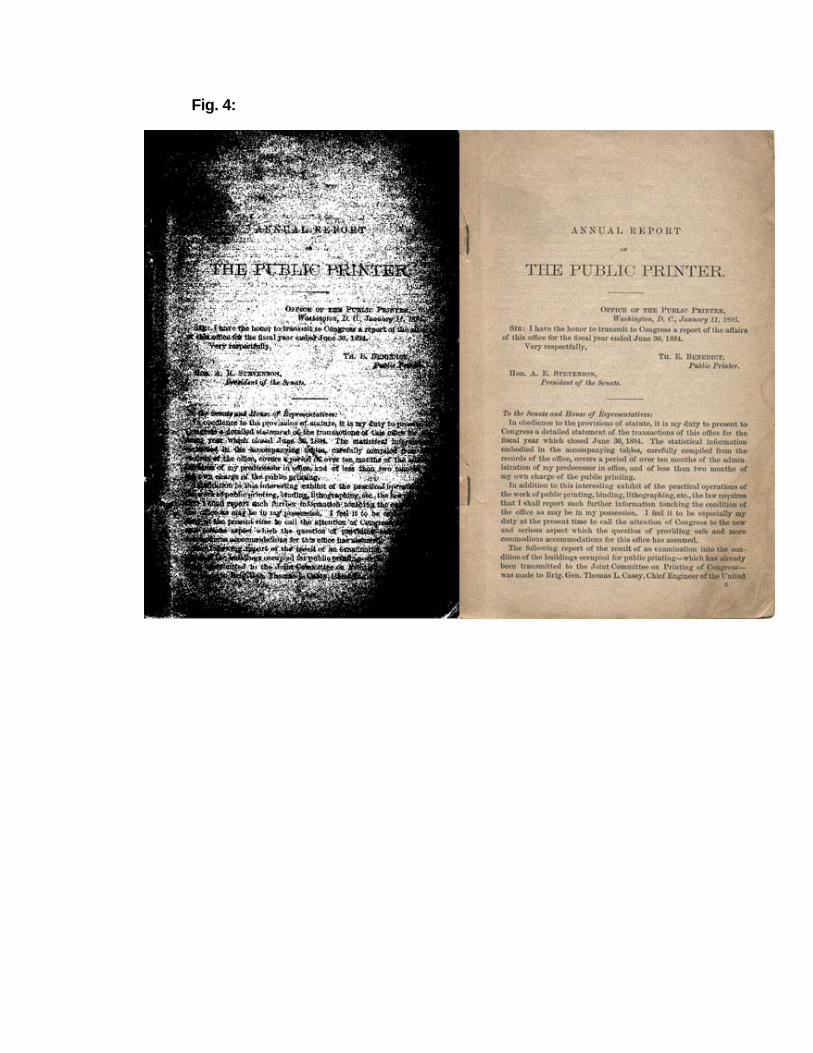
Fig. 4:

Fig. 5:
Effects of Scan Mode on OCR Accuracy
77.12%
98.26% 98.27%
70.00%
75.00%
80.00%
85.00%
90.00%
95.00%
100.00%
1
Scan Mode
Acc
urac
y R
ate
BitonalGrayscaleColor

Fig. 6:

Fig. 7:
Uncorrected OCR Accuracy - Overall
90.00%
91.00%
92.00%
93.00%
94.00%
95.00%
96.00%
97.00%
98.00%
99.00%
100.00%
1
Enhancement Type
Acc
urac
y R
ate
Original
0.1 Contrast
0.2 Contrast
0.3 Contrast
0.1 Threshold
0.2 Threshold
0.3 Threshold
0.1 Unsharp Mask
0.2 Unsharp Mask
0.3 Unsharp Mask
Downsampling 300
Downsampling 200

Fig. 8:
Uncorrected OCR Accuracy - Overall
99.00%
99.20%
99.40%
99.60%
99.80%
100.00%
1
Enhancement Type
Acc
urac
y R
ate
Original0.1 Contrast0.2 Contrast0.3 Contrast0.1 Unsharp Mask0.2 Unsharp Mask0.3 Unsharp Mask
B. References
GPO Publications:
The Annual Report of the Public Printer, January 1903
Report from the Meeting of Experts on Digital Preservation, March 12, 2004
Requirements Document for the Digital Conversion Services, May 4, 2005