Embed Size (px)
Citation preview

Optimizing Parameters that Influence Recovery in Solid Phase Extraction
Joan M. Stevens, Ph.D., and Mark CrawfordGilson, Inc., 3000 Parmenter Street., Middleton, WI 53562
www.gilson.com

Introduction:• Solid Phase Extraction has become a technique of choice for sample
cleanup and trace enrichment
• Some of the benefits of SPE: Versatility, Selectivity, Speed, and Low Solvent usage
• There are other methods for sample cleanup: Liquid-Liquid Extraction, Protein Precipitation, Turbulent Flow, and Dialysis
• Most automated methods find their roots in a manual method
• Most manual methods don’t optimize the extraction mechanism due to the so called “time” believed to be involved in method development
• Automation in its most general term removes the repetitive/monotonous nature associated with method development and the drain on humancapital

Optimization
• Condition– Solvent– Volume
• Load– Volume – Break-through
• Wash – Volume– Wash solvent selection– Break-through
• Elute– Volume– Elution solvent selection– Percent recovery
SPE Process
Analyte Interferences
Conditioning Loading Sample Washing Eluting

Let’s Face Facts:
• Time is a limiting factor
• Although we would appreciate all the steps associated with SPE to be optimized, work load doesn’t allow us this luxury
• However, if an automated system could accomplish all the variations of solutions, additions and elutionsthen we could optimize our SPE methods without manual intervention and still reap the benefits

Just the Basic Facts:• A typical SPE method with disposable cartridges
or 96-well plates consists of 4 basic steps:
CLWE• C = Condition
- Let’s think about this- What is a SPE cartridge?- Generally speaking its: A dry
sorbent/material held in place with afrit on the bottom and one on the top

Conditioning:• Wets/Activates the packing bed by solvation• Very important step often ignored or minimized• Major step - DO NOT LET THE CARTRIDGE DRY OUT• Methanol is usually the initial conditioning step
– Hydrates the particles, remember the packing material isn’t as efficient as the particles found in an HPLC column
– Need to rely on the basics of science to illicit the required effect

Conditioning Part 2:
• The second conditioning step is required now that the particles have been hydrated. The methanol environment needs to be displaced so that the particles can react with the sample
• Usually this is accomplished with an aqueous solution; water, water with a modifier or a buffer/pH

Now What?• Sample? What sample?
– What do you know about the sample• Serum• Plasma• Urine
• Why is Serum and Plasma difficult to work with?•Because of protein binding
•A particular drug can be bound to proteins in the biological fluid that will inhibit its interaction with the SPE cartridge, usually greater than 50% bound

Interrupting Protein Binding:• Prior to loading the sample onto
the SPE cartridge, protein interactions with the drug need to be interrupted. If not the results will be compromised
• This is accomplished with the addition of acidic solution or basic solution
• Optimization of common acidic additions is shown below:
Optimum
Acid Chlorpromazine ThioridazineConc. Rec. Rec. CV
Acid (%) (%)CV (%) (%) (%)
None 0 88 3.0 71 4.0TFA 0.0033 96 2.0 77 2.3TFA 0.01 96 1.8 81 2.3TFA 0.03 92 1.1 79 1.7
Acetic 0.0033 88 0.9 70 1.4Acetic 0.01 94 2.8 78 3.2Acetic 0.03 91 2.4 73 2.8Acetic 0.05 95 1.7 86 1.6H3PO4 0.0033 89 1.6 74 3.2H3PO4 0.01 89 1.9 73 1.6H3PO4 0.03 98 1.7 83 1.8H3PO4 0.05 90 2.3 76 1.8H3PO4 0.1 97 1.7 83 1.8

Plasma Acid Addition Recoveries:Thioridazine Acid Addition
Recoveries in Plasma
65.0
70.0
75.0
80.0
85.0
90.0
0 0.02 0.04 0.06 0.08 0.1 0.12
Conc (%)
Rec
over
y (%
)
TFAAcetic AcidPhosphoric Acid
Graph 1: As the acids get weaker, the recovery maximums increase, indicating that a weaker acid is more efficient to control plasma matrix effects.
Recovery Maximums

Loading the Sample:• Load the sample in two steps, if possible. Why?
– Take a look at the process• The media is activated---- Expose the media to the sample• The longer the sample interacts with the media pushes the
attraction of sample with media in the forward direction• If the sample can be added in two shots, the first interaction
with the sample allows the media to relax and be more accepting of the remaining sample
• Under the same concept, the sample must be added slowly to the SPE cartridge - usually 1 ml/min, ~20 drops /minute
• Channeling is an issue in SPE cartridges, a direct result of introducing the sample much too quickly to the media
• The sample must become “intimate” with the material
channeling
SPE media

Relationship Between Sample Recovery and Flow Rate in SPE

How Fragile is Fragile:• Now what do I do?
– The sample in now associated with the cartridge material....
– The sample isn’t going anywhere at this point. A nice, not too aggressive, push of positive pressure or vacuum will pull the liquid through the cartridge
– You will NOT dry the cartridge out. How long does it take to remove a aqueous solution in an evaporator?
– It will require several minutes of constant gas flow or vacuum to dry the cartridge out

Washing the Cartridge:
• “Throwing the baby out with the bath water”• Optimization of this step is crucial

Washing- Before Elution• These two steps are not to associated with each other, however, they are…• What are my concerns:
– Adequate Recovery: Will my recovery be adequate?????– Reproducibility: Between labs, within my lab.
• Confidence Level: Does the assay transfer….how?
• We need to test what is being eluted
•As much as interferents always compromise the purity of the effluent, there is a fine line between washing the cartridge enough to remove interferents and not decreasing the recovery of the analyte of interest at the same time
•How do we do it …..possibly automate the array to find the optimum set of conditions
• Rule of thumb: If it elutes with 40% wash, use 5 to 10% of two washes slowly
• Test the wash solutions for breakthrough of the analyte. If mass spec is available, choose it as your detection mode

Compound – Sorbant Interaction
Diagram 1: The compound-sorbant interaction is what makes solid phase extraction work. The solid phase interacts with the sample based on chemical structure (polarity, functionalities, size). Reverse phase methodology allows the sample to grip the sorbant due to hydrophobicity. The compounds, therefore, are attracted to the sorbant until washed away by an organic solvent. If the solvent is strong enough the sorbant lets go of the compound and elutes. The trick is to be able to wash away the impurities that are soluble in water and low organic solvents without eluting the compounds of interest.
Load Wash
= Impurity= CompoundFlow
Optimizing the Wash and Elution Step: Automation
• There are numerous SPE methods available, the web is a wonderfultool for perusing SPE manufacturers sites for methods; textbooks, published references, applications bibliographies, etc.
• Choose a method that extracts a drug/compound with some or all of the same functionalities associated with your compound– Amines, Carboxylic acids, Hydrophobicity
• Although the method may not be exact, this is a wonderful starting point
• Automating the method for optimization is now accessible

Automated Optimization:• Simple Liquid Handler and SPE racks• The SPE racks allow for multiple elutions or fractionation with various
solvents to optimize each and every step of an SPE method without manual intervention
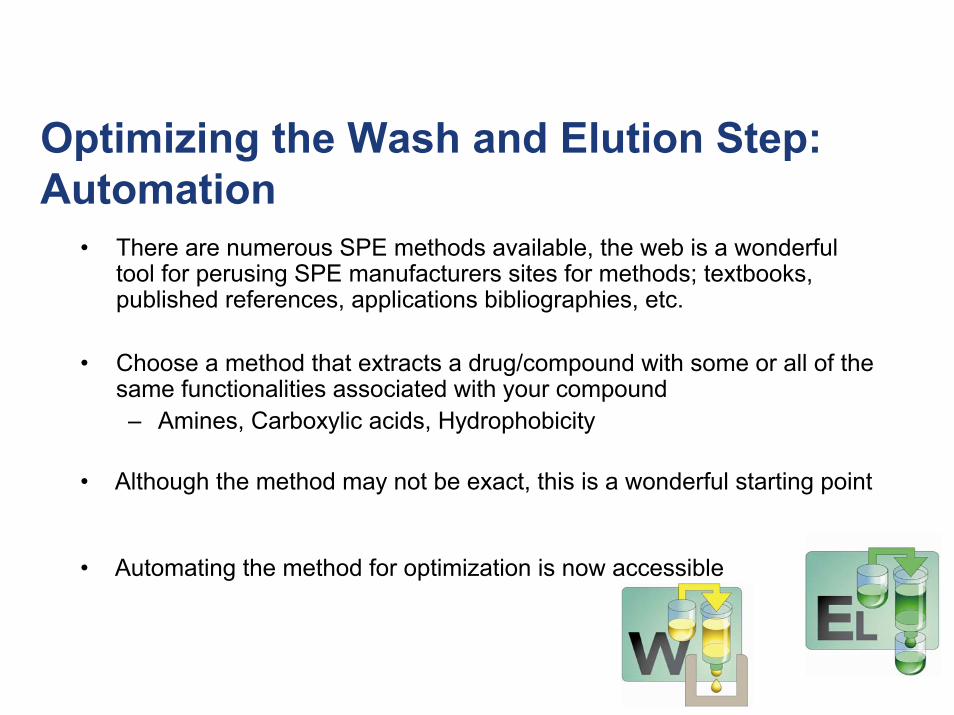
Example Method:• Human plasma containing chlorpromazine and thioridazine at 0.5
mg/ml concentration was acidified with 0.05% acetic acid to interfere with protein binding
• Basic procedure: – Condition:1 mL MeOH, 1 mL Water– Load: 1 mL of sample (0.5 mLs x 2)– Wash: 1 mL Water (x2), 0.5 mL 25% ACN/Water– Elute: 0.5 mL (x2) Elution solution (2:2:1, MeOH:ACN:Buffer)
• Buffer: 4.5 mL Phosphoric Acid, 4.5 mL TEA in 1 liter of water
• SPE method was downloaded from a web site
• The procedure is an example, the method is given as a starting point. Both are designed to offer all the basic data that you’ll need to create the procedure

Optimization of Method:• As mentioned previously, the conditioning steps prior to loading the sample is not as
important (excluding drying the cartridge) as how the sample is loaded and the wash solutions/elution solutions are used relative to recovery
– To prove the optimization concept, a series of various wash solutions and elution solutions were used in the SPE procedure and all wash/elution solutions were collected and analyzed for breakthrough of the compounds in the wash solutions and recovery in the eluent
– Wash Solution Used• Literature: 25% ACN/Water• Solutions: 10% ACN/Water
15% ACN/Water20% ACN/Water25% ACN/Water30% ACN/Water
- Elution Solution Used• Literature: 2:2:1 MeOH:ACN:Buffer• Solutions: 1:3:1 MeOH:ACN:Buffer
3:1:1 MeOH:ACN:Buffer4:1 ACN:Buffer

Optimization Grid:• 5 wash solutions and 4 elution solutions
• Using the basic elution solution 2:2:1, the SPE cartridges were exposed with the various wash solutions and repeated 8 times
• Once the optimum wash solution was determined, then the elution solution was varied and repeated 8 times
• Even with this relatively small study, close to 100 samples will be generated

Multi-Collect to Optimize SPE Procedure:
SPE columns
Drain
Collection tubes

Automated Optimization System:
Movement and Fractionation on the Automated System, Access to the Individual SPE cartridge

Optimizing Conditions Through Fractionation 1. Position sliding SPE rack to collect position
2. Apply sample to SPE cartridge, push through
3. Aspirate SPE solvent solution4. Dispense solvent solution, push volume
through6. Position sliding SPE rack so cartridge is
over well 27. Repeat steps 3-4 with other SPE solutions
Drain Trough
96 Deep WellPlate
Cap on SPE cartridge to seal probe
Push volume
Retained Sample
SPE solution

Breakthrough Curve for SPE Device
VB = The volume where analyte first appears (~ 1% maximal value)
VR = The retention volume
VM = The volume where maximal analyte breakthrough has occurred (~ 99% of maximal value)
UV Response
Sample Volume

Data and Results:Breakthrough of the Analyte in the Wash Solution
0
20000
40000
60000
80000
100000
120000
0 5 10 15 20 25 30 35
Percentage of Methanol Wash
Area
Cou
nt a
t 220
n
Series1Series2Linear (Series1)Linear (Series2)
Graph 2: Optimization of the wash solution relative to recovery for Chlorpromazine and Thioridazine at various concentrations of methanol used in the wash solution

Data:The following data represents the lower levels evaluated
0.5 μg.mL T/C in plasma
0.1 μg.mL T/C in plasma
0.05 μg/mL T/C in plasma
0.01 μg/mL T/C in plasma
Blank Plasma
20 μl injection of Spiked Plasma after SPE
T
C
Data and Results:• Changing the elution ratio did not have any distinguishable effect on the
recovery
• The recovery of Chlorpromazine and Thioridazine under optimized SPE conditions (15% methanol wash and 2:2:1 elution buffer) yielded 99% and 98%, respectively
• Although the increase in recovery for Chlorpromazine is negligible, the increase in recovery for Thioridazine is significant ~10%
• A good rule of thumb is that SPE cartridges retain a mass of solute (analyte plus retained contaminants) equivalent to 5% of the sorbent mass
• Conclusion - Using an automated optimization SPE system yielded positive results without manual intervention

Flavonoids
• Found in plant material and products produced from plant material
• Anthocyanins wide color range– Blue to red
• Produced by plants for environmental protection – UV protection in the 280 – 380 nm range– Microorganism infestation protection by
phytoalexins– Host specific signal compounds

Flavonols
Flavonol R1 R2Quercetin OH HKaempferol H HMyricetin OH OHIsorhamnetin OMe H
Classification of Flavonoids

Wash Break-Through
Wash MeOH
Break 25 30 35 40
500
1000
1500
2000
2500 X
3000 X X
3500 X
4000
MeOHNH4OAc
25 30 35 40
X
X
X
X
MeOH HCl
25 30 35 40
X X
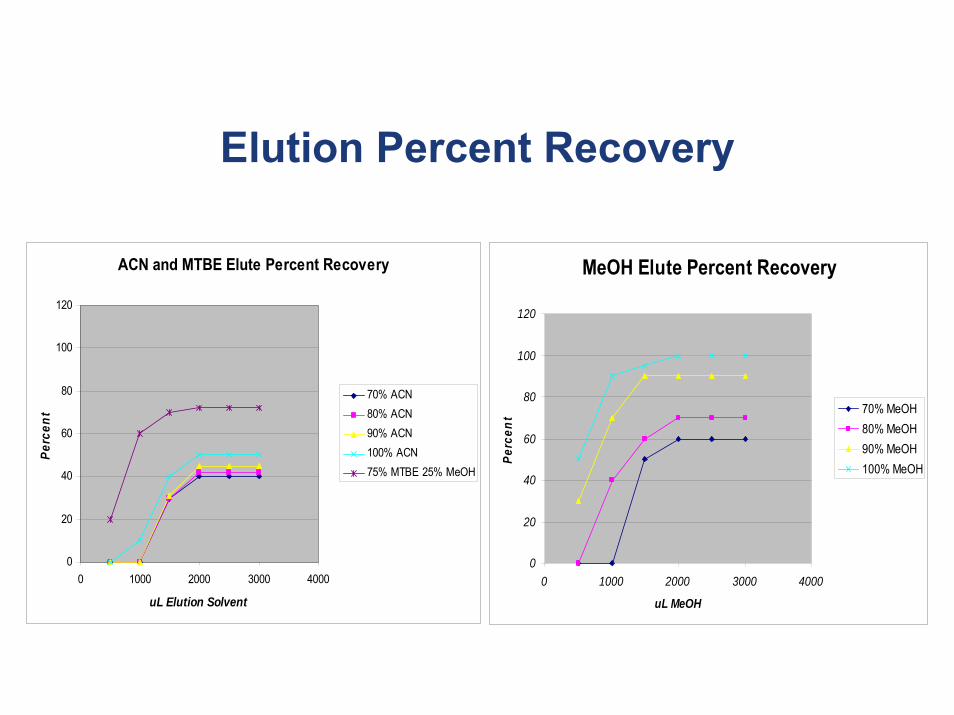
Elution Percent Recovery
MeOH Elute Percent Recovery
0
20
40
60
80
100
120
0 1000 2000 3000 4000
uL MeOH
Perc
ent 70% MeOH
80% MeOH90% MeOH100% MeOH
ACN and MTBE Elute Percent Recovery
0
20
40
60
80
100
120
0 1000 2000 3000 4000
uL Elution Solvent
Perc
ent
70% ACN80% ACN90% ACN100% ACN75% MTBE 25% MeOH
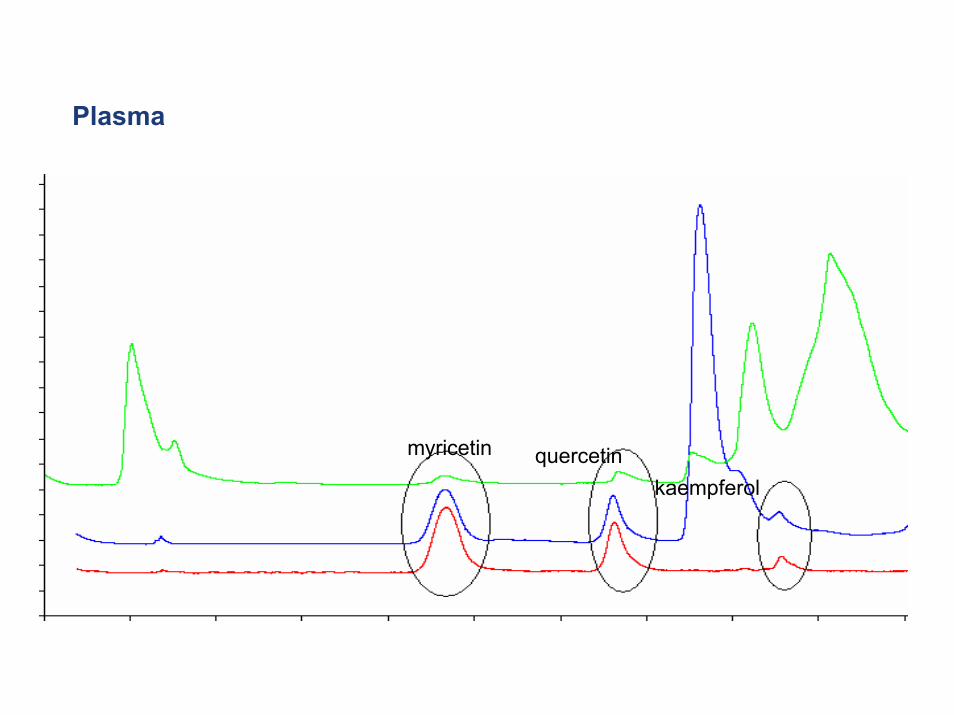
Plasma
quercetinkaempferol
myricetin

Optimization of SPE Method:
• Flavonoids recovery at 99±1% on all analytes versus ≤ 80 % for quercetin
• SPE of all matrices eliminates interfering peaks• Optimization of SPE method for multiple matrices
allows ease of use when analyzing 6 separate matrices.

Elution Volume:
• Although we’ve improved the SPE method the story is not finished
• In almost every situation the elution volume is too large for consistent detection S/N, or the organic concentration is too high for chromatography analysis

Strong Sample SolventsH2O / CH3CN100 : 0
H2O / CH3CN70 : 30
H2O / CH3CN50 : 50
H2O / CH3CN30 : 70
0 4 8 min 0 4 8 min 0 4 8 min 0 4 8 min
The sample should, whenever possible, be dissolved in the mobile phase
If the sample is dissolved in too strong a solvent, significant anomalies occur, peak splitting
Elution Solutions:
• Drying down the eluent volume either to the point of dryness or to a consistent volume is a major bottleneck in the SPE process, it takes time to dry the samples down and usually involves solubilizing the sample prior to analysis
• Degradation of samples via heating is a concern where the compounds may undergo hydrolysis, esters, which could lead to incorrect interpretation of the results

Alternative Solution:• TEC: trace enrichment cartridges in place of the injection loop
• The eluent from SPE cleanup is diluted with a consistent amount of aqueous mobile phase, significantly decreasing the organic strength of the elution solvent
• This diluted eluent solution is then exposed to the TEC
• The TEC will absorb the analyte of interest while the solution passes through to waste
• The TEC concentrates the analyte and then the TEC is brought inline to the HPLC system
• The TEC not only concentrates the analyte of interest but it removes chromatographic anomalies associated with high organic percentages

Data and Results for TEC:
Graph 3: Overlay of the plasma samples at various concentrations of Chlorpromazine and Thioridazine after SPE but without TEC (trace enrichment). A 20 μl sample was injected onto the analytical column, 0.5 mg/mL-0.005 mg/mL concentrations.

Data and Results for TEC:
Graph 4: Overlays of the plasma samples at various concentrations of Chlorpromazine and Thioridazine. A 900 μl volume injection was introduced to the TEC (trace enrichment) prior to analysis via the analytical column, 0.5 mg/mL- 0.005 mg/mL concentrations.
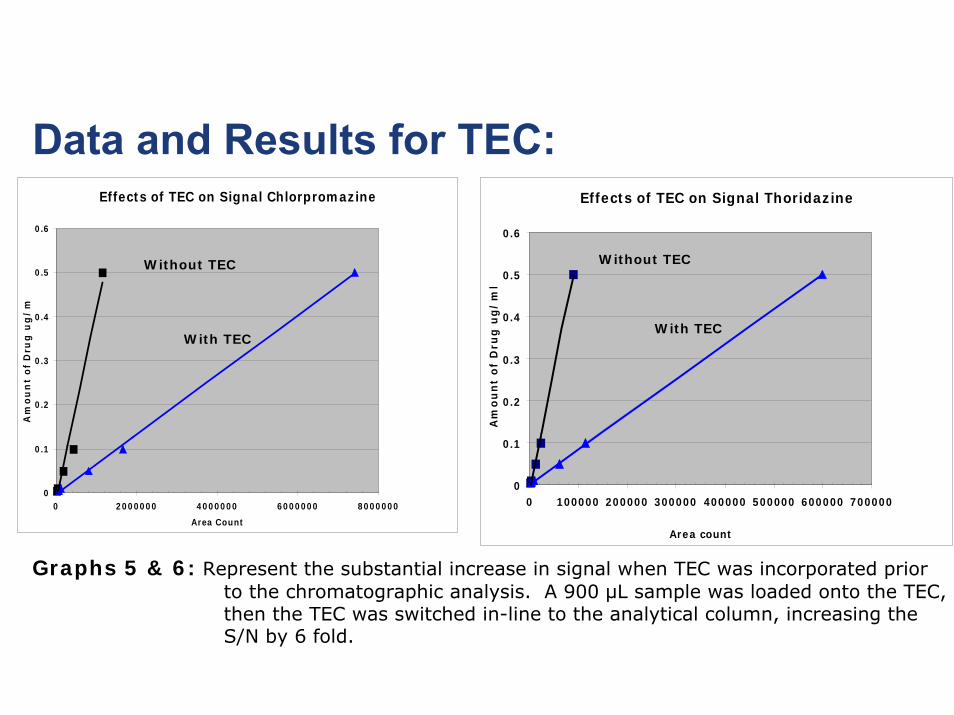
Data and Results for TEC:Effects of TEC on Signal Chlorpromazine
0
0.1
0.2
0.3
0.4
0.5
0.6
0 2000000 4000000 6000000 8000000
Area Count
Am
ou
nt
of
Dru
g u
g/
m
Effects of TEC on Signal Thoridazine
0
0.1
0.2
0.3
0.4
0.5
0.6
0 1000000
2000000
3000000
4000000
5000000
6000000
7000000
Area count
Am
ou
nt
of
Dru
g u
g/
ml
Graphs 5 & 6: Represent the substantial increase in signal when TEC was incorporated prior to the chromatographic analysis. A 900 μL sample was loaded onto the TEC, then the TEC was switched in-line to the analytical column, increasing the S/N by 6 fold.
Without TEC
With TEC
Without TEC
With TEC

Conclusion:• SPE is an important cleanup method for biological and environmental
samples
• A good rule of thumb: SPE cartridges retain a mass of solute (analyte plus retained contaminants) equivalent to 5% of the sorbent mass
• Optimizing SPE methods can be very advantageous however, extremely labor intensive and time consuming
• The automated Liquid Handler and SPE racks allow for the optimization process to take place via multiple collection sites and various conditions without manual intervention
• Incorporating the use of a TEC instead of drying down the eluent from SPE cleanup also offers a very advantageous alternative, removing the dry down bottleneck and analyte degradation

THANK YOU!