Embed Size (px)
Citation preview
Sitecore Performance
Table of Contents
1. Optimizing Sitecore 6 and later
1.1. Optimizing Performance in Sitecore
1.2. Database Administration
2. Optimizing Sitecore 5.3 and earlier
2.1. Storage in Sitecore
2.1.1. Storage Technology
2.1.2. Separate Server
2.1.3. Capacity Planning
2.1.4. Database Index Tuning
2.1.5. Staging
2.1.6. Database Administration
2.1.7. Deep vs Shallow Trees
2.2. Caching
2.2.1. Caching Output
2.2.2. Cache Sizing
2.2.3. Content Expiration in IIS
2.3. Programming
2.3.1. Practices
2.3.2. Optimize VS 2005
2.3.3. Optimize XSL
2.3.4. Convert XSL Renderings to .NET
2.3.5. Static HTML Generation
2.3.6. Debugging
2.4. Miscellaneous
2.4.1. Client Performance
2.4.2. Links
2.4.3. Modules & Components
2.4.4. Perfmon
2.4.5. Performance Monitoring
2.4.6. Publication
2.4.7. Stress Testing
2.4.8. Troubleshooting
Sitecore is designed to be a high-performance rendering engine, providing a highly-dynamic user experience and eliminating the need for static file
generation or inordinate hardware resources. In most cases Sitecore operates as a thin layer on top of the .NET Framework and a relational database
providing XML and process containers for the custom layouts, sublayouts and renderings used to build the web site.
1. Optimizing Sitecore 6 and later
For information about optimizing Sitecore 6 and later, see this section.
2. Optimizing Sitecore 5.3 and earlier
For information about optimizing Sitecore5.3 and earlier, see this section.
1. Optimizing Sitecore 6 and later
Below you will find tips and tricks how to optimize Sitecore performance starting from Sitecore 6 and later.
1.1. Optimizing Performance in Sitecore
This article contains a list of items that you should investigate if your Sitecore installation is experiencing poor performance.
1.2. Database Administration
View this section for database administration tips
1.1. Optimizing Performance in Sitecore
Note: Full-sized "CMS Performance Tuning Guide" document containing detailed instructions on how to implement most of the listed in this article items
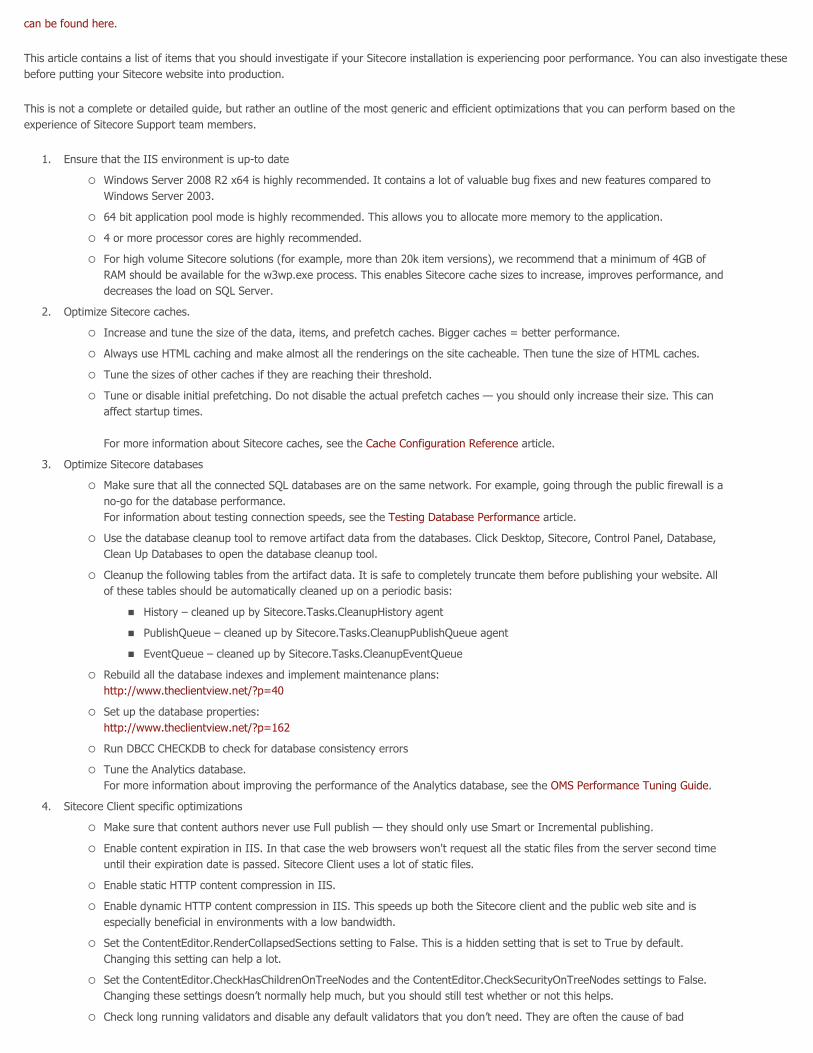
can be found here.
This article contains a list of items that you should investigate if your Sitecore installation is experiencing poor performance. You can also investigate these
before putting your Sitecore website into production.
This is not a complete or detailed guide, but rather an outline of the most generic and efficient optimizations that you can perform based on the
experience of Sitecore Support team members.
1. Ensure that the IIS environment is up-to date
� Windows Server 2008 R2 x64 is highly recommended. It contains a lot of valuable bug fixes and new features compared to
Windows Server 2003.
� 64 bit application pool mode is highly recommended. This allows you to allocate more memory to the application.
� 4 or more processor cores are highly recommended.
� For high volume Sitecore solutions (for example, more than 20k item versions), we recommend that a minimum of 4GB of
RAM should be available for the w3wp.exe process. This enables Sitecore cache sizes to increase, improves performance, and
decreases the load on SQL Server.
2. Optimize Sitecore caches.
� Increase and tune the size of the data, items, and prefetch caches. Bigger caches = better performance.
� Always use HTML caching and make almost all the renderings on the site cacheable. Then tune the size of HTML caches.
� Tune the sizes of other caches if they are reaching their threshold.
� Tune or disable initial prefetching. Do not disable the actual prefetch caches — you should only increase their size. This can
affect startup times.
For more information about Sitecore caches, see the Cache Configuration Reference article.
3. Optimize Sitecore databases
� Make sure that all the connected SQL databases are on the same network. For example, going through the public firewall is a
no-go for the database performance.
For information about testing connection speeds, see the Testing Database Performance article.
� Use the database cleanup tool to remove artifact data from the databases. Click Desktop, Sitecore, Control Panel, Database,
Clean Up Databases to open the database cleanup tool.
� Cleanup the following tables from the artifact data. It is safe to completely truncate them before publishing your website. All
of these tables should be automatically cleaned up on a periodic basis:
� History – cleaned up by Sitecore.Tasks.CleanupHistory agent
� PublishQueue – cleaned up by Sitecore.Tasks.CleanupPublishQueue agent
� EventQueue – cleaned up by Sitecore.Tasks.CleanupEventQueue
� Rebuild all the database indexes and implement maintenance plans:
http://www.theclientview.net/?p=40
� Set up the database properties:
http://www.theclientview.net/?p=162
� Run DBCC CHECKDB to check for database consistency errors
� Tune the Analytics database.
For more information about improving the performance of the Analytics database, see the OMS Performance Tuning Guide.
4. Sitecore Client specific optimizations
� Make sure that content authors never use Full publish — they should only use Smart or Incremental publishing.
� Enable content expiration in IIS. In that case the web browsers won't request all the static files from the server second time
until their expiration date is passed. Sitecore Client uses a lot of static files.
� Enable static HTTP content compression in IIS.
� Enable dynamic HTTP content compression in IIS. This speeds up both the Sitecore client and the public web site and is
especially beneficial in environments with a low bandwidth.
� Set the ContentEditor.RenderCollapsedSections setting to False. This is a hidden setting that is set to True by default.
Changing this setting can help a lot.
� Set the ContentEditor.CheckHasChildrenOnTreeNodes and the ContentEditor.CheckSecurityOnTreeNodes settings to False.
Changing these settings doesn’t normally help much, but you should still test whether or not this helps.
� Check long running validators and disable any default validators that you don’t need. They are often the cause of bad
performance.
� Do not show Standard Fields in Content Editor.
� Limit the number of items that share the same parent to 100 items per parent.
5. Cleanup obsolete versions and ensure they do not grow unrestricted – we do recommend to have no more than 5-10 versions per item in
Master database. Use the Version Manager shared source tool for this. http://marketplace.sitecore.net/en/Modules/Version_Manager.aspx
6. Check this article: http://sdn.sitecore.net/Scrapbook/Delay%20while%20validating%20digital%20signatures.aspx
7. Monitor Sitecore log files for any application restarts. If a new log file is generated, this often means that a restart has occured. Identify the
reason for the restart and address it.
� If the log file ends with a "Sitecore shutting down" message – this is a "soft crash" and for some reason the hosting
environment has forced the process to recycle (for example, due to some scheduled recycling or some critical file changes).
� If the log file does not end with a "Sitecore shutting down" message – this a “hard crash” due to for example a stack overflow
error or some worker thread deadlocks. A good solution could be to collect a process crash dump and analyze it with WinDbg.
8. Disable search indexes if you don't use them. Set Indexing.UpdateInterval to 00:00:00.
9. Watch out for any scheduled operations that may be running in the background - especially any custom made operations that for example
perform a complete rebuilding of the Lucene index.
10. Perform load testing and profiling of your solution to find slow running pages and code paths. This is the most efficient way to identify
any custom code and configuration issues.
� Load test the solution for example using:
� VS 2010 Load Testing Tools
� JMeter
� WCAT - http://www.theclientview.net/?p=131
� Profile your solution while stress testing (for example, by using the ANTS Performance profiler) to find bottlenecks in the code
that may need to be optimized.
� Valuable for understanding the health and performance of your application health and Windows performance counters:
� % time in GC
� # Induced GC
� # Bytes in all Heaps
� # Total committed bytes
� # Total reserved bytes
� Request/Sec
� Request Execution Time
� Valuable for understanding Sitecore caching state counters:
� CacheHits
� CacheMisses
� CacheClearings
� Data.PhysicalReads
� Data.PhysicalWrites
Major performance related fixes in the latest Sitecore 6 versions
1. 6.1.0 Update-2 – out of memory errors caused by FileWatchers
2. 6.1.0 Update-3 – UserProfile and IsUserInRole security caching
3. 6.2.0 Initial – SqlServerDataProvider.BlobStreamExists() caching
4. 6.2.0 Update-3 – duplicate requests to RolesInRoles provider (ref. 322685)
5. 6.2.0 Update-3 – crashes due to cyclic role inheritance (ref. 309080)
6. 6.3.0 Initial – publishing performance increased
7. 6.3.1 Initial – SQL replication can now be used for Scaling
1.2. Database Administration
Testing Database Performance
The recommendation below is primarily addressed to Sql Server environments.
A fast database connection is an important prerequisite for a stable Sitecore environment. Although data is cached in memory, you will eventually end up
with an empty cache, resulting in a read from the database on each Item request for the first requests to your web server. Imagine your website’s front
page navigates through 8000 Items to render itself, and each read from the database takes 5ms. On that initial request to the front page, 40 seconds
would be the smallest timeframe this request would take to execute. Meanwhile new incoming requests could pile up and overload the server.
So what is a fast connection, and how do we measure it?
You can download the test aspx code which allows to obtain the basic benchmark.
Downloads for Sitecore CMS 6.x
� Download test aspx code for Sitecore CMS 6.x, put it under the site root folder and open it in a Web browser, such as {site name}/databasetest.aspx.
The page content:
Server Information table – provides general information about the SQL Server instance.
Testing result table – contains the following columns:
Action – shows the performed testing action and how many times it had been performed (the default cycles count is 10000, but it can be changed
in the source code manually in the “cycles” variable).
Min Time – the minimal period of time taken to perform one test action.
Max Time – the maximal period of time taken to perform one test action.
Average Time – the average period of time taken to perform one test action.
Boundary Average Time – the approximate limit of average time that must be taken to perform one test action. If Average Time exceeds Boundary
Average Time, this may imply SQL database performance problems.
Indexes Information table – provides information about database indexes (see note 2 for additional information).
SQL Server Required Permissions:
ALTER permission
CONTROL permission
VIEW DATABASE STATE permission
EXECUTE permission
Notes:
1. The SQL server 2005 sp2 or later is required.
2. In the index information, it only indexes when more than 7000 rows and more than 5% fragmentation is displayed. (rebuilding indexes with
a low count of rows has no effect)
3. "Server Information" is taken from that server where corresponding database is hosted.
2. Optimizing Sitecore 5.3 and earlier
Below you will find tips and tricks how to optimize the performance of Sitecore 5.3 and earlier.
2.1. Storage in Sitecore
This section contains recommendations concerning capacity planning of the database server and database performance testing and administration
2.2. Caching
From this section you will learn about cache levels in Sitecore, configuring and sizing cache and increasing performance using cache
2.3. Programming
This section is dedicated to best programming practices, speeding up Sitecore installation and debugging in Sitecore
2.4. Miscellaneous
This section contains various advice for optimizing Sitecore installation, troubleshooting and detecting weak points
2.1. Storage in Sitecore
This section contains recommendations concerning capacity planning of the database server and database performance testing and administration
2.1.1. Selecting Storage Technology
In general .NET is best optimized with MS SQL Server
2.1.2. Separate Database Server
For best performance the database server should be hosted on a separate machine
2.1.3. Capacity Planning
In general one or two GB is enough space for most Sitecore implementations
2.1.4. Database Index Tuning
Clustered indexes on the fields tables has shown to increase performance especially when multiple versions of the same item exist.
2.1.5. Staging
By default every Sitecore instance has the resources to host both the CMS User Interfaces and the published site itself
2.1.6. Database Administration
View this section for database administration tips
2.1.7. Deep vs Shallow Trees
Performance degrades as the number of items under any item increases considerably.
2.1.1. Selecting Storage Technology
In general .NET is best optimized with MS SQL Server.
2.1.2. Separate Database Server
The hardware requirements documented for Sitecore refer to the web server; for best performance the database server should be hosted on a separate
machine.
2.1.3. Capacity Planning
The first aspect of capacity planning is separation of development, testing, quality assurance, production environments along with the separation of CMS
and runtime environments.
The performance of a Sitecore runtime web server with detached database storage depends on the complexity of the site implemented and its caching
configuration. Average CPU utilization per page can be used to approximate the number of pages which can be served in a given time – if each page
takes 25ms to render, the machine cannot serve more than 40 pages per second, 2,400 pages per minute or 144,000 pages per hour; a rendering time of
10ms per page would result in closer to 360,000 pages per hour. Average page rendering time and peak expected user load can be used to estimate
required capacity.
It is possible to host multiple websites under a single Sitecore installation by configuring the hostName for <site> entries in the <sites> section
of /web.config. This may be appropriate when there is a large amount of code and/or content overlap between the sites, but when sites are independent
they can also be hosted under separate document roots. Sitecore’s architecture allows multiple web and CMS servers to share the same security and
extranet databases. Each website or database consumes resources.
Consider recommendations below when planning disc space for the databases:
1. The disc space required depends on the size of the site. 1GB would generally be a minimum disc space. A larger site may require more
storage.
2. The databases are separated for easier administration in large-scale environments where web, extranet and/or other databases are hosted
or duplicated in one or more environments. Many item properties can be inherited, which minimizes storage requirements. A Sitecore item
contains all of the data for a page. An item's size can vary from 1KB to 15KB or even more, depending on the amount of content, specific
layout and security settings and other values applied. This description does not account for the file system data (media and code), but the
term item includes metadata about such files. This document assumes SQL Server is used.
There are seven databases behind a standard Sitecore installation, each of which varies in size and growth rate.
The size of the web and master databases depends on the number and size of items stored. The size of the master database also depends on the number
of versions per item, the amount of workflow history stored and possibly other factors. An item can vary in size from 1KB. Approximate database size
requirements can be calculated as follows:
50MB + (Years * Items * Versions/Year * Bytes/Version * Languages)
For instance, if four versions of 10,000 15KB items are created each year, item requirements for the master database in 5 years should be:
50 MB + (5 * 10,000 * 4 * 15,360 * 1) ~ 3 GB
Requirements for the web database would be the same if only one version of each Item is considered. So, the web database contains only the most recent
version of each Item:
50MB + (Items * Bytes/Version * Languages)
The implementation of the Workflow should not make the master database more than 5% larger.
In general the remaining five databases will be more than covered by 500MB.
� The archive database contains items which have been removed from the CMS and the published site but have not been permanently deleted; reserve 100MB
unless archiving requirements are high, in which case, reserve enough space for the number of items which will need to be archived over the life of the database.
� The core database controls the Sitecore UI and should grow minimally; reserve 100MB unless customization requirements are extreme.
� The recycle bin contains items which have been removed but not purged from the CMS; reserve 100MB unless deletion will be constant or the recycle bin cannot
be emptied periodically.
� The sizes of the extranet and security databases depend on the number of roles and users in each domain; reserve a minimum of 10MB for each plus at least 10KB
per user or simply 200MB. Multiple Sitecore instances can share individual extranet and security databases, and content can be published from a single master
database to multiple web databases.
In general this analysis would indicate that one or two GB should be adequate for most Sitecore implementations.
2.1.4. Database Index Tuning
Database Index Tuning
Summary
Database index tuning can increase the performance of high-volume Sitecore solutions to improve the user experience for both editors and the viewing
public. This article applies primarily to Sitecore implementations using SQL Server 2005, though similar techniques could be applied on solutions using
other supported RDBMS technologies. The specific techniques described in this resource have been shown to improve performance by up to 100 times for
certain operations.
Instructions for Sitecore CMS 5.3.1
Note: this section applies to Sitecore versions through 5.3.1 070924. The upgrade process from 070924 and earlier does not apply these changes
automatically (they should be applied manually after the upgrade).
Recommended Database Changes to Improve Performance
� For the SharedFields table in All Sitecore Databases:
� Change the ndxLookup index from Nonclustered to Clustered
� Configure Fill Factor for the ndxLookup index to between 50% and 75%
� Enable Pad Index for the ndxLookup index
� For the VersionedFields table in All Sitecore Databases:
� Create a clustered index named ndxItemIdon the column ItemId
� Configure Fill Factor for the ndxItemId index to between 50% and 75%
� Enable Pad Index for the ndxItemId
� For the UnversionedFields table in All Sitecore “Master” databases:
� Create a clustered index named ndxItemId on the column ItemId
� Configure Fill Factor for the ndxItemId index to between 50% and 75%
� Enable Pad Index for the ndxItemId index
Tuning Indexes in Management Studio
Updating the Type of an Existing Index (from Nonclustered to Clustered)
To update properties of an existing index take the following action;
� Expand Indexes under the table
� Double-click on the index
� Change the Index type property on the General tab.
Configuring the Fill Factor or enabling Pad Index for an Existing Index
To set the Fill Factor or enable Pad Index for an existing index take the following steps;
� Expand Indexes under the table
� Double-click the index
� Select the Options tab
� Select the Set fill factor checkbox and enter a percentage
� Select the Pad index checkbox if appropriate.
� Acknowledge the index properties
� Right-click on the index and choose Rebuild.
Creating a New Index
To create a new index take the following steps;
� Right-click Indexes under the table
� Choose New Index.
� On the General tab enter the Index name then select the Index type
� Press Add and select the column(s) to be indexed.
� If specifying a Fill factor or enabling Pad Index, select the Options tab, select the Set fill factor checkbox and enter a percentage.
� Select the Pad index checkbox if appropriate.
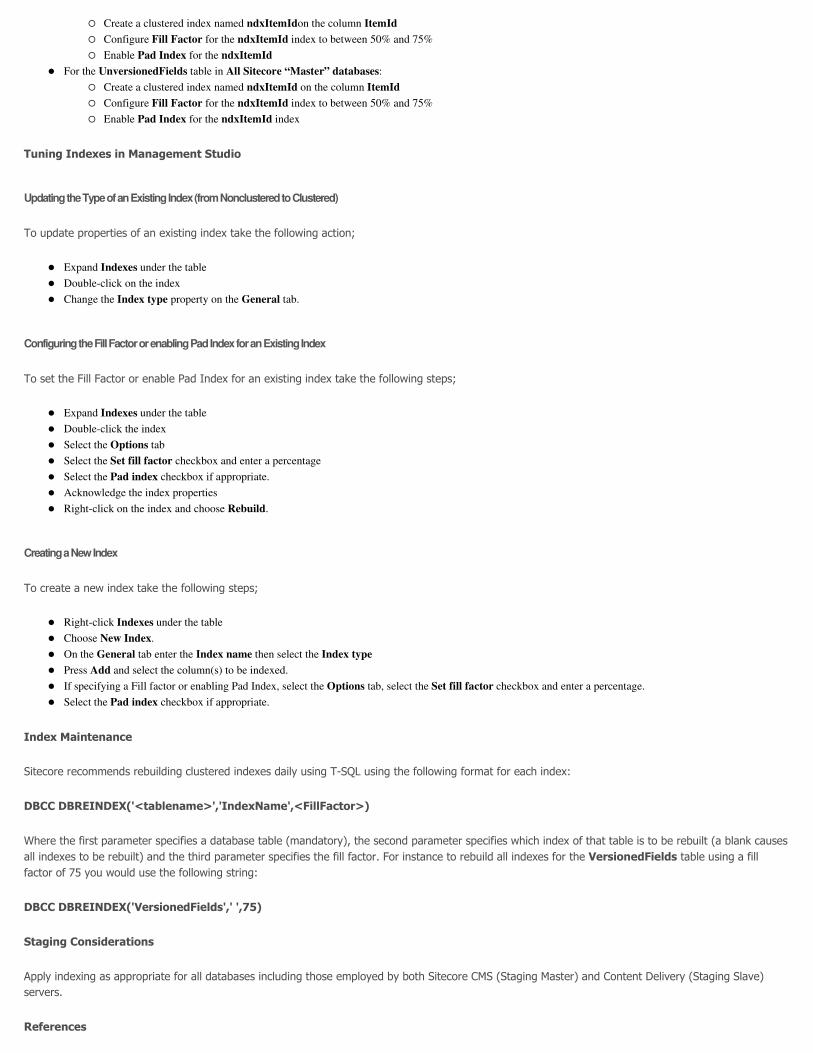
Index Maintenance
Sitecore recommends rebuilding clustered indexes daily using T-SQL using the following format for each index:
DBCC DBREINDEX('<tablename>','IndexName',<FillFactor>)
Where the first parameter specifies a database table (mandatory), the second parameter specifies which index of that table is to be rebuilt (a blank causes
all indexes to be rebuilt) and the third parameter specifies the fill factor. For instance to rebuild all indexes for the VersionedFields table using a fill
factor of 75 you would use the following string:
DBCC DBREINDEX('VersionedFields',' ',75)
Staging Considerations
Apply indexing as appropriate for all databases including those employed by both Sitecore CMS (Staging Master) and Content Delivery (Staging Slave)
servers.
References
For more information on SQL Server indexing, Fill Factor and Pad Index, please see:
� http://www.quest-pipelines.com/newsletter-v4/1203_B.htm
� http://msdn2.microsoft.com/en-us/library/ms181671.aspx
Instructions for Sitecore CMS 6.x
Note that you do NOT need to apply instructions for Sitecore CMS 5.3 mentioned above to Sitecore CMS 6 and later solutions.
You should apply the instructions in the SQL Server Index Fragmentation Level and the Database Properties sections that are described in the OMS
Performance Tuning Guide to all Sitecore content databases:
http://sdn.sitecore.net/Reference/Sitecore%206/OMS%20Performance%20Tuning%20Guide.aspx
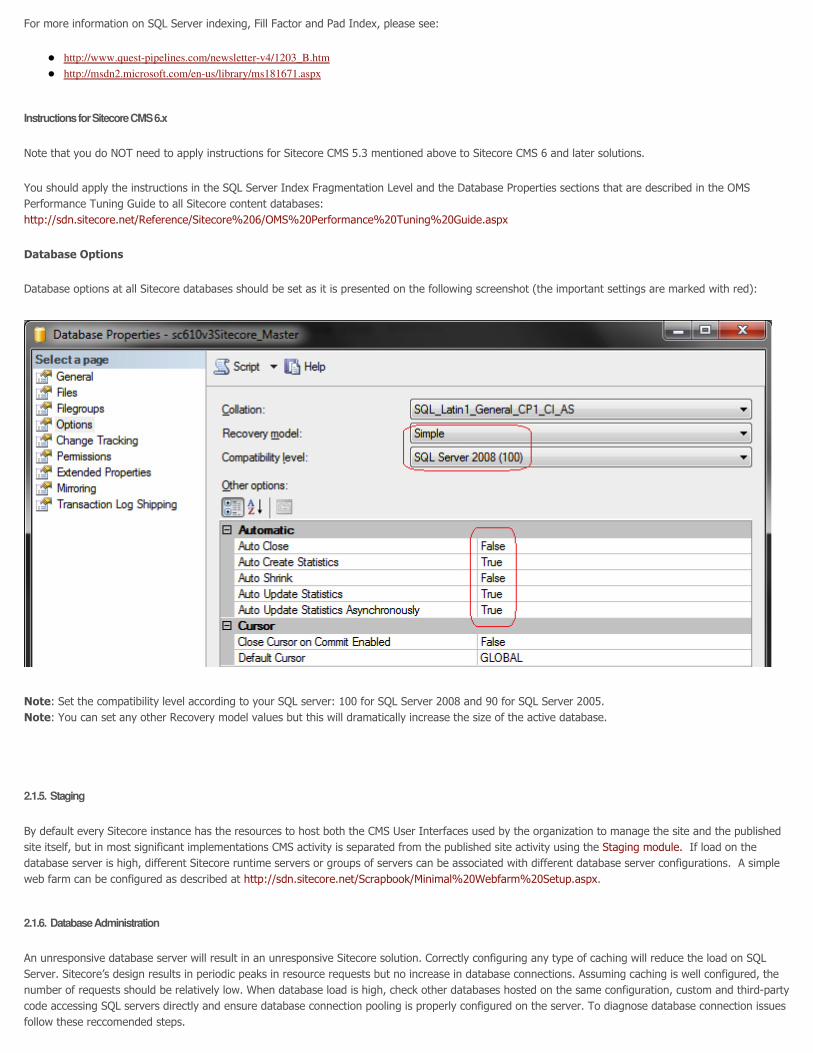
Database Options
Database options at all Sitecore databases should be set as it is presented on the following screenshot (the important settings are marked with red):
Note: Set the compatibility level according to your SQL server: 100 for SQL Server 2008 and 90 for SQL Server 2005.
Note: You can set any other Recovery model values but this will dramatically increase the size of the active database.
2.1.5. Staging
By default every Sitecore instance has the resources to host both the CMS User Interfaces used by the organization to manage the site and the published
site itself, but in most significant implementations CMS activity is separated from the published site activity using the Staging module. If load on the
database server is high, different Sitecore runtime servers or groups of servers can be associated with different database server configurations. A simple
web farm can be configured as described at http://sdn.sitecore.net/Scrapbook/Minimal%20Webfarm%20Setup.aspx.
2.1.6. Database Administration
An unresponsive database server will result in an unresponsive Sitecore solution. Correctly configuring any type of caching will reduce the load on SQL
Server. Sitecore’s design results in periodic peaks in resource requests but no increase in database connections. Assuming caching is well configured, the
number of requests should be relatively low. When database load is high, check other databases hosted on the same configuration, custom and third-party
code accessing SQL servers directly and ensure database connection pooling is properly configured on the server. To diagnose database connection issues
follow these reccomended steps.
� Configure perfmon to document the number of connections and requests per second.
� Shut down all websites connected to the server.
� Restart the database resulting in zero connections.
� Restart the websites.
� Analyze any unusual behavior in the perfmon results.
2.1.6.1. Testing Database Performance
Testing Database Performance
The recommendation below is primarily addressed to Sql Server environments.
A fast database connection is an important prerequisite for a stable Sitecore environment. Although data is cached in memory, you will eventually end up
with an empty cache, resulting in a read from the database on each Item request for the first requests to your web server. Imagine your website’s front
page navigates through 8000 Items to render itself, and each read from the database takes 5ms. On that initial request to the front page, 40 seconds
would be the smallest timeframe this request would take to execute. Meanwhile new incoming requests could pile up and overload the server.
So what is a fast connection, and how do we measure it?
You can download the test aspx code which allows to obtain the basic benchmark.
Downloads for Sitecore CMS version before 5.3 and for CMS 5.3
� Download test aspx code for pre Sitecore 5.3.x versions
� Download test aspx code for Sitecore 5.3.x versions
Specify in the aspx file, if you use Sitecore 4 or Sitecore 5 version, how many reads you want to perform, and the connection string for your database.
Default is 10000 reads.
Sample output for Sitecore 4 test:
Test done, 10000 reads in: 7500,79972465599 milliseconds
Sample output for Sitecore 5 test:
Test done, 10000 reads in: 4923,05249413557 milliseconds
If your own measurements are significantly slower than this, you should keep this in mind if you experience performance problems. Could a firewall
between your webserver and database explain the slow response times? Is the database server or network connection overloaded? One way or the other,
you are better off knowing how your database performs.
SQL Server Required Permissions:
ALTER permission
CONTROL permission
2.1.7. Deep vs Shallow Trees
Administrators should take into account that performance degrades as the number of items under any item increases. Usability is also affected - trying to
locate an item in a long list of items can be challenging and time-consuming (think about locating a file within a directory containing hundreds of files).
This is true anywhere data is stored hierarchically - in Content Editor, in User Manager or anywhere else. As a general precaution, no item should be the
parent of more than 100 other items. Plan for growth over time as well - consider how frequently and how many children will likely appear under an item
over the lifetime of the solution.
Architects should design their content trees to be deep rather than shallow to achieve optimal performance. For instance, consider a solution designed to
sell a large number of various camera models, each within a primary category such as "Point&Shoot" or "Professional". Rather than simply creating
categories with models directly beneath each, consider additional subcategories such as brands. The hierarchy should also be designed for maximum
usability by the content editors and to support rendering logic required for the site.
If a company has a thousand users who access the site or more, architects should group users such as by location, by office, by department, by team, by
first letter(s) of login name or other criteria to support a limitted number of users under each folder in user manager.
2.2. Caching
Correctly configuring caching of the output of renderings is generally the most effective way to increase the performance of a Sitecore solution. Most
Sitecore solutions are very dynamic, generating output for each HTTP request based on a number of factors including session, device, language,
authentication, authorization, protocol, domain, path, query string parameters and other variables. In such dynamic solutions, it is generally preferable to
set caching options on individual rendering components which are relatively static. Sitecore provides caching options which allow the rendered data to be
retrieved from cache if the data source, device, authentication status, user, rendering parameters and/or query string parameters are the same as the
previous request, as described in the Presentation Component Reference document.
There are at least three levels of caching in Sitecore.
� Item XML – this cache contains Sitecore’s raw XML and/or object data before any processing. The main considerations are configuring the size in /web.config
and the fact that any type of the publication clears the cache.
� Rendered Output – “HTML” cache of the output of various renderings under differing conditions.
� Security – the security descriptor database(s) associated with Item XML.
2.2.1. Caching Rendered Output
There are three places where caching of renderings can be configured in Sitecore
2.2.2. Cache Sizing
There are two major levels of caching in Sitecore
2.2.3. Performance Improvements by Using Content Expiration in IIS
Changing settings in the IIS can lead to noticable performance improvements when using the Sitecore client
2.2.1. Caching Rendered Output
There is a new article on SDN which covers this topic. Please read the Presentation Component Reference to get detailed information.
2.2.2. Cache Sizing
There are two major levels of caching in Sitecore:
� Database caches which are created for each database separately. They are data, path and credential caches.
� Site caches which are created for each site separately. They are html, xsl, registry and viewstate caches.
Cache sizes can be set up either on a specific site or database definition or it can be specified in the <cacheSizes> section. The values set directly on a
site or a database will always take precedence over the values set in <cacheSizes>.
Each set of caches is completely unrelated to other sets and works in its own environment with its own data.
Site-level caches are rather specific and work only in certain situations:
� HTML caching works only with output of Sitecore.Web.UI.WebControl class (and its derivatives).
� XSL, registry and viewstate caches work for respective parts of functionality only.
� HTML cache is disabled in the preview, webedit and debug modes.
� XSL cache is cleared when a corresponding XSL is changed in the file system.
The <cacheSizes> section should pretty much be self-explanatory. An example is shown below.
<cacheSizes> section settings
<cacheSizes>
<databases>
<master>
<data>20MB</data> <!-- data cache size for the database -->
<credential>2MB</credential> <!-- security data cache size for the database -->
<path>1MB</path> <!-- file path cache used by items of the database -->
</master>
</databases>
<sites>
<shell>
<html>2MB</html> <!-- html cache size for the site -->
<registry>3MB</registry> <!-- registry cache size for the site -->
<viewState>200KB</viewState> <!-- view state cache size for the site -->
<xsl>5MB</xsl> <!-- xsl renderings cache size for the site -->
</shell>
</sites>
</cacheSizes>
The valid cache names for the <databases> element are:
� data
� credential
� pathMapping
The valid cache names for the <sites> element are:
� html
� registry
� viewstate
� xsl
To set a cache size directly on a database, you must use the properties on the database object (as the database object is constructed by Sitecore.Factory
using only reflection).
To set the size of the data cache on the "master" database you can use:
<database id="master" ...>
...
<caches.DataCache.MaxSize>1000000</caches.DataCache.MaxSize>
</database>
Note that the size must be specified in bytes (as the type of the MaxSize property is long).
Database caches are controlled by the CacheOptions.DisableAll setting in the <dataProviders> section of the web.config file. CacheOptions.DisableAll set
to true on a dataprovider will disable database-level caches for all databases that use this dataprovider. For instance:
<filesystem type="Sitecore.Data.DataProviders.FileSystemDataProvider, Sitecore.Kernel">
<CacheOptions.DisableAll>true</CacheOptions.DisableAll>
</filesystem>
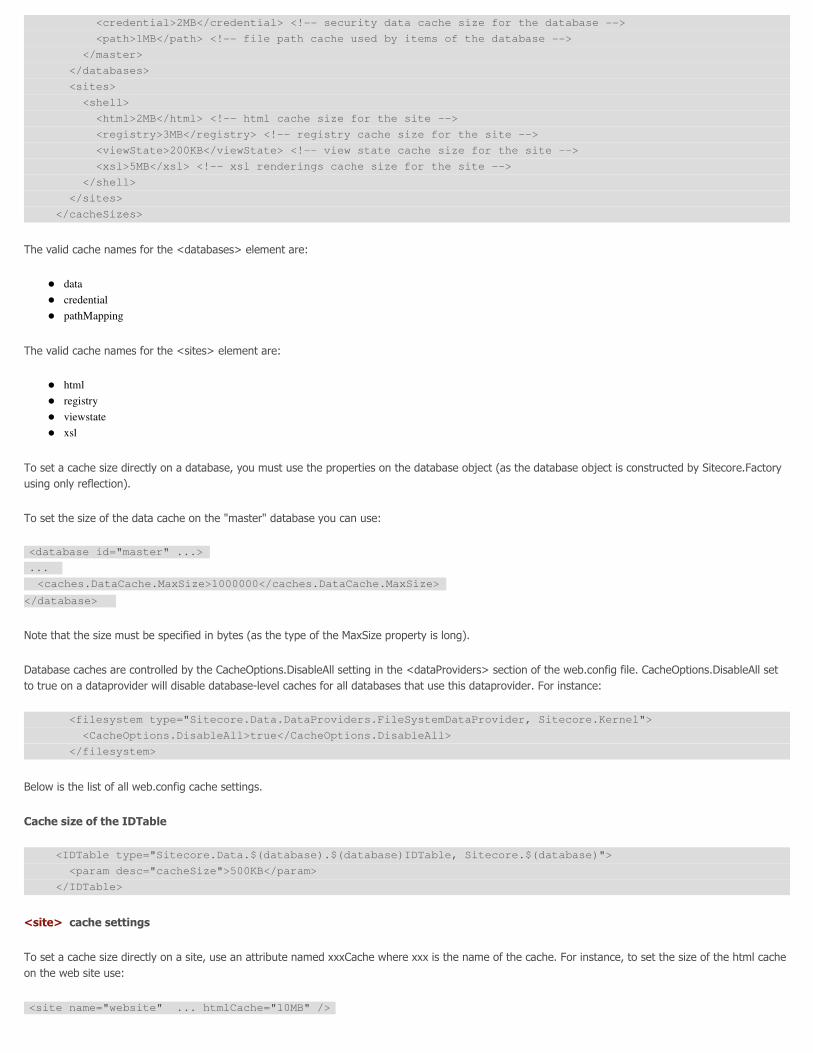
Below is the list of all web.config cache settings.
Cache size of the IDTable
<IDTable type="Sitecore.Data.$(database).$(database)IDTable, Sitecore.$(database)">
<param desc="cacheSize">500KB</param>
</IDTable>
<site> cache settings
To set a cache size directly on a site, use an attribute named xxxCache where xxx is the name of the cache. For instance, to set the size of the html cache
on the web site use:
<site name="website" ... htmlCache="10MB" />
The size can be specified in bytes (no postfix), kilobytes (KB) or megabytes (MB). Spaces and dots are allowed in the value string, so the following is also
valid:
<site name="website" ... htmlCache="1.024 KB" />
The settings listed below define the basic cache settings. They are overridden by the settings defined in the <sites> section.
� <setting name="Caching.CacheViewState" value="true" />
<!-- indicates whether to use caching for the view state -->
� <setting name="Caching.DefaultCredentialCacheSize" value="1MB" />
<!-- Determines the default credential cache size (can be redefined for the site) -->
� <setting name="Caching.DefaultDataCacheSize" value="10MB" />
<!-- Determines the default data cache size (can be redefined for the site) -->
� <setting name="Caching.DefaultHtmlCacheSize" value="5MB" />
<!-- Determines the default html cache size (can be redefined for the site) -->
� <setting name="Caching.DefaultPathCacheSize" value="100KB" />
<!-- Determines the default path cache size (can be redefined for the site) -->
� <setting name="Caching.DefaultRegistryCacheSize" value="5MB" />
<!-- Determines the default registry cache size (can be redefined for the site) -->
� <setting name="Caching.DefaultViewStateCacheSize" value="5MB" />
<!-- Determines the default view state cache size (can be redefined for the site) -->
� <setting name="Caching.DefaultXslCacheSize" value="10MB" />
<!-- Determines the default xsl rendering cache size (can be redefine for the site) -->
� <setting name="Caching.Enabled" value="true" />
<!-- Determines if caching should be enabled at all -->
� <setting name="DisableBrowserCaching" value="true" />
<!-- If true, all pages will have: Cache-Control: no-cache, no-store, Pragma: no-cache in the http header -->
2.2.2.1. Cache Duration
If the default cache duration is not sufficient, renderings can be written to perform their own caching.
2.2.2.2. Publishing
Items which are updated by the publishing process are automatically removed from the item XML cache. By default /web.config is configured such that
publishing clears the security and rendering caches. In this configuration frequent publication can decrease performance. It is also possible to clear the
rendering cache on a scheduled basis.
2.2.3. Performance Improvements by Using Content Expiration in IIS
We have discovered something which could actually be really important for remote users. Changing settings in the IIS can lead to noticable performance
improvements when using the Sitecore client.
Background
When using the Sitecore client, quite a few images fetched and updated via Ajax/Sheer result in an HTTP request to the server. But they should not have
been server requests, but instead simply fetched from local cache. And even though most of these requests result in a "304 Not Modified" status message,
the round-trip time alone will make the user experience a delay if they are on a slow connection.
Enabling the content expiration below will thus make the local IE use the local cache and save several server HTTP requests on each click in the content
editor (simply moving the mouse around can also trigger HTTP requests without this enabled)
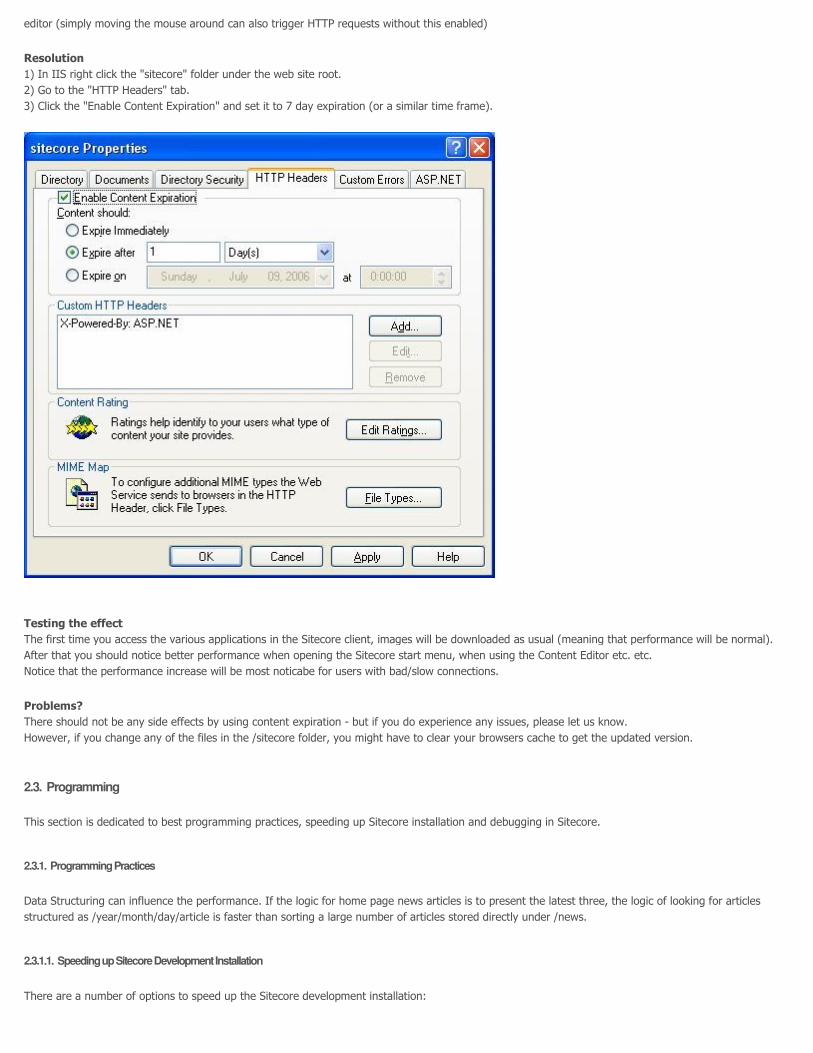
Resolution
1) In IIS right click the "sitecore" folder under the web site root.
2) Go to the "HTTP Headers" tab.
3) Click the "Enable Content Expiration" and set it to 7 day expiration (or a similar time frame).
Testing the effect
The first time you access the various applications in the Sitecore client, images will be downloaded as usual (meaning that performance will be normal).
After that you should notice better performance when opening the Sitecore start menu, when using the Content Editor etc. etc.
Notice that the performance increase will be most noticabe for users with bad/slow connections.
Problems?
There should not be any side effects by using content expiration - but if you do experience any issues, please let us know.
However, if you change any of the files in the /sitecore folder, you might have to clear your browsers cache to get the updated version.
2.3. Programming
This section is dedicated to best programming practices, speeding up Sitecore installation and debugging in Sitecore.
2.3.1. Programming Practices
Data Structuring can influence the performance. If the logic for home page news articles is to present the latest three, the logic of looking for articles
structured as /year/month/day/article is faster than sorting a large number of articles stored directly under /news.
2.3.1.1. Speeding up Sitecore Development Installation
There are a number of options to speed up the Sitecore development installation:
� Disable the indexes. Indexes are responsible for the search bar in Sitecore taskbar. If you can work without it, then comment out the <indexes> section inside the
database section in web.config (that is most probably /databases/master/indexes). The search will be disabled, along with index updates on each item
create/update/delete operation.
� Switch your site to the 'live' mode. Live mode completely eliminates the need for publishing, which can be annoying in development scenarios, by taking all
items directly from the content authoring database. To activate this go to your website in <sites> section of web.config (the site is called 'website' by default) and
change database="web" to database="master". This is the way Sitecore client site works with the core database. Naturally, by switching the publishing off you
also lose the publishing restrictions, that is 'do not publish/publish date' features.
2.3.1.2. Link Database
2.3.2. Optimize VS 2005
If you are finding that Visual Studio 2005 if running slowly you can take these steps to improve the speed of your IDE. Here are the tips:
� Disable Start Page.
Tools » Options » Environment » Startup, Change At startup setting to Show empty environment.
� Disable the splash screen.
� Open the properties of Visual Studio 2005 shortcut. Add the parameter /nosplash to the target.
For example: "C:\Program Files\Microsoft Visual Studio 2005\Common7\IDE\devenv.exe" /nosplash
� Close all unnecessary panels and tabs to prevent them from appearing when the IDE loads.
Then optimize your environment itself:
� Install Visual Studio 2005 SP1
� Turn off animations.
Tools » Options » Environment, uncheck Animate environment tools.
These and other useful features for optimising VS2005 were listed from an article published on a Sitecore blog recently. to see the posting click on the
following link.
http://sitecore.alexiasoft.nl/2007/10/25/increasing-productivity-with-visual-studio-2005/
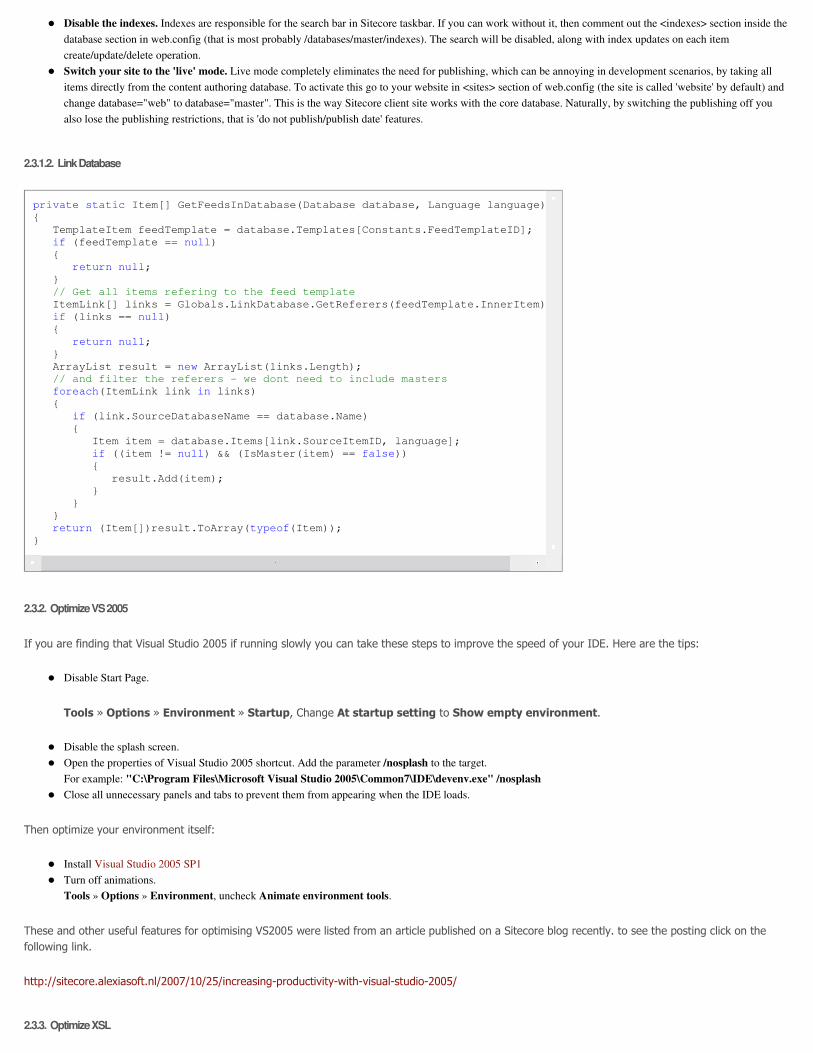
2.3.3. Optimize XSL
private static Item[] GetFeedsInDatabase(Database database, Language language)
{
TemplateItem feedTemplate = database.Templates[Constants.FeedTemplateID];
if (feedTemplate == null)
{
return null;
}
// Get all items refering to the feed template
ItemLink[] links = Globals.LinkDatabase.GetReferers(feedTemplate.InnerItem);
if (links == null)
{
return null;
}
ArrayList result = new ArrayList(links.Length);
// and filter the referers - we dont need to include masters
foreach(ItemLink link in links)
{
if (link.SourceDatabaseName == database.Name)
{
Item item = database.Items[link.SourceItemID, language];
if ((item != null) && (IsMaster(item) == false))
{
result.Add(item);
}
}
}
return (Item[])result.ToArray(typeof(Item));
}
You should avoid using the descendant axes (//, etc.).
Because of a memory leak in the 1.1 .NET framework (http://support.microsoft.com/default.aspx?scid=KB;EN-US;Q316775) which can lead to increased
CPU usage, implement .NET extensions instead of script embedded in the XSL code with msxml:script. .NET 2.0 may correct this issue. Implementing XSL
Extensions is described at Creating Sitecore Extension Function.
2.3.4. Convert Underperforming XSL Renderings to .NET
Certain operations can be completed much more efficiently in .NET than in XSL. Use Sitecore’s browser-based debugger to identify poorly performing code
for migration to pure .NET.
Invoking XSL may be more expensive in .NET than executing native .NET code. If possible, certain XSL renderings, especially those which consume a
great deal of resources or can only be cached under limited conditions should be converted to .NET method renderings, sublayouts or web controls.
Expensive XSL code can be converted to .NET extension controls and functions.
2.3.5. Static HTML Generation
Static generation should only be considered as a last resort as it defeats much of the value of implementing Sitecore.
2.3.6. Debugging
In addition to debuggers such as the one provided with Microsoft Visual Studio .NET, Sitecore provides a browser-based debugger which can be activated
in Layout Studio and by choosing Start from the Debug menu, through http://server?sc=debug=1 or by creating a menu item in the core database such as
through the debug package available from http://groups.yahoo.com/group/sitecore/files. Use Sitecore’s debugger to determine why pages are not
rendering correctly and which rendering components are consuming inordinate resources. Use the Microsoft Visual Studio .NET debugger for line-level
debugging. See http://sdn.sitecore.net/SDN5/Articles/API/Debugging%20Your%20Sitecore%20Code.aspx for specifics on debugging with Sitecore.
2.3.6.1. Accessing Sitecore Debugging More Easily
The Visual Studio .NET debugger is great for debugging .NET at the code level, but Sitecore’s browser-based debugger is often useful for performance
analysis and high-level investigation such as looking at the output of an entire page or individual rendering. The debugger requires authentication as an
administrator and provides some settings through /web.config (search for “debug”). There are at least two ways to access the debugger:
� Choose Start from the Debug menu in Layout Editor
� Access http://server?sc_debug=1 after authenticating
To add a Debug button to the bottom of the Sitecore menu, install the package or follow these steps:
� Log in to the Desktop as an administrator
� Switch to the Core Database using the icon in the lower right corner
� Open Content Editor
� Navigate to Documents and settings, All users, Start menu, Bottom
� Create a new Toolbutton
� In the Data Section
� Set Click to "system:debug"
� Set Header to "Debug"
� Set Icon to "Software/24x24/bug_red.png"
� Set ID to "Debug"
� Set Tool tip to "Debug"
� In the Appearance Section
� Set Icon to "Software/24x24/bug_red.png".
� In the Security Section
� Deny Everyone Read permission (it should only be exposed to administrators)
� Switch back to the Master Database
Refresh the desktop and a Debug item should appear at the bottom of the Sitecore menu.
You can download a ready-made package which adds a Debug button into Sitecore menu here .
2.4. Miscellaneous
This section contains various advice for optimizing Sitecore installation, troubleshooting and detecting weak points.
2.4.1. Documenting Client Performance
Refer to this section to learn how to document client performance
2.4.2. Links
View this section for related links
2.4.3. Modules and Third-Party Components
Check documentation specific to any modules or third-party components integrated into the solution
2.4.4. Perfmon
Configure perfmon to monitor Requests/Sec, Request Execution Time and % Processor Time
2.4.5. Performance Monitoring
This article will show you the most efficient way of pinpointing what drains your resources.
2.4.6. Publication
Infrequent incremental publishing has the least impact on site performance
2.4.7. Stress Testing
Certain types of processing may work well with small data sets or user load, but it is important to test the system in advance using large loads whenever
possible
2.4.8. Troubleshooting
Check this section for troubleshooting instructions
2.4.1. Documenting Client Performance
Every now and then users experience that the Sitecore client responds in a "slowly manner" at least for some actions. As you might know, the path from
slow experience to unhappy customer is not long. Now what appears fast or normal to one user may appear slow to another user. Therefore it is beneficial
for all parties if one can quantify what exactly the customer sees as slow. In the following article I will show how this can be done using an IE plugin called
HttpWatch. There are other tools like Fiddler that does the same job.
Getting the plugin
The plugin can be found at http://www.httpwatch.com/. After installing it, the plugin will appear as a button in your IE toolbar.
Documenting Client Performance
Faced with a statement like "the client performs slowly" is too vague a statement to be of any value in either support or product management. Therefore
such statements should be met by the following questions:
1. What actions in the client do you see as slow?
2. How long time do these actions take to perform?
3. Do they always take this long?
Assuming you have identified an action that is seen as slow th efollowing guideline can be used to answer question 2. above on how long time this action
actually takes.
1. Navigate to the context in the client where the action is performed
2. Open the HttpWatch plugin.
3. Configure the plugin filter to show only content of type text/html - Close the HtppWatch Filter window.
4. Choose "Start" in the plugin to monitor http traffic.
5. Activate the action seen as slow - Wait until the client is updated.
6. Choose "Stop"
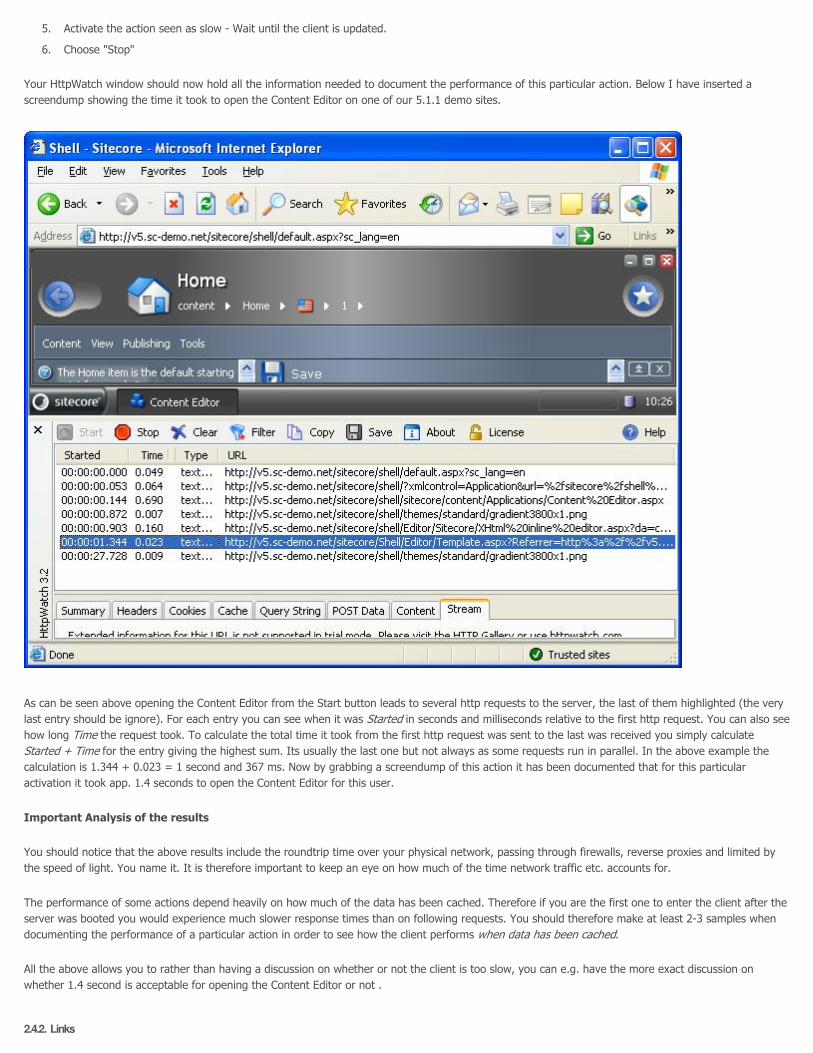
Your HttpWatch window should now hold all the information needed to document the performance of this particular action. Below I have inserted a
screendump showing the time it took to open the Content Editor on one of our 5.1.1 demo sites.
As can be seen above opening the Content Editor from the Start button leads to several http requests to the server, the last of them highlighted (the very
last entry should be ignore). For each entry you can see when it was Started in seconds and milliseconds relative to the first http request. You can also see
how long Time the request took. To calculate the total time it took from the first http request was sent to the last was received you simply calculate
Started + Time for the entry giving the highest sum. Its usually the last one but not always as some requests run in parallel. In the above example the
calculation is 1.344 + 0.023 = 1 second and 367 ms. Now by grabbing a screendump of this action it has been documented that for this particular
activation it took app. 1.4 seconds to open the Content Editor for this user.
Important Analysis of the results
You should notice that the above results include the roundtrip time over your physical network, passing through firewalls, reverse proxies and limited by
the speed of light. You name it. It is therefore important to keep an eye on how much of the time network traffic etc. accounts for.
The performance of some actions depend heavily on how much of the data has been cached. Therefore if you are the first one to enter the client after the
server was booted you would experience much slower response times than on following requests. You should therefore make at least 2-3 samples when
documenting the performance of a particular action in order to see how the client performs when data has been cached.
All the above allows you to rather than having a discussion on whether or not the client is too slow, you can e.g. have the more exact discussion on
whether 1.4 second is acceptable for opening the Content Editor or not .
2.4.2. Links
� There is a known performance issue in the .NET framework with string manipulation not using System.Text.StringBuilder
(http://support.microsoft.com/kb/307340/en-us).
� Excellent free file, registry, process and other monitors are provided by http://sysinternals.com for Microsoft Windows. Specific recommendations include:
� http://www.sysinternals.com/Utilities/Autoruns.html
� http://www.sysinternals.com/Utilities/Filemon.html
� http://www.sysinternals.com/Utilities/Filemon.html
� http://www.sysinternals.com/Utilities/Handle.html
� http://www.sysinternals.com/Utilities/ProcessExplorer.html
� http://www.sysinternals.com/Utilities/BgInfo.html
� http://msdn.microsoft.com/msdnmag/issues/06/07/WebAppFollies/default.aspx
� Improving .NET Application Performance and Scalability
http://msdn.microsoft.com/library/default.asp?url=/library/en-us/dnpag/html/scalenetchapt06.asp
2.4.3. Modules and Third-Party Components
Check documentation specific to any modules or third-party components integrated into the solution. For instance it may be possible to use Sitecore’s
default thumbnail algorithms or configure image resizing packages to create cacheable output instead of dynamically resizing images. Sitecore is designed
such that third-party caching solutions should not be required.
2.4.4. Perfmon
Configure perfmon to monitor Requests/Sec, Request Execution Time and % Processor Time. Request execution time indicates the length of each request
measured by IIS/ASP.NET.
Perfmon application is started by running the perfmon.exe application from the windows Run console. Please refer to the Perfmon help for instructions
on how to use this application.
Use profiling in the Sitecore debugger to locate peak usage pages.
Sitecore allows to view the execution time for entire pages and individual renderings on your website. This is a useful tool for reducing the execution time
of your website. The profiler is used in the following way:
1. Login to the client.
2. Enter http://<mysite>/?sc_debug=1 in your browser.
3. Navigate to the page you want to profile.
4. Move the mouse pointer right to the vertical scrollbar (a profiling pane should now appear to the right).
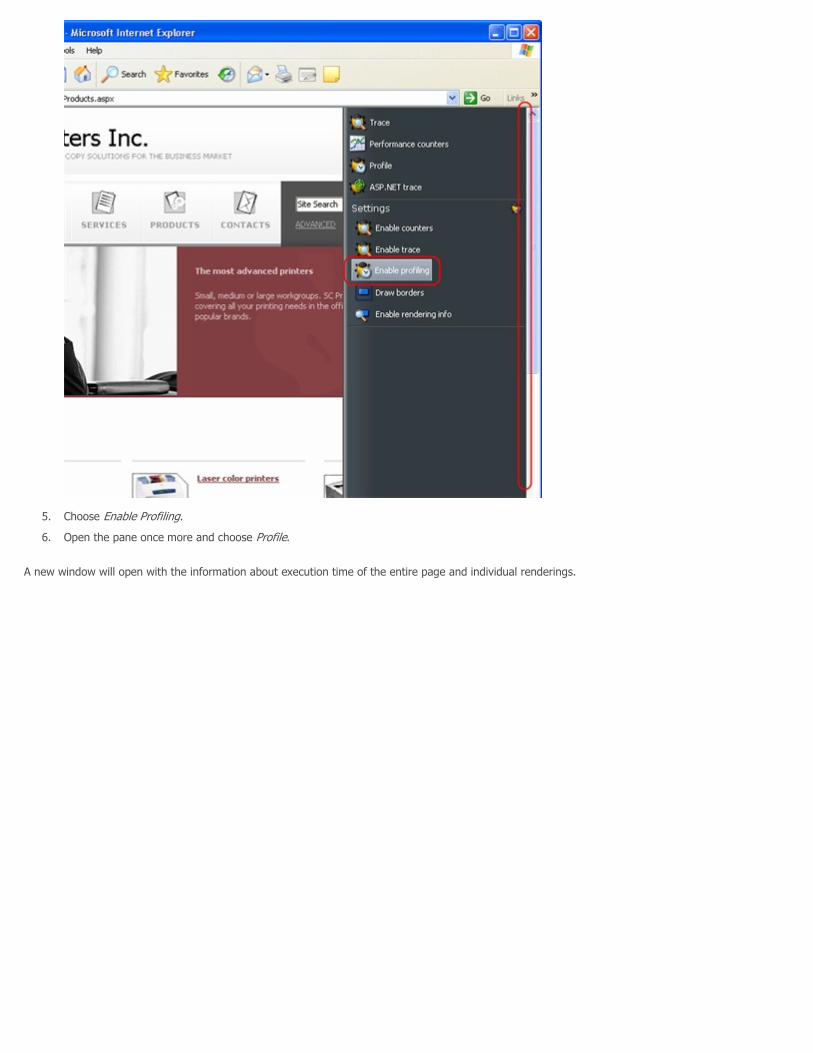
5. Choose Enable Profiling.
6. Open the pane once more and choose Profile.
A new window will open with the information about execution time of the entire page and individual renderings.
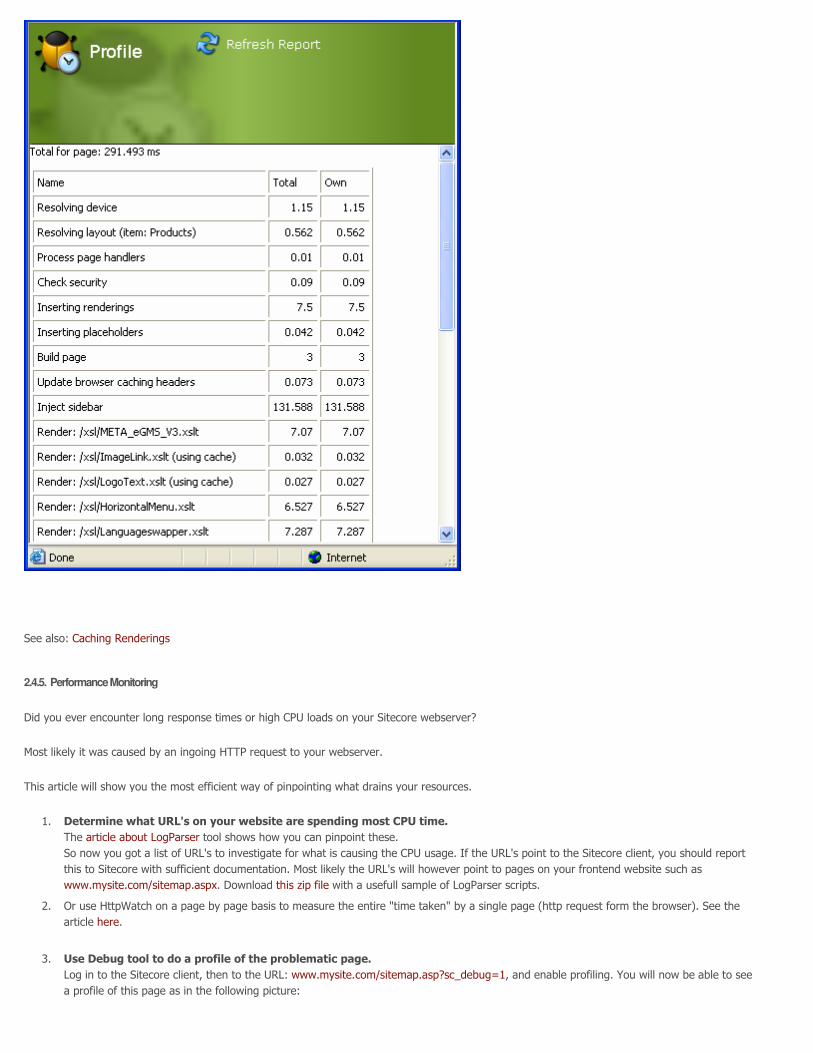
See also: Caching Renderings
2.4.5. Performance Monitoring
Did you ever encounter long response times or high CPU loads on your Sitecore webserver?
Most likely it was caused by an ingoing HTTP request to your webserver.
This article will show you the most efficient way of pinpointing what drains your resources.
1. Determine what URL's on your website are spending most CPU time.
The article about LogParser tool shows how you can pinpoint these.
So now you got a list of URL's to investigate for what is causing the CPU usage. If the URL's point to the Sitecore client, you should report
this to Sitecore with sufficient documentation. Most likely the URL's will however point to pages on your frontend website such as
www.mysite.com/sitemap.aspx. Download this zip file with a usefull sample of LogParser scripts.
2. Or use HttpWatch on a page by page basis to measure the entire "time taken" by a single page (http request form the browser). See the
article here.
3. Use Debug tool to do a profile of the problematic page.
Log in to the Sitecore client, then to the URL: www.mysite.com/sitemap.asp?sc_debug=1, and enable profiling. You will now be able to see
a profile of this page as in the following picture:
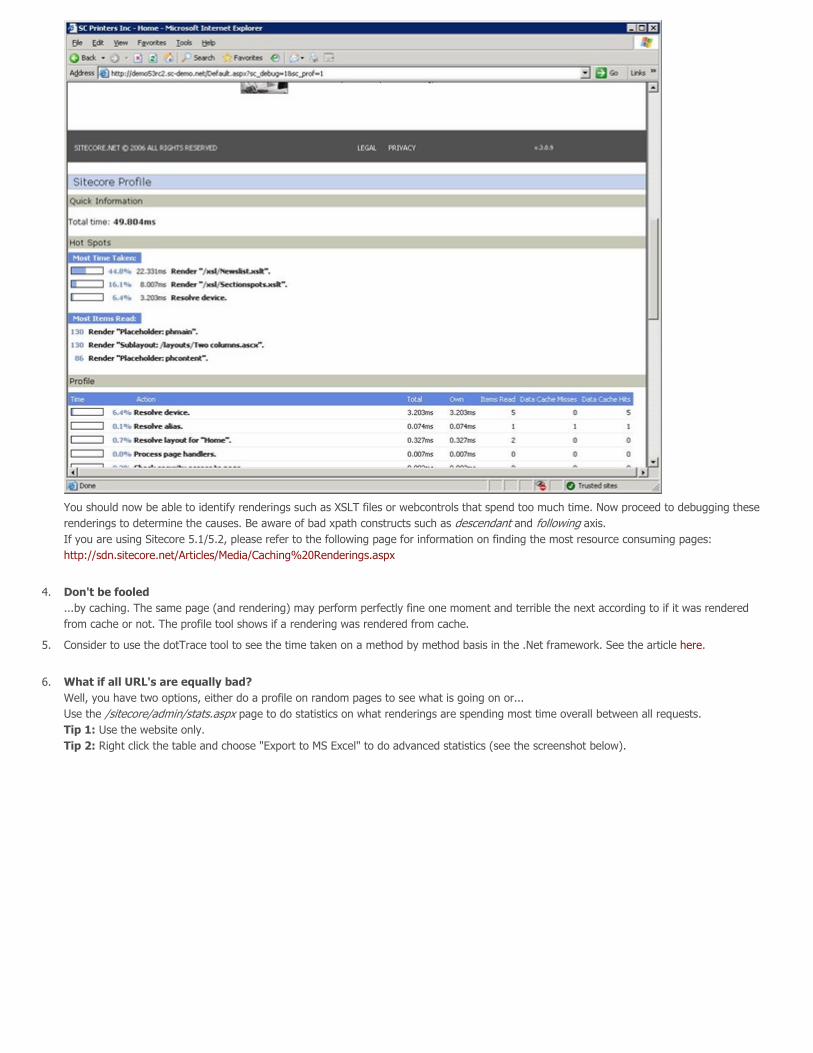
You should now be able to identify renderings such as XSLT files or webcontrols that spend too much time. Now proceed to debugging these
renderings to determine the causes. Be aware of bad xpath constructs such as descendant and following axis.
If you are using Sitecore 5.1/5.2, please refer to the following page for information on finding the most resource consuming pages:
http://sdn.sitecore.net/Articles/Media/Caching%20Renderings.aspx
4. Don't be fooled
...by caching. The same page (and rendering) may perform perfectly fine one moment and terrible the next according to if it was rendered
from cache or not. The profile tool shows if a rendering was rendered from cache.
5. Consider to use the dotTrace tool to see the time taken on a method by method basis in the .Net framework. See the article here.
6. What if all URL's are equally bad?
Well, you have two options, either do a profile on random pages to see what is going on or...
Use the /sitecore/admin/stats.aspx page to do statistics on what renderings are spending most time overall between all requests.
Tip 1: Use the website only.
Tip 2: Right click the table and choose "Export to MS Excel" to do advanced statistics (see the screenshot below).
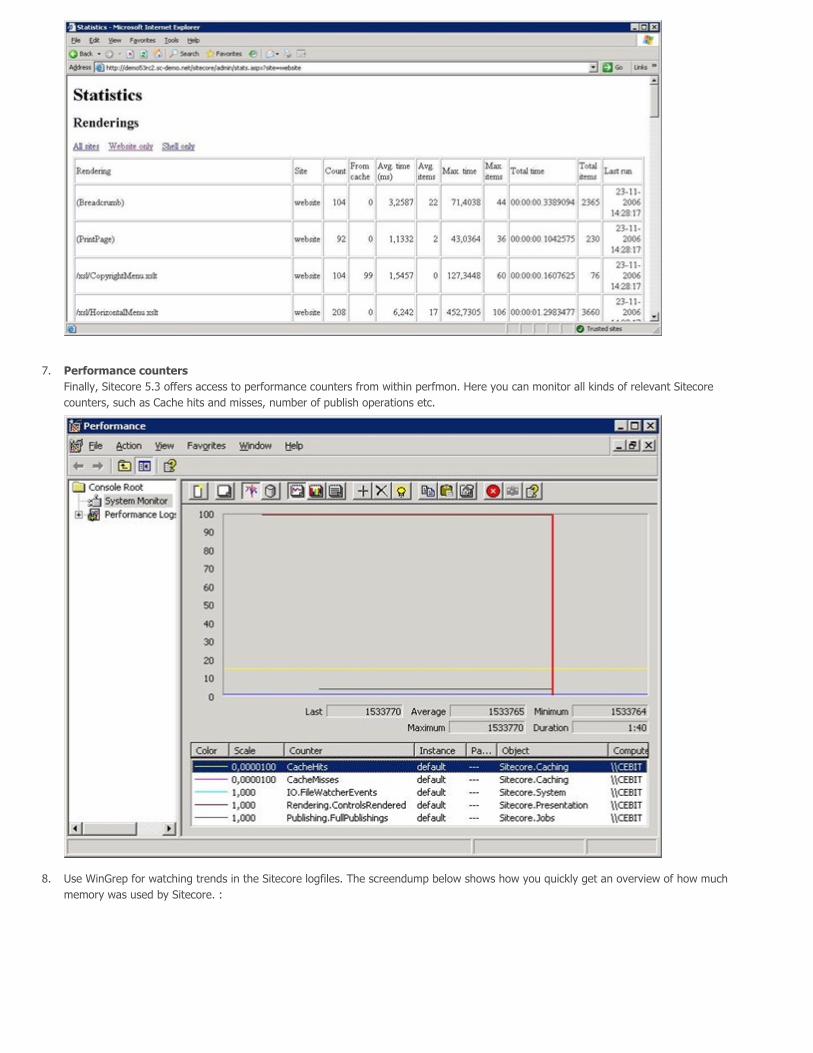
7. Performance counters
Finally, Sitecore 5.3 offers access to performance counters from within perfmon. Here you can monitor all kinds of relevant Sitecore
counters, such as Cache hits and misses, number of publish operations etc.
8. Use WinGrep for watching trends in the Sitecore logfiles. The screendump below shows how you quickly get an overview of how much
memory was used by Sitecore. :
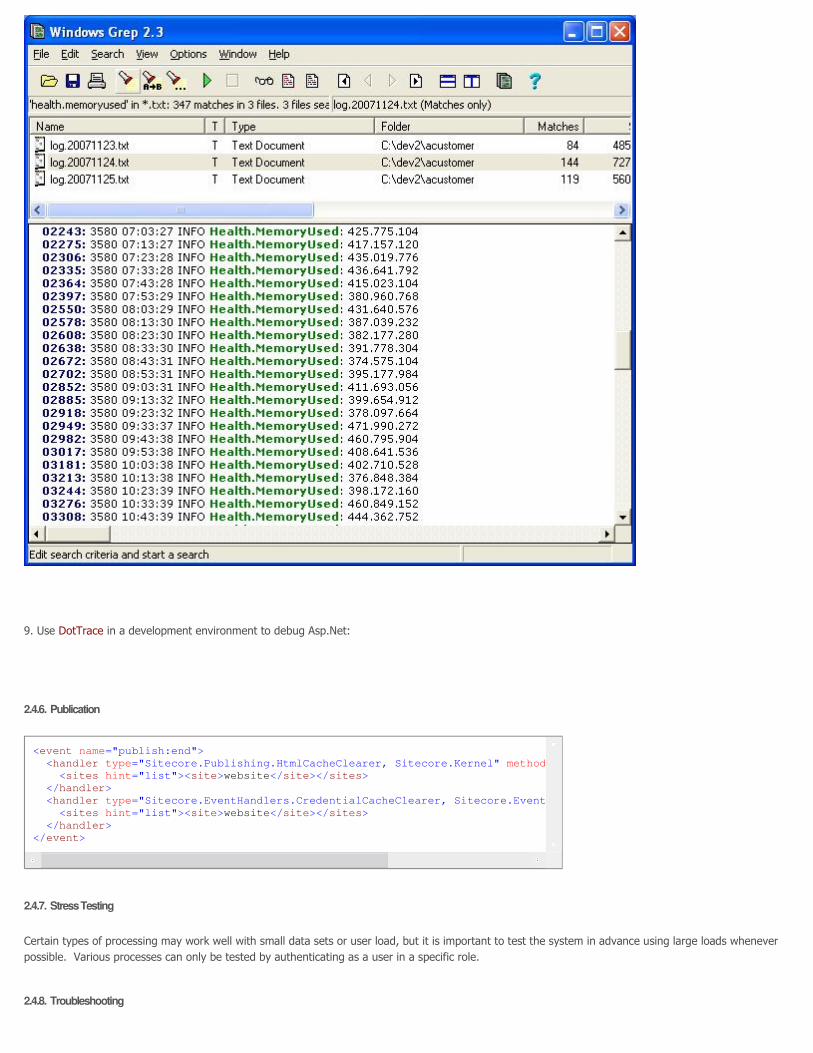
9. Use DotTrace in a development environment to debug Asp.Net:
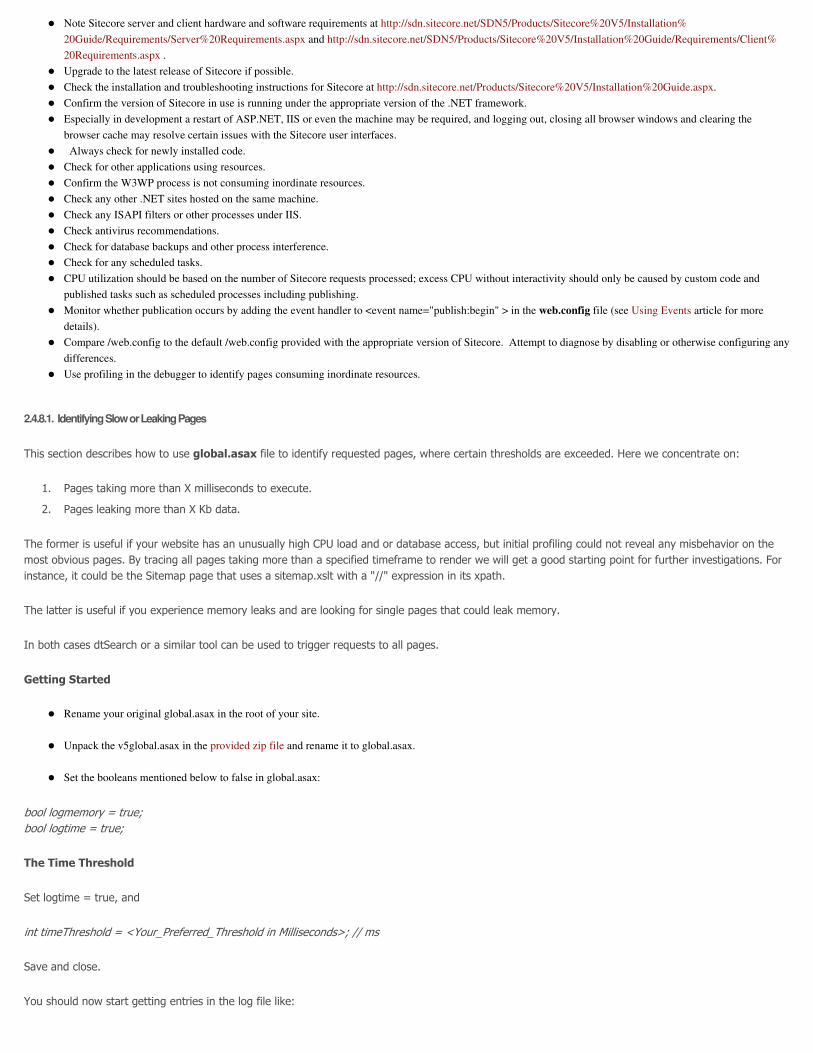
2.4.6. Publication
2.4.7. Stress Testing
Certain types of processing may work well with small data sets or user load, but it is important to test the system in advance using large loads whenever
possible. Various processes can only be tested by authenticating as a user in a specific role.
2.4.8. Troubleshooting
<event name="publish:end">
<handler type="Sitecore.Publishing.HtmlCacheClearer, Sitecore.Kernel" method
<sites hint="list"><site>website</site></sites>
</handler>
<handler type="Sitecore.EventHandlers.CredentialCacheClearer, Sitecore.EventHandlers"
<sites hint="list"><site>website</site></sites>
</handler>
</event>
� Note Sitecore server and client hardware and software requirements at http://sdn.sitecore.net/SDN5/Products/Sitecore%20V5/Installation%
20Guide/Requirements/Server%20Requirements.aspx and http://sdn.sitecore.net/SDN5/Products/Sitecore%20V5/Installation%20Guide/Requirements/Client%
20Requirements.aspx .
� Upgrade to the latest release of Sitecore if possible.
� Check the installation and troubleshooting instructions for Sitecore at http://sdn.sitecore.net/Products/Sitecore%20V5/Installation%20Guide.aspx.
� Confirm the version of Sitecore in use is running under the appropriate version of the .NET framework.
� Especially in development a restart of ASP.NET, IIS or even the machine may be required, and logging out, closing all browser windows and clearing the
browser cache may resolve certain issues with the Sitecore user interfaces.
� Always check for newly installed code.
� Check for other applications using resources.
� Confirm the W3WP process is not consuming inordinate resources.
� Check any other .NET sites hosted on the same machine.
� Check any ISAPI filters or other processes under IIS.
� Check antivirus recommendations.
� Check for database backups and other process interference.
� Check for any scheduled tasks.
� CPU utilization should be based on the number of Sitecore requests processed; excess CPU without interactivity should only be caused by custom code and
published tasks such as scheduled processes including publishing.
� Monitor whether publication occurs by adding the event handler to <event name="publish:begin" > in the web.config file (see Using Events article for more
details).
� Compare /web.config to the default /web.config provided with the appropriate version of Sitecore. Attempt to diagnose by disabling or otherwise configuring any
differences.
� Use profiling in the debugger to identify pages consuming inordinate resources.
2.4.8.1. Identifying Slow or Leaking Pages
This section describes how to use global.asax file to identify requested pages, where certain thresholds are exceeded. Here we concentrate on:
1. Pages taking more than X milliseconds to execute.
2. Pages leaking more than X Kb data.
The former is useful if your website has an unusually high CPU load and or database access, but initial profiling could not reveal any misbehavior on the
most obvious pages. By tracing all pages taking more than a specified timeframe to render we will get a good starting point for further investigations. For
instance, it could be the Sitemap page that uses a sitemap.xslt with a "//" expression in its xpath.
The latter is useful if you experience memory leaks and are looking for single pages that could leak memory.
In both cases dtSearch or a similar tool can be used to trigger requests to all pages.
Getting Started
� Rename your original global.asax in the root of your site.
� Unpack the v5global.asax in the provided zip file and rename it to global.asax.
� Set the booleans mentioned below to false in global.asax:
bool logmemory = true;
bool logtime = true;
The Time Threshold
Set logtime = true, and
int timeThreshold = <Your_Preferred_Threshold in Milliseconds>; // ms
Save and close.
You should now start getting entries in the log file like:

3064 14:47:53 INFO Page exceeded time threshold (ms): 1172,1225 ( Url: /sitecore/content/home/default)
The Memory Threshold
Set logmemory = true, and
int memoryThreshold = <YourPreferredThreshold in Kb>; // ms
Save and close.
You should now start getting entries in the log file like:
3064 14:47:53 INFO Page exceeded memory threshold (Kb): 172 ( Url: /sitecore/content/home/default)
Important note: In this mode, the cache will be flushed on each request in order to ensure that only true (see the note below) memory leaks are logged.
However this will have considerably negative effect on your website performance.
Note : Sitecore uses the ASP.NET cache to store Sitecore items, which will cause an increase in memory consumption. This is however not a true memory
leak as the memory will be released when the item is removed from cache eventually.
You can comment out the lines that flush the cache in order to improve performance but you should now be aware that the information logged will be
more blurred.
If a leaking page is found, repeatedly refreshing this page should now lead to a noticeable increase in memory usage.
Download the source code for this article.
2.4.8.2. Scheduled Publications
The frequency of scheduled publication can be manipulated but note that publishing clears the HTML cache and therefore can interfere with performance.
Review http://sdn.sitecore.net/SDN5/FAQ/Administration/Scheduled%20tasks.aspx and manipulate the Sitecore.Tasks.PublishAgent which is by
default disabled by comments /web.config.
2.4.8.3. Digging gold in IIS logfiles
This section describes how to use the free tool from Microsoft "Log Parser 2.2" with IIS logfiles.
Have you ever experienced that CPU usage skyrockets on your server, or at least somehow experieced long response times from Sitecore. Then you have
likely ended up with a question like this:
I wonder what pages on my site (be it on the website or in the client) are consuming all the resources?
Well, elsewhere here on SDN5 you can read how global.asax can be used to log all files taking longer than x milliseconds. However it doesn't give you the
full picture, and you have to wait until enough sample data have been collected. You don't want to wait, you want answers NOW? Well if the
column "Time taken" is added to your IIS logfiles, you can get these answers. If not, hurry up and add it.
So you open your IIS logfile in Excel and do some sorting, filtering and grouping to show these data, right? Yes, if you have less than 65.000 entries
and enough patience, maybe you do, but it doesn't exactly work like a dream. If you (hopefully) are familiar with SQL, you are likely to wine something
like "Sigh, why can't I just do some SUM's, COUNT's and AVERAGE's in sql instead of this nightmare Excel stuff?". Now there is a solution. Try e.g.:
1. Just Download LogParser 2.2 from http://www.microsoft.com/downloads/details.aspx?FamilyID=890cd06b-abf8-4c25-91b2-
f8d975cf8c07&displaylang=en
2. Install it on your webserver
3. From the logfolder on your website, run the following command: SELECT TOP 10 COUNT(*), AVG(time-taken), SUM(time-taken), cs-uri-stem
INTO report_sum.txt FROM test.log WHERE EXTRACT_EXTENSION(cs-uri-stem)='aspx' GROUP BY cs-uri-stem ORDER BY sum(time-taken)
DESC
4. Now view the top 10 urls that spent the most time being rendered in the outputfile report_sum.txt

It works like a charm - and fast. When opening the report_sum.txt afterwards, hey presto: a list as promised, showing that Default.aspx (frontpage of
website) topped the list with 1100+ seconds totally. Also it tells me that my Maillist.aspx averages at a high 3 seconds per request.
COUNT(ALL *) AVG(ALL time-taken) SUM(ALL time-taken) cs-uri-stem
------------ ------------------- ------------------- ----------------
976 1139 1111939 /Default.aspx
100 2959 295996 /Aktuelt/Postlister.aspx
146 989 144425 /Job.aspx
20 4663 93269 /sitecore/.../Upload/Upload2.aspx
...
I must admit this is nothing less than a Super Cool Tool that will allow you to easily identify problem pages in your installation. The way these SQL
statements can be combined is endless, and it can even be used with Sitecore 5 logfiles.
Another usefull query I would like to show is the following that will give you statistics per hour from your logfile.
"c:\program files\log parser 2.2\logparser" "SELECT date, QUANTIZE(time,3600) as interval, COUNT(*), AVG(time-taken), SUM(time-taken), DIV(TO_REAL
(COUNT(*)), 3600) AS Requests/sec INTO 'report_total_load_per_minute.txt' FROM %LOGFILE% GROUP BY date, interval ORDER BY date, interval" -
o:NAT
As can be seen below, this query will e.g. tell you that there were 111K+ requests between 12a.m. and 1p.m., average time was 144 ms, and there was a
whopping 31 Requests / second during this period. The total time taken is 16097 seconds or app. 4400ms per second. Now there are only 1000 ms on a
real second, but as these data were taken from a 4 processor server you would multiply this to get 4000 expected CPU milliseconds per second.
date interval COUNT(ALL *) AVG(ALL time-taken) SUM(ALL time-taken) Requests/sec
---------- -------- ------------ ------------------- ------------------- ------------
2006-07-03 12:00:00 111391 144 16086950 30.941944
2006-07-03 13:00:00 133281 106 14210042 37.022500
2006-07-03 14:00:00 50872 150 7678055 14.131111
2006-07-03 15:00:00 29795 198 5921612 8.276389
2006-07-03 16:00:00 10403 435 4526177 2.889722
I would like to introduce a key value called "CPU-Utilization" that is to be measured the following way:
100 pct * Avg(time-taken) * (Requests / second) / (#CPU * 1000).
From the above numbers, the CPU-Utilization would now be calculated like this: 144ms * 31 ReqPerSec) / (4 * 1000) = 112%.
What does this number tell you? Well you would not expect to utilize your server above 100%, and a number above this can only mean that requests have
been queued or idle within the server before a response was delivered. I would say that any CPU-utilization exceeding 80% is not sound over longer
periods of time, and in these cases you should seriously consider if the workload can be decreased or the hardware should be added to the installation.
The limit of 80% is taken out of the blue and may well be set too high. At a CPU-U rate of 112%, something is terribly wrong and your users are probably
suffering badly.
Summary:
This super cool tool allows us to easily determine the workload of the server back in time as well as pinpoint urls that are very resource demanding.
Standard .bat files can be created, which produces detailed reports on the basis of one or more logfiles in seconds. If your customer or IT department
insists that their single CPU server is more than enough hardware to do the job, this may just be the evidence needed to convince them otherwise.
Copyright 1999 - 2010 Sitecore A/S. All rights reserved.
Sitecore is a trademark of Sitecore A/S. All other brand and product names are the property of their respective holders. The contents of this
document are the property of Sitecore A/S.