Embed Size (px)
Citation preview
Optimizing Snow Plowing Operations in Urban Road Networks
FINAL RESEARCH REPORT
Joris Kinable, Stephen F. Smith (PI), Willem van Hoeve
Contract No. DTRT12GUTG11

DISCLAIMER The contents of this report reflect the views of the authors, who are responsible for the facts and the accuracy of the information presented herein. This document is disseminated under the sponsorship of the U.S. Department of Transportation’s University Transportation Centers Program, in the interest of information exchange. The U.S. Government assumes no liability for the contents or use thereof.
Optimizing Snow Plowing Operations in Urban Road Networks: 2015 Final Report
Joris Kinable1,2, Stephen F. Smith (PI)1, and Willem van Hoeve2
1 Robotics Institute, Carnegie Mellon University, 5000 Forbes Ave Pittsburgh, PA 15213, USA
2 Tepper School of Business, Carnegie Mellon University, 5000 Forbes Ave Pittsburgh, PA 15213, USA
[email protected], [email protected], [email protected]
1 Introduction
Each year, many northern cities face significant expenditures pertaining winter road maintenance. Snow removal constitutes a significant part of these costs. For example, the city of Pittsburgh (USA) spent a staggering $4.3M on consumable resources (salt, deicing chemicals), $3.3M on personnel, and $800K on equipment (vehicles, plows, maintenance) during last year’s winter season (2014/2015). In addition to these direct costs, a number of indirect costs can also be identified. Slippery roads deteriorate driving conditions thereby increasing the number of traffic accidents. Extensive utilization of snow plows, salt and chemicals damage the roads, corrode cars and metal bridges, and have an overall negative impact on the environment. Consequently, any ability to optimize winter road main- tenance and deicing operations offers significant opportunities to realize sub- stantial savings, to improve mobility and to reduce societal and environmental impact (Salazar-Aguilar et al., 2012; Usman et al., 2010; Environmental Protec- tion Agency, 1999; Rubin et al., 2010). Due to the disruptive effect of snowstorms on cities, both in terms of mobility and safety, the faster the streets can be cleared the better. Yet in most cities (including Pittsburgh), static plans for snowplowing are developed using simple allocation schemes, e.g., streets are divided among vehicles based on geographic area, and each driver determines his/her individual route. These schemes are used because they are easy to implement and they work but the resulting snow plowing operation can be quite inefficient. In extreme cases (e.g., the Pittsburgh storm of February 5-6, 2010 where snow removal took several days to accom- plish), this inefficiency can lead to protracted periods of hardship for urban residents and travelers. The generation of efficient vehicle routes for snow removal is a challenging op- timization problem, requiring consideration of constraints relating to resources (vehicle and crew availability; vehicle speed, range, home location), coverage topology (number of passes per road, one way roads, dead ends, refueling lo- cations), snow-clearing priorities (main arteries before side streets) and refresh rates (depending on storm intensity). Variations of the problem have been for- malized as the Chinese Postman problem and the Capacitated Arc Routing
Problem, and both problems have been shown to be inherently difficult to solve optimally (in other words it is only possible to generate optimal solutions for very small instances of the problem). Nevertheless, it is possible to produce near- optimal solutions with a variety of approximate search procedures (e.g., (Perrier et al., 2008; Salazar-Aguilar et al., 2012)), and these solutions can lead to sub- stantial improvements in snowplowing performance. Centennial, Colorado, for example, recently reduced the time required to clear streets by 28-40% by focus- ing on optimization of routes (Sedlak, 2013). Any ability to produce efficient snowplowing routes, however, is susceptible to execution-time dynamics. Impassible road segments due to blocking vehicles that are stuck or to unaccounted for construction projects will mandate deviations from pre-planned routes, which can result in significant efficiency loss if left to driver response. Events such as snow plow breakdowns or shifts in storm intensity can similarly render pre-planned routes obsolete and require re-optimization. As has been recently suggested in (ITS, 2014), even greater improvements to snow removal operations can be expected if snow plow route optimization is coupled with a real-time ability to re-route vehicles when circumstances warrant. This report summarizes research performed over the past year with funding pro- vided by the Carnegie Mellon TSET University Transportation Center toward development of a system for real-time optimization and management of snow plowing operations. The envisioned system will:
1. generate near-optimal plowing plans (or alternatively will import and
adapt pre-existing plowing plans) to fit current resource constraints and storm characteristics (vehicles, salt inventories, road priorities).
2. dynamically update these plans as execution proceeds and provide early alerting of potential problems.
3. generate routing adjustments for efficiently recovering from detected prob- lems (e.g., an impassable route, a broken down vehicle).
4. provide an intuitive interface for the drivers and route planners to resp. drive and schedule the routes.
During the past year, in collaboration with the City of Pittsburgh Department of Public Works (DPW), our main focus has been on:
– identifying the needs of the city and defining the practical snow plow
routing problem faced by the City of Pittsburgh, – developing procedures for generating near-optimal snow plow routes
that take into account most snow plowing constraints considered relevant by the DPW, and
– developing and field-testing a tablet-based application for in-vehicle instal- lation and communication of turn-by-turn instructions, based on the routes that are generated.
The remainder of this report elaborates on the approaches, methodology, and main findings of this work.
2 Approach
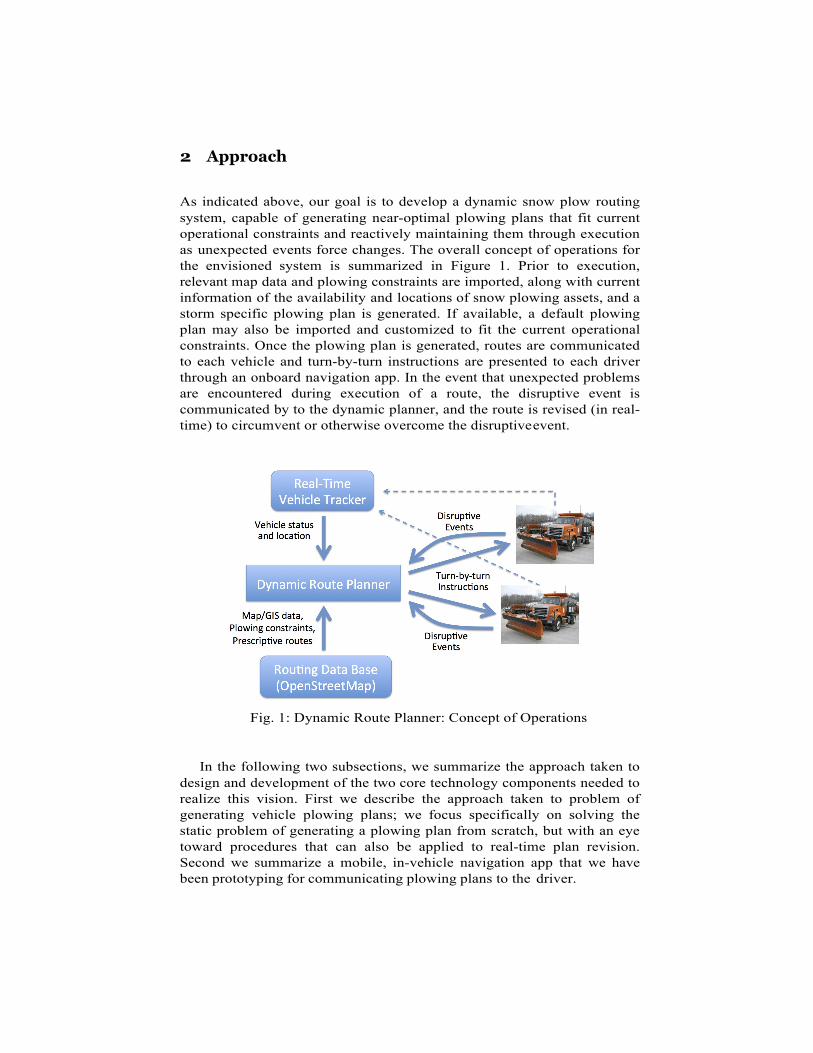
As indicated above, our goal is to develop a dynamic snow plow routing system, capable of generating near-optimal plowing plans that fit current operational constraints and reactively maintaining them through execution as unexpected events force changes. The overall concept of operations for the envisioned system is summarized in Figure 1. Prior to execution, relevant map data and plowing constraints are imported, along with current information of the availability and locations of snow plowing assets, and a storm specific plowing plan is generated. If available, a default plowing plan may also be imported and customized to fit the current operational constraints. Once the plowing plan is generated, routes are communicated to each vehicle and turn-by-turn instructions are presented to each driver through an onboard navigation app. In the event that unexpected problems are encountered during execution of a route, the disruptive event is communicated by to the dynamic planner, and the route is revised (in real-time) to circumvent or otherwise overcome the disruptive event.
Fig. 1: Dynamic Route Planner: Concept of Operations
In the following two subsections, we summarize the approach taken to design and development of the two core technology components needed to realize this vision. First we describe the approach taken to problem of generating vehicle plowing plans; we focus specifically on solving the static problem of generating a plowing plan from scratch, but with an eye toward procedures that can also be applied to real-time plan revision. Second we summarize a mobile, in-vehicle navigation app that we have been prototyping for communicating plowing plans to the driver.
ij
ij
2.1 Static Schedule Generation
For a given network of streets and a fleet of snow plows, the problem consists of finding a route for each vehicle, such that the routes collectively cover the entire network. The objective is to minimize the duration of the longest route, i.e. to minimize the makespan of the schedule. The road network is modeled as a mixed multigraph. Vertices in the graph represent intersections in the road network, the arcs and edges represent resp. directed and undirected road segments. For instance, a road in between two intersections, consisting of 2 lanes in each di- rection, translates to 4 directed arcs in the graph. We will refer to these arcs as unidirectional plow jobs. Unidirectional plow jobs are typically individual lanes of a multi-lane street, or one-way roads. In addition to unidirectional plow jobs, there also exist bidirectional plow jobs. Road segments in the latter category are small enough to be covered by a single pass of a snow plow, and the plow may come from either direction of the street. Typical examples of bidirectional plow jobs are streets in residential neighborhoods where cars are parked on each side of the road. The roads are serviced by a heterogeneous fleet of snow plows. When a vehicle services a road segment, it simultaneously clears the snow using a plow, and spreads salt. Servicing a road segment (i, j) takes dij time, sk
salt
and fk fuel, where the latter two values depend on the type of vehicle k being used. Vehicles may also traverse road segments without servicing them. This is called deadheading. Unlike servicing a road, deadheading does not require salt, but it obviously does require both time and fuel. Due to the relatively low speed limits within the city, deadheading and servicing a road take equal amounts of time, independent of the road conditions. Each vehicle occasionally needs to re-
k k fuel and resupply salt. A vehicle k has a fuel capacity F and salt capacity S . There are several depots throughout the city; some of these depots provide fuel, some provide salt, and some provide both. The fuel (salt) consumption per street segment (i, j) for a given vehicle type is known. In addition to the fuel and salt depots, we define 0 and n + 1 as the origin and destination depots where the vehicles are parked resp. before and after the trip. Each action, i.e. plowing, deadheading, refueling, resupplying salt, can be inter- preted as a job. Each job has a well-defined:
– type, e.g. plowing, deadheading, refueling, resupplying salt. – duration – fuel requirement – salt requirement – starting location – ending location
A vehicle schedule consists of an ordered sequence of these jobs. A schedule is said to be resource feasible if, at any point in time, the vehicle’s fuel level, resp. salt supply is within resp. [0, F
k], [0, S
k]. Performing a refuel or
resupply salt job replenishes the vehicle’s resources, whereas any of the other jobs consume these resources. A Snow Plow Schedule is considered feasible if, (a) all plow jobs
are covered by some vehicle, and (b) all vehicle schedules are resource feasible. To compute Snow Plow Schedules for a given area, we developed and compared four different algorithmic approaches:
1. Mixed Integer Programming Model 2.Constraint Programming Model 3. Greedy Constructive Heuristic, which generates resource feasible schedules
for vehicles in very little time 4. Late Acceptance Improvement Heuristic, which improves the quality of
sched- ules generated for each vehicle
For technical details about these approaches, we refer the reader to Kinable et al. (2016) (attached to this report).
2.2 Turn-by-turn Navigation App To support communication of planned routes to snow plow drivers, a team of software engineering students were enlisted to design and prototype an in-vehicle navigation application. Following consultation with DPW, an Android tablet was adopted as a target platform for initial development (although DPW has more recently expressed a preference for an IOS device). Using a human-centered design approach, a prototype app was designed and developed to provide the following capabilities:
– Route overview and tracking display - Once logged into the prototype app, a user can view an uploaded snow plowing plan on a map. As the plan is executed, GPS information is used to track progress and update the route overview display. To realize this, the prototype exploits a third party map- ping and navigation app called Scobbler.
– Routing to fuel and salt depots - In addition to viewing the route, the user can also request routes to the nearest fuel and salt depots, in case these resources are running low. Note, however, that routing plans are generated with knowledge of fuel and salt burning rates, and include these side trips as necessary in a way that optimizes the overall plowing objective (e.g., plowing time/distance).
– Turn-by-turn instructions - The core capability provided by the app is gen- eration of turn-by-turn instructions. This is also accomplished by combining local GPS information with Scobbler mapping and navigation capabilities. One reason for selecting the Scobbler MAP API is the flexibility that it pro- vides to separate route generation (which is to be done by our server rather than the navigation app itself) from presentation of turn-by-turn instruc- tions.
– Reporting of unexpected events -Finally, the prototype app provides the capa- bility to communicate unexpected events (from a fixed set of possible events) back to the planning server to trigger rerouting.
For further details on the motivation, design considerations, capabilities provided and underlying architecture of the mobile application, we refer the reader to Nunes et al. (2015) (also attached to this report).
inst jobs bidir dist inst jobs bidir dist inst jobs bidir dist kaminst 45 38 3.4 inst5 631 74 55.2 inst13 529 59 47.3 downtown 724 38 38.1 inst6 632 68 52.9 inst14 498 64 37.2 mntWash. 577 81 52.1 inst7 796 58 50.9 inst15 531 63 36.9 Residential 4073 64 315.5 inst8 500 31 42.8 inst16 498 92 47.5 inst1 233 61 27 inst9 481 38 38.4 inst17 499 75 42.6 inst2 346 93 38.6 inst10 574 64 41.5 inst18 1324 24 80.5 inst3 451 53 32.1 inst11 547 54 42.2 inst4 287 87 22.9 inst12 339 91 30.7
Table 1: Instance data: number of jobs, percentage of jobs that are bidirectional, total distance to plow (mi).
3 Methodology
3.1 Static Schedule Generation
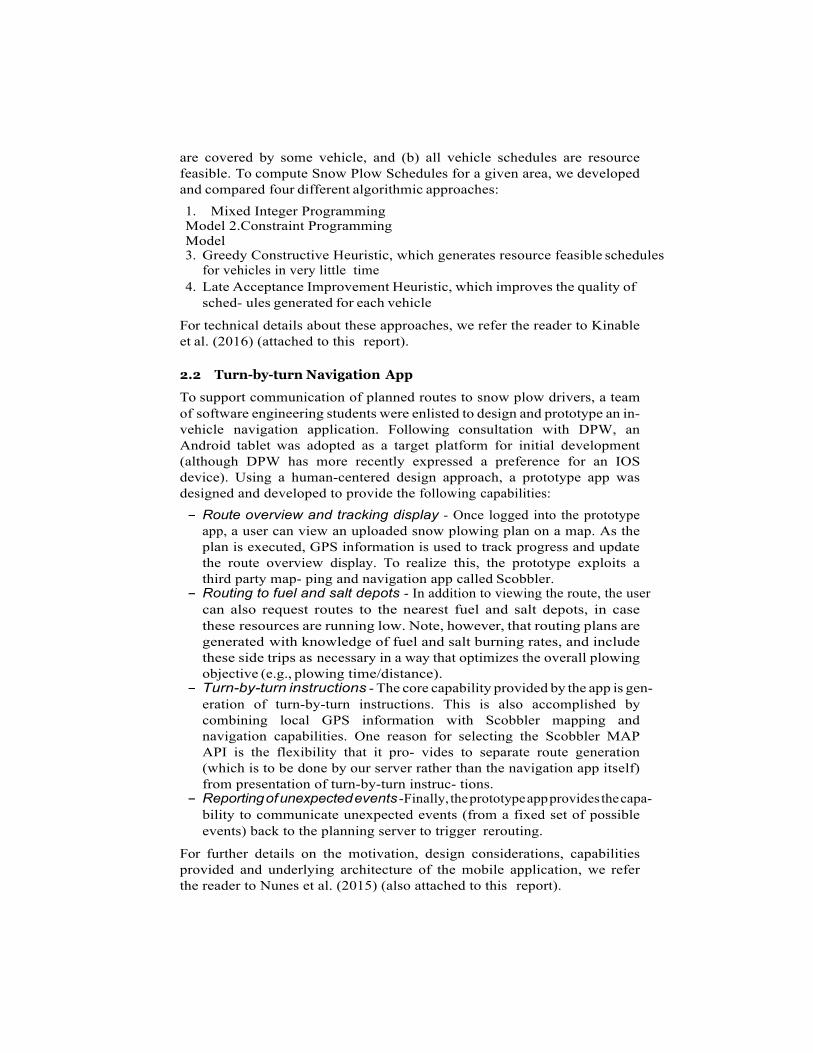
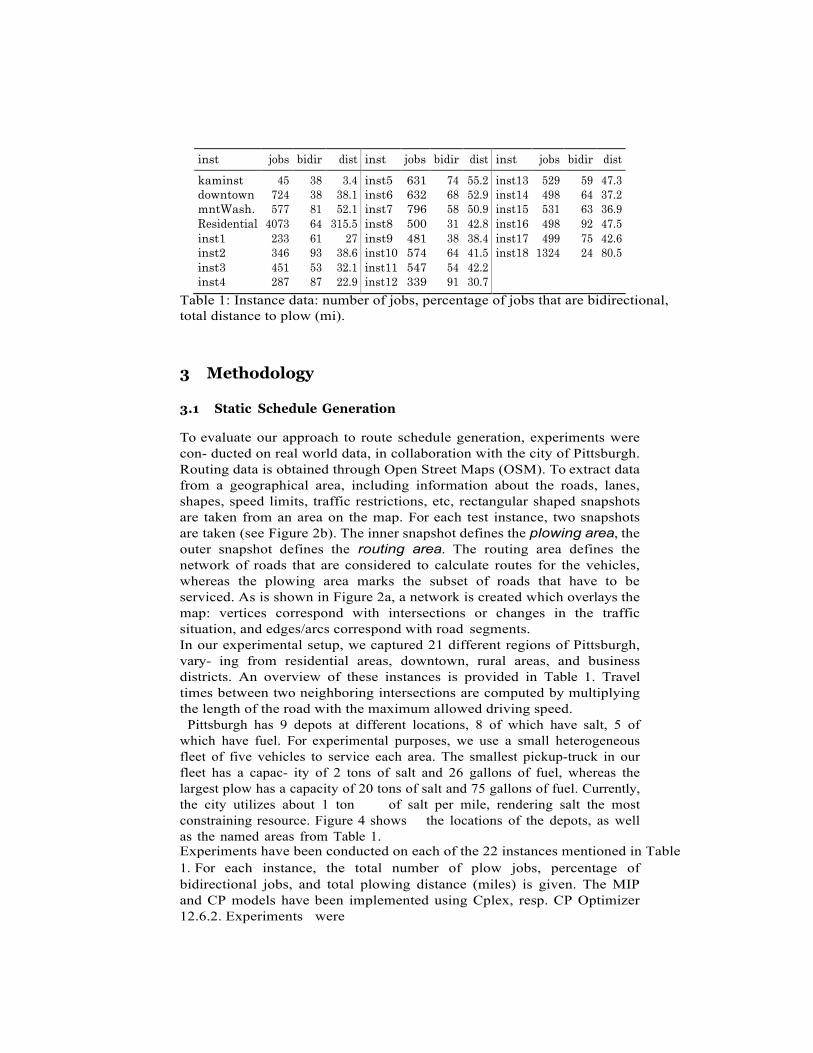
To evaluate our approach to route schedule generation, experiments were con- ducted on real world data, in collaboration with the city of Pittsburgh. Routing data is obtained through Open Street Maps (OSM). To extract data from a geographical area, including information about the roads, lanes, shapes, speed limits, traffic restrictions, etc, rectangular shaped snapshots are taken from an area on the map. For each test instance, two snapshots are taken (see Figure 2b). The inner snapshot defines the plowing area, the outer snapshot defines the routing area. The routing area defines the network of roads that are considered to calculate routes for the vehicles, whereas the plowing area marks the subset of roads that have to be serviced. As is shown in Figure 2a, a network is created which overlays the map: vertices correspond with intersections or changes in the traffic situation, and edges/arcs correspond with road segments. In our experimental setup, we captured 21 different regions of Pittsburgh, vary- ing from residential areas, downtown, rural areas, and business districts. An overview of these instances is provided in Table 1. Travel times between two neighboring intersections are computed by multiplying the length of the road with the maximum allowed driving speed.
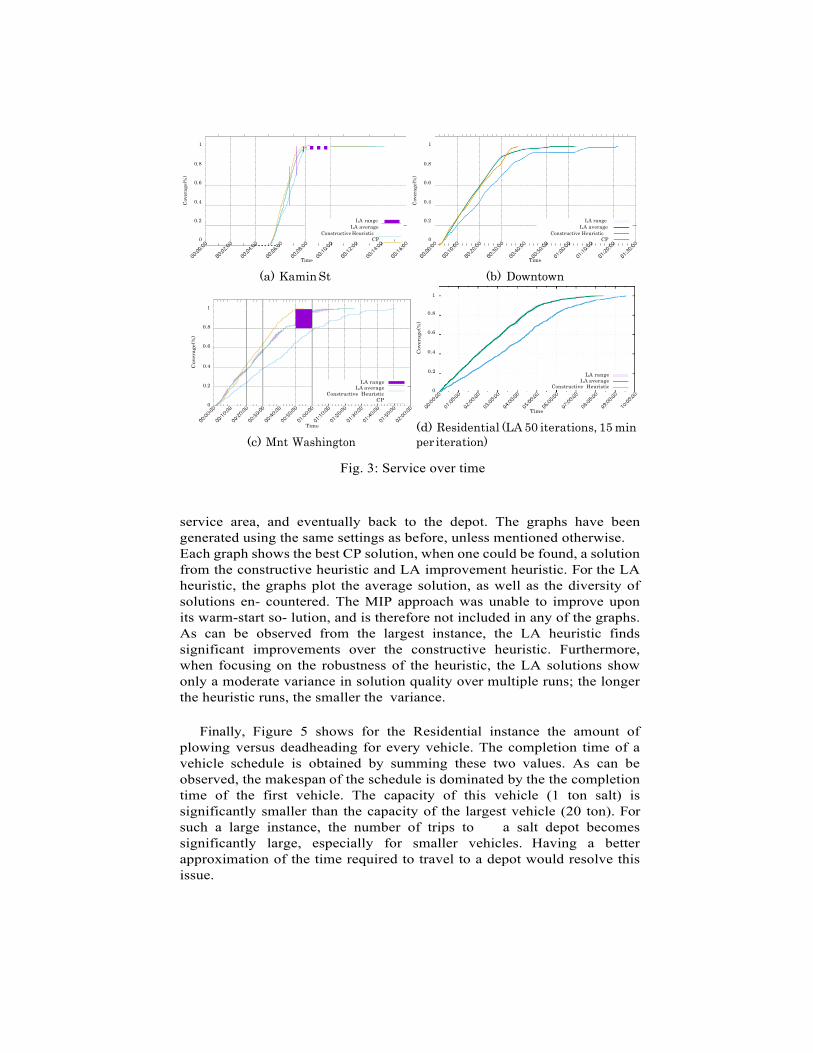
Pittsburgh has 9 depots at different locations, 8 of which have salt, 5 of which have fuel. For experimental purposes, we use a small heterogeneous fleet of five vehicles to service each area. The smallest pickup-truck in our fleet has a capac- ity of 2 tons of salt and 26 gallons of fuel, whereas the largest plow has a capacity of 20 tons of salt and 75 gallons of fuel. Currently, the city utilizes about 1 ton of salt per mile, rendering salt the most constraining resource. Figure 4 shows the locations of the depots, as well as the named areas from Table 1. Experiments have been conducted on each of the 22 instances mentioned in Table 1. For each instance, the total number of plow jobs, percentage of bidirectional jobs, and total plowing distance (miles) is given. The MIP and CP models have been implemented using Cplex, resp. CP Optimizer 12.6.2. Experiments were
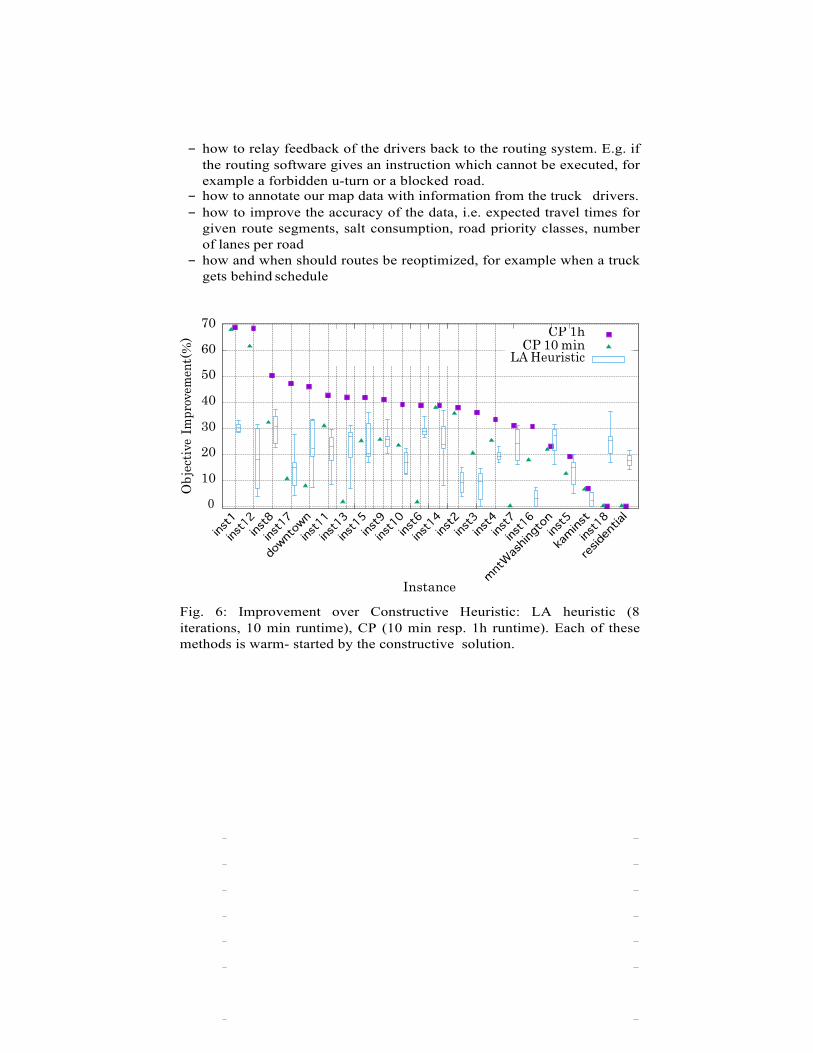
run using default parameters and extended inference on the CP sequence vari- ables. Figure 6 compares the performance of CP and the LA Heuristic. Since each of these methods is warm-started with the solution obtained from the Constructive heuristic, we only show how much either of these approaches could improve the constructive solution. Runtimes for the CP approach were capped at resp. 10 minutes and 1 hour. Similarly, the runtime of the LA Heuristic was capped at 10 minutes, or 10000 non-improving iterations, whichever came first. To measure the impact of the randomization in the LA Heuristic, 8 runs of the heuristic have been performed for each instance. The results of these runs are visualized by boxplots in Figure 6.
(b) Routing and plowing snapshots
Fig. 2: Solution details
3.2 Turn-by-turn Navigation App
To evaluate and refine the developed prototype in-vehicle navigation device, our methodology involves two steps. The first step, which we have been engaged in thus far, has been to conduct trial runs in the field to evaluate its ability to effectively support execution of an input plowing plan. For these tests, the app is loaded up with a vehicle plowing plan generated by our static schedule generator and then the route is driven according to the instructions provided by the app. Any problems encountered are then corrected and a new trial is understaken.
Once we have validated the performance of the turn-by-turn instruction ca- pability, the second evaluation step will be to engage one or more snow plow
(a) Network overlay
drivers in these trials, to get their feedback on usability aspects and identify ad- ditional requirements. We anticipate a similar iterative cycle during this second step, as the prototype app is hardened into an operational tool.
4 Findings
4.1 Static Schedule Generation
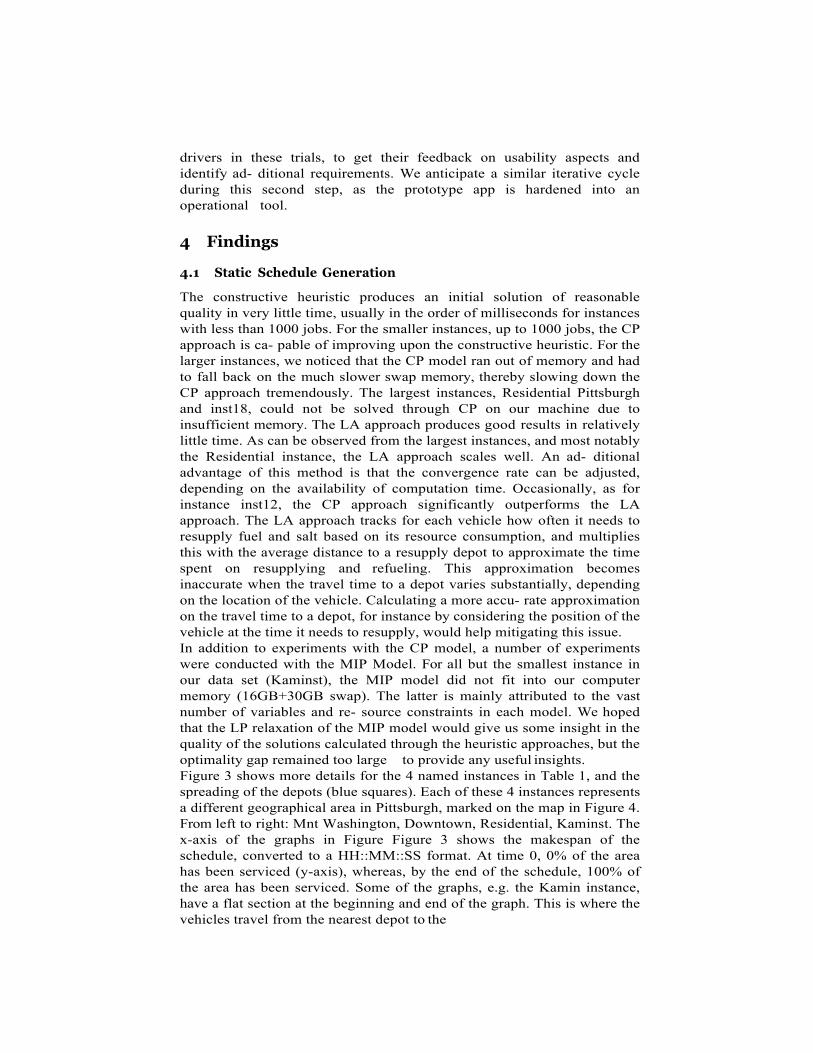
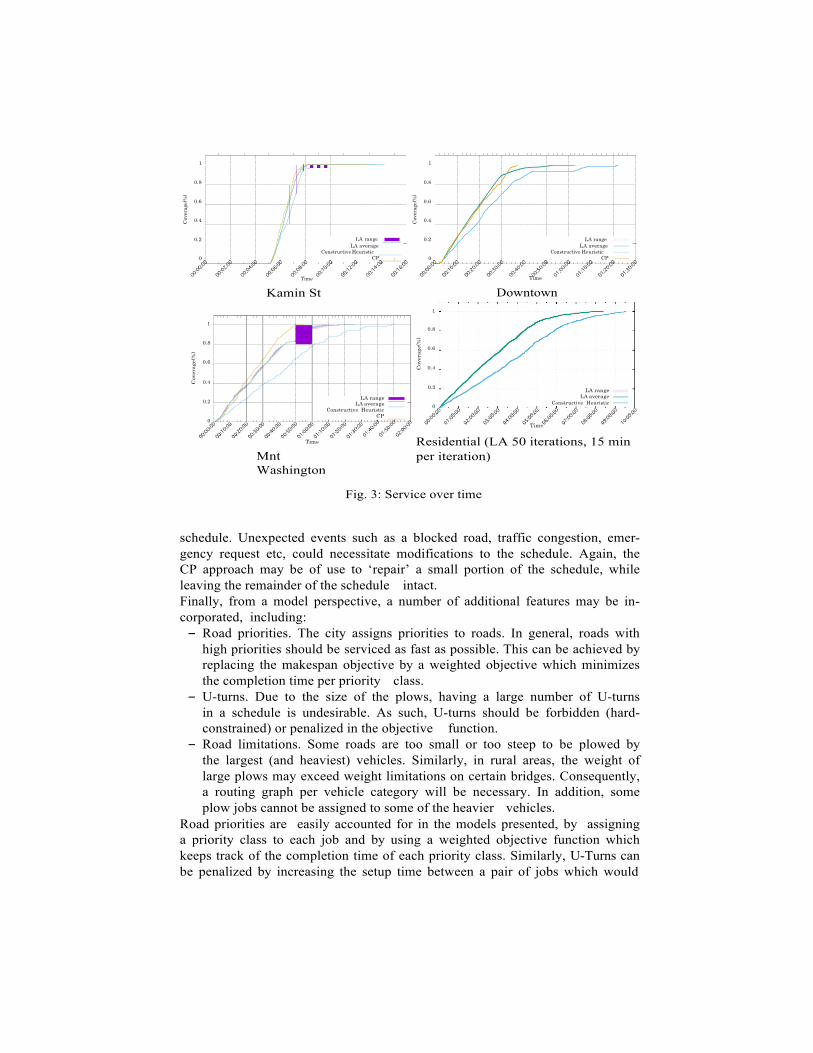
The constructive heuristic produces an initial solution of reasonable quality in very little time, usually in the order of milliseconds for instances with less than 1000 jobs. For the smaller instances, up to 1000 jobs, the CP approach is ca- pable of improving upon the constructive heuristic. For the larger instances, we noticed that the CP model ran out of memory and had to fall back on the much slower swap memory, thereby slowing down the CP approach tremendously. The largest instances, Residential Pittsburgh and inst18, could not be solved through CP on our machine due to insufficient memory. The LA approach produces good results in relatively little time. As can be observed from the largest instances, and most notably the Residential instance, the LA approach scales well. An ad- ditional advantage of this method is that the convergence rate can be adjusted, depending on the availability of computation time. Occasionally, as for instance inst12, the CP approach significantly outperforms the LA approach. The LA approach tracks for each vehicle how often it needs to resupply fuel and salt based on its resource consumption, and multiplies this with the average distance to a resupply depot to approximate the time spent on resupplying and refueling. This approximation becomes inaccurate when the travel time to a depot varies substantially, depending on the location of the vehicle. Calculating a more accu- rate approximation on the travel time to a depot, for instance by considering the position of the vehicle at the time it needs to resupply, would help mitigating this issue. In addition to experiments with the CP model, a number of experiments were conducted with the MIP Model. For all but the smallest instance in our data set (Kaminst), the MIP model did not fit into our computer memory (16GB+30GB swap). The latter is mainly attributed to the vast number of variables and re- source constraints in each model. We hoped that the LP relaxation of the MIP model would give us some insight in the quality of the solutions calculated through the heuristic approaches, but the optimality gap remained too large to provide any useful insights. Figure 3 shows more details for the 4 named instances in Table 1, and the spreading of the depots (blue squares). Each of these 4 instances represents a different geographical area in Pittsburgh, marked on the map in Figure 4. From left to right: Mnt Washington, Downtown, Residential, Kaminst. The x-axis of the graphs in Figure Figure 3 shows the makespan of the schedule, converted to a HH::MM::SS format. At time 0, 0% of the area has been serviced (y-axis), whereas, by the end of the schedule, 100% of the area has been serviced. Some of the graphs, e.g. the Kamin instance, have a flat section at the beginning and end of the graph. This is where the vehicles travel from the nearest depot to the
Cov
erag
e(%
)
1 1
0.8 0.8
0.6 0.6
0.4 0.4
0.2 0.2
0 0
Time
(a) Kamin St
Time
(b) Downtown
1
1 0.8
0.8
0.6
0.6 0.4
0.4
0.2
0.2
0
0
Time
(c) Mnt Washington
Time
(d) Residential (LA 50 iterations, 15 min per iteration)
Fig. 3: Service over time
service area, and eventually back to the depot. The graphs have been generated using the same settings as before, unless mentioned otherwise. Each graph shows the best CP solution, when one could be found, a solution from the constructive heuristic and LA improvement heuristic. For the LA heuristic, the graphs plot the average solution, as well as the diversity of solutions en- countered. The MIP approach was unable to improve upon its warm-start so- lution, and is therefore not included in any of the graphs. As can be observed from the largest instance, the LA heuristic finds significant improvements over the constructive heuristic. Furthermore, when focusing on the robustness of the heuristic, the LA solutions show only a moderate variance in solution quality over multiple runs; the longer the heuristic runs, the smaller the variance.
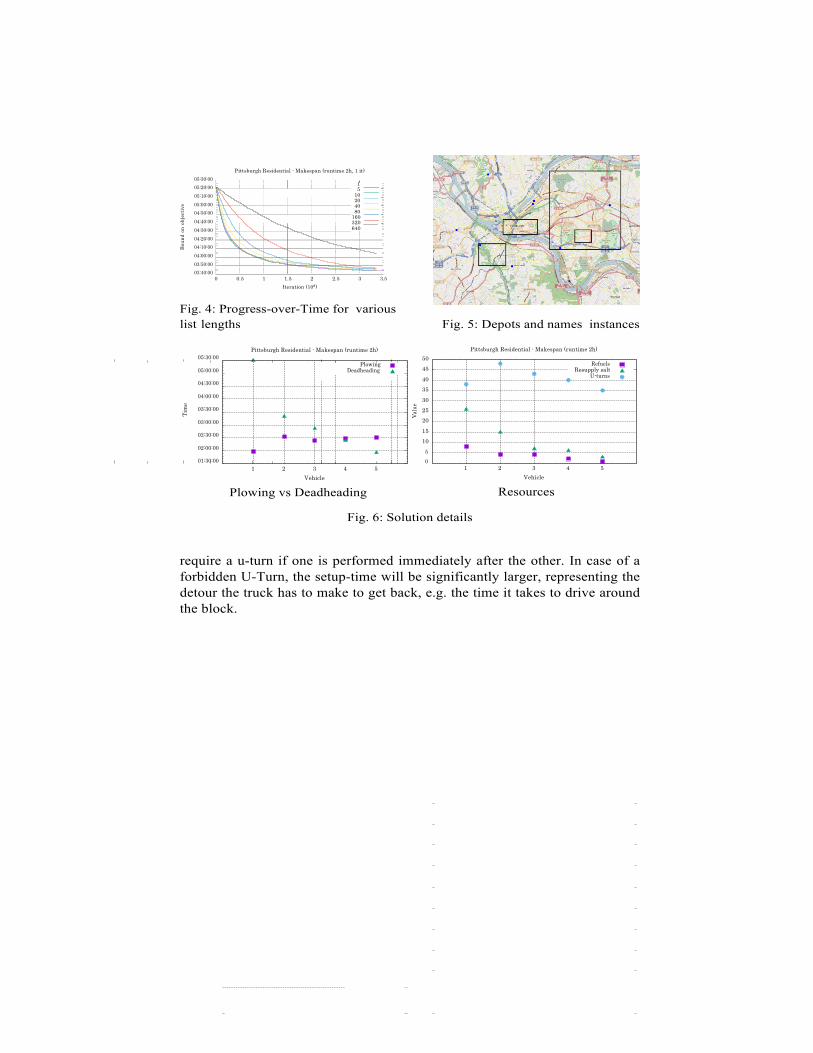
Finally, Figure 5 shows for the Residential instance the amount of
plowing versus deadheading for every vehicle. The completion time of a vehicle schedule is obtained by summing these two values. As can be observed, the makespan of the schedule is dominated by the the completion time of the first vehicle. The capacity of this vehicle (1 ton salt) is significantly smaller than the capacity of the largest vehicle (20 ton). For such a large instance, the number of trips to a salt depot becomes significantly large, especially for smaller vehicles. Having a better approximation of the time required to travel to a depot would resolve this issue.
LA range LA average
Constructive Heuristic
Cov
erag
e(%
) C
over
age(
%)
Cov
erag
e(%
)
LA range
LA average Constructive Heuristic
CP
LA range
LA average Constructive Heuristic
CP
LA range
LA average Constructive Heuristic
CP
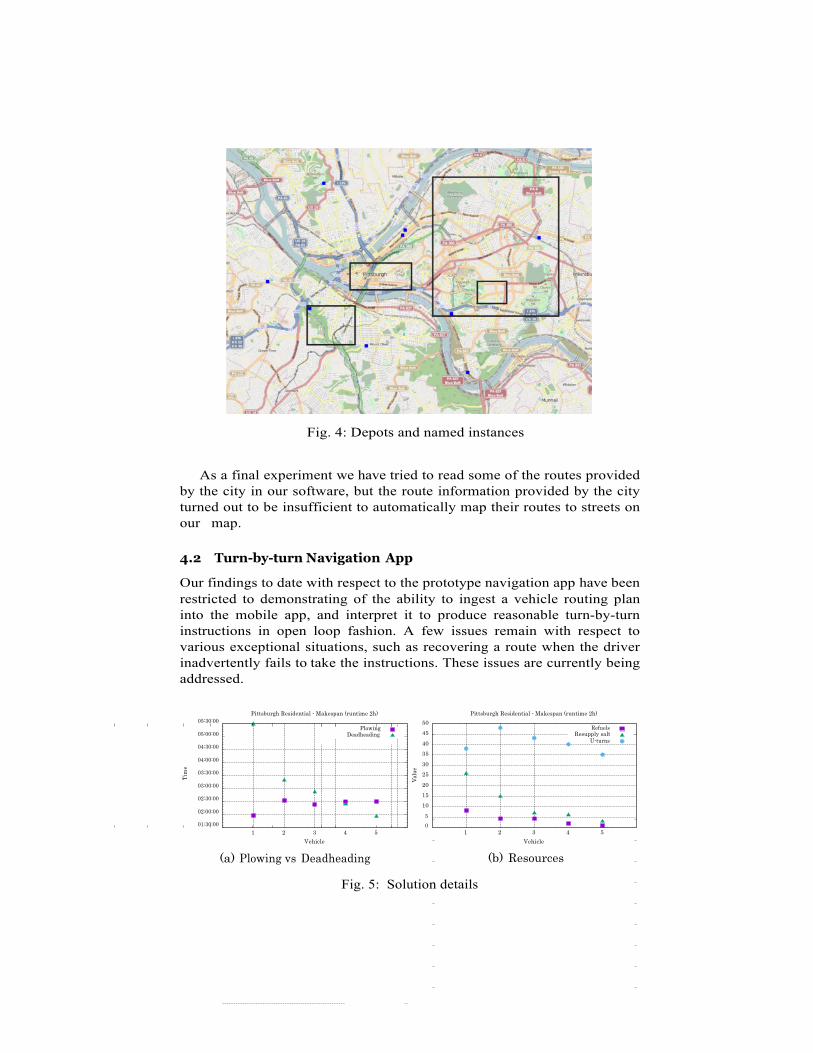
Fig. 4: Depots and named instances
As a final experiment we have tried to read some of the routes provided by the city in our software, but the route information provided by the city turned out to be insufficient to automatically map their routes to streets on our map.
4.2 Turn-by-turn Navigation App
Our findings to date with respect to the prototype navigation app have been restricted to demonstrating of the ability to ingest a vehicle routing plan into the mobile app, and interpret it to produce reasonable turn-by-turn instructions in open loop fashion. A few issues remain with respect to various exceptional situations, such as recovering a route when the driver inadvertently fails to take the instructions. These issues are currently being addressed.
05:30:00
05:00:00
04:30:00
04:00:00
03:30:00
03:00:00
02:30:00
02:00:00
01:30:00
Pittsburgh Residential - Makespan (runtime 2h)
1 2 3 4 5 Vehicle
(a) Plowing vs Deadheading
Pittsburgh Residential - Makespan (runtime 2h)
50 45 40 35 30 25 20 15 10
5 0
1 2 3 4 5 Vehicle
(b) Resources
Fig. 5: Solution details
Plowing Deadheading
Refuels Resupply salt
U-turns
Tim
e
Valu
e
5 Conclusion and Recommendations
The present work mainly focuses on the offline generation of static routes, as well as the visualization of roads to the drivers through turn-by-turn instruc- tions. When it comes to static route generation, the constructive heuristic is capable of finding initial solutions of reasonable quality fast. The CP approach finds good solutions to instances up to a 1000 jobs, but does not scale well be- yond that. The LA heuristic scales considerably better. A logical direction for further research would be to combine the LA heuristic and the CP approach in a Large Neighborhood Search. First, the LA heuristic is used to find a good global solution, after which the CP approach can be used to locally optimize small area’s of the map in an iterative procedure. Unexpected events such as a blocked road, traffic congestion, emergency request etc, could necessitate modifications to the schedule. These adaptive modifica- tions to the routes will be subject to research in the second part of this project. The CP approach we currently have in place may however be modified to deal with these adaptive situations. For example, if some part of the schedule can- not be executed due to some interruptive event, the CP approach may be used to ‘repair’ a small portion of the schedule, while leaving the remainder of the schedule intact.
In our future work, we will improve the quality of the routes,
experiment with different objective functions, and continue with the second part of the project which deals with adaptive route management. More precisely, a number of additional features will be incorporated in our model:
– Road priorities. The city assigns priorities to roads. In general, roads
with high priorities should be serviced as fast as possible. This can be achieved by replacing the makespan objective by a weighted objective which minimizes the completion time per priority class.
– U-turns. Due to the size of the plows, having a large number of U-turns in a schedule is undesirable. As such, U-turns should be forbidden (hard- constrained) or penalized in the objective function.
– Road limitations. Some roads are too small or too steep to be plowed by the largest (and heaviest) vehicles. Similarly, in rural areas, the weight of large plows may exceed weight limitations on certain bridges. Consequently, a routing graph per vehicle category will be necessary. In addition, some plow jobs cannot be assigned to some of the heavier vehicles. Incorporating these road limitations may however be hard, since our current map data does not contain any information about the width of the road, or maximum weight restrictions.
Next to the aforementioned extensions, we foresee a number of technical chal- lenges such as:
– how to keep the map data up-to-date.
– how to relay feedback of the drivers back to the routing system. E.g. if the routing software gives an instruction which cannot be executed, for example a forbidden u-turn or a blocked road.
– how to annotate our map data with information from the truck drivers. – how to improve the accuracy of the data, i.e. expected travel times for
given route segments, salt consumption, road priority classes, number of lanes per road
– how and when should routes be reoptimized, for example when a truck gets behind schedule
70
60
50
40
30
20
10
0
Instance
Fig. 6: Improvement over Constructive Heuristic: LA heuristic (8 iterations, 10 min runtime), CP (10 min resp. 1h runtime). Each of these methods is warm- started by the constructive solution.
CP 1h CP 10 min
LA Heuristic
Obj
ectiv
e Im
prov
emen
t(%
)
Bibliography
Environmental Protection Agency, “Storm water manage- ment fact sheet, minimizing effects from highway deic- ing.” Tech. Rep. EPA 832-F-99-016, 1999. [Online]. Available: http://water.epa.gov/scitech/wastetech/upload/2002 06 28 mtb ice.pdf
ITS, “Solving the snow plough conundrum,” ITS International, vol. 20, no. 4, pp. 37–38, 2014.
J. Kinable, W.-J. ”van Hoeve”, and S. F. Smith, “Optimization models for a real- world snow plow routing problem,” Proceedings of CPAIOR, LNCS, 2016.
B. Nunes, J. Urbano, T. Gordon, and T. Chen, “Snow plow router,” Tech. Rep. Final Report, ISR Project Course, 2015.
N. Perrier, A. Langevin, and C.-A. Amaya, “Vehicle routing for urban snow plowing operations,” Transportation Science, vol. 42, no. 1, pp. 44–56, 2008.
J. Rubin, P. E. Garder, C. E. Morris, K. L. Nichols, J. M. Peck- enham, P. McKee, A. Stern, and T. O. Johnson, “Maine winter roads: Salt, safety, environment and cost,” Margaret Chase Smith Policy Center, University of Maine, Tech. Rep., 2010. [Online]. Avail- able: http://umaine.edu/mcspolicycenter/files/2010/02/Winter-Road-Maint- Final.pdf
M. A. Salazar-Aguilar, A. Langevin, and G. Laporte, “Synchronized arc rout- ing for snow plowing operations.” Computers & Operations Research, vol. 39, no. 7, pp. 1432–1440, 2012.
M. Sedlak, “Plot a better plowing plan,” Public Works Magazine, 2013. [Online]. Available: http://www.pwmag.com/mobile-technology/plot- a-better-plowing-plan.aspx
T. Usman, L. Fu, and L. F. Miranda-Moreno, “Quantifying safety benefit of winter road maintenance: Accident frequency modeling,” Accident Analysis & Prevention, vol. 42, no. 6, pp. 1878 – 1887, 2010.

Appendix 1: Optimization Models for a Real-World Snow Plow Routing Problem. In Proceedings of CPAIOR, LNCS, Springer, To Appear, 2016
Optimization Models for a Real-World Snow Plow Routing Problem
J. Kinable1,2, W-J. van Hoeve2, and S. F. Smith1
1 Robotics Institute, Carnegie Mellon University, 5000 Forbes Ave Pittsburgh,
PA 15213, USA 2 Tepper School of Business, Carnegie Mellon University, 5000 Forbes Ave
Pittsburgh, PA 15213, USA [email protected], [email protected], [email protected]
Abstract. In cold weather cities, snowstorms can have a significant disruptive effect on both mobility and safety, and consequently the faster that streets can be cleared the better. Yet in most cities, plans for snowplowing are developed using simple allocation schemes that while easy to implement can also be quite inefficient. In this paper we consider the problem of optimizing the routes of a fleet of snow plowing vehicles, subject to street network topology, vehicle operating restrictions, and resource (salt, fuel) usage and replenishment constraints. We develop and analyze the performance of three different optimization models: a mixed-integer programming (MIP) model, a constraint programming (CP) model, and a constructive heuristic procedure that is amplified by an iterative improvement search. The models are evaluated on a set of snow plow routing problems of various sizes, constructed using Open Streets map data of Pittsburgh PA. Experimental results are presented that illustrate the differential strengths and weaknesses of each model, and suggest an alternative hybrid solution approach.
1 Introduction
Each year, many northern cities face significant expenditures pertaining winter road maintenance. Snow removal constitutes a significant part of these costs. For example, the city of Pittsburgh (USA) spent a staggering $4.3M on consumable resources (salt, deicing chemicals), $3.3M on personnel, and $800K on equipment (vehicles, plows, maintenance) during last year’s winter season (2014/2015). In addition to these direct costs, a number of indirect costs can also be identified. Slippery roads deteriorate driving conditions thereby increasing the number of traffic accidents. Extensive utilization of snow plows, salt and chemicals damage the roads, corrode cars and metal bridges, and have an overall negative impact on the environment. Consequently, any ability to optimize winter road main- tenance and deicing operations offers significant opportunities to realize sub- stantial savings, to improve mobility and to reduce societal and environmental impact (Salazar-Aguilar et al., 2012; Usman et al., 2010; Environmental Protec- tion Agency, 1999; Rubin et al., 2010). In this work we study the real-world snow plow routing problem (SPRP) faced
by the City of Pittsburgh PA where routes must be computed for a set of het- erogeneous vehicles such that they collectively cover a geographical area, and comply with various resource constraints. Here, as in any snow plowing activity, each vehicle removes snow from the streets and simultaneously spreads a mixture of salt and chemicals for deicing purposes. Since each vehicle has only limited fuel and salt capacity, resources have to be periodically replenished. A number of resource depots are available throughout the city: these depots offer fuel, salt or both. The objective is to compute a schedule for each vehicle, which satifies resource constraints and minimizes the overall time it takes to clear all streets (i.e., the schedule makespan). This work is part of a larger initiative to provide the city with an adaptive approach to snow plow route optimization and management. A route planning system is under development which will ultimately issue optimized turn-by-turn instructions to the vehicles in real-time during snow plowing operations, and dy- namically revise these plans as unexpected events force changes. This paper lays the foundations for this project, by formally defining the problem and analyzing both exact (CP and MIP) and heuristic approaches for solving it. The heuristics presented are designed with scalability and adaptivity in mind, such that they can be adapted at a later stage of the project to modify schedules in response to dynamic events such as blocked roads, equipment problems and emergency requests. The problem under consideration generalizes the well-known Chinese Postman Problem (Mei-Ko, 1962) and relates to other problems such as the Capacitated Arc Routing Problem (Eiselt et al., 1995a,b) and Resource Constrained Project Scheduling.Although an extensive amount of research has been devoted to road maintenance and snow control, only a limited number of works has studied snow plow routing with resource constraints. For an excellent literature overview per- taining winter road maintenance problems in general, and related solution ap- proaches, we refer to the survey series Perrier et al. (2006a,b, 2007a,b). Salazar-Aguilar et al. (2012) study a related routing problem where routes are computed in such a way that street segments with two or more lanes in the same direction are plowed simultaneously by different synchronized vehicles. This so- called ‘tandem plowing’ pushes snow from one lane to the next and eventually to the side of the road, thereby avoiding snow mounts building up between lanes. The problem in (Salazar-Aguilar et al., 2012) is first defined through a MIP model. In addition, an efficient Adaptive Neighborhood Search approach is proposed. Although synchronized plowing has certain benefits, it is not being ap- plied in Pittsburgh due to the added level of planning complexity that it implies. (Salazar-Aguilar et al., 2012) primarily focuses on the plowing aspects; manage- ment of resources such as salt and fuel is not considered. The performance of their algorithms are evaluated on real-world data, including an instance from the city of Dieppe, New Brunswick, Canada. With a population of roughly 24,000 inhabitants, 462 intersections and 1,234 road segments, the city of Dieppe is less than one fifth the size of downtown Pittsburgh. Consequently, it is not obvious whether their approach can be scaled and adapted to our problem setting.
Perrier et al. (2008) addresses another snow plow routing problem in urban areas. Each area is partitioned into a number of districts. Routes have to be determined for vehicles, parked at the district’s depot, such that all road segments are ser- viced and all operational constraints are satisfied. Routes crossing these bound- aries must be avoided from an administrative point of view. A similar situation arises currently in Pittsburgh where plows do not currently cross district bound- aries. Although these artificial boundaries simplify the problem, they may also have an negative impact on the solution quality so these boundaries are not con- sidered in this work. In addition to traditional routing constraints, Perrier et al. (2008) considers road priorities, precedence relations between roads belonging to different priority classes, tandem plowing and limitations on the plows which can be used to service certain roads. The authors propose a multicommodity network flow structure to impose the connectivity of the route performed by each vehicle. Two heuristic approaches are presented: the first constructs routes in parallel by solving a multiple vehicle rural postman problem with side con- straints, the second is a cluster-first route-second approach. Gupta et al. (2011) devised an iteration method to solve a snow plow routing problem on a network topography with a single depot. Per iteration, a trip, starting and ending at the depot and servicing a number of street segments is calculated. Every new iteration iteration, the street segments serviced in the previous iteration are removed from the network and a trip covering a (sub- set of) the remaining edges is calculated. The procedure repeats until all street segments have been serviced. The length of a single trip is limited by a max- imum duration. Moreover, the total amount of salt required by the edges in a trip cannot exceed the truck’s salt capacity. Although this problem bares strong similarities to our problem, the solution approach is not applicable because in our problem vehicles have to manage both salt and fuel resources, and not every depot offers both resources. The remainder of this paper is structured as follows. First, Section 2 formally defines the problem and introduces notation. Next, Sections 3 and 4 present a number of exact and heuristic models including a MIP model (Section 3.1), a CP model (Section 3.2), a constructive heuristic (Section 4.1) and a Late Ac- ceptance improvement heuristic (Section 4.2). Finally, Section 5 compares the performance of these methods on real-world data, and draws some conclusions.
2 Problem Description
For a given network of streets and a fleet of snow plows, our SPRP consists of finding a route for each vehicle, such that the routes collectively cover the entire network. The objective is to minimize the duration of the longest route, i.e. to minimize the makespan of the schedule. The road network is modeled as a mixed multigraph. Vertices in the graph represent intersections in the road network, the arcs and edges represent resp. directed and undirected road segments. For instance, a road in between two intersections, consisting of 2 lanes in each di- rection, translates to 4 directed arcs in the graph. We will refer to these arcs as
fk
sk
ij ij
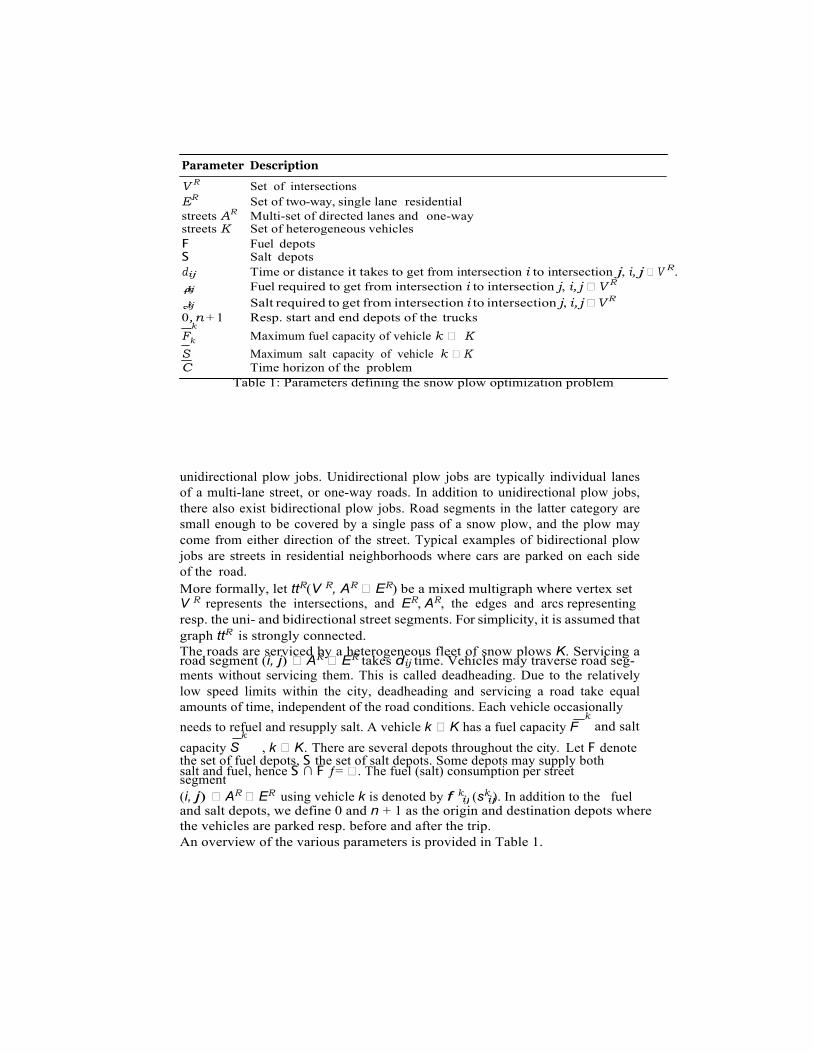
Parameter Description
V R Set of intersections ER Set of two-way, single lane residential streets AR Multi-set of directed lanes and one-way streets K Set of heterogeneous vehicles F Fuel depots S Salt depots dij Time or distance it takes to get from intersection i to intersection j, i, j � V R. ij Fuel required to get from intersection i to intersection j, i, j � V R
ij Salt required to get from intersection i to intersection j, i, j � V R
0, n + 1 Resp. start and end depots of the trucks k
F Maximum fuel capacity of vehicle k � K k
S Maximum salt capacity of vehicle k � K C Time horizon of the problem
Table 1: Parameters defining the snow plow optimization problem
unidirectional plow jobs. Unidirectional plow jobs are typically individual lanes of a multi-lane street, or one-way roads. In addition to unidirectional plow jobs, there also exist bidirectional plow jobs. Road segments in the latter category are small enough to be covered by a single pass of a snow plow, and the plow may come from either direction of the street. Typical examples of bidirectional plow jobs are streets in residential neighborhoods where cars are parked on each side of the road. More formally, let ttR(V R, AR � ER) be a mixed multigraph where vertex set V R represents the intersections, and ER, AR, the edges and arcs representing resp. the uni- and bidirectional street segments. For simplicity, it is assumed that graph ttR is strongly connected. The roads are serviced by a heterogeneous fleet of snow plows K. Servicing a road segment (i, j) � AR � ER takes dij time. Vehicles may traverse road seg- ments without servicing them. This is called deadheading. Due to the relatively low speed limits within the city, deadheading and servicing a road take equal amounts of time, independent of the road conditions. Each vehicle occasionally
k needs to refuel and resupply salt. A vehicle k � K has a fuel capacity F
k and salt
capacity S , k � K. There are several depots throughout the city. Let F denote the set of fuel depots, S the set of salt depots. Some depots may supply both salt and fuel, hence S ∩ F ƒ= �. The fuel (salt) consumption per street segment (i, j) � AR � ER using vehicle k is denoted by f k (sk ). In addition to the fuel and salt depots, we define 0 and n + 1 as the origin and destination depots where the vehicles are parked resp. before and after the trip. An overview of the various parameters is provided in Table 1.
i
ij
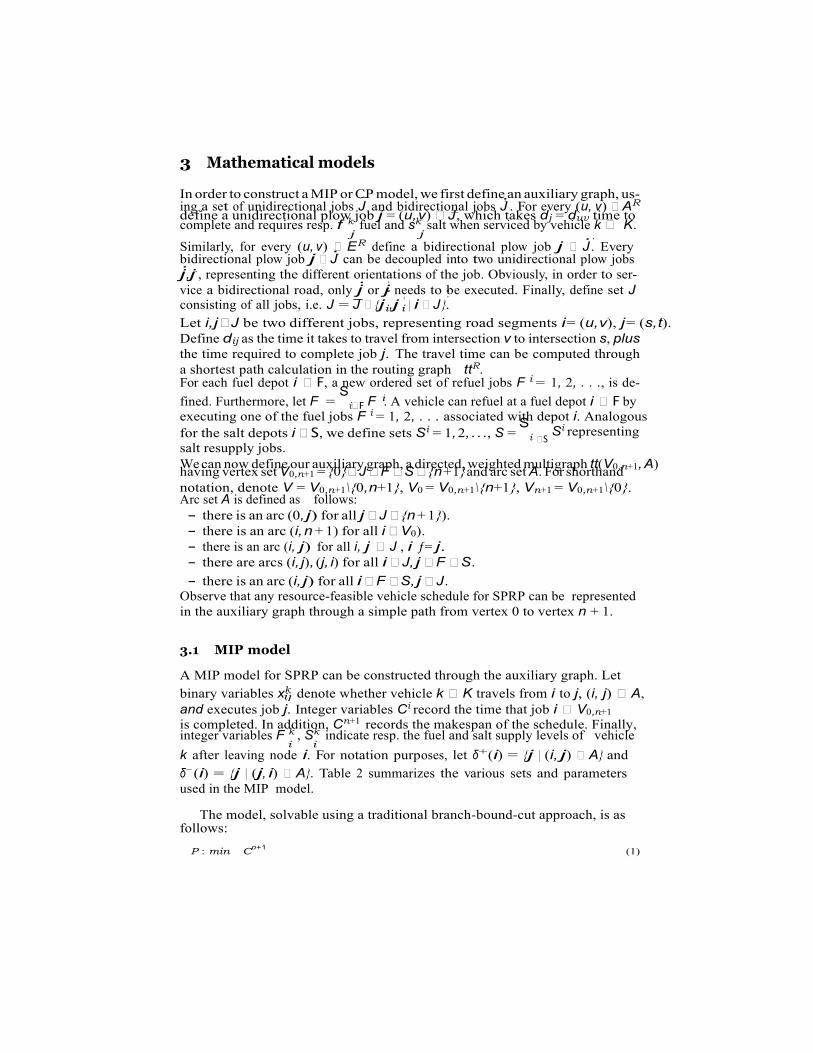
3 Mathematical models
In order to construct a MIP or CP model, we first define an auxiliary graph, us- ing a set of unidirectional jobs J and bidirectional jobs J . For every (u, v) � AR
define a unidirectional plow job j = (u, v) � J , which takes dj = duv time to complete and requires resp. f k fuel and sk salt when serviced by vehicle k � K.
j j
Similarly, for every (u, v) � ER define a bidirectional plow job j � J . Every bidirectional plow job j � J can be decoupled into two unidirectional plow jobs j,j , representing the different orientations of the job. Obviously, in order to ser- vice a bidirectional road, only j or j needs to be executed. Finally, define set J ˙ ˙ consisting of all jobs, i.e. J = J � {ji,j i | i � J }. Let i, j � J be two different jobs, representing road segments i = (u, v), j = (s, t). Define dij as the time it takes to travel from intersection v to intersection s, plus the time required to complete job j. The travel time can be computed through a shortest path calculation in the routing graph ttR. For each fuel depot i � F, a new ordered set of refuel jobs F i = 1, 2, . . ., is de- fined. Furthermore, let F =
Si�F F . A vehicle can refuel at a fuel depot i � F by
executing one of the fuel jobs F i = 1, 2, . . . associated with depot i. Analogous for the salt depots i � S, we define sets Si = 1, 2, . . ., S =
Si
salt resupply jobs. Si representing
We can now define our auxiliary graph, a directed, weighted multigraph tt(V0,n+1, A) having vertex set V0,n+1 = {0} �J �F �S �{n + 1} and arc set A. For shorthand notation, denote V = V0,n+1\{0, n+1}, V0 = V0,n+1\{n+1}, Vn+1 = V0,n+1\{0}. Arc set A is defined as follows:
– there is an arc (0, j) for all j � J � {n + 1}). – there is an arc (i, n + 1) for all i � V0). – there is an arc (i, j) for all i, j � J , i ƒ= j. – there are arcs (i, j), (j, i) for all i � J, j � F � S. – there is an arc (i, j) for all i � F � S, j � J .
Observe that any resource-feasible vehicle schedule for SPRP can be represented in the auxiliary graph through a simple path from vertex 0 to vertex n + 1.
3.1 MIP model
A MIP model for SPRP can be constructed through the auxiliary graph. Let binary variables xk denote whether vehicle k � K travels from i to j, (i, j) � A, and executes job j. Integer variables Ci record the time that job i � V0,n+1 is completed. In addition, Cn+1 records the makespan of the schedule. Finally, integer variables F k , Sk indicate resp. the fuel and salt supply levels of vehicle
i i k after leaving node i. For notation purposes, let δ+(i) = {j | (i, j) � A} and δ−(i) = {j | (j, i) � A}. Table 2 summarizes the various sets and parameters used in the MIP model.
The model, solvable using a traditional branch-bound-cut approach, is as
follows:
P : min Cn+1 (1)
�S
dk
fk
sk
x
xk ij
xk
xk
xk
i
i
i
0j
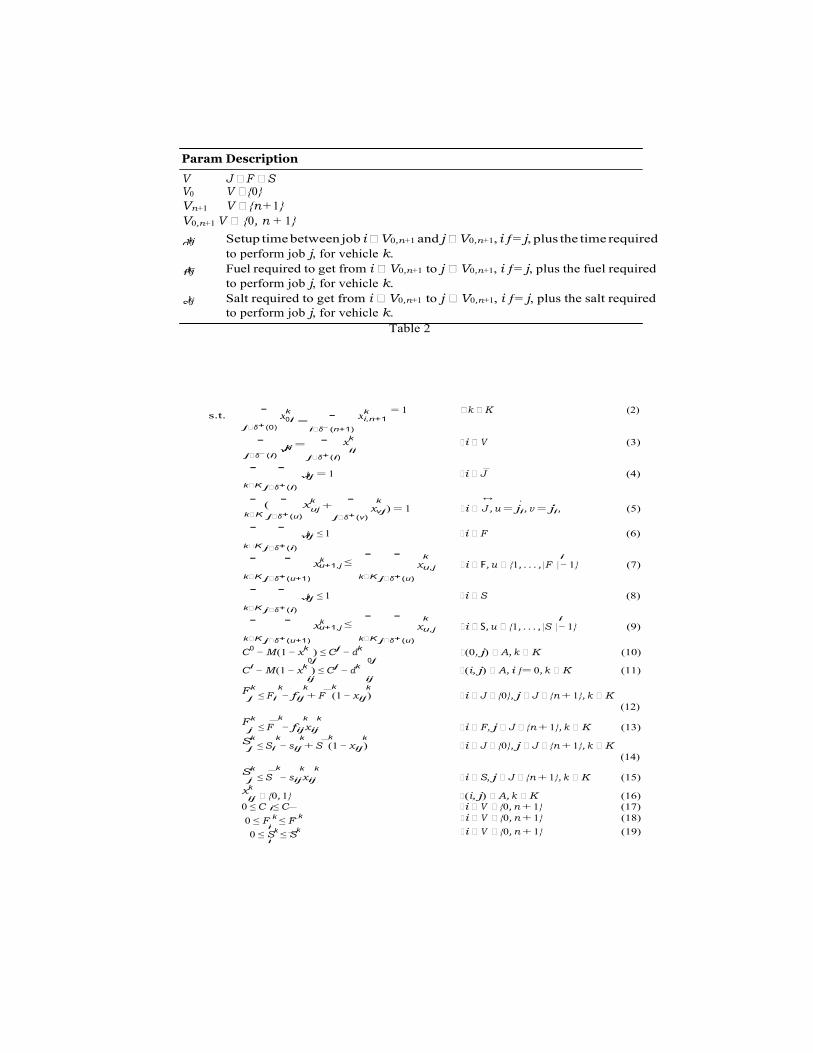
Param Description V J � F � S V0 V � {0} Vn+1 V � {n + 1} V0,n+1 V � {0, n + 1} ij Setup time between job i � V0,n+1 and j � V0,n+1, i ƒ= j, plus the time required
to perform job j, for vehicle k. ij Fuel required to get from i � V0,n+1 to j � V0,n+1, i ƒ= j, plus the fuel required
to perform job j, for vehicle k. ij Salt required to get from i � V0,n+1 to j � V0,n+1, i ƒ= j, plus the salt required
to perform job j, for vehicle k. Table 2
s.t. . k
j�δ+(0) = .
i�δ−(n+1)
k i,n+1
= 1 �k � K (2)
.
j�δ−(i) ji =
. j�δ+(i)
xk �i � V (3)
. . ij = 1 �i � J (4)
k�K j�δ+(i) .
( .
xk . k ↔
k�K j�δ+(u) uj +
j�δ+(v) xvj ) = 1 �i � J , u = ji, v = ji, (5)
. . ij ≤ 1 �i � F (6)
k�K j�δ+(i) . .
xk . . k i u+1,j ≤
k�K j�δ+(u+1)
xu,j �i � F, u � {1, . . . , |F | − 1} (7) k�K j�δ+(u)
. . ij ≤ 1 �i � S (8)
k�K j�δ+(i) . .
xk . . k i u+1,j ≤
k�K j�δ+(u+1)
xu,j �i � S, u � {1, . . . , |S | − 1} (9) k�K j�δ+(u)
C0 − M (1 − xk ) ≤ Cj − dk �(0, j) � A, k � K (10)
0j 0j
Ci − M (1 − xk ) ≤ Cj − dk �(i, j) � A, i ƒ= 0, k � K (11)
ij ij
F k k k k k
j ≤ Fi − fij + F (1 − xij ) �i � J � {0}, j � J � {n + 1}, k � K (12)
F k k k k
j ≤ F − fij xij �i � F, j � J � {n + 1}, k � K (13) Sk k k k k j ≤ Si − sij + S (1 − xij ) �i � J � {0}, j � J � {n + 1}, k � K
(14) Sk k k k
j ≤ S − sij xij �i � S, j � J � {n + 1}, k � K (15) xk
ij � {0, 1} �(i, j) � A, k � K (16) 0 ≤ C ≤ C �i � V � {0, n + 1} (17) 0 ≤ F k ≤ F
k �i � V � {0, n + 1} (18)
0 ≤ Sk ≤ Sk �i � V � {0, n + 1} (19)
x
i
i
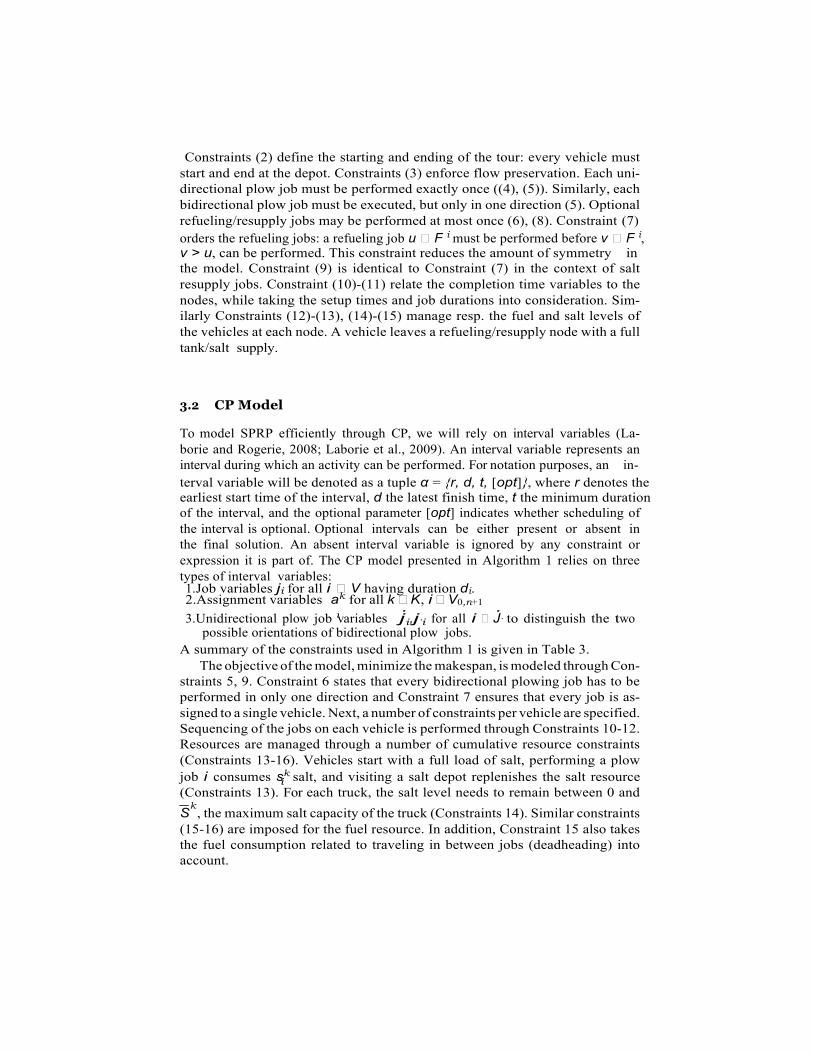
Constraints (2) define the starting and ending of the tour: every vehicle must start and end at the depot. Constraints (3) enforce flow preservation. Each uni- directional plow job must be performed exactly once ((4), (5)). Similarly, each bidirectional plow job must be executed, but only in one direction (5). Optional refueling/resupply jobs may be performed at most once (6), (8). Constraint (7) orders the refueling jobs: a refueling job u � F i must be performed before v � F i, v > u, can be performed. This constraint reduces the amount of symmetry in the model. Constraint (9) is identical to Constraint (7) in the context of salt resupply jobs. Constraint (10)-(11) relate the completion time variables to the nodes, while taking the setup times and job durations into consideration. Sim- ilarly Constraints (12)-(13), (14)-(15) manage resp. the fuel and salt levels of the vehicles at each node. A vehicle leaves a refueling/resupply node with a full tank/salt supply.
3.2 CP Model
To model SPRP efficiently through CP, we will rely on interval variables (La- borie and Rogerie, 2008; Laborie et al., 2009). An interval variable represents an interval during which an activity can be performed. For notation purposes, an in- terval variable will be denoted as a tuple α = {r, d, t, [opt]}, where r denotes the earliest start time of the interval, d the latest finish time, t the minimum duration of the interval, and the optional parameter [opt] indicates whether scheduling of the interval is optional. Optional intervals can be either present or absent in the final solution. An absent interval variable is ignored by any constraint or expression it is part of. The CP model presented in Algorithm 1 relies on three types of interval variables: 1. Job variables ji for all i � V having duration di. 2.Assignment variables ak for all k � K, i � V0,n+1
3.Unidirectional plow job variables ji,j i for all i � J to distinguish the two possible orientations of bidirectional plow jobs.
A summary of the constraints used in Algorithm 1 is given in Table 3. The objective of the model, minimize the makespan, is modeled through Con-
straints 5, 9. Constraint 6 states that every bidirectional plowing job has to be performed in only one direction and Constraint 7 ensures that every job is as- signed to a single vehicle. Next, a number of constraints per vehicle are specified. Sequencing of the jobs on each vehicle is performed through Constraints 10-12. Resources are managed through a number of cumulative resource constraints (Constraints 13-16). Vehicles start with a full load of salt, performing a plow job i consumes sk salt, and visiting a salt depot replenishes the salt resource (Constraints 13). For each truck, the salt level needs to remain between 0 and Sk
, the maximum salt capacity of the truck (Constraints 14). Similar constraints (15-16) are imposed for the fuel resource. In addition, Constraint 15 also takes the fuel consumption related to traveling in between jobs (deadheading) into account.
i
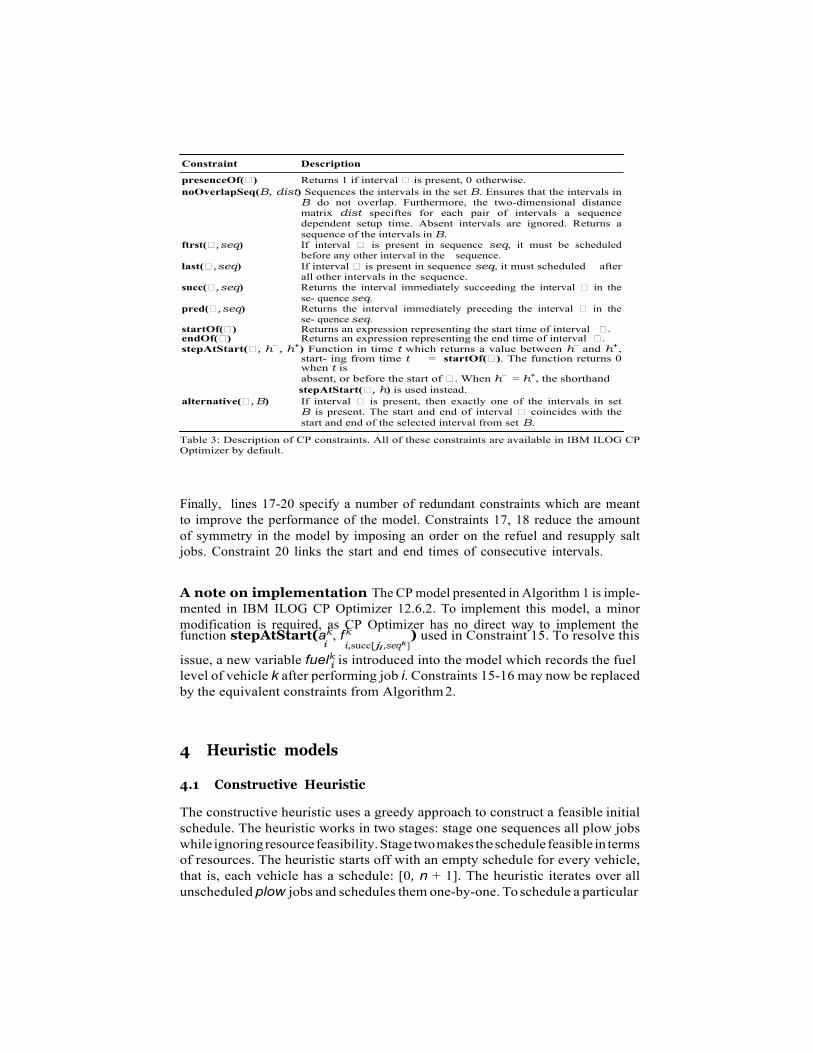
Constraint Description
presenceOf(�) Returns 1 if interval � is present, 0 otherwise. noOverlapSeq(B, dist) Sequences the intervals in the set B. Ensures that the intervals in
B do not overlap. Furthermore, the two-dimensional distance matrix dist speciftes for each pair of intervals a sequence dependent setup time. Absent intervals are ignored. Returns a sequence of the intervals in B.
ftrst(�, seq) If interval � is present in sequence seq, it must be scheduled before any other interval in the sequence.
last(�, seq) If interval � is present in sequence seq, it must scheduled after all other intervals in the sequence.
succ(�, seq) Returns the interval immediately succeeding the interval � in the se- quence seq.
pred(�, seq) Returns the interval immediately preceding the interval � in the se- quence seq.
startOf(�) Returns an expression representing the start time of interval �. endOf(�) Returns an expression representing the end time of interval �. stepAtStart(�, h−, h+) Function in time t which returns a value between h− and h+,
start- ing from time t = startOf(�). The function returns 0 when t is absent, or before the start of �. When h− = h+, the shorthand stepAtStart(�, h) is used instead.
alternative(�, B) If interval � is present, then exactly one of the intervals in set B is present. The start and end of interval � coincides with the start and end of the selected interval from set B.
Table 3: Description of CP constraints. All of these constraints are available in IBM ILOG CP Optimizer by default.
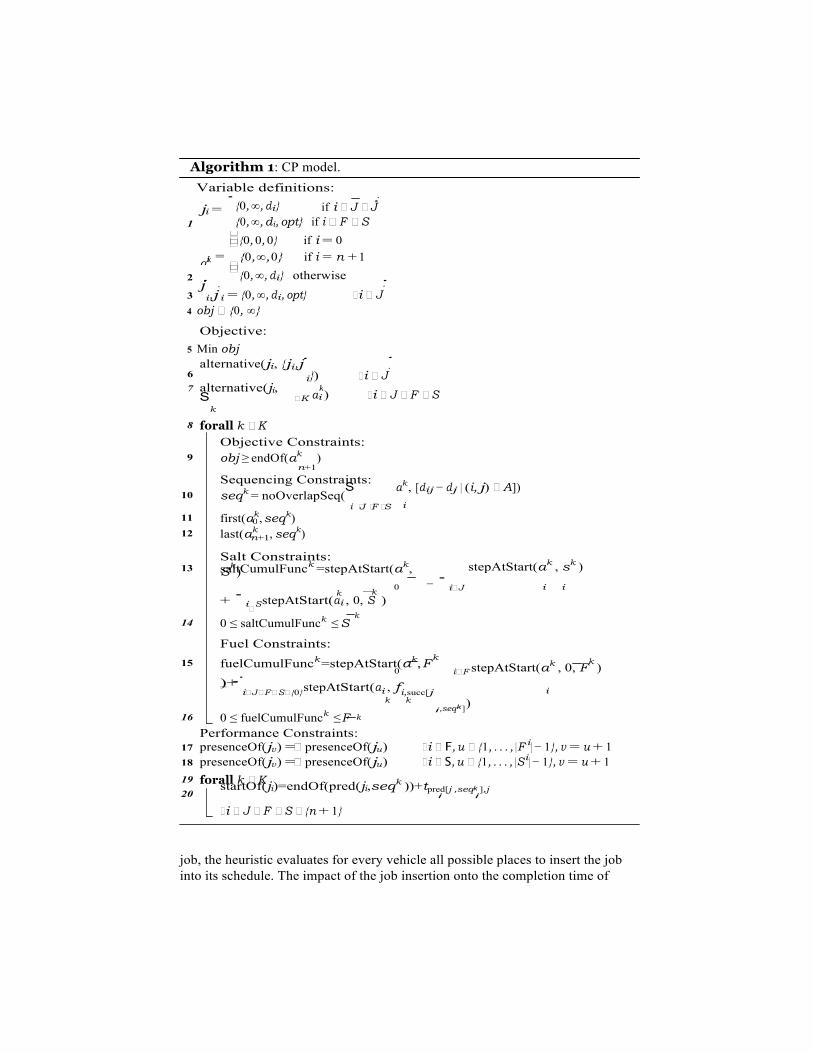
Finally, lines 17-20 specify a number of redundant constraints which are meant to improve the performance of the model. Constraints 17, 18 reduce the amount of symmetry in the model by imposing an order on the refuel and resupply salt jobs. Constraint 20 links the start and end times of consecutive intervals.
A note on implementation The CP model presented in Algorithm 1 is imple- mented in IBM ILOG CP Optimizer 12.6.2. To implement this model, a minor modification is required, as CP Optimizer has no direct way to implement the function stepAtStart(ak , f k ) used in Constraint 15. To resolve this
i i,succ[ji,seqk ] issue, a new variable fuelk is introduced into the model which records the fuel level of vehicle k after performing job i. Constraints 15-16 may now be replaced by the equivalent constraints from Algorithm 2.
4 Heuristic models
4.1 Constructive Heuristic
The constructive heuristic uses a greedy approach to construct a feasible initial schedule. The heuristic works in two stages: stage one sequences all plow jobs while ignoring resource feasibility. Stage two makes the schedule feasible in terms of resources. The heuristic starts off with an empty schedule for every vehicle, that is, each vehicle has a schedule: [0, n + 1]. The heuristic iterates over all unscheduled plow jobs and schedules them one-by-one. To schedule a particular
ak
�
k
n+1
i J F S i
0
n+1
0
i
Algorithm 1: CP model. Variable definitions:
ji =
.{0, ∞, di} if i � J � J
1 {0, ∞, di, opt} if i � F � S
��{0, 0, 0} if i = 0 i = {0, ∞, 0} if i = n + 1
2 ��{0, ∞, di} otherwise
j ˙ 3 i,j i = {0, ∞, di, opt} �i � J 4 obj � {0, ∞}
Objective: 5 Min obj
alternative(ji, {ji,j ˙ 6 7 alternative(ji,
Sk
8 forall k � K
i}) �i � J
�K ai ) �i � J � F � S
Objective Constraints: 9 obj ≥ endOf(ak )
Sequencing Constraints: 10 seqk = noOverlapSeq(
S
� � �
ak , [dij − dj | (i, j) � A])
11 first(ak , seqk ) 12 last(ak , seqk )
Salt Constraints: 13 saltCumulFunck =stepAtStart(ak , S
k )
stepAtStart(ak , sk )
0 − .
i�J i i k k
+ .
i S stepAtStart(ai , 0, S ) �
k
14 0 ≤ saltCumulFunck ≤ S
Fuel Constraints: 15 fuelCumulFunck =stepAtStart(ak , Fk
)+ . −
.i�J�F �S�{0}stepAtStart(ai , fi,succ[j
i�F stepAtStart(ak , 0, Fk )
k k
16 0 ≤ fuelCumulFunck ≤ F Performance Constraints:
i ,seqk ])
17 presenceOf(jv ) =� presenceOf(ju) �i � F, u � {1, . . . , |F i| − 1}, v = u + 1 18 presenceOf(jv ) =� presenceOf(ju) �i � S, u � {1, . . . , |Si| − 1}, v = u + 1 19 forall k � K startOf(ji)=endOf(pred(ji,seqk ))+tpred[j ,seqk ],j 20 i i
�i � J � F � S � {n + 1}
job, the heuristic evaluates for every vehicle all possible places to insert the job into its schedule. The impact of the job insertion onto the completion time of
k
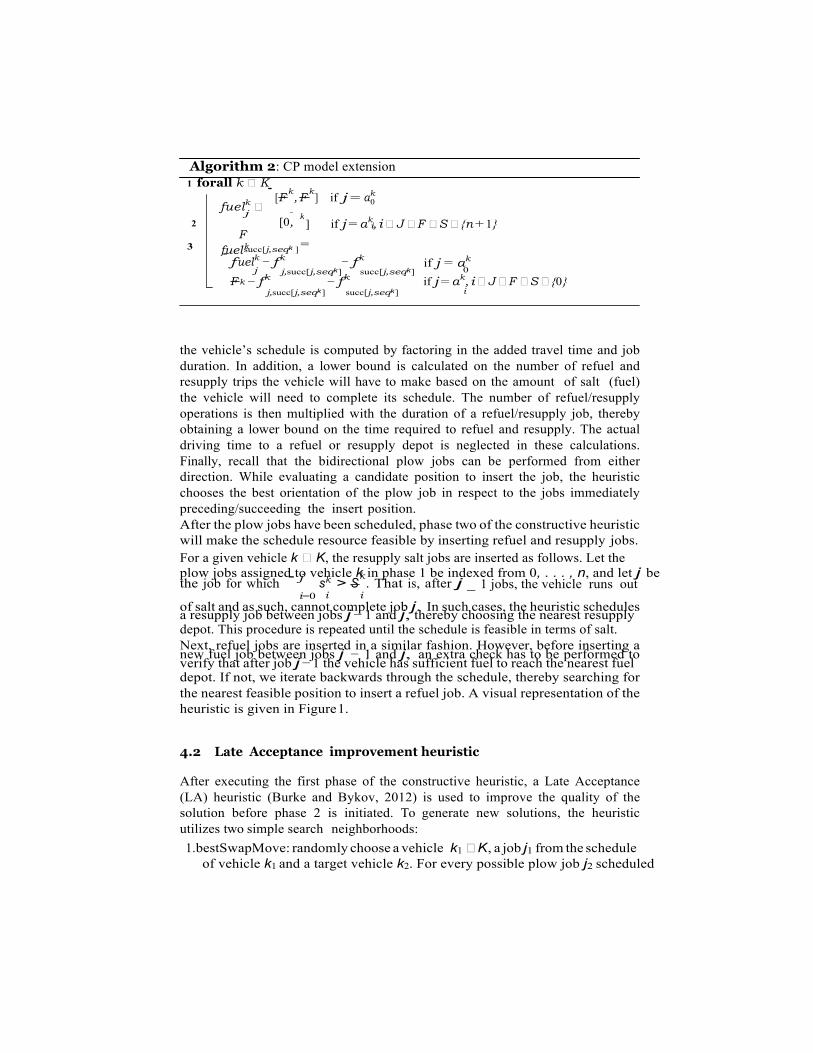
i
fuel k
k
Algorithm 2: CP model extension 1 forall k � K .
[F k, F
k ] if j = ak
fuelk � 0
j 2 [0,
F ] if j = ak, i � J � F � S � {n + 1}
3 succ[j,seqk ] = .fuelk − fk − fk
if j = ak
j j,succ[j,seqk ] succ[j,seqk ] 0 F − fk − fk if j = ak, i � J � F � S � {0}
j,succ[j,seqk ] succ[j,seqk ] i
the vehicle’s schedule is computed by factoring in the added travel time and job duration. In addition, a lower bound is calculated on the number of refuel and resupply trips the vehicle will have to make based on the amount of salt (fuel) the vehicle will need to complete its schedule. The number of refuel/resupply operations is then multiplied with the duration of a refuel/resupply job, thereby obtaining a lower bound on the time required to refuel and resupply. The actual driving time to a refuel or resupply depot is neglected in these calculations. Finally, recall that the bidirectional plow jobs can be performed from either direction. While evaluating a candidate position to insert the job, the heuristic chooses the best orientation of the plow job in respect to the jobs immediately preceding/succeeding the insert position. After the plow jobs have been scheduled, phase two of the constructive heuristic will make the schedule resource feasible by inserting refuel and resupply jobs. For a given vehicle k � K, the resupply salt jobs are inserted as follows. Let the plow jobs assigned to vehicle k in phase 1 be indexed from 0, . . . , n, and let j be the job for which
.j sk > Sk . That is, after j 1 jobs, the vehicle runs out
i=0 i i − of salt and as such, cannot complete job j. In such cases, the heuristic schedules a resupply job between jobs j − 1 and j, thereby choosing the nearest resupply depot. This procedure is repeated until the schedule is feasible in terms of salt. Next, refuel jobs are inserted in a similar fashion. However, before inserting a new fuel job between jobs j − 1 and j, an extra check has to be performed to verify that after job j − 1 the vehicle has sufficient fuel to reach the nearest fuel depot. If not, we iterate backwards through the schedule, thereby searching for the nearest feasible position to insert a refuel job. A visual representation of the heuristic is given in Figure 1.
4.2 Late Acceptance improvement heuristic
After executing the first phase of the constructive heuristic, a Late Acceptance (LA) heuristic (Burke and Bykov, 2012) is used to improve the quality of the solution before phase 2 is initiated. To generate new solutions, the heuristic utilizes two simple search neighborhoods: 1. bestSwapMove: randomly choose a vehicle k1 � K, a job j1 from the schedule
of vehicle k1 and a target vehicle k2. For every possible plow job j2 scheduled
k
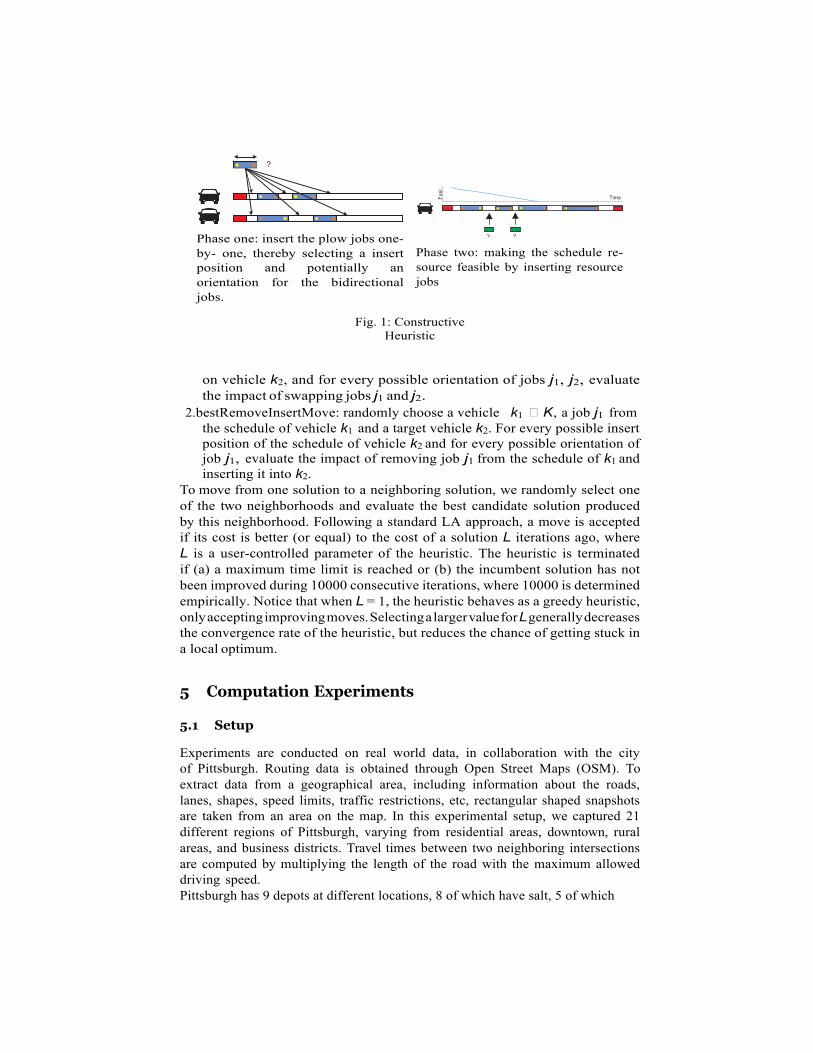
Phase one: insert the plow jobs one-by- one, thereby selecting a insert position and potentially an orientation for the bidirectional jobs.
? ?
Phase two: making the schedule re- source feasible by inserting resource jobs
Fig. 1: Constructive Heuristic
on vehicle k2, and for every possible orientation of jobs j1, j2, evaluate the impact of swapping jobs j1 and j2.
2. bestRemoveInsertMove: randomly choose a vehicle k1 � K, a job j1 from the schedule of vehicle k1 and a target vehicle k2. For every possible insert position of the schedule of vehicle k2 and for every possible orientation of job j1, evaluate the impact of removing job j1 from the schedule of k1 and inserting it into k2.
To move from one solution to a neighboring solution, we randomly select one of the two neighborhoods and evaluate the best candidate solution produced by this neighborhood. Following a standard LA approach, a move is accepted if its cost is better (or equal) to the cost of a solution L iterations ago, where L is a user-controlled parameter of the heuristic. The heuristic is terminated if (a) a maximum time limit is reached or (b) the incumbent solution has not been improved during 10000 consecutive iterations, where 10000 is determined empirically. Notice that when L = 1, the heuristic behaves as a greedy heuristic, only accepting improving moves. Selecting a larger value for L generally decreases the convergence rate of the heuristic, but reduces the chance of getting stuck in a local optimum.
5 Computation Experiments
5.1 Setup
Experiments are conducted on real world data, in collaboration with the city of Pittsburgh. Routing data is obtained through Open Street Maps (OSM). To extract data from a geographical area, including information about the roads, lanes, shapes, speed limits, traffic restrictions, etc, rectangular shaped snapshots are taken from an area on the map. In this experimental setup, we captured 21 different regions of Pittsburgh, varying from residential areas, downtown, rural areas, and business districts. Travel times between two neighboring intersections are computed by multiplying the length of the road with the maximum allowed driving speed. Pittsburgh has 9 depots at different locations, 8 of which have salt, 5 of which
?
Time Fuel
have fuel. For experimental purposes, we use a small heterogeneous fleet of five vehicles to service each area. The smallest pickup-truck in our fleet has a capacity of 2 tons of salt and 26 gallons of fuel, whereas the largest plow has a capacity of 20 tons of salt and 75 gallons of fuel. Currently, the city utilizes about 1 ton of salt per mile, rendering salt the most constraining resource.
5.2 Results
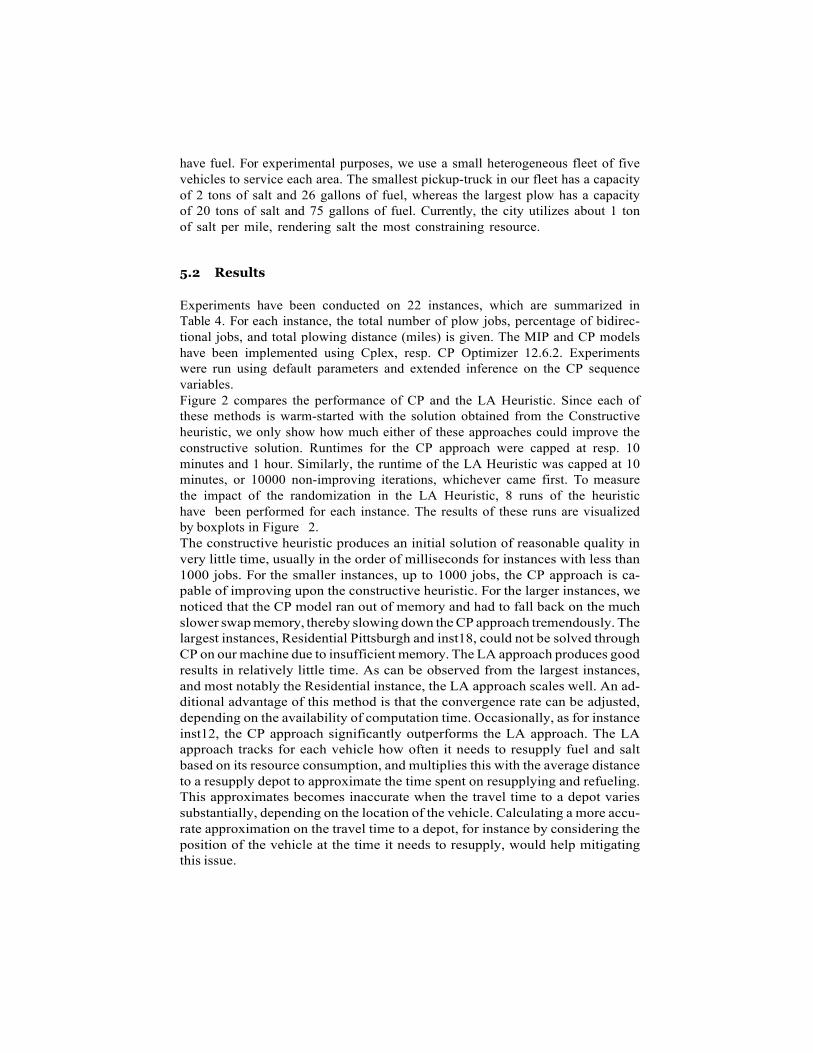
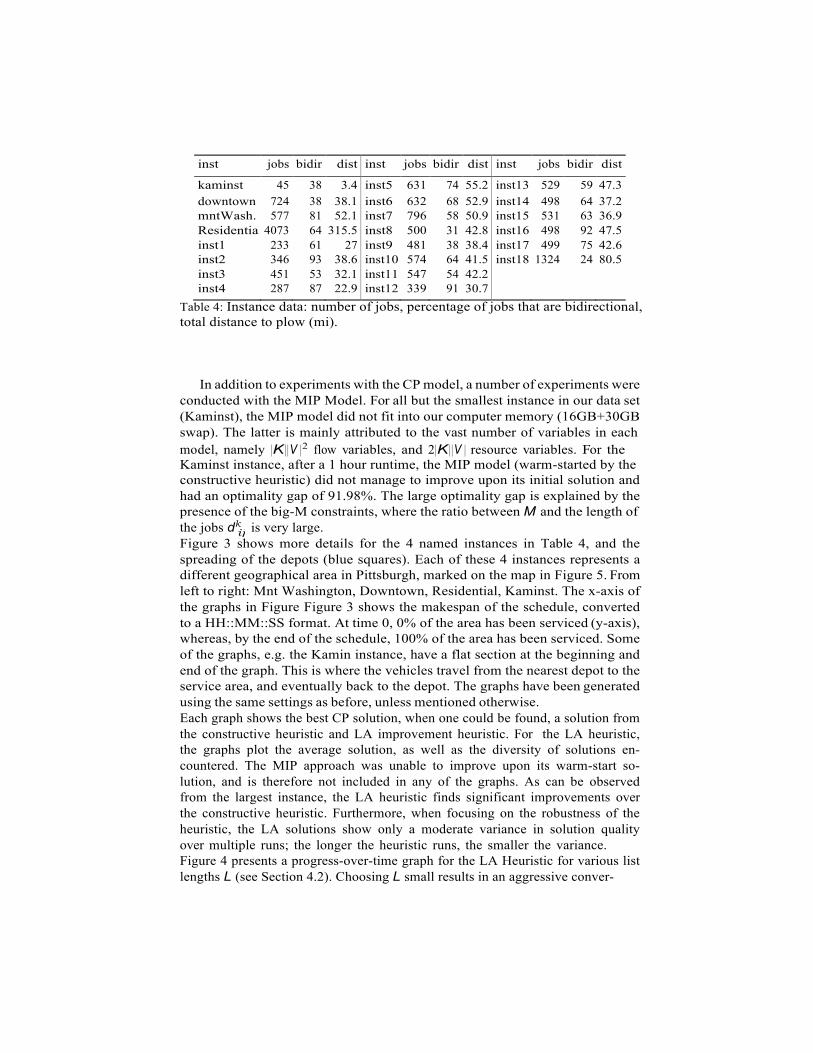
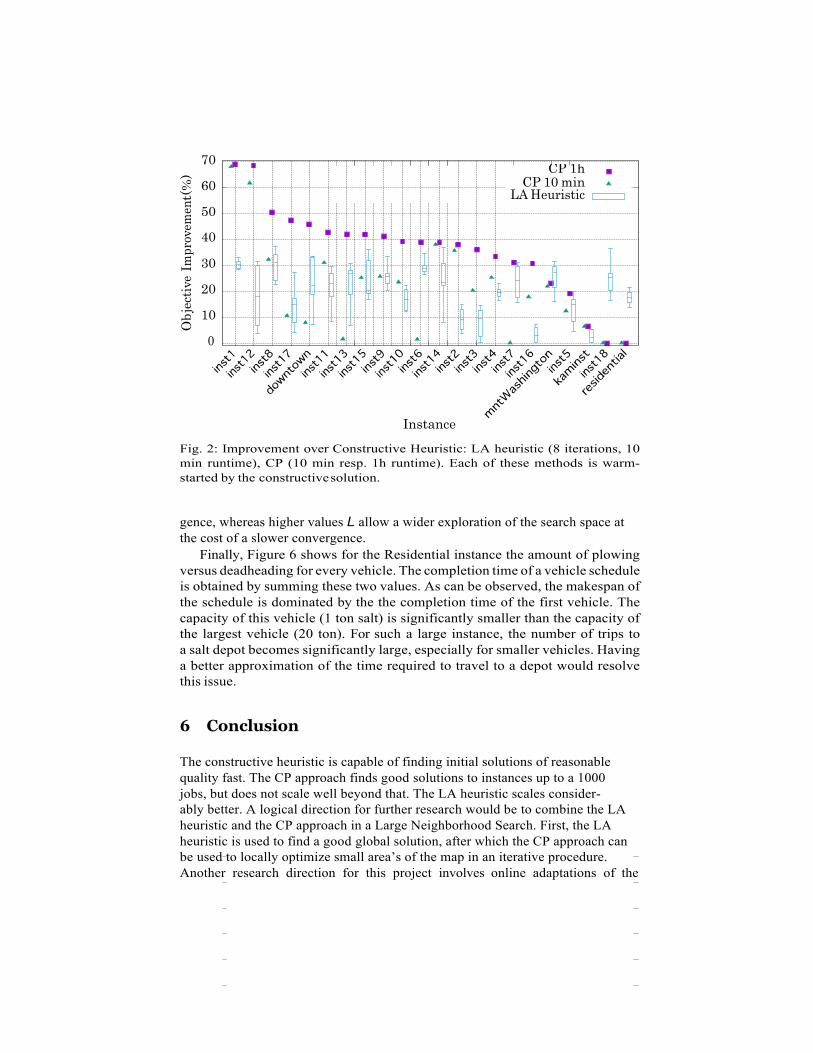
Experiments have been conducted on 22 instances, which are summarized in Table 4. For each instance, the total number of plow jobs, percentage of bidirec- tional jobs, and total plowing distance (miles) is given. The MIP and CP models have been implemented using Cplex, resp. CP Optimizer 12.6.2. Experiments were run using default parameters and extended inference on the CP sequence variables. Figure 2 compares the performance of CP and the LA Heuristic. Since each of these methods is warm-started with the solution obtained from the Constructive heuristic, we only show how much either of these approaches could improve the constructive solution. Runtimes for the CP approach were capped at resp. 10 minutes and 1 hour. Similarly, the runtime of the LA Heuristic was capped at 10 minutes, or 10000 non-improving iterations, whichever came first. To measure the impact of the randomization in the LA Heuristic, 8 runs of the heuristic have been performed for each instance. The results of these runs are visualized by boxplots in Figure 2. The constructive heuristic produces an initial solution of reasonable quality in very little time, usually in the order of milliseconds for instances with less than 1000 jobs. For the smaller instances, up to 1000 jobs, the CP approach is ca- pable of improving upon the constructive heuristic. For the larger instances, we noticed that the CP model ran out of memory and had to fall back on the much slower swap memory, thereby slowing down the CP approach tremendously. The largest instances, Residential Pittsburgh and inst18, could not be solved through CP on our machine due to insufficient memory. The LA approach produces good results in relatively little time. As can be observed from the largest instances, and most notably the Residential instance, the LA approach scales well. An ad- ditional advantage of this method is that the convergence rate can be adjusted, depending on the availability of computation time. Occasionally, as for instance inst12, the CP approach significantly outperforms the LA approach. The LA approach tracks for each vehicle how often it needs to resupply fuel and salt based on its resource consumption, and multiplies this with the average distance to a resupply depot to approximate the time spent on resupplying and refueling. This approximates becomes inaccurate when the travel time to a depot varies substantially, depending on the location of the vehicle. Calculating a more accu- rate approximation on the travel time to a depot, for instance by considering the position of the vehicle at the time it needs to resupply, would help mitigating this issue.
ij
inst jobs bidir dist inst jobs bidir dist inst jobs bidir dist
kaminst 45 38 3.4 inst5 631 74 55.2 inst13 529 59 47.3 downtown 724 38 38.1 inst6 632 68 52.9 inst14 498 64 37.2 mntWash. 577 81 52.1 inst7 796 58 50.9 inst15 531 63 36.9 Residential
4073 64 315.5 inst8 500 31 42.8 inst16 498 92 47.5 inst1 233 61 27 inst9 481 38 38.4 inst17 499 75 42.6 inst2 346 93 38.6 inst10 574 64 41.5 inst18 1324 24 80.5 inst3 451 53 32.1 inst11 547 54 42.2 inst4 287 87 22.9 inst12 339 91 30.7
Table 4: Instance data: number of jobs, percentage of jobs that are bidirectional, total distance to plow (mi).
In addition to experiments with the CP model, a number of experiments were conducted with the MIP Model. For all but the smallest instance in our data set (Kaminst), the MIP model did not fit into our computer memory (16GB+30GB swap). The latter is mainly attributed to the vast number of variables in each model, namely |K ||V |2 flow variables, and 2|K ||V | resource variables. For the Kaminst instance, after a 1 hour runtime, the MIP model (warm-started by the constructive heuristic) did not manage to improve upon its initial solution and had an optimality gap of 91.98%. The large optimality gap is explained by the presence of the big-M constraints, where the ratio between M and the length of the jobs dk is very large. Figure 3 shows more details for the 4 named instances in Table 4, and the spreading of the depots (blue squares). Each of these 4 instances represents a different geographical area in Pittsburgh, marked on the map in Figure 5. From left to right: Mnt Washington, Downtown, Residential, Kaminst. The x-axis of the graphs in Figure Figure 3 shows the makespan of the schedule, converted to a HH::MM::SS format. At time 0, 0% of the area has been serviced (y-axis), whereas, by the end of the schedule, 100% of the area has been serviced. Some of the graphs, e.g. the Kamin instance, have a flat section at the beginning and end of the graph. This is where the vehicles travel from the nearest depot to the service area, and eventually back to the depot. The graphs have been generated using the same settings as before, unless mentioned otherwise. Each graph shows the best CP solution, when one could be found, a solution from the constructive heuristic and LA improvement heuristic. For the LA heuristic, the graphs plot the average solution, as well as the diversity of solutions en- countered. The MIP approach was unable to improve upon its warm-start so- lution, and is therefore not included in any of the graphs. As can be observed from the largest instance, the LA heuristic finds significant improvements over the constructive heuristic. Furthermore, when focusing on the robustness of the heuristic, the LA solutions show only a moderate variance in solution quality over multiple runs; the longer the heuristic runs, the smaller the variance. Figure 4 presents a progress-over-time graph for the LA Heuristic for various list lengths L (see Section 4.2). Choosing L small results in an aggressive conver-
70
60
50
40
30
20
10
0
Instance Fig. 2: Improvement over Constructive Heuristic: LA heuristic (8 iterations, 10 min runtime), CP (10 min resp. 1h runtime). Each of these methods is warm-started by the constructive solution.
gence, whereas higher values L allow a wider exploration of the search space at the cost of a slower convergence.
Finally, Figure 6 shows for the Residential instance the amount of plowing versus deadheading for every vehicle. The completion time of a vehicle schedule is obtained by summing these two values. As can be observed, the makespan of the schedule is dominated by the the completion time of the first vehicle. The capacity of this vehicle (1 ton salt) is significantly smaller than the capacity of the largest vehicle (20 ton). For such a large instance, the number of trips to a salt depot becomes significantly large, especially for smaller vehicles. Having a better approximation of the time required to travel to a depot would resolve this issue.
6 Conclusion
The constructive heuristic is capable of finding initial solutions of reasonable quality fast. The CP approach finds good solutions to instances up to a 1000 jobs, but does not scale well beyond that. The LA heuristic scales consider- ably better. A logical direction for further research would be to combine the LA heuristic and the CP approach in a Large Neighborhood Search. First, the LA heuristic is used to find a good global solution, after which the CP approach can be used to locally optimize small area’s of the map in an iterative procedure. Another research direction for this project involves online adaptations of the
CP 1h CP 10 min
LA Heuristic O
bjec
tive
Impr
ovem
ent(
%)
Cov
erag
e(%
)
1 1
0.8 0.8
0.6 0.6
0.4 0.4
0.2 0.2
0 0
Time
Kamin St
Time
Downtown
1
1 0.8
0.8
0.6
0.6 0.4
0.4
0.2
0.2
0
0
Time
Mnt Washington
Time
Residential (LA 50 iterations, 15 min per iteration)
Fig. 3: Service over time
schedule. Unexpected events such as a blocked road, traffic congestion, emer- gency request etc, could necessitate modifications to the schedule. Again, the CP approach may be of use to ‘repair’ a small portion of the schedule, while leaving the remainder of the schedule intact. Finally, from a model perspective, a number of additional features may be in- corporated, including:
– Road priorities. The city assigns priorities to roads. In general, roads with high priorities should be serviced as fast as possible. This can be achieved by replacing the makespan objective by a weighted objective which minimizes the completion time per priority class.
– U-turns. Due to the size of the plows, having a large number of U-turns in a schedule is undesirable. As such, U-turns should be forbidden (hard- constrained) or penalized in the objective function.
– Road limitations. Some roads are too small or too steep to be plowed by the largest (and heaviest) vehicles. Similarly, in rural areas, the weight of large plows may exceed weight limitations on certain bridges. Consequently, a routing graph per vehicle category will be necessary. In addition, some plow jobs cannot be assigned to some of the heavier vehicles.
Road priorities are easily accounted for in the models presented, by assigning a priority class to each job and by using a weighted objective function which keeps track of the completion time of each priority class. Similarly, U-Turns can be penalized by increasing the setup time between a pair of jobs which would
LA range LA average
Constructive Heuristic
Cov
erag
e(%
) C
over
age(
%)
Cov
erag
e(%
)
LA range
LA average Constructive Heuristic
CP
LA range
LA average Constructive Heuristic
CP
LA range
LA average Constructive Heuristic
CP
05:30:00 05:20:00 05:10:00 05:00:00 04:50:00 04:40:00 04:30:00 04:20:00 04:10:00 04:00:00 03:50:00 03:40:00
Pittsburgh Residential - Makespan (runtime 2h, 1 it)
1 5
10 20 40 80
160 320 640
0 0.5 1 1.5 2 2.5 3 3.5 Iteration (106)
Fig. 4: Progress-over-Time for various list lengths Fig. 5: Depots and names instances
05:30:00
05:00:00
04:30:00
04:00:00
03:30:00
03:00:00
02:30:00
02:00:00
01:30:00
Pittsburgh Residential - Makespan (runtime 2h)
1 2 3 4 5 Vehicle
Plowing vs Deadheading
Pittsburgh Residential - Makespan (runtime 2h) 50 45 40 35 30 25 20 15 10
5 0
1 2 3 4 5 Vehicle
Resources
Fig. 6: Solution details
require a u-turn if one is performed immediately after the other. In case of a forbidden U-Turn, the setup-time will be significantly larger, representing the detour the truck has to make to get back, e.g. the time it takes to drive around the block.
Plowing Deadheading
Refuels Resupply salt
U-turns
Boun
d on
obj
ectiv
e Ti
me
Valu
e
Bibliography
E. K. Burke and Y. Bykov, “The late acceptance hill-climbing heuristic,” Department of Computing Science and Mathemat- ics, University of Stirling, Tech. Rep., 2012. [Online]. Available: http://www.cs.stir.ac.uk/research/publications/techreps/pdf/TR192.pdf
H. A. Eiselt, M. Gendreau, and G. Laporte, “Arc routing problems, part i: The chinese postman problem,” Operations Research, vol. 43, no. 2, pp. 231–242, 1995.
——, “Arc routing problems, part ii: The rural postman problem,” Operations Research, vol. 43, no. 3, pp. 399–414, 1995.
Environmental Protection Agency, “Storm water manage- ment fact sheet, minimizing effects from highway deic- ing.” Tech. Rep. EPA 832-F-99-016, 1999. [Online]. Available: http://water.epa.gov/scitech/wastetech/upload/2002 06 28 mtb ice.pdf
D. Gupta, E. Tokar-Erdemir, D. Kuchera, A. K. Mannava, and W. Xiong, “Optimal workforce planning and shift scheduling for snow and ice removal.” Center for Transportation Studies, University of Minnesota, Tech. Rep. Mn/DOT 2011-03, 2011. [Online]. Available: http://www.cts.umn.edu/Publications/ResearchReports
P. Laborie and J. Rogerie, “Reasoning with conditional time-intervals,” in FLAIRS Conference, 2008, pp. 555–560.
P. Laborie, J. Rogerie, P. Shaw, and P. Vil ım, “Reasoning with conditional time- intervals. part ii: An algebraical model for resources,” in FLAIRS Conference, 2009.
K. Mei-Ko, “Graphic programming using odd or even points,” Chinese Math, vol. 1, pp. 273–277, 1962.
N. Perrier, A. Langevin, and J. F. Campbell, “A survey of models and algorithms for winter road maintenance. part i: system design for spreading and plowing.” Computers & Operations Research, vol. 33, pp. 209–238, 2006.
——, “A survey of models and algorithms for winter road maintenance. part ii: system design for snow disposal,” Computers & Operations Research, vol. 33, no. 1, pp. 239 – 262, 2006.
——, “A survey of models and algorithms for winter road maintenance. part iii: Vehicle routing and depot location for spreading,” Computers & Operations Research, vol. 34, no. 1, pp. 211 – 257, 2007.
——, “A survey of models and algorithms for winter road maintenance. part iv: Vehicle routing and fleet sizing for plowing and snow disposal,” Computers & Operations Research, vol. 34, no. 1, pp. 258 – 294, 2007.
N. Perrier, A. Langevin, and C.-A. Amaya, “Vehicle routing for urban snow plowing operations,” Transportation Science, vol. 42, no. 1, pp. 44–56, 2008.
J. Rubin, P. E. Garder, C. E. Morris, K. L. Nichols, J. M. Peck- enham, P. McKee, A. Stern, and T. O. Johnson, “Maine winter roads: Salt, safety, environment and cost,” Margaret Chase Smith
Policy Center, University of Maine, Tech. Rep., 2010. [Online]. Avail- able: http://umaine.edu/mcspolicycenter/files/2010/02/Winter-Road-Maint- Final.pdf
M. A. Salazar-Aguilar, A. Langevin, and G. Laporte, “Synchronized arc rout- ing for snow plowing operations.” Computers & Operations Research, vol. 39, no. 7, pp. 1432–1440, 2012.
T. Usman, L. Fu, and L. F. Miranda-Moreno, “Quantifying safety benefit of winter road maintenance: Accident frequency modeling,” Accident Analysis & Prevention, vol. 42, no. 6, pp. 1878 – 1887, 2010.

Appendix 2: Snow Plow Router, Final Report, ISR Project Course, Spring 2015
CARNEGIE MELLON UNIVERSITY
MOBILE AND PERVASIVE COMPUTING SERVICES – SPRING 2015
Project Report
Snow Plow Router Team members: Bruno Nunes José Urbano Theo Gordon Ty Chen

Acknowledgement We would like to thank Professor Norman Sadeh for his guidance and advice throughout the development process. We would also like to thank Professors Stephen Smith and Zachary Rubinstein who introduced us to this project. Finally, we would like to thank Lee Heller, Jeff Koch, the City of Pittsburgh Department of Public Works, and most especially the Department of Public Works 3rd Division Drivers for giving their time, opinions, knowledge, and input to the development process.
Table of Contents Acknowledgement ......................................................................................................................................... 2
List of Figures ................................................................................................................................................. 5
Executive Summary ....................................................................................................................................... 6
Introduction & Motivation ............................................................................................................................ 6
Current Scenario ............................................................................................................................................ 6
Organization Description ........................................................................................................................... 6
Driver Description ...................................................................................................................................... 7
Equipment description .............................................................................................................................. 7
Work description ....................................................................................................................................... 8
Route Description ...................................................................................................................................... 8
Opportunities for improvement ................................................................................................................ 9
Challenges ................................................................................................................................................... 10
Stakeholders ............................................................................................................................................ 10
Environmental ......................................................................................................................................... 11
Driver Distractions ................................................................................................................................... 11
Personnel ................................................................................................................................................. 11
Technical .................................................................................................................................................. 11
Solution ........................................................................................................................................................ 12
Phase 1 – February 2015 ......................................................................................................................... 12
Phase 2 – May 2015 ................................................................................................................................ 13
Phase 3 – November 2015 ...................................................................................................................... 13
Architecture ................................................................................................................................................. 14
Phase 1 .................................................................................................................................................... 14
Phase 2 .................................................................................................................................................... 15
Phase 3 .................................................................................................................................................... 16
User Centered Design Process .................................................................................................................... 17
Understanding Target Users .................................................................................................................... 17
Technology and Architecture Selection .................................................................................................. 20
Identifying Functionality Requirements .................................................................................................. 20
Cost Estimates & Refining Options .......................................................................................................... 21
Use Cases ................................................................................................................................................. 21
Early Evaluation ....................................................................................................................................... 22
Prototype Refinement ............................................................................................................................. 22
Pilot testing .............................................................................................................................................. 22
Business Model ............................................................................................................................................ 22
Current work ........................................................................................................................................... 22
Future business opportunities ................................................................................................................ 23
Privacy and Security .................................................................................................................................... 24
Location Information ............................................................................................................................... 24
3rd Party APIs ................................................................................................................................................... 24
Public Interface ........................................................................................................................................ 24
Personally Identifiable Information ........................................................................................................ 24
Data Collection ........................................................................................................................................ 24
Future Work ................................................................................................................................................ 25
Development tools ...................................................................................................................................... 25
Conclusion ................................................................................................................................................... 25
References ................................................................................................................................................... 25
Appendices .................................................................................................................................................. 26
Use Cases ................................................................................................................................................. 26
Paper Prototype ...................................................................................................................................... 39

List of Figures Figure 1: 3rd Division -‐-‐-‐ Primary Route 2 ............................................................................................................. 9 Figure 2: Phase 1 Architecture .................................................................................................................... 15 Figure 3: Phase 2 Architecture .................................................................................................................... 16 Figure 4: Phase 3 Architecture .................................................................................................................... 17
Executive Summary In conjunction with the City of Pittsburgh’s Department of Public Works, we have developed an app to provide real time routing information to snow plow drivers. This report discusses the current operational environment in which this app will be used, as well as the challenges this app will face. The app solution will be discussed including current progress and future iterations. Finally, technical information and methodology will also be discussed.
Introduction & Motivation Pittsbugh is a hilly city in Western Pennsylvania, which receives on average 41.9 inches of snowfall annually (National Weather Service Pittsburgh, 2015) and contains roads as steep as 37% grade (Batz, 2005). During the winter months a fleet of Department of Public Works trucks, ranging from 1 to 10 tons, plow and salt the public streets of the city. The DPW drivers work night and day shifts using paper routes that they have mostly memorized.
These routes have existed for years, some decades. Understanding changes in street layout, traffic patterns, resource constraints, and technology, The City of Pittsburgh is investigating new methods of routing drivers. Approaches being considered range from newly generated static routes to an algorithm that routes drivers along a path that is being dynamically updated in response to various inputs.
These solutions have great potential to improve coverage, safety, and efficiency. However, any new route must be presented in a way that the driver can easily follow without any potentially unsafe distraction. The goal of this project is to understand the work environment of the driver and develop a route direction app that satisfies the needs of all stakeholders.
Current Scenario This app is aimed at a large municipal government with varying organizational levels, resources, and stakeholders. In order to gain wide acceptance, the app has to be an improvement on the status quo for the drivers, city management, and the public. Before the development team could focus on user centered design, we had to understand how users, stakeholders, and resources currently interact.
Organization Description The Pittsburgh Public Works Department is responsible for the city’s streets and parks, environmental services, and transportation (City of Pittsburgh, n.d.). The Street Maintenance Division is broken into 6 divisions. Each division is overseen by a Division Supervisor (Heller & Koch, 2015). In the winter, plowing efforts are carried out by a dispatcher and drivers, who belong to the American Federation of State, County and Municipal Employees, a public employees union. Every division has a fleet of trucks, ranging in size from 1 to 10 tons.
The 3rd division is considered the pilot division for new technology and is the division that will be the first to interact with new routes as well as our app. The 3rd division is overseen by the division supervisor, Jeffrey Koch. In addition to its trucks, the division also has an uncovered salt depot. Most other divisions have a covered salt shed and a supply of fuel.
Driver Description The Public Works drivers are members of the AFSCME union. Most are full-‐-‐-‐time year round employees of the DPW. During the summer they perform other DPW jobs such as landscaping and construction. From Thanksgiving to April the drivers work on snow removal. There are generally two shifts, a daytime shift that starts at 6 A.M. and an evening shift that starts at 10 P.M. When snow conditions are severe, the Division Supervisor can extend work hours up to 16 hour long shifts.
Most drivers are male and in a broad age range, with varying levels of education. Some drivers have Commercial Drivers Licenses and are authorized to driver the larger 8-‐-‐-‐10 ton trucks while those without a CDL drive the converted pickup trucks. Most drivers have been with their divisions for years and routinely drive the same routes every shift. Thus, the drivers mostly have the routes committed to memory. While they take paper copies of their routes with them, they generally do not refer to them for directions. This makes it difficult for drivers to switch routes or learn new ones. Drivers almost never plow routes outside of their division’s boundaries.
Equipment description The 3rd division has approximately three 10-‐-‐-‐ton trucks, two 8-‐-‐-‐ton trucks, and two 5-‐-‐-‐ton trucks as well as several pickup style trucks. The division also has a larger truck, which has been out for repairs and was therefore unobserved. Each truck has a plow mounted to the front and carries a load of salt with a spreader device in the bed of the truck. The different size trucks carry various amounts of salt and therefore have different maximum ranges before they must return for more salt. The trucks break down from time to time and are not always available.
The driver can control the position of the plow vertically and rotation via controls in the cab. These adjustments are powered by hydraulics. This control requires the use of one hand. When making tight turns, the driver must often angle the plow so as not to hit parked cars. The driver also controls the amount of salt being put on the roads by turning the salt spreader on and off and adjusting its speed. The spreader itself is located at the rear of the truck and the driver monitors the spreader by viewing the salt spray with the side-‐-‐-‐view mirrors.
The larger, dump truck style trucks have hydraulic pistons that lift up the bed of the truck. The driver uses this feature to move salt to the back of the bed where the spreader is located. The driver stops approximately every 15 minutes to raise and then lower the bed. The drivers of the smaller pickup trucks will instead get out of their trucks to fix jams of salt or redistribute the salt in the bed of the truck. Drivers of all sizes of trucks will occasionally get out of their vehicles to visually inspect the amount of salt remaining. Some newer large trucks have a conveyor belt in the bottom of the truck to move salt to the spreader, though the use of these trucks is not common. The issue of salt level monitoring is of particular concern after a recent incident where a driver exited the vehicle to inspect the salt level and slipped on ice, injuring her leg.
Besides the hydraulic controls, the cab also contains a VHF radio, driving controls and a built-‐-‐-‐in AM/FM radio. There are also other electronics with which the driver does not interact, mainly a GPS location tracker.
Work description The drivers begin their shifts at the vehicle depot. They congregate in a small office, get some food before they start driving, and discuss that shift’s work. The dispatcher assigns routes to the drivers based on which routes have been done recently, and which routes particular drivers normally do. The drivers then pick up paper copies of their routes and inspect their trucks to make sure that they are in good working order. The drivers then drive over to the salt pile where a front loader fills them up with a salt load.
From the salt pile, the drivers proceed to the start of their route. Once arrived, they will note down the time on the route paper. The drivers will then begin to drive their route, laying down salt and plowing. Generally, the drivers just salt, unless there has been snow accumulation. If the snow accumulation is light the driver will plow and salt. If the accumulation is heavy the driver may just plow as the salt is not as effective in those situations.
The smaller trucks conserve salt by only putting it down in intersections. They then rely on vehicle traffic to spread the salt from the intersection to the rest of the road. Vehicle traffic can be of a concern as salt is generally not very effective without traffic to work it into the snow and ice.
Occasionally the dispatcher will receive a special task request. These can vary from a complaint to the city’s non-‐-‐-‐emergency 311 number, to a request from ambulances to plow the entry to a hospital, or police at the scene of an accident. Once the dispatcher has received such a task, he will announce the task on the VHF radio. Drivers will then volunteer to complete the task. The first driver to volunteer will proceed to the location and clear the area of ice and snow. After which, the driver will return to the assigned route. Currently, there is no formal method for determining which driver is best situated to complete the task.
Route Description Each division has primary, secondary, tertiary, and emergency routes. The third division has 17 primary routes, 22 secondary routes, 13 tertiary routes, and 5 emergency routes. Primary routes are major commercial and residential corridors. Secondary routes are remaining medium and small streets. Tertiary routes cover alleys and other rarely used roads. Emergency routes only cover the largest, most vital, transportation corridors and access routes to hospitals and other emergency services. Emergency routes are only in effect when snowfall is over 30 inches.
Routes are currently provided in paper form (see Figure 1: 3rd Division -‐-‐-‐ Primary Route 2) and are normally between ten and twenty miles in length. They contain text instructions of which streets to plow and when to turn onto the next street. Drivers are instructed to write a start, middle, and end time for each street.
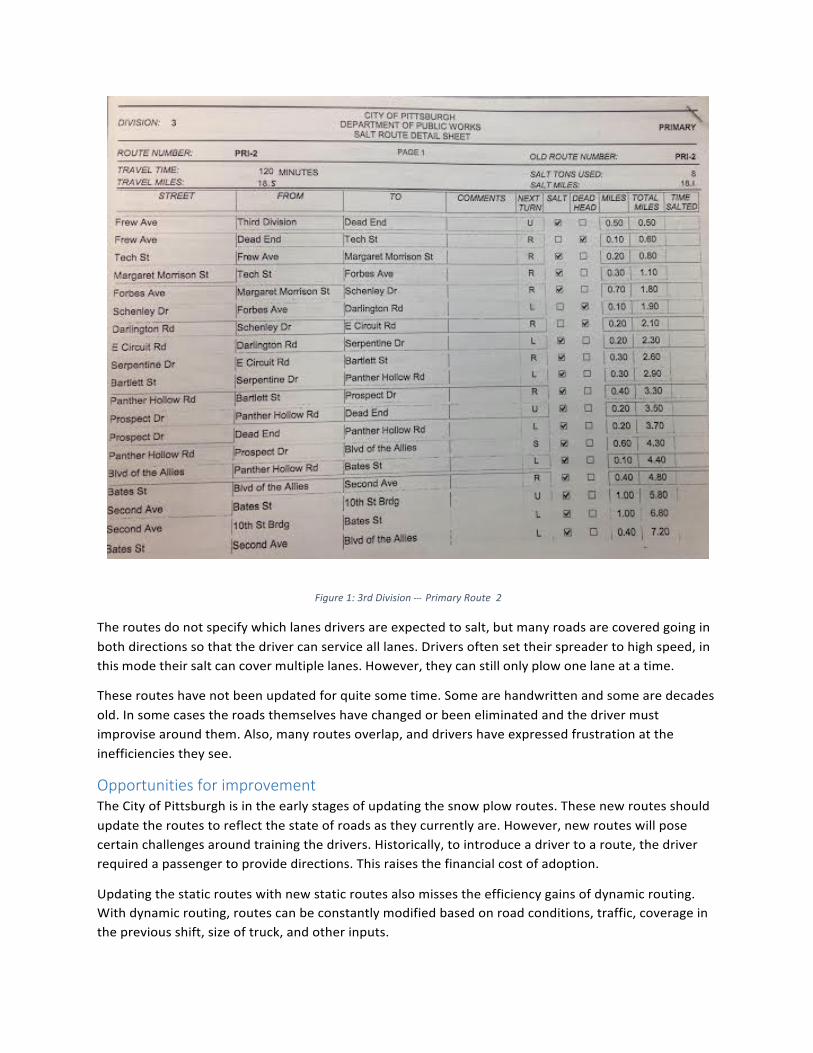
Figure 1: 3rd Division -‐-‐-‐ Primary Route 2 The routes do not specify which lanes drivers are expected to salt, but many roads are covered going in both directions so that the driver can service all lanes. Drivers often set their spreader to high speed, in this mode their salt can cover multiple lanes. However, they can still only plow one lane at a time.
These routes have not been updated for quite some time. Some are handwritten and some are decades old. In some cases the roads themselves have changed or been eliminated and the driver must improvise around them. Also, many routes overlap, and drivers have expressed frustration at the inefficiencies they see.
Opportunities for improvement The City of Pittsburgh is in the early stages of updating the snow plow routes. These new routes should update the routes to reflect the state of roads as they currently are. However, new routes will pose certain challenges around training the drivers. Historically, to introduce a driver to a route, the driver required a passenger to provide directions. This raises the financial cost of adoption.
Updating the static routes with new static routes also misses the efficiency gains of dynamic routing. With dynamic routing, routes can be constantly modified based on road conditions, traffic, coverage in the previous shift, size of truck, and other inputs.
Whether adopting new static routes or switching to dynamic routing, there is an opportunity for an app based solution to present routing information to drivers. A well designed app will make it easier to train new drivers, transfer old drivers to new routes, and share resources between divisions. An app could also automate the special task notification process and ensure that the closest driver is the one assigned to a task.
Other areas for improvement include monitoring the salt level, so that the driver depletes the salt load near to a salt depot and does not have to backtrack large distances. Using geospatial information, the app can map coverage, giving real time updates to the dispatcher, as well as the general public. The app can also eliminate paperwork for the drivers, reducing cost and allowing them to focus on snow removal.
Challenges Before designing this app, the development team must take into account the myriad challenges faced. The team must be cognizant of the large number of stakeholders involved in government projects. This app in particular also presents environmental challenges and requirements for a minimally invasive interface. This app is being targeted for a narrow user base and the design must be focused around the city employees who will be using the app. Finally, technical challenges abound and will be examined.
Stakeholders This app is being developed for the City of Pittsburgh. Lee Haller is the Deputy Director of the Department of Public Works and is the chief stakeholder in this project. In discussions with Mr. Haller, he expressed his desire for a solution that increased snow removal coverage of city streets. He also has budgetary responsibilities and wants to ensure that any solution is smoothly adopted into the workforce.
Jeff Koch is the supervisor of 3rd Division of the Department of Public Works. He also wants to improve coverage. As a supervisor he has expressed a desire for monitoring capabilities in the field. He also wants to ensure that the app is designed to be easy to use by his drivers.
The division dispatcher is looking for solutions that make the drivers’ task easier and would appreciate a way to monitor snow removal progress throughout a shift. As the dispatcher for special requests he will be affected by a new notification system.
The drivers will be the primary user of the app. They are primarily concerned with ease of use. They view the turn-‐-‐-‐by-‐-‐-‐turn instructions as extremely useful. Most of them are excited to be given new, more efficient routes, but see turn-‐-‐-‐by-‐-‐-‐turn directions as a vital tool to learn the routes. Drivers have also mentioned the paperwork that they are required to do while plowing and would like to see that process automated. Some drivers have expressed concerns about privacy, especially with information provided to the public.
The driving public will also be affected by this app. Increased efficiency and coverage will reduce the amount of time for the DPW to clear roads. Other projects that have provided real time information to the public have been positively received. There may be opportunities to provide more information to the public about what roads are cleared and when drivers can expect their roads to be cleared after a
snowfall. As any government program, the ultimate stakeholder is always the taxpayer. The taxpayer’s financial resources must be respected and this app should be designed to give value to taxpayers in the form of increased efficiency and improved safety.
Finally, emergency works have an interest in a solution that improves their ability access different parts of the city. They will also be well served by an app that improves response time to special tasks.
Having such a large number of stakeholders poses challenges. There are at times competing interests that must be resolved. In addition, just collecting data or input from this many stakeholders can be difficult. These challenges are compounded by the work settings. While the dispatcher and drivers were extremely helpful in providing input to our development process, we still had to be very conscientious of their schedule so as not to interfere with their work.
Environmental This app will, by definition, be used in challenging environmental circumstances. The drivers do their jobs no matter what the weather is. The environment inside the cab can be very noisy, with sound levels measured by us at over 100dB. Many drivers choose to drive with their window open for fresh air, this adds to the noise level. The smaller trucks also have limited space with their cabs. Any devices placed within the cabs must not interfere with the driver’s use of equipment, nor line of sight. In addition, many drivers work at night, so the app must not interfere with their night vision. Finally, strong vibrations were observed in the truck, so any new equipment must be securely installed.
Driver Distractions The drivers are expected to maneuver large trucks through narrow city streets, often with street parking, in icy and snowy conditions with low visibility. While driving they must monitor their route while adjusting the plow and salt spreader. The app interface must present information whenever it is needed in a format that is easy to interpret. At the same time, any interaction between the app and driver must be designed in a way that does not distract the driver and does not reduce safety.
Personnel Drivers may have different degrees of technical proficiency and exposure to smart phones and tablets. The app must be intuitive and have a very fast learning curve. Drivers cannot be expected to take time out of driving to explore controls. In addition, the drivers must feel that they are getting value out of the app in order to encourage adoption and participation.
Technical Many technical hurdles were encountered during the development of this app. The chief hurdle was around obtaining a turn-‐-‐-‐by-‐-‐-‐turn directions library. While there are plenty of libraries on Android for showing maps and laying out the user position and pins on them, the development team had trouble finding a library that provided turn-‐-‐-‐by-‐-‐-‐turn navigation. Most of the companies that provide mapping libraries do not provide navigation in their libraries, due to their business model. If we wanted to use Google’s navigation services, for example, we would have to provide the start and destination points to Google’s app, and it would handle the turn-‐-‐-‐by-‐-‐-‐turn navigation. This approach does not meet our expectations of functionalities, as it does not allow us to give directions inside our app.
We considered developing our own navigation library for turn-‐-‐-‐by-‐-‐-‐turn directions, but after some research we concluded that it would be infeasible in the short time frame that we had for developing the prototype.
In our search for a library that would do what we need, we found Skobbler (http://www.skobbler.com/), which promises to provide in-‐-‐-‐app turn-‐-‐-‐by-‐-‐-‐turn navigation. We then proceeded to use this library in our implementation, just to find out that they only provide navigation from one point to another, and not with multiple via points. The routes that we show for the drivers are by definition a set of via points, calculated to make better use of the available resources. The navigation for the shortest path between two points could be used if we could update the points at runtime, giving the user the impression that the multiple fragmented navigations were only one navigation through the assigned route. However, trying this approach resulted in a very fragmented experience that did not match our expectations. We contacted the library’s developers and they informed us that the feature that we need is scheduled to be rolled out in the next version by the beginning of March. Our plan is to wait for the release of this new version and keep using the library if it meets our needs, or find another solution in case negative.
The team also experienced difficulties getting quantitative data for prototype validation. While drivers were very happy to help us with development, any tests had to be done around their work schedule and in their office environment, not a controlled laboratory.
Solution The end goal for this project is to provide an app that is integrated with turn-‐-‐-‐by-‐-‐-‐turn directions, a dynamic routing algorithm, input from sensors onboard the trucks, and a web or app interface for supervisors and the driving public. We chose to constrain the development process to phases that would allow us to realize gains and obtain buy-‐-‐-‐in from stake and resource holders for future phases.
Phase 1 – February 2015 The first phase’s objective was to provide an initial proof of concept prototype by the end of February 2015. The development team’s goal was to show the utility of an app-‐-‐-‐based solution. We focused on understanding the users’ needs and developing an app that would work in the operational environment.
The key focus of this phase was building an app that could present preloaded route information to the drivers. The driver beings by logging in to the app and is then presented with an overview map of the preloaded route. The route is displayed as red lines covering the assigned streets. At this point the driver is given the option to accept or ignore the route. If the driver ignores the route, the app will continue to function as a GPS tracker overlaid on a street map.
Once the driver accepts the route, the app will show a path from the vehicle depot to the start of the route. As the driver follows the path, a pin will show the driver’s current position. Once the driver arrives at the start of the route, the app will continue to track the driver’s progress and as roads are completed, they will turn from red to green.
While driving, the driver can request directions to receive more salt or fuel. The app will pick the nearest appropriate location then provide the drive with a path to that destination. When the driver has completed a route, the app will direct the driver back to the Public Works facility.
Phase 2 – May 2015 Phase 2 of this project will focus primarily on providing turn-‐-‐-‐by-‐-‐-‐turn directions. The drivers have requested this feature and the development team views it as a key value driver. The turn-‐-‐-‐by-‐-‐-‐turn interface will be designed to provide directions simply in a way that does not distract drivers. User feedback will be sought on color schemes that do not impair night vision.
The development team will also explore the use of voice directions and speech input. Some consideration will be given to use of voice directions and speech input. Preliminary tests showed positive results for these solutions despite noise levels in the trucks. Further studies will confirm this and determine how easy these inputs are for drivers to use.
The development team will also use this phase to develop a notification system for dispatchers to prompt drivers to a special task. When the app receives a notification it will display a dialog box for the driver with a brief description of the task. The driver can then accept or reject the task. If the driver rejects the task, the app will return to its routing view. If the driver accepts the task the app will direct the driver to the location of the task. After the task is completed, the driver will be directed back to the route and continue normal snow removal duties.
This phase will also seek to verify earlier work in an operational setting. Once a turn-‐-‐-‐by-‐-‐-‐turn prototype is completed, the team will plan a series of ride along tests with the drivers. During the tests the drivers will be directed along a route by the app. Usability, driver reaction, and distraction levels will be monitored. After the completion of the route, the driver will be asked to fill out a more detailed survey. During this phase, the development team will also work with the Carnegie Mellon University team that is developing the dynamic routing algorithm to establish a protocol for sharing information between the routing algorithm and app.
Phase 3 – November 2015 Phase 3 will focus on developing a complete, functional, real time routing information system. The goal for this phase is to have the system ready for a preliminary rollout at the beginning of the 2015-‐-‐-‐2016 snow removal season. A complete system will involve many components and interrelationships.
Instead of relying on pre-‐-‐-‐loaded routes, the app in this phase will have routing information pushed to it by a server based dynamic routing algorithm. Precise formats and protocols will have to be developed for this information sharing. Bandwidth and other resource requirements will also have to be considered.
A key element of dynamic routing is providing the algorithm with real time information around which routes can be optimized. The app will therefore provide the algorithm with location updates so that the algorithm can track snow removal progress. The routing algorithm is under development by professors Stephen Smith and Zachary Rubinstein at CMU. They will develop the server side of the application that will communicate with our mobile application and calculate the routes in real time.
In addition to location information, the app will also need to provide the routing algorithm as well as the supervisors with vehicle status information. Work on this phase will involve integration with on-‐-‐-‐board sensors to determine salt and fuel level as well as the status of the plow and the salt spreader. The app will provide this information to the routing algorithm. The salt and fuel level information will be used to size routes and ensure that when trucks do need resource replenishment, they are close to a refilling
location. Occasionally, trucks travel along roads without plowing or deploying salt. Information pulled from the spreader and plow controls will allow the app and routing algorithm to track this status. Information collected by the app will initially be sent to a remote server. Once the information is on the server it will be stored for access by both the routing algorithm and other interfaces.
During this phase, two other interfaces will also be developed. One interface will be for supervisors and dispatchers. This interface will provide scheduling information where drivers shift information, including truck assignments will be entered. The information will also give dispatchers the ability to create and assign special task notifications. Through this interface supervisors will be able to track overall progress and generate relevant reports.
The second interface will be public facing and provide the driving public with real time and forecasted snow removal information. The public will access a website where they will see what streets have been recently serviced and will be able to enter their address and be provided with a time estimate for snow removal. The recently plowed street information will be provided by the app information stored on the server while snow removal forecasts will be provided by the routing algorithm.
Architecture This project involves multiple stakeholders and resource providers. Later phases of the project will see the introduction of multiple interfaces. As such, the development team has specified system architectures to map relationships and interface requirements.
Phase 1 Phase 1 focused on developing an app interface that met drivers’ needs and was intuitive to use. As such, features that required integration with other services, resources, or users were delayed for further phases. In this phase, existing routes are pre-‐-‐-‐loaded by the development team into the app. The app then uses weather and map APIs to present relevant information to the drivers. Drivers interact with the app to obtain this information. Any other information required, such as salt and fuel status will be manually input by the driver. See Figure 2: Phase 1 Architecture.
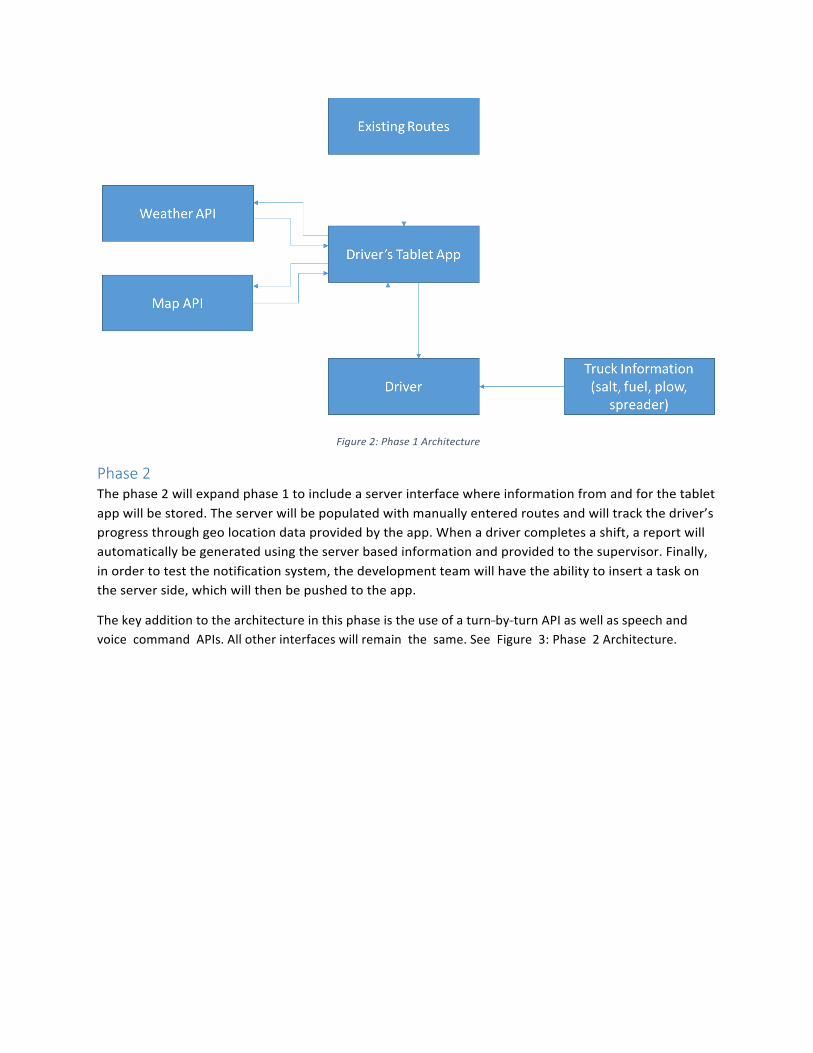
Figure 2: Phase 1 Architecture
Phase 2 The phase 2 will expand phase 1 to include a server interface where information from and for the tablet app will be stored. The server will be populated with manually entered routes and will track the driver’s progress through geo location data provided by the app. When a driver completes a shift, a report will automatically be generated using the server based information and provided to the supervisor. Finally, in order to test the notification system, the development team will have the ability to insert a task on the server side, which will then be pushed to the app.
The key addition to the architecture in this phase is the use of a turn-‐-‐-‐by-‐-‐-‐turn API as well as speech and voice command APIs. All other interfaces will remain the same. See Figure 3: Phase 2 Architecture.
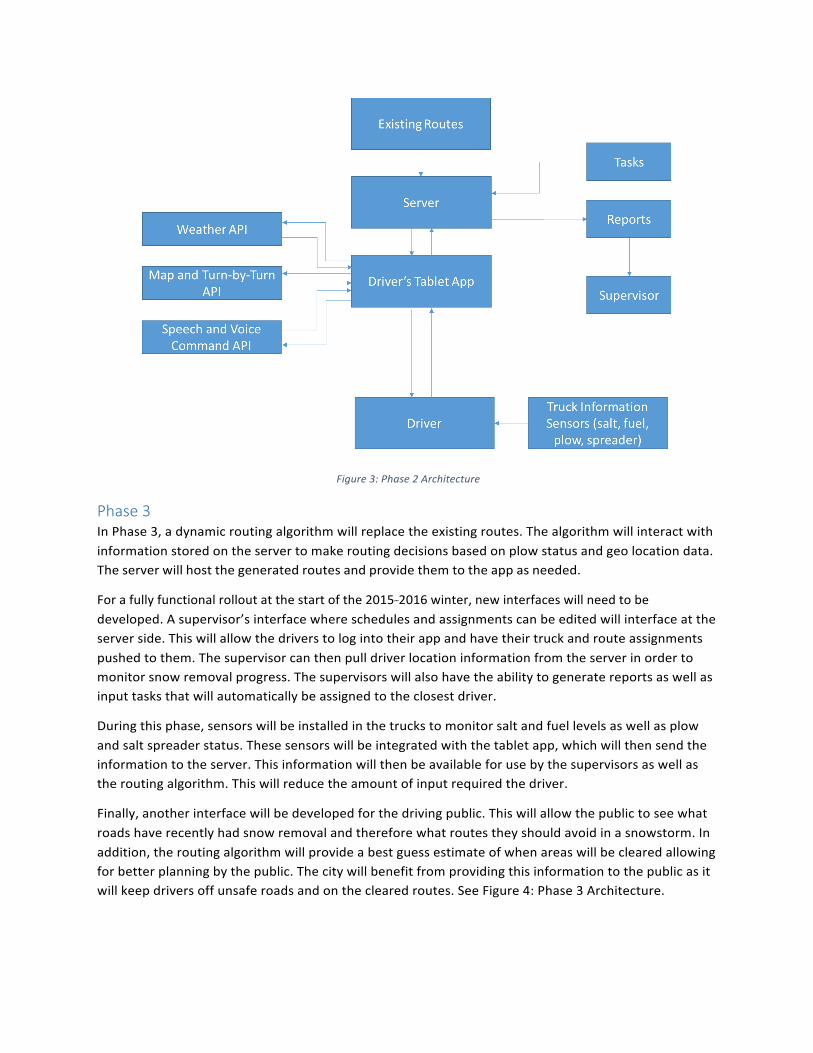
Figure 3: Phase 2 Architecture
Phase 3 In Phase 3, a dynamic routing algorithm will replace the existing routes. The algorithm will interact with information stored on the server to make routing decisions based on plow status and geo location data. The server will host the generated routes and provide them to the app as needed.
For a fully functional rollout at the start of the 2015-‐-‐-‐2016 winter, new interfaces will need to be developed. A supervisor’s interface where schedules and assignments can be edited will interface at the server side. This will allow the drivers to log into their app and have their truck and route assignments pushed to them. The supervisor can then pull driver location information from the server in order to monitor snow removal progress. The supervisors will also have the ability to generate reports as well as input tasks that will automatically be assigned to the closest driver.
During this phase, sensors will be installed in the trucks to monitor salt and fuel levels as well as plow and salt spreader status. These sensors will be integrated with the tablet app, which will then send the information to the server. This information will then be available for use by the supervisors as well as the routing algorithm. This will reduce the amount of input required the driver.
Finally, another interface will be developed for the driving public. This will allow the public to see what roads have recently had snow removal and therefore what routes they should avoid in a snowstorm. In addition, the routing algorithm will provide a best guess estimate of when areas will be cleared allowing for better planning by the public. The city will benefit from providing this information to the public as it will keep drivers off unsafe roads and on the cleared routes. See Figure 4: Phase 3 Architecture.
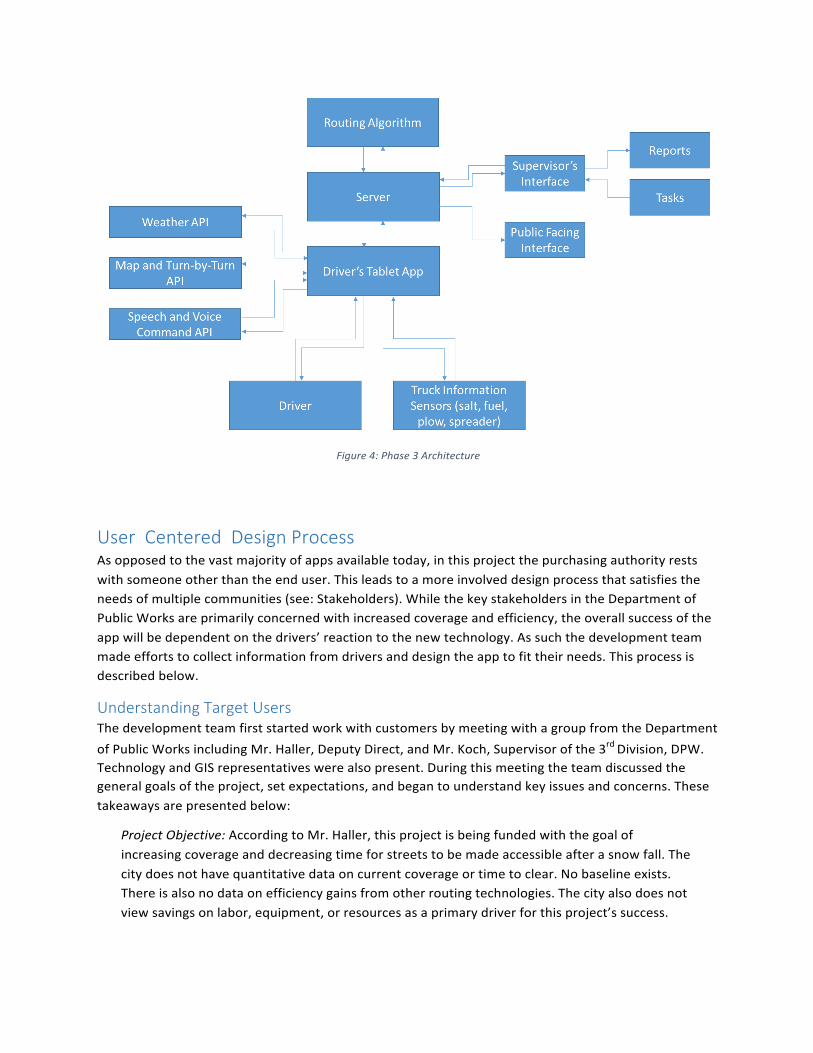
Figure 4: Phase 3 Architecture
User Centered Design Process As opposed to the vast majority of apps available today, in this project the purchasing authority rests with someone other than the end user. This leads to a more involved design process that satisfies the needs of multiple communities (see: Stakeholders). While the key stakeholders in the Department of Public Works are primarily concerned with increased coverage and efficiency, the overall success of the app will be dependent on the drivers’ reaction to the new technology. As such the development team made efforts to collect information from drivers and design the app to fit their needs. This process is described below.
Understanding Target Users The development team first started work with customers by meeting with a group from the Department of Public Works including Mr. Haller, Deputy Direct, and Mr. Koch, Supervisor of the 3rd Division, DPW. Technology and GIS representatives were also present. During this meeting the team discussed the general goals of the project, set expectations, and began to understand key issues and concerns. These takeaways are presented below:
Project Objective: According to Mr. Haller, this project is being funded with the goal of increasing coverage and decreasing time for streets to be made accessible after a snow fall. The city does not have quantitative data on current coverage or time to clear. No baseline exists. There is also no data on efficiency gains from other routing technologies. The city also does not view savings on labor, equipment, or resources as a primary driver for this project’s success.
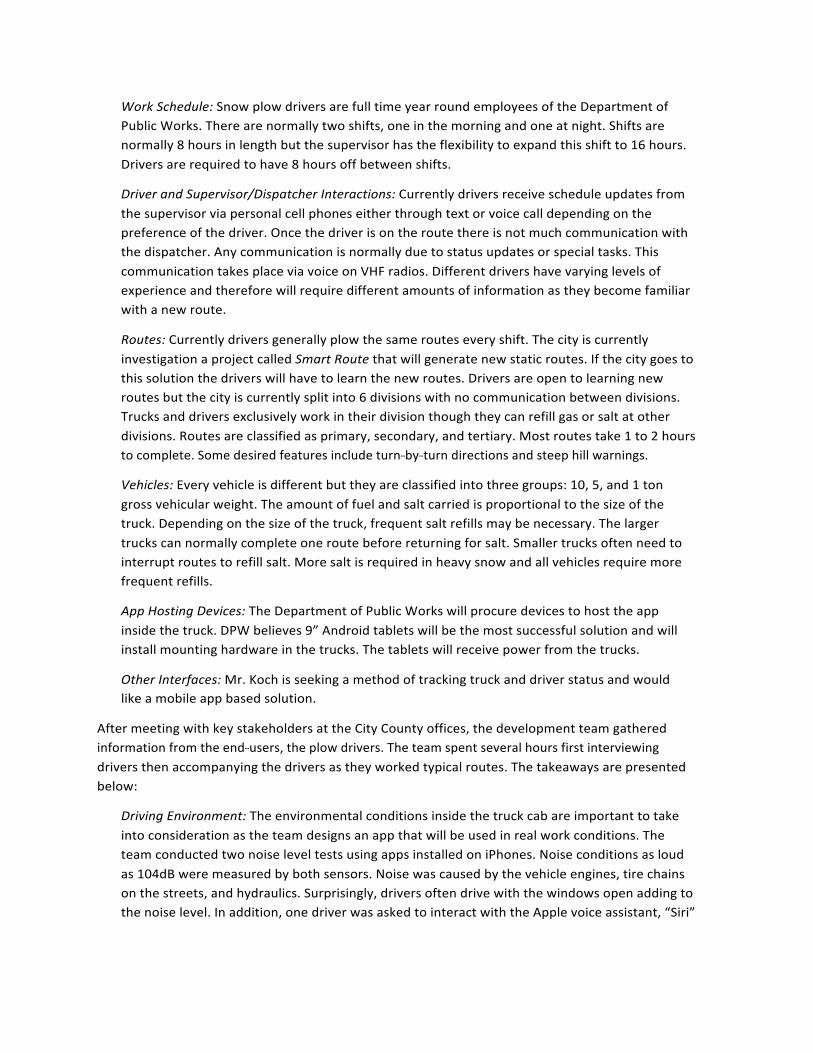
Work Schedule: Snow plow drivers are full time year round employees of the Department of Public Works. There are normally two shifts, one in the morning and one at night. Shifts are normally 8 hours in length but the supervisor has the flexibility to expand this shift to 16 hours. Drivers are required to have 8 hours off between shifts.
Driver and Supervisor/Dispatcher Interactions: Currently drivers receive schedule updates from the supervisor via personal cell phones either through text or voice call depending on the preference of the driver. Once the driver is on the route there is not much communication with the dispatcher. Any communication is normally due to status updates or special tasks. This communication takes place via voice on VHF radios. Different drivers have varying levels of experience and therefore will require different amounts of information as they become familiar with a new route.
Routes: Currently drivers generally plow the same routes every shift. The city is currently investigation a project called Smart Route that will generate new static routes. If the city goes to this solution the drivers will have to learn the new routes. Drivers are open to learning new routes but the city is currently split into 6 divisions with no communication between divisions. Trucks and drivers exclusively work in their division though they can refill gas or salt at other divisions. Routes are classified as primary, secondary, and tertiary. Most routes take 1 to 2 hours to complete. Some desired features include turn-‐-‐-‐by-‐-‐-‐turn directions and steep hill warnings.
Vehicles: Every vehicle is different but they are classified into three groups: 10, 5, and 1 ton gross vehicular weight. The amount of fuel and salt carried is proportional to the size of the truck. Depending on the size of the truck, frequent salt refills may be necessary. The larger trucks can normally complete one route before returning for salt. Smaller trucks often need to interrupt routes to refill salt. More salt is required in heavy snow and all vehicles require more frequent refills.
App Hosting Devices: The Department of Public Works will procure devices to host the app inside the truck. DPW believes 9” Android tablets will be the most successful solution and will install mounting hardware in the trucks. The tablets will receive power from the trucks.
Other Interfaces: Mr. Koch is seeking a method of tracking truck and driver status and would like a mobile app based solution.
After meeting with key stakeholders at the City County offices, the development team gathered information from the end-‐-‐-‐users, the plow drivers. The team spent several hours first interviewing drivers then accompanying the drivers as they worked typical routes. The takeaways are presented below:
Driving Environment: The environmental conditions inside the truck cab are important to take into consideration as the team designs an app that will be used in real work conditions. The team conducted two noise level tests using apps installed on iPhones. Noise conditions as loud as 104dB were measured by both sensors. Noise was caused by the vehicle engines, tire chains on the streets, and hydraulics. Surprisingly, drivers often drive with the windows open adding to the noise level. In addition, one driver was asked to interact with the Apple voice assistant, “Siri”
and was able to perform 4 out of 5 tasks. The driver was also able to recognize speech instructions from Siri.
Touch Interface: Through driver interviews the team found that the users were receptive to using a touch interface. However, the drivers expressed concern that the buttons be large and easy to read. Some drivers normally use reading glasses but will not be able to constantly take reading glasses off and on as they drive. The drivers on the large 8 and 10 ton trucks were observed to use one hand to steer and the other hand is often available to interact with the device. However, drivers on the smaller pickup style trucks are continuously controlling the salt flow with one hand and therefore have more limited ability to interact with a device.
Space Considerations: The team members who observed the larger trucks found that there was plenty of room for a tablet device to be mounted within arm’s reach of the driver without obstructing the field of view. Team members who observed the pickup trucks found that space was more constrained and that care would have to be taken to mount a device so as not to obstruct the drivers’ field of view.
Other Tasks: Through observations and interviews the team noted that the drivers must record the start and stop times and mileage for their routes, as well as the time at which salt was applied to the roads and how much salt was used.
Overall Driver Feedback: Drivers seemed very receptive to using an app. They feel that an app could reduce their paperwork as well as make their jobs more efficient. Many drivers expressed frustration with the older routes. This positive feedback was encouraging to the development team and illustrated several value drivers for the end user. Some drivers also expressed interest in fewer instructions. Instead of being told to plow certain streets in order, some drivers would prefer to be given an area to clear as they see fit. Drivers also expressed interest in weather information as some currently use their personal phones to check the forecast. The drivers are also interested in road information such as steep hills, road plates, or potholes.
Privacy Concerns: Several drivers expressed interest in public facing information such as predictions of when drivers’ streets will be cleared. However, one driver expressed privacy concerns. He felt that anonymous information about the location of a truck was fine but did not want personal identifiable information shared with the general public.
Special Tasks: Driver occasionally receive special tasks via VHF radio. These tasks are often requests from the public or emergency personnel. Some drivers report that they will use their personal phones to get directions to the task location.
Salt Monitoring: Drivers have to monitor the salt level in their trucks. On the larger trucks, the driver can observe the salt spray from the spreader using side-‐-‐-‐view mirrors. These trucks also have hydraulically lifted beds. When the driver observes that salt is no longer flowing, he will slow and lift the bed to slide salt to the back of the bed where the spreader is located. In smaller trucks the driver feels the car height and stops to check the salt level.
Technology and Architecture Selection Determining that the city is planning to purchase tablets for this purpose allowed the team to focus development on one platform. Through discussions with the drivers it was determined that the larger screen size of a tablet is a crucial benefit over phones. The team decided for a full sized tablet to allow for larger buttons and text making it easier for drivers to interact with the tablet at a glance. However, a 7” tablet option may be explored at a later time if space proves to be too restricted in the smaller trucks.
The team decided early on to develop the app to run natively on the Android operating system. The native app decision was made in order to improve performance as lag times could result in information not being presented in time for a driver to take a turn or perform an action. In addition, any issues with slow performance, especially around rendering maps, could make the drivers less likely to adopt the app.
Android OS was chosen both for its ease of use for developers as well as for financial consideration. Android tablets are more cost effective than iOS devices. The larger number of suppliers is viewed as an advantage when considering government acquisitions.
The development team worked with Professors Smith and Rubinstein to make architecture decisions. It was quickly determined that the eventual routing algorithm would be hosted on a server due to computational complexity and the need to manage several trucks at once. The development team also agreed early on to use map, weather, and voice/speech APIs as these would remove much of the more difficult development tasks.
Identifying Functionality Requirements Functional requirements were defined through interviews and observations described above. A list of initial requirements is presented below:
Route Information: The app must display information about the route to the drivers. At a minimum this must be an overhead view of the route overlaid on a map of city streets
Tracking Information: In order to add value to the drivers the app must track locational information to show snow removal status and remove paperwork requirements.
Routing to Fuel and Salt Depots: The app must provide a way for drivers to interrupt their routes to return to a depot for a fuel or salt refill.
Weather Information: Providing weather information is a value addition for drivers, which will encourage adoption
Requirements for full product functionality are listed below:
Multiple Routes: The app must have some way of storing or receiving routes. These routes can either be static, or be continuously updated by a dynamic routing algorithm.
Supervisor’s Interface: The supervisor must have the ability to assign routes to drivers. The supervisor must also be able to monitor snow removal progress.
Status Monitoring: The app must be able to receive truck status information such as fuel and salt levels as well as plow and spreader status.
Interface Options: The driver must have the ability to interact with the app in multiple ways depending on the situation. The app must be touch enabled as well as have voice and speech capabilities.
Cost Estimates & Refining Options A full routing system involves many interrelated systems from a dynamic routing algorithm, which will have performance requirements to fuel, salt, spreader, and plow sensors installed on the trucks, as well as web hosting for public facing interfaces. Most of these expenses are outside of the scope of this project, which currently is focused primarily on the app development.
Instead, cost estimates focused on the hardware costs of the tablet. A market survey found that tablets with a 9-‐-‐-‐10” screen and GPS functionality run between $200 and $500 (Tablet Reviews, n.d.). Data will also be a key expense for this program. However, most providers do not list business data prices and it is outside the scope of this project to begin negotiating service plans. For a point of reference, suitable consumer data plans range between $10 and $50.
Use Cases In order to conceptualize the use of this product and to understand the different interactions between the app and the user, the development team created a series of use cases. These are based off of interviews described above and internal team discussions. Some use cases will be part of phase 1 product while others will be delayed until future phases. The use cases are described below, for the full use cases see Appendix: Use Cases.
UC 101: Driver Starts Shift – The driver begins the shift, enters personal and truck information and receives a route.
UC 150: Driver Proceeds to Route – The driver is guided to the start of the route
UC 200: Driver Begins Plowing – Driver engages in plowing
UC 250: Driver Begins Salting – Driver spreads salt on route
UC 270: Driver Deadheads to New Location – Driver proceeds to a new location without engaging in snow removal activities
UC 300: Driver Encounters Obstacle – Driver encounters an obstacle that impedes snow removal activities and logs information
UC 400: Driver Needs Salt Fill – The driver runs out of salt and is routed to a salt depot
UC 450: Driver Needs Fuel – The driver runs low on fuel and is routed to a fuel depot
UC 500: Priority Assignment – The driver receives a special task and is given relevant information
UC 550: Driver Receives New Route – The driver receives a route and is asked to confirm
UC 600: Driver Finishes Route – The driver completes a route and is directed to vehicle depot or receives a new route
UC 650: Driver Ends Shift – The driver’s shift ends and the app prepares shift reports for supervisor
Early Evaluation In order to validate our design assumptions we drafted a paper prototype and conducted a trial with the 3rd division drivers. The drivers were shown prototypes for an overhead view of the route, status monitoring, salt and fuel refills, as well as a notification system, see Appendix: Paper Prototype.
The overall feedback was positive, however the drivers reiterated their desire for turn-‐-‐-‐by-‐-‐-‐turn directions. Many drivers felt that the system shown in the prototype would be a marginal improvement over the current situation. Drivers were very encouraged to see a route tracking feature that would reduce their paperwork requirements.
The drivers also voiced some concerns. The route overview in the prototype was simplistic and many drivers worried that with a full route the overview would be too zoomed out or too cluttered to provide much information. There was some discussion around a map that showed a shaded in outline of the overall route area without showing individual streets. This may be evaluated in later versions. The team has decided that the best fix to this problem is to go to a turn-‐-‐-‐by-‐-‐-‐turn interface.
The drivers also gave positive feedback to the interface design. They found the screen text to be informative and where easily able to understand the functionality of each button. They also reacted favorably to the size of the buttons and their locations. The drivers were encouraged that the buttons were at the corners of the screen, away from each other, making it less likely that they would press the wrong button by mistake.
Unfortunately, the team was unable to conduct a more scientific evaluation process. One of the challenges with this project is that user feedback is given in an informal setting in between work shifts. Future efforts will attempt to schedule a time for a more controlled study.
Prototype Refinement The team is currently in the refinement stage. The key refinement focuses on developing turn-‐-‐-‐by-‐-‐-‐turn directions.
Pilot testing The next phase of the project will focus on turn-‐-‐-‐by-‐-‐-‐turn directions and developing a functioning pilot app. The team plans to observe the drivers’ use of the pilot as they complete a route. Detailed measurements will be taken and after the trial the drivers will be asked to complete a survey. Takeaways from this test will be used to further iterate the app.
Business Model Current work During phase 1 and 2, app development is being done for credit at Carnegie Mellon University. This will allow the development team to provide a proof of concept to the City of Pittsburgh before more funding is required. Meanwhile, the routing algorithm is being developed as part of a Department of Public
Works grant. This grant builds on an existing relationship between the Department of Public Works and the CMU School of Computer Science.
After phase 2 is completed, more intense development will be required to integrate the app with the routing algorithm, sensors on the trucks, and to develop secondary interfaces. The development team anticipates using positive reception from phases 1 and 2 to help secure funding for phase 3.
Future business opportunities At this preliminary stage in a largely grant funded enterprise it is very difficult to develop a reliable business model. Phase 3 will be a key time to gather data on costs and benefits as well as begin negotiations with customers. Information discovered during this phase will be key to developing a precise business model. However, an initial plan of possible options will be useful in long term planning being conducted now. These options are discussed below.
The development team plans to conduct an initial rollout of a routing information system to the 3rd
Division of the Pittsburgh Public Works. During this phase, valuable user reactions will be observed and areas for improvement will be noted. Once the system is viewed as ready for a wider rollout, more business opportunities will be available.
Snow removal is a problem faced by many government bodies, both at the state, county, and municipal level. There is a wide customer base to target with a well-‐-‐-‐designed and valuable product. The development team will use the initial rollout in Pittsburgh to measure increases in coverage and efficiency and corresponding cost savings. This data will be used to determine the product’s value proposition.
There are many business model options for this tool. As the tool is marketed to potential customers, marginal cost drivers will have to be considered. Initial set-‐-‐-‐up costs, such as road mapping and algorithm adaptation may be key drivers. In this case, a business model that obtains most of its revenue from an initial purchase may be warranted. Another key measure will be lifecycle costs. Cost to maintain servers and routes and provide support to users must be measured. These costs will drive a subscription based business model.
Scale is another cost driver that must be measured. During phase 3 the development team will monitor the costs for additional app enabled devices, as well as the computing costs of extra miles of roads. This will help a future business model develop a segmented market approach where smaller municipal customers are provided services at less of a cost than more resource intense customers.
Another possible model would involve tiered service levels. The business could provide customers with a basic level of functionality, such as overhead route information and locational tracking. Other services such as dynamic routing, web interfaces, and use of sensor information could be sold at higher price points. One time static route creation is a service that could be offered at an intermediate tier. Premium users could also be offered functionality such as information sharing between the routing system and public traffic information services such as Waze.
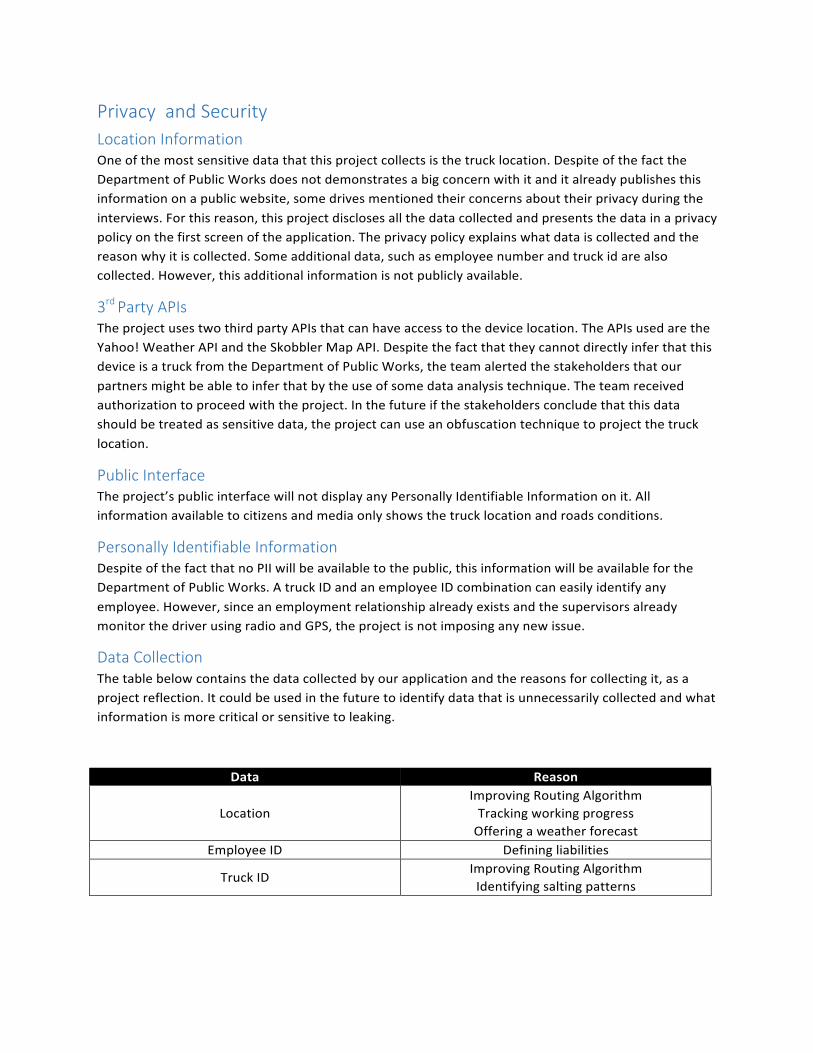
Privacy and Security Location Information One of the most sensitive data that this project collects is the truck location. Despite of the fact the Department of Public Works does not demonstrates a big concern with it and it already publishes this information on a public website, some drives mentioned their concerns about their privacy during the interviews. For this reason, this project discloses all the data collected and presents the data in a privacy policy on the first screen of the application. The privacy policy explains what data is collected and the reason why it is collected. Some additional data, such as employee number and truck id are also collected. However, this additional information is not publicly available.
3rd Party APIs The project uses two third party APIs that can have access to the device location. The APIs used are the Yahoo! Weather API and the Skobbler Map API. Despite the fact that they cannot directly infer that this device is a truck from the Department of Public Works, the team alerted the stakeholders that our partners might be able to infer that by the use of some data analysis technique. The team received authorization to proceed with the project. In the future if the stakeholders conclude that this data should be treated as sensitive data, the project can use an obfuscation technique to project the truck location.
Public Interface The project’s public interface will not display any Personally Identifiable Information on it. All information available to citizens and media only shows the truck location and roads conditions.
Personally Identifiable Information Despite of the fact that no PII will be available to the public, this information will be available for the Department of Public Works. A truck ID and an employee ID combination can easily identify any employee. However, since an employment relationship already exists and the supervisors already monitor the driver using radio and GPS, the project is not imposing any new issue.
Data Collection The table below contains the data collected by our application and the reasons for collecting it, as a project reflection. It could be used in the future to identify data that is unnecessarily collected and what information is more critical or sensitive to leaking.
Data Reason
Location
Improving Routing Algorithm Tracking working progress Offering a weather forecast
Employee ID Defining liabilities
Truck ID Improving Routing Algorithm Identifying salting patterns
Future Work Given the size of this project, the development process was divided into phases. For a description of these phases see Solution: Phase 1 – February 2015, Phase 2 – May 2015, Phase 3 – November 2015. Immediate future work will focus on developing turn-‐-‐-‐by-‐-‐-‐turn directions as well as a functional pilot. This pilot app will likely still be a standalone device with pre-‐-‐-‐loaded routes stored locally. However, the driver interactions will be fully functional and representative of a final product. The team will use this app to get driver feedback before the end of the snow removal season in April.
Feedback from this pilot will inform the remaining work to be performed in the spring semester. In addition, the team will spend time developing a server-‐-‐-‐based solution for route storage. The architecture for this infrastructure will be developed in conjunction with Professors Smith and Rubinstein so that the dynamic routing algorithm can interact with the system and populate routes.
Development tools
a. Balsamiq Mockups b. TRUSTe Privacy Policy Generator c. Motorola Xoom Tablet d. Android Studio e. Github
Conclusion Over the last two months the development team has created a prototype app that provides routing information to snow plow drivers. This app focuses on usability and simplicity while satisfying the requirements of multiple stakeholders. The team worked closely with the City of Pittsburgh’s Department of Public Works to develop use cases and features. In depth interviews and observations were conducted with the Department of Public Works’ 3rd Division Drivers to identify usability issues and gather feedback on prototypes. Future work aims to have a fully functional system ready with dynamic routing for the winter 2015-‐-‐-‐2016 season.
References Batz, B. J. (2005, January 30). Here: In Beechview. Retrieved February 25, 2015, from Pittsburgh Post
Gazette: http://old.post-‐-‐-‐gazette.com/pg/05030/448976.stm
National Weather Service Pittsburgh. (2015, February 25). Pittsburgh Historical Snowfall Totals 1883 to Current. Retrieved from NWS Pittsbugh, PA: http://www.erh.noaa.gov/pbz/thissnow.htm
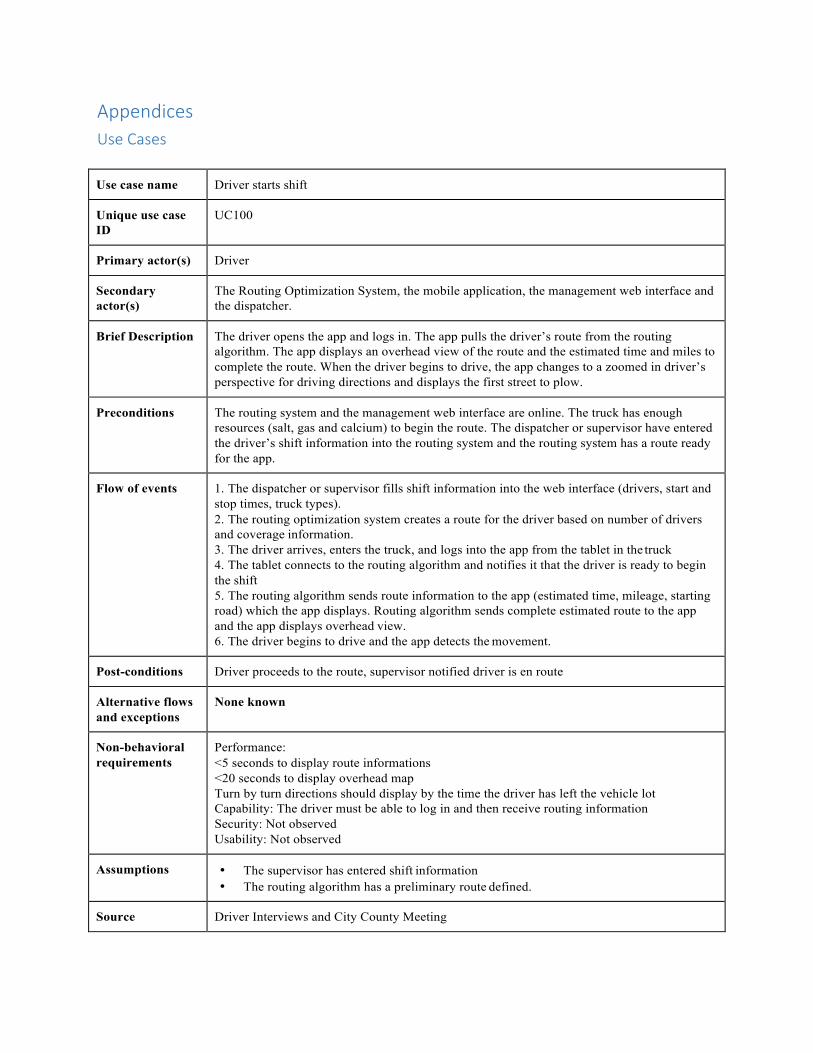
Appendices Use Cases
Use case name Driver starts shift
Unique use case ID
UC100
Primary actor(s) Driver
Secondary actor(s)
The Routing Optimization System, the mobile application, the management web interface and the dispatcher.
Brief Description The driver opens the app and logs in. The app pulls the driver’s route from the routing algorithm. The app displays an overhead view of the route and the estimated time and miles to complete the route. When the driver begins to drive, the app changes to a zoomed in driver’s perspective for driving directions and displays the first street to plow.
Preconditions The routing system and the management web interface are online. The truck has enough resources (salt, gas and calcium) to begin the route. The dispatcher or supervisor have entered the driver’s shift information into the routing system and the routing system has a route ready for the app.
Flow of events 1. The dispatcher or supervisor fills shift information into the web interface (drivers, start and stop times, truck types). 2. The routing optimization system creates a route for the driver based on number of drivers and coverage information. 3. The driver arrives, enters the truck, and logs into the app from the tablet in the truck 4. The tablet connects to the routing algorithm and notifies it that the driver is ready to begin the shift 5. The routing algorithm sends route information to the app (estimated time, mileage, starting road) which the app displays. Routing algorithm sends complete estimated route to the app and the app displays overhead view. 6. The driver begins to drive and the app detects the movement.
Post-conditions Driver proceeds to the route, supervisor notified driver is en route
Alternative flows and exceptions
None known
Non-behavioral requirements
Performance: <5 seconds to display route informations <20 seconds to display overhead map Turn by turn directions should display by the time the driver has left the vehicle lot Capability: The driver must be able to log in and then receive routing information Security: Not observed Usability: Not observed
Assumptions • The supervisor has entered shift information • The routing algorithm has a preliminary route defined.
Source Driver Interviews and City County Meeting
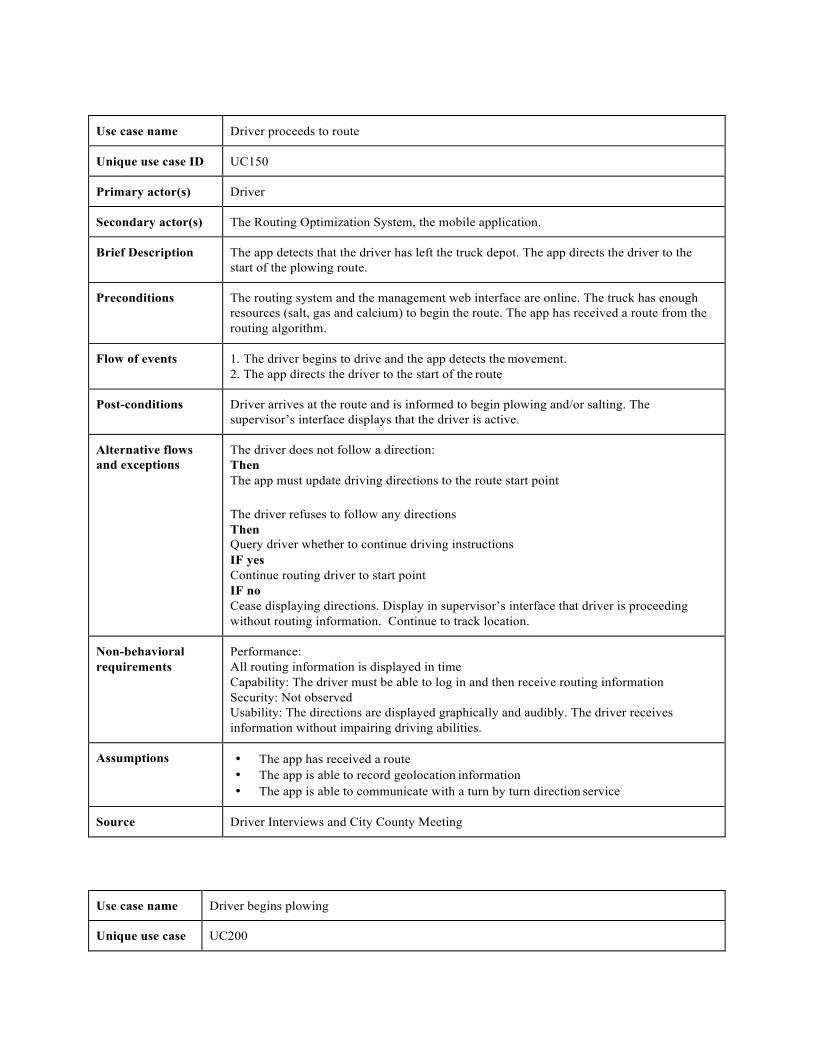
Use case name Driver proceeds to route
Unique use case ID UC150
Primary actor(s) Driver
Secondary actor(s) The Routing Optimization System, the mobile application.
Brief Description The app detects that the driver has left the truck depot. The app directs the driver to the start of the plowing route.
Preconditions The routing system and the management web interface are online. The truck has enough resources (salt, gas and calcium) to begin the route. The app has received a route from the routing algorithm.
Flow of events 1. The driver begins to drive and the app detects the movement. 2. The app directs the driver to the start of the route
Post-conditions Driver arrives at the route and is informed to begin plowing and/or salting. The supervisor’s interface displays that the driver is active.
Alternative flows and exceptions
The driver does not follow a direction: Then The app must update driving directions to the route start point
The driver refuses to follow any directions Then Query driver whether to continue driving instructions IF yes Continue routing driver to start point IF no Cease displaying directions. Display in supervisor’s interface that driver is proceeding without routing information. Continue to track location.
Non-behavioral requirements
Performance: All routing information is displayed in time Capability: The driver must be able to log in and then receive routing information Security: Not observed Usability: The directions are displayed graphically and audibly. The driver receives information without impairing driving abilities.
Assumptions • The app has received a route • The app is able to record geolocation information • The app is able to communicate with a turn by turn direction service
Source Driver Interviews and City County Meeting
Use case name Driver begins plowing
Unique use case UC200
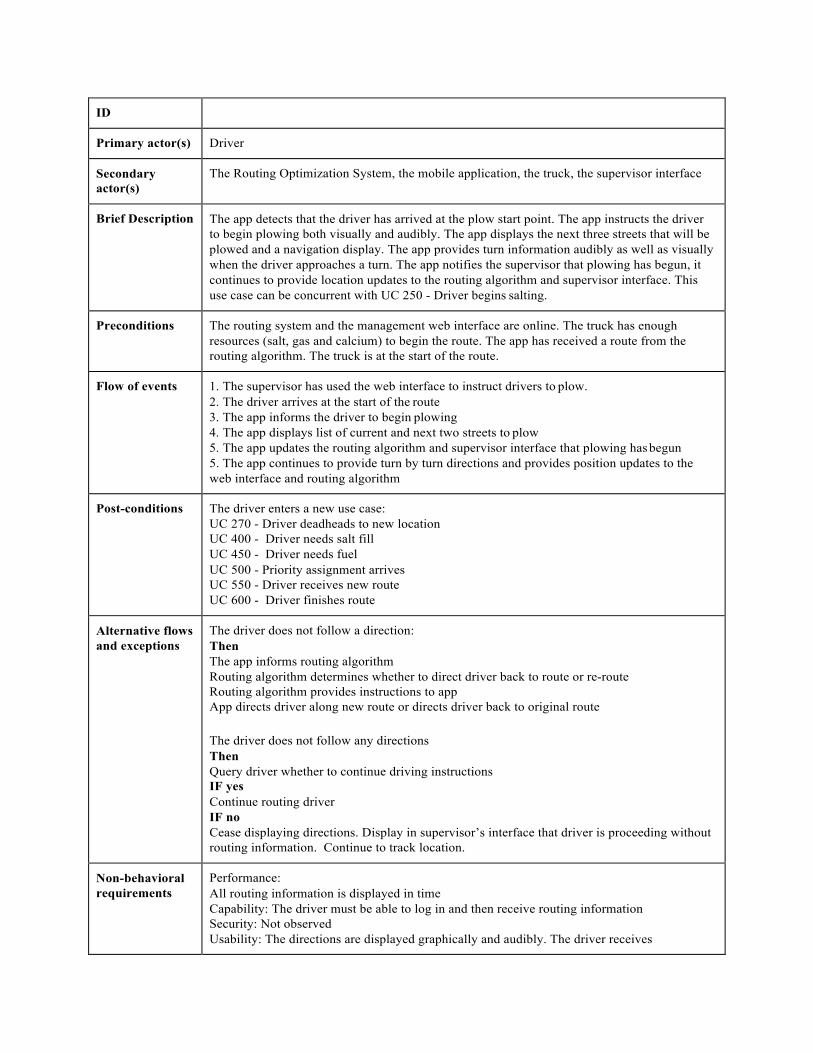
ID
Primary actor(s) Driver
Secondary actor(s)
The Routing Optimization System, the mobile application, the truck, the supervisor interface
Brief Description The app detects that the driver has arrived at the plow start point. The app instructs the driver to begin plowing both visually and audibly. The app displays the next three streets that will be plowed and a navigation display. The app provides turn information audibly as well as visually when the driver approaches a turn. The app notifies the supervisor that plowing has begun, it continues to provide location updates to the routing algorithm and supervisor interface. This use case can be concurrent with UC 250 - Driver begins salting.
Preconditions The routing system and the management web interface are online. The truck has enough resources (salt, gas and calcium) to begin the route. The app has received a route from the routing algorithm. The truck is at the start of the route.
Flow of events 1. The supervisor has used the web interface to instruct drivers to plow. 2. The driver arrives at the start of the route 3. The app informs the driver to begin plowing 4. The app displays list of current and next two streets to plow 5. The app updates the routing algorithm and supervisor interface that plowing has begun 5. The app continues to provide turn by turn directions and provides position updates to the web interface and routing algorithm
Post-conditions The driver enters a new use case: UC 270 - Driver deadheads to new location UC 400 - Driver needs salt fill UC 450 - Driver needs fuel UC 500 - Priority assignment arrives UC 550 - Driver receives new route UC 600 - Driver finishes route
Alternative flows and exceptions
The driver does not follow a direction: Then The app informs routing algorithm Routing algorithm determines whether to direct driver back to route or re-route Routing algorithm provides instructions to app App directs driver along new route or directs driver back to original route
The driver does not follow any directions Then Query driver whether to continue driving instructions IF yes Continue routing driver IF no Cease displaying directions. Display in supervisor’s interface that driver is proceeding without routing information. Continue to track location.
Non-behavioral requirements
Performance: All routing information is displayed in time Capability: The driver must be able to log in and then receive routing information Security: Not observed Usability: The directions are displayed graphically and audibly. The driver receives
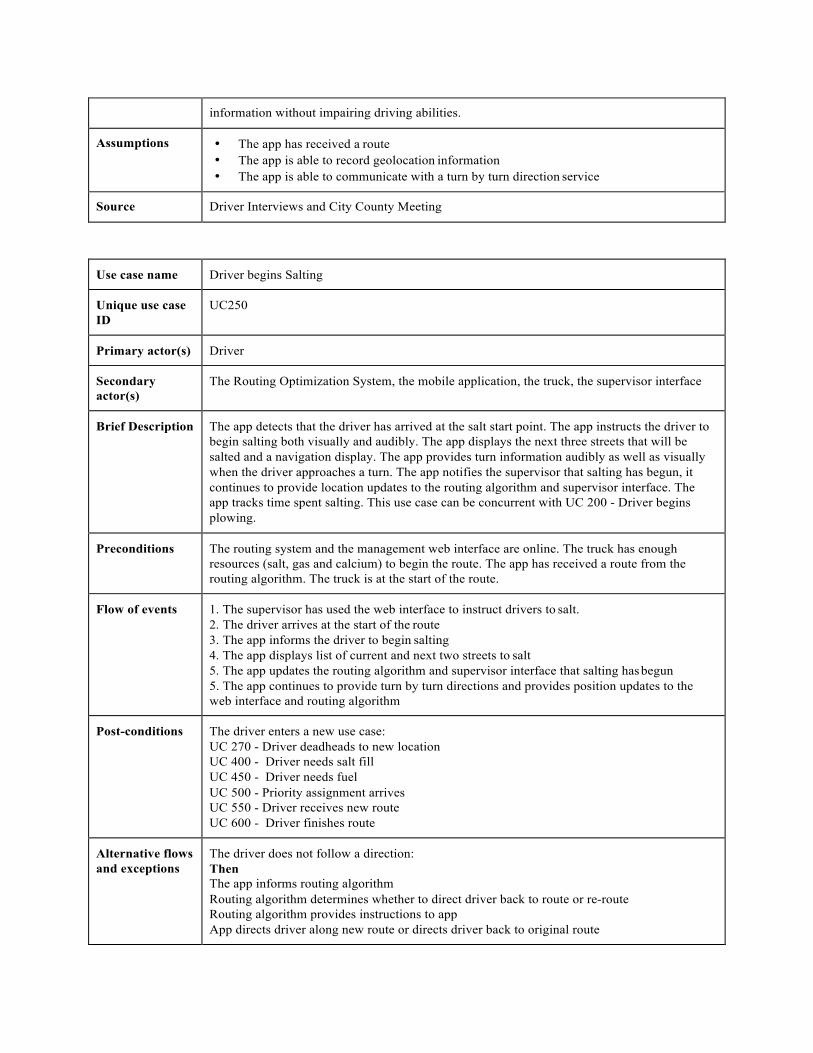
information without impairing driving abilities.
Assumptions • The app has received a route • The app is able to record geolocation information • The app is able to communicate with a turn by turn direction service
Source Driver Interviews and City County Meeting
Use case name Driver begins Salting
Unique use case ID
UC250
Primary actor(s) Driver
Secondary actor(s)
The Routing Optimization System, the mobile application, the truck, the supervisor interface
Brief Description The app detects that the driver has arrived at the salt start point. The app instructs the driver to begin salting both visually and audibly. The app displays the next three streets that will be salted and a navigation display. The app provides turn information audibly as well as visually when the driver approaches a turn. The app notifies the supervisor that salting has begun, it continues to provide location updates to the routing algorithm and supervisor interface. The app tracks time spent salting. This use case can be concurrent with UC 200 - Driver begins plowing.
Preconditions The routing system and the management web interface are online. The truck has enough resources (salt, gas and calcium) to begin the route. The app has received a route from the routing algorithm. The truck is at the start of the route.
Flow of events 1. The supervisor has used the web interface to instruct drivers to salt. 2. The driver arrives at the start of the route 3. The app informs the driver to begin salting 4. The app displays list of current and next two streets to salt 5. The app updates the routing algorithm and supervisor interface that salting has begun 5. The app continues to provide turn by turn directions and provides position updates to the web interface and routing algorithm
Post-conditions The driver enters a new use case: UC 270 - Driver deadheads to new location UC 400 - Driver needs salt fill UC 450 - Driver needs fuel UC 500 - Priority assignment arrives UC 550 - Driver receives new route UC 600 - Driver finishes route
Alternative flows and exceptions
The driver does not follow a direction: Then The app informs routing algorithm Routing algorithm determines whether to direct driver back to route or re-route Routing algorithm provides instructions to app App directs driver along new route or directs driver back to original route
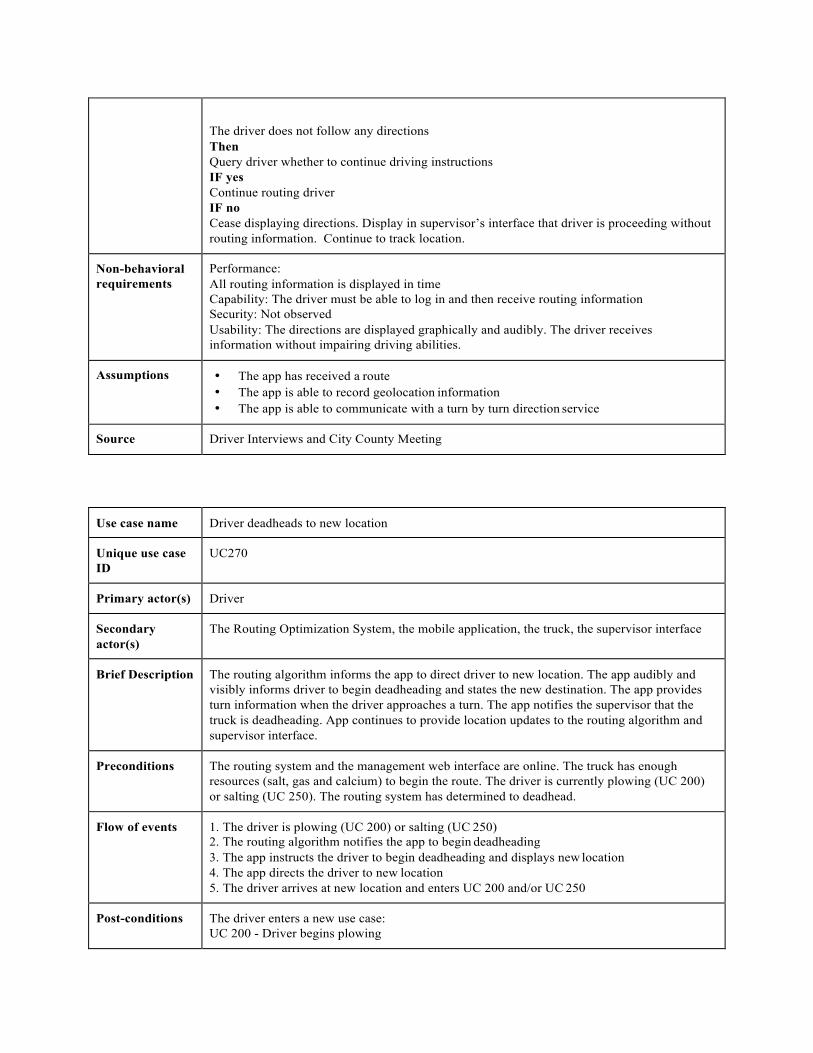
The driver does not follow any directions Then Query driver whether to continue driving instructions IF yes Continue routing driver IF no Cease displaying directions. Display in supervisor’s interface that driver is proceeding without routing information. Continue to track location.
Non-behavioral requirements
Performance: All routing information is displayed in time Capability: The driver must be able to log in and then receive routing information Security: Not observed Usability: The directions are displayed graphically and audibly. The driver receives information without impairing driving abilities.
Assumptions • The app has received a route • The app is able to record geolocation information • The app is able to communicate with a turn by turn direction service
Source Driver Interviews and City County Meeting
Use case name Driver deadheads to new location
Unique use case ID
UC270
Primary actor(s) Driver
Secondary actor(s)
The Routing Optimization System, the mobile application, the truck, the supervisor interface
Brief Description The routing algorithm informs the app to direct driver to new location. The app audibly and visibly informs driver to begin deadheading and states the new destination. The app provides turn information when the driver approaches a turn. The app notifies the supervisor that the truck is deadheading. App continues to provide location updates to the routing algorithm and supervisor interface.
Preconditions The routing system and the management web interface are online. The truck has enough resources (salt, gas and calcium) to begin the route. The driver is currently plowing (UC 200) or salting (UC 250). The routing system has determined to deadhead.
Flow of events 1. The driver is plowing (UC 200) or salting (UC 250) 2. The routing algorithm notifies the app to begin deadheading 3. The app instructs the driver to begin deadheading and displays new location 4. The app directs the driver to new location 5. The driver arrives at new location and enters UC 200 and/or UC 250
Post-conditions The driver enters a new use case: UC 200 - Driver begins plowing
UC 250 - Driver begins salting UC 450 - Driver needs fuel UC 500 - Priority assignment arrives UC 550 - Driver receives new route UC 600 - Driver finishes route
Alternative flows and exceptions
The driver does not follow a direction: Then The app must update driving directions to the new start point
The driver refuses to follow any directions Then Query driver whether to continue driving instructions IF yes Continue routing driver to new start point IF no Cease displaying directions. Display in supervisor’s interface that driver is proceeding without routing information. Continue to track location.
Non-behavioral requirements
Performance: All routing information is displayed in time Capability: The driver must be able to log in and then receive routing information Security: Not observed Usability: The directions are displayed graphically and audibly. The driver receives information without impairing driving abilities.
Assumptions • The app has received a route • The app is able to record geolocation information • The app is able to communicate with a turn by turn direction service
Source Driver Interviews and City County Meeting
Use case name Driver encounters obstruction
Unique use case ID
UC300
Primary actor(s) Driver
Secondary actor(s)
The Routing Optimization System, the mobile application, the truck, the supervisor interface
Brief Description While plowing, salting or en route, the driver encounters an obstruction causing a diversion from route. The driver manually or using voice activation informs the app that there is an obstacle. The app queries the driver if the obstacle is passable from the other direction, passable with a smaller vehicle, or impassible. The app confirms the information with the driver (i.e. “Obstruction on Negley Ave. between Howe and Walnut, passable with smaller vehicle. Is this correct?”).. The app informs the supervisor interface and routing algorithm and the algorithm decides how to re-route the driver.
Preconditions The routing system and the management web interface are online. The truck has enough resources (salt, gas and calcium) to begin the route. The driver is currently on the way to a
route (UC 150), plowing (UC 200), salting (UC 250), or deadheading (UC 270)
Flow of events 1. The driver is in UC 150, UC 200, UC 250, or UC 270 2. The driver inputs an obstruction 3. The app determines location where driver made diversion 4. The app queries the driver about details of obstruction 5. The app asks the driver to confirm obstruction information 6. The app informs routing algorithm and supervisor interface about the obstacle 7. Routing algorithm determines best course of action 8. The app receives course of action and continues routing driver
Post-conditions The driver continues previous use case: UC 150 - Driver proceeds to route UC 200 - Driver begins plowing UC 250 - Driver begins salting UC 270 - Driver deadheads
Alternative flows and exceptions
The driver can respond to obstacle information prompt by instructing app to continue providing directions. App informs routing algorithm of possible obstruction and continues routing driver.
The driver does not respond to requests for obstacle information. The app continues to display input options overlayed on the routing directions until information is input or the driver chooses to continue with routing.
The driver responds negatively to confirmation prompt. The app queries whether to change obstacle type or location. IF obstacle type Re-prompt for obstacle type and confirm entire obstacle information If location Display map of recent location and prompt driver to tap location then confirm entire obstacle information
Non-behavioral requirements
Performance: All routing information is displayed in time Capability: The app must track obstacles Security: Not observed Usability: The driver is able to input information without impairing driving abilities (stopping driving temporarily may be required).
Assumptions • The app is able to record geolocation information • The app is able to communicate with the routing algorithm
Source Driver Interviews and City County Meeting
Use case name Driver needs salt fill
Unique use case ID
UC400
Primary actor(s) Driver
Secondary actor(s)
The Routing Optimization System, the mobile application, the truck, the supervisor interface
Brief Description While plowing, salting or en route, the driver determines that salt is low. The driver manually or using voice activation informs the app that more salt is needed. The app informs the routing algorithm and supervisor interface. The routing algorithm determines the best route back to the salt location and the app provides directions. When the driver arrives at the salt location the routing algorithm will determine a new route. When the driver leaves salt location, the app will enter UC 150.
Preconditions The routing system and the management web interface are online. The driver is currently plowing (UC 200), salting (UC 250), or deadheading (UC 270). The driver determines more salt is needed.
Flow of events 1. The driver informs app of salt need 2. The app informs the routing algorithm and supervisor interface 3. The routing algorithm provides a route to salt depot 4. The app directs driver to depot 5. Driver receives salt load
Post-conditions The driver enters a new use case: UC 150 - Driver proceeds to route
Alternative flows and exceptions
The driver does not follow a direction: Then The app must update driving directions to the salt depot
The driver refuses to follow any directions Then Query driver whether to continue driving instructions IF yes Continue routing driver to salt depot IF no Cease displaying directions. Display in supervisor’s interface that driver is proceeding without routing information. Continue to track location.
Non-behavioral requirements
Performance: All routing information is displayed in time The app is able to display route back to salt depot within 10 seconds Capability: The driver must be routed back to salt depot Security: Not observed Usability: The directions are displayed graphically and audibly. The driver receives and inputs information without impairing driving abilities.
Assumptions • The app is able to record geolocation information • The app is able to communicate with a turn by turn direction service
Source Driver Interviews and City County Meeting
Use case name Driver needs fuel
Unique use case ID
UC450
Primary actor(s) Driver
Secondary actor(s)
The Routing Optimization System, the mobile application, the truck, the supervisor interface
Brief Description While plowing, salting or en route, the driver determines that fuel is low. The driver manually or using voice activation informs the app that more fuel is needed. The app knows the type of vehicle and the fuel type required. The app informs the routing algorithm and supervisor interface. The routing algorithm determines the best route back to the fuellocation and the app provides directions. When the driver arrives at the fuel location the routing algorithm will determine a new route. When the driver leaves salt location, the app will enter UC 150. The app logs mileage since last fuel fill.
Preconditions The routing system and the management web interface are online. The driver is currently plowing (UC 200), salting (UC 250), or deadheading (UC 270). The driver determines more fuel is needed.
Flow of events 1. The driver informs app of fuel need 2. The app informs the routing algorithm and supervisor interface 3. The routing algorithm provides a route to appropriate fueling location 4. The app directs driver to fuel location 5. Driver receives fuel
Post-conditions The driver enters a new use case: UC 150 - Driver proceeds to route
Alternative flows and exceptions
The driver does not follow a direction: Then The app must update driving directions to the salt depot
The driver refuses to follow any directions Then Query driver whether to continue driving instructions IF yes Continue routing driver to salt depot IF no Cease displaying directions. Display in supervisor’s interface that driver is proceeding without routing information. Continue to track location.
Non-behavioral requirements
Performance: All routing information is displayed in time The app is able to display route back to fueling location within 10 seconds Capability: The driver must be routed back to fueling location Security: Not observed Usability: The directions are displayed graphically and audibly. The driver receives and inputs information without impairing driving abilities.
Assumptions • The app is able to record geolocation information • The app is able to communicate with a turn by turn direction service
Source Driver Interviews and City County Meeting
Use case name Priority Assignment
Unique use case ID
UC500
Primary actor(s) Driver
Secondary actor(s)
The Routing Optimization System, the mobile application, the management web interface and the dispatcher.
Brief Description The dispatcher creates an assignment. The routing optimization algorithm selects the the nearest suitable truck. The driver of the selected truck receives a notification on this mobile application. The application directs the driver to the assignment. The driver reports the assignment status using the mobile application. The dispatcher and the supervisor monitor the assignment in a management web interface.
Preconditions The driver is logged-in to the mobile application. The routing system and the management web interface are online. The truck has enough resources (salt, gas and calcium) to perform this task. The dispatcher has an assignment
Flow of events 1. The dispatcher fills all assignment metadata on the web interface. 2. The dispatcher register an assignment on the web interface. 3. The routing optimization system schedules the assignment for a driver based on system constraints. 4. The driver receives the notification about that assignment on the mobile application. 5. The mobile application displays enough data about the notification for the driver to accept or deny it. 6. If the driver accepts the assignment
Then, the mobile application shows directions and notifies the routing optimization system that this assignment is in progress.
Else, the mobile application notifies the routing optimization that the driver is temporarily not able to accomplish the task. 7. The web management interface updates the assignments dashboard. 8. The driver follows the mobile application instructions to the assignment location. 9.. If the driver cannot execute the task for any reason
Then, he reports it to the dispatcher and waits for instructions. The dispatcher and the driver must agree on the assignment status. The driver must register the assignment status.
Else, the driver registers the assignment status as complete. 10. The routing algorithm determines next action for driver and app routes driver to appropriate location.
Post-conditions Attended assignment. Driver enters UC 150.
Alternative flows and exceptions
If the dispatcher registers a wrong assignment on the system Then, he should be able to delete it. When an assignment is deleted, the routing system should notify the mobile
application. The mobile application must cancel the assignment and guarantee the driver saw it.
Non-behavioral Performance:
requirements -The mobile application should receive the assignment in real-time. - 5 minutes average between the routing system finds the appropriated driver for that task and the mobile application displays the notification for the driver. Capability: The driver must finish assignment, before start a new one. Security: Not observed Usability: Not observed
Assumptions • The supervisor receives complaints about road conditions and then contacts the local dispatcher responsible for that region.
• There is no secrecy about assignment between drivers, dispatcher and supervisors. • The truck location is public.
Source Driver Interviews and City County Meeting
Use case name Driver receives new route
Unique use case ID UC550
Primary actor(s) Driver
Secondary actor(s) The Routing Optimization System, the mobile application.
Brief Description The routing optimization system pushes a new route to the app. The app notifies the driver and routes the driver to the new route.
Preconditions The routing system and the management web interface are online. The truck has enough resources (salt, gas and calcium) to begin the route. The app has received a route from the routing algorithm.
Flow of events 1. Supervisor or routing algorithm determine need to change driver’s route 2. The routing algorithm pushes new route information to the driver 3. The app alerts the driver to the change and specifies whether to deadhead or continue plowing/salting 4. The app directs the driver to the start of the new route
Post-conditions Driver arrives at the route and is informed to begin plowing and/or salting. The supervisor’s interface displays that the driver is active.
Alternative flows and exceptions
The driver does not follow a direction: Then The app must update driving directions to the route start point
The driver refuses to follow any directions Then Query driver whether to continue driving instructions IF yes Continue routing driver to start point IF no Cease displaying directions. Display in supervisor’s interface that driver is proceeding without routing information. Continue to track location.
Non-behavioral requirements
Performance: All routing information is displayed in time Capability: The driver must be able to log in and then receive routing information Security: Not observed Usability: The directions are displayed graphically and audibly. The driver receives information without impairing driving abilities.
Assumptions • The app has received a route • The app is able to record geolocation information • The app is able to communicate with a turn by turn direction service
Source Driver Interviews and City County Meeting
Use case name Driver finishes route
Unique use case ID UC600
Primary actor(s) Driver
Secondary actor(s) The Routing Optimization System, the mobile application, the truck, the supervisor interface
Brief Description The driver completes a route. The routing algorithm either begins a new route or returns the driver to depot.
Preconditions The routing system and the management web interface are online. The driver has completed a route
Flow of events 1. The app and routing algorithm determine the route has ended 2. The routing algorithm determines whether to initiate new route or return the driver to depot 3. The driver receives new route (UC 550) or is directed back to depot
Post-conditions The driver enters a new use case: UC 550 - Driver proceeds to route UC 650 - Driver finishes shift
Alternative flows and exceptions
The driver does not follow a direction: Then The app must update driving directions to the salt depot
The driver refuses to follow any directions Then Query driver whether to continue driving instructions IF yes Continue routing driver to salt depot IF no Cease displaying directions. Display in supervisor’s interface that driver is proceeding without routing information. Continue to track location.
Non-behavioral requirements
Performance: All routing information is displayed in time
The app is able to display route back to depot within 10 seconds Capability: The driver must be routed back to depot Security: Not observed Usability: The directions are displayed graphically and audibly. The driver receives and inputs information without impairing driving abilities.
Assumptions • The app is able to record geolocation information • The app is able to communicate with a turn by turn direction service
Source Driver Interviews and City County Meeting
Use case name Driver ends shift
Unique use case ID UC650
Primary actor(s) Driver
Secondary actor(s) The Routing Optimization System, the mobile application, the management web interface and the dispatcher.
Brief Description The driver returns to base and ends shift. A shift report is generated.
Preconditions The routing system and the management web interface are online. The truck has returned to base.
Flow of events 1. The driver arrives at base and informs the app the shift has ended 2. The app notifies the routing algorithm that the current driver is no longer available 3. The app pulls route covered information from routing algorithm 4. The app displays shift report to driver 5. Driver is prompted for notes and enters any if applicable 6. The app sends report to supervisor
Post-conditions The app is in standby mode until the next shift.
Alternative flows and exceptions
None known
Non-behavioral requirements
Performance: <30 seconds to generate report Capability: Generates accurate report and disseminates appropriately. Closes session. Security: Not observed Usability: Driver can input notes into report
Assumptions • The routing algorithm will present necessary report information to the app
Source Driver Interviews and City County Meeting
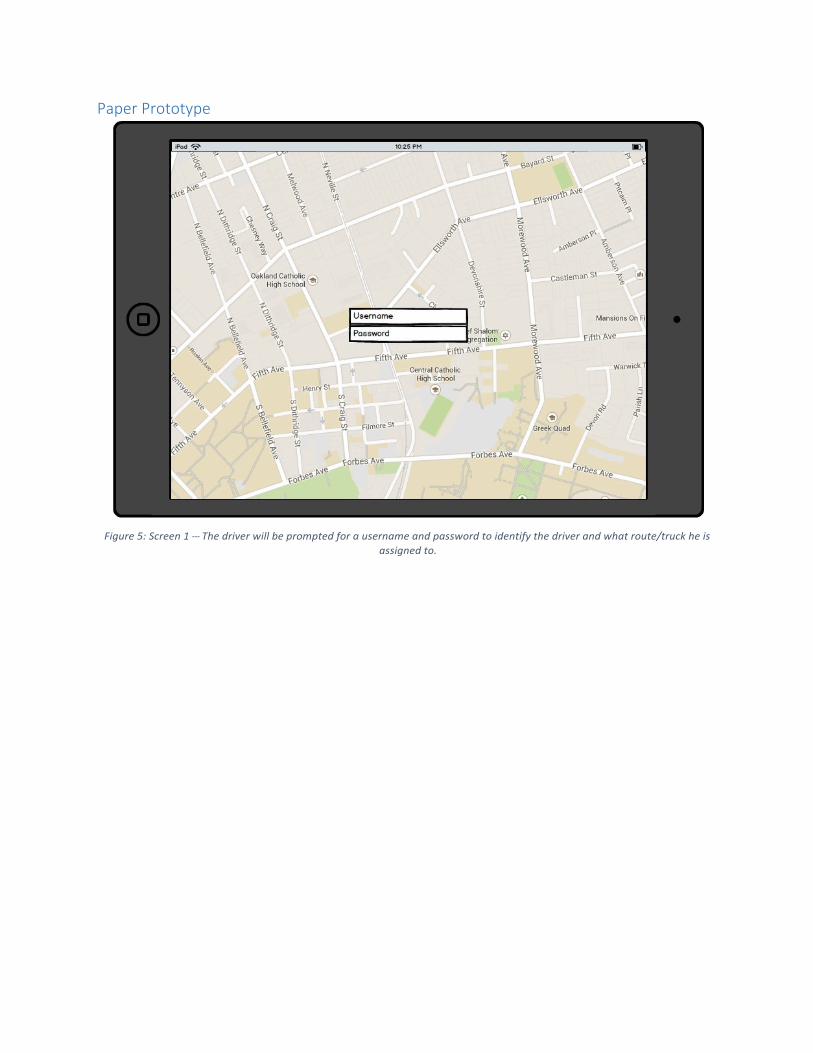
Paper Prototype
Figure 5: Screen 1 -‐-‐-‐ The driver will be prompted for a username and password to identify the driver and what route/truck he is assigned to.
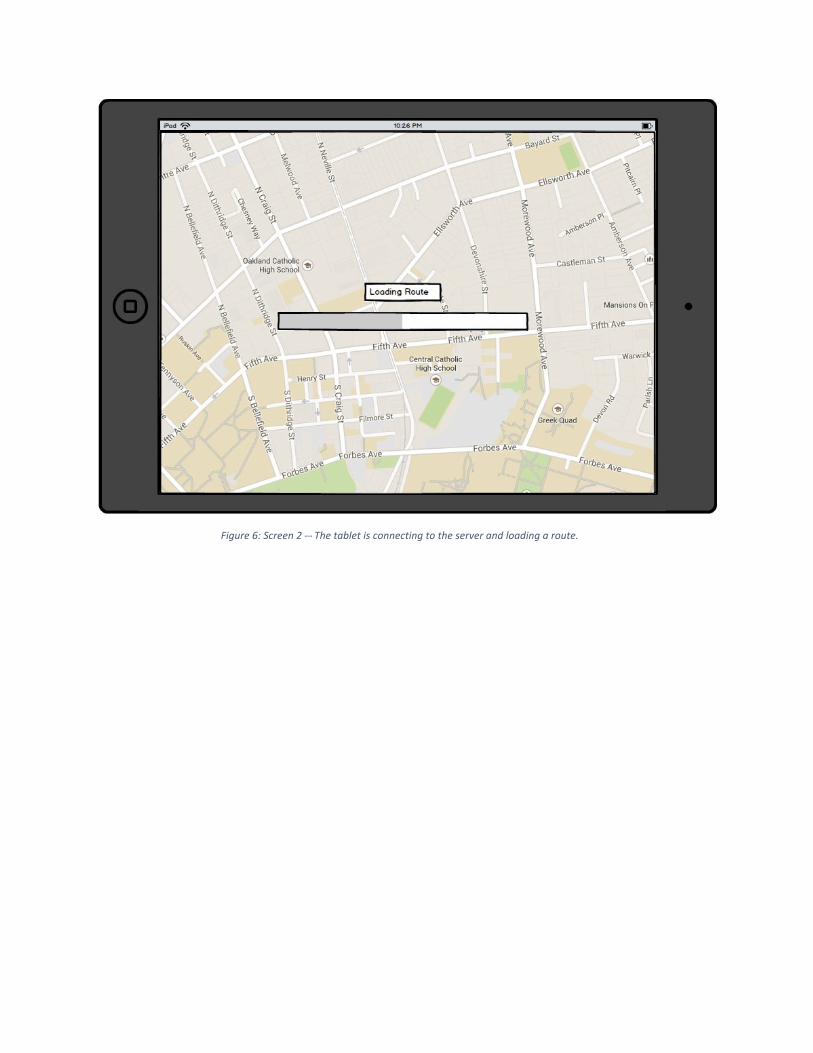
Figure 6: Screen 2 -‐-‐-‐ The tablet is connecting to the server and loading a route.
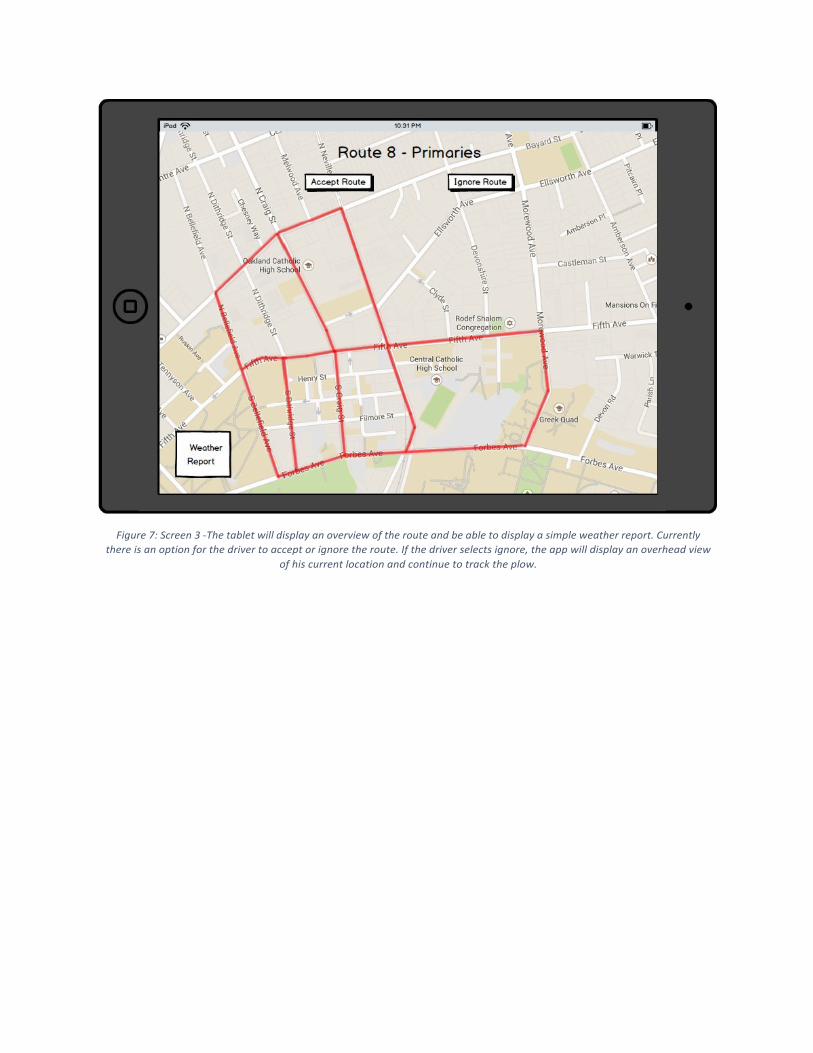
Figure 7: Screen 3 -‐-‐-‐The tablet will display an overview of the route and be able to display a simple weather report. Currently there is an option for the driver to accept or ignore the route. If the driver selects ignore, the app will display an overhead view
of his current location and continue to track the plow.
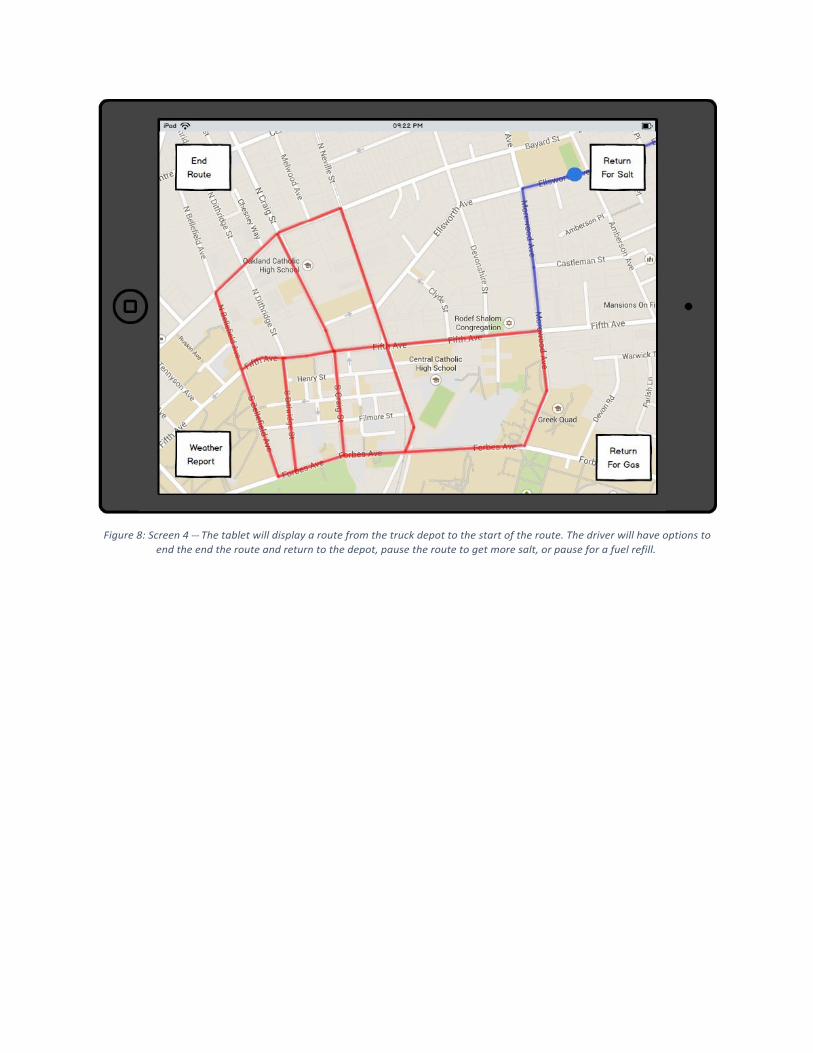
Figure 8: Screen 4 -‐-‐-‐ The tablet will display a route from the truck depot to the start of the route. The driver will have options to end the end the route and return to the depot, pause the route to get more salt, or pause for a fuel refill.
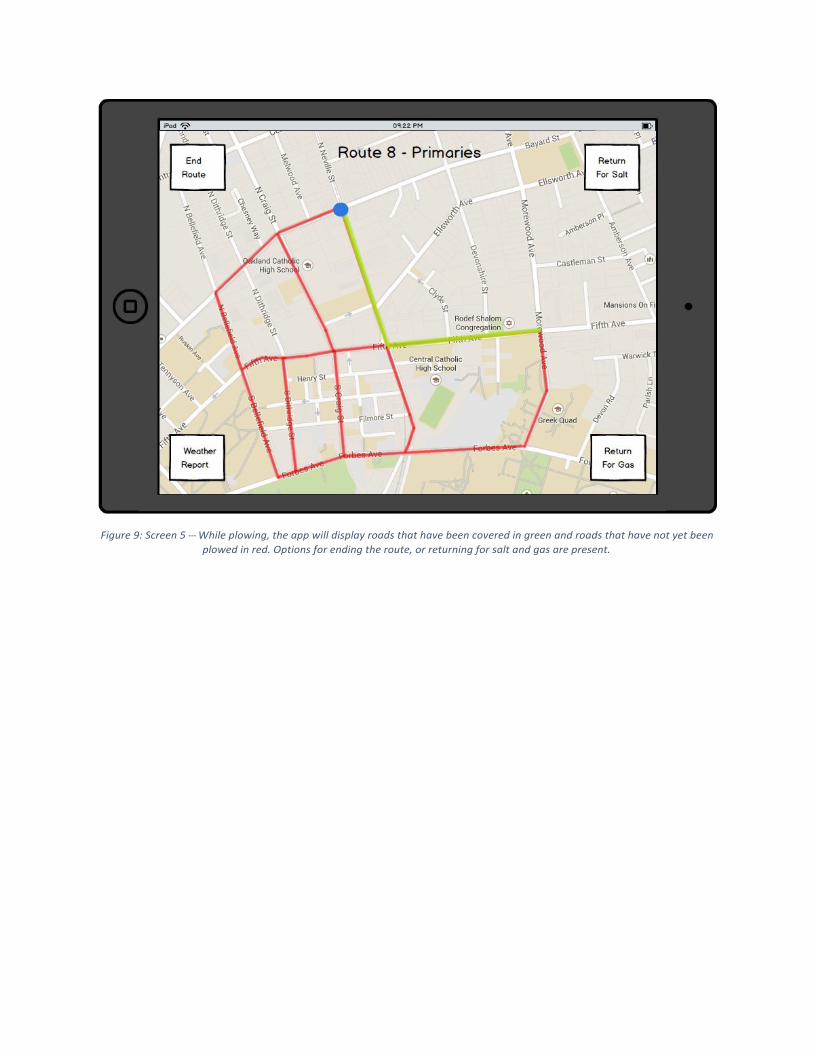
Figure 9: Screen 5 -‐-‐-‐ While plowing, the app will display roads that have been covered in green and roads that have not yet been plowed in red. Options for ending the route, or returning for salt and gas are present.
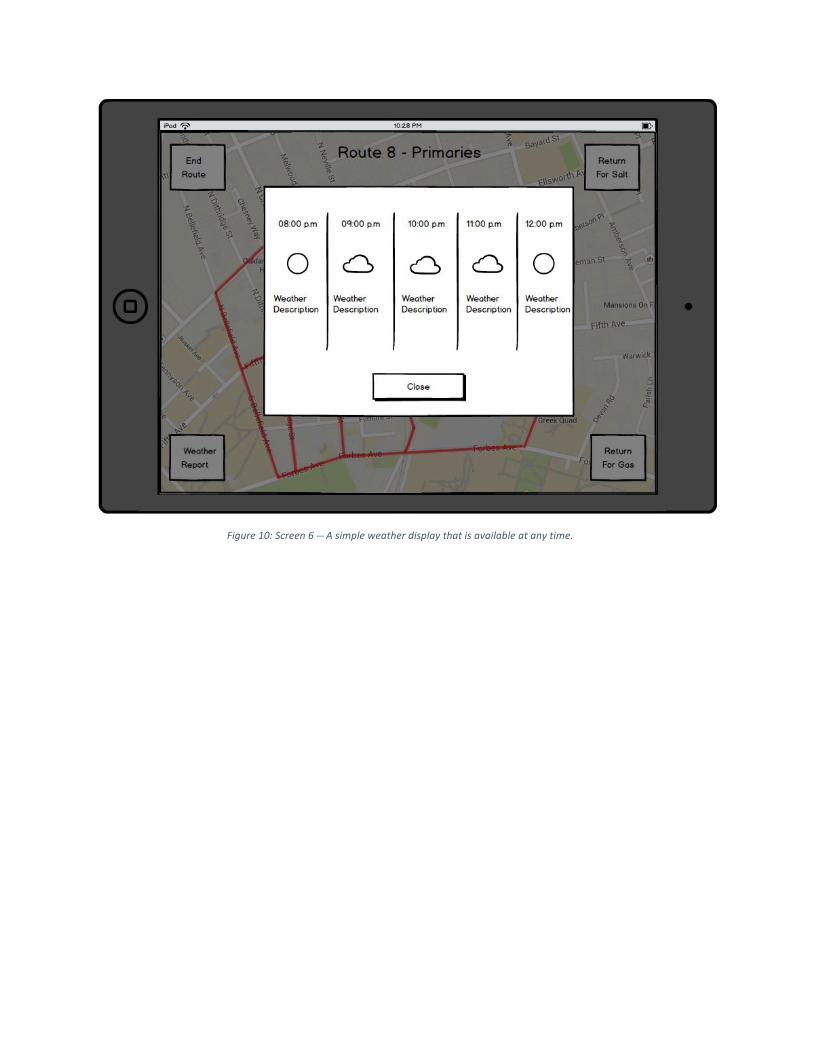
Figure 10: Screen 6 -‐-‐-‐ A simple weather display that is available at any time.
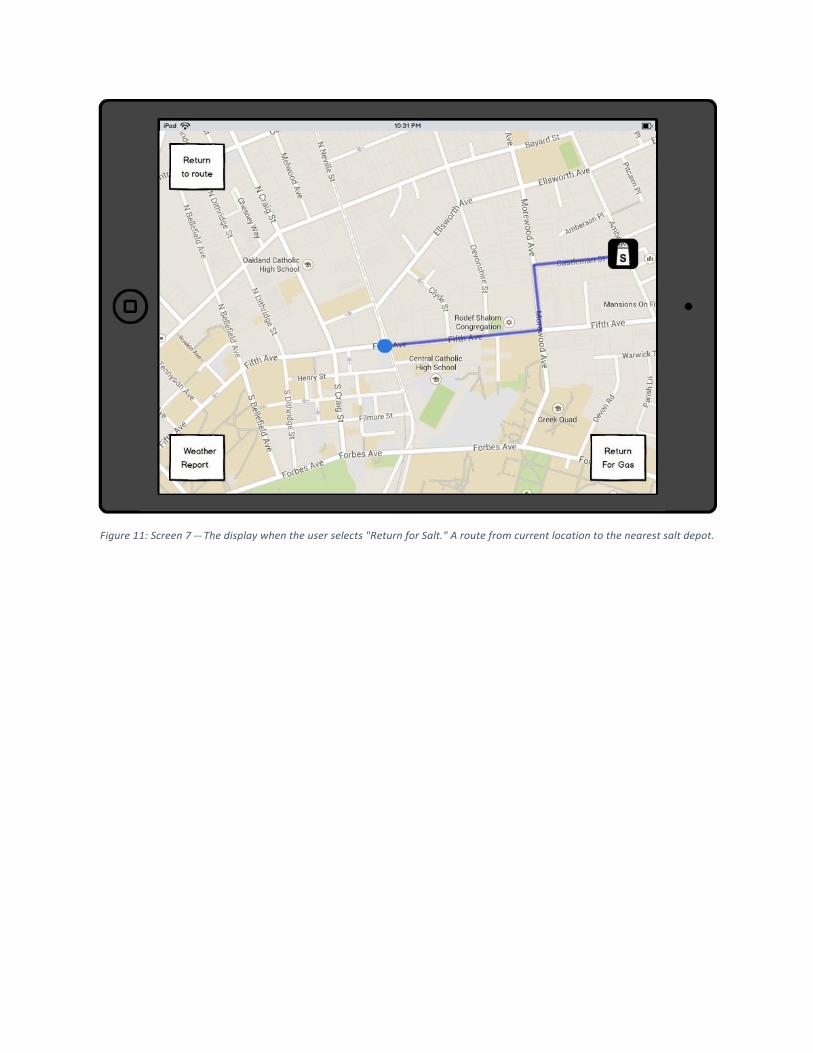
Figure 11: Screen 7 -‐-‐-‐ The display when the user selects "Return for Salt." A route from current location to the nearest salt depot.
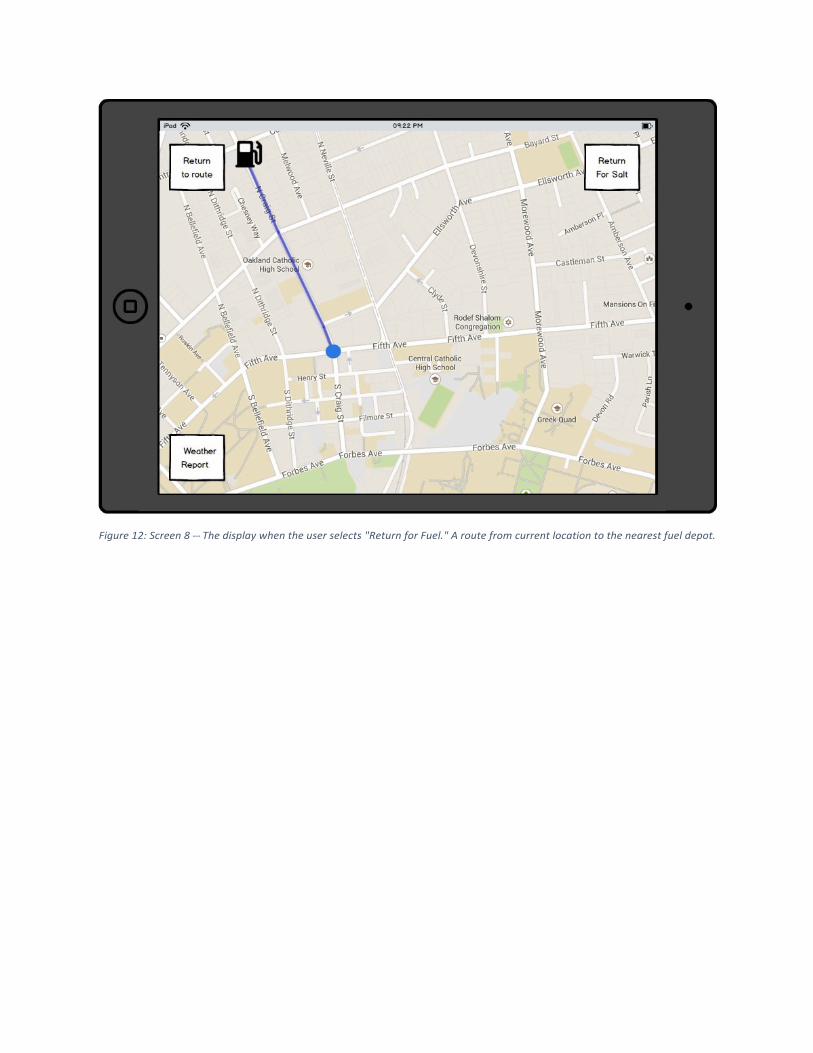
Figure 12: Screen 8 -‐-‐-‐ The display when the user selects "Return for Fuel." A route from current location to the nearest fuel depot.
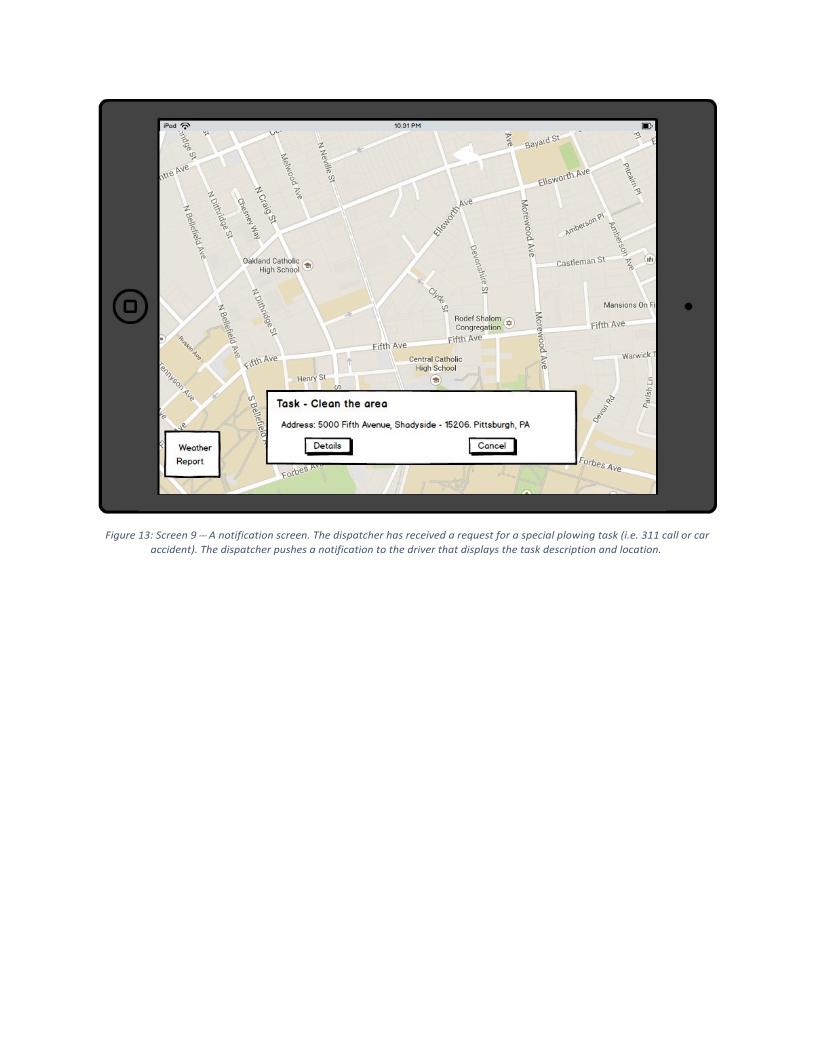
Figure 13: Screen 9 -‐-‐-‐ A notification screen. The dispatcher has received a request for a special plowing task (i.e. 311 call or car accident). The dispatcher pushes a notification to the driver that displays the task description and location.
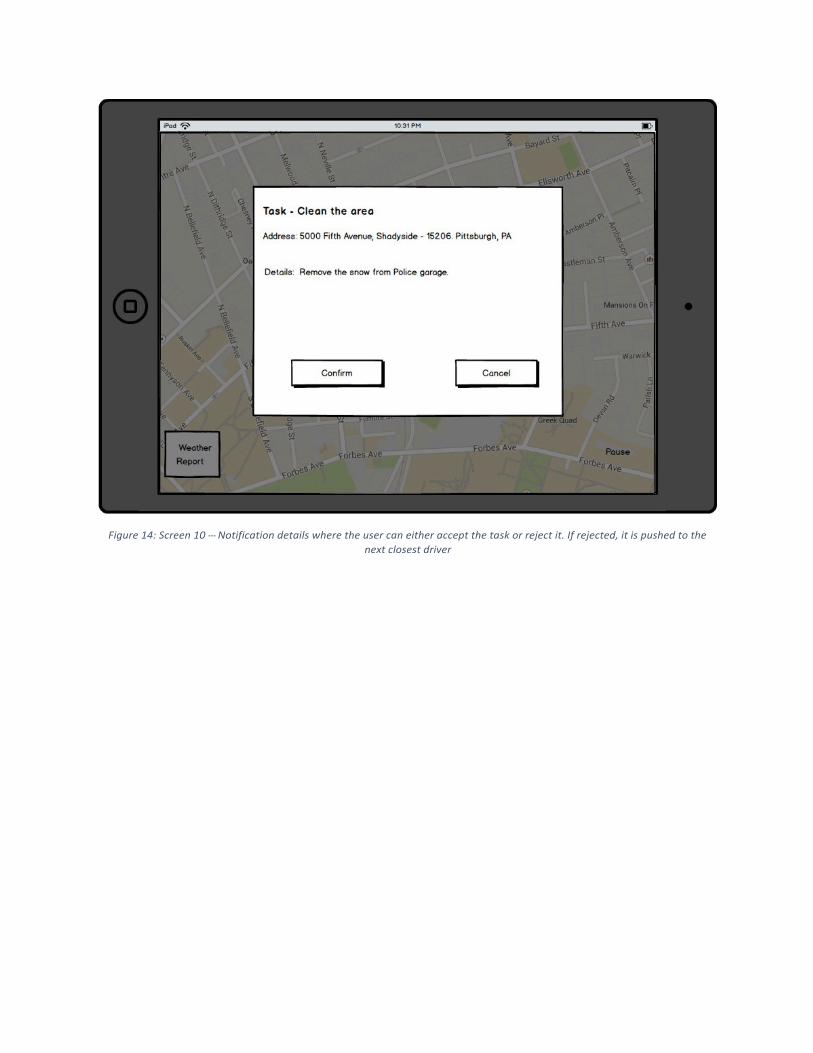
Figure 14: Screen 10 -‐-‐-‐ Notification details where the user can either accept the task or reject it. If rejected, it is pushed to the next closest driver
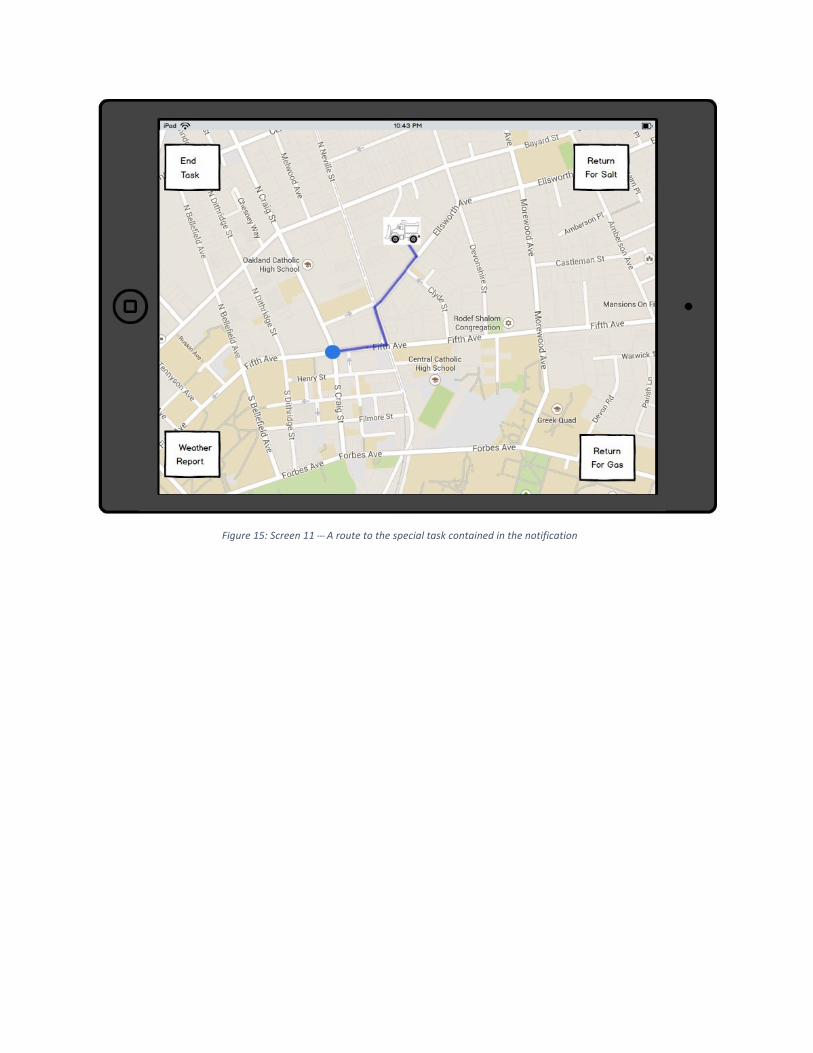
Figure 15: Screen 11 -‐-‐-‐ A route to the special task contained in the notification