Embed Size (px)
Citation preview
Clemson UniversityTigerPrints
All Theses Theses
12-2010
Optimizing The Mechanical Properties Of PartiallyYttria Stabilized Zirconia With Alumina AdditionsRamanaganapathy KandaswamyClemson University, [email protected]
Follow this and additional works at: https://tigerprints.clemson.edu/all_theses
Part of the Materials Science and Engineering Commons
This Thesis is brought to you for free and open access by the Theses at TigerPrints. It has been accepted for inclusion in All Theses by an authorizedadministrator of TigerPrints. For more information, please contact [email protected].
Recommended CitationKandaswamy, Ramanaganapathy, "Optimizing The Mechanical Properties Of Partially Yttria Stabilized Zirconia With AluminaAdditions" (2010). All Theses. 981.https://tigerprints.clemson.edu/all_theses/981
A Thesis
Presented to
The Graduate School of
Clemson University
In Partial Fulfillment
Of the Requirements for the Degree
Master of Science
Material Science & Engineering
by
Ramanaganapathy Kandaswamy
October 2010
Accepted by:
Dr. Eric C Skaar, Committee Chair
Dr. Jian Luo
Dr. John Ballato
OPTIMIZING THE MECHANICAL PROPERTIES OF PARTIALLY
YTTRIA STABILIZED ZIRCONIA WITH ALUMINA ADDITIONS
ii
ABSTRACT
Zirconia is one of the extensively studied solid oxide ceramics with respect to its
use in various industrial applications like electrolyte in fuel cells, sensors, refractories and
exhaust chamber in automobile industry. It can be found from the literature 1-4
that are
contradictory results on the mechanical properties when alumina is added. There are
several factors like microstructure, phase composition and method of processing that
affects the mechanical properties of the material. The focus of this research is to examine
how hardness, tensile strength and other properties varies with alumina content and
deduce the optimal amount of alumina that is needed to maximize the properties of the
composite. Using particle size analyzer the particle size of the powders used in preparing
the composite is calculated. Diametral compression test yields tensile strength and
hardness measurement is done using Vickers‟s hardness. Inference for the experimental
results along with regression and correlation analysis was carried out to substantiate the
results.

iii
DEDICATION
To my parents Mr Kandaswamy Santhanam and Mrs. Padmavathy Kandaswamy
iv
ACKNOWLEDGMENTS
I would like to thank my advisor, Dr. Eric Skaar for his continuous support and
guidance throughout my Masters program. His advice and constant encouragement
helped me in finishing my thesis.
I would like to extend my appreciation to Dr. Jian Luo, Dr. John Ballato and Dr.
James Reick for their valuable inputs and their suggestions.
I would also like to thank Department of Material Science and Engineering, for
the financial support.
I would like to express my heartfelt thanks to my parents Mr. Kandaswamy
Santhanam and Mrs. Padmavathy Kandaswamy for believing in my work ethic as well as
for continual moral and financial support during the entire program. I also would like to
extend my thanks to my brother Swaminathan Kandaswamy for his love and support.
Finally I would like to thank my relatives and my beloved friends for their high
expectations which also acted as a driving force to finish the program.
v
TABLE OF CONTENTS
TITLE PAGE i
ABSTRACT ii
DEDICATION iii
ACKNOWLEDGMENTS iv
LIST OF TABLES vi
LIST OF FIGURES vii
CHAPTER
I. INTRODUCTION 1
II. LITERATURE SURVEY 3
III. EXPERIMENTAL PROCEDURE 20
IV. DESIGN OF EXPERIMENTS 32
V. EXPERIMENTAL RESULTS 35
VI. DISCUSSION OF RESULTS 62
VII. SUMMARY 68
VIII. CONCLUSION 69
REFERENCES 71
APPENDICES
A. SAS code for particle size vs milling time 77
B. SAS code for density 78
C. Porosity 79
D. Hardness SAS code 81
E. Tensile strength data 83
F. X – ray analysis 85
G. Pictures of fracture during diametral compression test 88
vi
LIST OF TABLES
1. Design of Experiment 28
vii
LIST OF FIGURES
Figure Page
1. Three Different Crystallographic Forms of Zirconia 3
2. Cubic Zirconia Crystal Structure 4
3. Phase diagram of Y2O3-ZrO2 15
4. Carver Press 22
5. Horiba Particle Size Analyzer 23
6. Furnace 24
7. Cp Mallows Plot 31
8. Density Regression Model 32
9. Normality Test Statistics 33
10. Normal Probability Plot 34
11. Residual Plot for Pressing Load 35
12. Residual Plot for Milling Time 35
13. Residual Plot for Density 36
14. Model Output for Hardness 38
15. Diametral Compression Test 40
16. Diametral Compression Test Stress Diagram 40
17. Different Kinds of Fracture 43
1
Chapter One
INTRODUCTION
Zirconia is one of the oxide ceramics that has been extensively explored because
it exhibits excellent mechanical properties like high fracture toughness and bending
strength5. Because zirconia possesses high strength it is referred to as “Ceramic Steel”
5.
Zirconia exhibits different crystallographic forms at different temperatures and
each of them have their own advantages. Zirconia can be used for a variety of
applications because we can modify the properties of the composite as required by the
application. Addition of metal oxides from different periodic group enables us to modify
and control the behavior of the composite.
One major used of zirconia is in the field of solid oxide fuel cell due to its high
oxygen ion conductivity6. Zirconia has low thermal conductivity and high coefficient of
thermal expansion. This makes the material highly shock sensitive. Presence of fracture
in solid oxide fuel cell causes the fuel and oxidant to come in contact with one another.
This results in reduced cell efficiency and misbehavior of solid oxide fuel cell. Hence
there is a need for high performance zirconia solid oxide fuel cell which shows good
mechanical properties like high toughness, strength and hardness. There has been
extensive research in regard to improving the mechanical properties of yttria stabilized
zirconia3, 7-12
. However there are some controversies related to the amount of yttria and
alumina that can be added to have optimized mechanical properties3, 11, 13-15
. This
2
research focuses on identifying the amount of alumina that can be added and solve the
existing controversies.
The objective of the research is to optimize the mechanical properties of yttria
stabilized zirconia with alumina additions which is used as electrolyte in several
applications. It can be found from the literature that addition of alumina can help to
increase the mechanical properties but there are some contradictory publications as well.
My aim is to develop an empirical model for the yttria alumina zirconia system and
optimize the amount of alumina that is needed so that the strength of the composite is
optimized.
3
Chapter Two
LITERATURE SURVEY
2.1 Polymorphic Forms
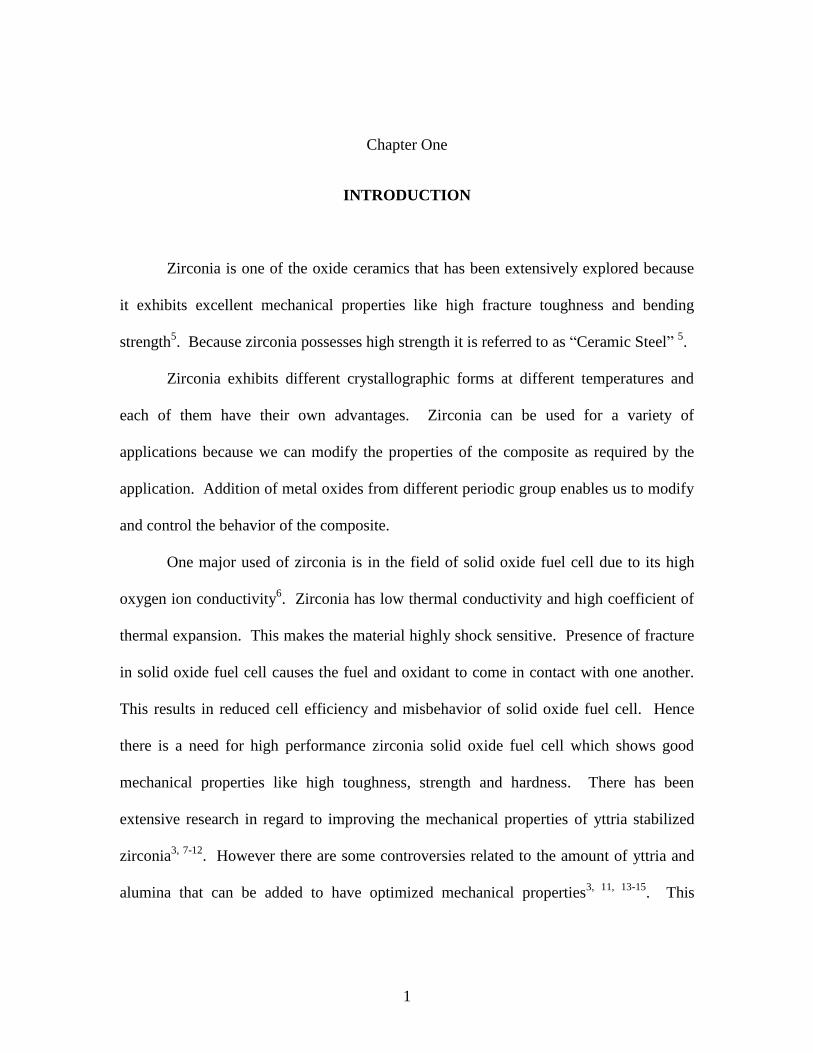
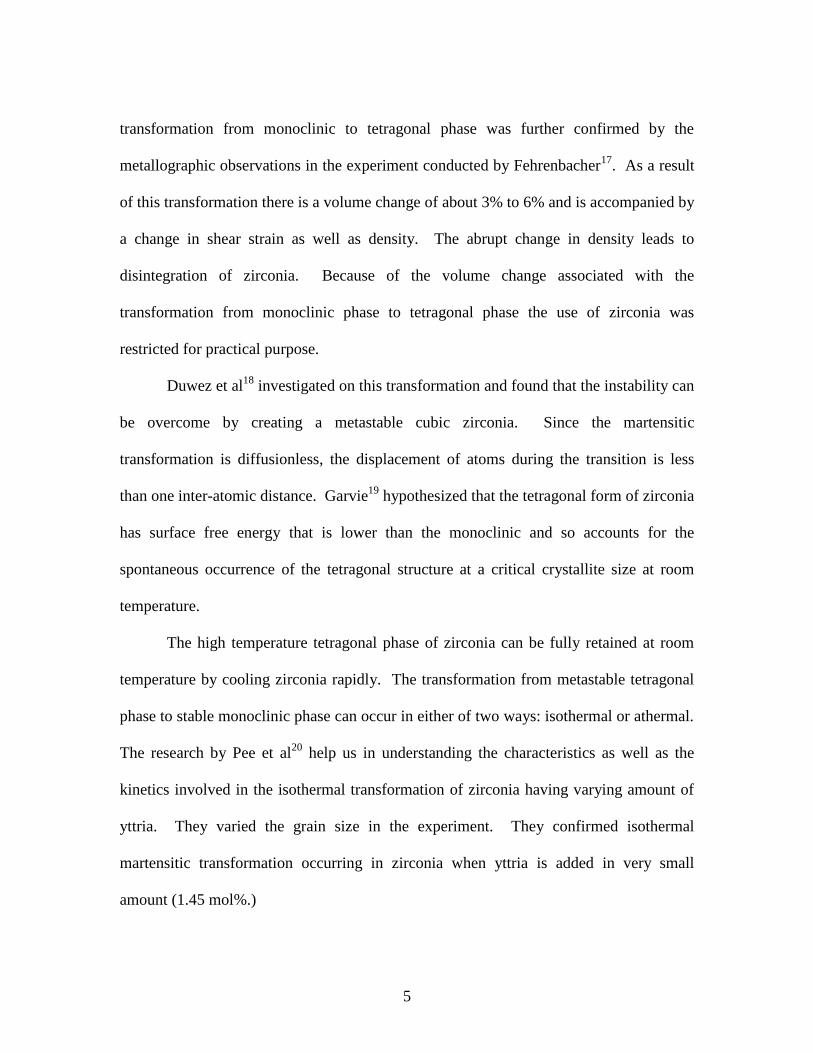
Zirconia can take three polymorphic forms16
. They are monoclinic, tetragonal and
cubic as shown in Figure 1. Zirconia in its pure form exhibits the following phase
transformation during a thermal cycle.
Figure 1: Different Crystal forms of Zirconia
The monoclinic crystal structure of pure zirconia is the thermodynamically stable
4
one at room temperature. The tetragonal phase of zirconia exhibits stability between
1000°C-1900°C. Tetragonal phase of zirconia is hard and this enables the use of
tetragonal zirconia to be used in various structural applications as well as for making
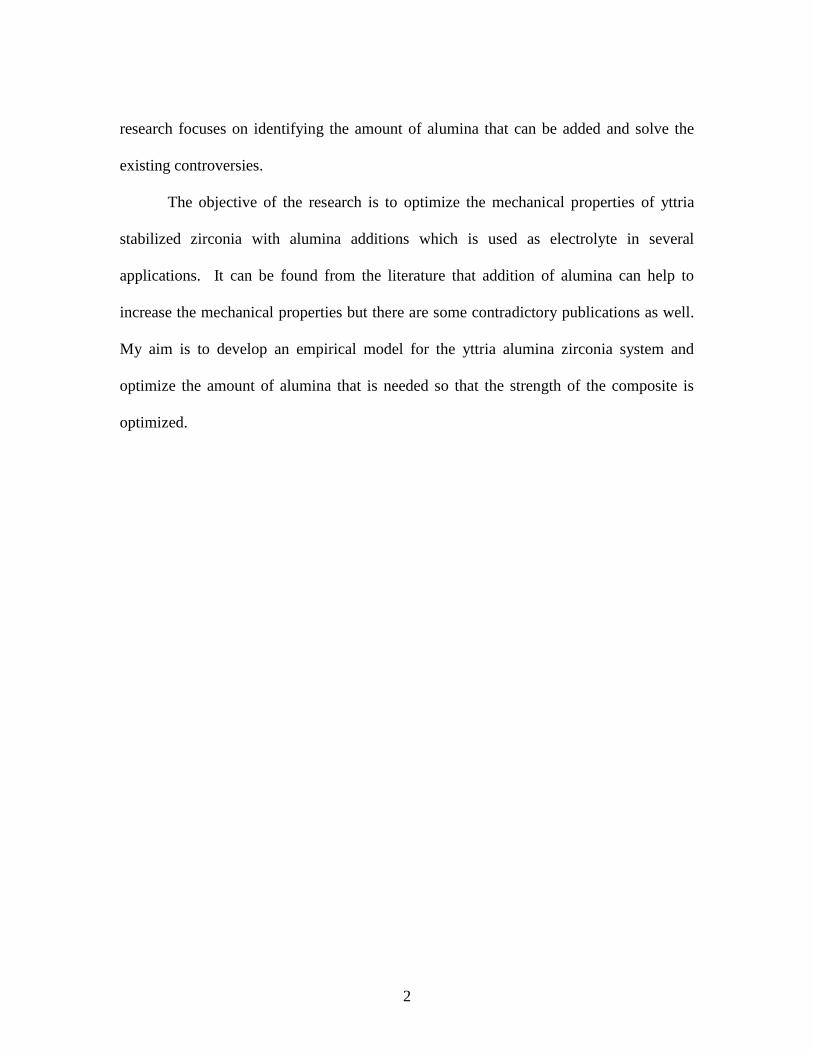
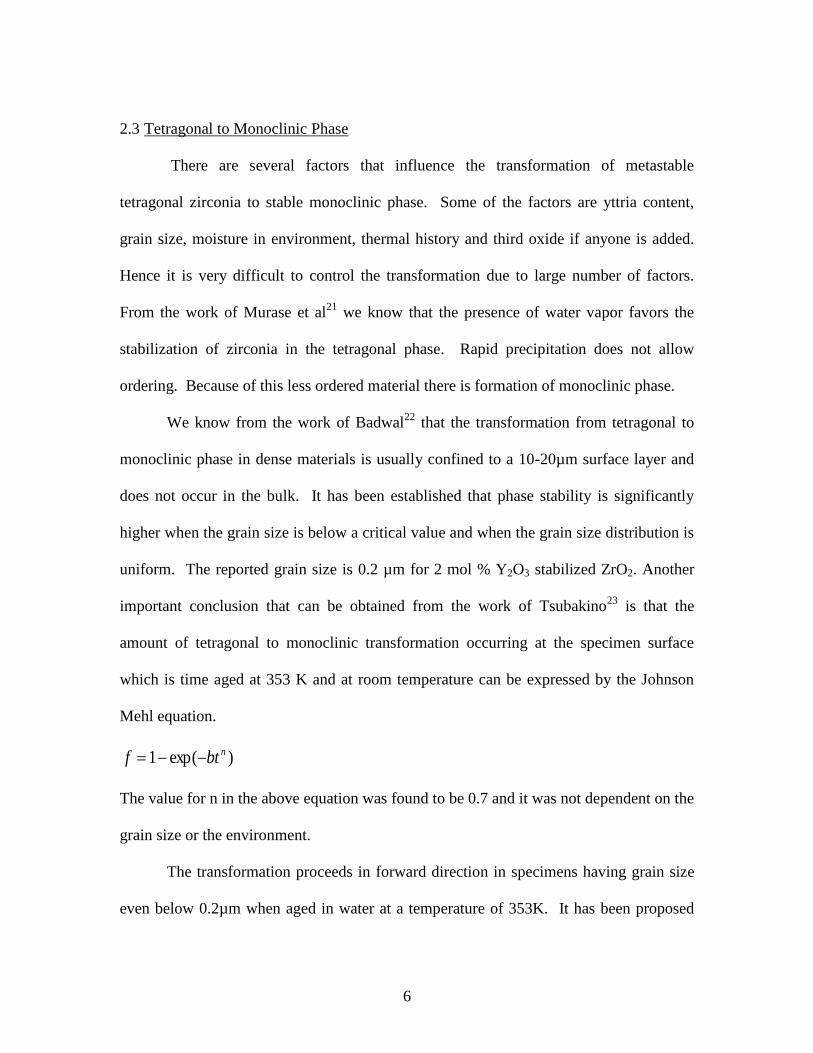
cutting tools. Cubic zirconia forms the open fluorite structure as shown in Figure 2:
Cubic Zirconia Crystal Structure. The larger atoms correspond to zircon and the smaller
ones correspond to oxygen. The cubic phase is very useful especially in the polishing of
glasses and several other applications. Because of its high refractive index it is used in
the jewelry industry. But the difficulty with using cubic phase is that it is not
thermodynamically stable at room temperature. Hence some stabilizing agents are added
to make high temperature phase thermodynamically stable at room temperature.
Figure 2: Cubic Zirconia Crystal Structure
2.2 Transformation in Zirconia
The transformation from tetragonal to monoclinic zirconia is a martensitic type
transformation17
. One important characteristic of martensitic type transformation is that
the transformation is independent of time and is only a function of temperature. This type
of transformation is known as athermal transformation. The athermal mode of
5
transformation from monoclinic to tetragonal phase was further confirmed by the
metallographic observations in the experiment conducted by Fehrenbacher17
. As a result
of this transformation there is a volume change of about 3% to 6% and is accompanied by
a change in shear strain as well as density. The abrupt change in density leads to
disintegration of zirconia. Because of the volume change associated with the
transformation from monoclinic phase to tetragonal phase the use of zirconia was
restricted for practical purpose.
Duwez et al18
investigated on this transformation and found that the instability can
be overcome by creating a metastable cubic zirconia. Since the martensitic
transformation is diffusionless, the displacement of atoms during the transition is less
than one inter-atomic distance. Garvie19
hypothesized that the tetragonal form of zirconia
has surface free energy that is lower than the monoclinic and so accounts for the
spontaneous occurrence of the tetragonal structure at a critical crystallite size at room
temperature.
The high temperature tetragonal phase of zirconia can be fully retained at room
temperature by cooling zirconia rapidly. The transformation from metastable tetragonal
phase to stable monoclinic phase can occur in either of two ways: isothermal or athermal.
The research by Pee et al20
help us in understanding the characteristics as well as the
kinetics involved in the isothermal transformation of zirconia having varying amount of
yttria. They varied the grain size in the experiment. They confirmed isothermal
martensitic transformation occurring in zirconia when yttria is added in very small
amount (1.45 mol%.)
6
2.3 Tetragonal to Monoclinic Phase
There are several factors that influence the transformation of metastable
tetragonal zirconia to stable monoclinic phase. Some of the factors are yttria content,
grain size, moisture in environment, thermal history and third oxide if anyone is added.
Hence it is very difficult to control the transformation due to large number of factors.
From the work of Murase et al21
we know that the presence of water vapor favors the
stabilization of zirconia in the tetragonal phase. Rapid precipitation does not allow
ordering. Because of this less ordered material there is formation of monoclinic phase.
We know from the work of Badwal22
that the transformation from tetragonal to
monoclinic phase in dense materials is usually confined to a 10-20µm surface layer and
does not occur in the bulk. It has been established that phase stability is significantly
higher when the grain size is below a critical value and when the grain size distribution is
uniform. The reported grain size is 0.2 µm for 2 mol % Y2O3 stabilized ZrO2. Another
important conclusion that can be obtained from the work of Tsubakino23
is that the
amount of tetragonal to monoclinic transformation occurring at the specimen surface
which is time aged at 353 K and at room temperature can be expressed by the Johnson
Mehl equation.
)exp(1 nbtf
The value for n in the above equation was found to be 0.7 and it was not dependent on the
grain size or the environment.
The transformation proceeds in forward direction in specimens having grain size
even below 0.2µm when aged in water at a temperature of 353K. It has been proposed
7
that domain boundaries inhibit the tetragonal to monoclinic transformation and only
when an active nucleation site is present, the transformation will take place at lower
temperature. Studies done in the last decade have shown some controversial results
related to the martensitic phase transformation20, 23, 24
. The athermal mode assumed for
martensitic transformation is questionable. It has been found that when the yttria content
is higher than 2 mol % then the transformation occurs isothermally. Hence there is some
dispute as to whether the transformation is athermal (diffusionless) or isothermal.
The work done by Tsubakino et al25
helps in resolving the above conflict.
Tsubakino found that when the yttria content is in the range of 0.5 to 4 mol % the
transformation proceeded by an isothermal mode. This is because the martensitic phase
in the as-sintered specimen was 95% (not 100%) and increased to 100% as the samples
were aged at 573 K. He also found that when the yttria content in the specimens are very
low then isothermal transformation proceeds at a faster rate. This was confirmed by the
shift to left side in the Time Temperature Transformation (TTT) or C curves. Thus it can
be found that two kinds of transformation occur and the type of transformation that
occurs depends on the yttria content in the specimen. Also it can be found that
transformation rate is inversely proportional to the yttria content. We can also infer that
the transformation rate and the amount of transformation increases as the grain size
increases.
2.4 Tetragonal to Cubic Transformation
Sheu et al26
studied the co-existence of cubic phase and the tetragonal phase.
They observed a spontaneous transformation from metastable cubic phase triggered by
8
mechanical forces at room temperature. Isolated tetragonal platelets present in the cubic
matrix were bounded by habit planes and contained anti-phase boundaries. The
tetragonality decreased with stabilizer content and structure vanishes when the yttria level
is increased to a maximum of 18 mol%. The tetragonality initially increases with
increasing temperature because of anisotropic thermal expansion but then decreases
rapidly after reaching a maximum, as the temperature for the tetragonal-to-cubic
transformation was approached. Being a first-order martensitic transformation, the cubic-
to-tetragonal transformation is accompanied by a discontinuous change of tetragonality
and a hysteresis loop as the temperature or composition passes through the equilibrium
value. The simultaneous presence of dopant cations and oxygen vacancies in large
concentration means that the local atomic environments in the stabilized material are very
different from the corresponding stoichiometric (tetragonal and cubic) phases.
Fabris et al27
proposed a self-consistent tight binding model that was based on the
electronic and structural properties of zirconia. When the concentration is fixed and we
increase temperature, then high temperature destabilizes the tetragonal phase and favors
the cubic phase. A similar phenomenon was found when the temperature was fixed and
the concentrations of the dopants were increased. Higher amount of impurities stabilize
the cubic phase easily.
Garvie16
studied the phases present in zirconia system and developed calibration
curves for determining the amount of free ZrO2 in partially stabilized zirconia ceramics.
He developed calibration curves using two methods for measuring intensity. They are the
matrix method and the polymorph method. In the matrix method a linear relation
9
between the monoclinic phase and the stabilized cubic phase is assumed. They were able
to obtain a reasonable curve. In the polymorph method stabilized zirconia is assumed to
be a high temperature polymorph of cubic zirconia. From the above two calibration
methods it was concluded that quantifying the monoclinic zirconia in partially stabilized
zirconia ceramics yielded a linear calibration curve when the cubic phase is considered to
be present in the form of matrix. The absorption coefficient differs negligibly from that
of pure zirconia when it is assumed to be high temperature polymorph of zirconia.
Among the two methods for quantifying zirconia the polymorph method came out better
when then integrated intensities are corrected for Lorentz polarization factors.
The phase analysis method suggested above helps to deduce the concentration of
free zirconia in partially stabilized zirconia. This is highly beneficial in understanding
the amount of zirconia that undergoes transformation at varying temperatures and
understand the kinetics involved. It helps us to tailor the final properties by changing the
free zirconia.
2.5 Phase Transformation Toughening
The type of phase transformation that occurs in the material when subjected to
load is called stress induced phase transformation. Phase transformation is accompanied
by an increase in volume and this increases crack propagation resistance in the material.
The stress induced transformation involves the transformation of metastable tetragonal
grains to monoclinic phase at the crack tip. This process is accompanied by volume
expansion and as a result causes compressive stress to be developed in the material28
.
This enables the material to withstand high loads. This is called phase transformation
10
toughening.
2.6 Stabilized Zirconia
Stabilizing agents are added to zirconia so that they can be maintained in their
high temperature crystallographic structure. This stabilized zirconia is metastable at
room temperature. In pure zirconia anisotropic volume expansion occurs during the
tetragonal to monoclinic transformation and this prevents from using zirconia in different
forms other than powder. Majority of the research has been devoted to stabilization of
zirconia into tetragonal or even better, into cubic phases by addition of various aliovalent
cation dopants.
It is believed that the addition of certain oxides reduce the temperature of the
cubic to tetragonal transformation to a value below room temperature. There is evidence
that undersized dopants enable us to stabilize the tetragonal form of ZrO2 29
. ZrO2 can be
stabilized by some tetravalent cations which do not introduce oxygen vacancies30, 31
According to Dietzel‟s cation field strength theory; the formation of a compound between
two oxides was likely only when the difference between the field strengths of both
cations exceeded 0.3. They found that if the difference was only slightly greater
compound formation was possible but such compounds melted incongruently indicating
poor lattice stability.
The divalent and trivalent oxides added as stabilizing agents enter into the
zirconia system forming a solid solution and stabilizing the cubic phase from room
temperature to its melting point. Since the cation diffusion is slow in ZrO2 the cubic
phase will remain stable for very long periods of time at temperatures below the
11
decomposition temperature and making it stable. A model has been proposed setting out
criteria for suitable dopants used as cation32
. There are several criteria and some of
which include stabilizing cations must have larger ionic sizes, a lower formal charge
state, and a higher ionicity than Zr.
The material selected to stabilize the zirconia must have ionic radius substantially
the same as the radius of zirconium ion. The zirconium ion in cubic configuration has an
ionic radius of about 0.87A°. Materials such as yttria, magnesia and ceria have average
ionic radius within 20% of the radius of zirconium ion. Some of the most widely used
oxides for stabilizing zirconia in cubic phases are calcia, magnesia and yttria33-35
.
Gulino36
investigated the low temperature stabilization of the zirconia using Bi3+
. This is
a new stabilizing agent and they were able to stabilize zirconia in low temperature range.
The stabilizing ions appear to enter the cubic structure of zirconia replacing some of the
zirconium ions. The minor difference in the ionic radii involved in the substitution
apparently prevents the phase changes which takes place in zirconia when present in pure
state. The amount of stabilizing agent is governed by the region of the equilibrium of the
phase diagram which has the desired phase field. Hence sintering the zirconia to 1350°C
-1550°C will result it in the tetragonal or in the tetragonal and cubic phase region. Upon
normal cooling to room temperature the tetragonal phase is retained in a metastable
condition.
Study has also been conducted on the amount of calcia and magnesia required to
stabilize zirconia in the cubic form. Thermal expansion studies were conducted for the
two stabilizing agents. From the work of Duwez34
we can find that when calcia is used as
12
a stabilizing agent (5-15 mol%) the specimens contains a mixture of monoclinic and
cubic phases. Manganese oxide and boron oxide were also considered as candidates for
sintering aid by Hansch et al37
. Sintering aid content was varied in the range of 3 -10 wt
% and density was measured for varying experimental conditions. From their
experimental results it can be concluded that addition of sintering aid increased the
density noticeably. Amount of densification increased with increasing amount of
sintering aid. Hence it can be concluded that the reactive mixture of manganese oxide
and boron oxide is one possible candidate for sintering aid.
Another sintering aid considered as candidate for zirconium oxide composite is
wollastonite by Rai38
. Wollastonite has a melting point of 1125°C which is very low
compared to 2677°C that of zirconia. The reason the researchers chose wollastonite for
sintering aid is because of presence of both CaO and SiO2 both of them helping in the
sintering process. However we know SiO2 can be detrimental to the final product and
may not yield the desired properties.
From the work of Reis it can be found that yttria used as additive showed the
maximum stability. For yttria as stabilizing agent, the composition can vary from 1% to
10%. Because of non-equilibrium effects such as the particle size and rate of temperature
change the equilibrium data is only a guide and it has been found that a minimum of
2.6% of yttria is required. Moure39
studied the microstructure of 3 mol% yttria stabilized
zirconia. The microstructure of the samples was composed of grains having uniform size
and shape. No porosity was observed in the samples. When fractured samples were
studied contrasting results were found for samples sintered at 30 minutes and 120
13
minutes. For samples sintered for 30 minutes two grain shapes were seen. They are
angular and round shaped. For samples sintered for 120 minutes only rounded shape
grains were observed. Also cracks were observed along the grain boundaries. For the
current research yttria is chosen for stabilization because of the extensive research
conducted using this material and availability as raw material.
Thus from the research work done in the previous decade we know that 8 mol %
yttria stabilized zirconia is a preferred candidate. When the zirconia ceramics is sintered
at high temperatures it leads to several problems. Some of the problems include
degradation of the quality of material, energy cost, excessive grain growth and
unfavorable interface reaction between ZrO2 based materials and other components.
From the study of Li et al40
it can be found that low temperature processing can
enable to get rid of the above problems. From the above work it can be concluded that at
high pressure of 4.5 GPa the samples had good sintering characteristics. The author states
that 8 YSZ underwent a phase transition from partial tetragonal phase to partial cubic
phase when the temperature was increased from 1000°C to 1450°C when sintered under
high pressure. They found that the electrical conductivity remained the same and is
suitable for all practical purpose.
In order to understand the phase relationship in the zirconia yttria system the
amount of yttria was varied and analyzed by Scott41
. From his work it can be found that
in pure oxides none of the high temperature phases can be retained by quenching to room
temperature. At low temperature the converse problem occurs. This is because of the very
slow diffusion rate of cation. Their conclusion is that it is necessary to obtain identical
14
results for experiments that had initial materials in a homogenous form (co-precipitates,
quenched melts) as well as for inhomogeneous form (physically mixed oxides). Samples
that had yttria content from 0% to 3% showed monoclinic phase.
Figure 3: Phase Diagram of ZrO2-Y2O3 24
Samples containing 4%-5% of yttria were not homogenous and had mixture of both
tetragonal and monoclinic phase. When the yttria content was increased from 6% to 11%
tetragonal phase structure was seen. When the yttria content is varied from 12% to 13%
15
the phase analysis resulted in uncertainty. This uncertainty is because the specimens
yielded tetragonal, face centered cubic as well as mixture of the two structures. Samples
having more than 13% yttria yielded cubic structure. This experimental work gives us the
amount of yttria required to obtain the desired phase.
Chevalier et al42
studied the effect of cubic phase on 3 mol % yttria stabilized
zirconia. Nakanishi24
elaborated on the transformation characteristics of zirconia. As we
know zirconia undergoes diffusionless transformation. He refers to the transformation
occurring in zirconia similar to the transformation from austenite to ferrite in steels. In
the above transformation not only shear mechanism plays a major role but also requires
individual atomic movement. The tetragonal to monoclinic transformation occurs
isothermally in zirconia yttria ceramic system. The above transformation is referred to as
Bainite like transformation since it is similar to the eutectoid transformation (
CFe3 )
The following phenomenon can be found in the above transformation
We will be able to see a surface relief in the transformation
The transformation occurs isothermally and not athermally
The transformation is controlled by rotation or short range diffusion of oxygen ions. The
author hypothesizes that exchange mechanism of oxygen ions and vacant lattice sites
plays an important role on isothermal propagation of the transformation.
2.7 Partially Stabilized Zirconia
Zirconia can be classified in to three categories based on the way they are present
in the material. They are Tetragonal Zirconia Polycrystalline (TZP), Partially Stabilized
16
Zirconia (PSZ) and Zirconia Toughened/Dispersed Ceramics (ZDC). If the amount of
stabilizing oxide is less than the required amount for stabilization then the zirconia is not
completely stable and is only partially stabilized. Usually the tetragonal or the monoclinic
phase particles will exist in the cubic zirconia matrix. Depending on what phase is
present in the system and their amount the property of the system changes. Tetragonal
phase transforms readily into monoclinic phase in partially stabilized zirconia.
Drennan12
studied the effect of SrO on the mechanical properties of magnesia
partially stabilized zirconia (MPSZ). From his research it can be found that
improvements in the mechanical properties of MPSZ are obtained by the addition of SrO.
SrO addition effectively neutralizes the detrimental effects of SiO2 contaminant by
forming a glass phase which is ejected from the bulk of the ceramic during sintering. As
a result of this combined effect there is a retardation of the sub-eutectoid decomposition
reaction. This also minimizes the retention of glass phases at the grain boundaries.
Partially stabilized zirconia has some peculiar applications. Because of the
reversible martensitic phase transformation (diffusionless) that occurs during heating and
cooling of zirconia it is used in the field of shape memory alloys43
. Researchers are
currently focusing on zirconia ceramics because they exhibit high strength and toughness.
These properties can be achieved in such materials by a stress induced volume expanding
phase transformation about the crack tip. In order for a material to exhibit martensitic
phase transformation the twin boundaries of the lower symmetry (lower temperature)
phase must be sufficiently mobile to enable reorientation on the application of stress.
The twin boundaries within the low temperature phase must then consist of partially or
17
fully coherent interfaces to enable reversal on heating.
It can be inferred from the work of Swain et al43
that the nonlinear strain
accommodates the reorientation within the microstructure when the temperature is below
the martensitic phase transformation temperature Ms. There is also a temperature Mf
below which the transformation occurs by stress induced phase transformation. Thus they
were able to clearly explain the behavior of phase transformation and how it can be used
in shape memory alloys. From the work of Swain44
we know that the amount of inelastic
strain at failure increases with increasing toughness. This inelastic strain is due to the
tetragonal to monoclinic transformation. This transformation occurs due to the stress
present at the tensile surface of the bend specimens.
2.8 Effect of Alumina Addition on Zirconia
2.8.1 Benefits
Choi et al11
studied the mechanical properties of zirconia-alumina composites by
varying the amount of alumina from 0%-30%. They prepared two kinds of composites
platelets and particulates. From their experiment we can obtain few interesting results.
The flexural strength of the particulate composites increased with increasing alumina
content while strength of the particulates remain unchanged with increasing alumina
content except at 5 mol%. However the reason for abnormal behavior at 5 mol% is not
explained. Also another important result that we can obtain from their work is that the
strength of the particulate composite was 15%-20% higher than that of the platelet
composites. Another important feature of alumina addition to yttria stabilized zirconia is
18
that it allows control of the microstructure through grain pinning. Also addition of
alumina is useful in removing the contaminants especially silica.
Guo et al45
proposed the brick layer model to explain the electrical conductivity of
stabilized zirconia. A study on the electrical properties of yttria stabilized zirconia which
is doped with alumina was carried out by Kumar et al46
. Their study revealed that the
conductivity due to grain boundaries is less than that of the grain. The resistivity offered
by grain boundaries can be related to the impurities present in the composite. Another
most important result that can be obtained from their experiment is the enormous change
in grain boundary resistivity with addition of alumina. An increase in temperature of
20°C increased the density of the sample considerably. Casella et al47
studied the micro
structural coarsening of zirconia toughened alumina. Micro-structural coarsening in
systems involving the presence of second phases depends on the interactions and
solubility between both phases. We know from the work of French et al48
that zirconia
toughened alumina ceramics containing a high volume fraction of zirconia particles
coarsen in a complementary way. When the amount of zirconia in the composite is high
then the above effect is more likely to occur. Coarsening is restricted by the limited
solubility of alumina in zirconia as well as by the physical constraint between both
phases. Thus from the work of above researchers it can be found that zirconia hinders the
grain growth in zirconia toughened alumina composites. Also the matrix grain size
decreases with increase in the zirconia content. It can also be inferred from the
experiments that the matrix grain size and particle size growth maintain a relatively
constant ratio. This evidences the fact that a complementary microstructure coarsening

19
occurs in the composites. Using the above information it can be concluded that varying
the amount of zirconia alumina in the composite will enable us to tailor the mechanical
properties by controlling the microstructure and heat treatment process.
20
Chapter Three
EXPERIMENTAL PROCEDURE
The starting materials for preparing the composite are experimental grade 99.5%
pure zirconium oxide from Wah Chang, yttrium oxide having purity of 99.99% from
Strem Chemicals and aluminum oxide. Calculated amount of zirconium oxide, yttrium
oxide and aluminum oxide are accurately weighed in a weighing paper using a physical
balance and the value is recorded. Ball milling technique is used for obtaining complete
mixture of powders. Zirconia balls were used as grinding media. The total amount of
charge (yttria + zirconia) was fixed to be 100 g. The ball milling is carried out in dry
state. Alumina content, milling time and load for pressing were varied as per the
experimental design set up. 10 g from the mixed batch is weighed and is used to prepare
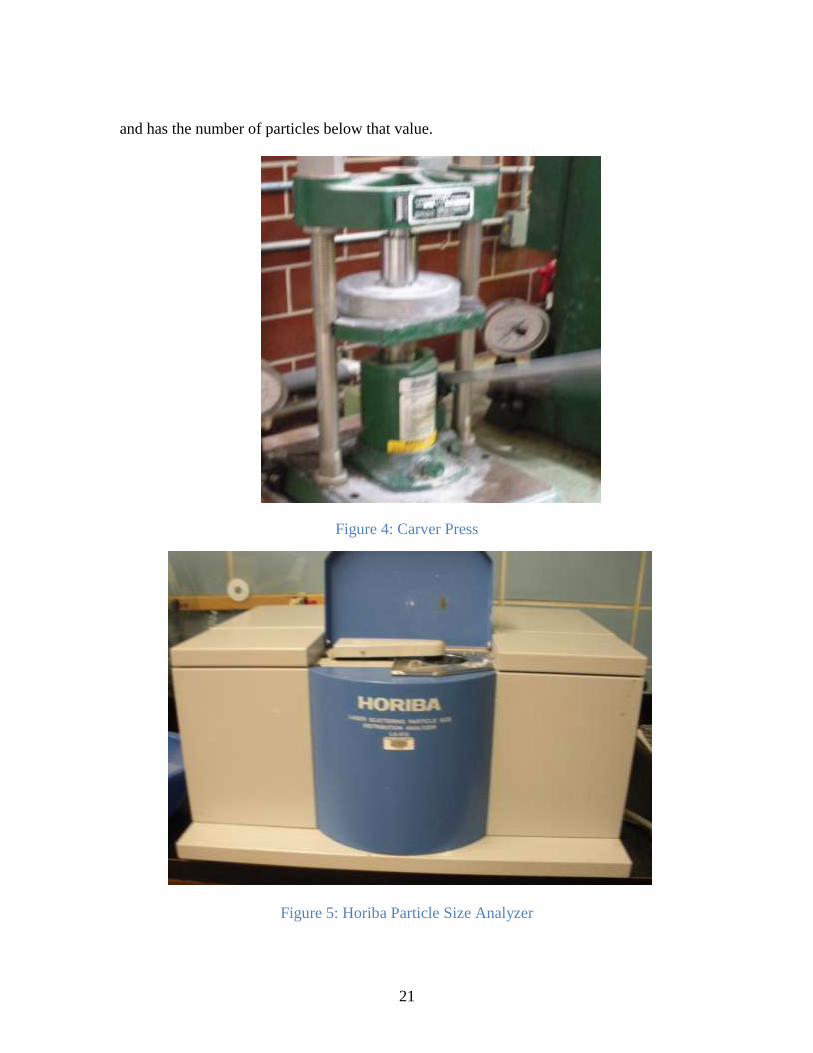
pellets. Around 10 such pellets were prepared for each batch. Pressing is done using
laboratory carver press shown in Figure 4. The residue powder obtained from ball mill jar
is used for measuring the particle size. Particle size is measured using Horiba particle
size analyzer LA910 shown in Figure 5. It gives the mean particle size based on the
distribution of particles and works on the laser scattering technique. In order to measure
the particle size, minute quantity of the powder (less than 0.1g) is suspended and
dispersed uniformly in distilled water using ultrasonic stirrer. The sample holder present
in the particle analyzer is filled with the suspension containing powder and the mean
particle size is measured. Particle size obtained is based on the size distribution curve
21
and has the number of particles below that value.
Figure 4: Carver Press
Figure 5: Horiba Particle Size Analyzer
22
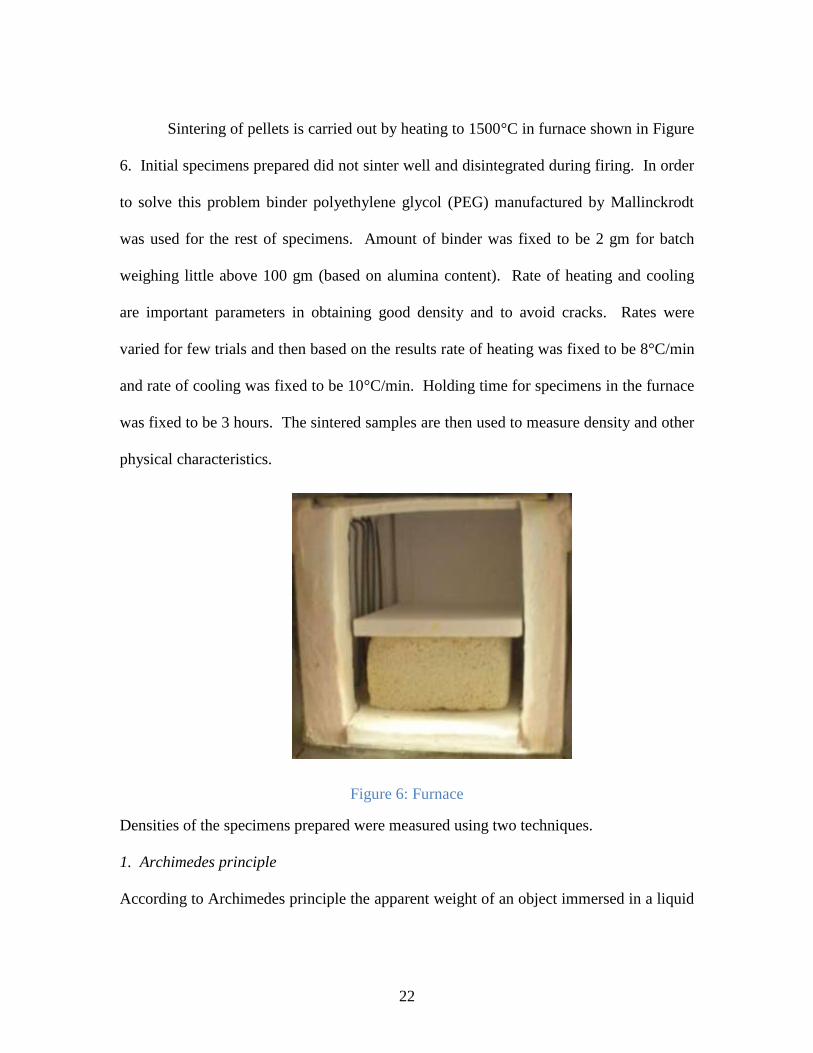
Sintering of pellets is carried out by heating to 1500°C in furnace shown in Figure
6. Initial specimens prepared did not sinter well and disintegrated during firing. In order
to solve this problem binder polyethylene glycol (PEG) manufactured by Mallinckrodt
was used for the rest of specimens. Amount of binder was fixed to be 2 gm for batch
weighing little above 100 gm (based on alumina content). Rate of heating and cooling
are important parameters in obtaining good density and to avoid cracks. Rates were
varied for few trials and then based on the results rate of heating was fixed to be 8°C/min
and rate of cooling was fixed to be 10°C/min. Holding time for specimens in the furnace
was fixed to be 3 hours. The sintered samples are then used to measure density and other
physical characteristics.
Figure 6: Furnace
Densities of the specimens prepared were measured using two techniques.
1. Archimedes principle
According to Archimedes principle the apparent weight of an object immersed in a liquid
23
decreases by an amount equal to the weight of the volume of the liquid that it displaces.
This method is used in measuring the density. Hence of object
liquid displaced ofWeight
object ofWeight
liquid ofDensity
object ofDensity
2. Using Mass volume relationship
We know from the definition of density that it is mass per unit volume. Mass is
calculated by measuring using the physical balance and volume of specimen is calculated
using standard geometry formulae. Specimen is in the form of cylinder and hence volume
of specimen is calculated using formulae . Using this we find the density.
X ray diffraction is one of the methods to investigate the phase composition and
to study the structure of the material. X ray diffraction analysis was carried out for the
several compositions to study the phases present. Copper radiation with wavelength of
1.5406A° was used for the study and values were recorded in continuous scanning mode.
Scanning speed varied from ¼ degree per minute to 1 degree per minute. No significant
changes in results were noticed on changing the scanning speed. The scanning range for
all the compositions were fixed to be in the range 25° to 36° based on a previous thesis 49
.
Using the standard data, the intensity peaks were matched with the measured data and
phases present for the compositions were found. Further justification was carried out by
correlating with the phase diagram (Phase Diagram of ZrO2-Y2O3 24
).
Thermal expansion is an important property that enables us to make several
inferences. Thermal expansion is defined as the change in length of the material for a unit
change in temperature. It is calculated using the formula
24
TE=α dL/dT
Each material has its own thermal expansion coefficient. Thermal expansion study is
used to identify phase change occurring in the composite. Zirconia undergoes phase
transformation as discussed previously. In order to find how the alumina affects the
phase transformation, thermal expansion study was done for varying compositions.
Thermal expansion study is carried out using a dilatometer manufactured by
Netzsch (DIL 402). Samples are obtained either from diametral compression test or cut
from sintered pieces. Broken pieces of diametral compression test are used. Samples are
heated from room temperature slowly to temperature of 700°C at a slow heating rate of ½
deg/min and then maintained at the same temperature for 3 hours. They are then slowly
cooled at the rate of ½ deg/min until room temperature is reached. The instrument
measures the change in length for every change in temperature. Based on the data
obtained a graph is plotted for each composition and the curves are carefully studied.
Samples are then selected at random from each batch and subjected to polishing.
Grinding and polishing are carried out using sequence of SiC papers and diamond paste.
Rough grinding was initially performed using 100 SiC paper. It is then followed by 320,
400, 600, 800 and 1000. After this polishing is done using diamond paste having size of 3
micron, 1 micron and 0.1 micron. The polished surfaces were examined using optical
microscope and then used for performing Vickers hardness indentation test.
Hardness of a material can be defined in terms of three behaviors. They are
resistance to scratch, indentation and rebound. For engineering and metallurgical
applications hardness is evaluated with respect to indentation. When a material is
25
subjected to constant compression load it resists deformation initially before a permanent
deformation occurs. Indentation hardness measures the resistance of a sample to
permanent plastic deformation. Usually a sharp pointed object is used for indentation.
Vickers hardness involves application of the standard load for a small duration of time.
The tip of the instrument has a indenter is made up of diamond which is in the shape of
pyramid. For the experiment Vickers instrument MHT LECO S200 model is used to
perform experiments. Vickers hardness has an unique advantage when compared to other
indentation techniques. It‟s easy to calculate the hardness because the calculations are
independent of the size of the indenter and the indentation technique can be used for all
materials irrespective of hardness.
The hardness number obtained by Vickers indentation method is not a true
property of the material and is an empirical value that should be seen in conjunction with
the experimental methods and hardness scale used. Vickers hardness can be calculated
from the standard Vickers hardness formula
28544.1
d
PH v
Here P is the load used for indentation and d is the diagonal length of the indentation.
There are several ways of evaluating the tensile strength of the material. Green
strength can be evaluated using three point test or four point test. The above testing
methods are traditionally used to overcome the inherent difficulty of tensile testing of
elastic materials. There is also a disadvantage associated with the bending test. Only the
surface of the specimen is subjected to maximum stress and failure is initiated by surface
rather than bulk flaws. There is also an indirect method of measuring the tensile strength
26
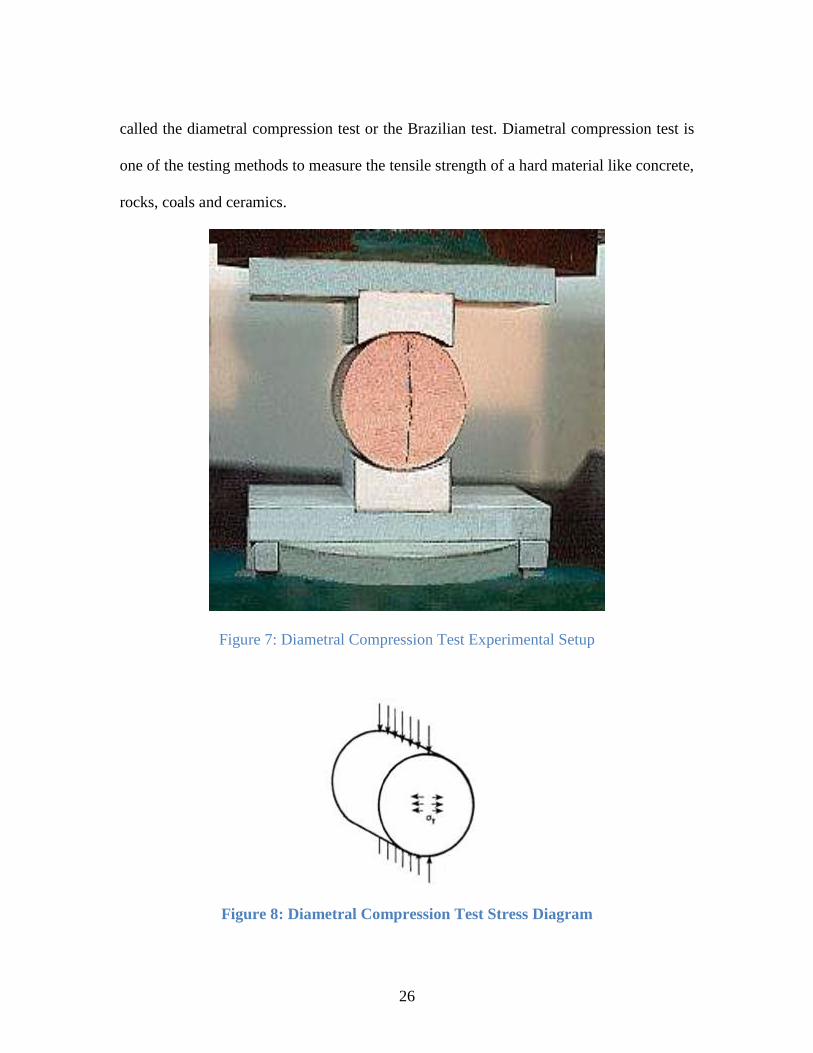
called the diametral compression test or the Brazilian test. Diametral compression test is
one of the testing methods to measure the tensile strength of a hard material like concrete,
rocks, coals and ceramics.
Figure 7: Diametral Compression Test Experimental Setup
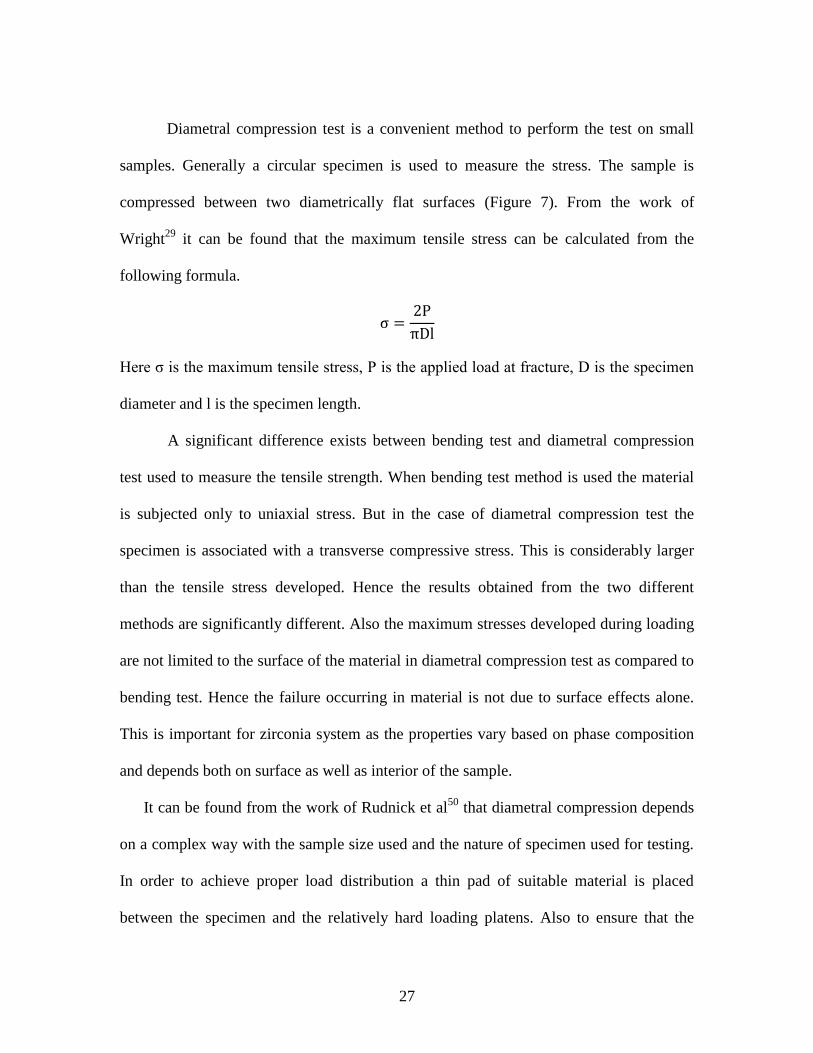
Figure 8: Diametral Compression Test Stress Diagram
27
Diametral compression test is a convenient method to perform the test on small
samples. Generally a circular specimen is used to measure the stress. The sample is
compressed between two diametrically flat surfaces (Figure 7). From the work of
Wright29
it can be found that the maximum tensile stress can be calculated from the
following formula.
Here σ is the maximum tensile stress, P is the applied load at fracture, D is the specimen
diameter and l is the specimen length.
A significant difference exists between bending test and diametral compression
test used to measure the tensile strength. When bending test method is used the material
is subjected only to uniaxial stress. But in the case of diametral compression test the
specimen is associated with a transverse compressive stress. This is considerably larger
than the tensile stress developed. Hence the results obtained from the two different
methods are significantly different. Also the maximum stresses developed during loading
are not limited to the surface of the material in diametral compression test as compared to
bending test. Hence the failure occurring in material is not due to surface effects alone.
This is important for zirconia system as the properties vary based on phase composition
and depends both on surface as well as interior of the sample.
It can be found from the work of Rudnick et al50
that diametral compression depends
on a complex way with the sample size used and the nature of specimen used for testing.
In order to achieve proper load distribution a thin pad of suitable material is placed
between the specimen and the relatively hard loading platens. Also to ensure that the
28
right conditions for tensile fracture of specimen exists, a narrow pad of soft material is
placed between platens and the specimen. Tensile stress can be held uniform over a
reasonable portion of the loaded diameter when the width of the bearing area is less than
20% of the specimen diameter. There is another need for using pads. They help to reduce
the friction between the specimen and loading platens. If the friction is not reduced it
might lead to a higher apparent tensile strength. The amount of material subjected to
stress in a diametral compression test is proportional to both the length and diameter of
the sample.
From the research work done by Marion et al51
we can find that the mean strength and
the standard deviation will decrease with an increase in diameter or length. They also
found that decrease in strength and standard deviation can be attributed to an increase in
the stiffness of the pad because the volume that got stressed increases. From the work of
Fell et al52
we know that the value of compressive and shear stresses are a minimum at
the center of the load diameter and infinitely high immediately under the load points. He
found that the tensile stress is constant over the load diameter except the regions near the
loading area. He also deduced that shear and compressive stresses are considerably
reduced in this area. An ideal condition of testing is obtained when the tablets have a high
elastic modulus. In such a case failure may be initiated by shear or compression. Three
kinds of fracture can occur in these specimens Figure 9. They are
1. Compression / Shear failure: In this kind of fracture the specimen splits into
several irregular fragments. Shapes of the resulting fragments are not regular.
2. Tensile fracture: In this kind of fracture the specimen splits into two halves along
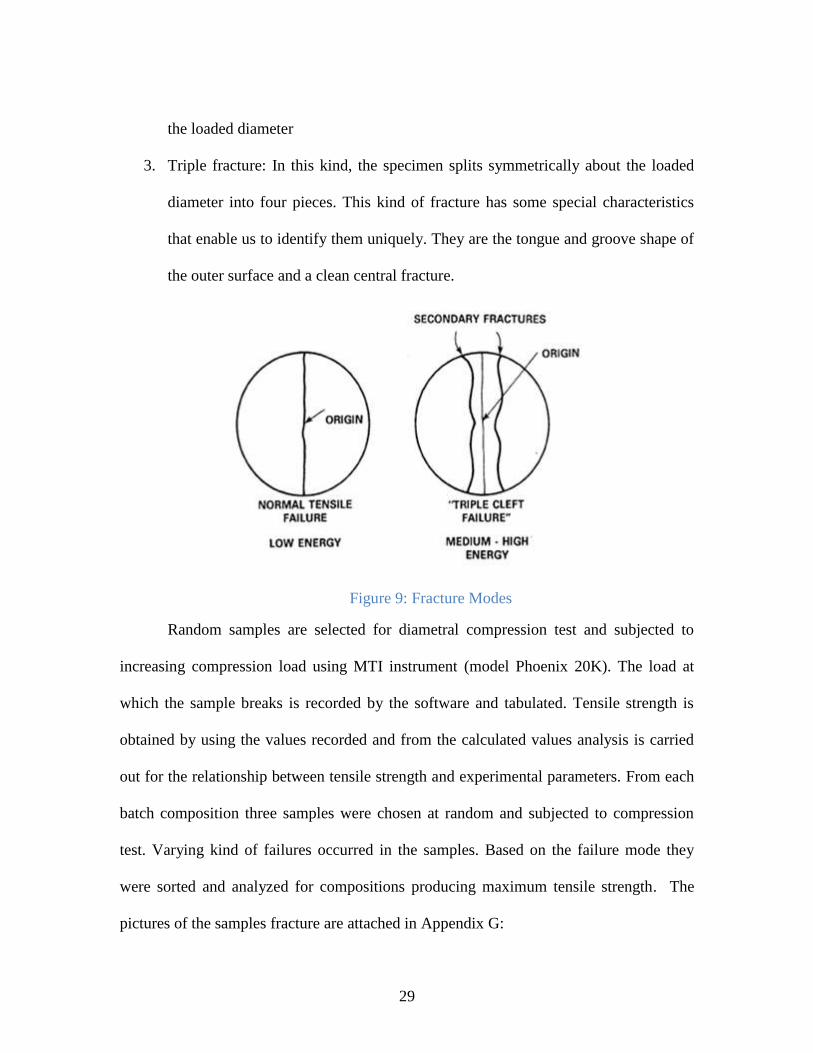
29
the loaded diameter
3. Triple fracture: In this kind, the specimen splits symmetrically about the loaded
diameter into four pieces. This kind of fracture has some special characteristics
that enable us to identify them uniquely. They are the tongue and groove shape of
the outer surface and a clean central fracture.
Figure 9: Fracture Modes
Random samples are selected for diametral compression test and subjected to
increasing compression load using MTI instrument (model Phoenix 20K). The load at
which the sample breaks is recorded by the software and tabulated. Tensile strength is
obtained by using the values recorded and from the calculated values analysis is carried
out for the relationship between tensile strength and experimental parameters. From each
batch composition three samples were chosen at random and subjected to compression
test. Varying kind of failures occurred in the samples. Based on the failure mode they
were sorted and analyzed for compositions producing maximum tensile strength. The
pictures of the samples fracture are attached in Appendix G:

30
Some of the samples had fractured in compression mode while others fractured in
tension mode or resulted in triple cleft failure. For analysis, only samples fractured in
tensile mode were considered.
31
Chapter Four
DESIGN OF EXPERIMENTS
Process modeling is a concise description of total variation in one quantity. We
can measure the desired response by controlling the values of the factors. Since it is
impossible to look at the entire space one can get an overall idea using the previous
literature and construct a design model over it.
There are three essential parts to every process model. They are
1. The response variable that we wanted to measure
2. Mathematical function that has the factors affecting it
3. Random error occurring due to experiments.
4.1 Box Behnken Method
Box Behnken method is a response surface methodology design. From the work
done by Nguyen et al53
we know that it is a three level second order design introduced by
Box and Behnken (1958,1960) for fitting the second order response surface model and is
generally of the form.
Xy
There are m factors x1, x2…xm in n runs where y is the n x 1 response vector, X is an n x
p model matrix with n 1 x p row vectors. X=(1, x1,….xm, x1x2,……xm-1xm, x21,…x
2m). β
is a p x 1 vector of parameters to be estimated and ε is an n x 1 vector of errors with zero
mean and covariance matrix Inσ2. BB designs are spherical designs because all design
32
points are either on a sphere or center of a sphere. It is a quadratic design model in which
the treatment combinations are at the center and midpoints of the edges and the process
space. Since the process looks at the centers it is difficult to capture the points that are
located at the corners. It is highly beneficial for process that does not involve or has less
important values at the end points. The points in the process space can be considered to
form a sphere with a center equidistant from the rest of the points.
When the experiment is conducted with three factors there is an advantage over
the central composite design is that it requires fewer number of experimental runs. For
the experiment three factors were chosen and 3 levels were fixed. The three factors that
were assumed to influence the density of the resulting composite are milling time,
alumina content and the load applied during pressing. Initial trials were conducted using
factorial design for pressing load, alumina content and milling time. Load measured in
pounds had three levels 3000, 4000 and 5000. Alumina content (in g) had center point at
6 and has adjacent values of 4 & 8.Milling time measured in hours also has three levels 8,
16 and 24.
The response variable is density. The following table shows the design set up for initial
study of the experiment.
33
Table 1: Design of Experiments Containing Factorial Design with Three Levels for Three
Factors Alumina, Milling Time and Pressure
4.2 Empirical Modeling for Analysis
SAS is used to obtain several statistical test results as well as for constructing
models. When several independent variables are present and we can use regression model
to find the dependence of these variables with the dependent variable. Regression
procedure usually gives the line of best fit based on the least square method. This
method minimizes the sum of squared distances between the observed data values and the
predicted values by the linear approximation54
. The best fit is the one which has the
lowest sum of squared values.
34
Chapter Five
EXPERIMENTAL RESULTS
By using the experimental procedures described in Chapter 3, the samples were
prepared for density, x-ray analysis, porosity and mechanical testing like hardness and
tensile strength. The average particle size obtained after milling is attached below. The
following graphs show the variation of particle size with milling time as well as variation
of particle size with alumina.
Zirconia(g) Yttria(g) Alumina(g) Milling
Time(hrs) Average Particle
Size(µm)
92 8 4 8 0.10027
92 8 4 16 0.0779
92 8 4 24 0.0795
92 8 6 8 0.11595
92 8 6 16 0.0883
92 8 6 24 0.08275
92 8 8 8 0.09455
92 8 8 16 0.0851
92 8 8 24 0.12385
35
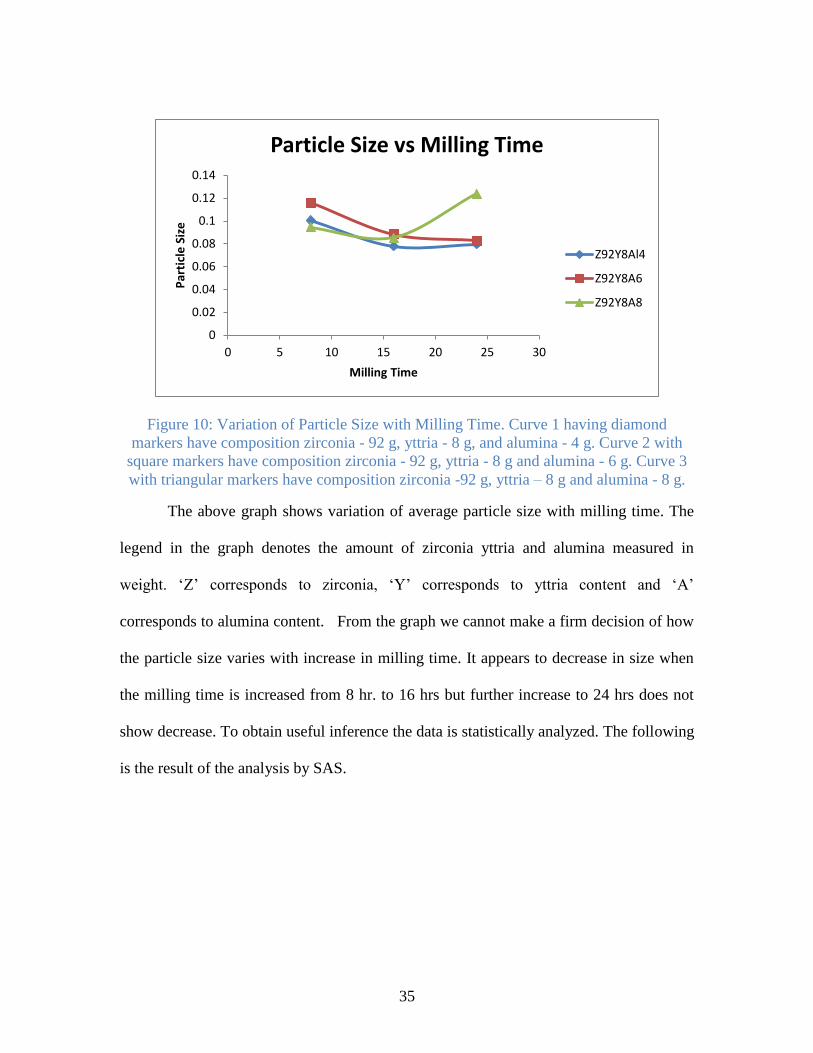
Figure 10: Variation of Particle Size with Milling Time. Curve 1 having diamond
markers have composition zirconia - 92 g, yttria - 8 g, and alumina - 4 g. Curve 2 with
square markers have composition zirconia - 92 g, yttria - 8 g and alumina - 6 g. Curve 3
with triangular markers have composition zirconia -92 g, yttria – 8 g and alumina - 8 g.
The above graph shows variation of average particle size with milling time. The
legend in the graph denotes the amount of zirconia yttria and alumina measured in
weight. „Z‟ corresponds to zirconia, „Y‟ corresponds to yttria content and „A‟
corresponds to alumina content. From the graph we cannot make a firm decision of how
the particle size varies with increase in milling time. It appears to decrease in size when
the milling time is increased from 8 hr. to 16 hrs but further increase to 24 hrs does not
show decrease. To obtain useful inference the data is statistically analyzed. The following
is the result of the analysis by SAS.
0
0.02
0.04
0.06
0.08
0.1
0.12
0.14
0 5 10 15 20 25 30
Par
ticl
e S
ize
Milling Time
Particle Size vs Milling Time
Z92Y8Al4
Z92Y8A6
Z92Y8A8
36
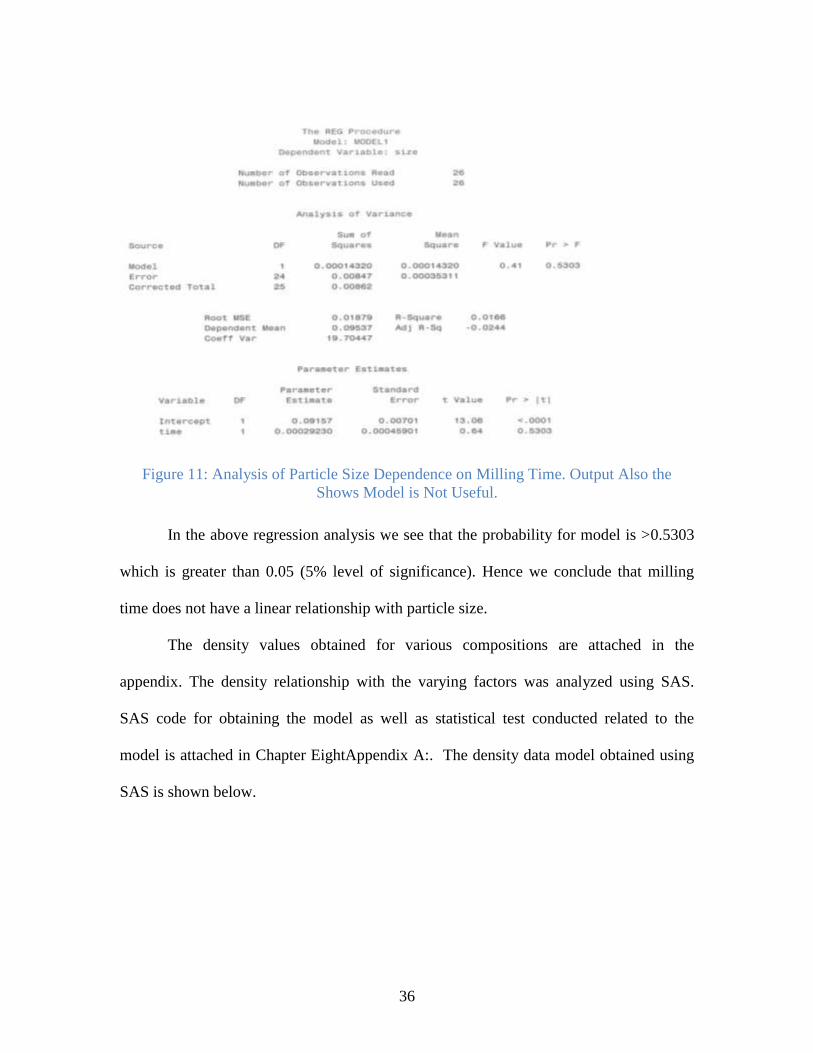
Figure 11: Analysis of Particle Size Dependence on Milling Time. Output Also the
Shows Model is Not Useful.
In the above regression analysis we see that the probability for model is >0.5303
which is greater than 0.05 (5% level of significance). Hence we conclude that milling
time does not have a linear relationship with particle size.
The density values obtained for various compositions are attached in the
appendix. The density relationship with the varying factors was analyzed using SAS.
SAS code for obtaining the model as well as statistical test conducted related to the
model is attached in Chapter EightAppendix A:. The density data model obtained using
SAS is shown below.
37
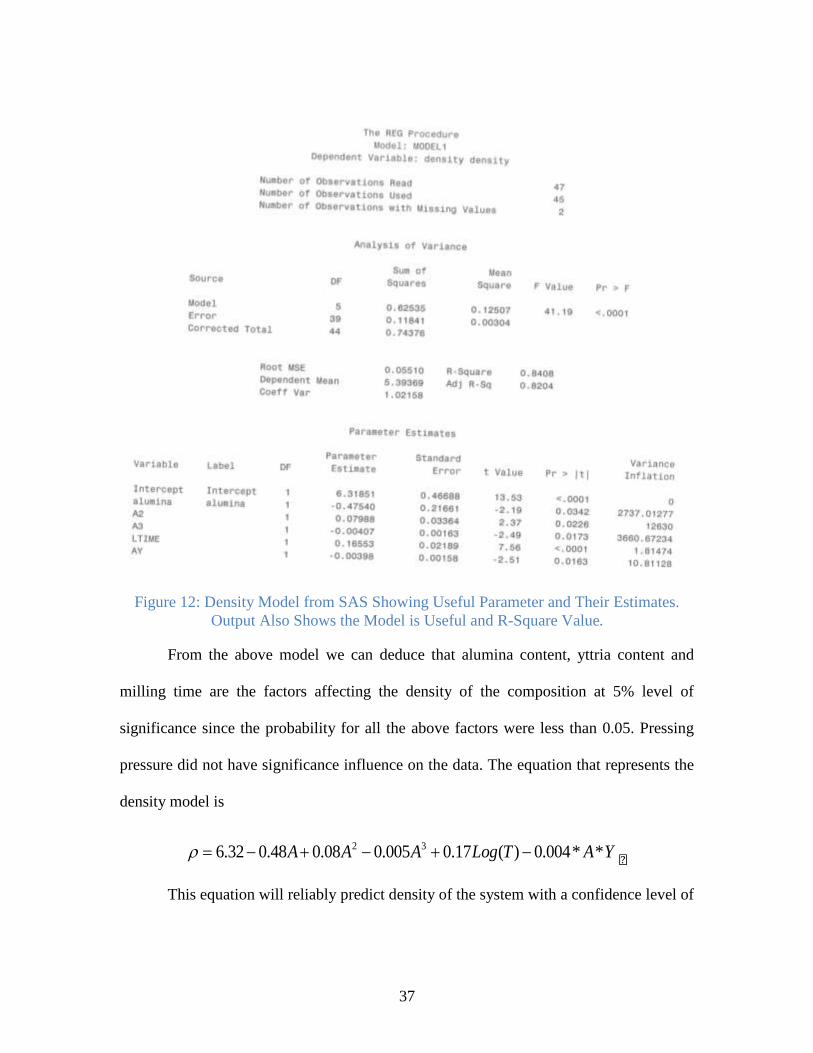
Figure 12: Density Model from SAS Showing Useful Parameter and Their Estimates.
Output Also Shows the Model is Useful and R-Square Value.
From the above model we can deduce that alumina content, yttria content and
milling time are the factors affecting the density of the composition at 5% level of
significance since the probability for all the above factors were less than 0.05. Pressing
pressure did not have significance influence on the data. The equation that represents the
density model is
YATLogAAA **004.0)(17.0005.008.048.032.6 32
This equation will reliably predict density of the system with a confidence level of
38
95%. In order to validate the result obtained by the predicted density from the equation
was compared with two new compositions and found that the experimental result was
very close to the predicted value with deviation less than 5%. The following graph shows
the three dimensional view of the response surface.
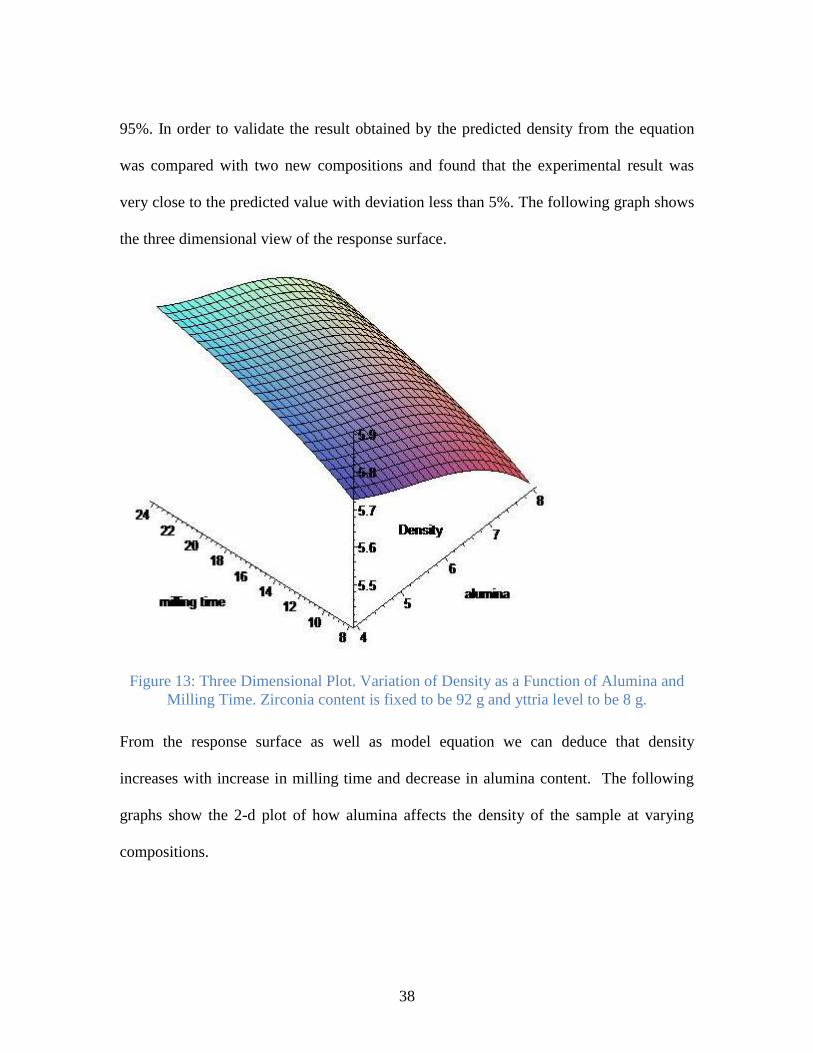
Figure 13: Three Dimensional Plot. Variation of Density as a Function of Alumina and
Milling Time. Zirconia content is fixed to be 92 g and yttria level to be 8 g.
From the response surface as well as model equation we can deduce that density
increases with increase in milling time and decrease in alumina content. The following
graphs show the 2-d plot of how alumina affects the density of the sample at varying
compositions.
39
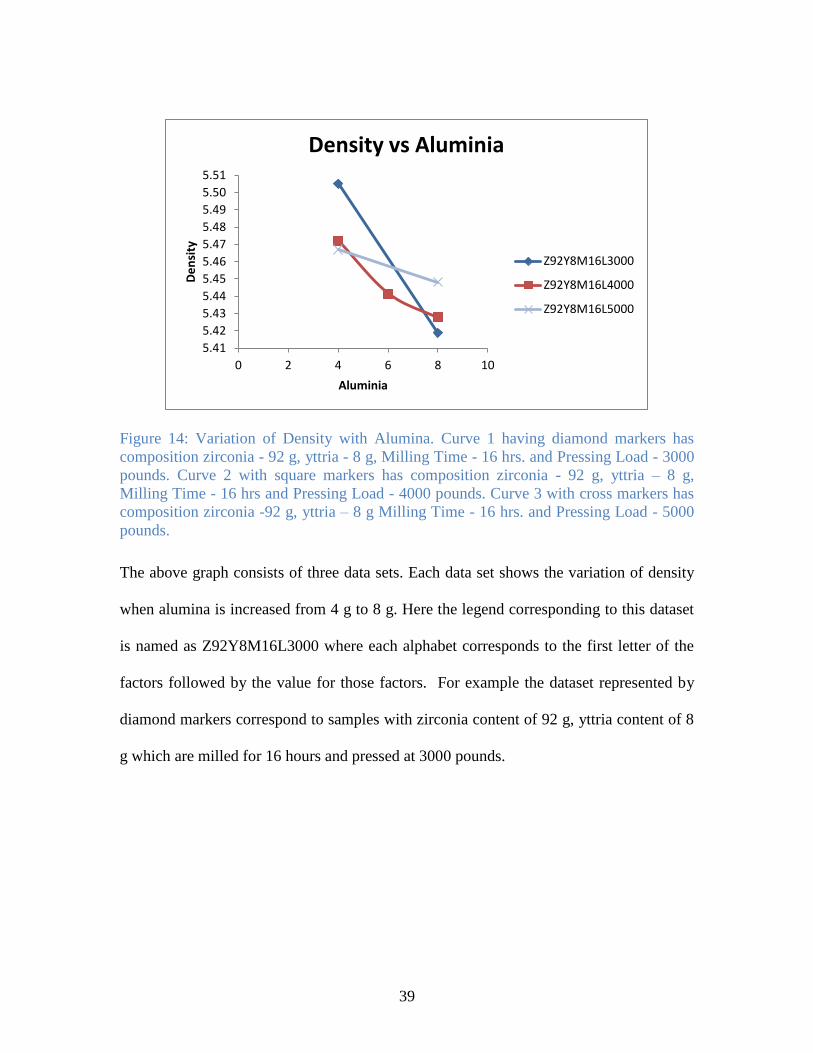
Figure 14: Variation of Density with Alumina. Curve 1 having diamond markers has
composition zirconia - 92 g, yttria - 8 g, Milling Time - 16 hrs. and Pressing Load - 3000
pounds. Curve 2 with square markers has composition zirconia - 92 g, yttria – 8 g,
Milling Time - 16 hrs and Pressing Load - 4000 pounds. Curve 3 with cross markers has
composition zirconia -92 g, yttria – 8 g Milling Time - 16 hrs. and Pressing Load - 5000
pounds.
The above graph consists of three data sets. Each data set shows the variation of density
when alumina is increased from 4 g to 8 g. Here the legend corresponding to this dataset
is named as Z92Y8M16L3000 where each alphabet corresponds to the first letter of the
factors followed by the value for those factors. For example the dataset represented by
diamond markers correspond to samples with zirconia content of 92 g, yttria content of 8
g which are milled for 16 hours and pressed at 3000 pounds.
5.41
5.42
5.43
5.44
5.45
5.46
5.47
5.48
5.49
5.50
5.51
0 2 4 6 8 10
De
nsi
ty
Aluminia
Density vs Aluminia
Z92Y8M16L3000
Z92Y8M16L4000
Z92Y8M16L5000
40
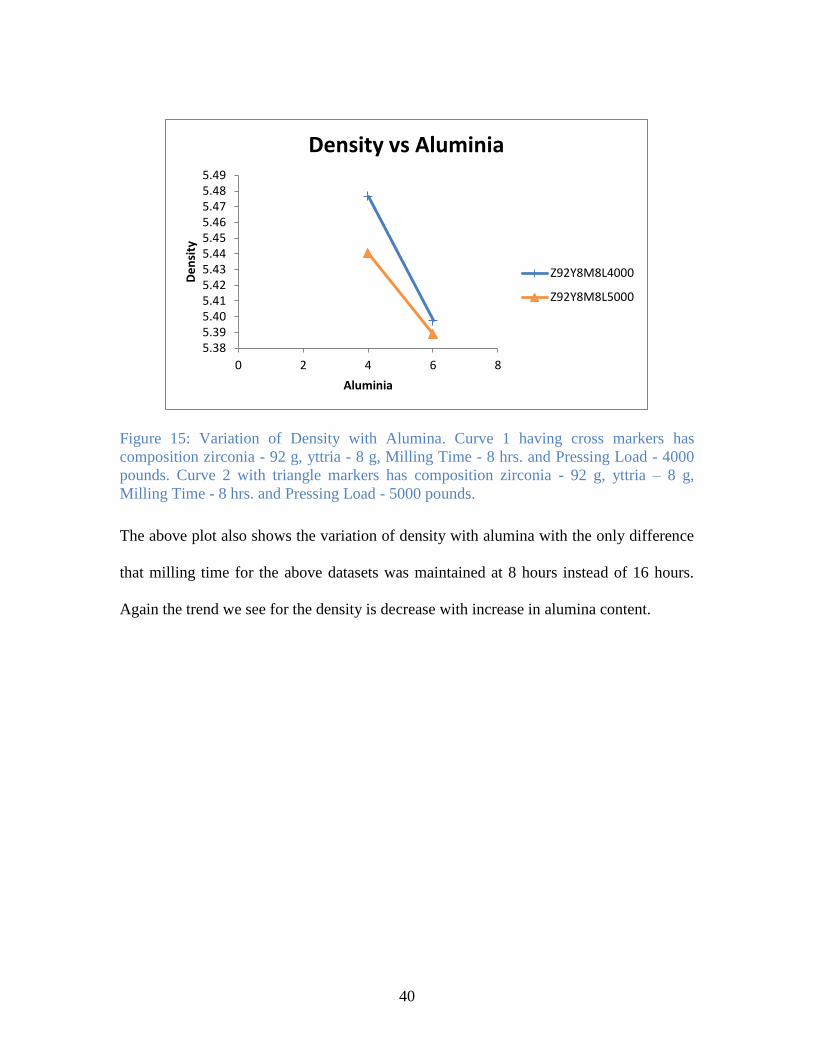
Figure 15: Variation of Density with Alumina. Curve 1 having cross markers has
composition zirconia - 92 g, yttria - 8 g, Milling Time - 8 hrs. and Pressing Load - 4000
pounds. Curve 2 with triangle markers has composition zirconia - 92 g, yttria – 8 g,
Milling Time - 8 hrs. and Pressing Load - 5000 pounds.
The above plot also shows the variation of density with alumina with the only difference
that milling time for the above datasets was maintained at 8 hours instead of 16 hours.
Again the trend we see for the density is decrease with increase in alumina content.
5.385.395.405.415.425.435.445.455.465.475.485.49
0 2 4 6 8
De
nsi
ty
Aluminia
Density vs Aluminia
Z92Y8M8L4000
Z92Y8M8L5000
41
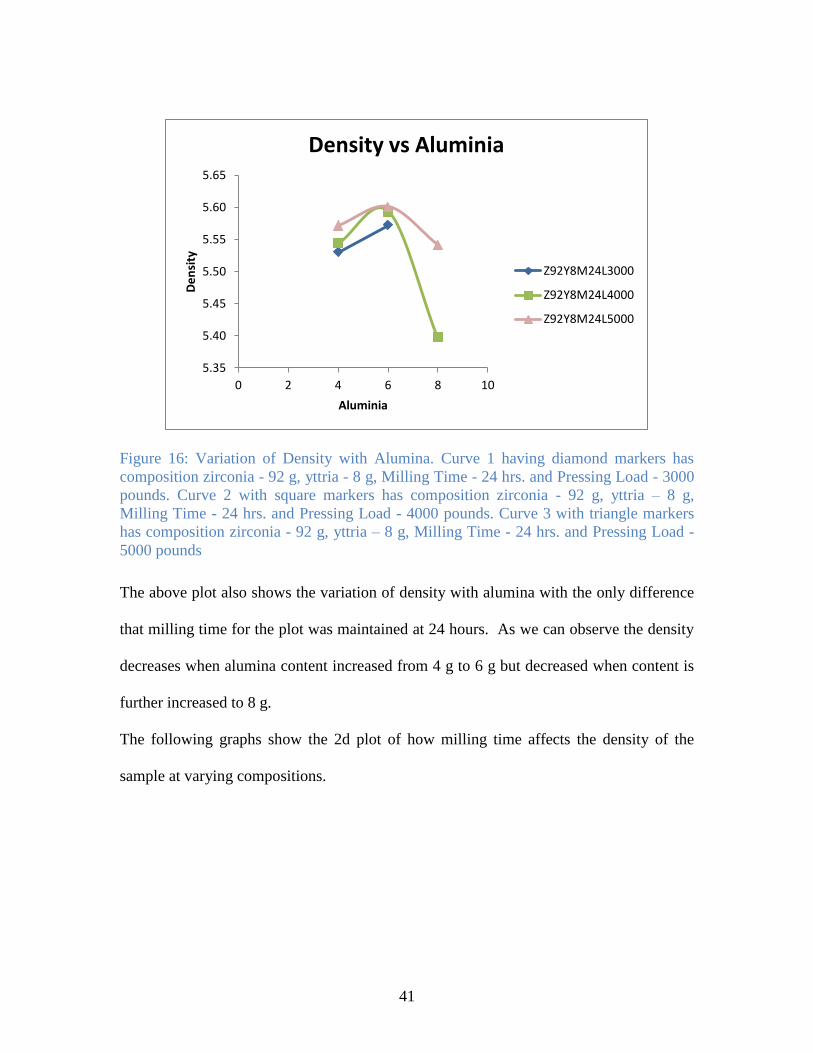
Figure 16: Variation of Density with Alumina. Curve 1 having diamond markers has
composition zirconia - 92 g, yttria - 8 g, Milling Time - 24 hrs. and Pressing Load - 3000
pounds. Curve 2 with square markers has composition zirconia - 92 g, yttria – 8 g,
Milling Time - 24 hrs. and Pressing Load - 4000 pounds. Curve 3 with triangle markers
has composition zirconia - 92 g, yttria – 8 g, Milling Time - 24 hrs. and Pressing Load -
5000 pounds
The above plot also shows the variation of density with alumina with the only difference
that milling time for the plot was maintained at 24 hours. As we can observe the density
decreases when alumina content increased from 4 g to 6 g but decreased when content is
further increased to 8 g.
The following graphs show the 2d plot of how milling time affects the density of the
sample at varying compositions.
5.35
5.40
5.45
5.50
5.55
5.60
5.65
0 2 4 6 8 10
De
nsi
ty
Aluminia
Density vs Aluminia
Z92Y8M24L3000
Z92Y8M24L4000
Z92Y8M24L5000
42
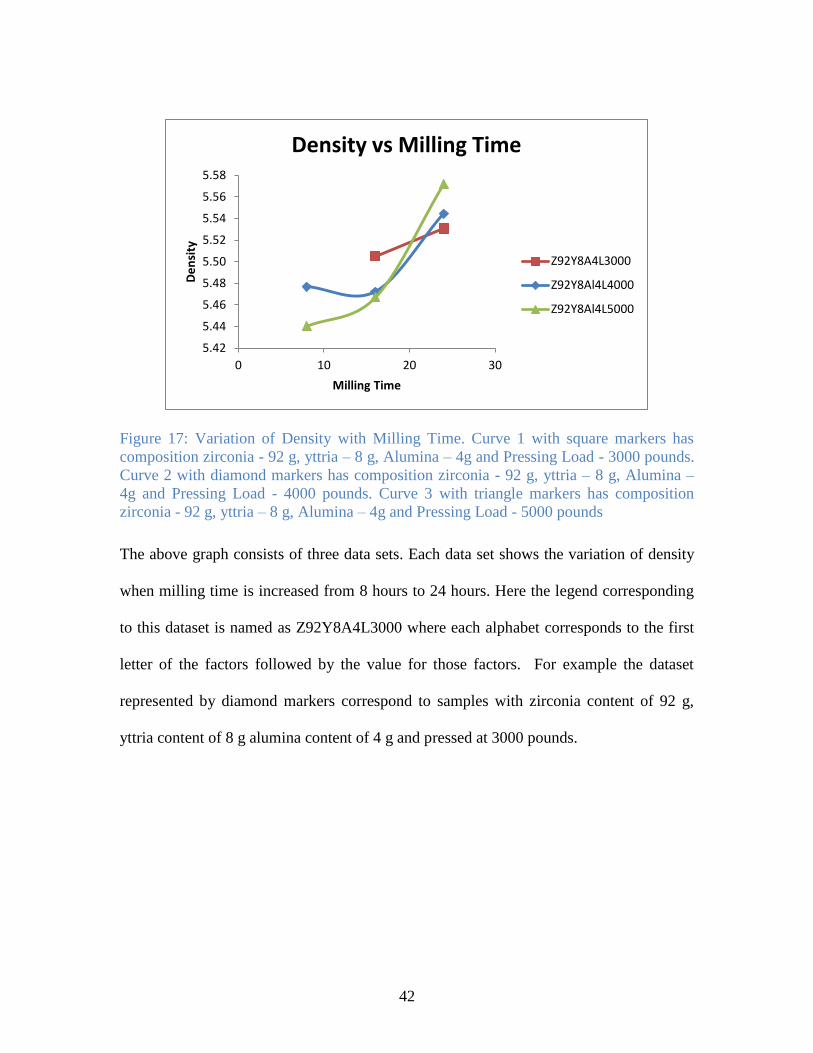
Figure 17: Variation of Density with Milling Time. Curve 1 with square markers has
composition zirconia - 92 g, yttria – 8 g, Alumina – 4g and Pressing Load - 3000 pounds.
Curve 2 with diamond markers has composition zirconia - 92 g, yttria – 8 g, Alumina –
4g and Pressing Load - 4000 pounds. Curve 3 with triangle markers has composition
zirconia - 92 g, yttria – 8 g, Alumina – 4g and Pressing Load - 5000 pounds
The above graph consists of three data sets. Each data set shows the variation of density
when milling time is increased from 8 hours to 24 hours. Here the legend corresponding
to this dataset is named as Z92Y8A4L3000 where each alphabet corresponds to the first
letter of the factors followed by the value for those factors. For example the dataset
represented by diamond markers correspond to samples with zirconia content of 92 g,
yttria content of 8 g alumina content of 4 g and pressed at 3000 pounds.
5.42
5.44
5.46
5.48
5.50
5.52
5.54
5.56
5.58
0 10 20 30
De
nsi
ty
Milling Time
Density vs Milling Time
Z92Y8A4L3000
Z92Y8Al4L4000
Z92Y8Al4L5000
43
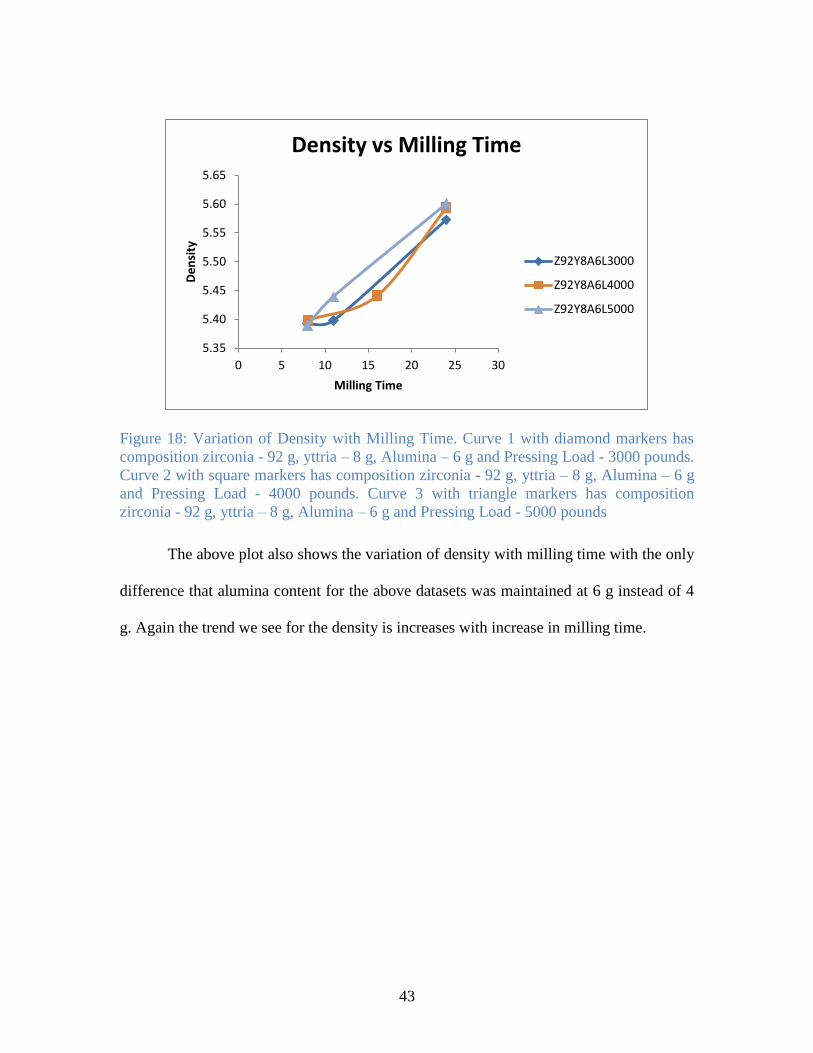
Figure 18: Variation of Density with Milling Time. Curve 1 with diamond markers has
composition zirconia - 92 g, yttria – 8 g, Alumina – 6 g and Pressing Load - 3000 pounds.
Curve 2 with square markers has composition zirconia - 92 g, yttria – 8 g, Alumina – 6 g
and Pressing Load - 4000 pounds. Curve 3 with triangle markers has composition
zirconia - 92 g, yttria – 8 g, Alumina – 6 g and Pressing Load - 5000 pounds
The above plot also shows the variation of density with milling time with the only
difference that alumina content for the above datasets was maintained at 6 g instead of 4
g. Again the trend we see for the density is increases with increase in milling time.
5.35
5.40
5.45
5.50
5.55
5.60
5.65
0 5 10 15 20 25 30
De
nsi
ty
Milling Time
Density vs Milling Time
Z92Y8A6L3000
Z92Y8A6L4000
Z92Y8A6L5000
44
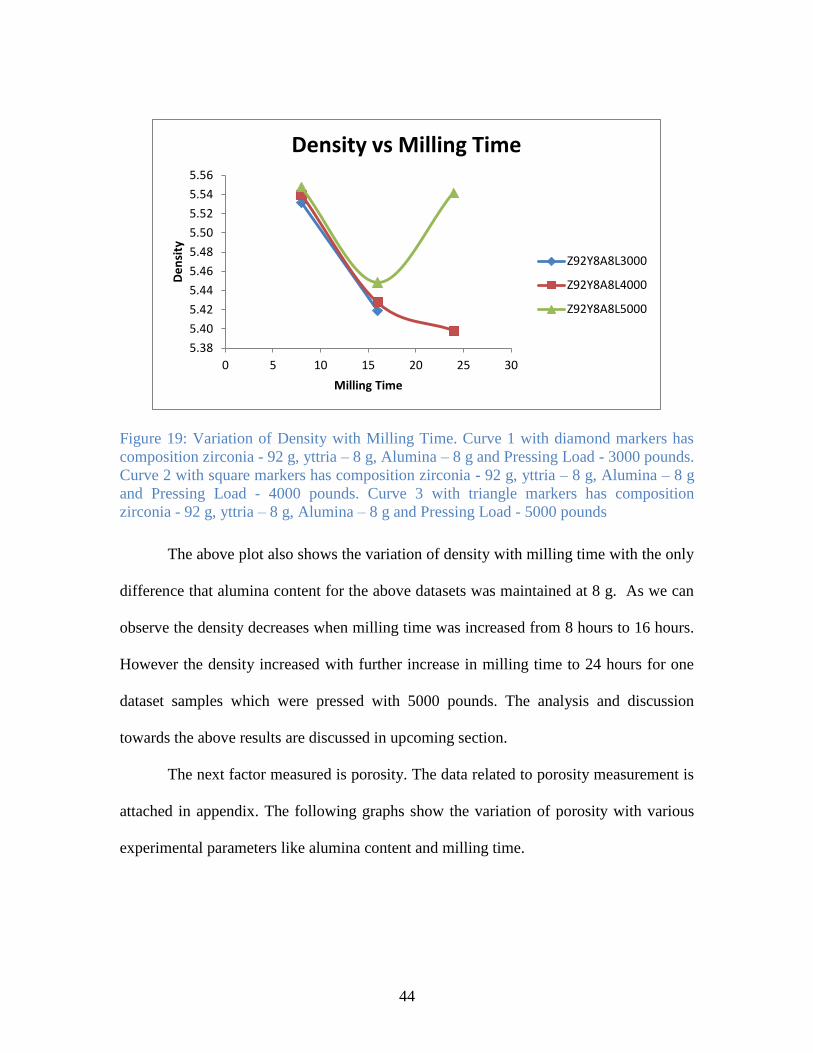
Figure 19: Variation of Density with Milling Time. Curve 1 with diamond markers has
composition zirconia - 92 g, yttria – 8 g, Alumina – 8 g and Pressing Load - 3000 pounds.
Curve 2 with square markers has composition zirconia - 92 g, yttria – 8 g, Alumina – 8 g
and Pressing Load - 4000 pounds. Curve 3 with triangle markers has composition
zirconia - 92 g, yttria – 8 g, Alumina – 8 g and Pressing Load - 5000 pounds
The above plot also shows the variation of density with milling time with the only
difference that alumina content for the above datasets was maintained at 8 g. As we can
observe the density decreases when milling time was increased from 8 hours to 16 hours.
However the density increased with further increase in milling time to 24 hours for one
dataset samples which were pressed with 5000 pounds. The analysis and discussion
towards the above results are discussed in upcoming section.
The next factor measured is porosity. The data related to porosity measurement is
attached in appendix. The following graphs show the variation of porosity with various
experimental parameters like alumina content and milling time.
5.38
5.40
5.42
5.44
5.46
5.48
5.50
5.52
5.54
5.56
0 5 10 15 20 25 30
De
nsi
ty
Milling Time
Density vs Milling Time
Z92Y8A8L3000
Z92Y8A8L4000
Z92Y8A8L5000
45
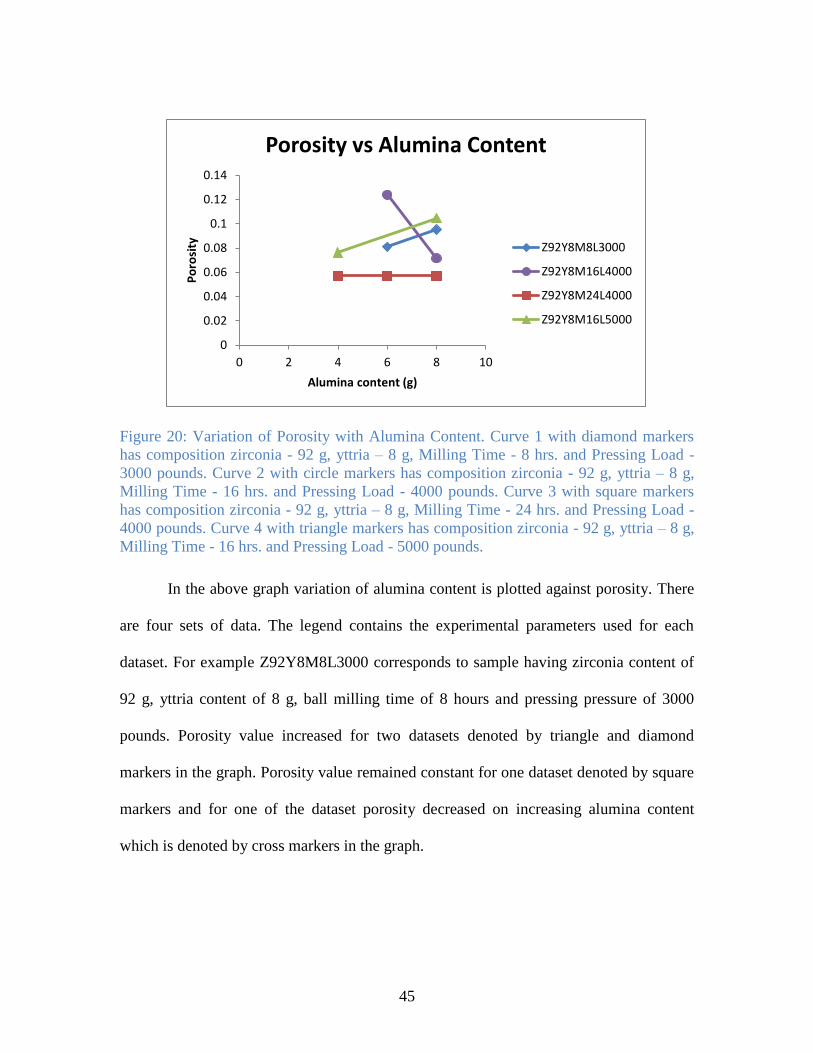
Figure 20: Variation of Porosity with Alumina Content. Curve 1 with diamond markers
has composition zirconia - 92 g, yttria – 8 g, Milling Time - 8 hrs. and Pressing Load -
3000 pounds. Curve 2 with circle markers has composition zirconia - 92 g, yttria – 8 g,
Milling Time - 16 hrs. and Pressing Load - 4000 pounds. Curve 3 with square markers
has composition zirconia - 92 g, yttria – 8 g, Milling Time - 24 hrs. and Pressing Load -
4000 pounds. Curve 4 with triangle markers has composition zirconia - 92 g, yttria – 8 g,
Milling Time - 16 hrs. and Pressing Load - 5000 pounds.
In the above graph variation of alumina content is plotted against porosity. There
are four sets of data. The legend contains the experimental parameters used for each
dataset. For example Z92Y8M8L3000 corresponds to sample having zirconia content of
92 g, yttria content of 8 g, ball milling time of 8 hours and pressing pressure of 3000
pounds. Porosity value increased for two datasets denoted by triangle and diamond
markers in the graph. Porosity value remained constant for one dataset denoted by square
markers and for one of the dataset porosity decreased on increasing alumina content
which is denoted by cross markers in the graph.
0
0.02
0.04
0.06
0.08
0.1
0.12
0.14
0 2 4 6 8 10
Po
rosi
ty
Alumina content (g)
Porosity vs Alumina Content
Z92Y8M8L3000
Z92Y8M16L4000
Z92Y8M24L4000
Z92Y8M16L5000
46
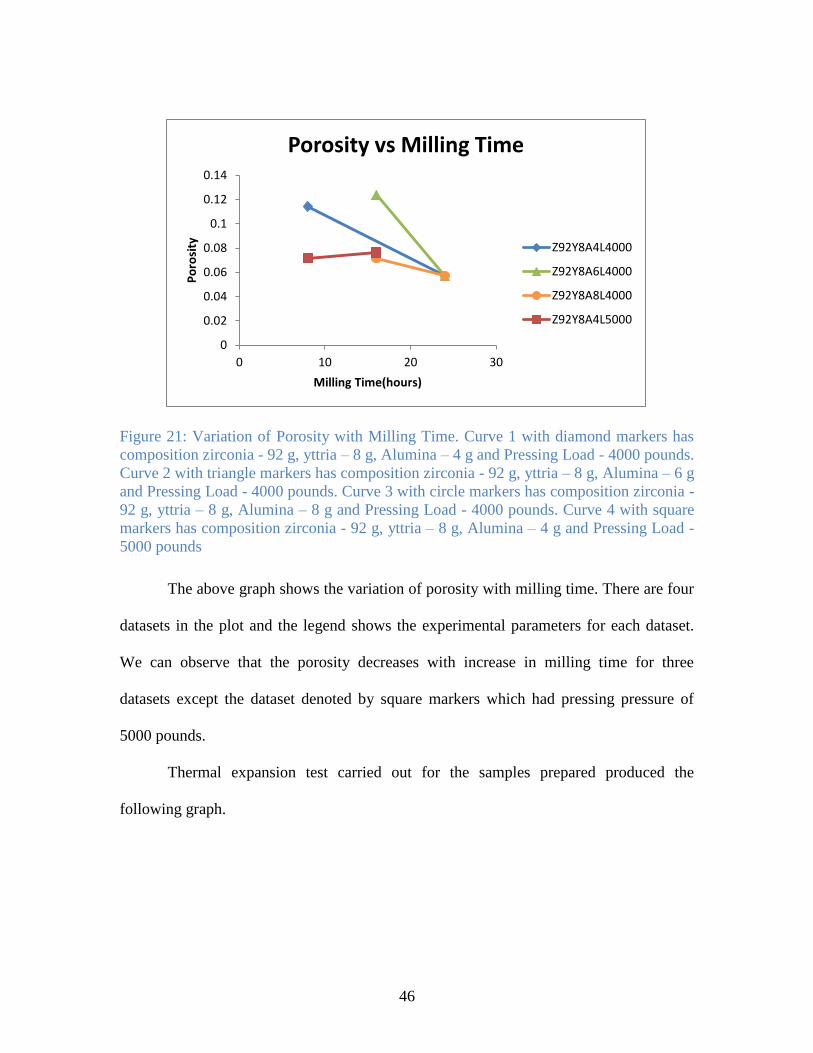
Figure 21: Variation of Porosity with Milling Time. Curve 1 with diamond markers has
composition zirconia - 92 g, yttria – 8 g, Alumina – 4 g and Pressing Load - 4000 pounds.
Curve 2 with triangle markers has composition zirconia - 92 g, yttria – 8 g, Alumina – 6 g
and Pressing Load - 4000 pounds. Curve 3 with circle markers has composition zirconia -
92 g, yttria – 8 g, Alumina – 8 g and Pressing Load - 4000 pounds. Curve 4 with square
markers has composition zirconia - 92 g, yttria – 8 g, Alumina – 4 g and Pressing Load -
5000 pounds
The above graph shows the variation of porosity with milling time. There are four
datasets in the plot and the legend shows the experimental parameters for each dataset.
We can observe that the porosity decreases with increase in milling time for three
datasets except the dataset denoted by square markers which had pressing pressure of
5000 pounds.
Thermal expansion test carried out for the samples prepared produced the
following graph.
0
0.02
0.04
0.06
0.08
0.1
0.12
0.14
0 10 20 30
Po
rosi
ty
Milling Time(hours)
Porosity vs Milling Time
Z92Y8A4L4000
Z92Y8A6L4000
Z92Y8A8L4000
Z92Y8A4L5000
47
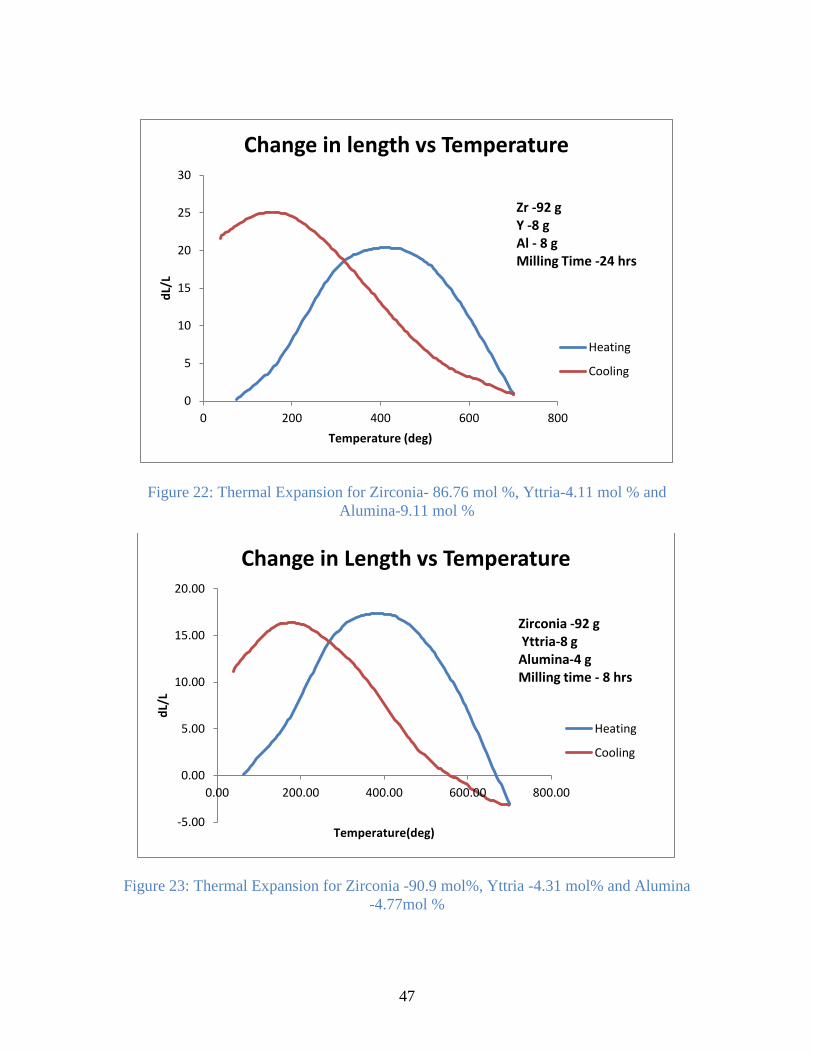
Figure 22: Thermal Expansion for Zirconia- 86.76 mol %, Yttria-4.11 mol % and
Alumina-9.11 mol %
Figure 23: Thermal Expansion for Zirconia -90.9 mol%, Yttria -4.31 mol% and Alumina
-4.77mol %
0
5
10
15
20
25
30
0 200 400 600 800
dL/
L
Temperature (deg)
Change in length vs Temperature
Heating
Cooling
Zr -92 g Y -8 g Al - 8 g Milling Time -24 hrs
-5.00
0.00
5.00
10.00
15.00
20.00
0.00 200.00 400.00 600.00 800.00
dL/
L
Temperature(deg)
Change in Length vs Temperature
Heating
Cooling
Zirconia -92 g Yttria-8 g Alumina-4 g Milling time - 8 hrs
48
From the above two expansion curves we can see that the samples expand
initially on heating until 410°C after which it starts contracting on heating. Also we can
see that the samples on cooling do not return to their original dimensions and permanent
deformation can be observed.
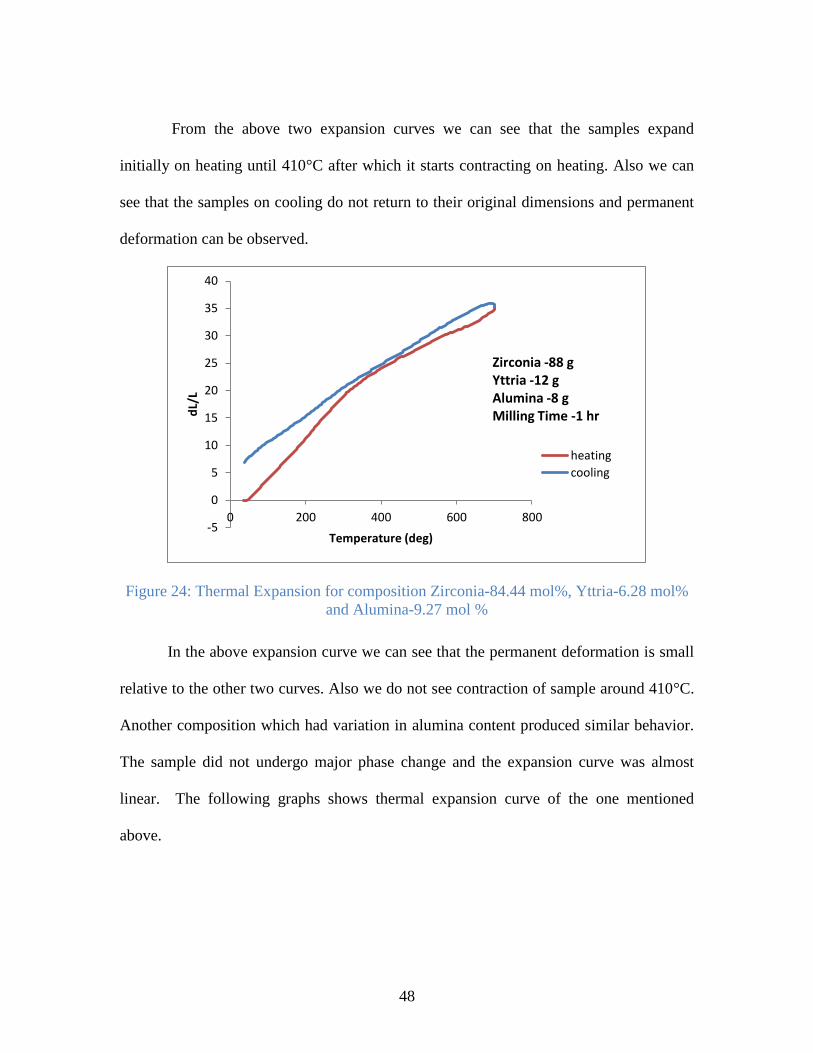
Figure 24: Thermal Expansion for composition Zirconia-84.44 mol%, Yttria-6.28 mol%
and Alumina-9.27 mol %
In the above expansion curve we can see that the permanent deformation is small
relative to the other two curves. Also we do not see contraction of sample around 410°C.
Another composition which had variation in alumina content produced similar behavior.
The sample did not undergo major phase change and the expansion curve was almost
linear. The following graphs shows thermal expansion curve of the one mentioned
above.
-5
0
5
10
15
20
25
30
35
40
0 200 400 600 800
dL/
L
Temperature (deg)
heating
cooling
Zirconia -88 g Yttria -12 g Alumina -8 g Milling Time -1 hr
49
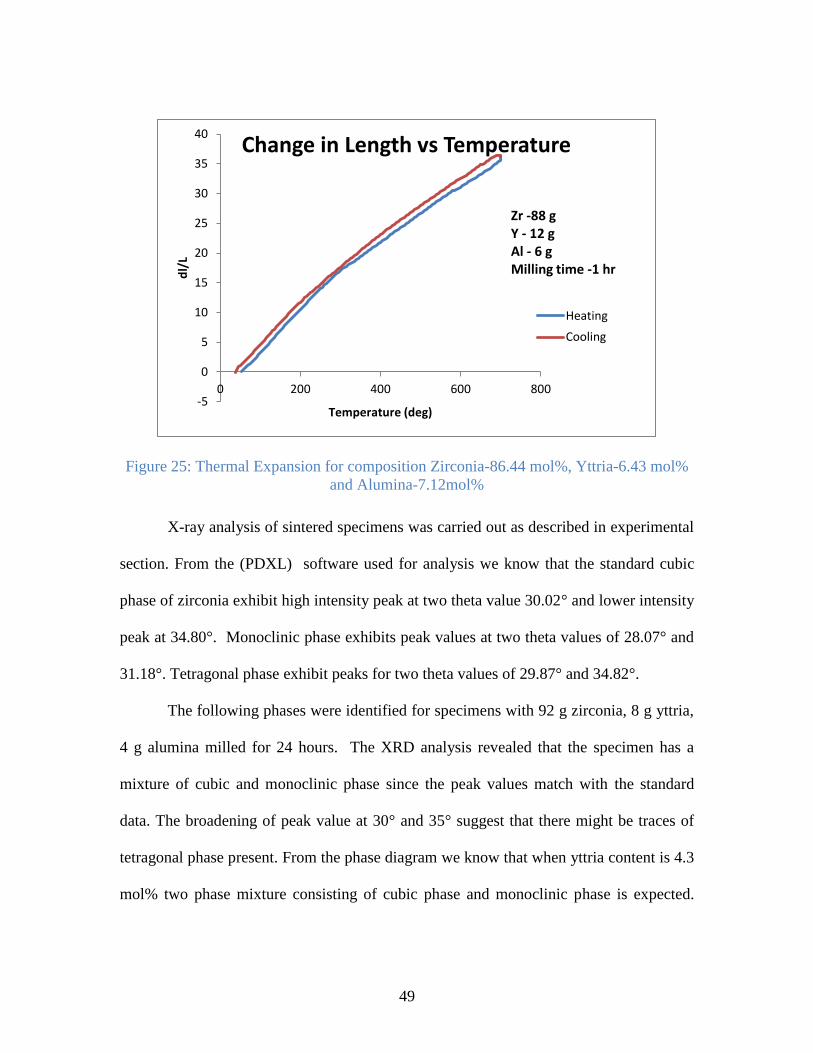
Figure 25: Thermal Expansion for composition Zirconia-86.44 mol%, Yttria-6.43 mol%
and Alumina-7.12mol%
X-ray analysis of sintered specimens was carried out as described in experimental
section. From the (PDXL) software used for analysis we know that the standard cubic
phase of zirconia exhibit high intensity peak at two theta value 30.02° and lower intensity
peak at 34.80°. Monoclinic phase exhibits peak values at two theta values of 28.07° and
31.18°. Tetragonal phase exhibit peaks for two theta values of 29.87° and 34.82°.
The following phases were identified for specimens with 92 g zirconia, 8 g yttria,
4 g alumina milled for 24 hours. The XRD analysis revealed that the specimen has a
mixture of cubic and monoclinic phase since the peak values match with the standard
data. The broadening of peak value at 30° and 35° suggest that there might be traces of
tetragonal phase present. From the phase diagram we know that when yttria content is 4.3
mol% two phase mixture consisting of cubic phase and monoclinic phase is expected.
-5
0
5
10
15
20
25
30
35
40
0 200 400 600 800
dl/
L
Temperature (deg)
Change in Length vs Temperature
Heating
Cooling
Zr -88 g Y - 12 g Al - 6 g Milling time -1 hr
50
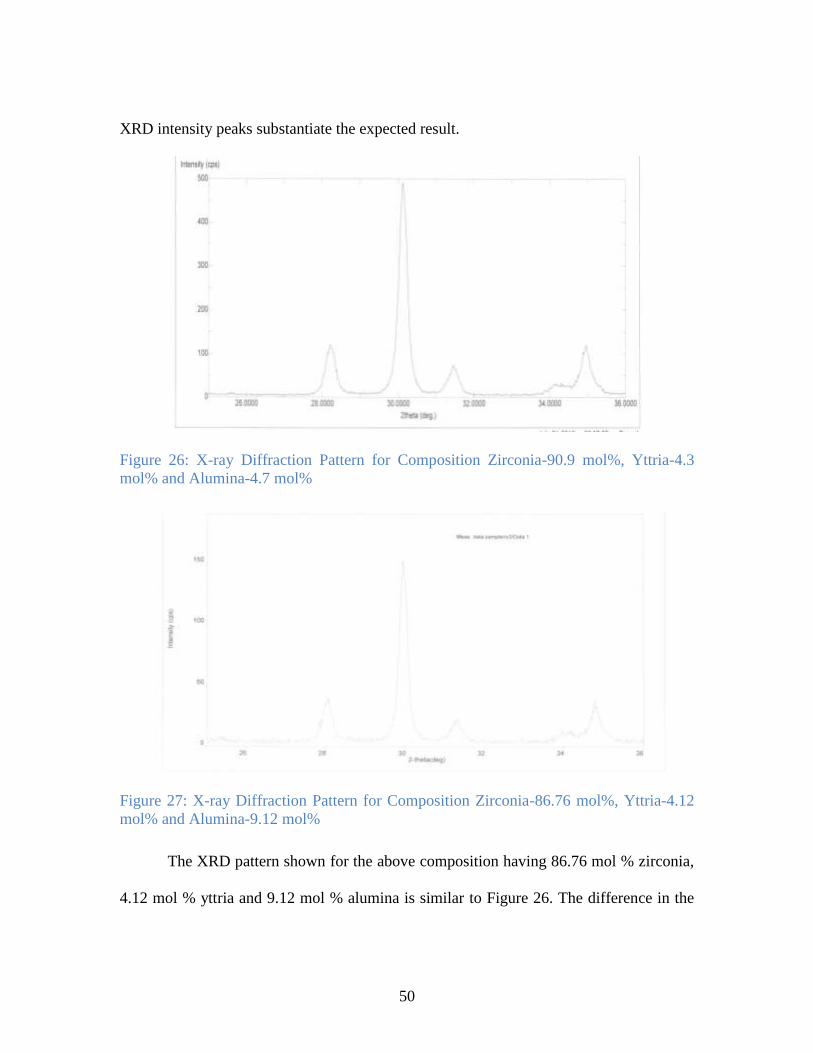
XRD intensity peaks substantiate the expected result.
Figure 26: X-ray Diffraction Pattern for Composition Zirconia-90.9 mol%, Yttria-4.3
mol% and Alumina-4.7 mol%
Figure 27: X-ray Diffraction Pattern for Composition Zirconia-86.76 mol%, Yttria-4.12
mol% and Alumina-9.12 mol%
The XRD pattern shown for the above composition having 86.76 mol % zirconia,
4.12 mol % yttria and 9.12 mol % alumina is similar to Figure 26. The difference in the
51
two curves is that monoclinic phase content increases as the amount of alumina increases
which causes a decrease in zirconia fraction. Similarly other compositions were
examined. They are shown below.
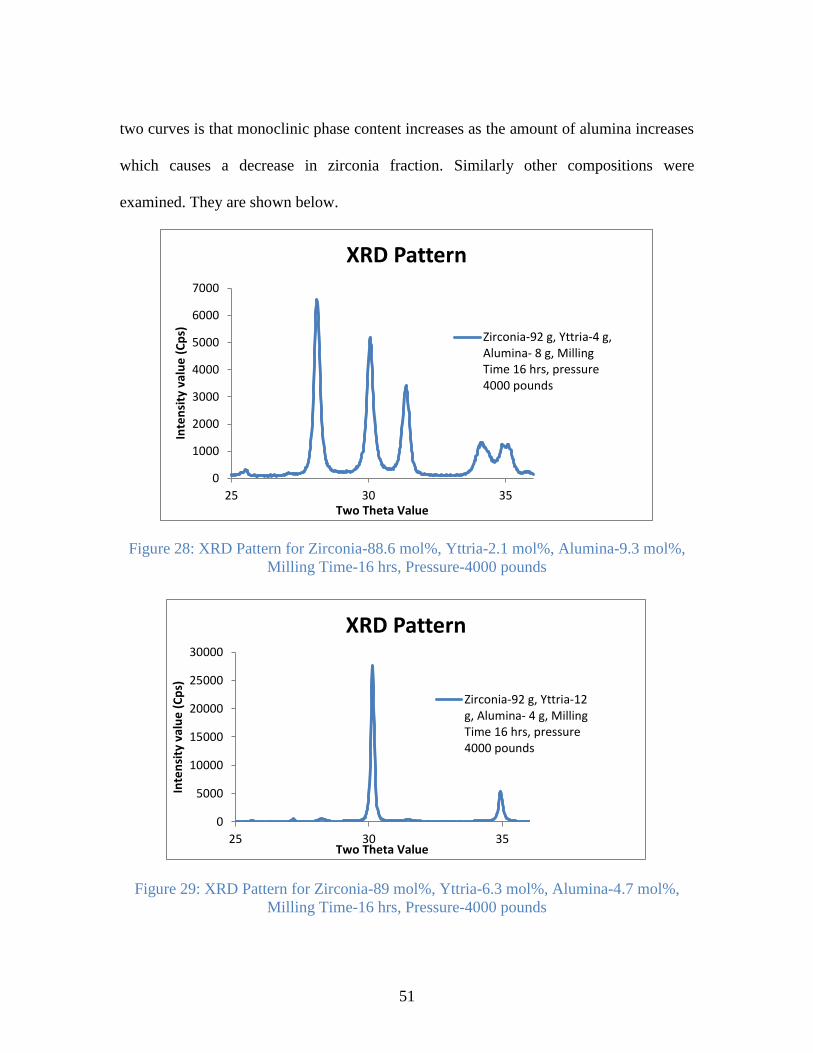
Figure 28: XRD Pattern for Zirconia-88.6 mol%, Yttria-2.1 mol%, Alumina-9.3 mol%,
Milling Time-16 hrs, Pressure-4000 pounds
Figure 29: XRD Pattern for Zirconia-89 mol%, Yttria-6.3 mol%, Alumina-4.7 mol%,
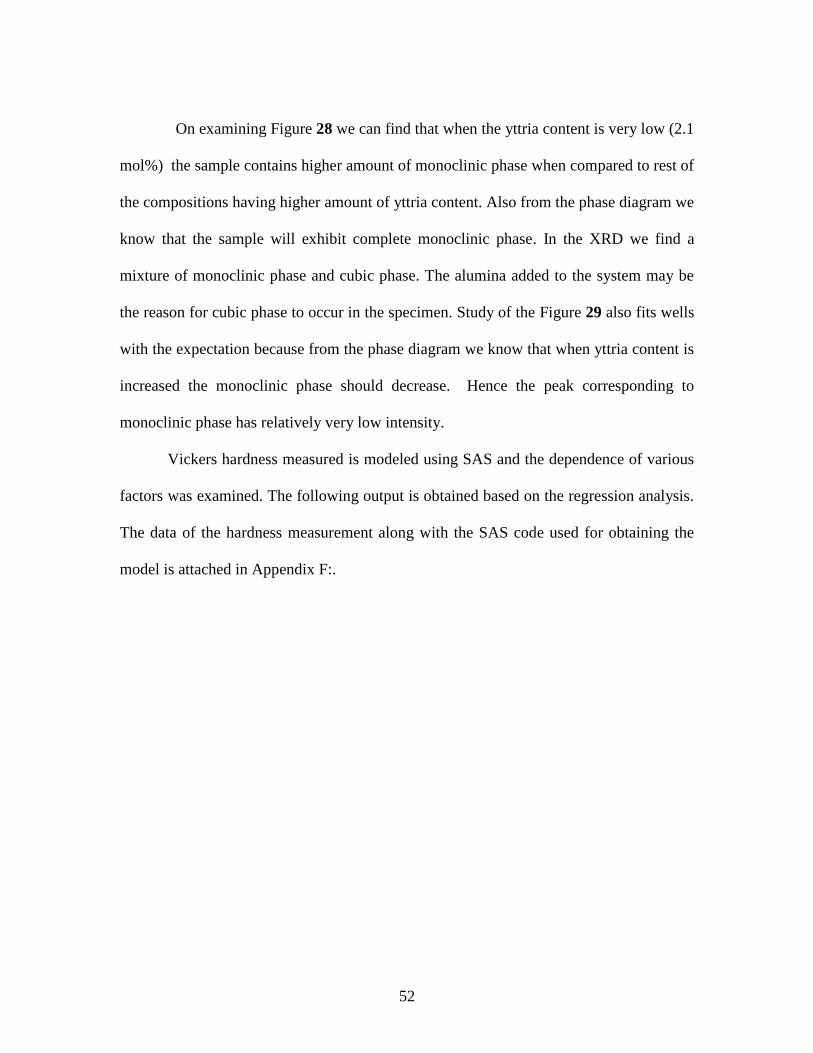
Milling Time-16 hrs, Pressure-4000 pounds
0
1000
2000
3000
4000
5000
6000
7000
25 30 35
Inte
nsi
ty v
alu
e (
Cp
s)
Two Theta Value
XRD Pattern
Zirconia-92 g, Yttria-4 g,Alumina- 8 g, MillingTime 16 hrs, pressure4000 pounds
0
5000
10000
15000
20000
25000
30000
25 30 35
Inte
nsi
ty v
alu
e (
Cp
s)
Two Theta Value
XRD Pattern
Zirconia-92 g, Yttria-12g, Alumina- 4 g, MillingTime 16 hrs, pressure4000 pounds
52
On examining Figure 28 we can find that when the yttria content is very low (2.1
mol%) the sample contains higher amount of monoclinic phase when compared to rest of
the compositions having higher amount of yttria content. Also from the phase diagram we
know that the sample will exhibit complete monoclinic phase. In the XRD we find a
mixture of monoclinic phase and cubic phase. The alumina added to the system may be
the reason for cubic phase to occur in the specimen. Study of the Figure 29 also fits wells
with the expectation because from the phase diagram we know that when yttria content is
increased the monoclinic phase should decrease. Hence the peak corresponding to
monoclinic phase has relatively very low intensity.
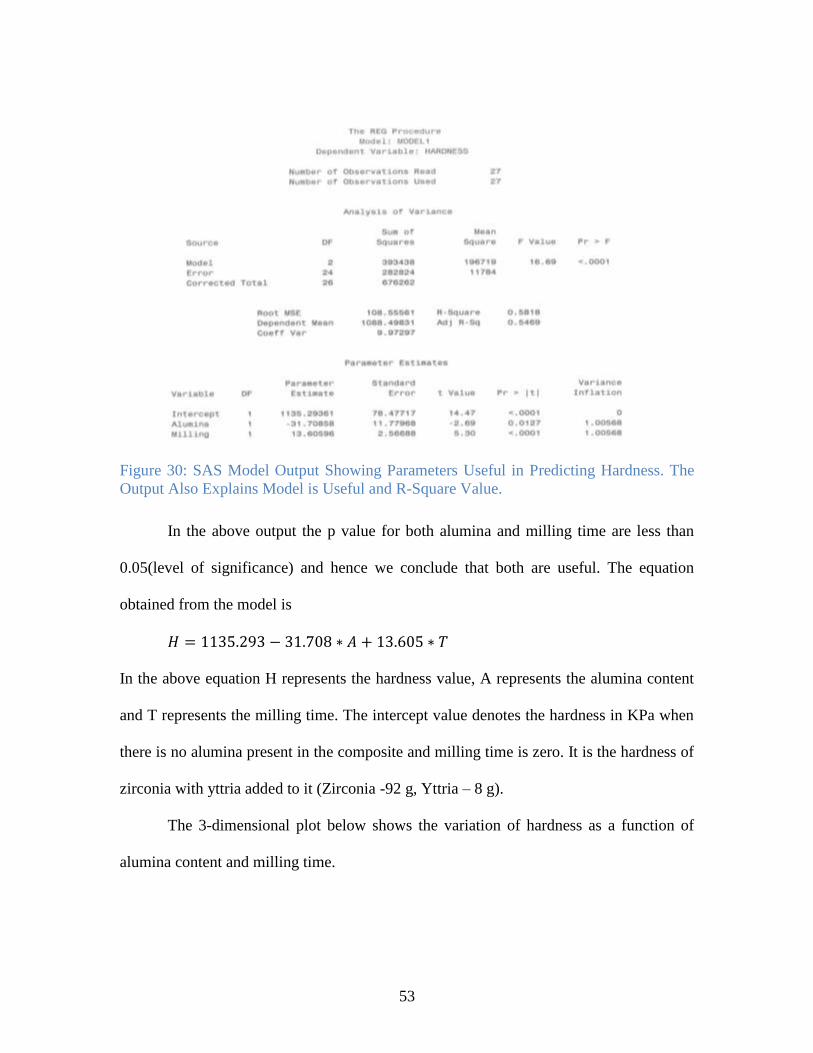
Vickers hardness measured is modeled using SAS and the dependence of various
factors was examined. The following output is obtained based on the regression analysis.
The data of the hardness measurement along with the SAS code used for obtaining the
model is attached in Appendix F:.
53
Figure 30: SAS Model Output Showing Parameters Useful in Predicting Hardness. The
Output Also Explains Model is Useful and R-Square Value.
In the above output the p value for both alumina and milling time are less than
0.05(level of significance) and hence we conclude that both are useful. The equation
obtained from the model is
In the above equation H represents the hardness value, A represents the alumina content
and T represents the milling time. The intercept value denotes the hardness in KPa when
there is no alumina present in the composite and milling time is zero. It is the hardness of
zirconia with yttria added to it (Zirconia -92 g, Yttria – 8 g).
The 3-dimensional plot below shows the variation of hardness as a function of
alumina content and milling time.
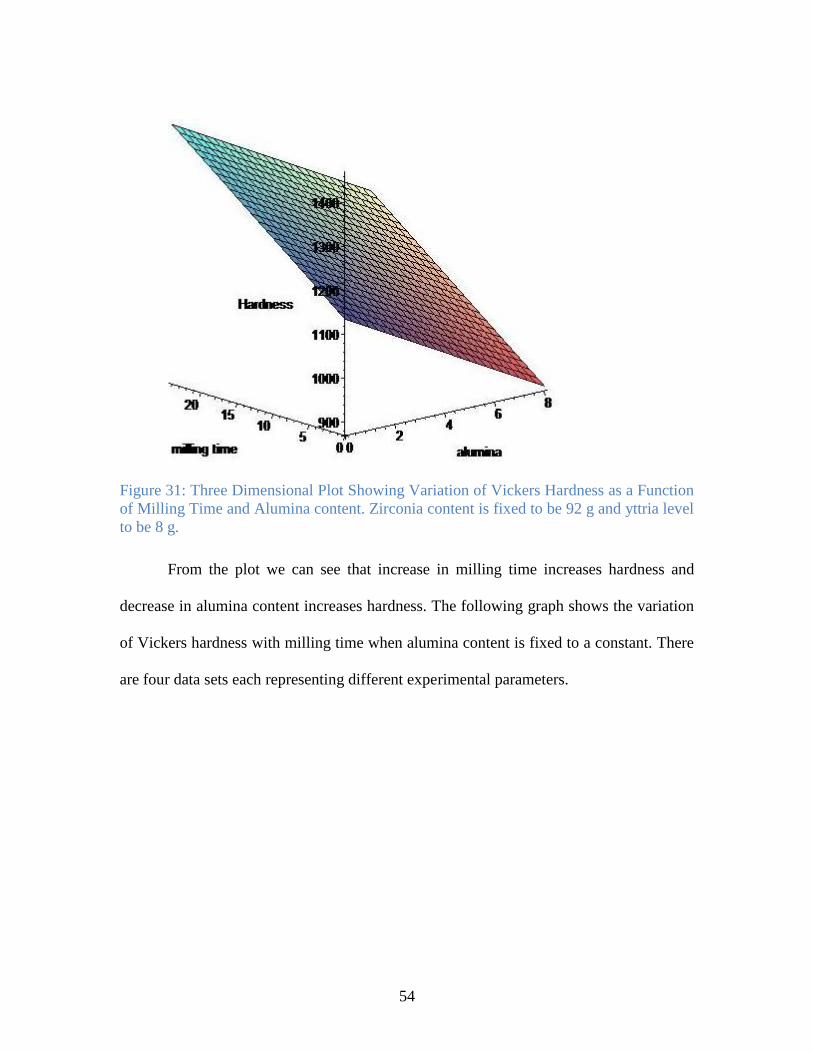
54
Figure 31: Three Dimensional Plot Showing Variation of Vickers Hardness as a Function
of Milling Time and Alumina content. Zirconia content is fixed to be 92 g and yttria level
to be 8 g.
From the plot we can see that increase in milling time increases hardness and
decrease in alumina content increases hardness. The following graph shows the variation
of Vickers hardness with milling time when alumina content is fixed to a constant. There
are four data sets each representing different experimental parameters.
55
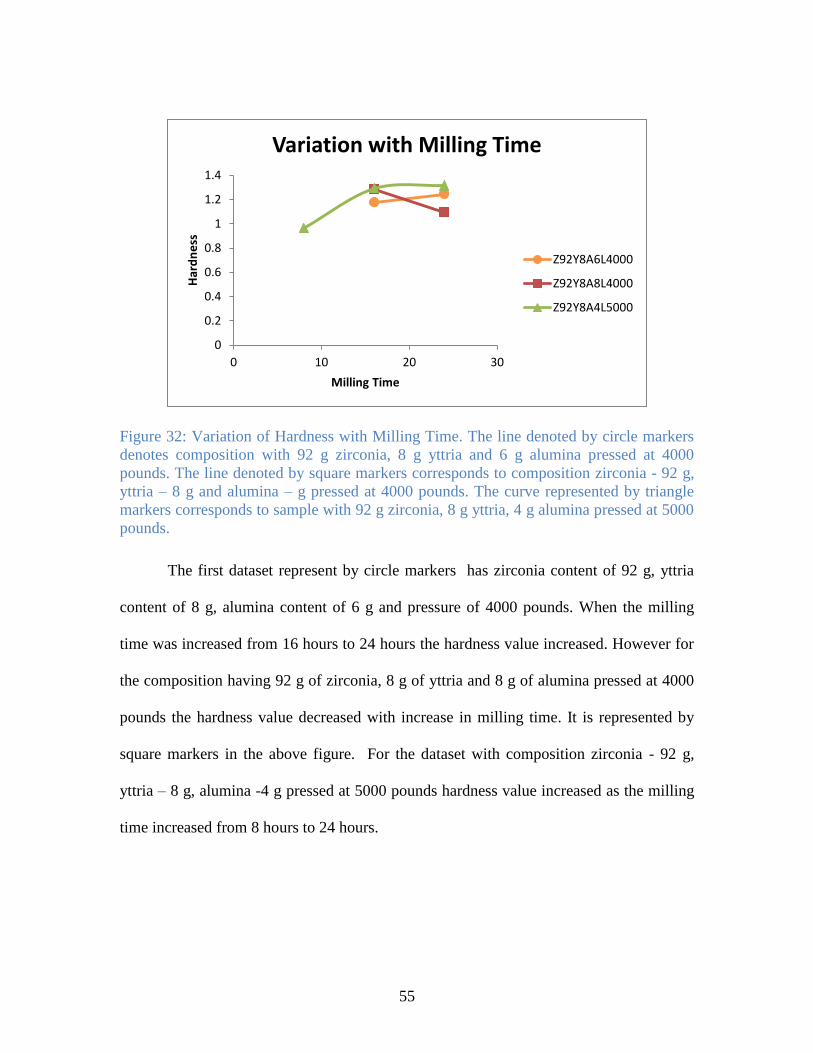
Figure 32: Variation of Hardness with Milling Time. The line denoted by circle markers
denotes composition with 92 g zirconia, 8 g yttria and 6 g alumina pressed at 4000
pounds. The line denoted by square markers corresponds to composition zirconia - 92 g,
yttria – 8 g and alumina – g pressed at 4000 pounds. The curve represented by triangle
markers corresponds to sample with 92 g zirconia, 8 g yttria, 4 g alumina pressed at 5000
pounds.
The first dataset represent by circle markers has zirconia content of 92 g, yttria
content of 8 g, alumina content of 6 g and pressure of 4000 pounds. When the milling
time was increased from 16 hours to 24 hours the hardness value increased. However for
the composition having 92 g of zirconia, 8 g of yttria and 8 g of alumina pressed at 4000
pounds the hardness value decreased with increase in milling time. It is represented by
square markers in the above figure. For the dataset with composition zirconia - 92 g,
yttria – 8 g, alumina -4 g pressed at 5000 pounds hardness value increased as the milling
time increased from 8 hours to 24 hours.
0
0.2
0.4
0.6
0.8
1
1.2
1.4
0 10 20 30
Har
dn
ess
Milling Time
Variation with Milling Time
Z92Y8A6L4000
Z92Y8A8L4000
Z92Y8A4L5000
56
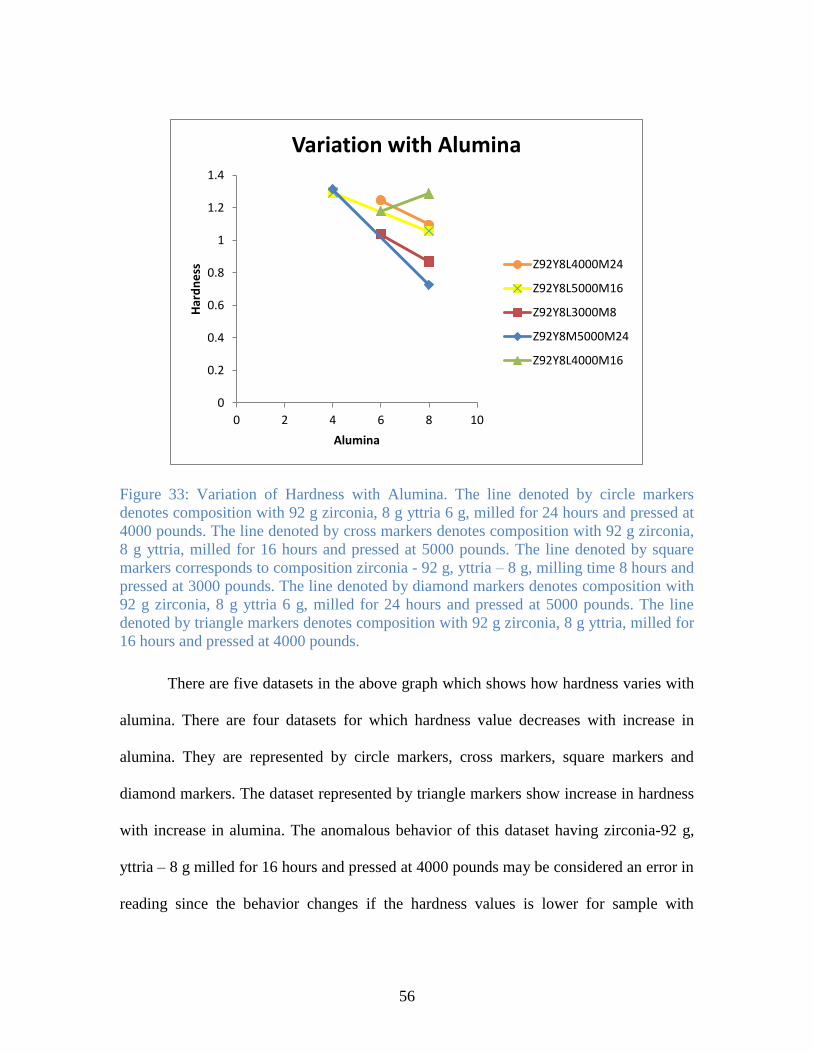
Figure 33: Variation of Hardness with Alumina. The line denoted by circle markers
denotes composition with 92 g zirconia, 8 g yttria 6 g, milled for 24 hours and pressed at
4000 pounds. The line denoted by cross markers denotes composition with 92 g zirconia,
8 g yttria, milled for 16 hours and pressed at 5000 pounds. The line denoted by square
markers corresponds to composition zirconia - 92 g, yttria – 8 g, milling time 8 hours and
pressed at 3000 pounds. The line denoted by diamond markers denotes composition with
92 g zirconia, 8 g yttria 6 g, milled for 24 hours and pressed at 5000 pounds. The line
denoted by triangle markers denotes composition with 92 g zirconia, 8 g yttria, milled for
16 hours and pressed at 4000 pounds.
There are five datasets in the above graph which shows how hardness varies with
alumina. There are four datasets for which hardness value decreases with increase in
alumina. They are represented by circle markers, cross markers, square markers and
diamond markers. The dataset represented by triangle markers show increase in hardness
with increase in alumina. The anomalous behavior of this dataset having zirconia-92 g,
yttria – 8 g milled for 16 hours and pressed at 4000 pounds may be considered an error in
reading since the behavior changes if the hardness values is lower for sample with
0
0.2
0.4
0.6
0.8
1
1.2
1.4
0 2 4 6 8 10
Har
dn
ess
Alumina
Variation with Alumina
Z92Y8L4000M24
Z92Y8L5000M16
Z92Y8L3000M8
Z92Y8M5000M24
Z92Y8L4000M16
57
alumina content of 8 g when compared to sample with alumina content of 6 g.
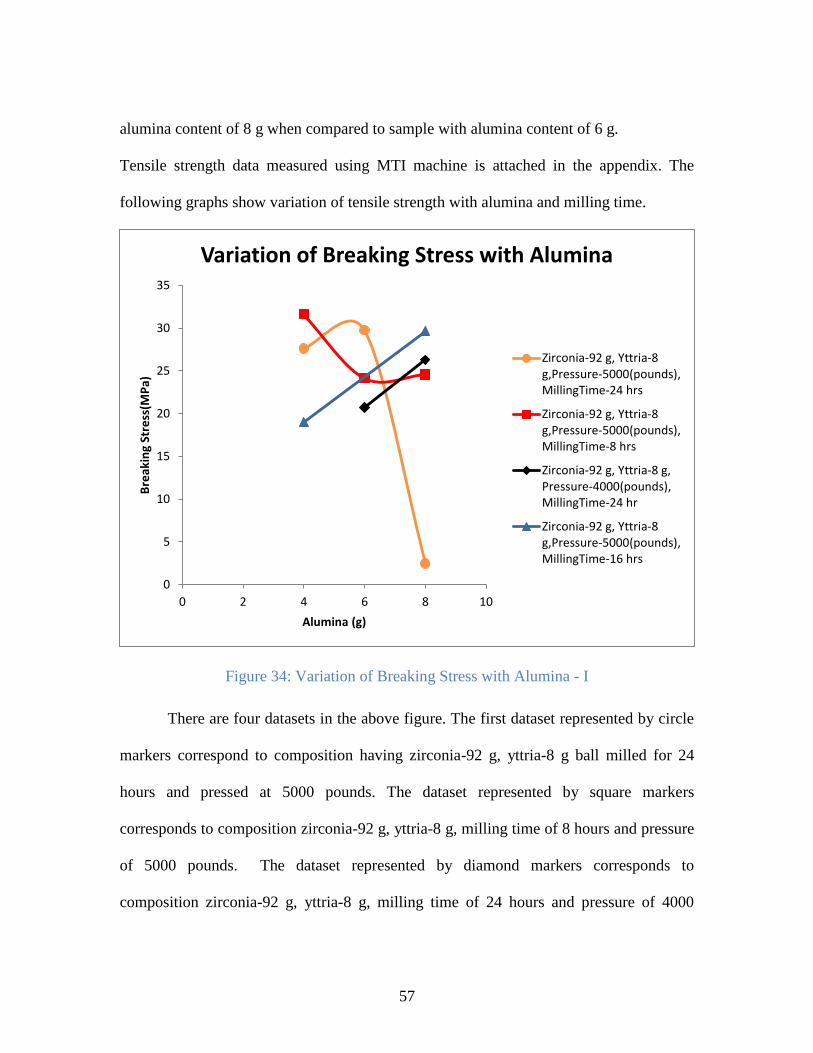
Tensile strength data measured using MTI machine is attached in the appendix. The
following graphs show variation of tensile strength with alumina and milling time.
Figure 34: Variation of Breaking Stress with Alumina - I
There are four datasets in the above figure. The first dataset represented by circle
markers correspond to composition having zirconia-92 g, yttria-8 g ball milled for 24
hours and pressed at 5000 pounds. The dataset represented by square markers
corresponds to composition zirconia-92 g, yttria-8 g, milling time of 8 hours and pressure
of 5000 pounds. The dataset represented by diamond markers corresponds to
composition zirconia-92 g, yttria-8 g, milling time of 24 hours and pressure of 4000
0
5
10
15
20
25
30
35
0 2 4 6 8 10
Bre
akin
g St
ress
(MP
a)
Alumina (g)
Variation of Breaking Stress with Alumina
Zirconia-92 g, Yttria-8g,Pressure-5000(pounds),MillingTime-24 hrs
Zirconia-92 g, Yttria-8g,Pressure-5000(pounds),MillingTime-8 hrs
Zirconia-92 g, Yttria-8 g,Pressure-4000(pounds),MillingTime-24 hr
Zirconia-92 g, Yttria-8g,Pressure-5000(pounds),MillingTime-16 hrs
58
pounds. The dataset represented by triangle markers corresponds to composition zirconia-
92 g, yttria-8 g, milling time of 16 hours and pressure of 5000 pounds. The first curve
initially showed an increase in strength followed by decrease in value. The second set
represented by square markers showed initial decrease in strength after which it
increased. Dataset third and fourth represented by diamond and triangle markers showed
increase in strength when the alumina content is increased. There are four more
compositions for which breaking stress variation was analyzed as a function of alumina.
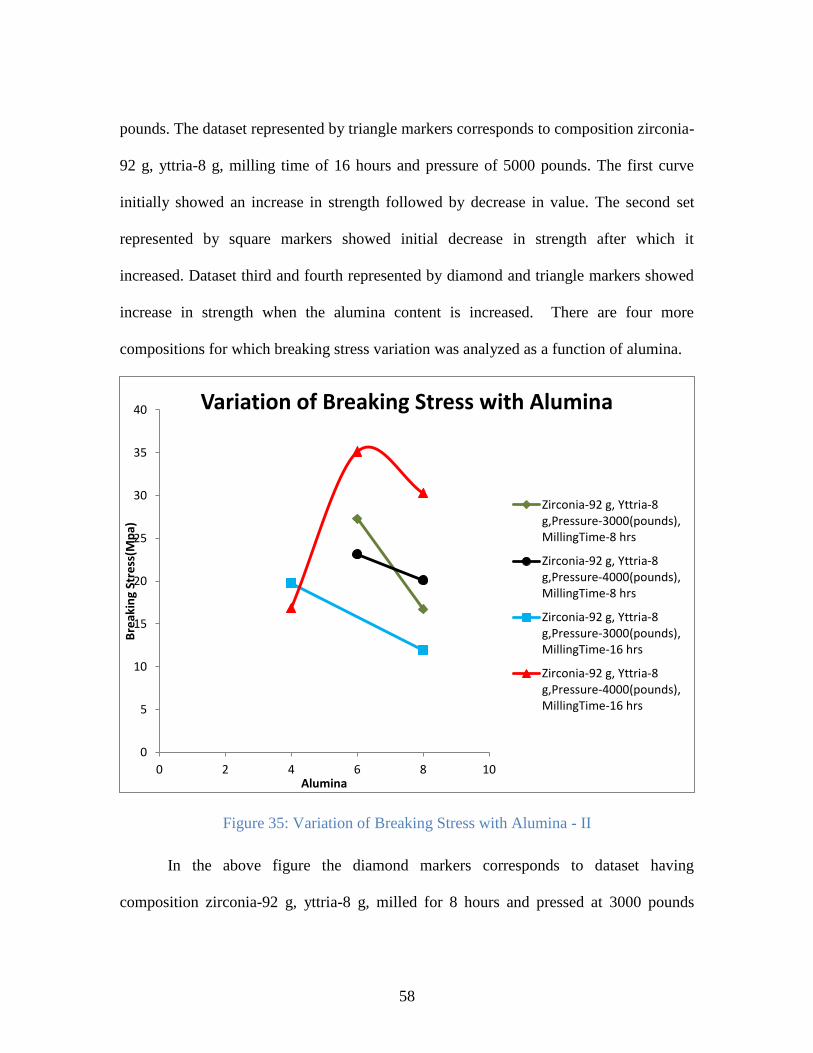
Figure 35: Variation of Breaking Stress with Alumina - II
In the above figure the diamond markers corresponds to dataset having
composition zirconia-92 g, yttria-8 g, milled for 8 hours and pressed at 3000 pounds
0
5
10
15
20
25
30
35
40
0 2 4 6 8 10
Bre
akin
g St
ress
(Mp
a)
Alumina
Variation of Breaking Stress with Alumina
Zirconia-92 g, Yttria-8g,Pressure-3000(pounds),MillingTime-8 hrs
Zirconia-92 g, Yttria-8g,Pressure-4000(pounds),MillingTime-8 hrs
Zirconia-92 g, Yttria-8g,Pressure-3000(pounds),MillingTime-16 hrs
Zirconia-92 g, Yttria-8g,Pressure-4000(pounds),MillingTime-16 hrs
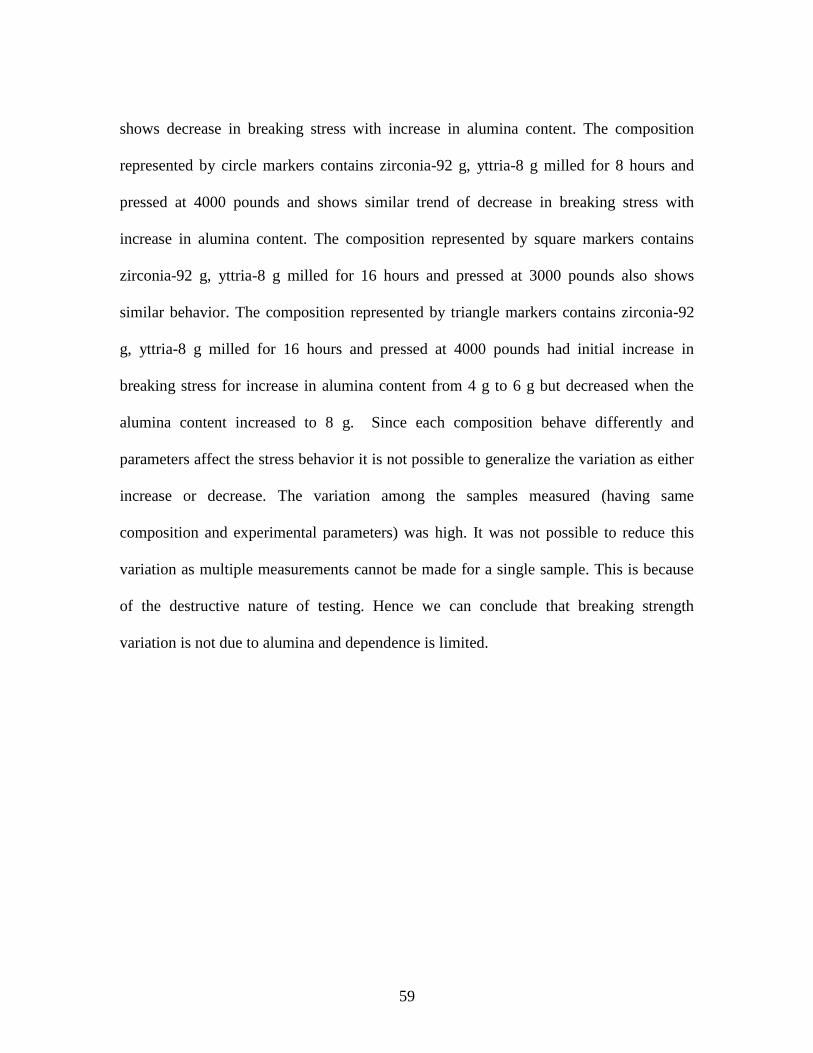
59
shows decrease in breaking stress with increase in alumina content. The composition
represented by circle markers contains zirconia-92 g, yttria-8 g milled for 8 hours and
pressed at 4000 pounds and shows similar trend of decrease in breaking stress with
increase in alumina content. The composition represented by square markers contains
zirconia-92 g, yttria-8 g milled for 16 hours and pressed at 3000 pounds also shows
similar behavior. The composition represented by triangle markers contains zirconia-92
g, yttria-8 g milled for 16 hours and pressed at 4000 pounds had initial increase in
breaking stress for increase in alumina content from 4 g to 6 g but decreased when the
alumina content increased to 8 g. Since each composition behave differently and
parameters affect the stress behavior it is not possible to generalize the variation as either
increase or decrease. The variation among the samples measured (having same
composition and experimental parameters) was high. It was not possible to reduce this
variation as multiple measurements cannot be made for a single sample. This is because
of the destructive nature of testing. Hence we can conclude that breaking strength
variation is not due to alumina and dependence is limited.
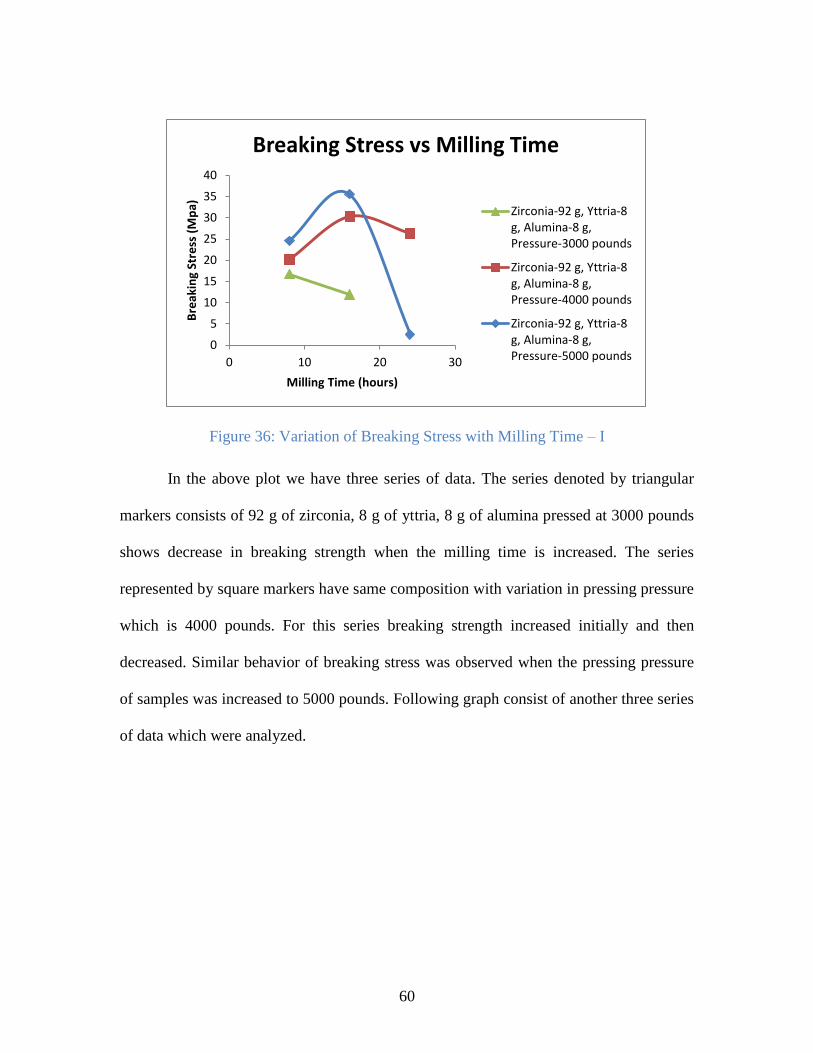
60
Figure 36: Variation of Breaking Stress with Milling Time – I
In the above plot we have three series of data. The series denoted by triangular
markers consists of 92 g of zirconia, 8 g of yttria, 8 g of alumina pressed at 3000 pounds
shows decrease in breaking strength when the milling time is increased. The series
represented by square markers have same composition with variation in pressing pressure
which is 4000 pounds. For this series breaking strength increased initially and then
decreased. Similar behavior of breaking stress was observed when the pressing pressure
of samples was increased to 5000 pounds. Following graph consist of another three series
of data which were analyzed.
0
5
10
15
20
25
30
35
40
0 10 20 30
Bre
akin
g St
ress
(M
pa)
Milling Time (hours)
Breaking Stress vs Milling Time
Zirconia-92 g, Yttria-8g, Alumina-8 g,Pressure-3000 pounds
Zirconia-92 g, Yttria-8g, Alumina-8 g,Pressure-4000 pounds
Zirconia-92 g, Yttria-8g, Alumina-8 g,Pressure-5000 pounds
61
Figure 37: Variation of Breaking Stress with Milling Time
In the above graph there are three series of data. The difference between the series
is the pressure at which they were pressed. All the series have composition zirconia-92 g,
yttria-8 g and alumina-6 g. The samples pressed at 3000 pounds and 5000 pounds show
increase in breaking stress with increase in milling time. However the sample pressed at
4000 pounds showed an initial increase in breaking stress followed by a decrease in
value. As we can observe the trends exhibited by each series in the two graphs are
different and hence we can conclude that milling time does not affect the breaking stress
independently. Variation of several factors and composition together affects the breaking
strength.
0
10
20
30
40
50
60
0 10 20 30
Bre
akin
g St
ress
(M
pa)
Milling Time (hours)
Breaking Stress vs Milling Time
Zirconia-92 g, Yttria-8g, Alumina-6 g,Pressure-3000 pounds
Zirconia-92 g, Yttria-8g, Alumina-6 g,Pressure-4000 pounds
Zirconia-92 g, Yttria-8g, Alumina-6 g,Pressure-5000 pounds
62
Chapter Six
DISCUSSION OF RESULTS
Porosity of the compositions measured was analyzed with relation to alumina and
milling time. We found that porosity decreased with increase in milling time and
increased with increase in alumina content. This is exactly an inverse relationship of
density with relation to alumina and milling time. Hence one should expect that porosity
and density are inversely related. A plot between porosity and density is carried out and
we find same relation but with lot of variance as shown in Figure 38.
The exact reason for having high variance is not available but it can be speculated
to the number of porosity measurements made for a particular composition. The number
of porosity measurements made for each specimen is one. Hence to reduce the variation,
it is necessary to carry out more porosity measurements at different regions of the same
sample and there by decrease the error occurring during measurement.
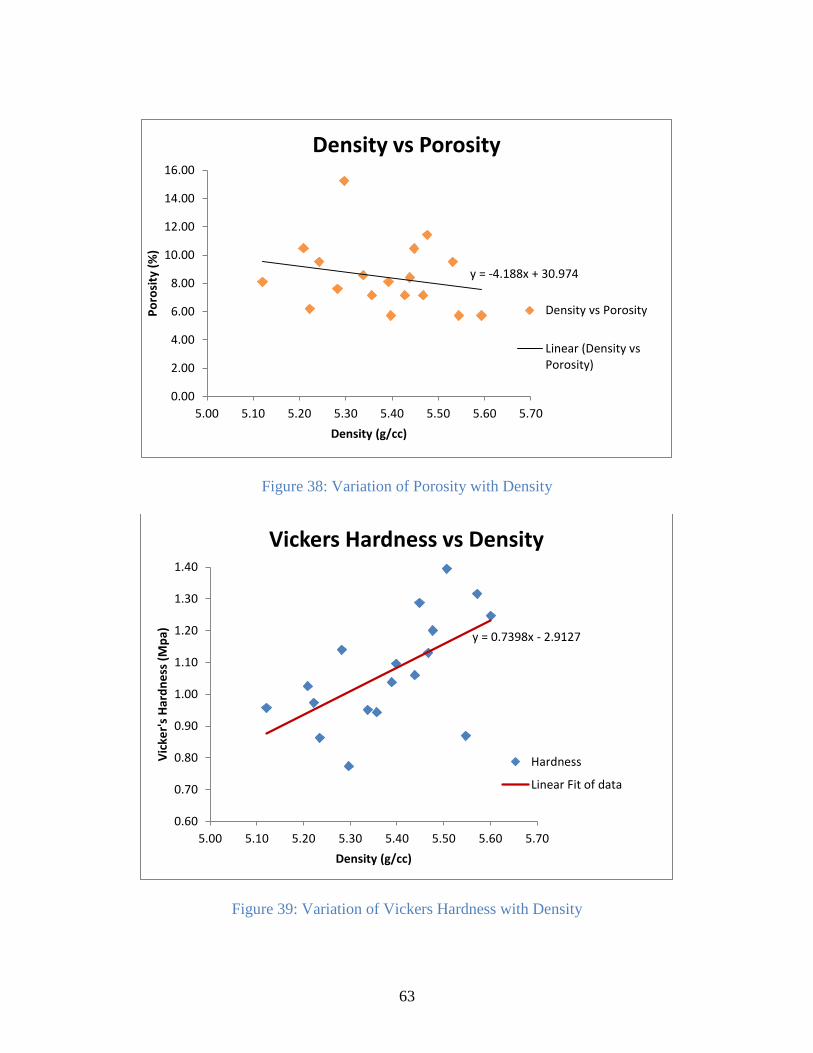
63
Figure 38: Variation of Porosity with Density
Figure 39: Variation of Vickers Hardness with Density
y = -4.188x + 30.974
0.00
2.00
4.00
6.00
8.00
10.00
12.00
14.00
16.00
5.00 5.10 5.20 5.30 5.40 5.50 5.60 5.70
Po
rosi
ty (
%)
Density (g/cc)
Density vs Porosity
Density vs Porosity
Linear (Density vsPorosity)
y = 0.7398x - 2.9127
0.60
0.70
0.80
0.90
1.00
1.10
1.20
1.30
1.40
5.00 5.10 5.20 5.30 5.40 5.50 5.60 5.70
Vic
ker'
s H
ard
ne
ss (
Mp
a)
Density (g/cc)
Vickers Hardness vs Density
Hardness
Linear Fit of data
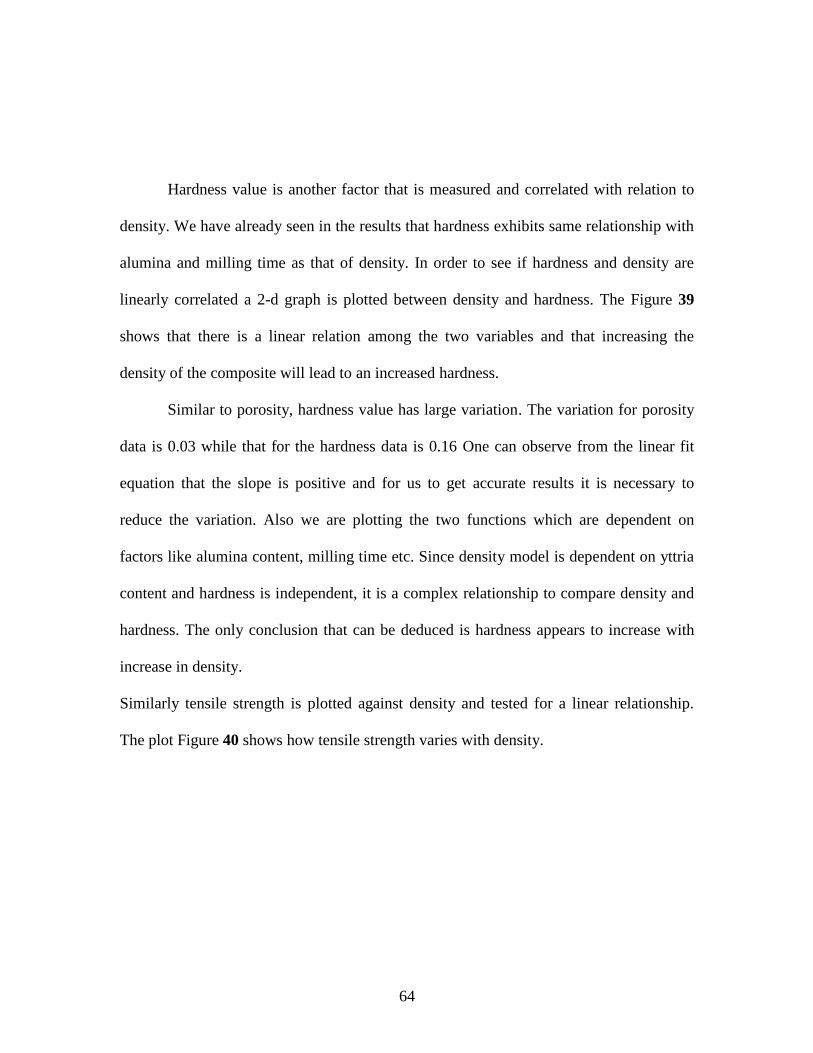
64
Hardness value is another factor that is measured and correlated with relation to
density. We have already seen in the results that hardness exhibits same relationship with
alumina and milling time as that of density. In order to see if hardness and density are
linearly correlated a 2-d graph is plotted between density and hardness. The Figure 39
shows that there is a linear relation among the two variables and that increasing the
density of the composite will lead to an increased hardness.
Similar to porosity, hardness value has large variation. The variation for porosity
data is 0.03 while that for the hardness data is 0.16 One can observe from the linear fit
equation that the slope is positive and for us to get accurate results it is necessary to
reduce the variation. Also we are plotting the two functions which are dependent on
factors like alumina content, milling time etc. Since density model is dependent on yttria
content and hardness is independent, it is a complex relationship to compare density and
hardness. The only conclusion that can be deduced is hardness appears to increase with
increase in density.
Similarly tensile strength is plotted against density and tested for a linear relationship.
The plot Figure 40 shows how tensile strength varies with density.
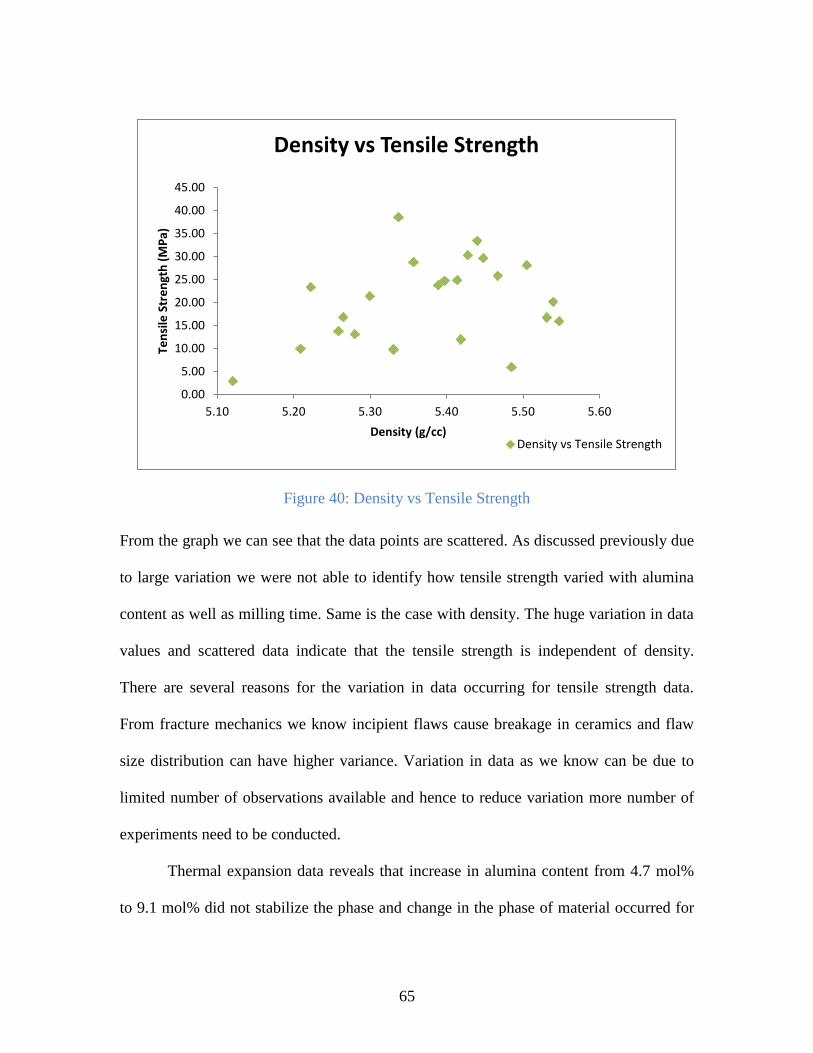
65
Figure 40: Density vs Tensile Strength
From the graph we can see that the data points are scattered. As discussed previously due
to large variation we were not able to identify how tensile strength varied with alumina
content as well as milling time. Same is the case with density. The huge variation in data
values and scattered data indicate that the tensile strength is independent of density.
There are several reasons for the variation in data occurring for tensile strength data.
From fracture mechanics we know incipient flaws cause breakage in ceramics and flaw
size distribution can have higher variance. Variation in data as we know can be due to
limited number of observations available and hence to reduce variation more number of
experiments need to be conducted.
Thermal expansion data reveals that increase in alumina content from 4.7 mol%
to 9.1 mol% did not stabilize the phase and change in the phase of material occurred for
0.00
5.00
10.00
15.00
20.00
25.00
30.00
35.00
40.00
45.00
5.10 5.20 5.30 5.40 5.50 5.60
Ten
sile
Str
en
gth
(M
Pa)
Density (g/cc)
Density vs Tensile Strength
Density vs Tensile Strength
66
both the compositions. The compositions in the range exhibited phase change at 410°C
and underwent permanent deformation. However when the yttria content was increased
from 4.1 mol% to 6.4 mol% the thermal expansion behavior changed significantly. In the
former cases we were able to see that the material changed its expansion behavior around
400°C..
For samples having higher amount of yttria greater than5 mol% the phase diagram
shows the composition to contain metastable tetragonal phase. The X-ray analysis
conducted on these samples revealed relatively less intense peaks for monoclinic phase
when compared to the counterparts. With these data and information from phase diagram
we can safely conclude that the material‟s abnormal behavior of sudden contraction on
heating is due to phase change. Hence the volume change occurring during the process of
thermal expansion is studied. For the study alumina is assumed not to interact with yttria
stabilized zirconia system {{134 Cynthia,Ann.Powell 1985}} and calculations were
carried out for three compositions used in my experiments using the phase diagram in
Figure 3.
The first composition analyzed is for yttria content of 6.9 mol%. The mole
fraction of cubic phase of zirconia is 71.62% at room temperature and that of monoclinic
phase is 28.38%. Phase change from monoclinic to tetragonal occurs for this
composition at 500°C. In the thermal expansion study conducted the sample was heated
from room temperature to 700°C. Hence the volume change occurring in the material on
heating to 700C is calculated using lever rule. At 700°C the amount of cubic phase of
zirconia is 72.63 mol%. Amount of tetragonal phase is 27.37 mol%. Using the above data
67
volume at room temperature as well as 700°C is calculated. The densities of three phases
of zirconia were obtained from literature 49
. Relative volume change for the composition
is found to be -0.0179. It is used to calculate relative linear change and it is found to be -
0.00596. The experimental value for relative linear change in length is 0.00152. Similar
procedure is repeated for composition containing 4.5 mol% yttria. The relative volume
change is found to be -0.0408 and the relative linear change is found to be -0.0136. The
experimental value for relative linear change in length is - 0.000135. Thus we could see
that the experimental value is not within 5% deviation and deviation is very high. Hence
we can conclude that the measurement obtained from thermal expansion data is not valid.
The composition containing 2.3 mol% yttria shows complete cubic phase region
from phase diagram. Thermal expansion for this composition did not show any
contraction unlike other compositions and showed a linear behavior. The reason for the
large difference observed can also be due to the error due to push rod measurement. The
sample initially expanded and then underwent contraction. During contraction the sample
might have slipped between the ends of push rod and the reading obtained may be
incorrect.
68
Chapter Seven
SUMMARY
The relationship between various experimental results was related to one another
and following useful results were obtained. We found that density of the composite
increased with decrease in alumina. A similar trend was seen for hardness value.
Comparison of the mean of hardness value at different levels of milling time when
alumina content was fixed at 8 wt% shows that there is no significant difference in
hardness between 16 hours and 24 hours of milling. Since the variations for hardness
value are very high, it is difficult to recognize an appreciable difference among the two
levels. Another possible reason might be beyond 16 hours of milling time the critical
value is reached and as a result milling action does not have any improvement of mixture.
Similarly comparison of means for varying levels of alumina at fixed levels of milling
time showed that there is no considerable difference in hardness value when alumina
content is increased from 4 wt to 6 wt%. However the difference became noticeable
when alumina content is increased to 8 wt%. The tensile strength data discussed
previously is correlated to the density and hardness data. Higher tensile strength values
were obtained for compositions having higher density value in few cases and as pointed
out earlier more data needs to be collected before proposing the inference..
69
Chapter Eight
CONCLUSIONS
The current work has enabled us to identify the variation in several properties of
zirconia yttria alumina system having varying quantities of yttria and alumina. This
study has enabled us to answer the question is there a significant difference in properties
with increase in small amount of alumina. (up to 10 weight percent). An empirical model
developed will enable us to predict the density of the resulting composite if the
experimental conditions are provided as input. Similarly hardness value can also be
predicted for such composites. Some of the inferences from the work are
1. Density of sample increases with increase in milling time and decrease in alumina
content. Maximum density of 5.6 g/cc was obtained for samples having milling
time of 24 hours and when the alumina content was 6 wt%.
2. Hardness value increased with increase in milling time and decrease in alumina
content similar to density. Maximum hardness value 1.39MPa was obtained for
samples having alumina content of 4 wt % and milling time of 16 hours.
3. High tensile strength of was obtained for alumina content of 8 wt% and milling
time of 24 hours.
4. X-ray analysis reveals that varying amount of yttria and alumina content helps us
to control the resulting phase. Very low yttria content of 2 mol% results in higher

70
monoclinic phase. As yttria content increases the amount of monoclinic phase
decreases and amount of cubic phase increases.

71
References
72
REFERENCES
(1) Hassan, A. A. E.; Menzler, N. H.; Blass, G.; Ali, M. E.; Buchkremer, H. P.; Stover, D.
J. Mater. Sci. 2002, 37, 3467-3475.
(2) Tcheliebou, F.; Boyer, A. Materials Science & Engineering B (Solid-State Materials
for Advanced Technology) 1994, B26, 175-80.
(3) Kim, J. K.; Kim, K. H.; Choa, Y. H.; Yoon, J.; Shim, K. B. In In Effect of alumina
additions on mechanical and electrical properties of 8mol% yttria-stabilized
zirconia prepared by spark plasma sintering; Trans Tech Publications Ltd: 2006;
Vol. 317-318, pp 917-920.
(4) Susnik, D.; Holc, J.; Hrovat, M.; Zupancic, S. J. Mater. Sci. Lett. 1997, 16, 1118-
1120.
(5) Garvie, R. C.; Hannink, R. H.; Pascoe, R. T. Nature 1975, 258, 703-4.
(6) Mori, M.; Liu, Y.; Shuhua, M.; Hashimoto, S.; Takei, K. Journal of the Korean
Ceramic Society 2008, 45, 760-765.
(7) Basu, B. International Materials Reviews 2005, 50, 239-256.
(8) Basu, B.; Vleugels, J.; Van, D. B. Materials Science & Engineering A (Structural
Materials: Properties, Microstructure and Processing) 2004, A366, 338-47.
(9) Carter, G. A.; Hart, R. D.; Kirby, N. M.; Milosevic, D.; Titkov, A. N. Journal of the
Australasian Ceramic Society 2003, 39, 149-53.
(10) Chen, Y. L.; Qi, M.; Wu, J. S.; Wang, D. H.; Yang, D. Z. Appl. Phys. Lett. 1994, 65,
303-5.
(11) Choi, S. R.; Bansal, N. P. J Am Ceram Soc 2005, 88, 1474-80.
(12) Drennan, J.; Hannink, H. J. J Am Ceram Soc 1986, 69, 541-546.
(13) Ohnishi, H.; Naka, H.; Sekino, T.; Ikuhara, Y.; Mihara, K. Journal of the Ceramic
Society of Japan 2008, 116, 1270-7.
(14) Xiaoguang, L.; Daming, C.; Jianfeng, T.; Baowei, L. Rare Metal Materials and
Engineering 2005, 34, 691-4.
73
(15) Mori, M.; Abe, T.; Itoh, H.; Yamamoto, O.; Takeda, Y.; Kawahara, T. Solid State
Ionics, Diffusion & Reactions 1994, 74, 157-64.
(16) Garvie, R. C.; Nicholson, P. S. J Am Ceram Soc 1972, 55, 303-5.
(17) Fehrenbacher, L. L.; Jacobson, L. A. American Ceramic Society -- Journal 1965, 48,
157-161.
(18) Duwez, P.; Brown, J., F.H.; Odell, F. Electrochemical Society -- Journal 1951, 98,
356-362.
(19) Garvie, R. C. J. Phys. Chem. 1978, 82, 218-24.
(20) Hayakawa, M.; Nishio, K.; Hamakita, J.; Onda, T. In In Isothermal and athermal
martensitic transformations in a zirconia-yttria alloy; International Conference on
Martensitic Transformations; Elsevier: Switzerland, 1999; Vol. A273-275, pp 213-
17.
(21) Murase, Y.; Kato, E. J Am Ceram Soc 1979, 62, 527.
(22) Badwal, S. P. S.; Nardella, N. Applied Physics A (Solids and Surfaces) 1989, A49,
13-24.
(23) Tsubakino, H.; Hamamoto, M.; Nozato, R. J. Mater. Sci. 1991, 26, 5521-6.
(24) Nakanishi, N.; Shigematsu, T. Mater. Trans. JIM 1991, 32, 778-84.
(25) Tsubakino, H.; Matsuura, N. J Am Ceram Soc 2002, 85, 2102-6.
(26) Tzer-Shin Sheu; Tseng-Ying Tien; I-Wei Chen J Am Ceram Soc 1992, 75, 1108-16.
(27) Fabris, S.; Paxton, A.; Finnis, M. W. Acta Materialia 2002, 50, 5171-8.
(28) Lawson, S. Journal of the European Ceramic Society 1995, 15, 485-502.
(29) Li, P.; I-Wei Chen; Penner-Hahn, J. J Am Ceram Soc 1994, 77, 1281-8.
(30) Xue, J.; Dieckmann, R. Solid State Ionics, Diffusion & Reactions 1994, 73, 273-82.
(31) Chen, S.; Deng, W.; Shen, P. Materials Science & Engineering B (Solid-State
Materials for Advanced Technology) 1994, B22, 247-55.
(32) Ho, S. M. Materials science and engineering 1982, 54, 23-29.
74
(33) Gupta, T. K.; Bechtold, J. H.; Kuznicki, R. C.; Cadoff, L. H.; Rossing, B. R. J.
Mater. Sci. 1977, 12, 2421-2426.
(34) DUWEZ, P.; ODELL, F.; BROWN, f,H., Jr Journal of the American Ceramic
Society 1952, 35, 107-113.
(35) Weber, B. C.; Garrett, H. J.; Mauer, F. A.; Schwartz, M. A. American Ceramic
Society -- Journal 1956, 39, 197-206.
(36) Gulino, A.; La Delfa, S.; Fragala, I.; Egdell, R. G. Chemistry of Materials 1996, 8,
1287-1287.
(37) Hansch, R.; Menzler, N. H.; Fleck, R.; Buchkremer, H. P. In In Low temperature
densification of SOFC electrolytes using manganese oxide and boron oxide; 9th
International Symposium on Solid Oxide Fuel Cells, SOFC IX, May 15, 2005 - May
20; Electrochemical Society Inc: Quebec, Canada, 2005; Vol. PV 2005-07, pp 1008-
1015.
(38) Rai, A.; Gupta, N. P. InterCeram: International Ceramic Review 1996, 45, 2-2pp.
(39) Moure, C.; Jurado, J. R.; Duran, P. In In Preparation, microstructure and electrical
conductivity of yttria-doped tetragonal zirconia; Electrical Ceramics; UK, 1985; , pp
31-43.
(40) Li, Q.; Zhang, Y. F.; Ma, X. F.; Meng, J.; Cao, X. Q. Ceram. Int. 2009, 35, 453-456.
(41) Scott, H. G. J. Mater. Sci. 1975, 10, 1527-35.
(42) Chevalier, J. J.; Deville, S.; Münch, E.; Jullian, R.; Lair, F. Biomaterials 2004, 25,
5539-5545.
(43) Swain, M. V. Nature 1986, 322, 234-6.
(44) Swain, M. V.; Rose, L. R. F. In In Strength limitations of transformation-toughened
zirconia alloys; Proceedings of the Second US-Australian-West German
Transformation Toughening Workshop; USA, 1986; Vol. 69, pp 511-18.
(45) Guo, X.; Ding, Y. J. Electrochem. Soc. 2004, 151, 1-7.
(46) Varanasi, C.; Juneja, C.; Chen, C.; Kumar, B. J. Power Sources 2005, 147, 128-35.
(47) Casellas, D.; Nagl, M. M.; Llanes, L.; Anglada, M. J Am Ceram Soc 2005, 88, 1958-
63.
75
(48) French, J. D.; Harmer, M. P.; Chan, H. M.; Miller, G. A. J Am Ceram Soc 1990, 73,
2508-10.
(49) Cynthia, A. P. Characterization Of The Effect Of Minor Alumina Additions On The
Processing And Properties Of Yttria Partially Stabilized Zirconia, Clemson
University, 1985.
(50) Rudnick, A.; Hunter, A. R.; Holden, F. C. Materials Research and Standards 1963,
3, 283-289.
(51) Marion, R. H.; Johnstone, J. K. American Ceramic Society Bulletin 1977, 56, 998-
1002.
(52) Fell, J. T.; Newton, J. M. Journal of Pharmaceutical Sciences 1970, 59, 688-691.
(53) Nam-Ky Nguyen; Borkowski, J. J. Journal of Statistical Planning and Inference
2008, 138, 294-305.
(54) Panik, M. J., Ed.; In Regression Modeling : Methods, Theory, And Computation
With SAS ; Boca Raton : CRC Press: 2009; .

76
APPENDICES
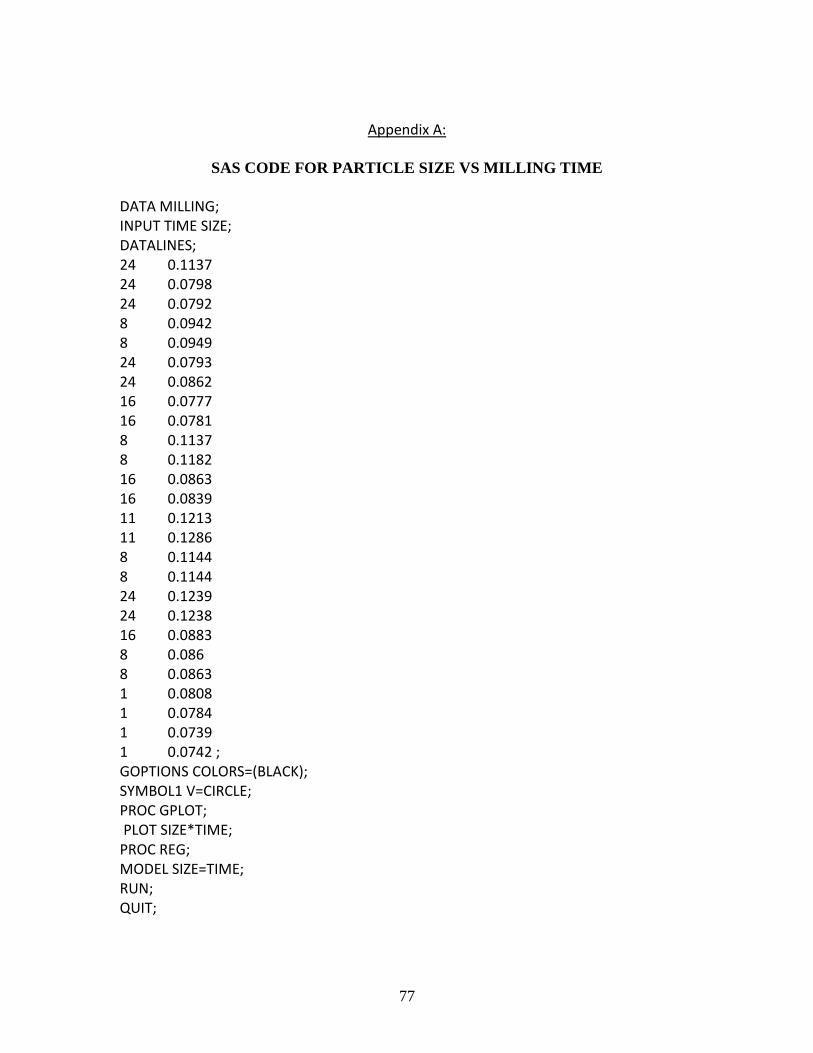
77
Appendix A:
SAS CODE FOR PARTICLE SIZE VS MILLING TIME
DATA MILLING; INPUT TIME SIZE; DATALINES; 24 0.1137 24 0.0798 24 0.0792 8 0.0942 8 0.0949 24 0.0793 24 0.0862 16 0.0777 16 0.0781 8 0.1137 8 0.1182 16 0.0863 16 0.0839 11 0.1213 11 0.1286 8 0.1144 8 0.1144 24 0.1239 24 0.1238 16 0.0883 8 0.086 8 0.0863 1 0.0808 1 0.0784 1 0.0739 1 0.0742 ; GOPTIONS COLORS=(BLACK); SYMBOL1 V=CIRCLE; PROC GPLOT; PLOT SIZE*TIME; PROC REG; MODEL SIZE=TIME; RUN; QUIT;
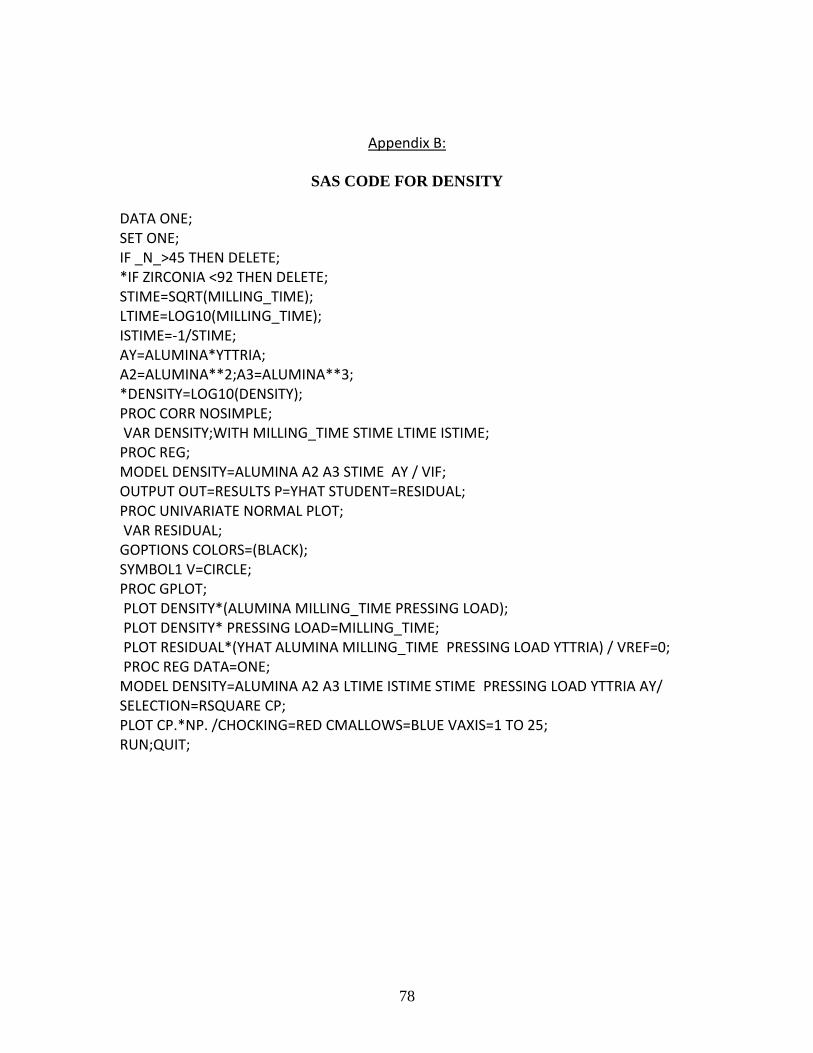
78
Appendix B:
SAS CODE FOR DENSITY
DATA ONE; SET ONE; IF _N_>45 THEN DELETE; *IF ZIRCONIA <92 THEN DELETE; STIME=SQRT(MILLING_TIME); LTIME=LOG10(MILLING_TIME); ISTIME=-1/STIME; AY=ALUMINA*YTTRIA; A2=ALUMINA**2;A3=ALUMINA**3; *DENSITY=LOG10(DENSITY); PROC CORR NOSIMPLE; VAR DENSITY;WITH MILLING_TIME STIME LTIME ISTIME; PROC REG; MODEL DENSITY=ALUMINA A2 A3 STIME AY / VIF; OUTPUT OUT=RESULTS P=YHAT STUDENT=RESIDUAL; PROC UNIVARIATE NORMAL PLOT; VAR RESIDUAL; GOPTIONS COLORS=(BLACK); SYMBOL1 V=CIRCLE; PROC GPLOT; PLOT DENSITY*(ALUMINA MILLING_TIME PRESSING LOAD); PLOT DENSITY* PRESSING LOAD=MILLING_TIME; PLOT RESIDUAL*(YHAT ALUMINA MILLING_TIME PRESSING LOAD YTTRIA) / VREF=0; PROC REG DATA=ONE; MODEL DENSITY=ALUMINA A2 A3 LTIME ISTIME STIME PRESSING LOAD YTTRIA AY/ SELECTION=RSQUARE CP; PLOT CP.*NP. /CHOCKING=RED CMALLOWS=BLUE VAXIS=1 TO 25; RUN;QUIT;
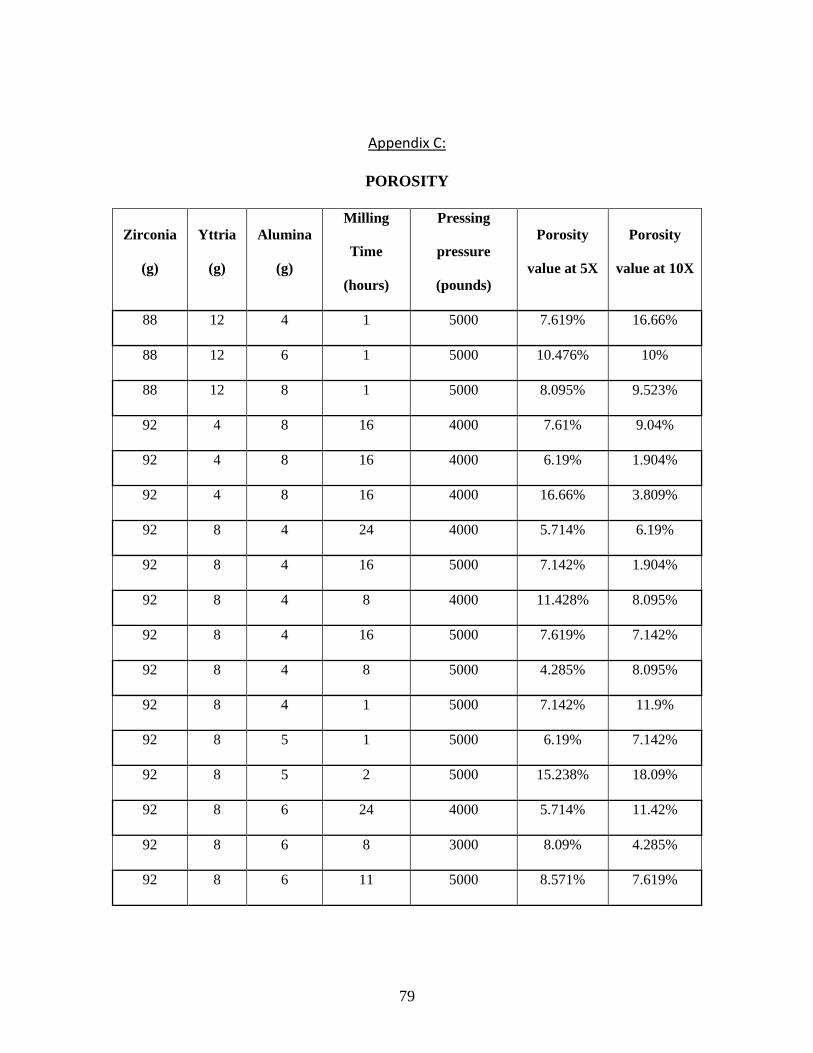
79
Appendix C:
POROSITY
Zirconia
(g)
Yttria
(g)
Alumina
(g)
Milling
Time
(hours)
Pressing
pressure
(pounds)
Porosity
value at 5X
Porosity
value at 10X
88 12 4 1 5000 7.619% 16.66%
88 12 6 1 5000 10.476% 10%
88 12 8 1 5000 8.095% 9.523%
92 4 8 16 4000 7.61% 9.04%
92 4 8 16 4000 6.19% 1.904%
92 4 8 16 4000 16.66% 3.809%
92 8 4 24 4000 5.714% 6.19%
92 8 4 16 5000 7.142% 1.904%
92 8 4 8 4000 11.428% 8.095%
92 8 4 16 5000 7.619% 7.142%
92 8 4 8 5000 4.285% 8.095%
92 8 4 1 5000 7.142% 11.9%
92 8 5 1 5000 6.19% 7.142%
92 8 5 2 5000 15.238% 18.09%
92 8 6 24 4000 5.714% 11.42%
92 8 6 8 3000 8.09% 4.285%
92 8 6 11 5000 8.571% 7.619%
80
92 8 6 16 4000 12.38% 10.476%
92 8 6 1 5000 15.238% 9.047%
92 8 6 1 5000 9.04% 6.66%
92 8 8 8 3000 9.52% 9.52%
92 8 8 16 4000 7.142% 7.142%
92 8 8 16 5000 10.47% 7.619%
92 8 8 24 4000 5.714% 11.428%
92 8 8 2 5000 8.095% 6.19%
92 8 10 2 4000 9.523% 4.76%
92 12 4 16 4000 5.714% 6.667%
92 12 6 24 4000 10% 22.85%
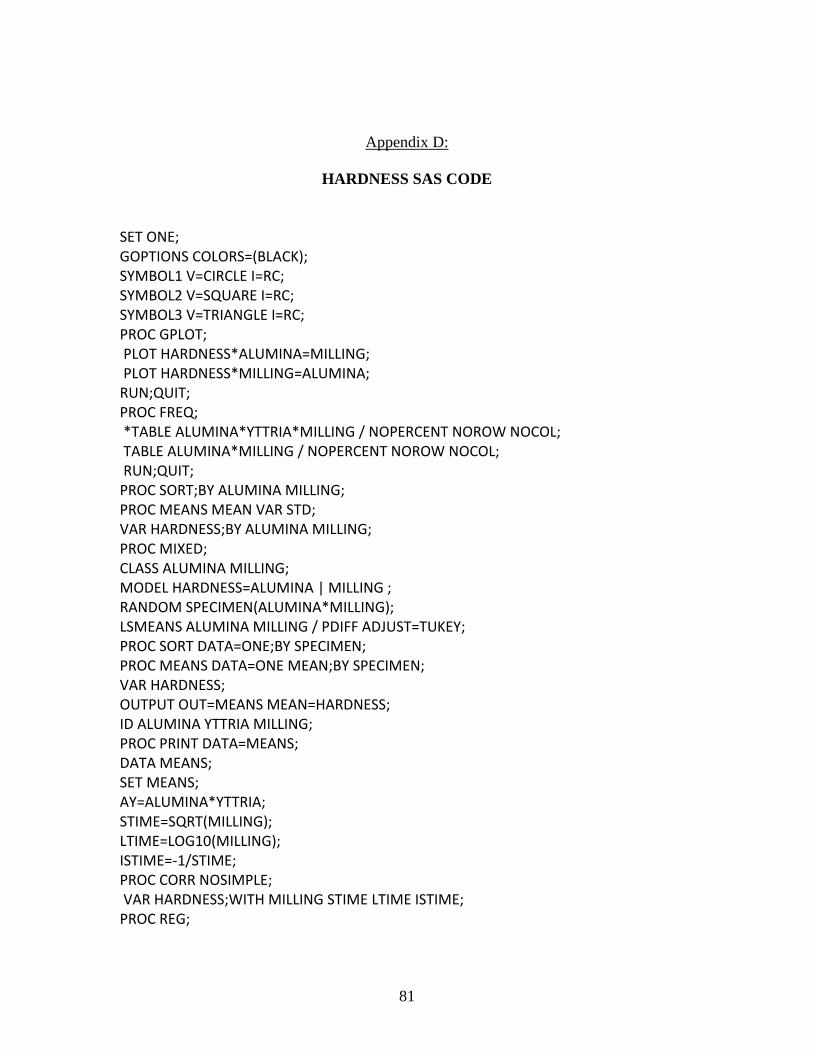
81
Appendix D:
HARDNESS SAS CODE
SET ONE; GOPTIONS COLORS=(BLACK); SYMBOL1 V=CIRCLE I=RC; SYMBOL2 V=SQUARE I=RC; SYMBOL3 V=TRIANGLE I=RC; PROC GPLOT; PLOT HARDNESS*ALUMINA=MILLING; PLOT HARDNESS*MILLING=ALUMINA; RUN;QUIT; PROC FREQ; *TABLE ALUMINA*YTTRIA*MILLING / NOPERCENT NOROW NOCOL; TABLE ALUMINA*MILLING / NOPERCENT NOROW NOCOL; RUN;QUIT; PROC SORT;BY ALUMINA MILLING; PROC MEANS MEAN VAR STD; VAR HARDNESS;BY ALUMINA MILLING; PROC MIXED; CLASS ALUMINA MILLING; MODEL HARDNESS=ALUMINA | MILLING ; RANDOM SPECIMEN(ALUMINA*MILLING); LSMEANS ALUMINA MILLING / PDIFF ADJUST=TUKEY; PROC SORT DATA=ONE;BY SPECIMEN; PROC MEANS DATA=ONE MEAN;BY SPECIMEN; VAR HARDNESS; OUTPUT OUT=MEANS MEAN=HARDNESS; ID ALUMINA YTTRIA MILLING; PROC PRINT DATA=MEANS; DATA MEANS; SET MEANS; AY=ALUMINA*YTTRIA; STIME=SQRT(MILLING); LTIME=LOG10(MILLING); ISTIME=-1/STIME; PROC CORR NOSIMPLE; VAR HARDNESS;WITH MILLING STIME LTIME ISTIME; PROC REG;
82
MODEL HARDNESS=ALUMINA YTTRIA MILLING AY STIME LTIME ISTIME/ SELECTION= RSQUARE CP; PLOT CP.*NP. /CHOCKING=RED CMALLOWS=BLUE VAXIS=1 TO 25; PROC REG DATA=MEANS; MODEL HARDNESS=ALUMINA MILLING / VIF; OUTPUT OUT=RESULTS P=YHAT STUDENT=RESIDUAL; PROC UNIVARIATE NORMAL PLOT; VAR RESIDUAL; PROC GPLOT DATA= RESULTS; PLOT RESIDUAL*(YHAT ALUMINA MILLING) / VREF=0; RUN;QUIT;
83
Appendix E:
TENSILE STRENGTH DATA
zirconia yttria alumina
pressure
(pound)
millling time
average breaking stress
(MPa)
92 8 8 5000 24 2.468381
88 12 8 5000 1 2.908432
92 8 8 5000 38 3.819324
92 8 8 5000 24 5.286108
92 12 4 4000 16 5.899151
88 12 4 5000 1 9.441329
92 12 6 4000 24 9.761464
88 12 6 5000 1 9.909615
92 8 8 3000 16 11.91712
92 8 5 4000 1 13.74556
92 8 5 3000 1 16.70698
92 8 8 3000 8 16.7162
92 8 10 2000 1 16.78584
92 8 4 4000 16 16.87886
92 8 4 5000 16 19.00671
92 8 4 3000 16 19.78659
92 8 6 5000 8 19.80149
92 8 8 4000 8 20.12382
84
92 8 6 4000 24 20.70896
92 8 5 2000 1 21.34991
92 8 6 4000 8 23.1475
92 8 5 5000 1 23.34763
92 8 6 5000 8 24.12785
92 8 8 5000 8 24.56625
92 4 8 4000 16 24.86631
92 8 8 4000 24 26.29334
92 8 6 3000 8 27.27138
92 8 4 5000 24 27.6037
92 8 4 5000 2 28.73785
92 8 8 5000 16 29.66678
92 8 6 5000 24 29.75279
92 8 8 4000 16 30.29113
92 8 4 5000 8 31.61759
92 8 8 5000 2 32.65956
92 8 6 4000 16 35.13735
92 8 4 5000 16 36.36955
92 8 10 4000 1 40.15456
92 8 8 5000 16 41.45403
92 8 6 5000 1 44.43368
92 8 6 3000 24 48.83083
92 8 0 5000 24 19.18065
85
Appendix F:
X – RAY ANALYSIS
Figure 41: Zirconia-88 g, Yttria-12 g, Alumina-4 g and Milling Time-1
hour
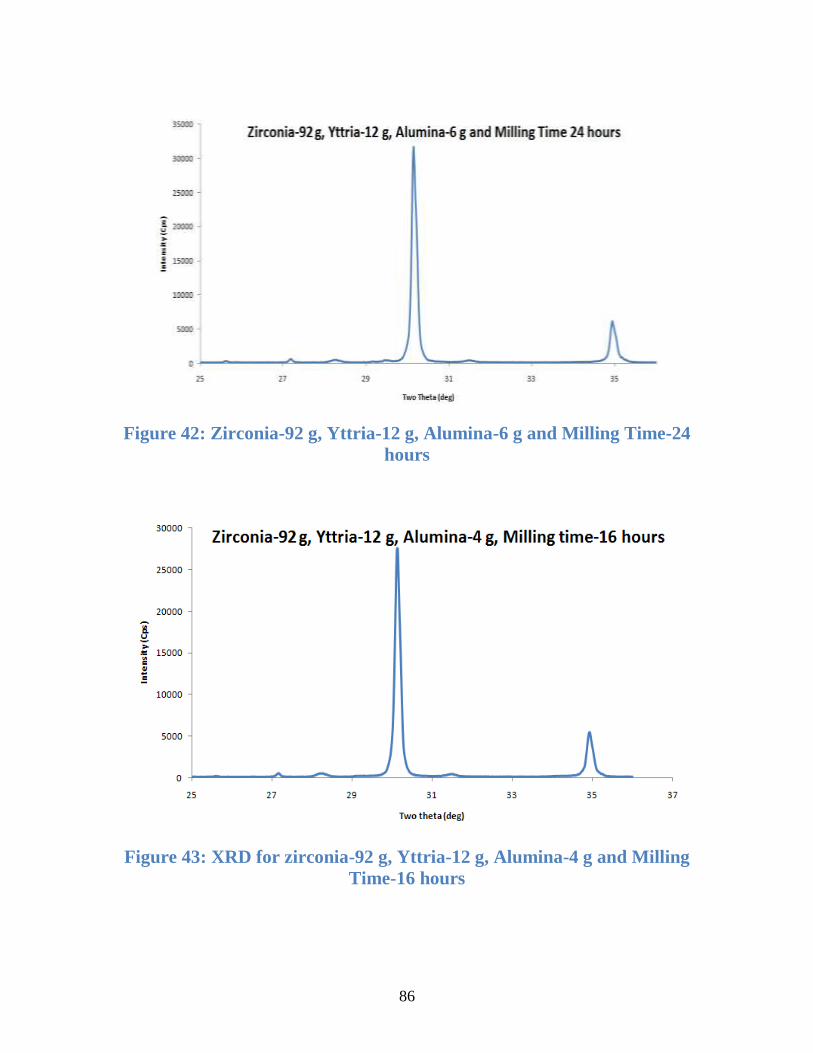
86
Figure 42: Zirconia-92 g, Yttria-12 g, Alumina-6 g and Milling Time-24
hours
Figure 43: XRD for zirconia-92 g, Yttria-12 g, Alumina-4 g and Milling
Time-16 hours
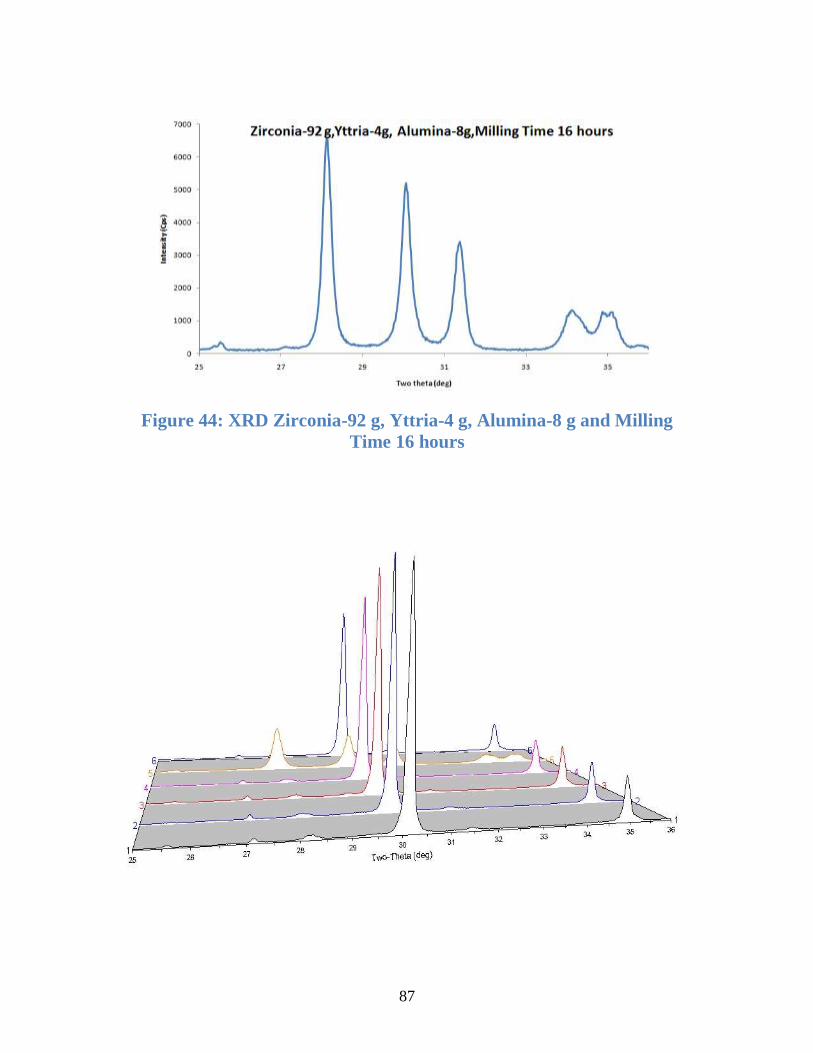
87
Figure 44: XRD Zirconia-92 g, Yttria-4 g, Alumina-8 g and Milling
Time 16 hours
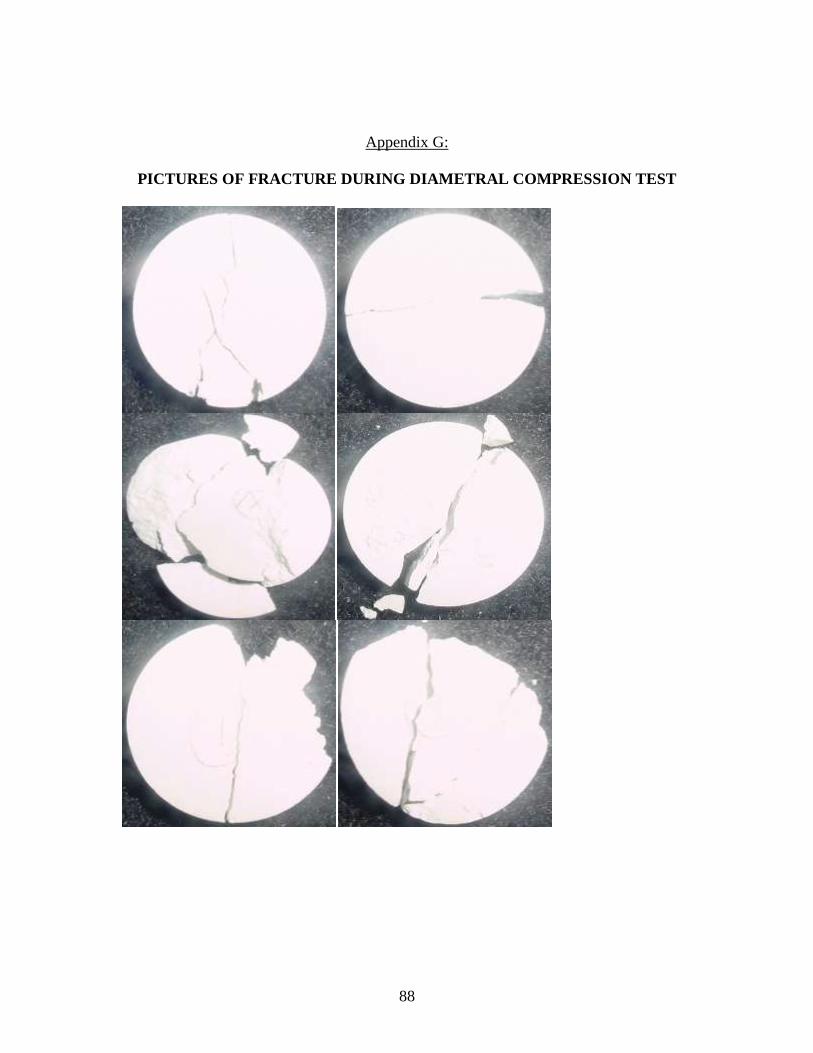
88
Appendix G:
PICTURES OF FRACTURE DURING DIAMETRAL COMPRESSION TEST
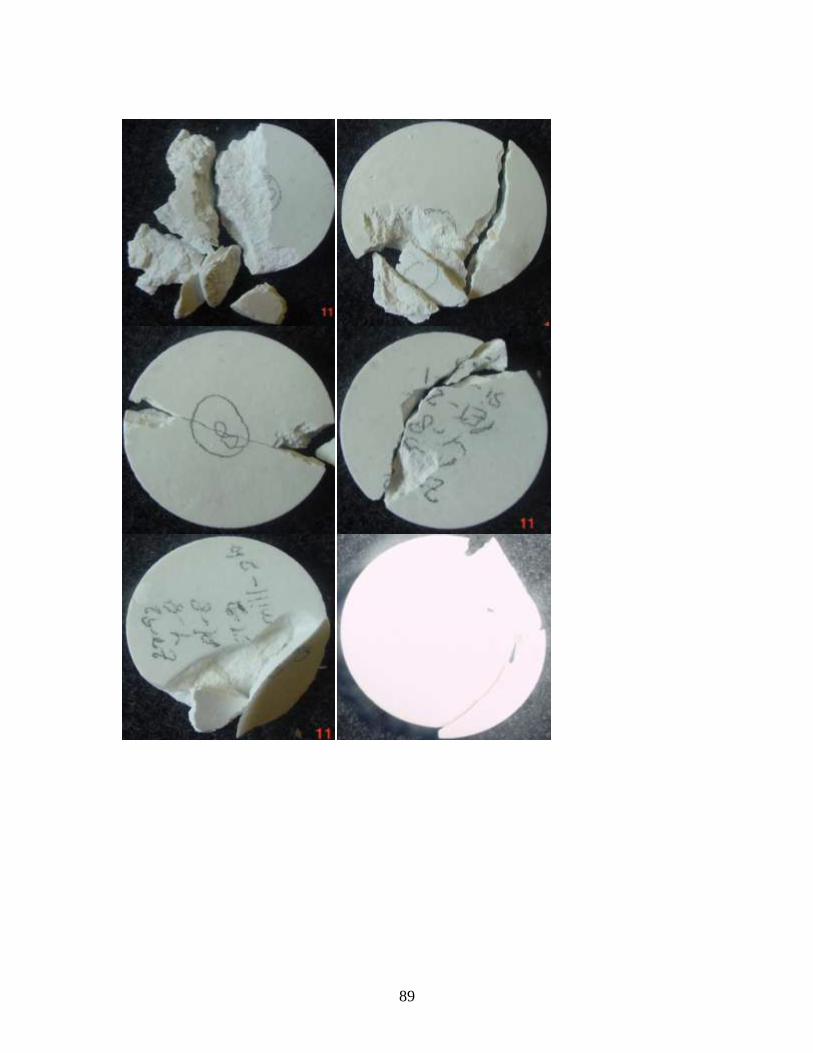
89
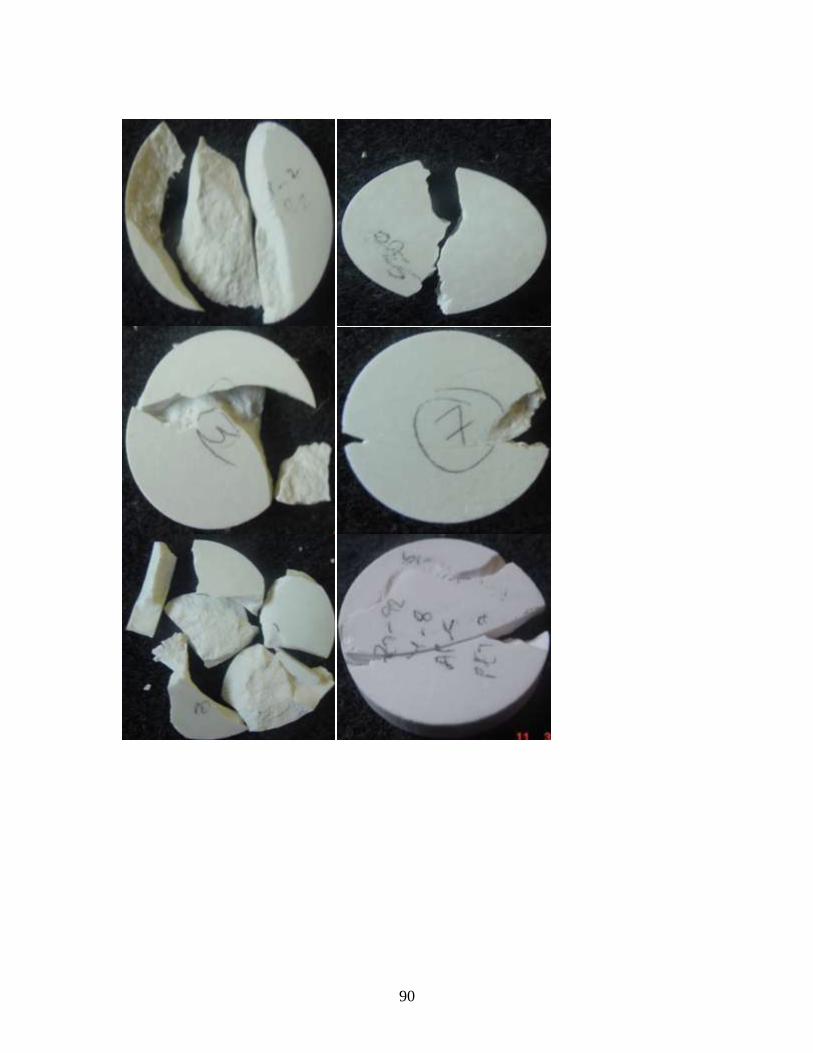
90
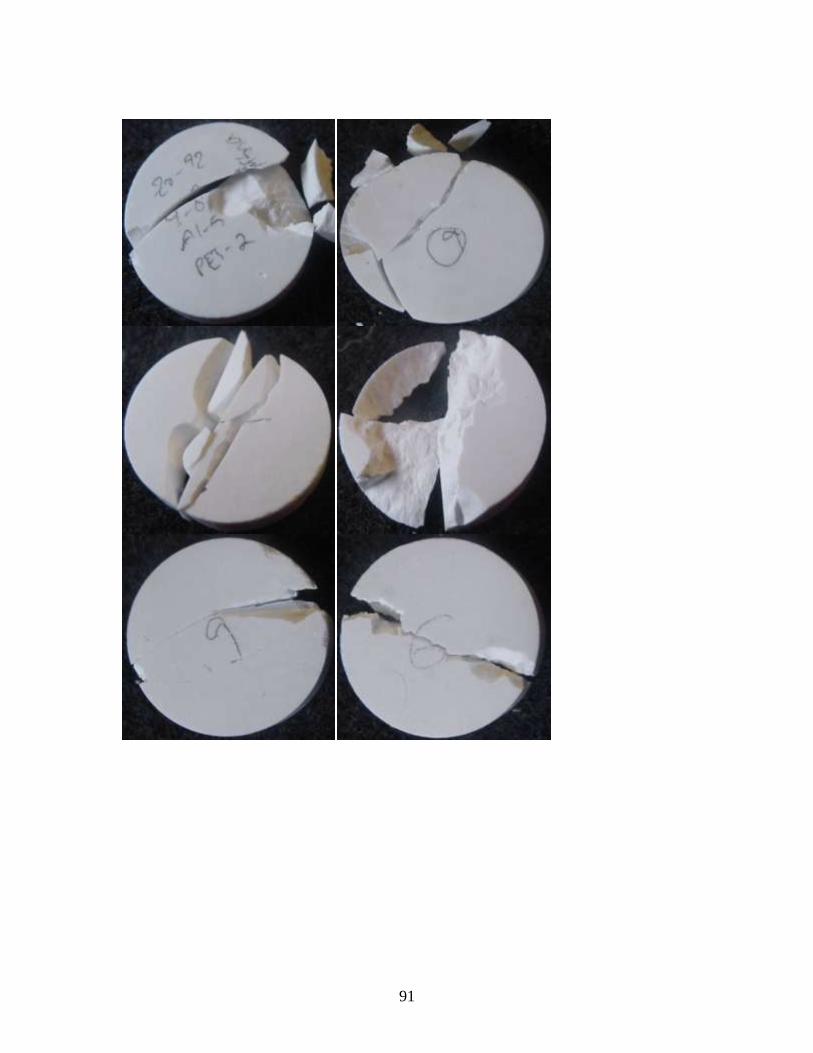
91
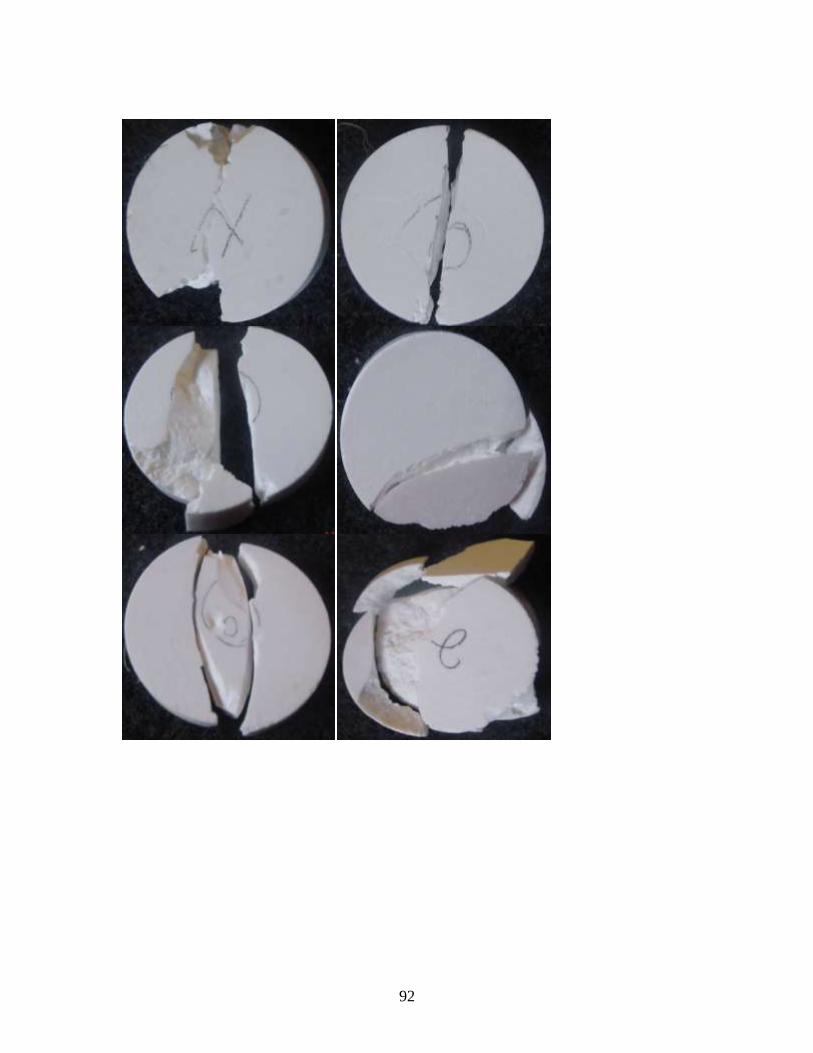
92
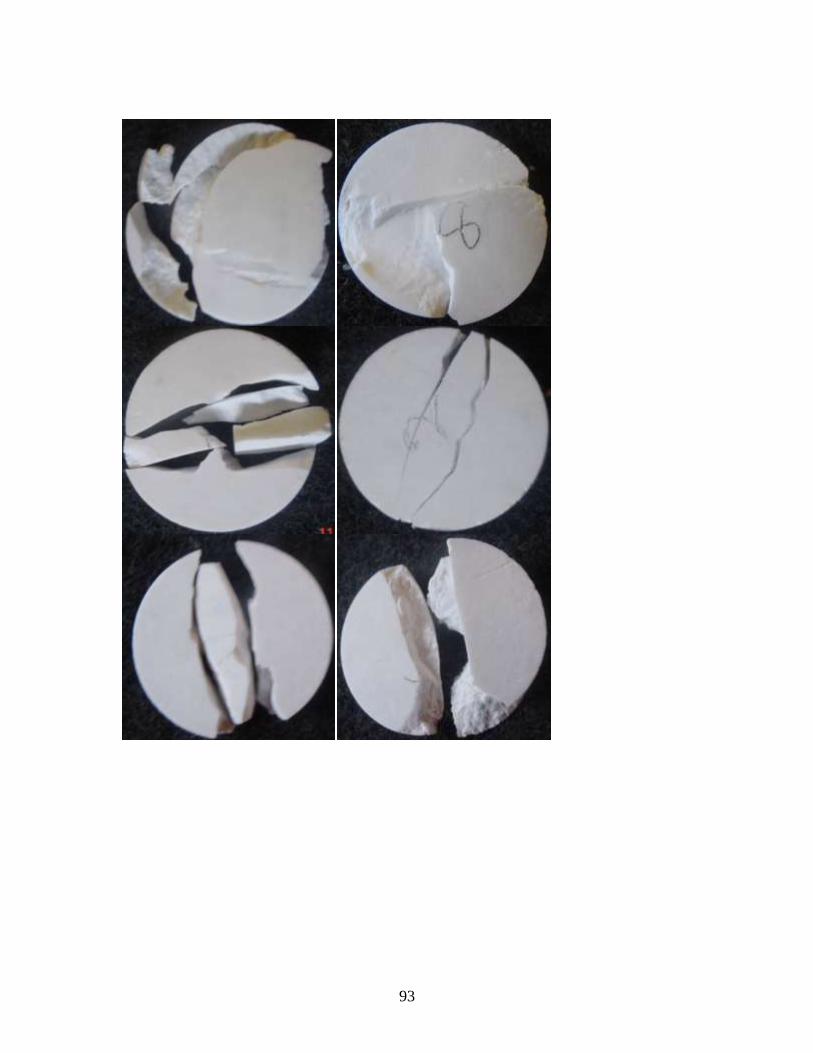
93
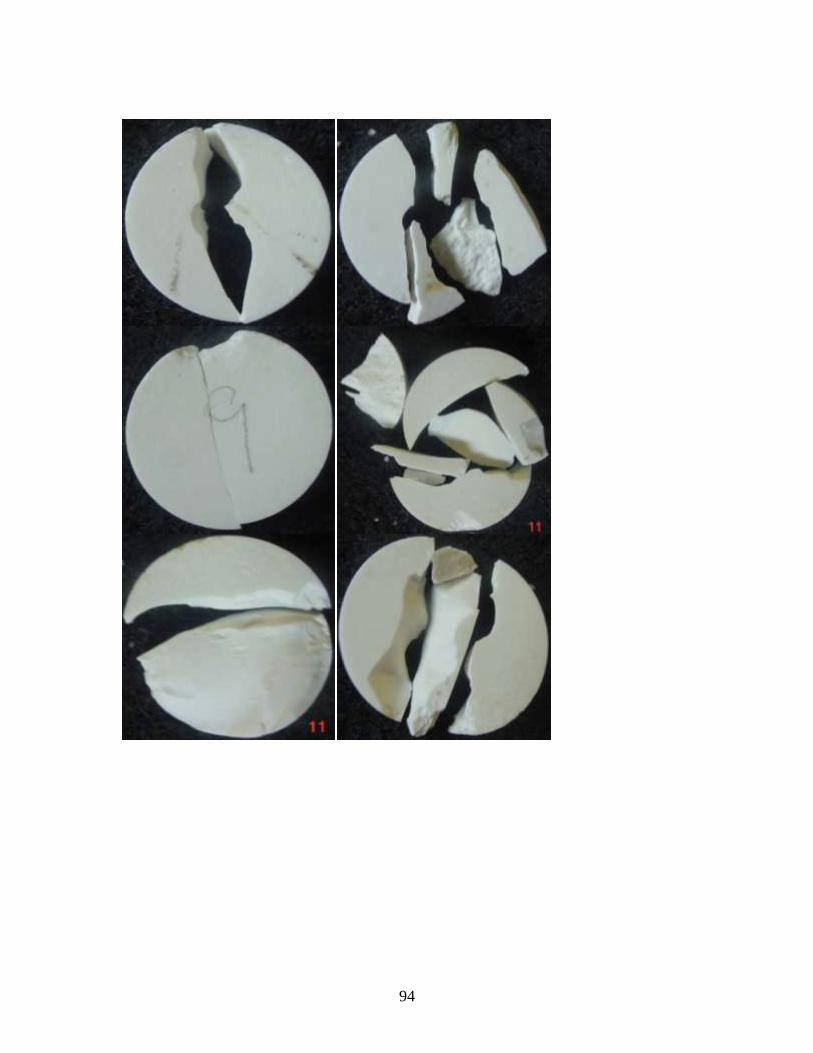
94
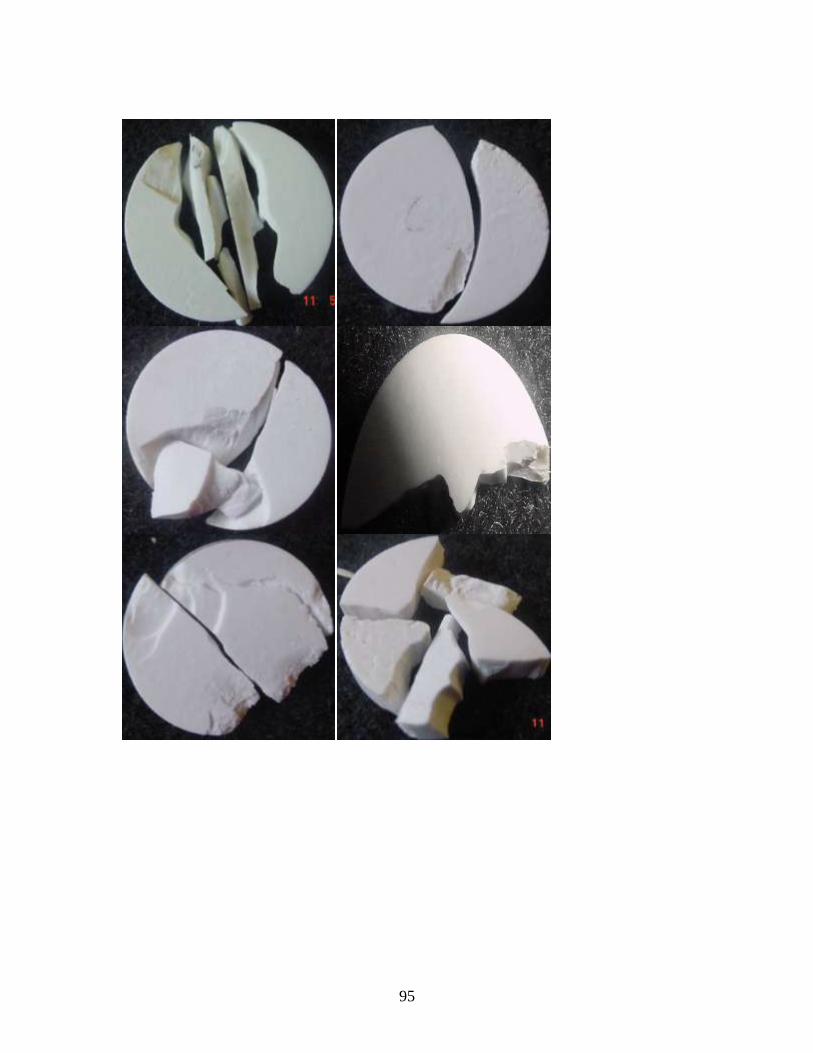
95
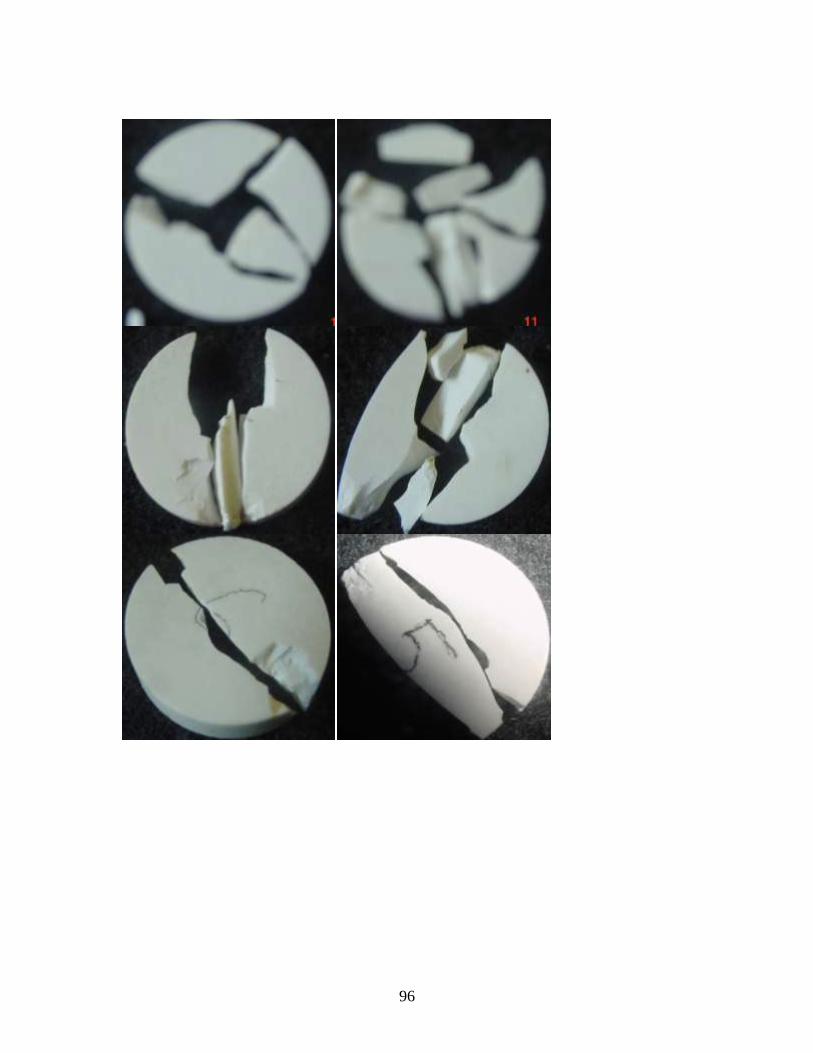
96
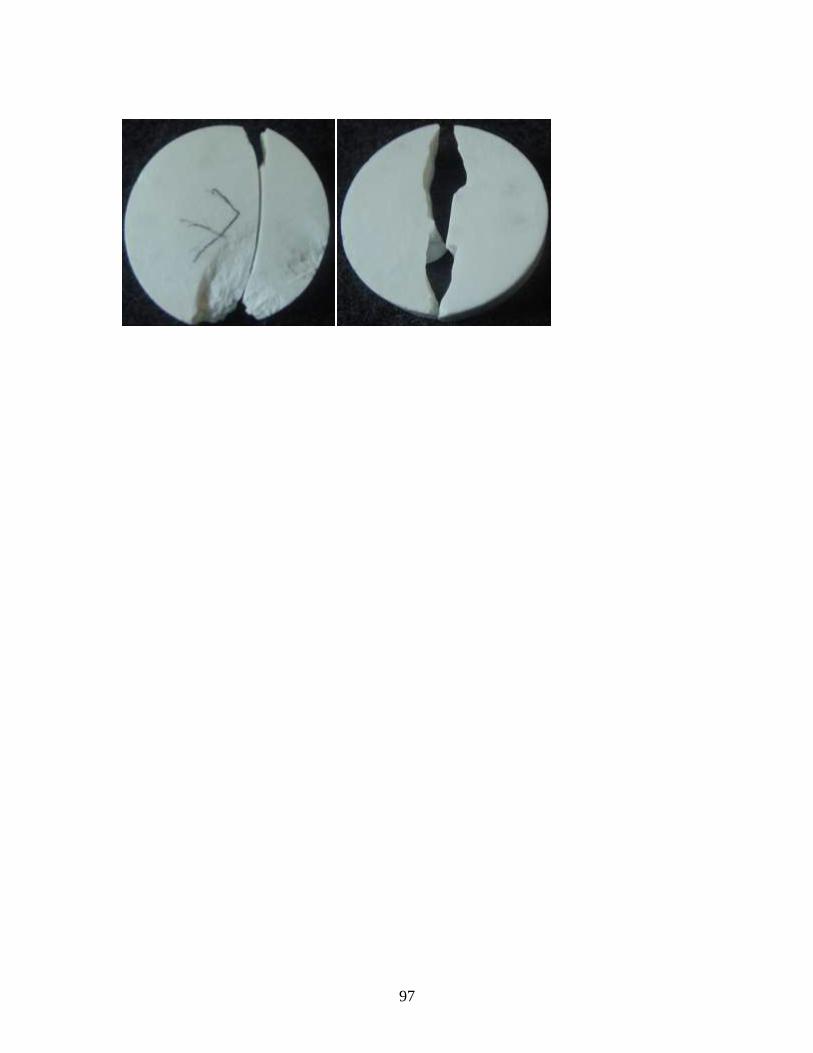
97