Embed Size (px)
Citation preview

Optimizing Your EHR For
Get With the Guidelines –
Heart Failure®
Data Collection

Reaching over one million patients, Get With The Guidelines®-Heart Failure is
an in-hospital quality improvement program for enhancing heart failure care
by promoting consistent adherence to the latest scientific treatment
guidelines.
Active participation in the program can lead to improved outcomes and lower
readmission rates – benefiting patients and hospitals alike.
9/12/2018 ©2013, American Heart Association 2

Why participate in Get With The Guidelines-Heart Failure?
• Heart Failure is the leading cause of 30-day readmissions. Readmissions penalties
are a serious financial burden for hospitals. Active participation in Get With The
Guidelines-Heart Failure can help your hospital understand strengths and areas to
improve, which could lead to reduced 30-day readmissions.
• Get With The Guidelines-Heart Failure can help your hospital with tools to track and
benchmark critical aspects of care. Published studies indicate that participating in
our program can improve processes of care.
• Hospitals that participate actively in Get With The Guidelines-Heart Failure may be
eligible for public recognition by the American Heart Association. It’s an opportunity
to hone a competitive edge in the marketplace by providing tangible evidence of
commitment to quality care.
9/12/2018 ©2013, American Heart Association 3

9/12/2018 ©2013, American Heart Association 4
Find out how GWTG HF can help your hospital.
Visit our website:
Get With The Guidelines®-Heart Failure
And contact your local representative today.

Optimizing Your EHR For
Get With the Guidelines –
Heart Failure®
Data Collection

Kirsten Brauch
Epic Implementation Services
9/12/2018 ©2015, American Heart Association 6
Michael Sherwood
Senior Informatics Analyst
SSM Health – St. Louis Network

GWTG and Epic
Optimizing Your EHR for GWTG-Heart Failure Data
Collection

GWTG and Epic
Options for submitting Manual abstraction Interface with a third party Clarity extracts
If you’re new to the program and are looking for ways to submit, you can leverage existing content to get started.
If you’re happy with your system and you want to do more, we have resources available to help you.

Project Planning
Create build trackers Include each data element you’re planning to abstract Determine the workflow your end users are currently
using to capture each data element
Use your build trackers to create reports for each dataset
Determine how you will track your patients for each measure for concurrent and retrospective review
Use Foundation content as a starting place
If your goal is to cut down on manual abstraction, use your build tracker as a guide to map your data elements and complete your integration.

On the Horizon
Epic is continuously working to improve options for submitting to GWTG out of our Foundation System.
You can use Foundation System content as a starting place for any build related to the GWTG measure sets.
The build and workflows we recommend for GWTG abstraction line up with the tools you’re likely already using for other quality programs.

Next Steps
If you want to do more with Epic and GWTG, talk to your Technical Coordinator, Implementation Director, or BFF
For more information, reach out to Kirsten Brauch at [email protected]

9/12/2018 ©2015, American Heart Association 12
Michael Sherwood
Senior Informatics Analyst
SSM Health – St. Louis Network

Optimizing Your EHR for GWTG-Heart Failure Data Collection
September 12, 2018

SSM Health Team Members
Michael Sherwood (Technical Lead)Senior Informatics AnalystSSM Health – St. Louis [email protected]
Suzi Guignon, MSN, RNTeam Leader – Clinical RegistriesSSM Health – St. Louis [email protected]
Tim LyerlaSenior Informatics AnalystSSM Health – St. Louis [email protected]
Carol Papps, RN (HF Registry Lead)Clinical Data CoordinatorSSM Health – St. Louis Network [email protected]
Shelli Smith-ValentiManager – Informatics SSM Health – St. Louis [email protected]
Leah Meyer, MBA, BSN, RNSystem Manager – Clinical Quality ComplianceSSM Health [email protected]
14

➢ To share the SSM Health team process of reducing manual data abstraction for the AHA Heart Failure (HF) registry, while increasing the volume of uploaded data.
➢ To describe the process SSM Health used for mapping data elements into a CSV file using discrete fields located within the electronic medical record (Epic) and IQVIA/Quintiles automated CSV uploader.
➢ To explain the SSM Health data extraction process for the AHA HF registry through an automated upload of patient data from Epic Clarity into the patient management tool.
15
Presentation Objectives

• Over $500 Million in Community Benefit
• 40,000+ Employees
• 9,900+ Physicians/Providers
• 300+ Physician Office/Outpatient Sites
• 24 Hospitals
• 10 Post-Acute Facilities
• 83 Counties – SSM Health at Home
• 5.4 Million Covered Lives – Navitus
• 410,000 Covered Lives – Dean Health Plan
• 40+ Managed Hospitals/Affiliate
Relationships
A $7 Billion* not-for-profit, Catholic healthcare system
SSM Health – System Overview
* Reflects total revenue; includes Agnesian HealthCare and Monroe Clinic

SSM Health Participating HospitalsAHA Heart Failure Registry
• SSM Health St. Joseph Hospital: St. Charles, Missouri
• SSM Health St. Joseph Hospital: Lake St. Louis, Missouri
• SSM Health St. Mary’s Hospital: St. Louis, Missouri
• SSM Health St. Clare Hospital: Fenton, Missouri
• SSM Health DePaul Hospital: St. Louis, Missouri
• SSM Health Saint Louis University Hospital: St. Louis, Missouri
• SSM Health St. Clare Hospital: Baraboo, Wisconsin*
*Optimization process not yet implemented
17

Team Development:Roles & Responsibilities
❖Establishment of a multidisciplinary team that meets routinely is essential to the success of the program.
❖ Key team members include:
➢ Quality Abstractors/Clinical Data Coordinators• Provide data definitions• Assist the informatics analysts with identifying discrete fields in Epic• Manually validate the data pull• Continuously review automated upload for quality data integrity
➢ Informatics Analysts• Develop the program using database extraction (Clarity) and front-end validation in Epic Hyperspace
• Collaborate with the abstractors and support technicians
➢ IQVIA/Quintiles Support Technicians• Provide CSV specifications• Work with the Informatics Analysts
18

SSM Process Roadmap
19
Interpret• Interpretation of clinical specifications
Identify• Identification of the data components found in Epic
Collaborate• Collaboration on the best approaches for each data element extraction (manual vs. automated)
Build• Build the extraction program
Align• Alignment of technical build and mapping specifications
Validate• Validation of extracted data fields
Review• Extensive review of the final uploaded file

Process Overview:Interpret, Identify & Collaborate
• IQVIA/Quintiles provided coding instructions that had specific qualifications and criteria for each data element.
• Quality Abstractors clarified and interpreted the instructions to align with SSM Health processes and documentation.
• The team held several webinar screen-sharing sessions to walk through complete manual abstractions of all data elements.
• During and following those sessions, the team determined the best approaches for the extraction of each data element (continued manual abstraction vs. newly automated extraction).
20
• Interpretation of clinical specifications
Identify

Tracking Documentation
➢Documentation: The team utilized an Excel file (example on the following slide) to track the:
• Required data elements
• Data locations within Epic Hyperspace and corresponding locations in Clarity (where possible)
• Expanded definitions, assumptions, and key decision points for each element
➢ The creation of the exhaustive element list and tracking document in Excel took approximately 10% of the total project time.
21

SSM Tracking Documentation Sample
22

Process Overview:Build
• The technical build (SQL), alignment with expectations, and validation of the output all occurred continuously throughout the development of the process.
• When one section or group of elements was thought to be complete, the output was shared with the Quality Abstractor.
23
Build
Align
Validate
• Build the extraction programBuild

Process Overview:Align & Validate
Two methods of validation were used:
1. Manual abstraction was performed for the target elements first, then the SQL output for the same elements was shared.
2. The SQL output for target elements was shared, then the abstractor reviewed the output to determine if the data was appropriate.
➢We chose to build and validate simultaneously. Other teams might prefer to receive all specifications up front and only move to validation after the build is complete.
➢Validation accounted for approximately 25% of the project time.
24

Technical Build: SQL – Data Mapping I
The SQL begins by creating temporary tables to hold all possible and relevant values from Clarity and their corresponding codes in the CSV specifications (SQL table definition on the following slide).
➢We chose to include the text descriptions for each code. This took extra development time which was not necessary for producing the CSV, but it made debugging much easier.
➢The temporary tables containing the mappings accounted for approximately 25% of the project time.
25

Technical Build:SQL – Data Mapping IIPrimary data mapping table definition
26

Technical Build: SQL – Data Mapping III
Example: Discharge Disposition & Other Facilities
27

Technical Build: Main SQL
After the mapping table is created, the SQL continues on to:
1) Input the appropriate date & location filters from the automation process
2) Define the population
3) Gather attributes about the population
4) Evaluate new attributes continuously for conditions that impact branching logic
• For example: if we found in the medical history that the patient had a CRT-D placed prior to hospitalization, we don’t need to go through the logic to identify the reasons ICD therapy was not placed or prescribed at discharge.
➢ The amount of time required for processing each data element was highly variable and dependent on design choices made before and while writing the SQL. The mapping table was revisited and revised several times as the project progressed.
➢ Development of the main SQL took approximately 25% of the project time.
28

Technical Build: SQL – Data Mapping IV
Once all of the elements are gathered, the SQL finishes by applying the data mapping tables to convert the output from an SSM Health Clarity report to the IQVIA/Quintiles-defined CSV (example on following slide).
At this point, changes to the output were made based on the feedback received by the CSV uploader & IQVIA/Quintiles technical support.
➢ We found that there were fewer late-stage changes to the output than expected. We attribute this to the creation and utilization of the data element tracking document as well as including the text descriptions in the mapping tables.
➢ Additional work and re-work needed to correctly format the output to the CSV specifications accounted for approximately 5% of the project time.
29

Technical Build:SQL – Data Mapping V
Example output of the SQL
30

Process Overview: Automation
Automation options will vary based on the resources available at your specific organization and how you store and retrieve your data.
➢ We chose a business process automation approach where the following steps are performed in a single script:
1. Identify the reporting period for the upload file
2. Create appropriate date-based folders on a network drive
3. Execute the SQL
4. Determine the sample size for each location based on number of records returned
5. Randomly select the sample from the full dataset for each location
6. Write out a CSV for each participating location to the folders created in step 2
➢ Development of the automation script accounted for approximately 10% of the project time.
31

• There are 69 data points for abstraction in the limited version of the PMT AHA HF registry.
• Post-project, we now manually abstract only 13 data points which are found mostly in narrative charting.
• A full manual abstract previously took 35 minutes per chart.
• Post-project, an abstractor now spends about 10 minutes per chart using the data pull automation method.
• As a result, one 0.5 FTE abstractor is now able to support HF registry abstraction for 6 adult hospitals.
32
Project Results
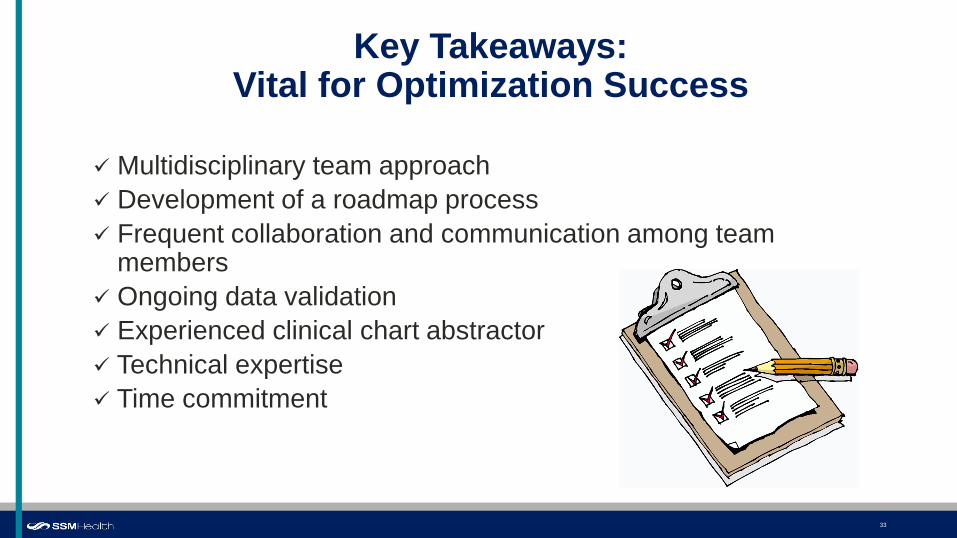
✓ Multidisciplinary team approach
✓ Development of a roadmap process
✓ Frequent collaboration and communication among team members
✓ Ongoing data validation
✓ Experienced clinical chart abstractor
✓ Technical expertise
✓ Time commitment
33
Key Takeaways:Vital for Optimization Success

34
Questions?
Please submit any post-presentation questions to:
Michael Sherwood (Technical Lead)
Senior Informatics Analyst
SSM Health – St. Louis Network
Carol Papps, RN (HF Registry Lead)
Clinical Data Coordinator
SSM Health - St. Louis Network

Contact Us to Learn More
Tanya Lane Truitt, RN MS
Senior Manager QSI Programs & Operations: Resuscitation & HF
Get With The Guidelines®
Liz Olson, CVA
Program Manager, Get With The Guidelines – Resuscitation & HF
Stay informed on the latest updates from all of the Get With The Guidelines programs.
Sign Up for Focus on Quality e-Communications

Thank you for your active participation and
contributions to GWTG-Heart Failure!
9/12/2018 ©2010, American Heart Association