Embed Size (px)
Citation preview
Options- and Volatility–based Benchmark Indexes
> Manage Portfolio Volatility > Generate Premium Income > Potentially Enhance Risk-adjusted Returns
Prepared for CBOE RMC Asia on 30 Nov. 2016By Matt Moran, CBOE, 1-312-786-7249
CBOE 2
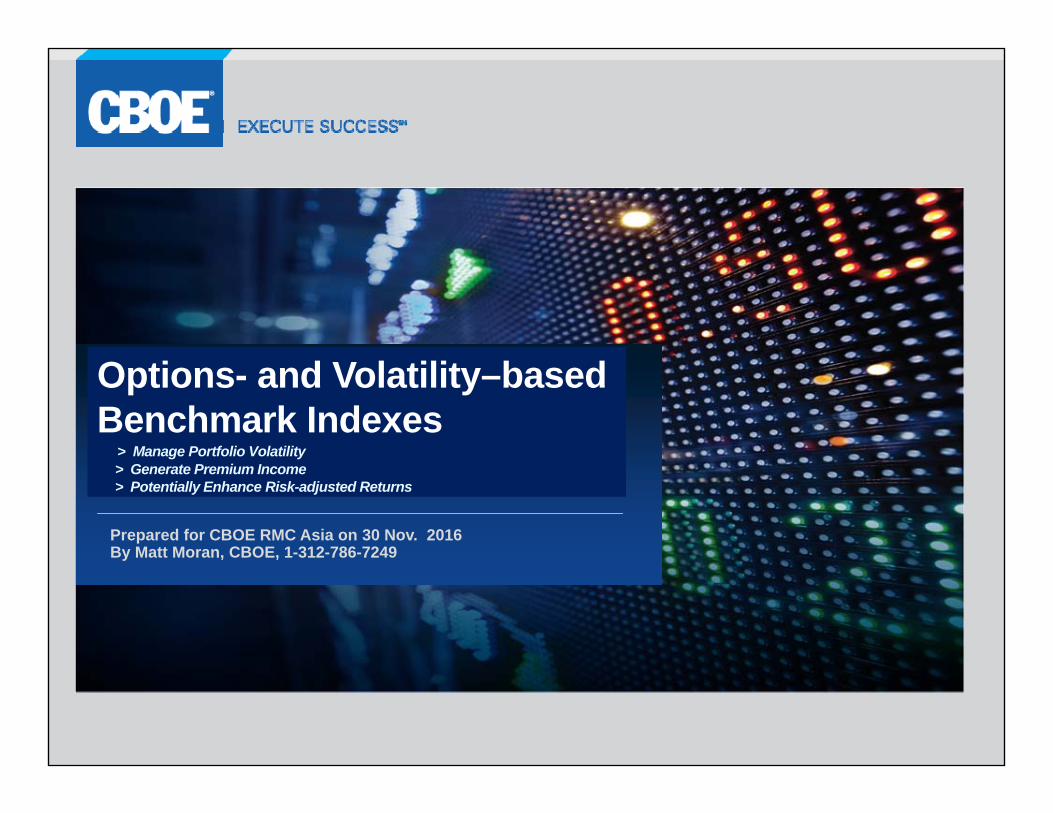
CBOE Strategy Benchmark Indexes
www.cboe.com/benchmarks
BuyWrite Indexes1 BXM CBOE S&P 500 BuyWrite Index
2 BXD CBOE DJIA BuyWrite Index
3 BXMC CBOE S&P 500 Conditional BuyWrite Index
4 BXMD CBOE S&P 500 30-Delta BuyWrite Index
5 BXMW CBOE S&P 500 Multi-Week BuyWrite Index
6 BXN CBOE Nasdaq BuyWrite Index
7 BXR CBOE Russell 2000 BuyWrite Index
8 BXRC CBOE Russell 2000 Conditional BuyWrite Index
9 BXRD CBOE Russell 2000 30-Delta BuyWrite Index
10 BXY CBOE S&P 500 2% OTM BuyWrite Index
PutWrite Indexes11 PUT CBOE S&P 500 PutWrite Index
12 PUTR CBOE Russell 2000 PutWrite Index
13 WPUT CBOE S&P 500 One-Week PutWrite Index
14 WPTR CBOE Russell 2000 One-Week PutWrite Index
Combo, Butterfly & Condor Indexes15 CMBO CBOE S&P 500 Covered Combo Index
16 BFLY CBOE S&P 500 Iron Butterfly Index
17 CNDR CBOE S&P 500 Iron Condor Index
Collar Indexes18 CLL CBOE S&P 500 95-110 Collar Index
19 CLLR CBOE Russell 2000 Zero-Cost Put Spread Collar Index
20 CLLZ CBOE S&P 500 Zero-Cost Put Spread Collar
Risk Reversal Index21 RXM CBOE Risk Reversal Index
SMILE Index22 SMILE CBOE SMILE Index
Put Protection Index23 PPUT CBOE S&P 500 5% Put Protection Index
Volatility-related Benchmark Indexes24 VPD CBOE VIX Premium Strategy Index23 VPN CBOE Capped VIX Premium Strategy Index24 VXTH CBOE VIX Tail Hedge Index25 LOVOL CBOE Low Volatility Index26 VSTG CBOE VIX Strangle Index
Target Outcome IndexesSPRO CBOE S&P 500 Buffer Protect Index Balanced SeriesSPEN CBOE S&P 500 Enhanced Growth Index Balanced Series
CBOE 3
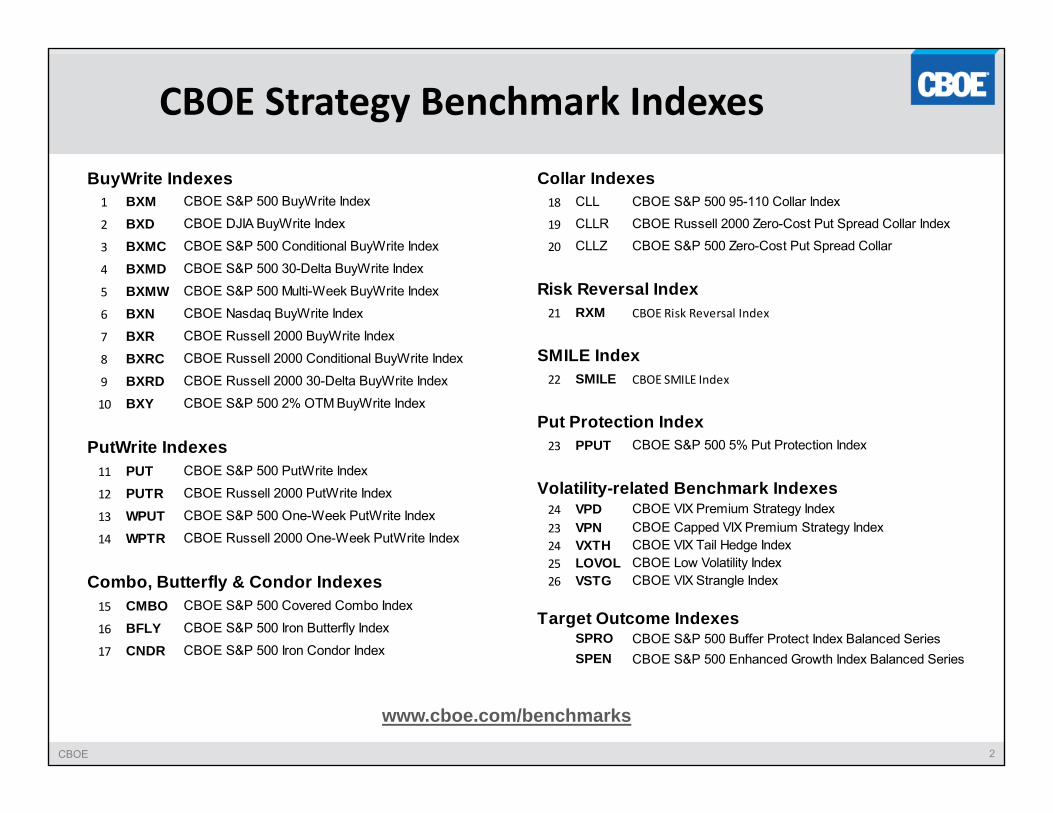
ConsultantsEight Research Papers1. Cambridge Associates. Highlights from the
Benefits of Selling Volatility (2011).2. Aon Hewitt. Harvesting the Equity
Insurance Risk Premium: Know Your Options (2014).
3. Hewitt EnnisKnupp. The CBOE S&P 500 BuyWrite Index (BXM) - A Review of Performance (2012).
4. Ennis Knupp & Associates. "Evaluating the Performance Characteristics of the CBOE S&P 500 PutWrite Index" (2008).
5. Russell Investments. Capturing the Volatility Premium through Call Overwriting. (2012).
6. Callan Associates. "An Historical Evaluation of the CBOE S&P 500 BuyWrite Index Strategy." (2006).
7. Pension Consulting Alliance. “Option-Writing Strategies in a Low-Volatility Framework” The Journal of Investing (2015).
8. Wilshire. “Three Decades of Options-Based Benchmark Indices with Premium Selling or Buying: A Performance Analysis” (Sept. 2016).
Most of the papers above focus on CBOE benchmark indexes and are at www.cboe.com/benchmarks
The Largest Investment ConsultantsRanked by worldwide institutional assets underadvisement, in millions, as of June 30, 2015.Source: Pensions & Investments (Nov. 30, 2015)
CBOE 4
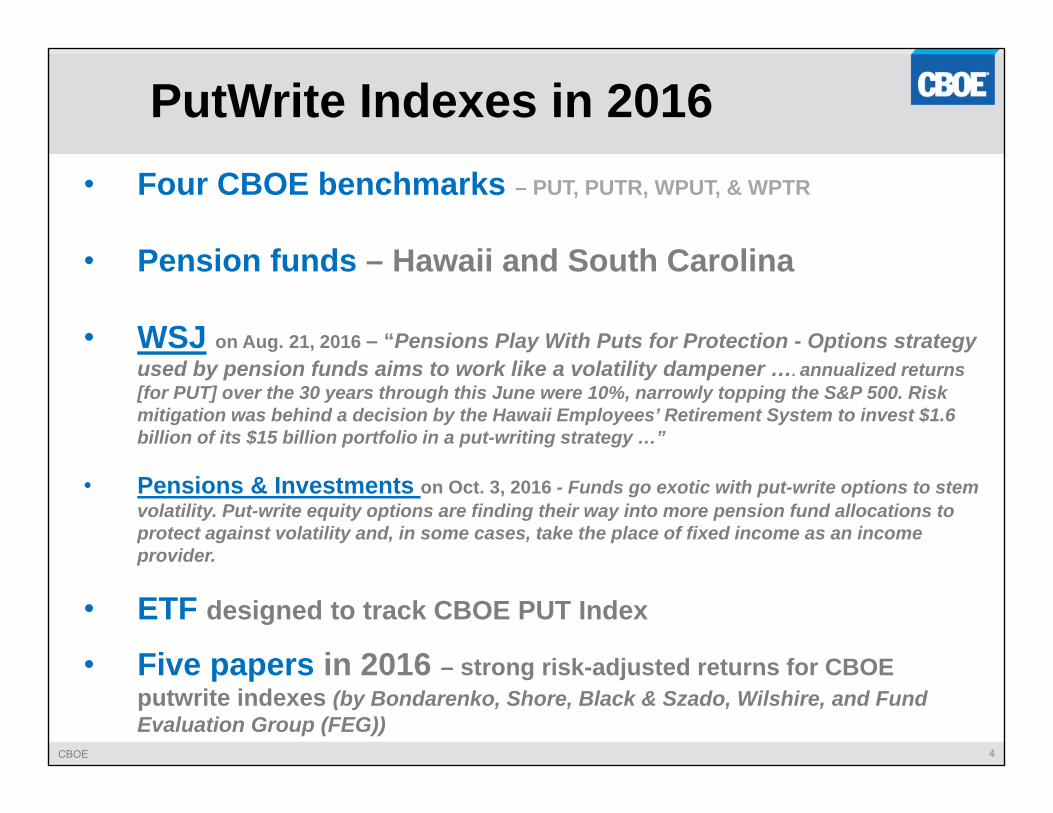
PutWrite Indexes in 2016• Four CBOE benchmarks – PUT, PUTR, WPUT, & WPTR
• Pension funds – Hawaii and South Carolina
• WSJ on Aug. 21, 2016 – “Pensions Play With Puts for Protection - Options strategy used by pension funds aims to work like a volatility dampener …. annualized returns [for PUT] over the 30 years through this June were 10%, narrowly topping the S&P 500. Risk mitigation was behind a decision by the Hawaii Employees’ Retirement System to invest $1.6 billion of its $15 billion portfolio in a put-writing strategy …”
• Pensions & Investments on Oct. 3, 2016 - Funds go exotic with put-write options to stem volatility. Put-write equity options are finding their way into more pension fund allocations to protect against volatility and, in some cases, take the place of fixed income as an income provider.
• ETF designed to track CBOE PUT Index
• Five papers in 2016 – strong risk-adjusted returns for CBOE putwrite indexes (by Bondarenko, Shore, Black & Szado, Wilshire, and Fund Evaluation Group (FEG))
CBOE 5
Three Decades of Options-Based Benchmark Indices with
Premium Selling or Buying: A Performance Analysis
September 2016Wilshire Analytics Applied Research Group
©2016 Wilshire Associates Incorporated. All rights reserved.
CBOE 6
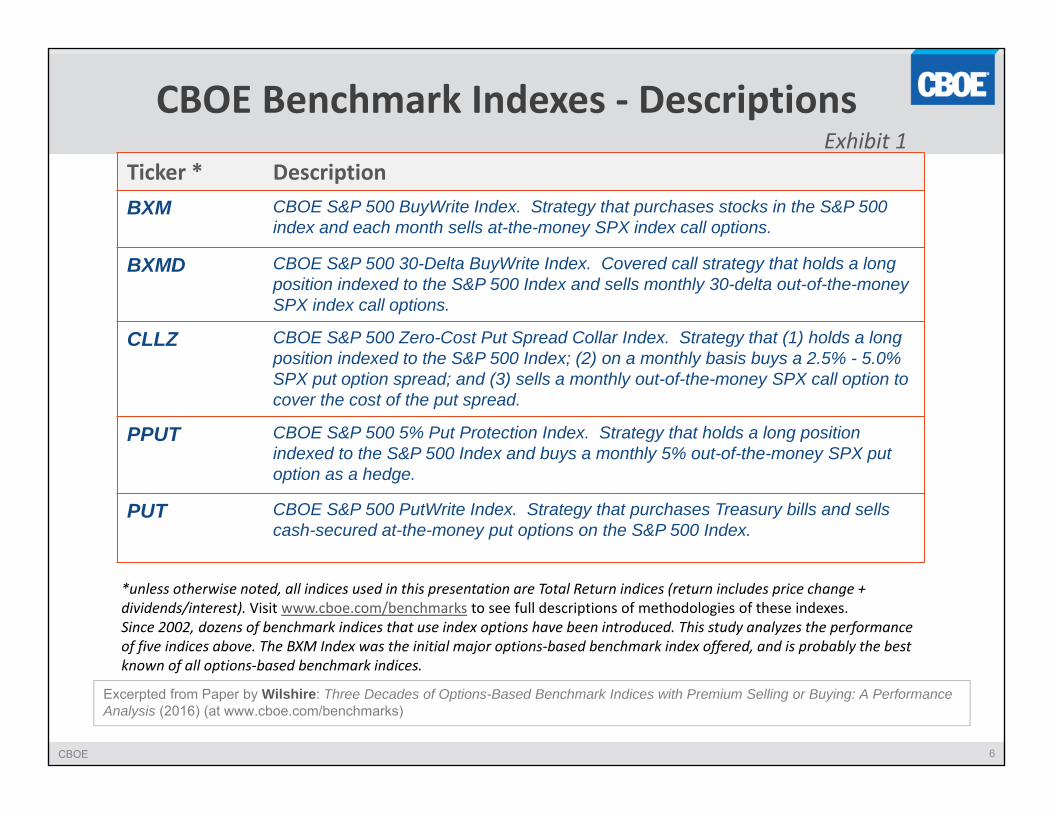
CBOE Benchmark Indexes ‐ DescriptionsExhibit 1
Ticker * DescriptionBXM CBOE S&P 500 BuyWrite Index. Strategy that purchases stocks in the S&P 500
index and each month sells at-the-money SPX index call options.
BXMD CBOE S&P 500 30-Delta BuyWrite Index. Covered call strategy that holds a long position indexed to the S&P 500 Index and sells monthly 30-delta out-of-the-money SPX index call options.
CLLZ CBOE S&P 500 Zero-Cost Put Spread Collar Index. Strategy that (1) holds a long position indexed to the S&P 500 Index; (2) on a monthly basis buys a 2.5% - 5.0% SPX put option spread; and (3) sells a monthly out-of-the-money SPX call option to cover the cost of the put spread.
PPUT CBOE S&P 500 5% Put Protection Index. Strategy that holds a long position indexed to the S&P 500 Index and buys a monthly 5% out-of-the-money SPX put option as a hedge.
PUT CBOE S&P 500 PutWrite Index. Strategy that purchases Treasury bills and sells cash-secured at-the-money put options on the S&P 500 Index.
*unless otherwise noted, all indices used in this presentation are Total Return indices (return includes price change + dividends/interest). Visit www.cboe.com/benchmarks to see full descriptions of methodologies of these indexes. Since 2002, dozens of benchmark indices that use index options have been introduced. This study analyzes the performance of five indices above. The BXM Index was the initial major options‐based benchmark index offered, and is probably the best known of all options‐based benchmark indices.
Excerpted from Paper by Wilshire: Three Decades of Options-Based Benchmark Indices with Premium Selling or Buying: A Performance Analysis (2016) (at www.cboe.com/benchmarks)
CBOE 7
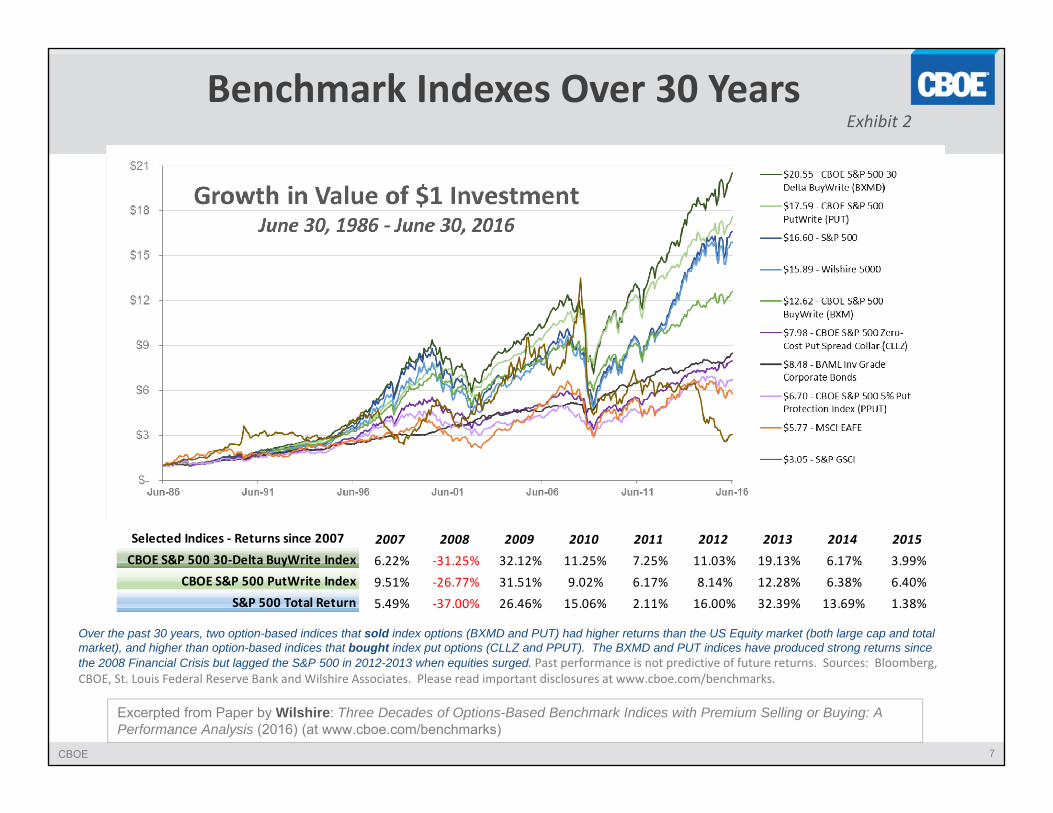
Benchmark Indexes Over 30 Years
Over the past 30 years, two option-based indices that sold index options (BXMD and PUT) had higher returns than the US Equity market (both large cap and total market), and higher than option-based indices that bought index put options (CLLZ and PPUT). The BXMD and PUT indices have produced strong returns since the 2008 Financial Crisis but lagged the S&P 500 in 2012-2013 when equities surged. Past performance is not predictive of future returns. Sources: Bloomberg, CBOE, St. Louis Federal Reserve Bank and Wilshire Associates. Please read important disclosures at www.cboe.com/benchmarks.
Exhibit 2
Selected Indices ‐ Returns since 2007 2007 2008 2009 2010 2011 2012 2013 2014 2015CBOE S&P 500 30‐Delta BuyWrite Index 6.22% ‐31.25% 32.12% 11.25% 7.25% 11.03% 19.13% 6.17% 3.99%
CBOE S&P 500 PutWrite Index 9.51% ‐26.77% 31.51% 9.02% 6.17% 8.14% 12.28% 6.38% 6.40%S&P 500 Total Return 5.49% ‐37.00% 26.46% 15.06% 2.11% 16.00% 32.39% 13.69% 1.38%
Excerpted from Paper by Wilshire: Three Decades of Options-Based Benchmark Indices with Premium Selling or Buying: A Performance Analysis (2016) (at www.cboe.com/benchmarks)
CBOE 8
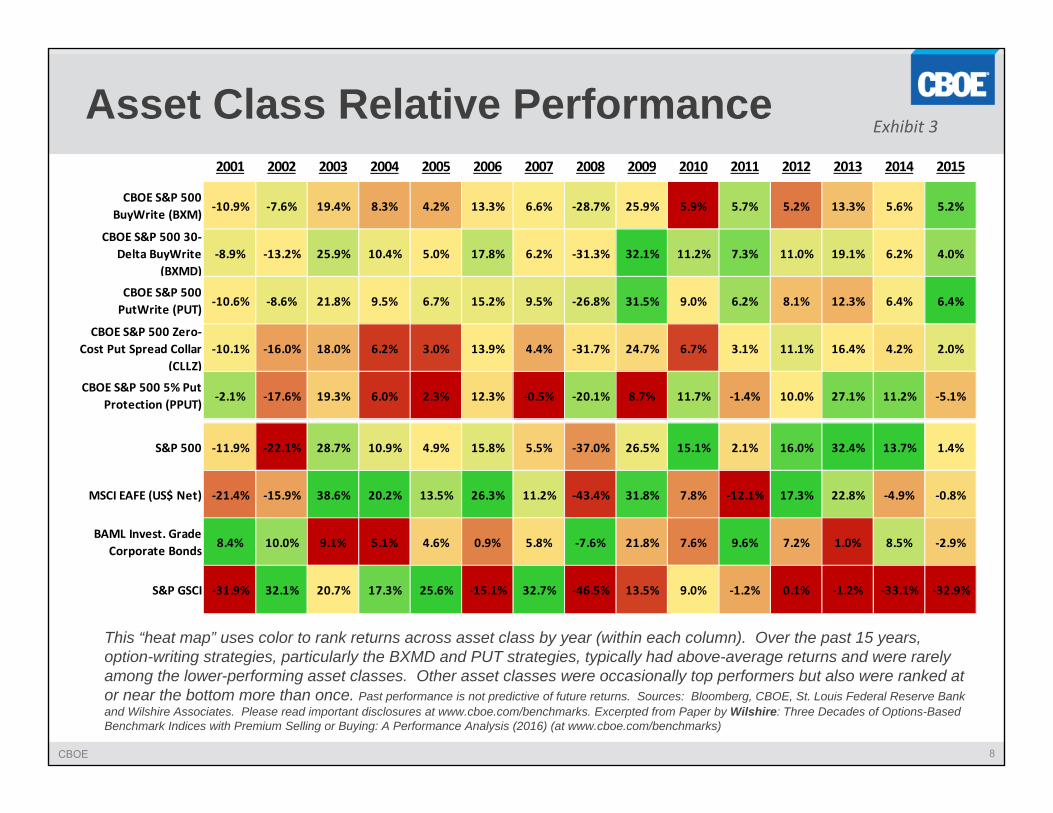
Asset Class Relative Performance
This “heat map” uses color to rank returns across asset class by year (within each column). Over the past 15 years, option-writing strategies, particularly the BXMD and PUT strategies, typically had above-average returns and were rarely among the lower-performing asset classes. Other asset classes were occasionally top performers but also were ranked at or near the bottom more than once. Past performance is not predictive of future returns. Sources: Bloomberg, CBOE, St. Louis Federal Reserve Bank and Wilshire Associates. Please read important disclosures at www.cboe.com/benchmarks. Excerpted from Paper by Wilshire: Three Decades of Options-Based Benchmark Indices with Premium Selling or Buying: A Performance Analysis (2016) (at www.cboe.com/benchmarks)
Exhibit 3
2001 2002 2003 2004 2005 2006 2007 2008 2009 2010 2011 2012 2013 2014 2015
CBOE S&P 500 BuyWrite (BXM) ‐10.9% ‐7.6% 19.4% 8.3% 4.2% 13.3% 6.6% ‐28.7% 25.9% 5.9% 5.7% 5.2% 13.3% 5.6% 5.2%
CBOE S&P 500 30‐Delta BuyWrite
(BXMD)‐8.9% ‐13.2% 25.9% 10.4% 5.0% 17.8% 6.2% ‐31.3% 32.1% 11.2% 7.3% 11.0% 19.1% 6.2% 4.0%
CBOE S&P 500 PutWrite (PUT) ‐10.6% ‐8.6% 21.8% 9.5% 6.7% 15.2% 9.5% ‐26.8% 31.5% 9.0% 6.2% 8.1% 12.3% 6.4% 6.4%
CBOE S&P 500 Zero‐Cost Put Spread Collar
(CLLZ)‐10.1% ‐16.0% 18.0% 6.2% 3.0% 13.9% 4.4% ‐31.7% 24.7% 6.7% 3.1% 11.1% 16.4% 4.2% 2.0%
CBOE S&P 500 5% Put Protection (PPUT) ‐2.1% ‐17.6% 19.3% 6.0% 2.3% 12.3% ‐0.5% ‐20.1% 8.7% 11.7% ‐1.4% 10.0% 27.1% 11.2% ‐5.1%
S&P 500 ‐11.9% ‐22.1% 28.7% 10.9% 4.9% 15.8% 5.5% ‐37.0% 26.5% 15.1% 2.1% 16.0% 32.4% 13.7% 1.4%
MSCI EAFE (US$ Net) ‐21.4% ‐15.9% 38.6% 20.2% 13.5% 26.3% 11.2% ‐43.4% 31.8% 7.8% ‐12.1% 17.3% 22.8% ‐4.9% ‐0.8%
BAML Invest. Grade Corporate Bonds 8.4% 10.0% 9.1% 5.1% 4.6% 0.9% 5.8% ‐7.6% 21.8% 7.6% 9.6% 7.2% 1.0% 8.5% ‐2.9%
S&P GSCI ‐31.9% 32.1% 20.7% 17.3% 25.6% ‐15.1% 32.7% ‐46.5% 13.5% 9.0% ‐1.2% 0.1% ‐1.2% ‐33.1% ‐32.9%
CBOE 9
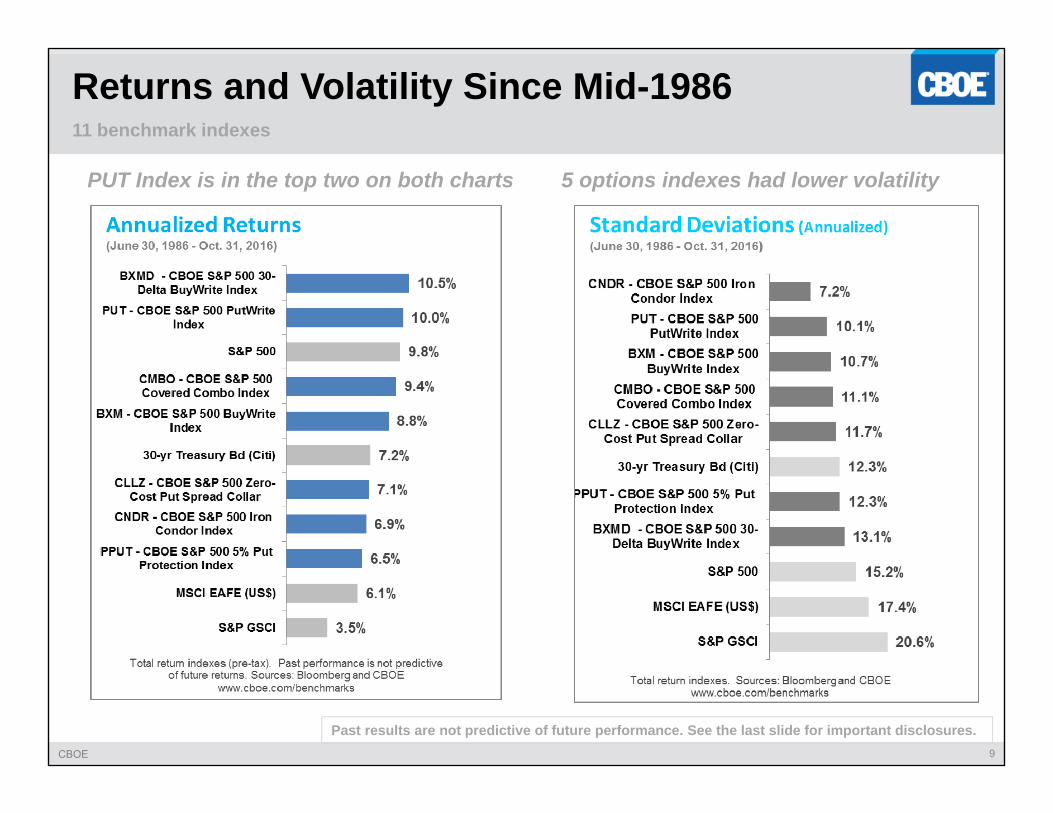
Returns and Volatility Since Mid-1986 11 benchmark indexes
PUT Index is in the top two on both charts 5 options indexes had lower volatility
Past results are not predictive of future performance. See the last slide for important disclosures.
CBOE 10
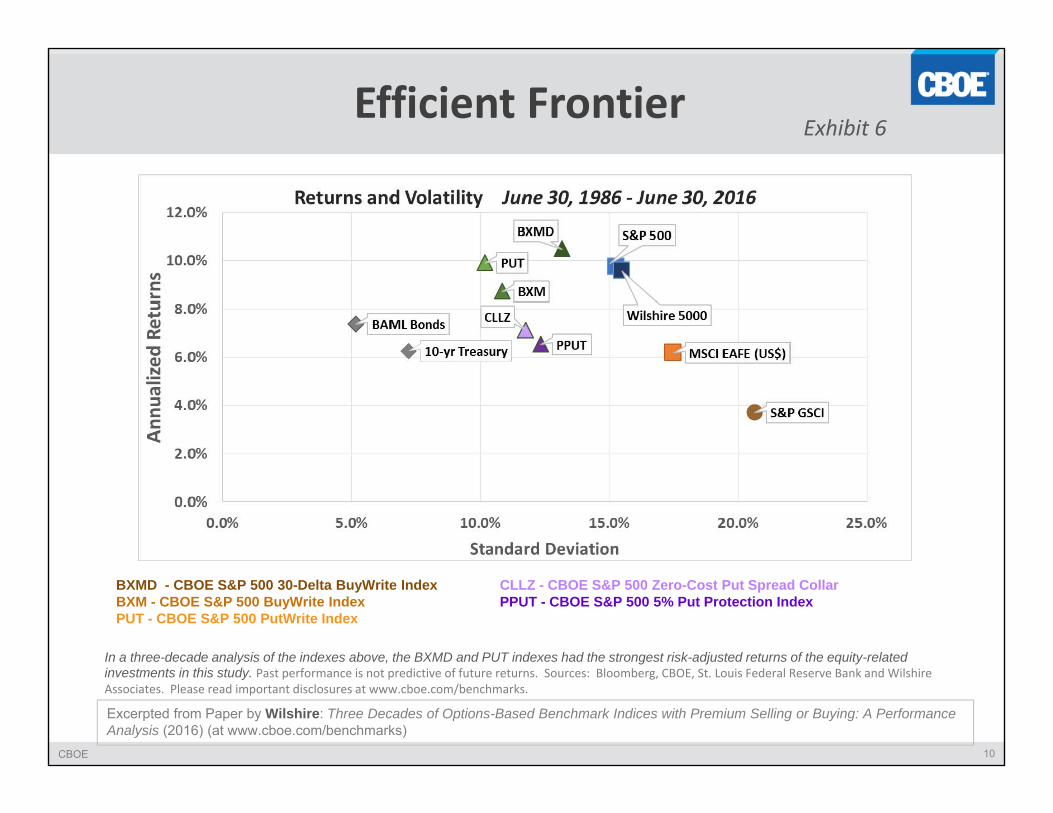
Efficient Frontier
BXMD - CBOE S&P 500 30-Delta BuyWrite Index CLLZ - CBOE S&P 500 Zero-Cost Put Spread Collar BXM - CBOE S&P 500 BuyWrite Index PPUT - CBOE S&P 500 5% Put Protection Index PUT - CBOE S&P 500 PutWrite Index
In a three-decade analysis of the indexes above, the BXMD and PUT indexes had the strongest risk-adjusted returns of the equity-related investments in this study. Past performance is not predictive of future returns. Sources: Bloomberg, CBOE, St. Louis Federal Reserve Bank and WilshireAssociates. Please read important disclosures at www.cboe.com/benchmarks.
Exhibit 6
Excerpted from Paper by Wilshire: Three Decades of Options-Based Benchmark Indices with Premium Selling or Buying: A Performance Analysis (2016) (at www.cboe.com/benchmarks)
CBOE 11
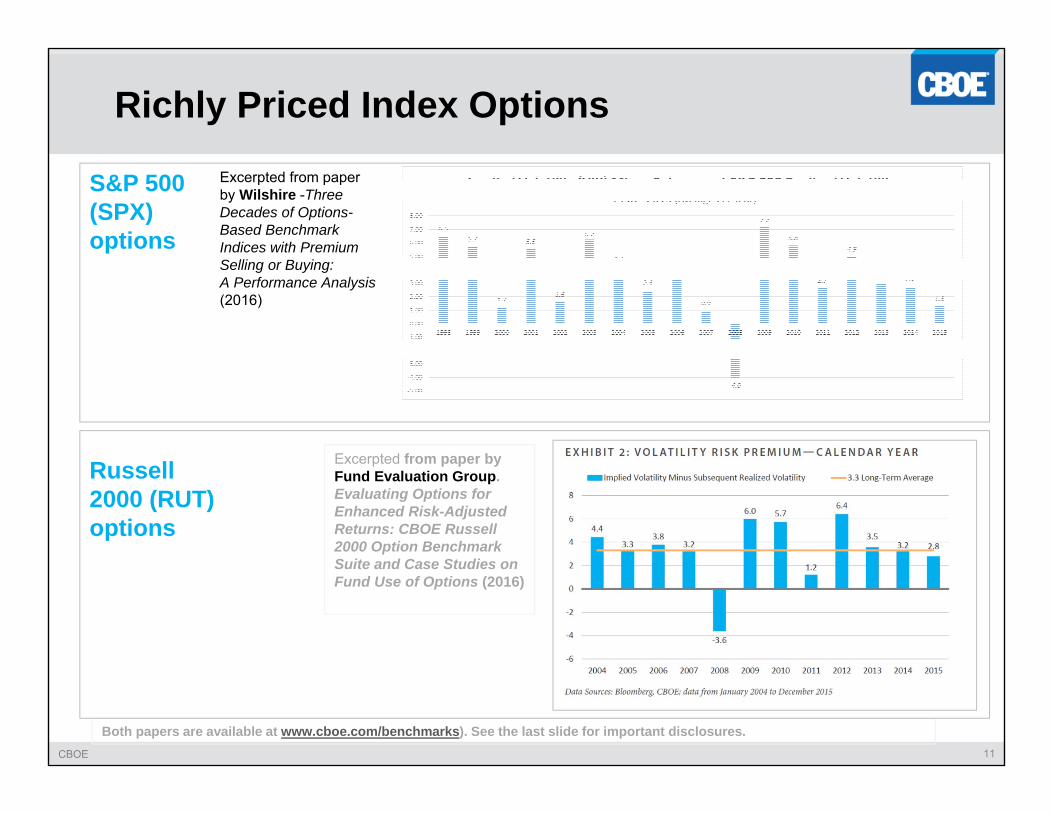
Excerpted from paper by Fund Evaluation Group. Evaluating Options for Enhanced Risk-Adjusted Returns: CBOE Russell 2000 Option Benchmark Suite and Case Studies on Fund Use of Options (2016)
Richly Priced Index OptionsExcerpted from paper by Wilshire -Three Decades of Options-Based Benchmark Indices with Premium Selling or Buying: A Performance Analysis (2016)
Both papers are available at www.cboe.com/benchmarks). See the last slide for important disclosures.
S&P 500 (SPX) options
Russell 2000 (RUT) options
CBOE 12
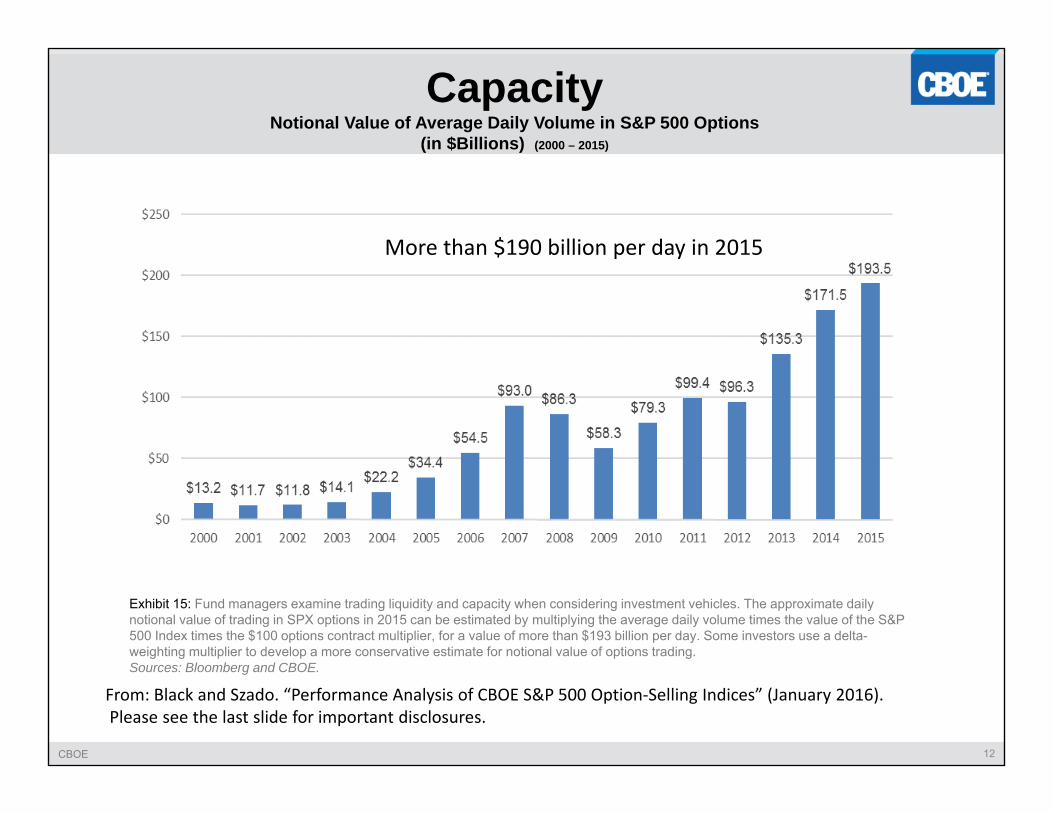
CapacityNotional Value of Average Daily Volume in S&P 500 Options
(in $Billions) (2000 – 2015)
From: Black and Szado. “Performance Analysis of CBOE S&P 500 Option‐Selling Indices” (January 2016).Please see the last slide for important disclosures.
More than $190 billion per day in 2015
Exhibit 15: Fund managers examine trading liquidity and capacity when considering investment vehicles. The approximate daily notional value of trading in SPX options in 2015 can be estimated by multiplying the average daily volume times the value of the S&P 500 Index times the $100 options contract multiplier, for a value of more than $193 billion per day. Some investors use a delta-weighting multiplier to develop a more conservative estimate for notional value of options trading. Sources: Bloomberg and CBOE.
CBOE 13
2016
CBOE 14
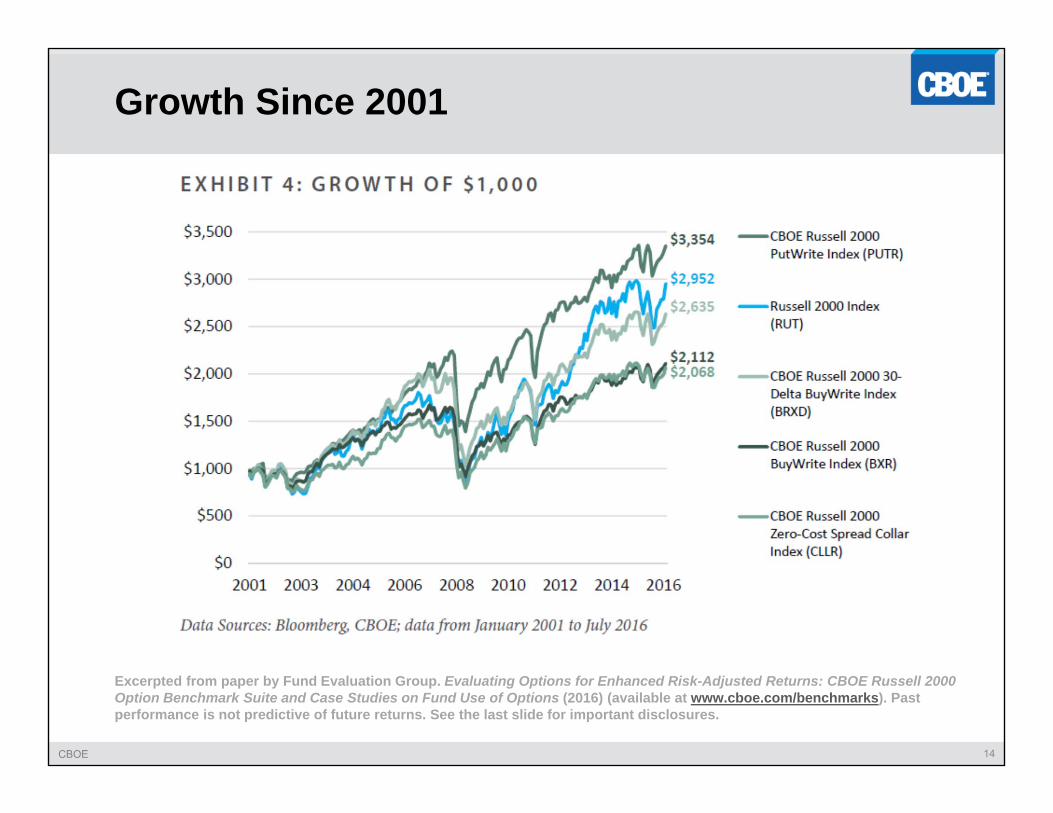
Excerpted from paper by Fund Evaluation Group. Evaluating Options for Enhanced Risk-Adjusted Returns: CBOE Russell 2000 Option Benchmark Suite and Case Studies on Fund Use of Options (2016) (available at www.cboe.com/benchmarks). Past performance is not predictive of future returns. See the last slide for important disclosures.
Growth Since 2001
CBOE 15
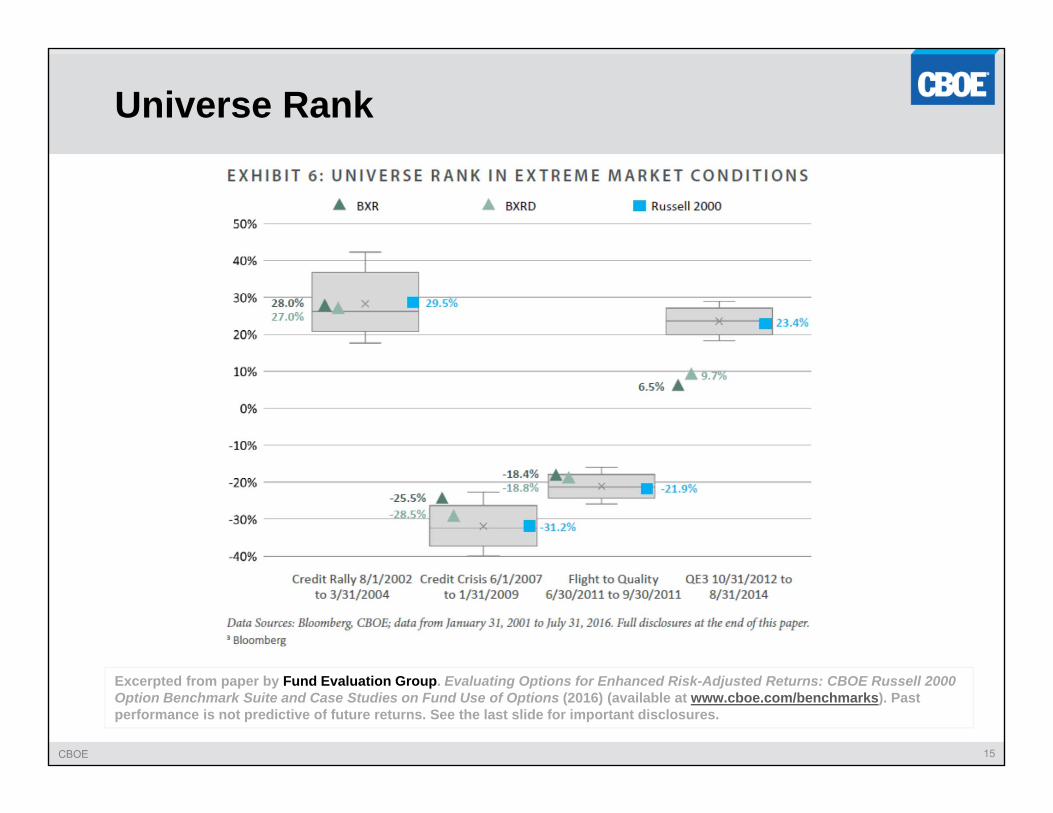
Excerpted from paper by Fund Evaluation Group. Evaluating Options for Enhanced Risk-Adjusted Returns: CBOE Russell 2000 Option Benchmark Suite and Case Studies on Fund Use of Options (2016) (available at www.cboe.com/benchmarks). Past performance is not predictive of future returns. See the last slide for important disclosures.
Universe Rank
CBOE 16
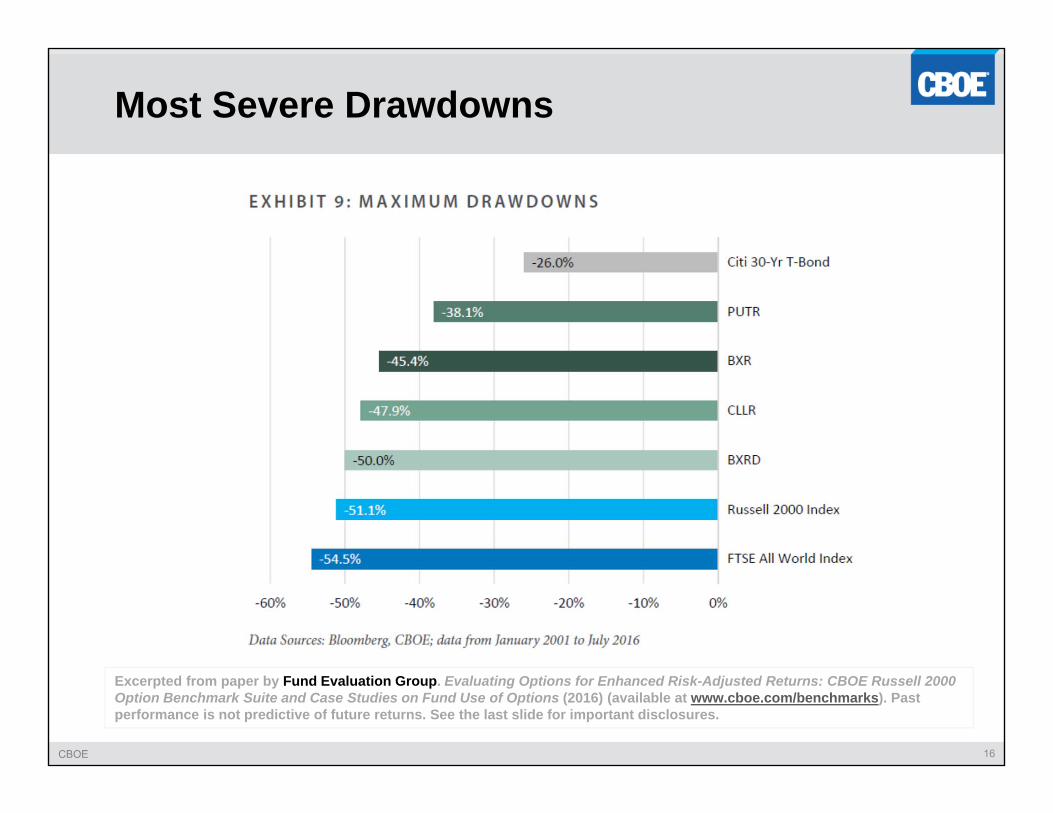
Excerpted from paper by Fund Evaluation Group. Evaluating Options for Enhanced Risk-Adjusted Returns: CBOE Russell 2000 Option Benchmark Suite and Case Studies on Fund Use of Options (2016) (available at www.cboe.com/benchmarks). Past performance is not predictive of future returns. See the last slide for important disclosures.
Most Severe Drawdowns
CBOE 17
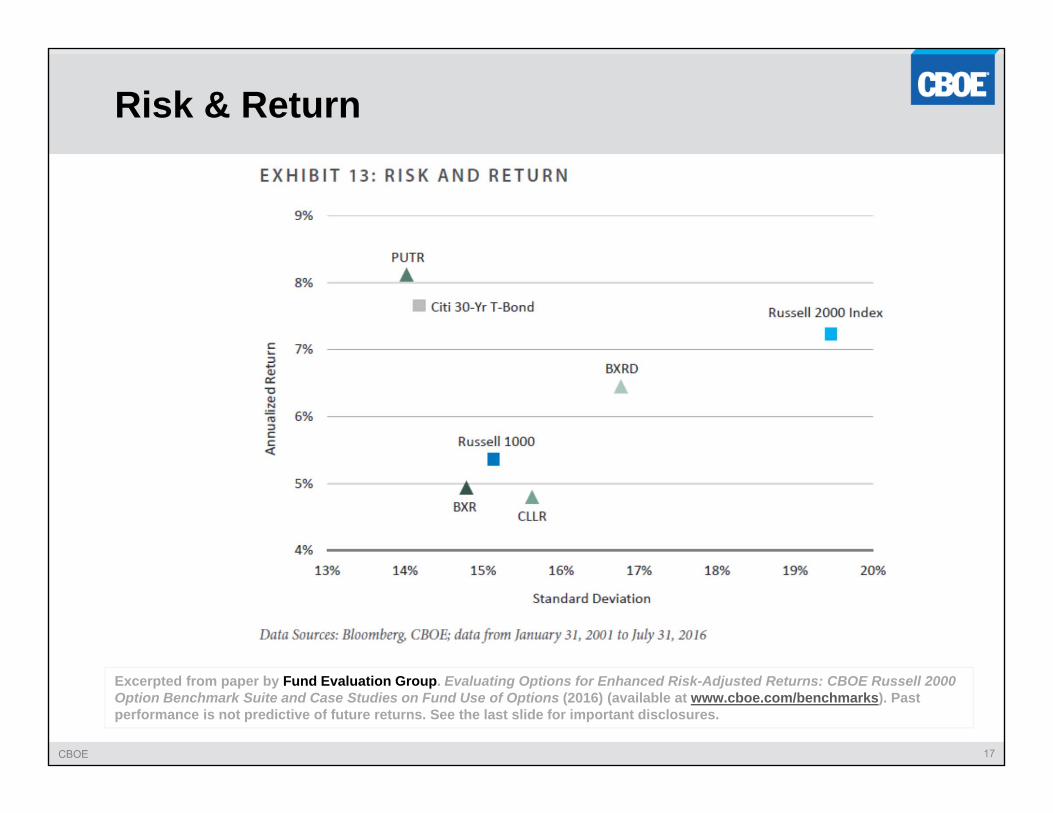
Excerpted from paper by Fund Evaluation Group. Evaluating Options for Enhanced Risk-Adjusted Returns: CBOE Russell 2000 Option Benchmark Suite and Case Studies on Fund Use of Options (2016) (available at www.cboe.com/benchmarks). Past performance is not predictive of future returns. See the last slide for important disclosures.
Risk & Return
CBOE 18
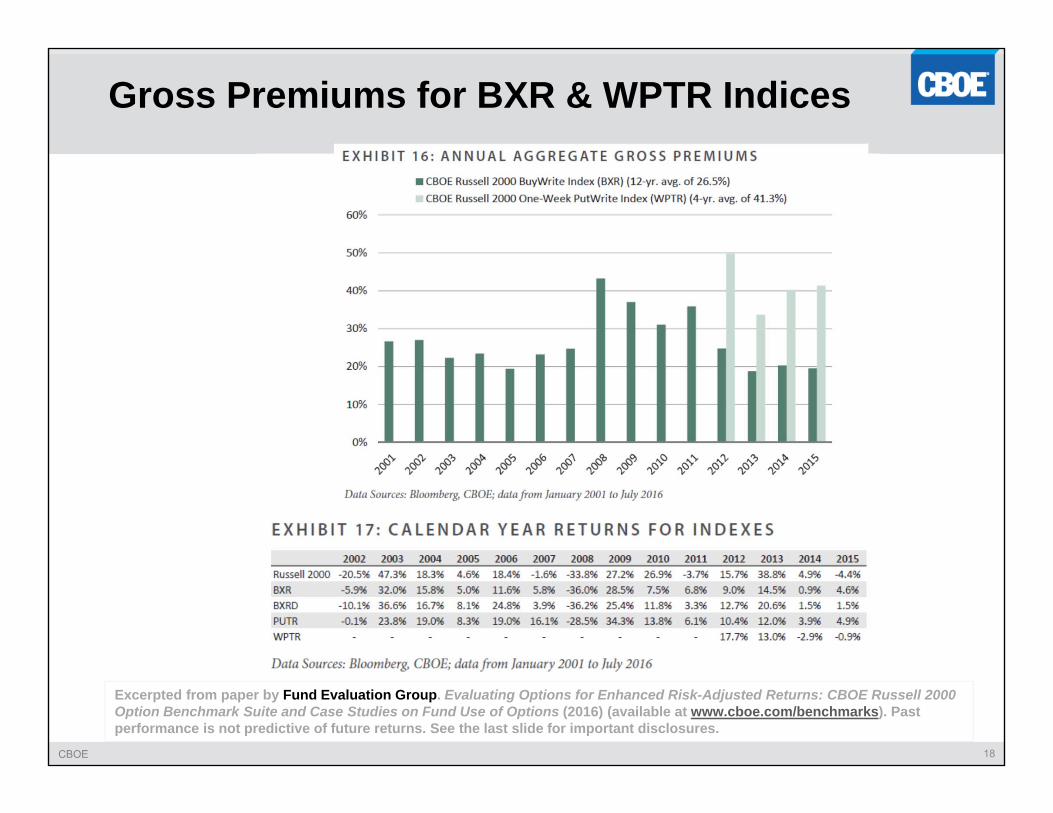
Excerpted from paper by Fund Evaluation Group. Evaluating Options for Enhanced Risk-Adjusted Returns: CBOE Russell 2000 Option Benchmark Suite and Case Studies on Fund Use of Options (2016) (available at www.cboe.com/benchmarks). Past performance is not predictive of future returns. See the last slide for important disclosures.
Gross Premiums for BXR & WPTR Indices
CBOE 19
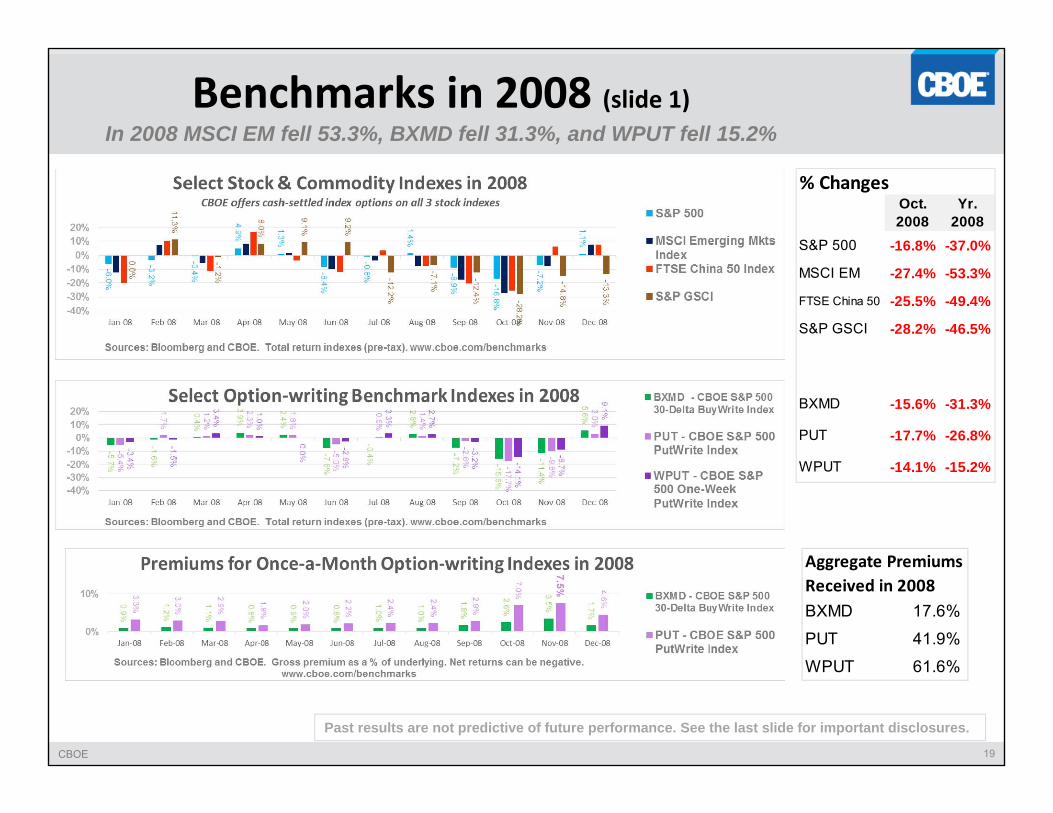
Benchmarks in 2008 (slide 1)In 2008 MSCI EM fell 53.3%, BXMD fell 31.3%, and WPUT fell 15.2%
% ChangesOct. 2008
Yr. 2008
S&P 500 -16.8% -37.0%
MSCI EM -27.4% -53.3%
FTSE China 50 -25.5% -49.4%
S&P GSCI -28.2% -46.5%
BXMD -15.6% -31.3%
PUT -17.7% -26.8%
WPUT -14.1% -15.2%
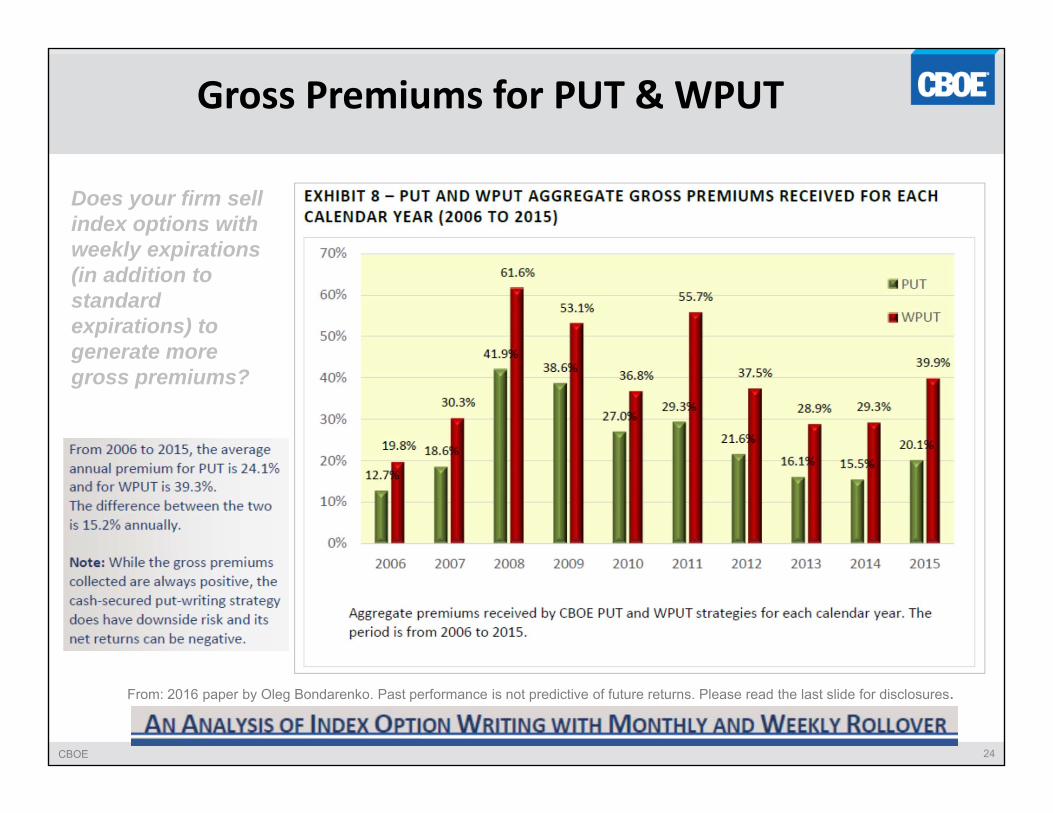
Aggregate Premiums Received in 2008BXMD 17.6%
PUT 41.9%
WPUT 61.6%
Past results are not predictive of future performance. See the last slide for important disclosures.
CBOE 20
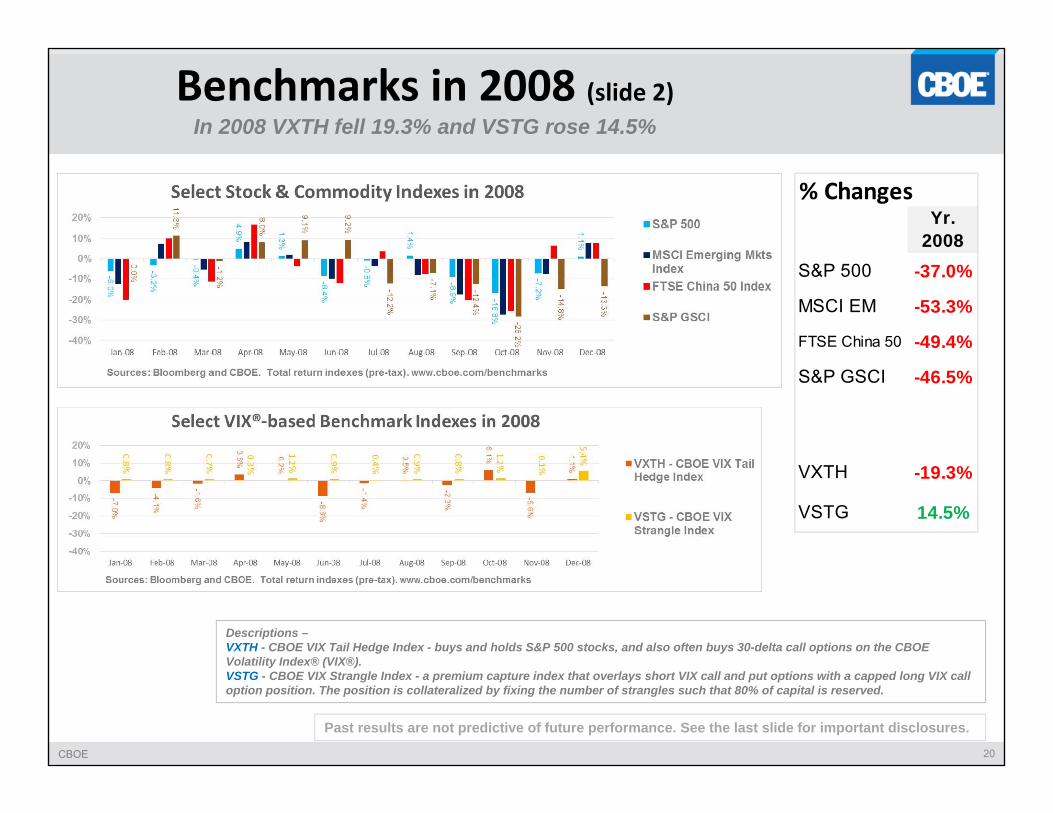
Benchmarks in 2008 (slide 2)In 2008 VXTH fell 19.3% and VSTG rose 14.5%
Descriptions –VXTH - CBOE VIX Tail Hedge Index - buys and holds S&P 500 stocks, and also often buys 30-delta call options on the CBOE Volatility Index® (VIX®).VSTG - CBOE VIX Strangle Index - a premium capture index that overlays short VIX call and put options with a capped long VIX call option position. The position is collateralized by fixing the number of strangles such that 80% of capital is reserved.
Past results are not predictive of future performance. See the last slide for important disclosures.
% ChangesYr.
2008S&P 500 -37.0%
MSCI EM -53.3%
FTSE China 50 -49.4%
S&P GSCI -46.5%
VXTH -19.3%
VSTG 14.5%
CBOE 21
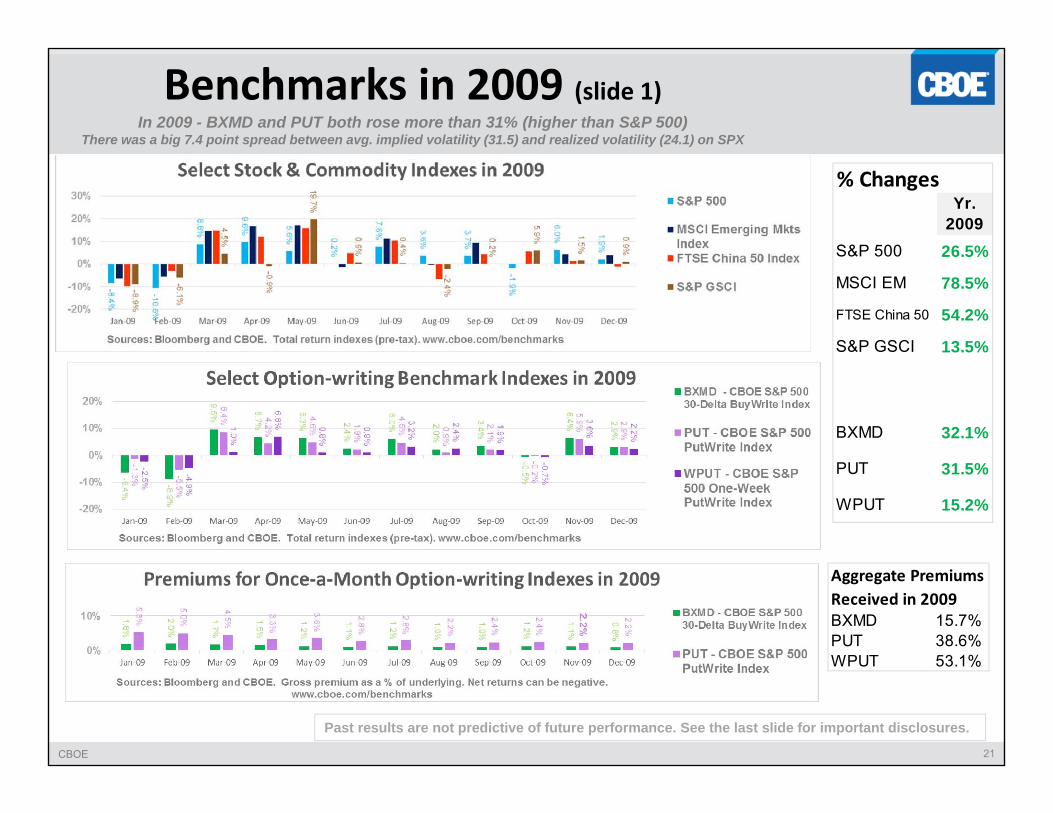
Benchmarks in 2009 (slide 1) In 2009 - BXMD and PUT both rose more than 31% (higher than S&P 500)
There was a big 7.4 point spread between avg. implied volatility (31.5) and realized volatility (24.1) on SPX
Aggregate Premiums Received in 2009BXMD 15.7%PUT 38.6%WPUT 53.1%
% ChangesYr.
2009S&P 500 26.5%
MSCI EM 78.5%
FTSE China 50 54.2%
S&P GSCI 13.5%
BXMD 32.1%
PUT 31.5%
WPUT 15.2%
Past results are not predictive of future performance. See the last slide for important disclosures.
CBOE 22
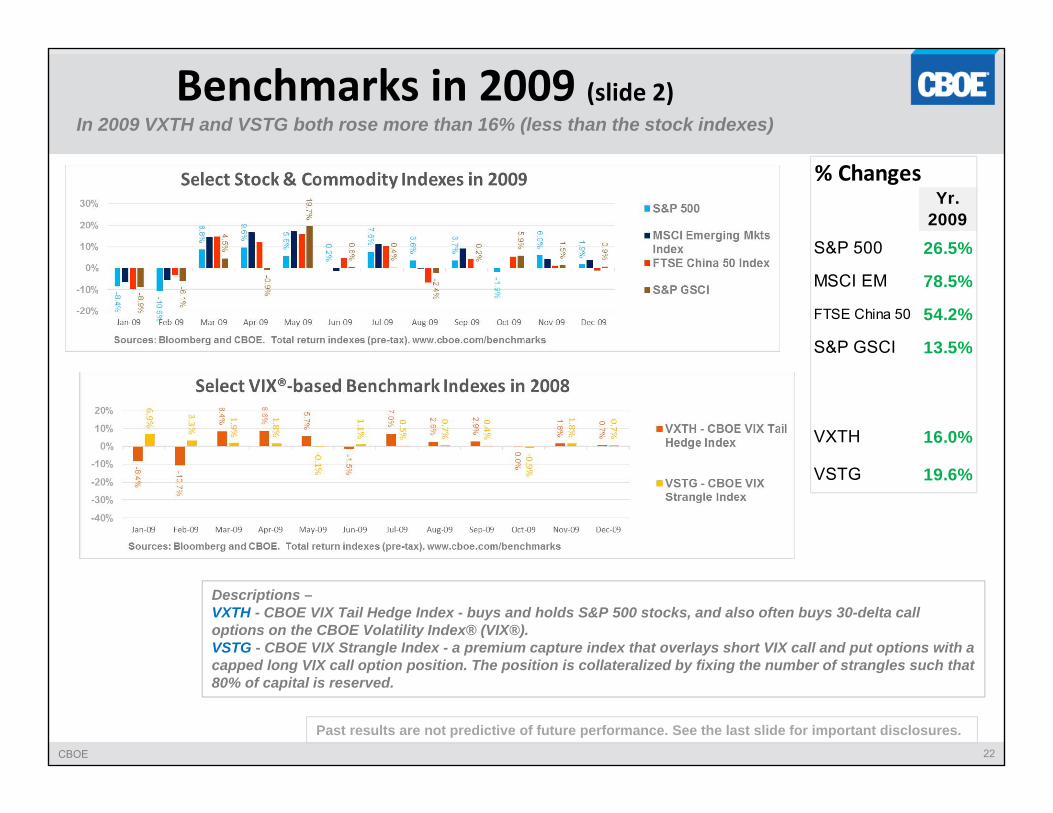
Benchmarks in 2009 (slide 2)In 2009 VXTH and VSTG both rose more than 16% (less than the stock indexes)
% ChangesYr.
2009S&P 500 26.5%
MSCI EM 78.5%
FTSE China 50 54.2%
S&P GSCI 13.5%
VXTH 16.0%
VSTG 19.6%
Descriptions –VXTH - CBOE VIX Tail Hedge Index - buys and holds S&P 500 stocks, and also often buys 30-delta call options on the CBOE Volatility Index® (VIX®).VSTG - CBOE VIX Strangle Index - a premium capture index that overlays short VIX call and put options with a capped long VIX call option position. The position is collateralized by fixing the number of strangles such that 80% of capital is reserved.
Past results are not predictive of future performance. See the last slide for important disclosures.
CBOE 23
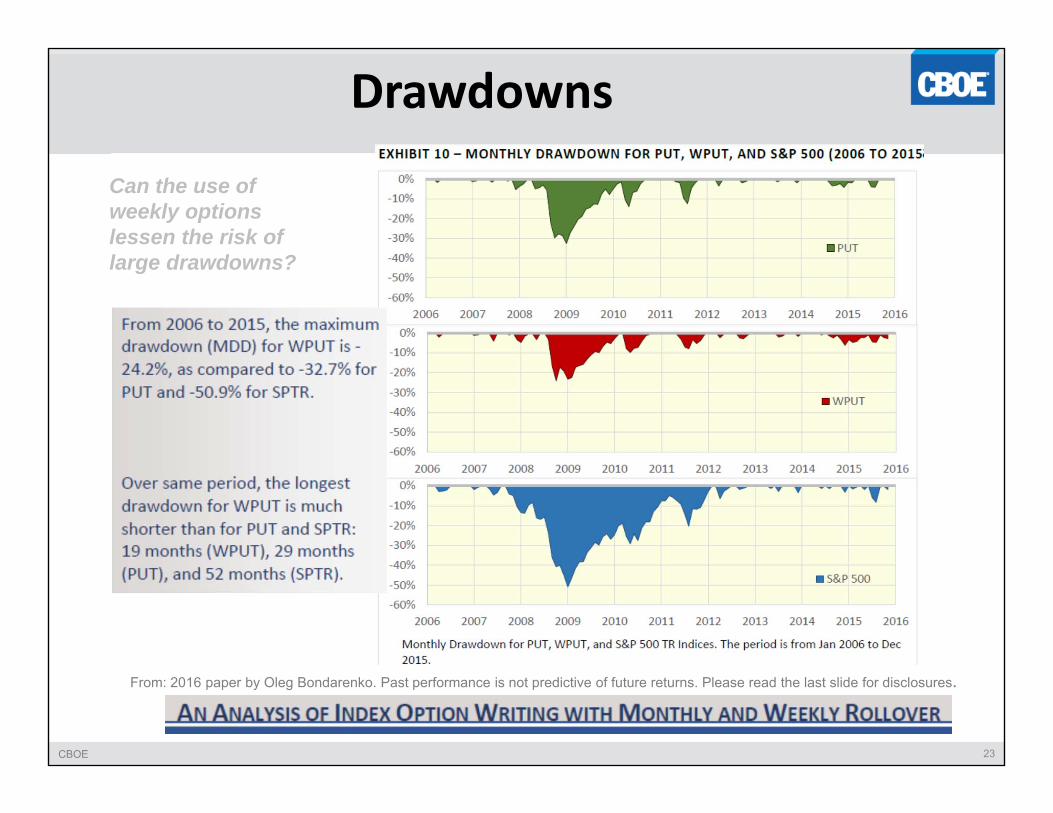
Drawdowns
Can the use of weekly options lessen the risk of large drawdowns?
From: 2016 paper by Oleg Bondarenko. Past performance is not predictive of future returns. Please read the last slide for disclosures.
CBOE 24
Gross Premiums for PUT & WPUT
From: 2016 paper by Oleg Bondarenko. Past performance is not predictive of future returns. Please read the last slide for disclosures.
Does your firm sell index options with weekly expirations (in addition to standard expirations) to generate more gross premiums?
CBOE 25
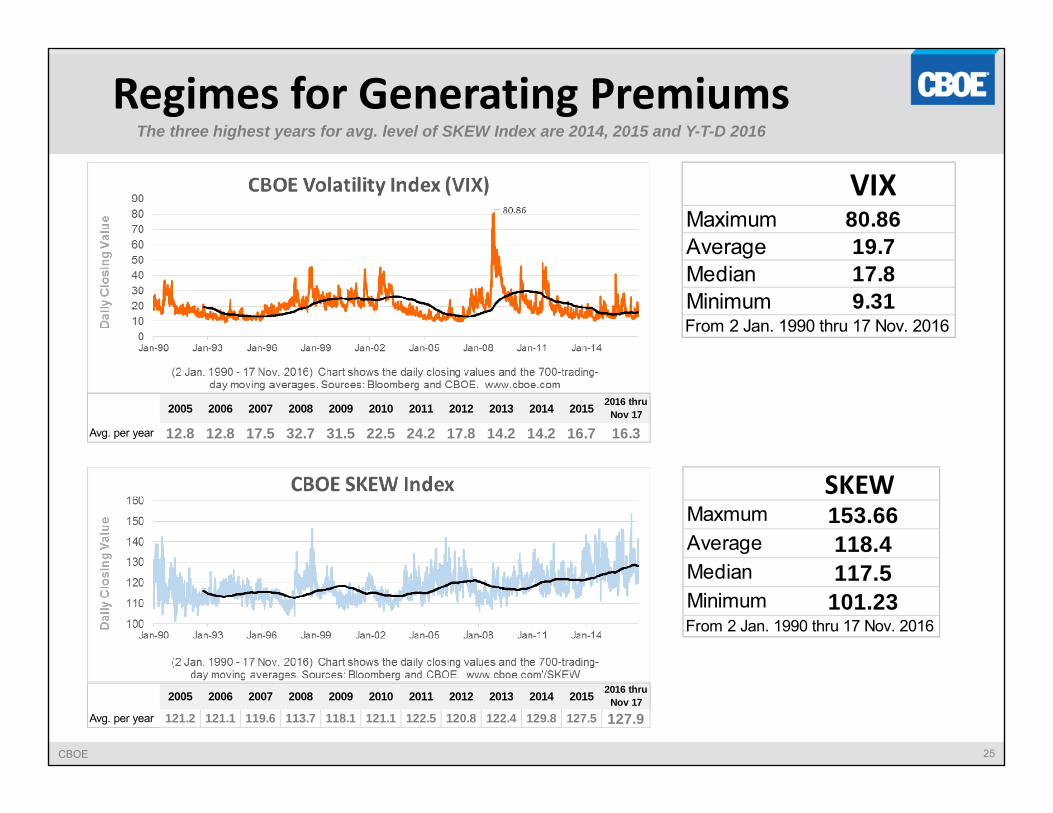
Regimes for Generating PremiumsThe three highest years for avg. level of SKEW Index are 2014, 2015 and Y-T-D 2016
2005 2006 2007 2008 2009 2010 2011 2012 2013 2014 2015 2016 thru Nov 17
Avg. per year 12.8 12.8 17.5 32.7 31.5 22.5 24.2 17.8 14.2 14.2 16.7 16.3
2005 2006 2007 2008 2009 2010 2011 2012 2013 2014 2015 2016 thru Nov 17
Avg. per year 121.2 121.1 119.6 113.7 118.1 121.1 122.5 120.8 122.4 129.8 127.5 127.9
SKEW Maxmum 153.66Average 118.4Median 117.5Minimum 101.23From 2 Jan. 1990 thru 17 Nov. 2016
VIXMaximum 80.86Average 19.7Median 17.8Minimum 9.31From 2 Jan. 1990 thru 17 Nov. 2016
CBOE 26
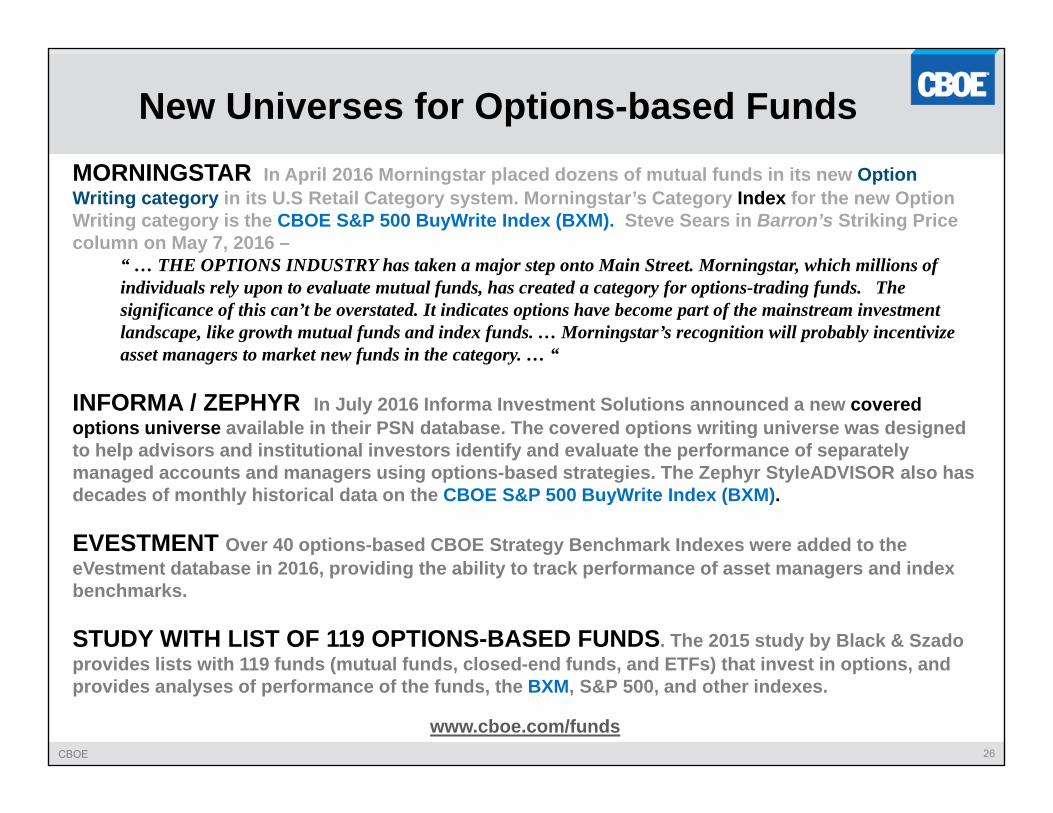
New Universes for Options-based FundsMORNINGSTAR In April 2016 Morningstar placed dozens of mutual funds in its new Option Writing category in its U.S Retail Category system. Morningstar’s Category Index for the new Option Writing category is the CBOE S&P 500 BuyWrite Index (BXM). Steve Sears in Barron’s Striking Price column on May 7, 2016 –
“ … THE OPTIONS INDUSTRY has taken a major step onto Main Street. Morningstar, which millions of individuals rely upon to evaluate mutual funds, has created a category for options-trading funds. The significance of this can’t be overstated. It indicates options have become part of the mainstream investment landscape, like growth mutual funds and index funds. … Morningstar’s recognition will probably incentivize asset managers to market new funds in the category. … “
INFORMA / ZEPHYR In July 2016 Informa Investment Solutions announced a new covered options universe available in their PSN database. The covered options writing universe was designed to help advisors and institutional investors identify and evaluate the performance of separately managed accounts and managers using options-based strategies. The Zephyr StyleADVISOR also has decades of monthly historical data on the CBOE S&P 500 BuyWrite Index (BXM).
EVESTMENT Over 40 options-based CBOE Strategy Benchmark Indexes were added to the eVestment database in 2016, providing the ability to track performance of asset managers and index benchmarks.
STUDY WITH LIST OF 119 OPTIONS-BASED FUNDS. The 2015 study by Black & Szado provides lists with 119 funds (mutual funds, closed-end funds, and ETFs) that invest in options, and provides analyses of performance of the funds, the BXM, S&P 500, and other indexes.
www.cboe.com/funds
CBOE 27
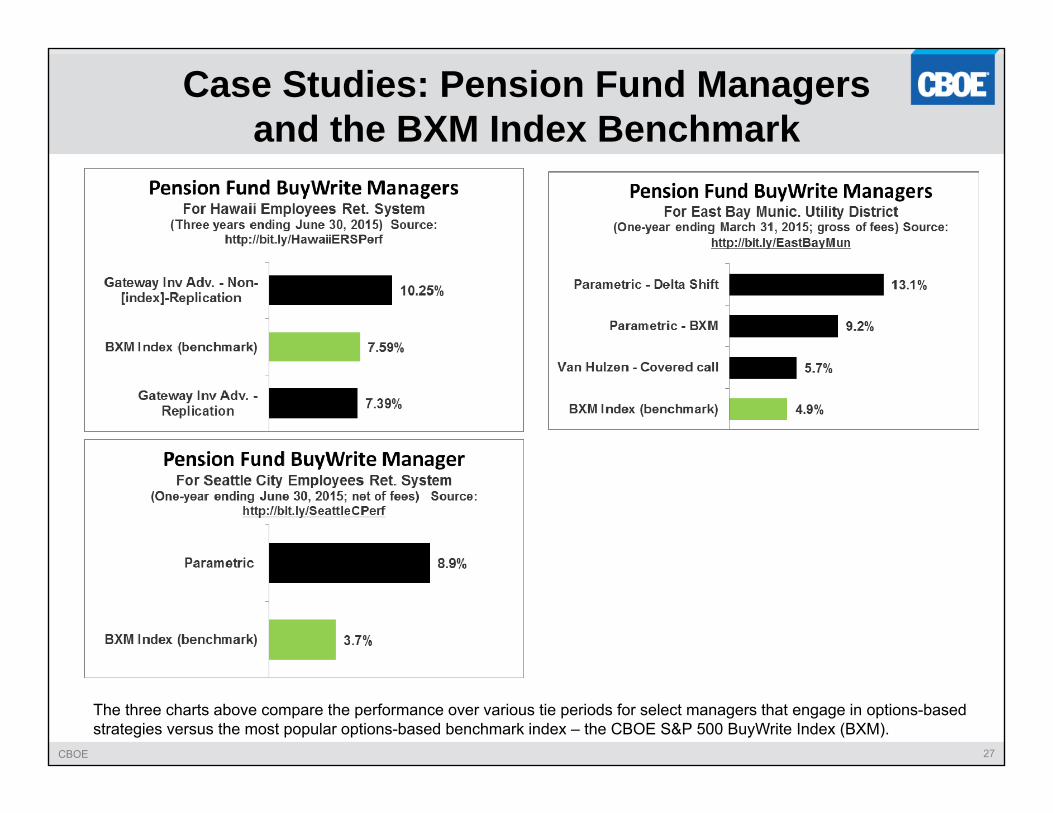
Case Studies: Pension Fund Managers and the BXM Index Benchmark
The three charts above compare the performance over various tie periods for select managers that engage in options-based strategies versus the most popular options-based benchmark index – the CBOE S&P 500 BuyWrite Index (BXM).
CBOE 28
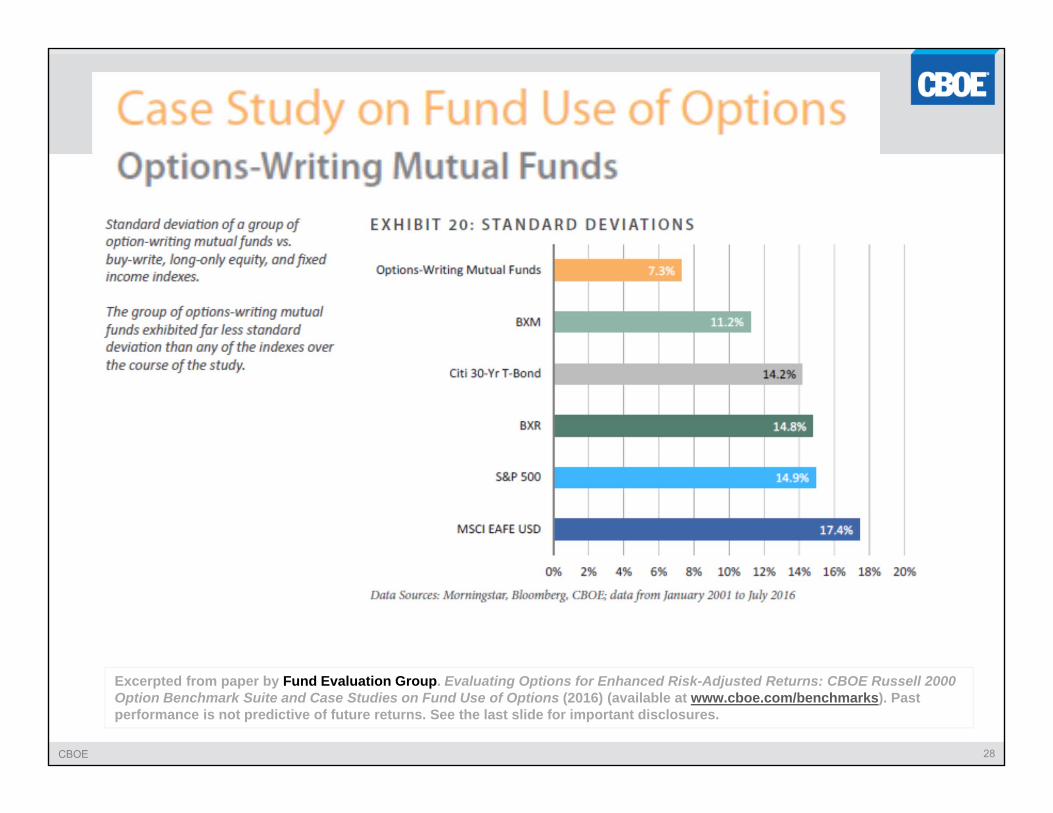
Excerpted from paper by Fund Evaluation Group. Evaluating Options for Enhanced Risk-Adjusted Returns: CBOE Russell 2000 Option Benchmark Suite and Case Studies on Fund Use of Options (2016) (available at www.cboe.com/benchmarks). Past performance is not predictive of future returns. See the last slide for important disclosures.
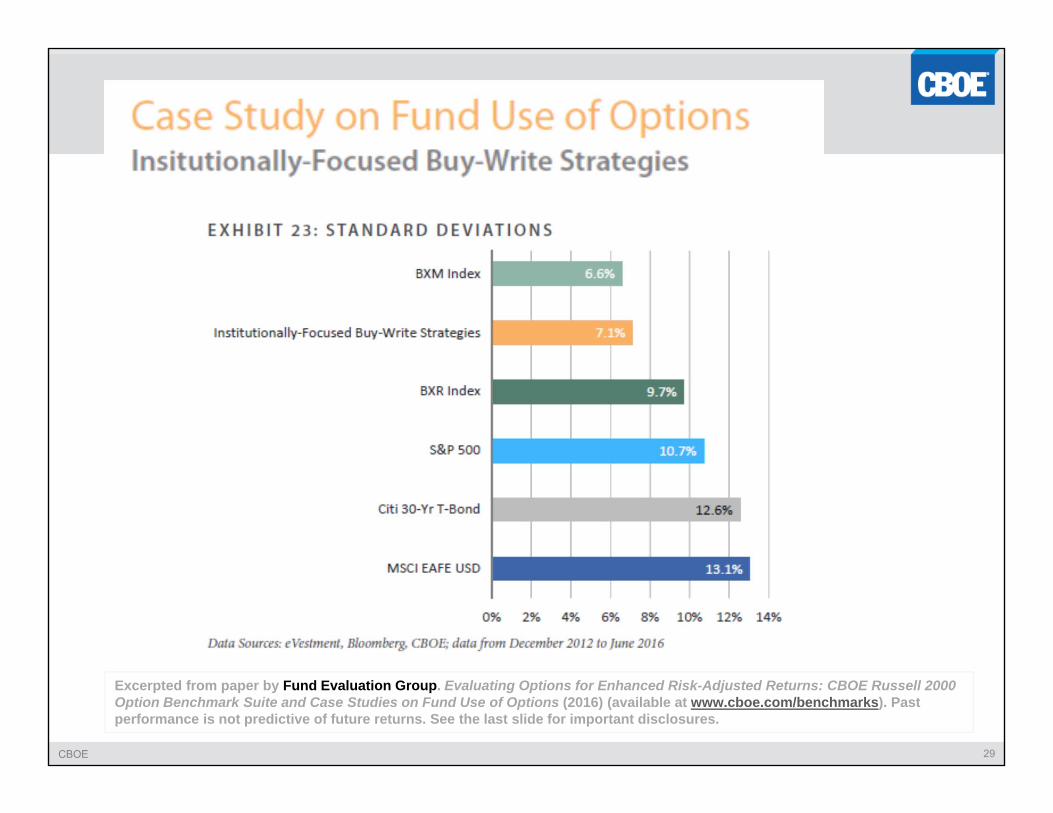
CBOE 29
Excerpted from paper by Fund Evaluation Group. Evaluating Options for Enhanced Risk-Adjusted Returns: CBOE Russell 2000 Option Benchmark Suite and Case Studies on Fund Use of Options (2016) (available at www.cboe.com/benchmarks). Past performance is not predictive of future returns. See the last slide for important disclosures.
CBOE 30
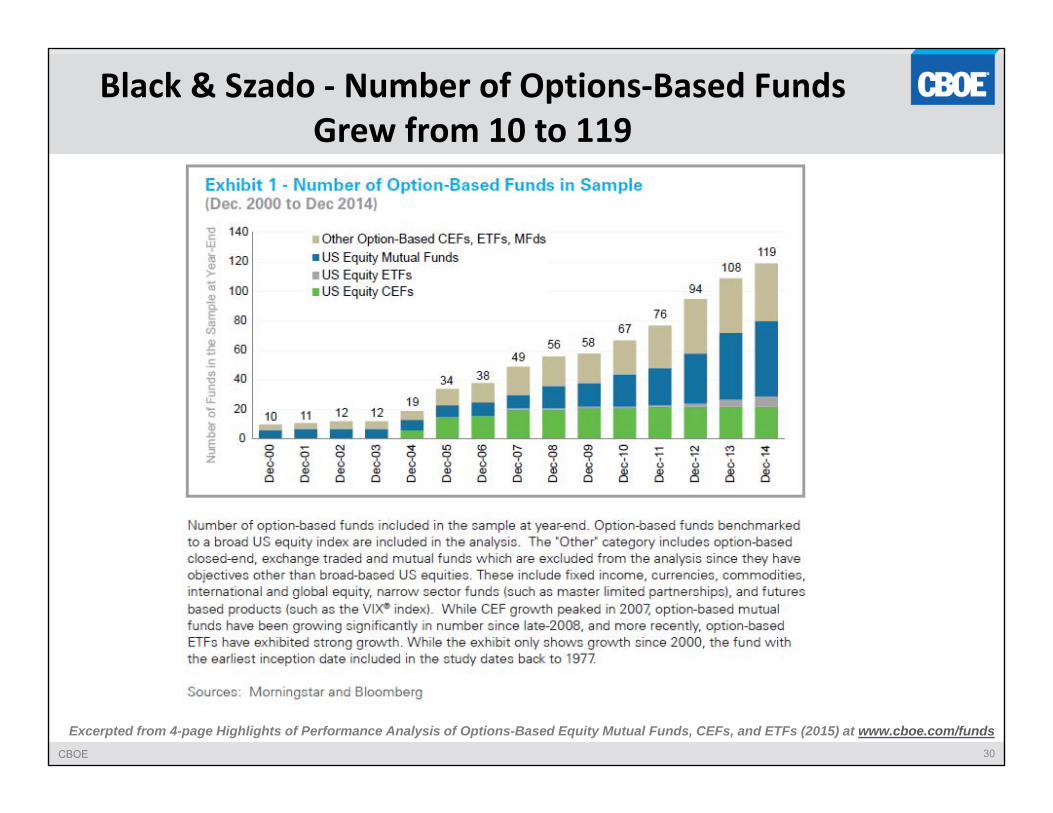
Black & Szado ‐ Number of Options‐Based Funds Grew from 10 to 119
Excerpted from 4-page Highlights of Performance Analysis of Options-Based Equity Mutual Funds, CEFs, and ETFs (2015) at www.cboe.com/funds
CBOE 31
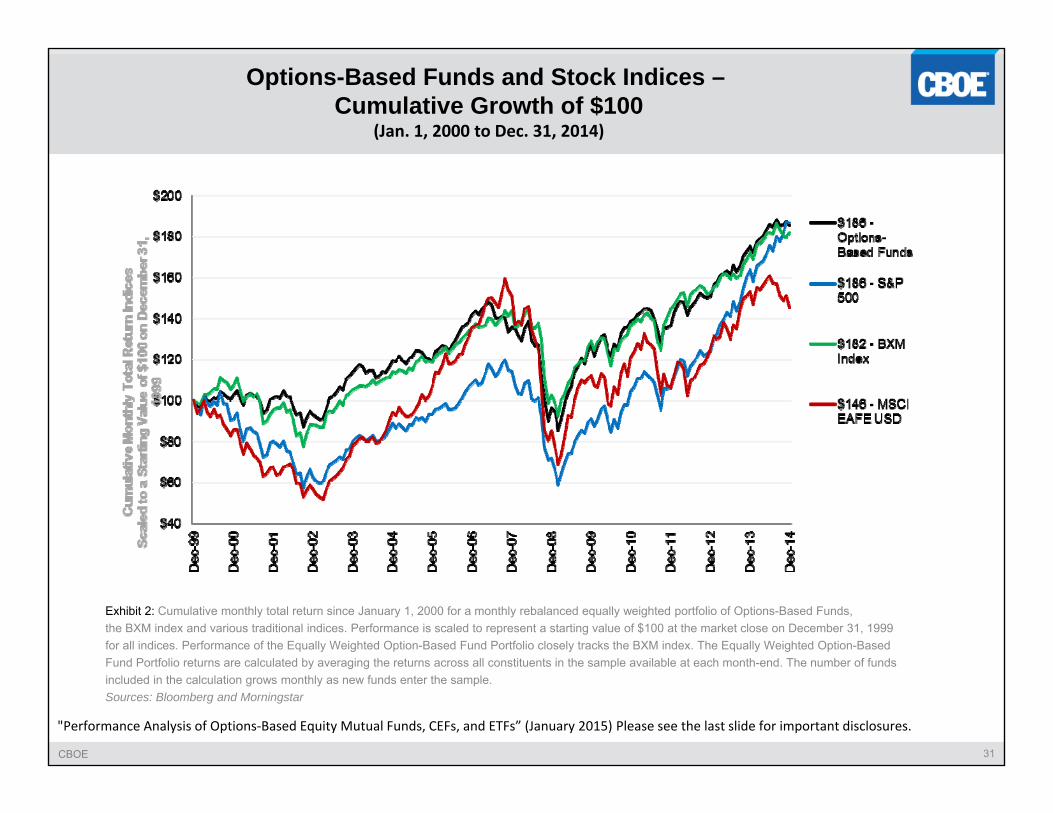
Exhibit 2: Cumulative monthly total return since January 1, 2000 for a monthly rebalanced equally weighted portfolio of Options-Based Funds, the BXM index and various traditional indices. Performance is scaled to represent a starting value of $100 at the market close on December 31, 1999 for all indices. Performance of the Equally Weighted Option-Based Fund Portfolio closely tracks the BXM index. The Equally Weighted Option-Based Fund Portfolio returns are calculated by averaging the returns across all constituents in the sample available at each month-end. The number of funds included in the calculation grows monthly as new funds enter the sample.Sources: Bloomberg and Morningstar
"Performance Analysis of Options‐Based Equity Mutual Funds, CEFs, and ETFs” (January 2015) Please see the last slide for important disclosures.
Options-Based Funds and Stock Indices –Cumulative Growth of $100
(Jan. 1, 2000 to Dec. 31, 2014)
CBOE 32
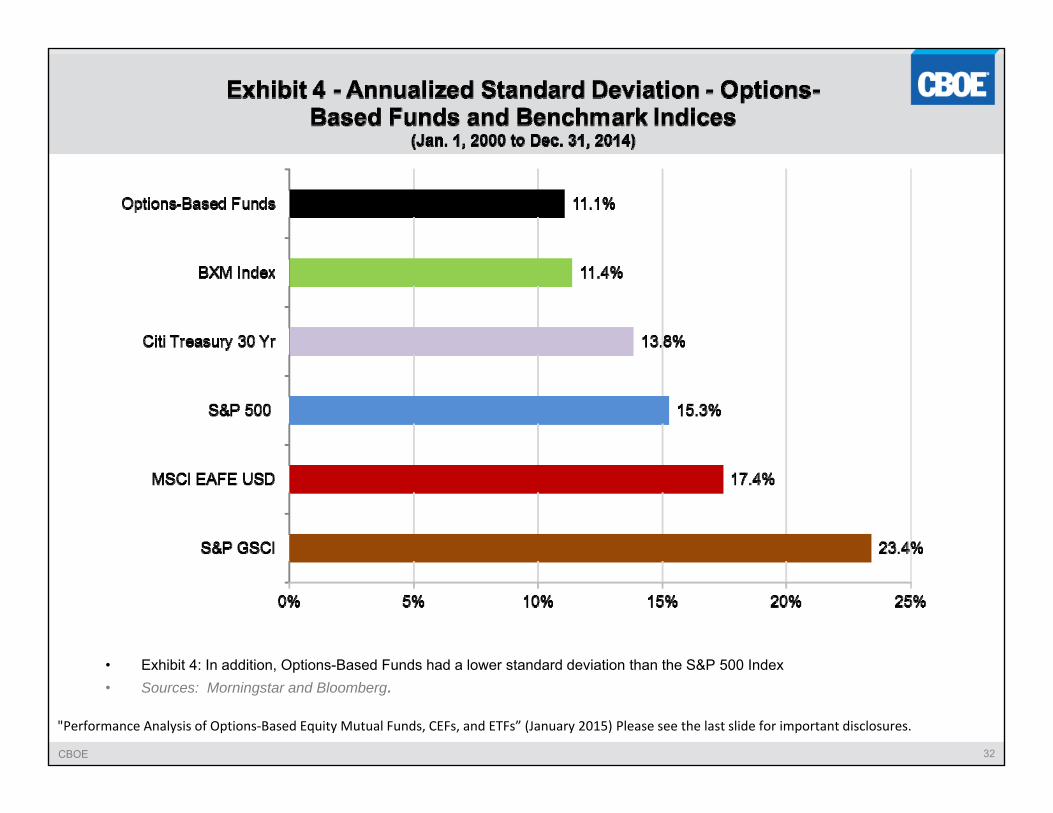
• Exhibit 4: In addition, Options-Based Funds had a lower standard deviation than the S&P 500 Index• Sources: Morningstar and Bloomberg.
"Performance Analysis of Options‐Based Equity Mutual Funds, CEFs, and ETFs” (January 2015) Please see the last slide for important disclosures.
CBOE 33
Thank You
CBOE’s Options Benchmark Indexes> Manage Portfolio Volatility > Generate Premium Income > Potentially Enhance Risk-adjusted Returns
www.cboe.com/benchmarks
CBOE 34
“Performance Analysis of CBOE S&P 500 Options‐Selling Indices” (January 2016) Please see the last slide for important disclosures.
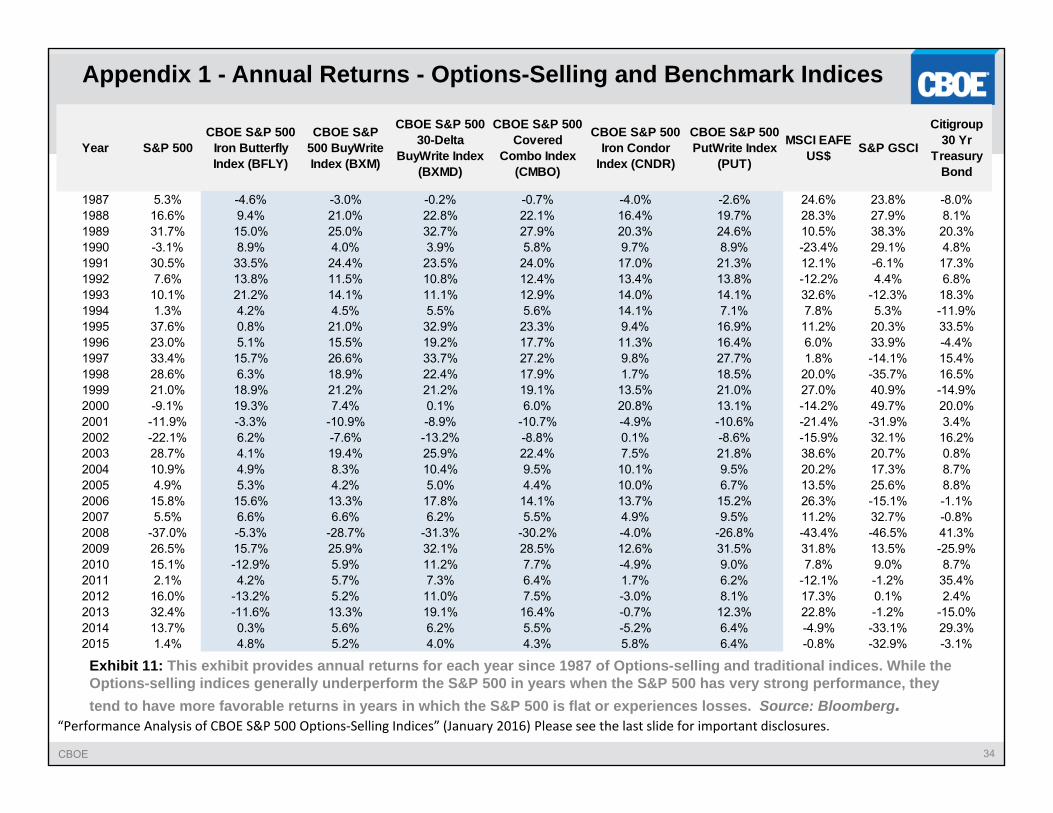
Exhibit 11: This exhibit provides annual returns for each year since 1987 of Options-selling and traditional indices. While the Options-selling indices generally underperform the S&P 500 in years when the S&P 500 has very strong performance, they tend to have more favorable returns in years in which the S&P 500 is flat or experiences losses. Source: Bloomberg.
Appendix 1 - Annual Returns - Options-Selling and Benchmark Indices
Year S&P 500CBOE S&P 500
Iron Butterfly Index (BFLY)
CBOE S&P 500 BuyWrite Index (BXM)
CBOE S&P 500 30-Delta
BuyWrite Index (BXMD)
CBOE S&P 500 Covered
Combo Index (CMBO)
CBOE S&P 500 Iron Condor
Index (CNDR)
CBOE S&P 500 PutWrite Index
(PUT)
MSCI EAFE US$ S&P GSCI
Citigroup 30 Yr
Treasury Bond
1987 5.3% -4.6% -3.0% -0.2% -0.7% -4.0% -2.6% 24.6% 23.8% -8.0%1988 16.6% 9.4% 21.0% 22.8% 22.1% 16.4% 19.7% 28.3% 27.9% 8.1%1989 31.7% 15.0% 25.0% 32.7% 27.9% 20.3% 24.6% 10.5% 38.3% 20.3%1990 -3.1% 8.9% 4.0% 3.9% 5.8% 9.7% 8.9% -23.4% 29.1% 4.8%1991 30.5% 33.5% 24.4% 23.5% 24.0% 17.0% 21.3% 12.1% -6.1% 17.3%1992 7.6% 13.8% 11.5% 10.8% 12.4% 13.4% 13.8% -12.2% 4.4% 6.8%1993 10.1% 21.2% 14.1% 11.1% 12.9% 14.0% 14.1% 32.6% -12.3% 18.3%1994 1.3% 4.2% 4.5% 5.5% 5.6% 14.1% 7.1% 7.8% 5.3% -11.9%1995 37.6% 0.8% 21.0% 32.9% 23.3% 9.4% 16.9% 11.2% 20.3% 33.5%1996 23.0% 5.1% 15.5% 19.2% 17.7% 11.3% 16.4% 6.0% 33.9% -4.4%1997 33.4% 15.7% 26.6% 33.7% 27.2% 9.8% 27.7% 1.8% -14.1% 15.4%1998 28.6% 6.3% 18.9% 22.4% 17.9% 1.7% 18.5% 20.0% -35.7% 16.5%1999 21.0% 18.9% 21.2% 21.2% 19.1% 13.5% 21.0% 27.0% 40.9% -14.9%2000 -9.1% 19.3% 7.4% 0.1% 6.0% 20.8% 13.1% -14.2% 49.7% 20.0%2001 -11.9% -3.3% -10.9% -8.9% -10.7% -4.9% -10.6% -21.4% -31.9% 3.4%2002 -22.1% 6.2% -7.6% -13.2% -8.8% 0.1% -8.6% -15.9% 32.1% 16.2%2003 28.7% 4.1% 19.4% 25.9% 22.4% 7.5% 21.8% 38.6% 20.7% 0.8%2004 10.9% 4.9% 8.3% 10.4% 9.5% 10.1% 9.5% 20.2% 17.3% 8.7%2005 4.9% 5.3% 4.2% 5.0% 4.4% 10.0% 6.7% 13.5% 25.6% 8.8%2006 15.8% 15.6% 13.3% 17.8% 14.1% 13.7% 15.2% 26.3% -15.1% -1.1%2007 5.5% 6.6% 6.6% 6.2% 5.5% 4.9% 9.5% 11.2% 32.7% -0.8%2008 -37.0% -5.3% -28.7% -31.3% -30.2% -4.0% -26.8% -43.4% -46.5% 41.3%2009 26.5% 15.7% 25.9% 32.1% 28.5% 12.6% 31.5% 31.8% 13.5% -25.9%2010 15.1% -12.9% 5.9% 11.2% 7.7% -4.9% 9.0% 7.8% 9.0% 8.7%2011 2.1% 4.2% 5.7% 7.3% 6.4% 1.7% 6.2% -12.1% -1.2% 35.4%2012 16.0% -13.2% 5.2% 11.0% 7.5% -3.0% 8.1% 17.3% 0.1% 2.4%2013 32.4% -11.6% 13.3% 19.1% 16.4% -0.7% 12.3% 22.8% -1.2% -15.0%2014 13.7% 0.3% 5.6% 6.2% 5.5% -5.2% 6.4% -4.9% -33.1% 29.3%2015 1.4% 4.8% 5.2% 4.0% 4.3% 5.8% 6.4% -0.8% -32.9% -3.1%
CBOE 35
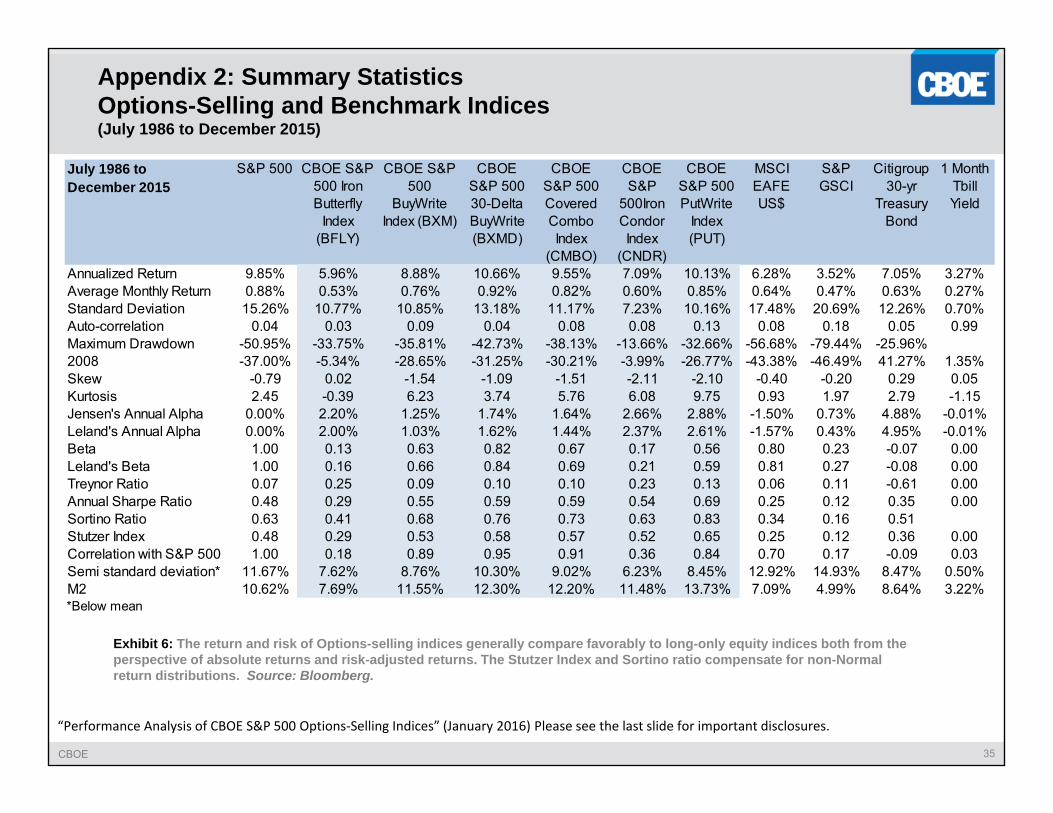
Exhibit 6: The return and risk of Options-selling indices generally compare favorably to long-only equity indices both from the perspective of absolute returns and risk-adjusted returns. The Stutzer Index and Sortino ratio compensate for non-Normal return distributions. Source: Bloomberg.
Appendix 2: Summary StatisticsOptions-Selling and Benchmark Indices (July 1986 to December 2015)
“Performance Analysis of CBOE S&P 500 Options‐Selling Indices” (January 2016) Please see the last slide for important disclosures.
July 1986 to December 2015
S&P 500 CBOE S&P 500 Iron Butterfly
Index (BFLY)
CBOE S&P 500
BuyWrite Index (BXM)
CBOE S&P 500 30-Delta BuyWrite (BXMD)
CBOE S&P 500 Covered Combo Index
(CMBO)
CBOE S&P
500Iron Condor Index
(CNDR)
CBOE S&P 500 PutWrite
Index (PUT)
MSCI EAFE US$
S&P GSCI
Citigroup 30-yr
Treasury Bond
1 Month Tbill Yield
Annualized Return 9.85% 5.96% 8.88% 10.66% 9.55% 7.09% 10.13% 6.28% 3.52% 7.05% 3.27%Average Monthly Return 0.88% 0.53% 0.76% 0.92% 0.82% 0.60% 0.85% 0.64% 0.47% 0.63% 0.27%Standard Deviation 15.26% 10.77% 10.85% 13.18% 11.17% 7.23% 10.16% 17.48% 20.69% 12.26% 0.70%Auto-correlation 0.04 0.03 0.09 0.04 0.08 0.08 0.13 0.08 0.18 0.05 0.99Maximum Drawdown -50.95% -33.75% -35.81% -42.73% -38.13% -13.66% -32.66% -56.68% -79.44% -25.96%2008 -37.00% -5.34% -28.65% -31.25% -30.21% -3.99% -26.77% -43.38% -46.49% 41.27% 1.35%Skew -0.79 0.02 -1.54 -1.09 -1.51 -2.11 -2.10 -0.40 -0.20 0.29 0.05Kurtosis 2.45 -0.39 6.23 3.74 5.76 6.08 9.75 0.93 1.97 2.79 -1.15Jensen's Annual Alpha 0.00% 2.20% 1.25% 1.74% 1.64% 2.66% 2.88% -1.50% 0.73% 4.88% -0.01%Leland's Annual Alpha 0.00% 2.00% 1.03% 1.62% 1.44% 2.37% 2.61% -1.57% 0.43% 4.95% -0.01%Beta 1.00 0.13 0.63 0.82 0.67 0.17 0.56 0.80 0.23 -0.07 0.00Leland's Beta 1.00 0.16 0.66 0.84 0.69 0.21 0.59 0.81 0.27 -0.08 0.00Treynor Ratio 0.07 0.25 0.09 0.10 0.10 0.23 0.13 0.06 0.11 -0.61 0.00Annual Sharpe Ratio 0.48 0.29 0.55 0.59 0.59 0.54 0.69 0.25 0.12 0.35 0.00Sortino Ratio 0.63 0.41 0.68 0.76 0.73 0.63 0.83 0.34 0.16 0.51Stutzer Index 0.48 0.29 0.53 0.58 0.57 0.52 0.65 0.25 0.12 0.36 0.00Correlation with S&P 500 1.00 0.18 0.89 0.95 0.91 0.36 0.84 0.70 0.17 -0.09 0.03Semi standard deviation* 11.67% 7.62% 8.76% 10.30% 9.02% 6.23% 8.45% 12.92% 14.93% 8.47% 0.50%M2 10.62% 7.69% 11.55% 12.30% 12.20% 11.48% 13.73% 7.09% 4.99% 8.64% 3.22%*Below mean
CBOE 36
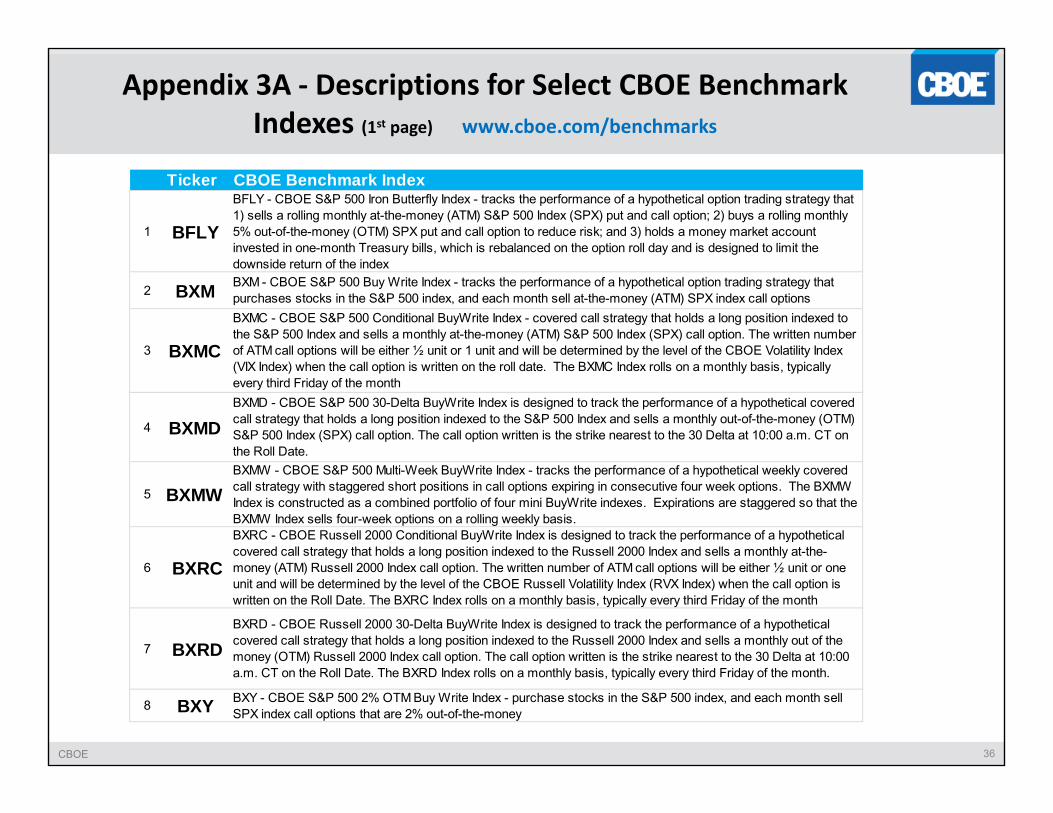
Appendix 3A ‐ Descriptions for Select CBOE Benchmark Indexes (1st page) www.cboe.com/benchmarks
Ticker CBOE Benchmark Index
1 BFLY
BFLY - CBOE S&P 500 Iron Butterfly Index - tracks the performance of a hypothetical option trading strategy that 1) sells a rolling monthly at-the-money (ATM) S&P 500 Index (SPX) put and call option; 2) buys a rolling monthly 5% out-of-the-money (OTM) SPX put and call option to reduce risk; and 3) holds a money market account invested in one-month Treasury bills, which is rebalanced on the option roll day and is designed to limit the downside return of the index
2 BXM BXM - CBOE S&P 500 Buy Write Index - tracks the performance of a hypothetical option trading strategy that purchases stocks in the S&P 500 index, and each month sell at-the-money (ATM) SPX index call options
3 BXMC
BXMC - CBOE S&P 500 Conditional BuyWrite Index - covered call strategy that holds a long position indexed to the S&P 500 Index and sells a monthly at-the-money (ATM) S&P 500 Index (SPX) call option. The written number of ATM call options will be either ½ unit or 1 unit and will be determined by the level of the CBOE Volatility Index (VIX Index) when the call option is written on the roll date. The BXMC Index rolls on a monthly basis, typically every third Friday of the month
4 BXMD BXMD - CBOE S&P 500 30-Delta BuyWrite Index is designed to track the performance of a hypothetical covered call strategy that holds a long position indexed to the S&P 500 Index and sells a monthly out-of-the-money (OTM) S&P 500 Index (SPX) call option. The call option written is the strike nearest to the 30 Delta at 10:00 a.m. CT on the Roll Date.
5 BXMW BXMW - CBOE S&P 500 Multi-Week BuyWrite Index - tracks the performance of a hypothetical weekly covered call strategy with staggered short positions in call options expiring in consecutive four week options. The BXMW Index is constructed as a combined portfolio of four mini BuyWrite indexes. Expirations are staggered so that the BXMW Index sells four-week options on a rolling weekly basis.
6 BXRC
BXRC - CBOE Russell 2000 Conditional BuyWrite Index is designed to track the performance of a hypothetical covered call strategy that holds a long position indexed to the Russell 2000 Index and sells a monthly at-the-money (ATM) Russell 2000 Index call option. The written number of ATM call options will be either ½ unit or one unit and will be determined by the level of the CBOE Russell Volatility Index (RVX Index) when the call option is written on the Roll Date. The BXRC Index rolls on a monthly basis, typically every third Friday of the month
7 BXRDBXRD - CBOE Russell 2000 30-Delta BuyWrite Index is designed to track the performance of a hypothetical covered call strategy that holds a long position indexed to the Russell 2000 Index and sells a monthly out of the money (OTM) Russell 2000 Index call option. The call option written is the strike nearest to the 30 Delta at 10:00 a.m. CT on the Roll Date. The BXRD Index rolls on a monthly basis, typically every third Friday of the month.
8 BXY BXY - CBOE S&P 500 2% OTM Buy Write Index - purchase stocks in the S&P 500 index, and each month sell SPX index call options that are 2% out-of-the-money
CBOE 37
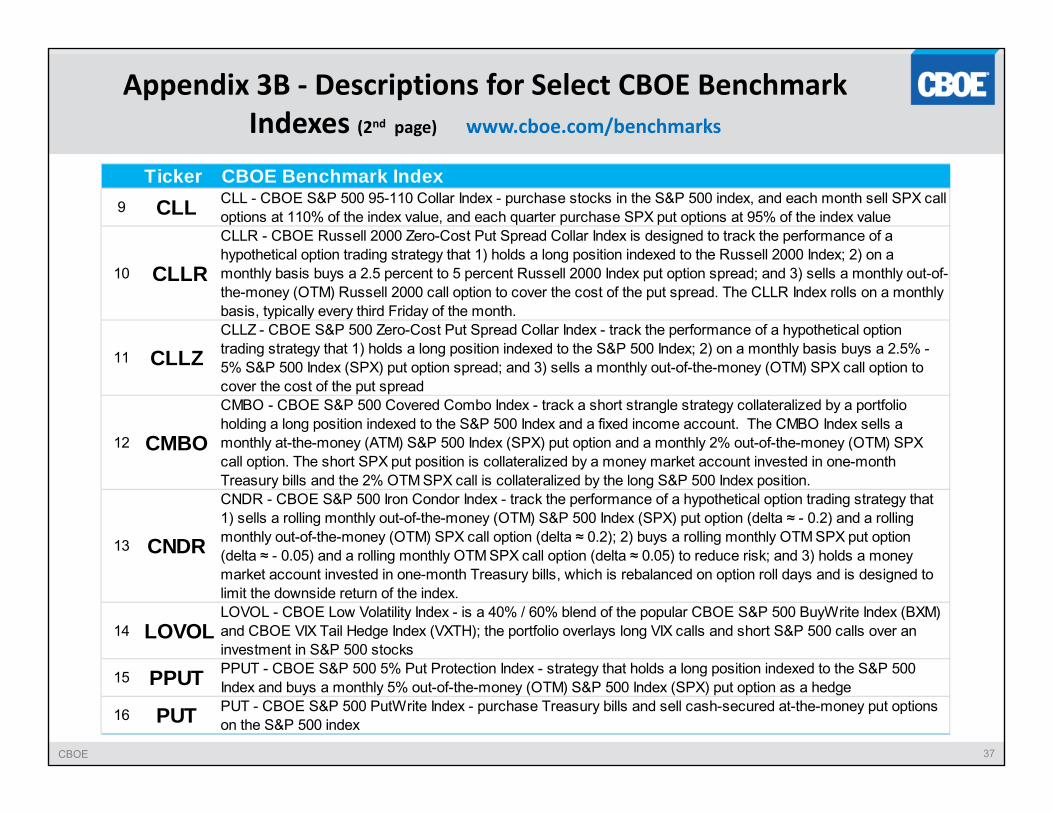
Appendix 3B ‐ Descriptions for Select CBOE Benchmark Indexes (2nd page) www.cboe.com/benchmarks
Ticker CBOE Benchmark Index9 CLL CLL - CBOE S&P 500 95-110 Collar Index - purchase stocks in the S&P 500 index, and each month sell SPX call
options at 110% of the index value, and each quarter purchase SPX put options at 95% of the index value
10 CLLR
CLLR - CBOE Russell 2000 Zero-Cost Put Spread Collar Index is designed to track the performance of a hypothetical option trading strategy that 1) holds a long position indexed to the Russell 2000 Index; 2) on a monthly basis buys a 2.5 percent to 5 percent Russell 2000 Index put option spread; and 3) sells a monthly out-of-the-money (OTM) Russell 2000 call option to cover the cost of the put spread. The CLLR Index rolls on a monthly basis, typically every third Friday of the month.
11 CLLZ CLLZ - CBOE S&P 500 Zero-Cost Put Spread Collar Index - track the performance of a hypothetical option trading strategy that 1) holds a long position indexed to the S&P 500 Index; 2) on a monthly basis buys a 2.5% - 5% S&P 500 Index (SPX) put option spread; and 3) sells a monthly out-of-the-money (OTM) SPX call option to cover the cost of the put spread
12 CMBO
CMBO - CBOE S&P 500 Covered Combo Index - track a short strangle strategy collateralized by a portfolio holding a long position indexed to the S&P 500 Index and a fixed income account. The CMBO Index sells a monthly at-the-money (ATM) S&P 500 Index (SPX) put option and a monthly 2% out-of-the-money (OTM) SPX call option. The short SPX put position is collateralized by a money market account invested in one-month Treasury bills and the 2% OTM SPX call is collateralized by the long S&P 500 Index position.
13 CNDR
CNDR - CBOE S&P 500 Iron Condor Index - track the performance of a hypothetical option trading strategy that 1) sells a rolling monthly out-of-the-money (OTM) S&P 500 Index (SPX) put option (delta ≈ - 0.2) and a rolling monthly out-of-the-money (OTM) SPX call option (delta ≈ 0.2); 2) buys a rolling monthly OTM SPX put option (delta ≈ - 0.05) and a rolling monthly OTM SPX call option (delta ≈ 0.05) to reduce risk; and 3) holds a money market account invested in one-month Treasury bills, which is rebalanced on option roll days and is designed to limit the downside return of the index.
14 LOVOLLOVOL - CBOE Low Volatility Index - is a 40% / 60% blend of the popular CBOE S&P 500 BuyWrite Index (BXM) and CBOE VIX Tail Hedge Index (VXTH); the portfolio overlays long VIX calls and short S&P 500 calls over an investment in S&P 500 stocks
15 PPUT PPUT - CBOE S&P 500 5% Put Protection Index - strategy that holds a long position indexed to the S&P 500 Index and buys a monthly 5% out-of-the-money (OTM) S&P 500 Index (SPX) put option as a hedge
16 PUT PUT - CBOE S&P 500 PutWrite Index - purchase Treasury bills and sell cash-secured at-the-money put options on the S&P 500 index
CBOE 38
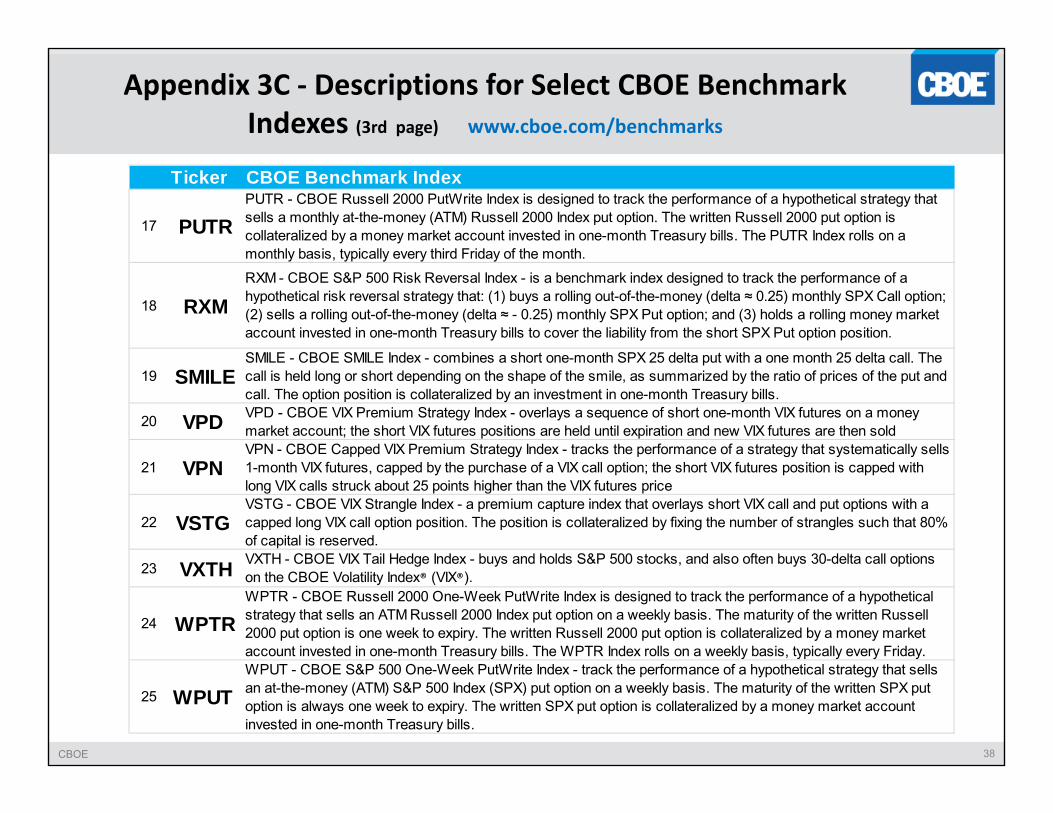
Appendix 3C ‐ Descriptions for Select CBOE Benchmark Indexes (3rd page) www.cboe.com/benchmarks
Ticker CBOE Benchmark Index
17 PUTRPUTR - CBOE Russell 2000 PutWrite Index is designed to track the performance of a hypothetical strategy that sells a monthly at-the-money (ATM) Russell 2000 Index put option. The written Russell 2000 put option is collateralized by a money market account invested in one-month Treasury bills. The PUTR Index rolls on a monthly basis, typically every third Friday of the month.
18 RXMRXM - CBOE S&P 500 Risk Reversal Index - is a benchmark index designed to track the performance of a hypothetical risk reversal strategy that: (1) buys a rolling out-of-the-money (delta ≈ 0.25) monthly SPX Call option; (2) sells a rolling out-of-the-money (delta ≈ - 0.25) monthly SPX Put option; and (3) holds a rolling money market account invested in one-month Treasury bills to cover the liability from the short SPX Put option position.
19 SMILESMILE - CBOE SMILE Index - combines a short one-month SPX 25 delta put with a one month 25 delta call. The call is held long or short depending on the shape of the smile, as summarized by the ratio of prices of the put and call. The option position is collateralized by an investment in one-month Treasury bills.
20 VPD VPD - CBOE VIX Premium Strategy Index - overlays a sequence of short one-month VIX futures on a money market account; the short VIX futures positions are held until expiration and new VIX futures are then sold
21 VPN VPN - CBOE Capped VIX Premium Strategy Index - tracks the performance of a strategy that systematically sells 1-month VIX futures, capped by the purchase of a VIX call option; the short VIX futures position is capped with long VIX calls struck about 25 points higher than the VIX futures price
22 VSTG VSTG - CBOE VIX Strangle Index - a premium capture index that overlays short VIX call and put options with a capped long VIX call option position. The position is collateralized by fixing the number of strangles such that 80% of capital is reserved.
23 VXTH VXTH - CBOE VIX Tail Hedge Index - buys and holds S&P 500 stocks, and also often buys 30-delta call options on the CBOE Volatility Index® (VIX®).
24 WPTRWPTR - CBOE Russell 2000 One-Week PutWrite Index is designed to track the performance of a hypothetical strategy that sells an ATM Russell 2000 Index put option on a weekly basis. The maturity of the written Russell 2000 put option is one week to expiry. The written Russell 2000 put option is collateralized by a money market account invested in one-month Treasury bills. The WPTR Index rolls on a weekly basis, typically every Friday.
25 WPUT WPUT - CBOE S&P 500 One-Week PutWrite Index - track the performance of a hypothetical strategy that sells an at-the-money (ATM) S&P 500 Index (SPX) put option on a weekly basis. The maturity of the written SPX put option is always one week to expiry. The written SPX put option is collateralized by a money market account invested in one-month Treasury bills.
CBOE 39
Benchmark indexes and Consultants’ Papers at www.cboe.com/benchmarks
Disclosures. Chicago Board Options Exchange® (CBOE®) provided financial support for the research for the papers by Wilshire, FEG and Oleg Bondarenko . Options involve risk and are not suitable for all investors. Prior to buying or selling an option, a person must receive a copy of Characteristics and Risks of Standardized Options. Copies are available from your broker or from The Options Clearing Corporation at www.theocc.com. The information in this presentation is provided for general education and information purposes only. No statement within this presentation should be construed as a recommendation to buy or sell a security or to provide investment advice. The CBOE strategy benchmark indexes (the “Indexes”) are designed to represent proposed hypothetical options strategies. The actual performance of investment vehicles such as mutual funds or managed accounts can have significant differences from the performance of the Indexes. Investors attempting to replicate the Indexes should discuss with their advisors possible timing and liquidity issues. Like many passive benchmarks, the Indexes do not take into account significant factors such as transaction costs and taxes. Transaction costs and taxes for strategies such as the Indexes could be significantly higher than transaction costs for a passive strategy of buying-and-holding stocks. Investors should consult their tax advisor as to how taxes affect the outcome of contemplated options transactions. Past performance does not guarantee future results. This presentation contains index performance data based on back-testing, i.e., calculations of how the index might have performed prior to launch. Back-tested performance information is purely hypothetical and is provided in this presentation solely for informational purposes. Back-tested performance does not represent actual performance and should not be interpreted as an indication of actual performance. No representation is being made that any investment will or is likely to achieve a performance record similar to that shown. It is not possible to invest directly in an index. CBOE calculates and disseminates the Indexes. The methodologies of the Indexes are the property of Chicago Board Options Exchange, Incorporated (CBOE). CBOE®, Chicago Board Options Exchange®, CBOE Volatility Index® and VIX® are registered U.S. trademarks and BXM, BXD, BXMC, BXMD, BXMW, BXN, BXR, BXRC, BXRD, BXY, CLL, CLLR, CLLZ, PUT, PUTR, WPUT, WPTR, CMBO, BFLY, CNDR, RXM, SMILE, PPUT, VPD, VPN, VXTH, LOVOL, VSTG, SPRO, SPEN, BuyWrite, and PutWrite are service marks of CBOE. S&P® and S&P 500® are registered trademarks of Standard and Poor's Financial Services, LLC and are licensed for use by CBOE. Financial products based on S&P indices are not sponsored, endorsed, sold or promoted by Standard & Poor’s, and Standard & Poor’s makes no representation regarding the advisability of investing in such products. Russell®, Russell 1000® an Russell 2000® are registered trademarks of the Frank Russell Company, used under license. MSCI, and the MSCI index names are service marks of MSCI Inc. or its affiliates and have been licensed for use by CBOE. All other trademarks and service marks are the property of their respective owners. Your useof, and access to, this presentation is subject to the Terms and Conditions for Use of CBOE Websites located at http://www.cboe.com/common/termsconditions.aspx. Redistribution, reproduction and/or photocopying in whole or in part are prohibited without the written permission of CBOE. © CBOE 2016. All Rights Reserved.
More Information