Embed Size (px)
Citation preview

THE WORLD MEDICINES SITUATION 2011
OPTIONS FOR FINANCING AND OPTIMIZING MEDICINES IN
RESOURCE-POOR COUNTRIESPanos Kanavos
London School of Economics, London
Prithwiraj DasLondon School of Economics, London
Varatharajan DurairrajDepartment of Health Systems Financing, WHO, Geneva
Richard LaingDepartment of Essential Medicines and Pharmaceutical Policies, WHO, Geneva
Dele Olawale AbegundeDepartment of Essential Medicines and Pharmaceutical Policies, WHO, Geneva
GENEVA 2011

TheWorldMedicinesSituation2011
3rd Edition
This document has been produced with the financial assistance of the Department for Inter-national Development (DFID), UK, and the Government of the Netherlands. The views expressed herein are those of the authors and can therefore in no way be taken to reflect the official opinion of the Department for International Development (DFID), UK, or the Government of the Netherlands.
For additional information please contact [email protected]
© World Health Organization 2011
All rights reserved. Publications of the World Health Organization can be obtained from WHO Press, World Health Organization, 20 Avenue Appia, 1211 Geneva 27, Switzerland (tel.: +41 22 791 3264; fax: +41 22 791 4857; e-mail: [email protected]). Requests for permission to reproduce or translate WHO publications – whether for sale or for noncom-mercial distribution – should be addressed to WHO Press, at the above address (fax: +41 22 791 4806; e-mail: [email protected]).
The designations employed and the presentation of the material in this publication do not imply the expression of any opinion whatsoever on the part of the World Health Organiza-tion concerning the legal status of any country, territory, city or area or of its authorities, or concerning the delimitation of its frontiers or boundaries. Dotted lines on maps represent approximate border lines for which there may not yet be full agreement.
The mention of specific companies or of certain manufacturers’ products does not imply that they are endorsed or recommended by the World Health Organization in preference to others of a similar nature that are not mentioned. Errors and omissions excepted, the names of proprietary products are distinguished by initial capital letters.
All reasonable precautions have been taken by the World Health Organization to verify the information contained in this publication. However, the published material is being distributed without warranty of any kind, either expressed or implied. The responsibility for the interpretation and use of the material lies with the reader. In no event shall the World Health Organization be liable for damages arising from its use.
The named authors alone are responsible for the views expressed in this publication.

Options for �nancing and optimizing medicines in resource-poor countries
Panos Kanavos, Prithwiraj Das , Varatharajan Durairaj , Richard Laing and Dele Olawale Abegunde
World Health Report (2010)Background Paper, 34
The path to universal coverageHEALTH SYSTEMS FINANCING

© World Health Organization, 2010 All rights reserved. The designations employed and the presentation of the material in this publication do not imply the expression of any opinion whatsoever on the part of the World Health Organization concerning the legal status of any country, territory, city or area or of its authorities, or concerning the delimitation of its frontiers or boundaries. Dotted lines on maps represent approximate border lines for which there may not yet be full agreement. The mention of specific companies or of certain manufacturers' products does not imply that they are endorsed or recommended by the World Health Organization in preference to others of a similar nature that are not mentioned. Errors and omissions excepted, the names of proprietary products are distinguished by initial capital letters. All reasonable precautions have been taken by the World Health Organization to verify the information contained in this publication. However, the published material is being distributed without warranty of any kind, either expressed or implied. The responsibility for the interpretation and use of the material lies with the reader. In no event shall the World Health Organization be liable for damages arising from its use. The findings, interpretations and conclusions expressed in this paper are entirely those of the author and should not be attributed in any manner whatsoever to the World Health Organization.

2
Options for financing and optimizing medicines in resource-poor countries
World Health Report (2010) Background Paper, No 34
Panos Kanavos1, Prithwiraj Das1, Varatharajan Durairaj2, Richard Laing3 and Dele Olawale Abegunde3
1 London School of Economics, London, The United Kingdom 2 Department of Health Systems Financing, World Health Organization, Geneva, Switzerland 3 Department of Essential Medicines and Pharmaceutical Policies, World Health Organization, Geneva, Switzerland

3
Acknowledgements
The authors are grateful to Priyanka Kanth-Devarakonda and Willemien Schurer for excellent research assistance. The paper has benefited significantly from comments by Guy Carrin. We are grateful for their contribution.

4
Abbreviations used
ACAME African Association of Central Medical Stores for Generic Essential Drugs
CDS Community Drug Scheme CEE Central and Eastern Europe CIF Cost, Insurance, Freight CMS Cooperative Medical System (China) DLO Supplementary Pharmaceutical Provision (Russian
Federation) ECCB Eastern Caribbean Central Bank ECDS Eastern Caribbean Drug Service EFPIA European Federation of Pharmaceutical Industry
Associations Ex-M Ex Manufacturer’s (Price) FFOMI Federal Fund of Obligatory Medical Insurance (Russian
Federation) FOB Free on Board FSU Former Soviet Union G Generic GST General Sales Tax IB Innovator Brand IT Information Technology IRP International Reference Price JFDA Jordan Food and Drug Administration JNDF Jordanian National Drug Formulary JUH Jordan University Hospital LPI Local Price Inflator LPG Lowest Priced Generic MDG Millennium Development Goals MoH Ministry of Health MPR Median Price Ratio MPS Medicine Price Survey MSA Medical Savings Account MSH Management Sciences for Health MSP Maximum Selling Price M-U Mark-Up

5
NGO Non-Governmental Organization OB Originator Brand OECS Organization of Eastern Caribbean States OOPs Household out-of-pocket spending OTC Over the Counter PHI Private Health Insurance PPS Pharmaceutical Procurement Service RDF Revolving Drug Fund RMS Royal Medical Service (Jordan) SHI Social Health Insurance TAC Technical Advisory Committee TNMSC Tamil Nadu Medical Services Corporation UNICEF United Nations (International) Children’s (Emergency) Fund US$ United States dollar WHO World Health Organization VAT Value Added Tax

6
Executive summary
Globally, there are significant inequalities in access to medicines, particularly in resource-poor countries. The available literature suggests that these inequalities are mainly due to inadequate public spending, a lack of or adequate health insurance coverage, poor availability of essential medicines, poor affordability and high household out-of-pocket expenditure. Ranked among the top two items in household health care budgets, medicines account for a significant proportion of personal or household income as much of the financing of medicines in the developing world is characterized by household out-of-pocket payments. As health insurance and savings are only available to a small proportion of developing world populations, there is a high likelihood of households entering the debt and poverty cycle. Additional financial burden on the households is imposed by price inflators and fragmented and ineffective procurement systems. Medicines in the private sector are significantly higher priced and more dominated with originator brand drugs.
Although prepayment and risk pooling could protect poor households from facing catastrophic spending in health, many resource-poor countries lack appropriate mechanisms to pool financial risks, even with rising income. However, successful models, many of them at the sub-national or sub-sector level, do exist in some countries, which could be scaled up or replicated. This paper discusses various options for resource-poor countries to enhance access to, and minimize household out-of-pocket spending, on medicines. Specific options discussed in this paper are
• Taxation • Social health insurance • Private health insurance • Community financing • Drug sales and revolving funds • Medical savings accounts
Some positive medicine financing experiences have come from East Caribbean states, India, the Russian Federation, Sudan, and Viet Nam. On the other hand, less successful experiences are reported from Lao PDR, Nigeria, and Uganda. Mixed results have emerged from Bangladesh and Jordan. Of course, many options practiced in different countries are not strictly comparable because their objectives and targets and, therefore, their achievements are quite different. However, some options may be relevant to particular settings in resource-poor countries and lessons can be learnt from them so as to develop appropriate medicine financing strategies.
Drawing lessons from various experiences, one could argue that successful financing of medicines is contingent upon a number of factors, as outlined below:
• Political commitment • Effective design and administrative capacity • Clear implementation strategies • Financial sustainability • Rational selection and rational drug use • Affordable prices • Reliable medicine supply systems and low taxes

7
Introduction
Target 17 of the eighth goal of the MDGs seeks to provide access to affordable essential medicines in developing countries in cooperation with pharmaceutical companies,1 and is measured with indicator 46 as the proportion of population with such access on a sustainable basis.2-3 The available literature suggests that they are mainly inequalities in access to medicines due to inadequate public spending, a lack of or adequate health insurance coverage, poor availability of essential drugs, poor affordability and high household out-of-pocket expenditure, partly due to significantly higher priced and more dominated with originator brand drugs in the private sector. Moreover, many resource-poor countries lack appropriate mechanisms to protect the poor and pool financial risks. This paper discusses various options for resource-poor countries to enhance access to medicines and minimize household out-of-pocket spending on medicines. Some of the suggested options are already in practice in some low-income countries while others emerged from the experience in high- and middle-income countries.
The paper has four broad sections. Section-1 discusses the challenges to medicines’ financing in developing countries and highlights some of the bottlenecks in medicines availability, affordability, and the lack of good regulation and planning. The following section analyses different options for financing medicines and their merits and demerits. Section-3 brings out some examples of successful execution of the listed financing options. Section-4 provides an analytical framework for financing to attain universal coverage of medicines.

8
1 Medicine financing: Challenges in resource-poor countries
There are significant inequalities in the distribution of prescription medicines consumption and expenditure from a global perspective. Whereas high-income countries account for 80.3% of global pharmaceutical spending, upper middle-income countries, lower middle-income and low-income countries account for 9.9%, 9.3% and 0.5%, respectively.4 When considering the population distribution, expenditures on medicines become even more unequal. Table-1 demonstrates this by examining expenditure on medicines by (WHO) region and income group. The high-income group has an average per capita spend of US$ 438, whereas the low-income group has a US$ 7 per capita. At the same time, the Southeast Asian region (SEARO) has 31.2% of the global population but only 3% of total medicines spending, while Europe and the Americas with 14.6% and 16.4% of the world’s population account for 33.7% and 43.3% of total medicine spending respectively.
Table-1
Total medicine spending by region and income, 2005-06
Countries Population Total expenditure Country
group Number % Number ('000) % Million
US$ %
Per capita (US$)
By WHO Region AFRO 19 41.3 310,156 5.7 4,466 0.5 21AMRO 35 100.0 890,669 16.4 356,005 43.3 116EMRO 4 20.0 26,941 0.5 1,512 0.2 97EURO 46 86.8 793,314 14.6 277,540 33.7 340SEARO 9 81.8 1,696,228 31.2 25,064 3.0 16WPRO 17 63.0 1,718,390 31.6 158,216 19.2 131
BY World Bank Income Group High 43 89.6 983,493 18.0 660,609 80.3 438Upper-middle 35 83.3 782,194 14.4 81,235 9.9 82Low-middle 33 61.1 3,106,247 57.0 76,857 9.3 31Low 19 38.8 577,565 10.6 4,123 0.5 7
Source: Adapted from Lu et al, 2010.4
Whereas expenditure on medicines ranges between 7% and 30% of total health care expenditure (both public and private) in developed and transition economies, it ranges between 25% and 65% of total health expenditures in the developing world.5-6 Many developing countries' reported spending on medicines and human resources rank among the top two items in their health care budgets.
Surveys in Kenya suggest that almost half of respondents reported problems paying for their last illness, 66% were prevented from using health care due to costs, 71% had no ready cash for health care, 27% did not receive drugs due to lack of funds and 31% bought less drugs due to lack of funds.7-10 Sources of money for health care include delaying payment (5%), payment in kind (2%),

9
borrowing from friends (31-45%), selling produce (6-9%), selling belongings (2-15%), savings (4%), gifts (2-3%) or by not seeking care (3-9%).
In Guinea, 25% could not access health care due to costs, 57% had no ready cash for health care, 7% did not receive drugs due to lack of funds and 15% bought less drugs due to lack of funds.10-11 Sources of money for health care include getting exempted (1%), delaying payment (18%), paying in kind (2%), borrowing from friends (25%), borrowing from money lenders (2%), selling produce (20%), selling belongings (2%), savings (12%), gifts (11%) or by not seeking care (3%). Informal payments are frequently requested from care providers, and are often far greater than the official out-of-pocket (OOP) expenditures.
Similarly in Burundi, 12% could not use health care due to costs and 28% had no ready cash for health care.10 Sources of money for health care include borrowing from friends (35%), selling produce (18%), selling belongings (22%), or gifts (16%). Significant shortages were also reported for pharmaceuticals.
1.1 Out-of-pocket spending (OOP)
Much of the financing of medicines in the developing world is characterized by household out-of-pocket (OOP) payments.12-15 As health insurance and savings are only available to a small proportion of developing world populations, there is a high likelihood of households entering the debt and poverty cycle.16-19 Out-of-pocket spending is often proportional to the amount of care consumed and regressive, as usually it proportionately takes up large portions of lower income household budgets. Furthermore, there is no risk pooling or separation between risk of illness from financial risk.
In a large number of developing countries, up to 90% of the population purchase medicines on an out-of-pocket basis;13,20-21 In other words, medicines account for a significant proportion of personal or household income.21-23 This is in sharp contrast to most developed countries, where OOPs for prescription medicines are a small proportion of total spending on medicines, due to health insurance coverage, as Figure-1 suggests. In the UK, for instance, the effective co-payment4 is 6%, whereas in France and Spain it is 3.6% and 7.8% respectively (Figure-1). In all these countries, there are extensive exemptions from co-payments, based on disease type, age and income, where applicable. Most chronic diseases are either fully covered by health insurance (if they are deemed life threatening), or subject to a (very) modest co-payment.
In the developing world, observed OOPs are higher in outpatient and chronic care. In Kenya, 69.4% of household health-related OOPs are expended on outpatient care.7-8 In India, these numbers are higher, notably, 83% in rural areas and 77% in urban areas.24 This is a phenomenon also observed in Pakistan,
4 Defined as total OOPs on prescription medicines over total expenditures on prescription medicines

10
where 98% of health care funding is private and means that most of the medicine requirements are covered by patients on an OOP basis.25 In Ghana, 25% of drug funding is generated through the OOP expenditure of patients on medicines and other health care facilities.26
Figure-1
Effective co-payment for prescription medicines in selected (European) countries with comprehensive health insurance coverage, 2006
Source: Authors' compilations from EFPIA, 2008.135
Further, indirect OOPs may be required for health care goods or services which cost above a set reimbursement rate.22-23 For instance, under referencing pricing5 for pharmaceuticals, the cost above the reference price is borne by the patient; similarly under balance billing patients pay for the difference between the reimbursement rate and the care provider’s fee.
1.1.1 The problem of informal payments
Informal OOPs exist in some (developing, transition as well as developed) countries in the public sector despite not being officially endorsed.27,28 These may range from ex-post gifts to ‘thank’ staff for care (for patients with chronic ailments, these may also have the nature of ex-ante payments) to large envelope payments given to the physician before treatment to secure their services. Informal payments are often a form of corruption undermining the official system and reducing equity of access particularly for vulnerable populations. As these
5 A mechanism, whereby health insurance pays (reimburses) up to a maximum for a product or a service and the patient pays the difference if the reimbursed product or service is not that of the consumer’s choice.

11
payments are covert, much of the ‘evidence’ is often anecdotal. These payments exist for several reasons:
Lack of financial resources in the public system
Without payment, patients cannot obtain basic supplies such as the drugs or bandages required for treatment. Staff relies on payments to supplement their small or non-existent public salaries.
Desire to exercise consumer leverage over providers
No third party is involved in the transaction, making the provider accountable to the patient. This seems to be important in southern Europe and may explain their lack of demand for private health insurance.
Cultural tradition
Southern European, Central and Eastern European (CEE) and former Soviet Union (FSU) countries have a long tradition of informal payments that has persisted despite attempts in some countries to curb it.
Lack of private services
The private sector is not fully developed, so patients with money have fewer options to obtain services elsewhere. In Western Europe, physicians may legally work across the public–private divide, shifting patients to their private practice. Treating patients for a ‘private’ payment in the public sector may arise where private practice does not exist.
Information on the extent and size of informal payments is often limited because they are covert and, in some countries, illegal. Furthermore, a lack of transparency means that accessing this revenue is difficult for publicly funded systems. In transitional countries the informal payments partially replace government funding to fund materials or finance salaries, in addition to providing extra services or better quality care.27 Unfortunately in some countries, it may be the only method of provider payment, allowing some form of health care provision to take place.
Although difficult to measure due to the nature of its activity, household surveys, corruption surveys and exit polling show large variations in informal payments (3% of patients in Peru to 96% in Pakistan).28 Regions with greater likelihood of informal payments, particularly for inpatient care, include South-East Asia (with the exception of Thailand), South Asia, Eastern Europe and regions of South America. Often these payments are necessary to receive care, even ‘free’ care, and to receive higher quality care. The impact on household budgets can be significant, ranging from 5% of average monthly per capita income to far over 100%, particularly for inpatient care.
In Bulgaria, there is a complexity and range of informal payments, from illicit under-the-counter to semi-official user fees, and from unethical ex ante to

12
gratuitous ex post gifts.29 Almost one quarter of survey respondents reported giving an informal payment for public care, primarily as gifts rather than cash. These payments were for pharmaceuticals, hospital stay, to physicians for examinations, operations (surgery and obstetrics), tests and certificates, and for nursing care. Average cash payments were 4.4% of monthly salary, but 21% of minimum monthly salary, while gifts were 1.5% and 7% respectively. Gifts are generally given after treatment, while cash is given either before or during treatment, or a combination thereof.
In Greece, OOPs accounted for approximately 40% of total health expenditure in 2004, of which 10% is considered informal. More than one-third of publicly treated patients report informal physician payments some of which are demanded by physicians for care.30,133 The primary reason for payment was to receive better quality care, although 20% of patients reported being asked to pay prior to surgery and the likelihood of making informal payments related to their surgery was twice that of non-surgery payments. The average inpatient payment for care was €535, while for gratuities €280. Informal payments are also given to nursing staff, on average €37, and are higher in private than public hospitals.
In Turkey, approximately 30% of total health expenditure is through OOPs, with a quarter classified as informal payments.31 Of these informal payments, 72% were cash payments and 27% in-kind payments. Overall, the majority of OOPs were directed to outpatient care; however, higher amounts per episode were directed to inpatient care for food, medicines and medical devices. The majority of public payments were for medicines and surgery services privately for medical services, reflecting competition within a private-public practice physician. Lowest income (indigent) patients insured by the state (Green Card citizens) made informal payments primarily for surgery (64%) and physician (80%) services, compared to uninsured for medicines (82%). Cultural factors were not seen as primary reasons for giving informal payments (i.e. gratitude).
1.1.2 Likely responses to a perennial problem
Response to informal payments is difficult. Increasing the level of resources allocated to health care may be easier said than done during difficult economic times. Raising wages and restructuring incentives may be implemented, along with increasing accountability with strong management and introducing community involvement, particularly in smaller communities.
Converting informal payments into formalized cost-sharing arrangements requires compliance from providers, who may lose substantial income (especially if income has to be declared for tax purposes) and public support. Securing these commitments is not an easy task. Experience from low-income countries suggests that whether such initiatives can be implemented in practice depends on the ability of government to regulate providers and their willingness to set priorities or limit the services on offer.
The ability to achieve improved efficiency and quality, without jeopardizing equity, is critically dependent on several policy measures. These encompass the skills and capacity of staff, the development of appropriate incentives and exemption

13
systems and suitable information systems to support the accounting and auditing of such payments.32 Informal payments do, however, represent an important source of revenue in countries in which prepayment systems have collapsed, and phasing them out without developing suitable alternatives would probably be altogether damaging.
1.1.3 Equity implications of OOPs
Evidence from several countries (including Myanmar, Nepal, Indonesia, Pakistan, several sub-Saharan African countries, and also some European countries) indicates a willingness to pursue provision of free/ low cost medicines to respective populations.12,18,20-21,25,33-38 Unfortunately, due to a lack of available resources or absence of adequate earmarked funding, frequently results are limited to poor medicines availability and accessibility, contributing to inequity and often leading to impoverishment. For members of the population still able to access and avail themselves health care services, the OOPs has lesser impact and these people are at lower risk of facing catastrophic spending.
Similar to developing countries, many transition economies face serious problems in drug financing since often federal/national budgets ignore the importance of funding essential medicines, leading to significant inequities. This is shown to be true in Georgia and Kazakhstan, and also in the Baltic countries.39
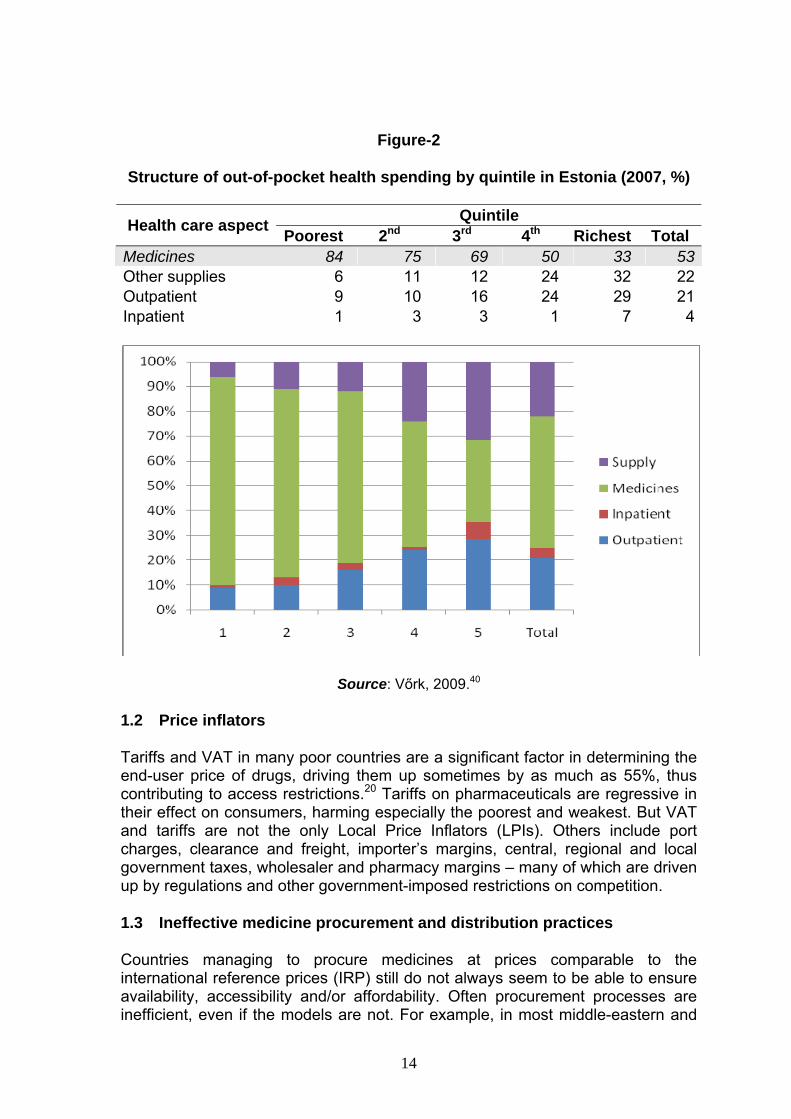
In Estonia, a recent study of income inequality in health care financing and utilization has raised significant equity concerns, likely to impact access to medicines.40 Not only do 53% of average OOP household expenditure relate to medicines, but there are concerns that different socio-economic groups are impacted differently. A disaggregation of these figures by quintile – each quintile including equal number of households – reveals significant differences across different income levels: medicines account for 33% of total out-of-pocket health expenditures for the wealthiest quintile, and 84% for the poorest quintile (Figure-2). The poorest quintile is also much more likely to be affected and, in fact, impoverished because of OOPs. The availability and affordability concerns surrounding medicines in this particular country context have also been confirmed by more recent evidence.134
Due to the scarcity of data available on OOP spending, specifically on medicines, it is difficult to evaluate the entire problem. However, a near universal finding in all studies is that a single catastrophic health incident pushes families, usually already in debt, further down the poverty line, consequently forcing them to sell belongings and assets, or incurring non repayable loans from informal or formal sector funders.12-19
Many countries, such as India, Mexico, Indonesia and Egypt, have special provisions in place for parts of the population, chiefly civil servants, enabling them and their families to access health care and medicines at subsidised rates. Although this ensures that part of the population’s needs is adequately met, it is often seen as unfair because similar provisions do not exist for other segments of the population. Further, such provisions contribute to inequity, as civil servants are not the poorest segment of society most in need of comprehensive coverage.
14
Figure-2
Structure of out-of-pocket health spending by quintile in Estonia (2007, %)
Quintile Health care aspect Poorest 2nd 3rd 4th Richest Total Medicines 84 75 69 50 33 53Other supplies 6 11 12 24 32 22Outpatient 9 10 16 24 29 21Inpatient 1 3 3 1 7 4
Source: Vőrk, 2009.40
1.2 Price inflators
Tariffs and VAT in many poor countries are a significant factor in determining the end-user price of drugs, driving them up sometimes by as much as 55%, thus contributing to access restrictions.20 Tariffs on pharmaceuticals are regressive in their effect on consumers, harming especially the poorest and weakest. But VAT and tariffs are not the only Local Price Inflators (LPIs). Others include port charges, clearance and freight, importer’s margins, central, regional and local government taxes, wholesaler and pharmacy margins – many of which are driven up by regulations and other government-imposed restrictions on competition.
1.3 Ineffective medicine procurement and distribution practices
Countries managing to procure medicines at prices comparable to the international reference prices (IRP) still do not always seem to be able to ensure availability, accessibility and/or affordability. Often procurement processes are inefficient, even if the models are not. For example, in most middle-eastern and

15
some Asian countries (e.g. Pakistan), public procurement rates seem to be reasonably low and affordable, however, this does not necessarily translate into low retail prices or high availability.25,41-47 Even if procurement practices and processes work reasonably well, the absence of insurance schemes or other social security results in high OOPs, often disproportionate to personal or family income.
In countries where procurement is functional in terms of quantity of medicines procured for the medical needs of given populations, bottlenecks in the distribution system impede access to medicines. In India and China, for example, procurement is carried out by various entities, including public sector hospitals, private sector retail pharmacies and some governmental bodies.48-53 The result is poor coordination in the procurement processes due to simultaneous procurement of similar drugs and, although it stimulates competition in procurement rates, it also results in widespread disparities observed in patient prices at different outlets.
Fragmentation in the procurement process for pharmaceuticals and lack of coordination capabilities often result in significant waste of resources.20 Many countries continue procurement of branded drugs, rather than cheaper generics, adding to the total health expenditure incurred. A significant pitfall is the lack of available data which hinders analysis of procurement models, and in turn affects the possibility of carrying out reforms.
1.3.1 Distribution practices
A well-run distribution system should maintain a constant supply of medicines, store them in good condition, minimize medicine losses due to spoilage and expiry, rationalize the storage points, use available transport efficiently, reduce theft and fraud, and provide information for forecasting medicine needs.132 The evidence on how distribution channels work in developing countries is fairly fragmented both in terms of country coverage and data comprehensiveness.54-61
The key points from the available evidence are summarized in Table-2. These disparities emanate from a variety of sources, including differences in importing and local production of medicines, national/regional tariffs and mark-ups, and a country’s ability to regulate the medicines distribution chain. The evidence points at certain trends in terms of the variability of mark-ups and margins applied to medicines between countries, within countries, between different drugs, and in different sectors.20
Often there are differential policies on certain drugs which may include mark-up exemption (in which case, the nature of the drugs is not specified), ineffective regulation, ineffective implementation of regulation, or a complete absence of regulation where mark-ups are applied at the discretion of the major players in the distribution chain, especially wholesalers and retailers. Some countries put a ceiling on the percentage of mark-ups allowed for wholesale and retail distribution, whereas others regulate import tariffs or their national taxes such as VAT and GST. While there is some information on distribution mark-ups and taxes, the evidence from the peer review literature and other sources is very

16
scarce on the broad legal framework relating to pharmacy operations and geographical distribution, among others.
Table-2
Key pitfalls in distribution systems for medicines in developing countries
1. Significant gaps in the evidence, which is not comprehensive for any country.
2. Very high mark-ups reflecting inefficient markets or an absence of regulation. Wholesale and retail mark-ups are the most significant components of final price.
3. Import tariffs are not the largest component of the final price while government taxes are major contributors.
4. Absence of price regulation monitoring or/and enforcement regarding margins.
5. No meaningful information emerging about organization of the distribution sector, both wholesale and retail (e.g. whether there are restrictions in the geographic allocation of pharmacies).
Source: The authors from the literature.
Information is also very scarce on the distribution of retail outlets within countries, in terms of rural and urban distribution, or demographic distribution. Similarly, evidence on how the wholesale sector operates and how market coverage is ensured is not available and only mentioned in a few studies in passing. The same also applies to the quality and efficiency of distribution, where little has been found or reported on the key components of the distribution chain including quality and efficiency of storage, transport and dispensary facilities. These gaps in the data have some serious human resource implications.
1.3.2 Taxation and distribution of medicines in developing countries
Tariffs and taxes are a significant factor in determining the end-user price of drugs in many developing countries and drive them up, sometimes by as much as 55%. Some countries put a ceiling on the percentage of mark-ups allowed for the wholesale and retail sectors, whereas others regulate import tariffs and others control their national taxes such as VAT and GST. There is some information on distribution mark-ups and taxes (see Table-3). Thailand is seen to have very high cumulative mark-ups that can go up to 2,000% in certain cases on the Maximum Selling Price (MSP); however, the accuracy of the data has been questioned. In comparison in the Philippines, cumulative mark-ups ranged much lower but similar problems have occurred in collecting data from primary sources for specific medicines. In China, public sector price components were collected in a drug-specific rather than general method and found that different medicines are

17
subjected to different taxes and exemptions, for example in Shandong53 and Shanghai52 provinces.
Table-3
Distribution margins and taxes in some low/middle-income countries
Country Value (% MSP or ex-M)
Stage/Purpose Comments
2,000 Cumulative Inaccurate estimation 20-285 Public mark-up (M-U): OB 28-41%, G
20-285%
37-900 Private cumulative M-U Extreme variability noted 0-31 Wholesale M-U: G 7-31%, OB <2%
Thailand
13-150 Pharmacy M-U: G (20-150%); OB (13-40%)
87-273 Cumulative M-U Sector not specified 3-5 National corporate taxes
Philippines
12 VAT 4 Duty tax on all imported medicines China
17 VAT Pharmacy medicines sans public
Pakistan 25 Cumulative M-U Ex-factory prices (locally produced generics)
10 - 30 Wholesale M-U: 10%; Retail M-U 30%
Regulated
7 VAT Regulated
Morocco
32-40 Custom charges 44-63 Cumulative M-U Sector unspecified 15-35 Wholesale M-U: G 25-35%, OB 15-
25%
Kyrgyzstan
5-25 Retail: G 15-25%, OB 5-15% Yemen 57 Cumulative M-U Sector non-specified Ghana 178-246 Cumulative M-U: public 178-246%,
private 27-388%, mission 67-186% Public sector
Nigeria 123 Cumulative M-U: 44% landing cost, 8% clearance fee, 12% inspection fee, 13% import margin; 23% each wholesale & retail margin
For imported medicines from the point of landing till dispensing
49 FOB 1-35 M-U: retail (35%); wholesale (1.3%) 11.9 Import fee
1.5 Clearing fee
Uganda
1.5 CIF
Originator Brand (OB); Generics (G); Mark-Up (M-U); Cost, Insurance and Freight (CIF); Free on Board (FOB); Ex-Manufacturer’s Price (ex-M); Maximum Selling Price (MSP).
Source: The authors from the literature.

18
In Pakistan, higher level regulation is noted in the supply chain under the Drug Act of 1976, which regulates the import, export, storage and distribution of medicines.25,62 Pakistan is reported to manufacture 95% on its national pharmaceutical needs locally, considerably reducing the amount of medicines that are imported. In Morocco, the law regulates wholesale mark-ups at 10% and retail mark-ups at 30%. A VAT of 7% is reported to be applied to certain drugs (although the selection criteria for these drugs are not mentioned). For imported drugs, customs duties are also applied, with different charges for drugs originating from different geographical regions. In Kyrgyzstan, mark-ups differ for generic and originator brand drugs, with higher mark-ups for the former and wholesalers compared to retailers.63 Yemen has fairly extensive data, including information on the distribution of pharmacies, and reports a public sector distribution warehouse and 225 pharmacies staffed with qualified pharmacists.43
In Ghana, the data reveals wide disparities between different sectors, different medicines in the same sector and different medicines in different sectors.26,64 In Nigeria, medicines were reported to cost at least 123% of the landing cost, which is the cost of imported medicines.65-68 In Uganda, data only covers the private sector with further information not available on public and mission sectors or cumulative mark-ups for generics.69
1.4 Price disparities
Public sector procurement prices are often found to be low and comparable to international reference prices (IRP). Nonetheless, in most cases low procurement prices do not translate into low patient prices, even in the public sector, and the savings or low costs are not passed on to patients, resulting in severe affordability problems.20 The prices of medicines in the mission and NGO sectors, where they still have to be purchased, are usually lower than the private sector yet higher than the public sector. On the other hand, medicines in the private sector are significantly higher priced and more dominated with originator brand drugs. Originator brands are priced significantly higher than generics. It has been demonstrated that countries with effective generic policies minimize on excess medicine spending.20
There are significant price disparities between different regions of a given country. The differences could be between different provinces or states, or between areas of different economic growth (rural and urban differences). Some regional disparities arise from decentralized procurement, by which means prices are different in different geographical regions, while socio-economic differences arise from a community’s power to pay a certain higher price. In India and China, prices differ across states, while in Africa differences are mostly between rural and urban areas;12 for instance in Tanzania, the urban public sector has drug prices 10% higher than the rural public sector. Similar evidence emerges from other African countries, such as Uganda, Kenya, Ghana and Nigeria. Prices may also fluctuate abruptly, as in Kenya where they fluctuate within a month up to 4 times the original price.12 These price variations make it extremely difficult to manage household budgets, especially for chronic diseases that necessitate continuous treatment.

19
Cameron et al (2009)20 found that the percent difference in price between originator brands (OB) and lowest-priced generics (LPGs) in the private sector was over 300% in lower-middle income and low-income countries, 152% in upper-middle income countries and 6% in India (see also the evidence from different settings presented in Table-4). In India, median price in the private sector was less than 2 times the IRP, with the exception of few innovator brands (IB).
Table-4
Private sector patient prices
Country Prices Comments India Median price < 2* IRP With the exception of OBs MPRs: 1.74-4.38 OB 1.3-1.69 MSGs 1.3-1.84 LPGs Jordan 17*IRP OB 11- 51* IRP For 50% of the surveyed
medicines 10.5 * IRP LPGs Pakistan 3.36* IRP OB 2.26* IRP LPG Yemen 2- 129* IRP OB 0.26-18* IRP LPGs Ghana 18*IRP OB 2.04-7* IRP For 50% of the LPGs
surveyed.
Note: Originator brands (OB), Medicine Price Survey (MPS), lowest price generic (LPG), International Reference Price (IRP), Median Price Ratio (MPR).
Source: The authors from the literature.
In middle-eastern countries, private sector prices are noted to be among the highest. In Jordan, patient prices for originator brand products were approximately 17 times higher than the IRP, with half of the medicines priced between 11 and 51 times, and LPGs priced 10.5 times higher than international reference prices.44 Originator brands are primarily found in the private sector with substantially greater costs.
In Pakistan, overall prices for originator brands were 3.36 times the IRP and the LPGs were 2.26 times the IRP.25 In Yemen, where prices are noted to be extremely high for innovator brands, whereas the median price ratios (MPRs) varied from around 2 to 129 times greater than IRP.43
In Ghana’s Private Retail Pharmacy sector, innovator brands were priced at more than 18 times the IRP, with half of them priced between 9.13 to 52.14 times the IRP. Generic prices were lower, with half of the LPGs ranging between 2.04 and 7.00 times the IRP. LPGs were also 65.9% more expensive in private retail pharmacies than in public sector pharmacies. The most exorbitant prices were
20
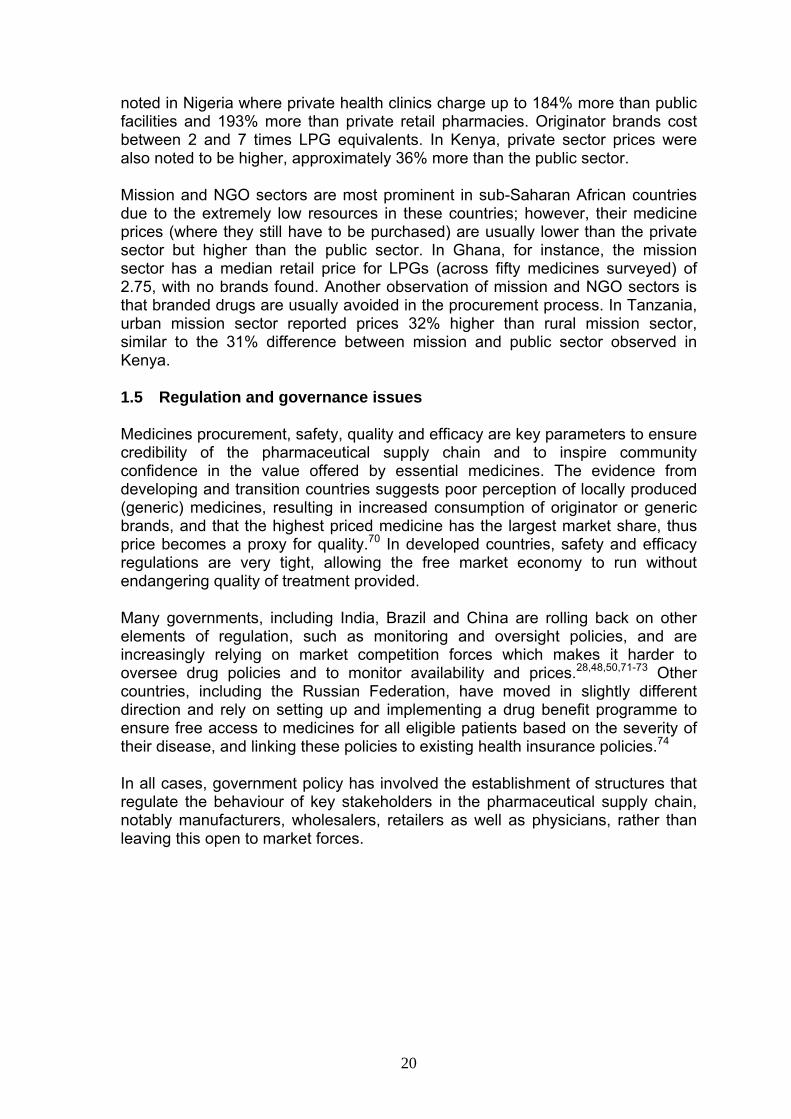
noted in Nigeria where private health clinics charge up to 184% more than public facilities and 193% more than private retail pharmacies. Originator brands cost between 2 and 7 times LPG equivalents. In Kenya, private sector prices were also noted to be higher, approximately 36% more than the public sector.
Mission and NGO sectors are most prominent in sub-Saharan African countries due to the extremely low resources in these countries; however, their medicine prices (where they still have to be purchased) are usually lower than the private sector but higher than the public sector. In Ghana, for instance, the mission sector has a median retail price for LPGs (across fifty medicines surveyed) of 2.75, with no brands found. Another observation of mission and NGO sectors is that branded drugs are usually avoided in the procurement process. In Tanzania, urban mission sector reported prices 32% higher than rural mission sector, similar to the 31% difference between mission and public sector observed in Kenya.
1.5 Regulation and governance issues
Medicines procurement, safety, quality and efficacy are key parameters to ensure credibility of the pharmaceutical supply chain and to inspire community confidence in the value offered by essential medicines. The evidence from developing and transition countries suggests poor perception of locally produced (generic) medicines, resulting in increased consumption of originator or generic brands, and that the highest priced medicine has the largest market share, thus price becomes a proxy for quality.70 In developed countries, safety and efficacy regulations are very tight, allowing the free market economy to run without endangering quality of treatment provided.
Many governments, including India, Brazil and China are rolling back on other elements of regulation, such as monitoring and oversight policies, and are increasingly relying on market competition forces which makes it harder to oversee drug policies and to monitor availability and prices.28,48,50,71-73 Other countries, including the Russian Federation, have moved in slightly different direction and rely on setting up and implementing a drug benefit programme to ensure free access to medicines for all eligible patients based on the severity of their disease, and linking these policies to existing health insurance policies.74
In all cases, government policy has involved the establishment of structures that regulate the behaviour of key stakeholders in the pharmaceutical supply chain, notably manufacturers, wholesalers, retailers as well as physicians, rather than leaving this open to market forces.

21
2 Options for financing medicines
This section provides an overview of resource mobilization for the financing of pharmaceutical services, focusing on specific macro- and micro-financing mechanisms. The financing models for medicines can be broadly grouped as shown in Figure-3. Combinations of the various options are often seen in practice and are in fact the rule rather than the exception. It is easier to mobilize resources at macro level as this pre-supposes the establishment of (some) coverage policy with rules and regulations applied uniformly and nationally, as opposed to potentially fragmented structures applied to sections or regions of a country which is often the case with community financing schemes.
Figure-3
Financing options for medicines
Source: The authors.
The type of revenue-raising mechanism has often little bearing on the resources available to spend on drug benefits. Evidence from countries that fund health and medicine through taxation or social insurance does not point towards significant differences between the two methods, as far as resource mobilization is concerned.5 Indeed, there seems to be a limit with regards to how much tax or social insurance contributions can be increased in order to fund services or the purchase of goods. Under social insurance, employers are key stakeholders who

22
normally object to premium increases,6 viewing them as a cost and a consequent threat to national and international competitiveness. Under taxation, the electorate is usually resistant to further tax increases due to its invisibility in the use of the available resources. As a result, under both taxation and social insurance, similar resources can be raised for medicines. Much of the discussion surrounding taxation and social insurance relates to the utilization of the available resources and in all cases results in oversight mechanisms and regulatory practices being put in place to ensure that resources are used optimally. These mechanisms apply both on the supply- and the demand-side, and include patient cost-sharing.
This may not be the case under private health insurance or medical savings accounts (MSA), where the insurer is partly responsible for decisions on premium policy (private health insurance) or expenditures of medical savings accounts proceeds (MSA schemes). It is likely that private insurance schemes will meet an upper ceiling and a resistance to continuous increases in premiums, particularly if employers contribute a proportion of that premium, resulting in a managed care type of coverage where utilization of medicines is monitored and/or regulated through both supply- and demand-side policies similar to those in taxation and social insurance systems.
Regardless of the method of raising funds, a drug benefit coverage and whether it is universal, comprehensive with exemptions, or targeted (covering only a sub-section of the population and/or a defined list of diseases/diagnoses), has significant resource implications and analogous resource mobilization requirements. Clearly, universal drug benefits are likely to be more costly than targeted programmes where their resource implications depends on conditions covered (acute vs. chronic – the latter being associated with significantly higher costs). Evidence suggests that over 80% of total medicine costs and an equal proportion of health care costs in defined comprehensive benefits are attributable to chronic conditions.33
2.1 Financing medicines through taxation
The problems with tax-funded health systems in a developing country context have been well documented,75 including problems with the provision of and access to medicines, poor medicines management, poor accountability, high levels of corruption, lack of incentives, continued underfunding, and resource and expenditure misallocation. Resource-poor countries with very limited resources have weaker institutions and limited resources to finance essential services and provide financial protection. This results in limited access and poor-quality health services as well as limited financial protection against catastrophic health expenditures, particularly for the poor in rural areas. More troublesome situations find only one of the three basic financing functions (revenue collection) is fully under the control of ministries of health.
6 To the extent that employers contribute part or a significant proportion of the actual insurance premium.

23
2.1.1 Revenue collection
Tax-based health systems receive their funding from general tax revenues. Thus, the quantity collected and the proportion of the total amount allocated to health is largely outside the control of the MoH. Significant donor financing of health activities outside government budgets may motivate ministries of finance to allocate domestic resources to uses other than health and medicines, thereby reducing the additionality of health funding. As the tax and revenue system is outside the control of the MoH, it has little ability to affect the equity aspects of revenue generation.
2.1.2 Pooling
Given that resource collection is outside of MoH control and that the whole population is generally covered by government health services, risk and equity subsidization are determined by MoH decisions on resource allocation, purchasing and service delivery functions. Risk pooling and prepayment functions are central to the creation of cross-subsidies between high-risk and low-risk individuals (risk subsidy) as well as between rich and poor (equity subsidy).
2.1.3 Resource allocation and purchasing
For a determined budget, resource allocation and purchasing are key endogenous functions of the MoH. Its resource allocation method largely determines quality, efficiency, access and equity of services. The MoH must determine, within political economy constraints, what, how and for whom to purchase. Although these functions are fundamental to attaining access, equity and efficiency in a health system, they are not solely under the MoH control.
Tax-based health systems have usually been associated with the delivery of services by public providers, although in a number of developed countries reforms have separated purchasing from provision. Problems, such as power of medical unions, misappropriation of public funds, lack of accountability and interregional distribution inequities of facilities and personnel, have all been associated with public sector delivery. These problems may result in inequitable physical access to services and medicines for the poor, particularly in rural areas. Although public sector service delivery is not an inherent characteristic of all national health services, separating financing from provision may generate appropriate incentives to improve service efficiency and equity.
2.2 Statutory health insurance
Social health insurance (SHI) is quite distinct from systems where health insurance is largely voluntary and from those dominated by out-of-pocket payments. Overall, SHI contributions are compulsory, and, importantly, can pool health risks plus financial risks over time and across individuals. This pooling decreases the uncertainty linked with health and health costs such as when, what type, how long, and how costly an illness may be,76 although costs of administering and re-allocating funds can be significant. Furthermore, separating

24
contributions from health status promotes the financing goal of equity of access based on health needs rather than ability to pay.
The range of SHI models represented by Europe, Latin America and parts of Asia highlights the significant variation across SHI schemes. In many countries, SHI schemes provide universal coverage, while in others they are selective, including the coverage of medicines. Coverage selectivity can occur because insurance or medicines coverage is not offered to all members of the population, or because beneficiaries are often permitted to opt out of the SHI system, or simply due to insufficient resources to provide universal coverage. Sometimes this is intentional, but often it is related to systemic failures. For example, in some lower income countries only a relatively small proportion of the population receives coverage (e.g. Dominican Republic, Kyrgyzstan), despite pledges and the political goal of universality as a long-term objective.
Social health insurance contributions are proportionate or slightly regressive, as contributions are based on income, usually with contribution ceilings, either as a fixed proportion of earnings or on total income paid by the employee and/or employers; this may differ between funds. Unemployed may be covered by employed contributions or by government assistance. Depending on the system in place, eligible patients may have a choice between funds and the benefits package to which they subscribe; while premium cost is known, insurance funds rarely compete on premiums to attract new clients. The insured are also aware of care costs, particularly cost-sharing for different goods or services.
2.3 Private health insurance and medical savings accounts
Levels of public finance are often low in resource-poor countries, prompting interest in private forms of prepayment.77-82 In recent years, the role of private health insurance and medical savings accounts (MSAs) in financing health care and medicines has emerged as a key policy issue in different parts of the world.13,34,83-85
Private insurance premiums are largely regressive, even when premiums are subsidized, as health history and risks are attached to contributions. Health care is often supplied based on ability to pay rather than evaluation of health needs, penalising the unhealthy. In practice, private insurance may have poor cost controls, experiencing inequity of access and perhaps inequity of health, in addition to administrative inefficiencies and costs (administrative costs range from 12-17% compared to 6% in SHI).86-88 Some risk pooling may occur, yet often proves inadequate, and cream-skimming is inherent in the system.
The concept of MSA – in its purest form, a vehicle to allow people to save money to spend on health care – was initially developed in the United States in the 1970s. In the 1980s and 1990s the concept was translated into policy in a handful of countries, either as part of a private health insurance market (South Africa and the USA) or to complement publicly-financed health care in south-east Asia (Singapore and China). Two threads link these four initiatives: a desire to address the problem of ‘moral hazard’ in health care and a belief that individuals should take some responsibility for their health care costs.86,89 It is only in the last 5 to 10

25
years that MSAs have begun to be discussed as an option in European health care systems. If people accumulate their own money to pay for health care (or accumulate savings based on contributions from their employer or the government), they may be more responsible in the health care consumption. Instead of ‘using or losing’ the money they pay in health insurance premiums, the choice they now have is to ‘spend it or save it.’90
2.4 Community financing
Community-based health funds have existed for centuries.91 The earliest ones were largely sponsored by local religious organizations such as churches and synagogues. In the 20th century, community cooperatives, local mutual aid societies and local funeral funds have sponsored and managed local health funds. The initiation of a nationwide community-based and managed program in China, the cooperative medical system (CMS), in the late 1950s created a great deal of attention on the potential of community-based efforts to mobilize resources and provide cost-effective health care for the rural population. Other well-known successful community-based financing and provision programs include the Thai Health Card scheme and Indonesia’s Dana Sehat.91 Each scheme covered millions of rural people for primary care and some secondary hospital services. Other local schemes such as Grameen Health Program, Dhaka Community Hospital Insurance Program and SEWA have been successfully established and cover thousands of low-income households.
Community health financing is defined as a system comprising consumer payments, including user fees, pre-payments and/or other charges, for community delivered health care with proceeds retained and managed within the local health sector. This method of mobilizing resources provides additional health resources and may also be a method for communities to be active, rather than passive, participants in their health system. The generation of funds depends greatly on the balance of a combination of factors: prices and the relevant level of OOPs, willingness to pay, quality of care, improvements, local government investment and management of payments. Community financing covers a range of different methods,10-11,92-96 including,
• Charging systems, such as fee for a service rendered, or fee per consultation;
• Drug sales and revolving drug funds; • Personal insurance (pre-payment) schemes; and • Income-generating schemes, such as community or
individual labour and fundraising activities, raffles, donations, etc.
The following sections discuss the various coverage options through community financing and presents such evidence from selected countries.
2.4.1 Charging systems
Raising funds by charging fees for services, consultations or medicines is very common;77,91-92,95 yet such systems tend to be regressive for several reasons.
26
First, the sick, particularly the chronically ill, incur greater penalties compared to those enjoying good health. Second, the poor may pay more as they are statistically at greater risk for illness. Third, the poor are likely to incur even greater financial penalties if flat payment rates are in place, as usually standard in many systems, resulting in health care costs equalling a higher percentage of their annual income than the wealthy. Fourth, this regressive nature often results in potential clients excluded from the system by their inability to pay, and when exemption schemes do operate their effectiveness is not routinely monitored.
In medicines, cost sharing creates various scenarios for total prescription drug and user charge expenditures, with price sensitivity playing a key role.97 When patients are not sensitive to drug prices, introducing or increasing user charges will only have minor effects on total drug expenditure, although it will increase user charge expenditure. When patients are sensitive to drug prices, introducing or increasing user charges will have a greater effect on total drug expenditure as patients will decrease their drug usage.
Examination of aggregate data found greater cost sharing (ranging from $0.50-$35 copayment or 0-95% co-insurance) was associated with lower total prescription drug expenditure, and varied with the user charge characteristics: charge amount, drug types and population. The price elasticity of user charges on total drug expenditure ranges from -0.29 to -0.06 (suggesting that a 10% change in user charges results in 0.6-2.9% decrease in total drug expenditure), although can be much higher (-1.07) in vulnerable communities who are financially responsible for 100% of the cost of their prescription medicines.97-98
Health insurance coverage also plays an important role in this context. Health insurance coverage can increase total drug expenditure, although this is dependant on physician prescribing patterns, overall coverage and culture.11,77,79 User charges increase patients’ total OOP expenditures, however, even partial insurance coverage can lower OOPs.
User charges may also affect other parts of the health care market, such as physician visits, hospital care and over the counter (OTC) drugs. The effect of physician visit user charges usually leads to decreased physician visits, while its absence is associated with higher physician visits as found in universal taxation-based health care (i.e. UK, Canada).99 Hospital care user charges which encourage lower-cost drug choices have no effect on inpatient or emergency care,100 while all other user charges may increase inpatient, outpatient and emergency care usage. When OTC drug user charges are used, the results are less clear; it may or may not increase prescription versus OTC drug expenditure,101 and if a fixed number of prescription coverage is implemented then OTC expenditure may increase.102 These results point to user charges potentially increasing overall health expenditure, as prescription drugs may be substituted by more expensive hospital care, although heavily dependent on user charge design and exemptions.
User charges, regardless of their form, have a negative impact on volume of drug consumption. Conversely, health insurance increases prescription drug usage, except in the case of limited reimbursement pharmaceutical lists.103-104 The

27
exceptions to this relationship can be under chronic care, life-threatening conditions or other price-insensitive groups. Reference pricing and multi-tiered formularies usually have little effect on volume as patients switch drugs rather than discontinue consumption. Measurement of elasticity of demand for user charges on total drug use ranges from -0.8 to -0.02 (a 10% change in user charges results in 0.2-8.0% decrease in total drug volume).97
The effects of drug charges on health are difficult to measure as longitudinal data is scarce. Evidence suggests that user charges have a negative impact on health, decreasing drug use and increasing improper drug use (i.e. reducing dosage, missing dosage, substituting with OTC drugs). This is particularly the case in financially vulnerable groups, even when user charges are income related.105-107
The implementation of user charges appears to have an impact on both essential and non-essential drugs.9,108-109 This points to the significance of patients being their own judge for which drugs to forego, something that most are obviously not qualified to do.106
User charges appear to decrease efficiency, where health care resources are best used to maximize health outcomes, by decreasing prescription drug consumption due to relatively inelastic demand while shifting costs from third party payers to patients, regardless of protection policies for the financially vulnerable. Shifting patients to less-expensive and generic drugs is only a one-off event, however, it may protect against systemic abuse of hospital care as a substitute for prescription drugs. User charges appear to have a negative equity effect on health, increase poor drug-taking behaviour and forces patients to make unqualified decisions between essential and non-essential drugs. Overall and unless appropriately targeted, user charges are a regressive form of health care financing, penalizing the poor and reducing their drug usage even when subsidized.
2.4.2 Medicines sales and revolving funds
Revolving funds seem to be successful in improving drug availability, when certain guidelines are followed.110-116 They cannot, however, be expected to subsidize other areas of health care, such as training of community health workers, immunization programmes or preventive activities. In addition, high emphasis on profit would detract from the aim of making essential drugs available at low cost. Moreover, they could result in irrational medicines prescription practices.
Opponents of revolving funds highlight considerable problems with their operation. First, calculating profit margins is complicated by management problems, including inflation budgeting, rising prices, foreign-exchange transactions, devaluation, import charges and taxes. Second, many pharmacies funded by NGOs depend on skilled administrators to run them, and often find themselves de-capitalized due to the aforementioned problems which are often beyond their control. Third, there are opportunities for corruption at local level, especially when health workers’ salaries are linked to drugs sales or profits

28
coupled with weak project or community control. Fourth, defining essential drugs and prescribing of non-essential drugs may prove problematic.
Of the above, the de-capitalization problem is very common but not without apparent solutions. One scheme in Zaire developed an innovative and successful solution: it bought cattle as soon as the programme had enough money which were sold once new drugs were needed. As long as livestock retains greater value than cash, and no calamity befalls them, this solution is an interesting method of operation.117 Nevertheless, such innovative and often risky solutions are the exception rather than the rule.
In order for revolving drug funds to be operationally viable, it is important to: (a) develop and use a rational drug policy (including guidelines on how to use drugs safely and appropriately); (b) use a standard list of essential generic drugs; (c) develop standard treatment guidelines; (d) have in place good management, administration, monitoring and reporting; (e) have good control and monitoring at project and/or community level; (f) ensure staff training with adequate support and supervision; (g) ensure accurate price setting (which reflects the need to subsidize some more expensive medicines and cope with expiry of some stock and currency fluctuations), or, better still, a standard charge per consultation rather than per prescription; (h) offer a guarantee of foreign exchange if drugs are to be imported.
2.4.3 Personal insurance (prepayment) schemes
This is one of the most progressive methods to fund essential medicines, although its implementation varies quite significantly by area or country.22,118-119 Personal insurance schemes have featured in many developing countries in Asia more so than in Africa.118 In these schemes, services are usually paid for in advance, which may bear no relation to the service used. Costs are shared among individuals, regardless of whether they use the services or not. Overall, the healthy population subsidizes the chronically sick.
There seem to be several advantages in such schemes. First, they are more favourable towards the sick and poor as risks are shared resulting in a progressive rather than regressive system. Second, patients are not penalised when vulnerable and sick and unable to work. Third, budgeting is encouraged as premiums are usually set annually and the system can forecast income generation. Finally, annual fee payments can take into account seasonal variations in members’ ability to pay, for instance, following harvest periods.
Despite the advantages, membership levels often remain low since many people may be unwilling to pay in advance for services they may not use. In addition, it is not usually possible to cover a sufficient proportion of costs by this method alone.
Numerous studies have examined why rural populations voluntarily enrol, and stayed enrolled, in different prepayment schemes.91 In China and Indonesia, market surveys of health care systems, risk pooling and prepay preferences found people valued primarily: availability of close-by and affordable primary care and drugs; some protection against high financial risks such as hospital charges;

29
neat and clean facilities particularly outhouses or bathrooms; reasonably competent practitioners and good customer service. Various studies from Asia, Africa and Latin America found similar findings. The products valued by community members are summarized in Table-5.
Table-5
How do community members value availability, quality, risk protection and cost?
Availability of affordable services
Quality of services (competence, cleanliness &
custom service) Costs
Preventive Primary care & drugs
Hospital PreventivePrimary care & drugs
Hospital
Extent of risk
protection Travel Charges at time of use
High High Modest Modest High High Modest High High
Source: Hsiao, 2001.91
2.4.4 Income generating schemes
Income generating schemes have made useful contributions to health programmes, however, they cover supplementary rather than core financing needs and are often based around community labour. In Senegal, villagers developed several different income-generating projects to support their local health posts, health workers and water supply developments. These included the sale of vegetables from market gardens, and the purchase of chairs and tables for hire at weddings and funerals.120 The latter involved the development of a women’s fund-raising committee to control the finances and activities.
These schemes require a great degree of community participation, and in some cases have led to disharmony if some members are perceived as not doing their share of the work. While fairly successful on an ad hoc basis, this is neither a reliable method of financing, nor is it sustainable. It is, however, extremely useful when funds are required for a specific purpose, such as repairs to a health station.
2.4.5 Issues concerning community based financing mechanisms
The measurement of affordability in community financed care is difficult, as choices are made between ability to pay and willingness to pay. Local income levels and cash availabilities can impact affordability, while relying on national per capita income may be unrealistic locally, particularly when overall per capita income is difficult to measure. Affordability in community financing is most troublesome for major expensive care, but less so for minor basic care.
Health care choices and willingness of pay depend largely on the perceptions of quality of care in community financed care. For pharmaceuticals, price may be seen as a guide to quality, injections may be preferred over tablets, patients may
30
purchase from high status individuals rather than receive them free, and counterfeit prescriptions can be a major problem.
A community financed care system using OOPs for prescriptions runs the risk of over-prescribing drugs responding to patient demands rather than prescribing based on diagnostic needs. This may become more problematic when quality of care and provider status is measured upon catering to these demands.
2.4.5.1 Cost recovery
In practice, community financed health care has yet to provide full coverage of operating costs, although efficient management with low administrative costs can recoup substantial portions of operating costs. The proportion of cost recovery is dependant on the local market, affordability, exemptions and pricing, which results in large variability of success. The goal of full cost recovery involves trade-offs between degree of cost recovery and economic accessibility, while its pursuit means less reliance on external funding. When external funding is unreliable, care can continue to be delivered regardless of central situations.
2.4.5.2 Community participation
Community participation is often a neglected portion of community financed health care and difficult to quantitatively define, yet remains central to the success of the system. Given that proceeds from financing are retained within the community health system, greater thought should be placed on community mobilization, financing, health workers, representation and hierarchies.

31
3 Evidence on various financing options in different contexts
This section brings examples concerning the listed financing options from Bangladesh, India, Jordan, Lao Peoples Democratic Republic, Nigeria, the Russian Federation, Sudan, Uganda, Viet Nam and the east Caribbean States.
3.1 Targeted outpatient drug benefit based on disease severity
The Russian Federation government introduced a targeted drug benefit plan, through implementation of the Programme of Supplementary Pharmaceutical Provision (DLO) in 2005.74 The most important achievement of the DLO programme (see Box-1) was that, for the first time, it enabled free access to essential medicines by the most vulnerable and under-provided segment of the Russian population. Under the scheme patients could obtain medications sustainably without the necessity of having to make any OOP contribution, compared with status quo ante where all medicines were financed out-of-pocket. Prescribed drug provision increased from 87% (April, 2005) to 99.5% (January, 2006), while the share of prescriptions waiting to be filled decreasing from 11% (April, 2005) to less than 1% (January, 2006).
The vast majority of medicines (over 75%) consumed by DLO eligible individuals in the first half of 2006 were within the more expensive medicines categories, costing more than 500 roubles each ($18); half of these medicines were very expensive costing in excess of 2,000 roubles each ($72). Prior to DLO implementation, patients would either need to purchase these on the commercial market paying the entire cost out of pocket, obtain some pharmaceutical coverage through in-patient settings, or simply forego treatment.
On average, the number of prescriptions filled nationally increased 2.5- to 3-fold in 2005 (the inaugural year) compared with 2004. In some regions, particularly those previously underserved, the increases were even more striking including a four-fold increase in Mordovia, a five-fold increase in Amur, and more than a six-fold increase in Kaluga. The average cost per prescription nearly doubled, from 180 rubles ($6.4) to 340 rubles ($12), between the first quarter of 2005 and the same period in 2006. This was not due to price hikes, as prices had stabilized and even fallen by 10% across 118 medicines, but rather an indication that more expensive medicines were being prescribed more frequently.
The DLO programme was made possible because of the political commitment by the Russian government and was accompanied by the appropriate financial resources. Its long-term financial sustainability relies on continued political support, availability of resources alongside the implementation of appropriate policies to manage resource use appropriately.
At the other end of the spectrum, physicians were mainly concerned with having an excessive workload and caring for patients without necessarily having the relevant supporting infrastructure. Pharmacists were sometimes overwhelmed by caring for an increased number of patients, while at the same time experiencing listed medicine shortages. In addition, the requirement to prepare dispensing and activity reports led to a disproportionate amount of time spent on administration.

32
Box-1
Financing a targeted prescription drug benefit: The Programme for Supplementary Pharmaceutical Provision (DLO) of the Russian Federation
The DLO programme initially enrolled nearly 16 million eligible citizens in the Russian Federation and included people of all ages (children, retirees and those aged between 16 and 60). Eligibility was based on either (а) disability status; “disabled” were classified those who were very ill, or chronically ill (more that 90% of all eligible groups); or (b) special social status, e.g. or war veterans. The key objective was to enable access to pharmaceutical treatments by this population at no cost to them or their families. The key actors in this DLO system included the Ministry of Health Care and Social Development, which coordinates the activities of the other stakeholders, sets the main rules for programme regulation, including those governing the budget, medications and fund flows, as well as establishing the list of reimbursable products. Other actors included the Federal Foundation of Obligatory Medical Insurance (FFOMI), holding the budget paying for pharmaceutical products, and the Federal Service of Health Care and Social Development (Roszdravnadzor), initially supervising implementation of the DLO programme and responsible for oversight, pricing policy and overall policy reform. Physicians, pharmacies and regional storehouses who prescribe, dispense, store and deliver pharmaceuticals to the eligible population, as well as pharmaceutical distributors at the federal level who purchase and supply pharmaceutical products were and still are key actors.
The implementation of the DLO programme required mobilization of a substantial number of resources and manpower including:
• 233,698 participating physicians • 26,064 polyclinics, hospitals, and other institutions • 6,000 pharmacies initially, subsequently increased
to12,813 pharmacies by the beginning of 2006 • 23 pharmaceutical distributors at federal level, selected
through an initial competitive process • 86 regional storehouses working together with federal level
pharmaceutical distributors • 61 national and 110 foreign pharmaceutical manufacturers
Source: Khabriev et al, 200674
At the same time, patients expressed a number of complaints: government-led surveys suggested that 27% of all patient-related complaints related to medicines not being in-stock at a participating pharmacy and a further 27% of complaints related to (excessive) waiting times in order to see a physician and receive a prescription.

33
3.2 Revolving drug funds
There is a wealth of evidence on the operation of Revolving Drug Funds (RDFs) in Asian and African countries, with both positive and negative experiences emerging.
3.2.1 Viet Nam
In Vietnam, the establishment of a RDF (Box-2) resulted in the availability of essential and some non-essential medicines in participating health centres, with particular progress in remote areas.113 Drug procurement and sales occur at the community level, with little central government interference but with their support. Its success appears to be associated with overall increased household wealth, increased drug consumption, local drug manufacturing and decentralization of decision making. Competition between public and private suppliers appears to have aided the replenishment mechanisms as well as encourage remote area access to drugs. These drugs are affordable and of acceptable quality, with primarily public (Vinapharm) rather than private suppliers.
Box-2
Revolving Drug Funds in Vietnam
The 1980s in Vietnam saw the popularisation of market forces in all sectors of the economy, including fee-for-service and private practice in the health care sector. The source of taxation-financed health care decreased to almost nil by 1990, adversely affecting staffing, equipment, drug availability and medical supplies, and resulted in the transfer of many surviving health care centres or personnel to private practice. External aid from UNICEF and the Nippon Foundation initialised a revolving drug fund in 1994, including a seed stock of essential drugs, basic health centre equipment, training and support, in order to revitalize community health services.
Source: Umenai and Narula, 1999113
Community involvement, performance and management vary widely between communities, positively impacting communities who emphasize finance. The effects of the programme on health centre staff have been largely positive due to resource supply and bonuses. In particular, households in participating communities slightly increased the use of community health centres, although limited data exists on effects on household expenditure. Appropriate drug use appears improved, with 1.9 items per prescription in participating regions versus 3.3 in others, and only 19% versus 81% as injectable medicines. Additional improvements include training, equipment purchasing, guidelines and procedures development and application, in addition to management and organization.

34
Several factors have contributed to the success of the RDF in Vietnam, as follows:
• The government’s interest in access and cost recovery of affordable, good quality generic drugs.
• Elimination of conflicts with the national drug policy. • Encouragement of private investment in improving the
pharmaceutical sector. • Privatization of central drug manufacturing and supply. • Strengthening of MoH regulatory and control functions, as
well as the local community decision making abilities for ordering, purchasing and selling drugs.
• Community involvement in managing and training the revolving drug fund and health services; and
• The existence of strong local health administration, with systemic interest in the supervision and management of the fund.
3.2.2 Lao PDR
Contrary to the experience offered by Vietnam, Lao PDR offers a less positive experience in introducing a revolving drug fund (Box-3). Overall, the shift from higher cost private pharmacies to lower cost RDF was not perceived to be wholly successful.112 The RDF was not felt to be integral to the community, RDF staff felt at odds with local prescribing culture (preferences for injections, brand name drugs, stockpiling) and villagers did not want lengthy examinations. Medicine quality was of concern, particularly at smaller private pharmacies.
Box-3
Revolving Drug Funds in Lao PDR
Pharmaceutical cost recovery programmes in Laos, initiated by MoH and UNICEF, were an experiment in health financing and pharmaceutical policy. Laos began the transition to a market economy in the mid 1980s, with RDFs implemented in the 1990s. By 1997, almost half of health centres, three-quarters of regional hospitals and almost all provincial hospitals had RDFs each unique in its operation and organization. The majority (95%) of total drug expenditure was covered by OOP, a per capita outlay of $11 USD per year, with the remainder covered by central government. Drug supply was via government endowment to government health facilities (6%), drug sales at national hospitals (16%), RDF at health facilities and hospitals (3%) or drug sales by private pharmacies (75%). The RDF operates in conjunction with other drug supply routes: private pharmacies are the main procurement source and government endowment covers drugs in priority health programmes.
Source: Murakami et al, 2001

35
However, impact analysis of RDF implementation found significant increases in outpatient visits at health centres and hospitals. Regional hospitals and district health centres had regular supply of essential drugs (85% and 78%), and a majority of patients could fill their prescription at the hospital pharmacy (87%). On average, the cost recovery rate of health centres and hospitals was just over 100%, however, variations occurred with some not achieving full recovery. The majority of prescriptions were given based on treatment guidelines, although some concerns existed for over prescribing unnecessary antibiotics. Private pharmacy visiting hours were more liberal than RDF, and RDF staff was perceived as needing more training and supervision.
3.2.3 Sudan
In the Khartoum state of Sudan, RDFs were established in 1989, and a recent survey found that RDF-supplied health facilities were more likely to have regular medicine supplies than non-RDF facilities.115 More than three-quarters of exit polls of RDF users purchased their medicines there, with less than 10% unable to do so due to stocking issues. For essential items, availability was 97% compared to 87% in non-RDF facilities. Over a twenty year period, the programme has expanded from 60 centres to supplying almost the entire state, although yet to achieve rural penetration. The OOP charges for RDF medicines are approximately 2% of lowest government salary. Its success is related to substantial investments, gradual implementation with testing of financial systems and proper training, as well as business-oriented and transparent management. The fund is politically supported, contains a currency swap agreement, and is able to revise prices. The community is also committed with high supervision and a reliable supply system.
3.2.4 Uganda
In Uganda, the RDF system was abolished in 2001 in response to poverty assessments and lack of evidence of quality improvement, while counter-measures of increased government financing for drugs and staff wages was implemented. Examination of this policy change found increased drug availability in public facilities, although the average annual out-of-stock days increased significantly and was greater than private non-profit facilities.108 This situation resulted in patients seeking medicines privately and paying OOP. On average, 80% of public health units did not receive drugs on time, increasingly due to district bureaucracy; these issues are less of a problem at private non-profit facilities. Perceptions of public health units staffing were of lower quality than private non-profit, in addition, public staff experienced fewer allowances than previously in addition to salary delays.
3.2.5 Nigeria
In Nigeria, initial implementation in 1989 of a RDF under the Bamako Initiative led to full cost recovery, with 80% used to replenish stock and the remainder for local health initiatives. Recently, OOPs and irrational drug prescribing have resulted in inequity in access and utilization. An examination of healthcare staff found initially they were motivated due to drug availability; however, current government focus

36
on cost recovery comes at the expense of health provision.114 This is further compounded by non-payment of salaries resulting in further mark-ups passed onto the patients, in addition to poor training in financial systems resulting in local mismanagement of funds. Health workers often purchase or steal their own medicines which they sell privately to patients, resulting in available medicines expiring before purchase, as monitoring is not routine. Full course of medicines often do not occur due to lack of money, irrespective of medicine availability.
3.2.6 Lessons learned
Revolving drug funds often present problems, which typically relate to
• The sources of initial capital investment • Ensuring that prices are low but cover resupply costs • Project supervision • Whether they ensure safety against catastrophic spending • Potential under-estimation of capital costs and losses
through deterioration, and high operating costs • The fact that after an initial capital investment, medicine
supplies are replenished using the funds collected from the sales to the consumer
In addition to the above, adjusting for inflation, checking the quality of the medicines and likely failures to collect payments for unsubsidized medicines may constitute further shortcomings.
3.3 Good procurement practices
The evidence on procurement of medicines in developing countries provides an insight into the various procurement models and is only limited by the availability of information.41,80,121-123 An attempt is made to present some good procurement methods which in turn result in better availability, affordability and overall improved access to essential medicines. This section presents the evidence on the different types of procurement models and how these affect access to medicines. Different countries are seen to employ different types of procurement models. It emerges from the literature that, while many countries are moving towards improved procurement practices, access to medicines still remains of vital focus (and a significant shortcoming) in the vast majority of cases.48,124-128
Evidence on public procurement in the case of the middle-east and some Asian countries (such as Pakistan or the Indian state of Tamil Nadu) reveals that public procurement prices seem to be low and affordable, yet this does not always translate into low retail prices, even in public sector facilities where patients are having to pay for their medicines, or into high availability. The procurement models and payment options used in some countries are summarized in Table-6.
3.3.1 Pooled procurement through inter-country initiatives
Even though national pharmaceutical policies have been developed in many developing countries, accessibility to essential drugs varies both within and

37
between countries. This variability becomes more prominent during economic crises since drug supply management is disrupted due to financial and economic factors. Inter-country cooperation in sustaining essential drug supply becomes a critical issue as this strategy can ameliorate the shortage of essential drugs in the health care facility. Such cooperation has been commonly seen in the area of pharmaceutical procurement where countries collaborate successfully in pooled procurement or group purchasing with obvious benefit due to economies of scale. A number of successful examples exist to date in different parts of the world. The schemes now in operation are (a) the African Association of Central Medical Stores for Generic Essential Drugs (ACAME); (b) the Maghreb Commission for Bulk Purchasing by the Arab States; (c) the Bulk Purchasing System of the Gulf Countries; (d) the Eastern Caribbean Drug Service (ECDS); and (e) the South Pacific Pharmaceutical Project among the Pacific Island countries. Among them, the ECDS features prominently (see Box-4).
Table-6
Examples of Country Specific Procurement Models
Country Procurement Model Payment Options India Decentralised/Mixed Mixed (Pooling prevalent) China Decentralised/ Pooled and Tendering Philippines Centralised Pooled and Competitive bidding Pakistan Not Available Bulk Jordan Para-state Tender Lebanon Centralized Tender Nigeria Not available Competitive bidding/ Tendering Brazil Decentralised/ Mixed Competitive bidding
Source: The authors from the literature.
The OECS has performed well over time for a number of reasons, including political will, financial commitment, a centralized tender system, organizational aspects, a single stable currency and terms of payment and past performance of suppliers. These are discussed below.
Political will and financial commitment
Political will was an essential ingredient for success as the Prime Ministers of the OECS agreed to establish the OECS Pharmaceutical Procurement Service OECS/PPS in 1986. The countries deposited one-third of their annual pharmaceutical budget to individual country drug accounts at the Eastern Caribbean Central Bank (ECCB) in order to assure prompt payment to suppliers and to maintain a RDF. This was a concrete sign of political will and financial commitment.

38
Box-4
Pooled procurement through the Organization of Eastern Caribbean Service
The countries comprising the Organization of Eastern Caribbean States (OECS) – formerly known as the Eastern Caribbean Drug Service (ECDS) - recognized that efficient procurement practices could improve the use of existing resources. Of the four areas of drug supply management - selection, procurement, distribution, and use - efficient procurement provides the greatest opportunity for cost-savings.
The OECS/Pharmaceutical Procurement Service (OECS/PPS) is an agency of the OECS, a formal grouping of nine Eastern Caribbean Countries - Anguilla, Antigua and Barbuda, British Virgin Islands, Dominica, Grenada, Montserrat, St. Kitts and Nevis, St. Lucia and St. Vincent and the Grenadines - with a combined population of approximately 550,000 inhabitants. It was established under a project funded by USAID, and by 1989 was financially self-sufficient. It is a self-financing public sector monopsony that covers its operating cost from a 15% surcharge.
The core function of the OECS/PPS is the pooled procurement of pharmaceuticals and medical supplies for nine Ministries of Health (MOHs) of the OECS countries. During the 2001-02 tender cycle, the annual survey on a market basket of 20 popular medicines showed that the regional prices were 44% lower than individual country prices. The continuous annual cost-savings accrued after 16 years of the joint purchasing arrangement have reinforced it as an excellent cost-benefit model of economic and functional cooperation among OECS member countries.
The OECS/PPS operates a centralized, restricted tendering system in which all approved suppliers are pre-qualified by a vendors’ registration questionnaire. Pre-qualification is necessary to assess the quality standards, technical competence and financial viability of competing suppliers. Following a solicitation bid from over 75 international suppliers, the OECS/PPS awards annual contracts, places orders directly with suppliers, and monitors delivery and supplier performance. It does not warehouse supplies, but instructs suppliers to ship consignments directly to participating countries which in turn reimburse their respective ECCB drug accounts.
Recognizing the success with pooled procurement, the OECS/PPS has rapidly expanded its product portfolio to include medical supplies, contraceptives and x-ray consumables. The OECS/PPS has now been mandated to explore the feasibility of purchasing dental and laboratory supplies. During the 2001-02 tender cycle, the Unit purchased US $3.5 million worth of supplies for the 9 OECS member states.
Overall, the evidence shows the success of the OECS/PPS in implementing improved pharmaceutical procurement as a cost containment strategy, and outlines essential elements for successful pooled procurement for other resource-constrained countries.
Source: OECS, 2009129
Centralized Tender (Bid)
The OECS/PPS presented suppliers with a public sector monopsony, a purchasing cartel, so that products tendered by OECS/PPS are purchased exclusively through annual contracts. Prior to the establishment of OECS/PPS,

39
the OECS countries purchased drugs individually from suppliers by direct negotiation. The cost of pharmaceuticals in any country depended on the following factors: professional attitude and negotiating skills of the supplies officer, government payment track record, and source of supply. Consequently, drug prices for similar products varied widely among OECS countries.
Organizational Development & Institutional Alliances
The Eastern Caribbean Central Bank (ECCB) facilitated prompt payment of foreign exchange to suppliers at no additional cost to participating countries. The formal country-based committees of the OECS/PPS ensured participatory decision-making and commitment by MoH. The OECS/PPS Policy Board, who exercised overall responsibility for the policy directives of the Unit, was comprised by the MoH (assisted by their Permanent Secretaries), the OECS Director General, the ECCB representative and the OECS/PPS Managing Director. The tendered items were extracted from the OECS/PPS’ Regional Formulary and Therapeutics Manual, which is reviewed annually by the OECS/PPS Technical Advisory Committee (TAC). The Tenders Sub-Committee reviewed bid offers and awarded contracts to successful suppliers. The pooled procurement list represents large volume and/or high-cost items for which there is a consistently high demand.
Choice of Currency Foreign Exchange and Terms of Payment
The OECS/PPS solicits bids in U.S. dollars to provide one standard monetary unit for easy price comparison. The Eastern Caribbean (E.C.) dollar is pegged to the US$ at a rate of 2.7 and has remained stable at this rate for the last 25 years. The use of the US dollar prices through the OECS/PPS procurement system allow OECS countries to forecast drug costs in the E.C. dollar without concern about fluctuations between international currency, or between the E.C dollar and the US dollar. The stability of the E.C. dollar and the availability of the US dollar are advantages that many developing countries, including some Caribbean countries, do not have. One of the most critical elements of OECS/PPS initial success in reducing the cost of pharmaceuticals was the ability to pay suppliers promptly in foreign exchange within 60 days of receipt of goods. In recent years, however, this reputation for prompt payment initially established by the OECS/PPS has become tarnished because of slow reimbursement of drug accounts by some member countries experiencing economic difficulties. Suppliers have responded to tardy payments by withholding shipments to both defaulting and non-defaulting countries.
Past performance of suppliers
The selection of suppliers has a profound impact on both the quality and cost of drugs. Inadequate quality assurance in the selection process may result in the purchase of drugs that are ineffective and unsafe. Hidden costs caused by late deliveries, defaulting on confirmed orders, losses due to poor packaging, short expiry date and other factors attributable to an unreliable supplier may raise the cost of a drug to several times the original contract price. Apart from the cost implications, poor supplier performance can seriously hurt the credibility of health

40
programs and demoralize health workers. Prior to the adjudication of contracts, the past performance of suppliers is reviewed in detail. Factors considered in evaluating supplier performance include delivery times, number of partial shipments per purchase order, expiration dates, quality of packaging and labelling, quality of attendant documentation, quality assurance of products and proficiency of the customer service department.
3.3.1.1 Lessons learned
Based on the OECS experience, the key findings in pooled procurement of pharmaceuticals are the following:
• Reduction in the cost of drugs and other medical supplies; • Improvement in quality assurance; • Increased collaboration of pharmaceutical sectors among
countries including harmonization of drug registration.
There are a number of key conditions for successful implementation of pooled procurement. They are (a) political will, (b) commitment of participating countries to the scheme, (c) formal agreement among the relevant countries, (d) well-defined regulations and procedures, (e) a permanent and independent secretariat, and (f) stage-by-stage development. Exchange rate stability, as a result of a currency-pegging policy, is also particularly helpful in this context, as is the availability of resources to dedicate to the joint procurement activities.
3.3.2 Efficient drug procurement in Tamil Nadu
The Tamil Nadu Medical Services Corporation (TNMSC), an autonomous medicines procurement agency, procures and supplies medicines for the public health care system in the state of Tamil Nadu in India with the aim of making medicines accessible to the public through public health services at lower prices (see Box-5). Overall, the TNMSC model has many positive attributes: it appears to be efficient, procures medicines at prices lower than market rates and has increased availability in the public health system. The evidence from 2002 – 2008 suggests that prices of the TNMSC are lower than retail market rates.48,130 There has been a downward pressure on prices over a period of five years, although 2007–2008 has seen a slight increase in prices in the case of more than 50% of drugs (see Table-7).
Overall competition, measured by the number of applicants per medicine, is relatively strong, although falling in 2007-08, with an uneven pattern in the prices of high-expenditure drugs. While consistent competition has brought down prices of groups of medicines and decreased competition, it has also increased the prices of remaining medicines (see Table-8). Competition is low in the case of high-priced speciality medicines and interestingly, one company accounts for 60% of the speciality medicines budget. Medicines procurement and utilization are in sync with the increase in demand.
With regards to quality control, all approved suppliers are accredited by the National Accreditation Board for Testing and Calibration of Laboratories and

41
follow strict quality control measures set by pharmacopeia, ensuring that assured quality drugs are available to the public. Evidence over the 2002–2008 period suggests there has been a continuous increase in the number of samples being tested, with satisfactory results. Interviews with those responsible for quality control in the participating laboratories established that procedures were stringent and standardized.
Box-5
Medicines procurement in Tamil Nadu
Prior to 1995, drug procurement in Tamil Nadu was decentralized, with approximately 1,000 institutions procuring their own drugs. This resulted in acute drug shortages, market-driven high prices, plus drug pilferage and wastage due to improper storage and distribution. This situation gave rise to a lack of faith in public health services and low utilization of services. To overcome the problem, the TNMSC, an autonomous drug procurement agency, was established in 1995 by an executive order of the government of Tamil Nadu under the Company Securities Act, 1956. The agency adopted the European model of drug procurement, involving both procurement and logistics. The main objective of the TNMSC is to ensure the availability of quality essential drugs to public health services at cost-effective prices.
The TNMSC was established with the involvement of multiple stakeholders. The process of floating tenders was used with the aim of bringing transparency into the state drug procurement mechanism. The model implements strong quality control measures and has a robust infrastructure in the areas of information technology (IT) and warehouse distribution. The human resource component and other services have collectively affected its performance. The TNMSC also provides various services and procures surgical equipment, veterinary drugs and essential medicines for human use in the public health system.
Procurement is done within given budget constraints and combines procurement with logistics with a distinctive stakeholder ownership. Quality assurance mechanisms are built-in along with improved infrastructure to cater for IT surveillance systems for inventory management and account keeping. The infrastructure re-modelling also provides for appropriate warehouses for stocking and distribution. The reform was initiated as a response to decentralization in procurement by the Indian government, which resulted in acute shortage of drugs, market-driven high prices, and drug pilferage and wastage (due to improper storage and distribution). The challenge faced by the state at present is to ensure sustainability of implemented successful practices established in 1995. Sustainability in all procurement practices is vital to cater to growing medicine needs of the respective communities. Health and drug expenditures have increased by 80% since 2002, responding to increase in drug consumption and price variability. Sustainability also needs to address the availability and affordability matters. In Tamil Nadu, even though procurement is seemingly efficient, availability and affordability are still low, but improving.
Source: Chokshi et al, 200848

42
Table-7
Prices of high-expenditure medicines over time
Name of drug Unit 2002–
03 2003–
05 2005–
06 2006–
07 2007–
08 Salbutamol 10x10 5.73 5.22 5.18 4.85 4.45Amylodipine 10x10 7.56 6.3 5.05 4.7 5.1Theophylline 10x10 10.03 9.04 8.29 8.09 8.9Multivitamin 10x10 14.4 16 15.39 13.4 14.54Metronidazole 10x10 12.7 13 13.47 14.29 14.72Ibuprofen 10x10 12.6 12.49 12.42 11.95 14.25Enalapril 10x10 6.4 5.95 5.13 5.04 6.15Diclofenac 10x10 7.19 6.86 5.85 5.55 7.6Atenolol 14x10 14.68 12 11.9 11.44 10.72Calcium lactate 10x10 5.59 5.4 5.59 5.56 6.3Glybenclamide 10x10 5.19 4.54 4.23 3.77 3.9Isosorbide 10x10 3.96 3.82 3.69 3.58 6.6Metformin 10x10 15.9 14.46 13.1 12.36 12.16Ranitidine 10x10 22.34 22.05 18.25 21.61 18.19Co-trimoxazole 10x10 27.28 24.88 25.3 30.42 32.23Amoxycillin 10x10 75.45 61.68 54.48 52.85 93.96Aluminium hydroxide 10x10 6.25 6.2 6.15 6.3 5.85Ferrous sulphate with folic acid 10x10 5.98 6.74 6.54 8.4 8.73Chlorpheniramine 10x10 2.4 2.59 2.7 2.59 2.6Vit. B complex tab NFI prophylactic 10x10 5.99 5.7 4.77 4.22 4.85Paracetamol 10x10 11.24 12.4 13.42 13.41 12.69
Source: Chokshi et al, 200848
3.3.2.1 Lessons learned
Overall, the Tamil Nadu procurement model has been able to:
• Procure drugs at prices that are lower than market prices • Trigger some competition, although further work is needed • Increase efficiency, whilst taking advantage of IT,
safeguarding transparency and flexibility • Ensure adequate quality of the drugs procured by
implementing a tight quality control policy
Factors contributing to its success are the use of IT, the transparency created by the tendering process and state government policies, outsourcing of activities, and flexible and focused human resource policies. The stringent quality control policy of the TNMSC ensures drugs distributed from PHS are of standard quality while political commitment and enactment of legislation contribute to its sustainability.

43
Table-8
Number of drugs drawing one or more applicants
Number of drugs No. of applicants 2002–03 2003–04 2005–06 2006–07 2007–08
16 and above 28 34 28 17 915 5 4 4 0 014 4 6 6 3 413 6 5 6 4 312 6 6 10 6 111 2 13 11 6 210 16 10 7 6 89 16 9 7 9 58 11 14 6 9 107 17 15 15 19 166 18 6 27 17 265 18 19 20 21 204 29 30 21 32 283 24 33 30 38 422 32 26 33 33 421 25 29 39 51 36
Total no. of drugs 257 259 270 271 252
Source: Chokshi et al, 2008.48
Other states or countries intending to replicate the TNMSC model should take note of the fact that the efficiency of the TNMSC can be attributed to various factors: political commitment, legislation, as well as the plus points of the model itself, notably efficiency and procurement at low cost. Replication of the model requires following the steps and processes used in Tamil Nadu, which may not be universally applicable. It would be useful for interested parties to seek information on the suppliers, both accepted and rejected, and to learn the reasons for rejection. Further, they should access information on quality testing laboratories from the TNMSC.
3.3.3 Partial health insurance with a vibrant local pharmaceutical industry
In Jordan approximately 32% of the national population have no insurance coverage and a significant proportion of total health expenditures, nearly 33%, are related to medicines (see Box-6). A procurement system is in place for purchasing medicines in the public sector.44 Medicines expenditures in 2003 was almost $300 million; approximately 80% of all spending on medicines is paid for by OOPs. The Jordanian pharmaceutical market is made up of imported (75%) and locally manufactured medicines (25%). Most of the locally-produced medicines are generics, usually sold under a commercial name (branded generics). About 5% of local production is manufactured under license through an

44
agreement with the originator brand manufacturer with some local labelling and packaging undertaken using products supplied in bulk from the originator company.
Box-6
Access, availability and affordability of medicines in Jordan
The total expenditure on medicines in Jordan was one-third of total (public and private) health care expenditure. According to MoH data, government medicine expenditure as a proportion of total medicine expenditure is relatively small, ranging from 19% in 1996 to 17% in 2003. Over 80% of the cost of medicines purchased publicly is funded through OOPs, despite 68% of the population having some sort of health insurance coverage (although 32% have no coverage).
In the public sector, the procurement agency purchases medicines at prices comparable to the IRP which indicates a high level of purchasing efficiency, although, a number of high priced originator brands are also being purchased. Public sector patient prices for generic medicines are similar to procurement prices, indicating very low mark-ups in the public sector distribution chain. However, median availability of generic medicines in the public sector was only 28%, indicating many patients purchase medicines in the private sector.
In the private sector, the median availability of originator brands and generic medicines was 60% and 80%, respectively. Generic medicines in private pharmacies were priced about 10 times higher than in the public sector, and 10 times higher than IRP. When originator brand medicines are dispensed in private pharmacies, patients pay about twice the price of generics.
Based on a recent WHO-HAI pricing survey, examining treatment of common conditions using standard regimens, the lowest paid government worker would need 2.1 days to treat arthritis with diclofenac and 4.6 days to treat an ulcer with ranitidine when purchasing LPGs from private pharmacies. If originator brands are dispensed, costs escalate to between 4.6 and 8.6 days’ wages respectively. Some treatments were clearly unaffordable particularly for chronic conditions; for instance, ulcer treatment with originator omeprazole would cost 19.9 days’ wages. Affordability is much better for medicines purchased in the public sector, particularly for generic medicines, but availability is poor.
Source: Bader, 200744
Several different medicine brands are listed by private health insurers for reimbursement. Private health insurance funds generally require doctors to prescribe LPGs in a given bio-equivalent category. However, the present drug law does not allow for generic substitution or other changes to the prescription unless the prescribing doctor has formally agreed in writing. This applies where the patient is insured (68% of population).

45
The Jordanian pharmaceutical industry (comprising 18 companies) is dynamic, profitable and export-oriented with exports to markets in over 60 countries, including the Middle East, South Africa, Europe and North America. In 2003 production for the local industry totalled JD141.6 million (about US$ 200 million), of which JD103 million or US$ 145 million (73%) was exported. The remaining JD38.6 million (US$ 54.4 million) was for local consumption, and of this JD9.9 million or US$ 13.9 million (25.6%) was spent on government tenders. The industry represents a capital investment in excess of US$400 million, and has generated over 4,000 jobs.
A national medicines policy has been in place since 2002 with the establishment of the Joint Procurement Administration in 2006, while the Jordan National Drug Formulary (JNDF) was reviewed and published in August 2006. For the public system, medicines are acquired through tenders issued by the generic (or scientific) name of medicines. These tenders are conducted through one of three sources: the MoH, the Royal Medical Services (RMS) and the Jordan University Hospital (JUH).
The sale of medicines is regulated by the Pharmacy and Drug Law as enforced by the Jordan Food and Drug Administration (JFDA). Prices in Jordan are regulated, and registration of a product includes price setting. Registration fees differ between originator brands and generics, and between imported and locally produced medicines, while generics and locally produced enjoy lower registration fees.
Evidence suggests that procurement of medicines In the public sector is relatively efficient as procurement prices are close to IRP.44 Generic medicines are generally sold to patients at similar prices to the procurement price benefiting patients (see Table-9). For some medicines the government purchases originator brands when lower-priced generics are available, pointing to a lack of efficiency.
Table-9
Jordan: Median MPR for medicines found in both the public and private sectors
Type and number of medicines in
both sectors
Median MPR Public Sector Procurement
Prices
Median MPR Public Sector Patient Prices
Median MRP Private Sector Patient Prices
Originator brand (n=1)
6.53 5.95 9.30
Lowest price generics (LPGs)
0.66 (n=9)
0.85 (n=16)
9.49 (n=16)
Source: Adapted from Bader, 200744
Median availability of generic medicines in the public sector was poor; half of medicines were found in only 5.1% to 61.1% of surveyed public facilities. As a result, many patients have to purchase medicines from the private sector. Median

46
availability in the private sector was higher than the public sector but did not reach the ideal of 100%. Private sector patient prices were on average 17 and 11 times higher then IRP for originator brands and LPGs respectively. The overall originator brand premium in the private sector was 222%, showing patients are paying substantially more to purchase originator products compared to LPGs. Patients are paying substantially more (about 10 times more) for generics in the private sector than in the public sector. Given the low availability of generics in the public sector, this is a cause for concern.
For the standard treatment of common conditions, the lowest paid government worker would need to spend less than 1 day’s wages to purchase generic medicines in the public sector, while in the private sector up to 8.6 days’ wages are needed to purchase LPGs and up to 21.6 days’ wages to purchase originator brands. In the private sector, treatment of some chronic conditions is unaffordable even when LPGs are used.
3.3.3.1 Lessons learned
The overall experience from Jordan raises questions of both availability and affordability similar to those in other developing countries, with significant variation in prices offered by the public and private sectors. Although generics are procured very close to the IRP, availability in public sector is relatively poor:
• Despite two thirds of the population having health insurance coverage, about 80% of total pharmaceutical expenditure is still paid for OOP.
• Jordan has a vibrant local pharmaceutical industry catering primarily for the private sector and export market
• Public procurement mechanisms are reported to be relatively efficient, but availability – particularly of generics – ranges from average to very poor in public, yet significantly better, in private sector outlets, although with much higher prices.
• Some of treatments, particularly for chronic illnesses, are not affordable to significant parts of the population.
3.3.4 Maintaining equity and improving access through pre-payment schemes
The Gonoshasthya Kendra health centre in Bangladesh uses a differential contribution structure, which is means tested to ensure those who cannot afford OOP for the services have access to their services and medicines (Box-7).131 Approximately 25% of those eligible enrolled in the scheme, however, membership renewals were quite low. Overall, the scheme recovered approximately 50% of its cost, through fees for service and the insurance scheme (about 25% from each).
47
Box-7
Gonoshasthya Kendra in Bangladesh
Gonoshasthya Kendra, funded by Oxfam, highlights how equity and revenue raising capacity could be safeguarded, in what was considered an innovative scheme. A system of prepayments was initiated where members were divided into classes, as follows:
• First, the destitute, families with no male earner, or families with a disabled earner: these paid a registration fee of 5 taka per year and 1 taka per visit;
• Second, families who could not afford, from any source, two meals a day; these paid 10 taka per annum and 3 taka per visit;
• Third, families who could afford two meals a day throughout the year, but had no surplus; they paid 25 taka per annum, plus 6 taka per visit; and
• Fourth, wealthy landowners paid 30 taka per annum, plus 5 taka per visit, plus half the cost of their medicine.
Under the provisions of the scheme, non-members could still have access to the services by paying 10 taka per visit plus total costs of drugs or treatment. There were also different charges for a long list of services such as medical investigations.
Source: Mehreen, 2008131
Overall, individual prepayment schemes in the context of developing countries are viable under certain provisions. First, a good understanding of community dynamics and community coherence as some members subsidize others with seemingly few benefits for themselves. In order to achieve consensus, significant preparatory work may need to be done in the community before such a programme can be contemplated. Second, membership should ideally be as broad as possible. And third, premiums must be affordable and ideally on a sliding scale.
3.4 An evaluation of the existing medicine financing mechanisms
The criteria for evaluating financing mechanisms include, chiefly, equity, access, efficiency, appropriateness of care, financial sustainability and political feasibility.
Equity addresses the question of who benefits and who pays for services and that its application means that care is provided according to need and is financed according to ability to pay. In the context of medicine policy, equity implies universal access to medicines according to need, regardless of income level.
Access encompasses availability, accessibility and affordability of medicines and the extent to which these three are improved.
Appropriateness of care or rational medicine use relates to the question of whether the financing mechanism creates incentives for overuse, underuse or misuse of medicines. Free access to medicines could lead to high demand and

48
potential overuse; similarly, provider-induced demand could also lead to high demand and potential problems in use, particularly if revenue from medicine sales is used for staff salaries.
Efficiency addresses the question of whether the financing mechanism encourages the maximum output or health outcome from available resources.
Financial sustainability takes into account whether a reasonable level of funding will be maintained over time, as both the amount of revenue generated and the availability of funding over time are very important.
Political feasibility debates the additional requirements both from a systemic as well as an administrative perspective for introducing a drug benefit and making the funding mechanism(s) operational. For instance, managing a viable revolving drug fund is many times more demanding than managing a system in which drugs are free. Insurance schemes require a multiplicity of new structures and arrangements. By contrast, government financing (general taxation) systems are usually well established, but can be less efficient, and donor administrative requirements are usually well defined and do not place additional requirements on existing structures.
Table-10 presents and compares each of the financing mechanisms discussed in Section-3 by benchmarking them against these evaluation criteria. Clearly, of course, it is not possible to have a clear winner that satisfies all criteria at the same time and it is important to highlight the fact that important tradeoffs need to be considered in this context. For instance, meeting the objective of equity fully, in terms of universality, is likely to create problems of cost and financial sustainability. Although these tradeoffs need to be considered very seriously at policy level, it is also important to understand that policy mechanisms exist to fine-tune choices improve performance across criteria. For instance, improving availability does not necessarily improve affordability unless an appropriate cost-sharing structure is introduced.
The ten financing mechanisms outlined in Table 10 are not mutually exclusive, and they can co-exist possibly to cover different needs of different population groups within a developing country context. Regardless of the mechanism of finance, several issues emerge that policy makers in a developing country context need to take into account.
Table-10 also includes Global Partnerships, which are a new form of assistance available to developing countries. Despite being a relatively recent phenomenon, they seem to have amassed significant support among donor agencies, whether bilateral or multilateral.133 There are arguments favouring GHPs over bilateral or multilateral aid, which include, (a) their flexibility, (b) the potential for scale economies, (c) the multiple country links, and (d) their independence.
3.4.1 Cost of a medicines benefit
Significant differences exist across countries in the mix of pharmaceutical products consumed. These differences may well reflect variations in underlying
49
disease prevalence, national prescribing guidelines, or other factors, including culture, procurement practices, product launch, the mix of brands versus generics, etc. As a result, the cost of a medicines benefit depends on the type of medicines consumed and the prescribing rates for these medicines.
Negotiating and monitoring the prices of medicines that are included in a drug benefit is very important as prices are a key cost driver for drug benefit managers. Prices and price levels of medicines in different countries are a function of many parameters. Key among them are (a) whether the medicines in question are brands (in-patent or off-patent) or generics; (b) the extent to which regulation affects the prices of medicines; (c) the extent to which there is a reimbursement authority that negotiates prices of medicines; (d) the age of product on the market; (e) the number of manufacturers for a specific product on the market; (f) the stakeholder effects on the prices of medicines and (g) the size of the market.
Relevant cost drivers for a drug benefit include the prevalence of different conditions, the extent to which a drug benefit is comprehensive or targeted (selective), the prices at which drugs are procured and the consumption volume that is likely to emerge. Within each of these areas important decisions need to be made; key among them are how prices and price levels are determined, the procurement policy and whether it applies to a number of outpatient drugs (and which ones), the remuneration of stakeholders, the type of medicines included in the drug benefit and the criteria for their inclusion, prescribing policy and cost-sharing policy.
The authorities that are empowered with the establishment of a drug benefit are also empowered to monitor the way it works, its sustainability as well as have oversight on and regulate the behaviour of different stakeholders, including providers. Beyond deciding what drugs to include in a formulary, local decision makers also need to steer the way the drug benefit works with a view to keeping within budget and ensuring it covers the needs of the population it is supposed to cover.
3.4.2 The role of local industry and imports
Countries where the generic drug industry is still under-developed have the option of importing drugs at much lower prices from other countries with growing/large generic drug industries such as Pakistan, India and China. It has also been noted in some of the middle-eastern countries that importation of generics from Asian industries is an efficient method of cost containment due to fewer import tariffs resulting in cheaper patient prices. This necessitates heightened generic policies to be implemented in all countries.

50
4 Conclusions
The available literature suggests that there is significant inequity in access to medicines in many resource-poor countries, propagated by inadequate public spending, a lack of or adequate health insurance coverage, poor availability of essential drugs, poor affordability and high OOP expenditure. International evidence suggests that high OOP payments for health care are positively related to catastrophic payments and can often lead to impoverishment. This in turn indicates that poverty can be prevented by reducing the burden of catastrophic payments, whose primary determinant is OOP payments.
4.1 Options for financing medicines
Although prepayment and risk pooling could protect poor households from facing catastrophic spending in health, many resource-poor countries lack appropriate mechanisms to pool financial risks, even with rising income. However, successful models, many of them at the sub-national or sub-sector level, do exist in these countries, which could be scaled up or replicated. This paper has discussed a few of them. Some positive medicine financing experiences have come from Eastern Caribbean states, Tamil Nadu in India, the Russian Federation, Sudan, and Viet Nam. The tax-based DLO programme in the Russian Federation enabled free access to essential medicines by the most vulnerable and under-provided segment. The community-based revolving drug funds in Vietnam resulted in the availability of essential and some non-essential medicines, particularly in remote areas; it also succeeded in a Sudanese province. The pooled procurement methods in the Eastern Caribbean States and the Tamil Nadu state of India using two different approaches enhanced efficient, sustainable and affordable access to essential medicines. The evidence from these experiences also suggests that constant reform may be needed to ensure the continuity and sustainability of these policy mechanisms.
On the other hand, less successful experiences are reported from Lao PDR, Nigeria, and Uganda. A community-based revolving drug approach similar to the one in Viet Nam was proved to be less successful in Lao PDR, Nigeria and Uganda. Despite their known advantages, revolving drug funds also present a number of disadvantages, related to the sources of initial capital investment, project supervision, whether they ensure safety against catastrophic spending, potential under-estimation of capital costs and losses through deterioration, potentially high operating costs, and the fact that after an initial capital investment, medicine supplies are replenished using the funds collected from the sales to the consumer.
Mixed results have emerged from Bangladesh and Jordan. Of course, all these are not comparable because their objectives and targets and, therefore, their achievements are quite different.
4.2 Enabling factors to successfully finance medicines
Drawing lessons from various experiences, one could argue that successful financing of medicines is contingent upon a number of factors, as outlined below.
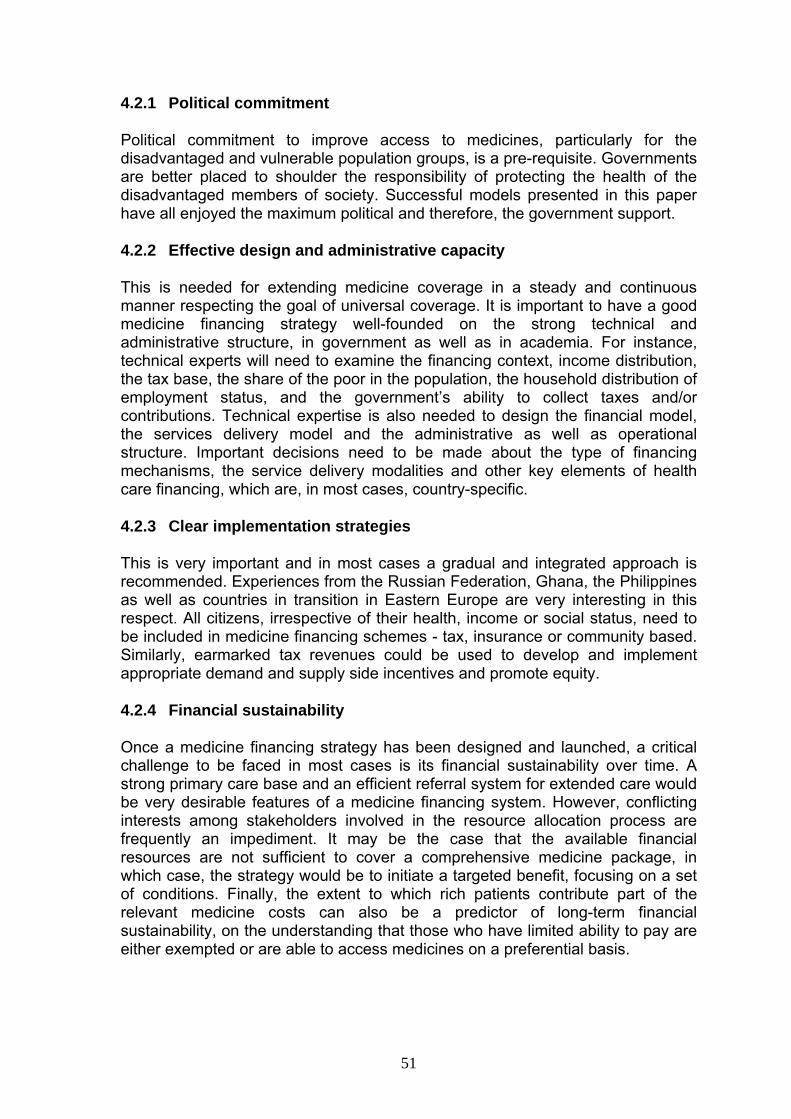
51
4.2.1 Political commitment
Political commitment to improve access to medicines, particularly for the disadvantaged and vulnerable population groups, is a pre-requisite. Governments are better placed to shoulder the responsibility of protecting the health of the disadvantaged members of society. Successful models presented in this paper have all enjoyed the maximum political and therefore, the government support.
4.2.2 Effective design and administrative capacity
This is needed for extending medicine coverage in a steady and continuous manner respecting the goal of universal coverage. It is important to have a good medicine financing strategy well-founded on the strong technical and administrative structure, in government as well as in academia. For instance, technical experts will need to examine the financing context, income distribution, the tax base, the share of the poor in the population, the household distribution of employment status, and the government’s ability to collect taxes and/or contributions. Technical expertise is also needed to design the financial model, the services delivery model and the administrative as well as operational structure. Important decisions need to be made about the type of financing mechanisms, the service delivery modalities and other key elements of health care financing, which are, in most cases, country-specific.
4.2.3 Clear implementation strategies
This is very important and in most cases a gradual and integrated approach is recommended. Experiences from the Russian Federation, Ghana, the Philippines as well as countries in transition in Eastern Europe are very interesting in this respect. All citizens, irrespective of their health, income or social status, need to be included in medicine financing schemes - tax, insurance or community based. Similarly, earmarked tax revenues could be used to develop and implement appropriate demand and supply side incentives and promote equity.
4.2.4 Financial sustainability
Once a medicine financing strategy has been designed and launched, a critical challenge to be faced in most cases is its financial sustainability over time. A strong primary care base and an efficient referral system for extended care would be very desirable features of a medicine financing system. However, conflicting interests among stakeholders involved in the resource allocation process are frequently an impediment. It may be the case that the available financial resources are not sufficient to cover a comprehensive medicine package, in which case, the strategy would be to initiate a targeted benefit, focusing on a set of conditions. Finally, the extent to which rich patients contribute part of the relevant medicine costs can also be a predictor of long-term financial sustainability, on the understanding that those who have limited ability to pay are either exempted or are able to access medicines on a preferential basis.

52
4.2.5 Rational selection and rational drug use
While advanced methods of treatment for major infectious diseases and related conditions tend to become ever more complex and costly, many highly effective medicines are or can be made available at very low cost. It is therefore feasible for affordable treatments to be procured in a straightforward manner if one chooses well. Rational selection of medicines includes defining which medicines are most needed, identifying the most cost-effective treatments for particular conditions while taking full account of quality and safety aspects as well as ensuring that medicines are used correctly and effectively. Appropriate prescribing by physicians and other health professionals and use by patients can be pursued by introducing evidence-based treatment guidelines and protocols. Based on these and on actual needs a national formulary or essential medicines list can be prepared. In-service programmes and availability of unbiased information are also needed to update the skills and knowledge of clinicians and other health care professionals (pharmacists, nurses) in effective drug use. The encouragement of rational drug use by patients carries equal weight in this process.
4.2.6 Affordable prices
Affordability of medicines by individual patients in developing countries is critically important and influences access to care and treatment. Medicine prices in developing countries are often higher than those in developed countries and, more often than not, they have to be met entirely by sick patients. Reducing the burden of high prices implies that a proportion of the cost is covered and/or that good choices are made in drug selection and procurement, so that prices are brought to the lowest attainable level. That could be ensured by promoting competition among different generic versions as well as negotiation of prices. Availability of good quality and cheaper generics would also contribute towards that goal. The realization of the fact that prices of medicines comprise mark-ups for (wholesale and retail) distribution, which are quite often arbitrarily set and vary substantially even within countries, could also lead to their rationalization.
4.2.7 Reliable medicine supply systems and low taxes
Medicine supply systems must serve to ensure continuous availability of essential medicines and medical supplies of good quality. Supply needs to be well planned and dependable in order to ensure availability, minimize shortages and stock-outs, and keep costs under control. Meeting increasing medicine demand and expectations requires cost-effective ways of financing and managing medicine supplies. It is not uncommon to have a confluence and co-involvement of public, private and NGO sectors in national medicine supply and distribution systems. National legislation and regulations should be in place for monitoring both imported and locally produced medicines that are available in the local market. Control is also needed over who prescribes and who dispenses and how is the quality of medicine supplies assured. Finally, tariffs and sales taxes (e.g. value added tax) on medicines should be kept at a minimum or removed as these are taxes on health and deter access.

53
The next world health report will be on health financing and will argue for universal coverage by extending health care services and financial risk protection to the vast majority of the global population, rich and poor.134 This paper highlighted financing issues (and some successes in dealing with them) concerning medicines, one of the key inputs of health care service provision and a crucial determinant of the household out-of-pocket spending.

54
Table-10
Options for financing medicines in developing countries
Financing mechanism Equity Efficiency
Access (Availability & affordability)
Financial sustainability
Appropriateness of care Political feasibility
General Taxation
Can be equitable
Depends on who pays taxes, who receives services and how progressive the tax system is
Offers little incentive for improvement(s)
Can increase access depending on budget allocation(s) & good management and type of coverage & cost-sharing arrangements
Depends on economic growth, the business cycle and government revenues
Requires good drug selection, management & control; prescription monitoring and follow up; active involvement in managing the drug benefit
May require new structures
Requires political willingness to advocate in favour of weaker socio-economic groups
Social Health Insurance (SHI)
Should be equitable (based on social solidarity)
Could be efficient if management is good, including provider relationships and contracts
Strong incentive for efficiency if care is “managed”
Can increase equity if drug benefit is part of insurance package and cost-sharing arrangements take into account ability to pay
Sustainable if there exist good management & collection mechanisms, and adequate premiums
Having a large share of the population in paid employment is beneficial and contributes to sustainability
Requires good drug selection, management & control; prescription monitoring and follow up; active involvement in managing the drug benefit
Can lead to inappropriate use depending on patient-provider relationship
Requires new administrative structures and the setting up of a Health Insurance Fund; contracts with providers
Insurance Fund often dependent on the government structures rather than being independent

55
Private Health Insurance (PHI)
In principle inequitable, because of the ability to pay principle and cream-skimming; although this is partly dependent on membership
Offers some incentive based on good management and provider contracts
Should be equitable if membership is conferred; significant affordability questions remain for those who cannot afford membership
Sustainability depends on good management, adequate revenues from premia and sufficient number of members; incentive to cream-skim
Same as in Social Health Insurance
Requires new administrative structures
Requires contracts with providers and a contracting culture
May attract criticism if it is the only option available
Medical Savings Accounts (MSA)
In principle equitable for all socio-economic groups, so long as there is catastrophic coverage if proceeds of MSA are exhausted
Strong incentive from MSA holder to select most suitable provider; avoids moral hazard, but requires good information, which is not always feasible
Access increases as pool of resources becomes available through MSA; affordability is guaranteed if catastrophic cover also exists
MSAs are financially sustainable, so long as individuals contribute to it regularly
May not work in non-monetised, rural settings
Can lead to inappropriate use depending on patient-provider relationship and high cost for MSA holder
Requires
operational framework for MSAs, which needs to be enforced
additional coverage provided by the state in case MSA proceeds are exhausted
Revolving Drug Funds (RDFs)
Can increase depending on supply management improvements
Success depends on supply management improvements
In principle can increase, only if exemptions or sliding fees are in place for the poor
Can increase, but requires good management and a reliable drug supply
Can encourage over-prescribing if revenue is used to fund staff salaries
Fees may discourage overuse or lead to underuse
If run by central government, they require some support and management structures
Politically feasible
Community Drug Schemes (CDS)
Can increase because local control and
Success depends on supply
In principle can increase, only if exemptions or
Can increase, but requires good management and
Can encourage over-prescribing if revenue is
Requires a framework enabling local authorities or communities to operate
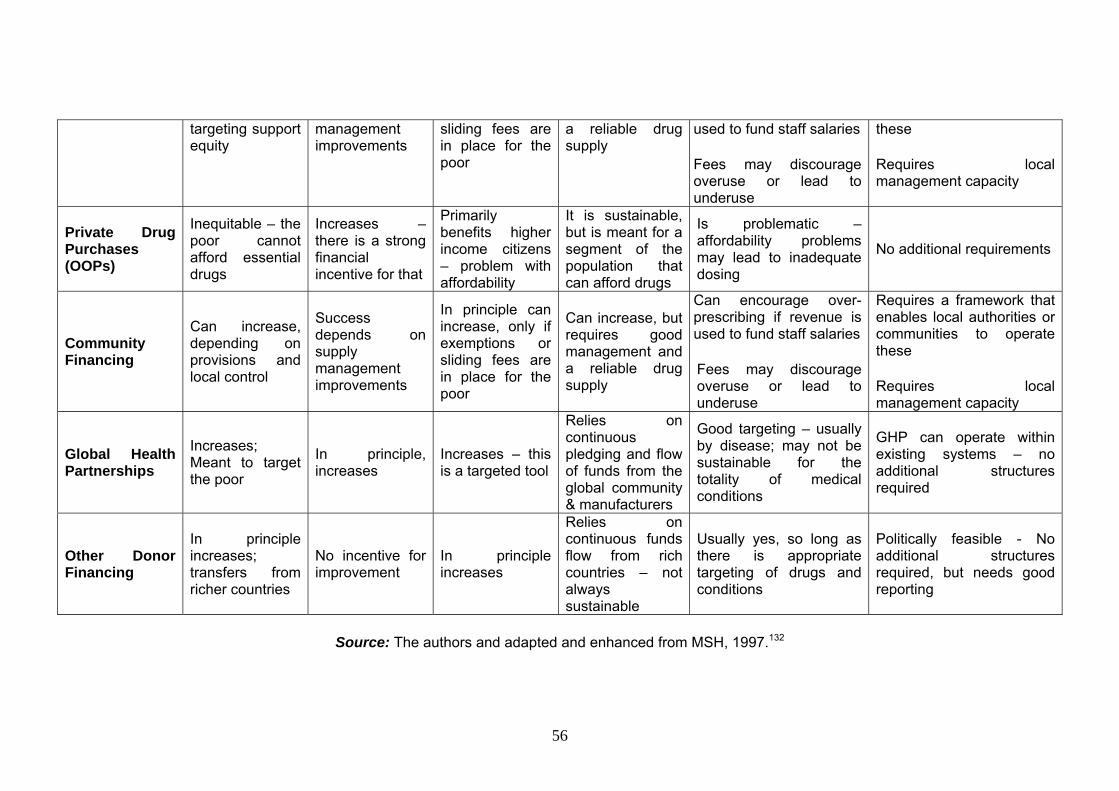
56
targeting support equity
management improvements
sliding fees are in place for the poor
a reliable drug supply
used to fund staff salaries
Fees may discourage overuse or lead to underuse
these
Requires local management capacity
Private Drug Purchases (OOPs)
Inequitable – the poor cannot afford essential drugs
Increases – there is a strong financial incentive for that
Primarily benefits higher income citizens – problem with affordability
It is sustainable, but is meant for a segment of the population that can afford drugs
Is problematic – affordability problems may lead to inadequate dosing
No additional requirements
Community Financing
Can increase, depending on provisions and local control
Success depends on supply management improvements
In principle can increase, only if exemptions or sliding fees are in place for the poor
Can increase, but requires good management and a reliable drug supply
Can encourage over-prescribing if revenue is used to fund staff salaries
Fees may discourage overuse or lead to underuse
Requires a framework that enables local authorities or communities to operate these
Requires local management capacity
Global Health Partnerships
Increases; Meant to target the poor
In principle, increases
Increases – this is a targeted tool
Relies on continuous pledging and flow of funds from the global community & manufacturers
Good targeting – usually by disease; may not be sustainable for the totality of medical conditions
GHP can operate within existing systems – no additional structures required
Other Donor Financing
In principle increases; transfers from richer countries
No incentive for improvement
In principle increases
Relies on continuous funds flow from rich countries – not always sustainable
Usually yes, so long as there is appropriate targeting of drugs and conditions
Politically feasible - No additional structures required, but needs good reporting
Source: The authors and adapted and enhanced from MSH, 1997.132

57
Reference
1. United Nations. MDG Gap Task Force Report 2008: Delivering on the Global Partnership for Achieving the Millennium Development Goals. New York: United Nations, 2008.
2. HAI. New UN report: Millennium development goal 8.E - Essential medicines: the high price of health. Amsterdam: Health Action International, 2008.
3. HAI. Medicine price, availability, affordability and price components. Geneva: Health Action International, 2008.
4. Lu Y, Hernandez P, Abegunde D, Tan Torres T. Medicine Expenditures. Chapter 16, in World Medicine Situación Report, 2010.
5. OECD. Pharmaceutical Pricing Policies in a Global Market, Paris: Organization for Economic Co-operation and Development (OECD), 2008.
6. UNESCAP. Financial and human resources for health. Statistical Yearbook for Asia and the Pacific. New York: United Nations, 2007.
7. Wamai RG. Reforming health systems: the role of NGOs in Decentralization – lessons from Kenya and Ethiopia. Boston, USA: Harvard School of Public Health, 2008.
8. Mubangizi P. Kenya medicine price monitor: July-August 2007. Geneva: Health Action International (HAI), 2007.
9. Mwabu G, Mwanzia J, Liambila W. User charges in government health facilities in Kenya: effect on attendance and revenue. Health Policy and Planning 1995;10(2):164-70.
10. McPake B, Hanson K, Mills A. Community financing of health care in Africa: an evaluation of the Bamako initiative. Social Science and Medicine 1993;36(11):1383-95.
11. Chabot J, Boal M, Da Silva A. National community health insurance at village level: the case from Guinea Bissau. Health Policy Plan. 1991;6(1):46-54.
12. Leive A, Xu K. Coping with out-of-pocket health payments: empirical evidence from 15 African countries. Bull World Health Organ 2008; 86 (11): 849-856.
13. O'Donnell O, van Doorslaer E, Rannan-Eliya RP, Somanathan A, Adhikari SR, Akkazieva B, et al. Who pays for health care in Asia? Journal of Health Economics 2008; 27(2): 460-75.
14. Xu K, Evans DB, Carrin G, Aguilar-Rivera AM, Musgrove P, Evans T. Protecting households from catastrophic health spending. Health Affairs (Millwood) 2007; 26(4): 972-83.
15. Wagstaff A, van Doorslaer E. Catastrophe and impoverishment in paying for health care: with applications to Vietnam 1993-1998. Health Econ 2003;12(11): 921-34.
16. Banerjee AV, Duflo E. The Economic Lives of the Poor. Journal of Economic Perspectives 2007;21(1):141-167.
17. McIntyre D, Thiede M, Dahlgren G, Whitehead M. What are the economic consequences for households of illness and of paying for health care in low- and middle-income country contexts? Social Science and Medicine 2006; 62(4): 858-65.

58
18. Peters DH, Garg A, Bloom G, Walker DG, Brieger WR, Rahman MH. Poverty and access to health care in developing countries. Ann N Y Acad Sci 2008;1136:161-71.
19. Russell S. Ability to pay for health care: concepts and evidence. Health Policy and Planning 1996; 11(3): 219-37.
20. Cameron A, Ewen M, Ross-Degnan D, Ball D, Laing R. Medicine prices, availability, and affordability in 36 developing and middle-income countries: a secondary analysis. Lancet 2009; 373(9659): 240-9.
21. WHO. WHO medicines strategy - Countries at the core - 2004 - 2007. Geneva: World Health Organization 2004.
22. Xu K, Klavus J, Aguilar-Rivera AM, Carrin G, Zeramdini R, Murray CJL. Summary measures of the distribution of household financial contributions to health. In: Murray CJL, Evans DB, editors. Health Systems Performance Assessment: Debates, Methods and Empiricism. Geneva: World Health Organization, 2003.
23. Xu K, Klavus J, Evans DB, Hanvoravongchai P, Zeramdini R, Murray CJL. The impact of vertical and horizontal inequality on the fairness in financial contribution index. In: Murray CJL, Evans DB, editors. Health Systems Performance Assessment: Debates, Methods and Empiricism. Geneva: World Health Organization, 2003.
24. Garg CC, Karan AK. Reducing out-of-pocket expenditures to reduce poverty: a disaggregated analysis at rural-urban and state level in India. Health Policy and Plannig 2009; 24(2): 116-28.
25. Kiani A, Qadeer A, Tisocki K, Mirza Z, Mustafa T. Prices, availability and affordability of medicines in Pakistan. Geneva: Health Action International (HAI), 2006.
26. Andrews E. Medicine prices in Ghana: A comparative study of public, private and mission sector medicine prices. Geneva: Health Action International (HAI), 2004.
27. Ensor T. Informal payments for health care in transition economies. Social Science and Medicine 2004; 58(2): 237-46.
28. Lewis M. Informal payments and the financing of health care in developing and transition countries. Health Affairs (Millwood) 2007; 26(4): 984-97.
29. Balabanova D, McKee M. Understanding informal payments for health care: the example of Bulgaria. Health Policy 2002; 62(3): 243-73.
30. Liaropoulos L, Siskou O, Kaitelidou D, Theodorou M, Katostaras T. Informal payments in public hospitals in Greece. Health Policy 2008; 87(1): 72-81.
31. Tatar M, Ozgen H, Sahin B, Belli P, Berman P. Informal payments in the health sector: a case study from Turkey. Health Affairs (Millwood) 2007; 26(4): 1029-39.
32. Mills AE, Spencer EM. Organization ethics or compliance: which will articulate values for the United States' healthcare system? HEC Forum 2001; 13(4): 329-43.
33. Mendis S, Fukino K, Cameron A, Laing R, Filipe A, Jr., Khatib O, et al. The availability and affordability of selected essential medicines for chronic

59
diseases in six low- and middle-income countries. Bulletin of the World Health Organization 2007; 85(4): 279-88.
34. Sekhri N, Savedoff W. Private health insurance: implications for developing countries. Bulletin of the World Health Organization 2005; 83(2): 127-34.
35. van de Ven WP, Beck K, Buchner F, Chernichovsky D, Gardiol L, Holly A, et al. Risk adjustment and risk selection on the sickness fund insurance market in five European countries. Health Policy 2003;65(1):75-98.
36. Whitehead M, Dahlgren G, Evans T. Equity and health sector reforms: can low-income countries escape the medical poverty trap? Lancet 2001;358(9284):833-6.
37. Hotchkiss DR, Rous JJ, Karmacharya K, Sangraula P. Household health expenditures in Nepal: implications for health care financing reform. Health Policy and Planning 1998; 13(4): 371-83.
38. Reich MR. The politics of health sector reform in developing countries: three cases of pharmaceutical policy. Health Policy 1995; 32(1-3): 47-77.
39. Skarbinski J, Walker HK, Baker LC, Kobaladze A, Kirtava Z, Raffin TA. The burden of out-of-pocket payments for health care in Tbilisi, Republic of Georgia. Journal of American Medical Association 2002; 287(8): 1043-9.
40. Vőrk A, Saluse J, Habicht J. Income-related inequality in health care financing and utilization in Estonia 2000-2007. Health Financing Technical Paper: WHO Regional Office for Europe, 2009.
41. Goodman C, Kachur SP, Abdulla S, Bloland P, Mills A. Drug shop regulation and malaria treatment in Tanzania--why do shops break the rules, and does it matter? Health Policy and Planning 2007; 22(6): 393-403.
42. Sooksriwong C-o, Yoongthong W. Thailand - Medicine prices, availability, affordability & price components. Geneva: Health Action International (HAI), 2006.
43. Al-Qubati YA, Ahmed A-KS. Medicine prices in Yemen: A survey report on medicine: availability, prices and affordability. Geneva: Health Action International (HAI), 2007.
44. Bader R. Medicine prices, availability and affordability in Jordan: Report of a survey conducted in 2004 in Amman, Irbid, Zarqa and Karak using the WHO/HAI price measurement methodology. Geneva: Health Action International (HAI), 2007.
45. Batangan DB, Echavez. C, Santiago AA, Cruz ACdl. The prices people have to pay for medicines in the Philippines. Geneva: Health Action International (HAI), 2006.
46. Benammar R, Agoumi A, Amamou A, Hachlaf A, Belhaj K, et al. Enquête sur les Prix des Médicaments: Maroc. Geneva: Health Action International (HAI), 2004.
47. Godwin SK, Varatharajan D. Drug price differentials across different retail market settings: an analysis of retail prices of 12 commonly used drugs. Health Administrator 2007; 19(1): 41-47.
48. Chokshi M, Weeasurija K, Nicod E, Kanavos P. Tamil Nadu Public Drug Procurement Model. Bulletin of the World Health Organization, 2009, under review.

60
49. Kotwani A, Ewen M, Dey D, Iyer S, Lakshmi PK, Patel A, et al. Prices & availability of common medicines at six sites in India using a standard methodology. Indian Journal of Medical Research 2007;125(5): 645-54.
50. Selvaraj S. How effective is India's drug price control regime? Boston, USA: Harvard School of Public Health, 2007.
51. Duggal R. Poverty & health: criticality of public financing. Indian Journal of Medical Research 2007;126(4):309-17.
52. Lu YE. A survey of medicine prices, availability and affordability in Shanghai, China using the WHO/HAI methodology: Research report. Geneva: Health Action International (HAI), 2006.
53. Qiang S. A survey of medicine prices, availability, affordability and price components in Shandong province, China. Geneva: Health Action International (HAI), 2005.
54. WHO. WHO Medicines. Geneva: World Health Organization 2009. 55. WHO. Essential Drugs and Medicines Policy. Manila: World Health
Organization, Western Pacific Region, 2008. 56. WHO. Technical discussion on medicine prices and access to medicines in
the eastern Mediterranean region. Geneva: World Health Organization, Regional committee for the eastern Mediterranean region - Fifty-fourth session, 2007.
57. WHO. Guidelines for drug donations: Interagency guidelines - 2nd edition. Geneva: World Health Organization 1999.
58. WHO. Counterfeit drugs: guidelines for the development of measures to combat counterfeit drugs. Geneva: World Health Organization 1999.
59. WHO. National drug regulatory legislation: guiding principles for small drug regulatory authorities. WHO Technical Report Series Annex. Geneva: World Health Organization 1999.
60. WHO. Health reform and drug financing. Geneva: World Health Organization. Health Economics and Drugs EDM Series, 1998.
61. WHO. Financing drugs in south-east Asia. Geneva: World Health Organization, Health economics and drugs DAP series,1997.
62. Government of Pakistan. DRUG Act. 1976. Islamabad: Ministry of Health. http://www.dcomoh.gov.pk/regulations/drugact1976.php (Accessed on 26th February 2010).
63. Karymbaeva S. Medicine prices, availability, affordability and price components in Kyrgystan: Report of a survey undertaken February to May 2005. Geneva: Health Action International (HAI), 2005.
64. Ansah EK, Narh-Bana S, Asiamah S, Dzordzordzi V, Biantey K, Dickson K, et al. Effect of removing direct payment for health care on utilisation and health outcomes in Ghanaian children: a randomised controlled trial. PLoS Med 2009;6(1).
65. Onwujekwe O, Dike N, Chukwuka C, Uzochukwu B, Onyedum C, Onoka C, et al. Examining catastrophic costs and benefit incidence of subsidized antiretroviral treatment (ART) programme in south-east Nigeria. Health Policy 2008.
61
66. Onwujekwe O, Ojukwu J, Shu E, Uzochukwu B. Inequities in valuation of benefits, choice of drugs, and mode of payment for malaria treatment services provided by community health workers in Nigeria. American Journal of Tropical Medicine and Hygiene 2007; 77(1): 16-21.
67. Auton M, Adegoke C. Medicine prices in Nigeria: Prices people pay for medicines. Geneva: Health Action International (HAI), 2005.
68. Uzochukwu BS, Onwujekwe OE, Akpala CO. Effect of the Bamako-Initiative drug revolving fund on availability and rational use of essential drugs in primary health care facilities in south-east Nigeria. Health Policy and Planning 2002;17(4):378-83.
69. Mubangizi P, Martin OO. Uganda medicine price monitor: Oct-Dec 2006. Geneva: Health Action International (HAI), 2007.
70. Mouala C, Abeye J, Somse P, Maritoux J, Goumba A. Prescribing and dispensing generic drugs in the Mambere-Kadei health district of the Central African Republic. Med Trop (Mars) 2008; 68(2): 149-54.
71. Bertoldi AD, de Barros AJ, Wagner A, Ross-Degnan D, Hallal PC. Medicine access and utilization in a population covered by primary health care in Brazil. Health Policy 2009; 89(3): 295-302.
72. Weiyuan C. China's village doctors take great strides. Bulletin of the World Health Organization 2008; 86(12): 914-5.
73. Tang S, Meng Q, Chen L, Bekedam H, Evans T, Whitehead M. Tackling the challenges to health equity in China. Lancet 2008; 372(9648): 1493-501.
74. Khabriev RU, Kanavos PG, Telnova EA, Gildeeva GN. Improving access to medicines in the Russian Federation: The programme for supplementary pharmaceutical provision. Eurohealth, 12(4), 2006.
75. Wagstaff A, Claeson M. The Millennium Development Goals for Health: Rising to the Challenges. Washington, DC: World Bank, 2004.
76. Barr N. Economics of the Welfare State. 4th ed: Oxford University Press, 2004.
77. Carrin G, Waelkens MP, Criel B. Community-based health insurance in developing countries: a study of its contribution to the performance of health financing systems. Trop Med Int Health 2005;10(8):799-811.
78. Grant K, Grant R. Health insurance and the poor in low income countries. World Hosp Health Serv 2003;39(1):19-22.
79. Carrin G. Social health insurance in developing countries: A continuing challenge. International Social Security Review 2002; 55: 57-69.
80. Dumoulin J, Kaddar M, Velasquez G. Guide to drug financing mechanisms. Geneva: World Health Organisation, 1998.
81. Abel-Smith B. Health insurance in developing countries: lessons from experience. Health Policy Plan 1992;7(3):215-26.
82. Abel-Smith B, Dua A. Community-financing in developing countries: the potential for the health sector. Health Policy Plan 1988;3(2):95-108.
83. Pauly MV, Zweifel P, Scheffler RM, Preker AS, Bassett M. Private Health Insurance In Developing Countries. Health Aff 2006;25(2):369-379.

62
84. Santoso B, Shein K, Suryawati S. Financing drugs in South-East Asia. New Delhi: WHO South East Asian Regional Office, Health Economics and Drugs DAP Series No. 8, 1998:72.
85. Varatharajan D, MuralikannanM, Gopalan SS, Jayalakshmi C, Sr. Agnes Clare CSST, Shivalingiah M, Sarma PS. Lessons learned from a community-based medisave experiment among rural women in the Indian state of Karnataka. Geneva: World Health Organization, Department of Health Systems Financing, Discussion Paper No. 6, 2009.
86. Thomson S, Mossialos E. Medical savings accounts: can they improve health systemperformance in Europe? Euro Observer 2008;10(4):1-4.
87. Thomson S, Mossialos E. Regulating private health insurance in the European Union: the implications of single market legislation and competition policy. Journal of European Integration 2007; 29(1): 89-107.
88. Mossialos E, Thomson S (Ed.) Voluntary health insurance in the European Union. Copenhagen: World Health Organization, 2004.
89. Hsiao WC. Behind the ideology and theory: what is the empirical evidence for medical savings accounts? J Health Polit Policy Law 2001;26(4):733-7.
90. Hoffman C, Tolbert J. Health Savings Accounts and High Deductible Health Plans: Are They An Option for Low-Income Families? Kaiser Commission on Medicaid and the Uninsured, Kaiser Family Foundation (KFF), 2006.
91. Hsiao WC. Unmet Health Needs of Two Billion: Is Community Financing a Solution? In: Preker AS, editor. Health, Nutrition and Population (HNP) Discussion Paper. Washington, DC: The International Bank for Reconstruction and Development / The World Bank, 2001:50.
92. Gertler P, Levine DI, Moretti E. Do microfinance programs help families insure consumption against illness? Health Econ 2009;18(3):257-73.
93. Jacobs B, Bigdeli M, Pelt MV, P I, C S, B C. Bridging community-based health insurance and social protection for health care - a step in the direction of universal coverage? Tropical Medicine and International Health 2008;13(2):140-43.
94. McCord MJ. Health care microinsurance - case studies from Uganda, Tanzania, India and Cambodia. Small Enterprise Development 2001;12:25-38.
95. Dror DM, Jacquier C. Micro-insurance: Extending Health Insurance to the Excluded. International Social Security Review 1999; 52: 71-97.
96. Sauerborn R, Adams A, Hien M. Household strategies to cope with the economic costs of illness. Soc Sci Med 1996; 43(3): 291-301.
97. Gemmill MC, Thomson S, Mossialos E. What impact do prescription drug charges have on efficiency and equity? Evidence from high-income countries. International Journal of Equity in Health 2008;7:12.
98. Gemmill-Toyama M, Costa-Font J, Kanavos P. Does Cost Sharing Affect the Quality of Pharmaceutical Care for the Elderly? London: London School of Economics and Political Science, LSE Health, Health Econometrics and Data Group (HEDG) Working Paper 09/04, 2009.

63
99. Li X, Guh D, Lacaille D, Esdaile J, Anis AH. The impact of cost sharing of prescription drug expenditures on health care utilization by the elderly: own- and cross-price elasticities. Health Policy 2007; 82(3): 340-7.
100. Motheral B, Fairman KA. Effect of a three-tier prescription copay on pharmaceutical and other medical utilization. Med Care 2001; 39(12): 1293-304.
101. Stuart B, Grana J. Are prescribed and over-the-counter medicines economic substitutes? A study of the effects of health insurance on medicine choices by the elderly. Med Care 1995; 33(5): 487-501.
102. Cox ER, Jernigan C, Coons SJ, Draugalis JL. Medicare beneficiaries' management of capped prescription benefits. Med Care 2001; 39(3): 296-301.
103. O'Brien B. The effect of patient charges on the utilization of prescription medicines. Journal of Health Economics 1989; 8(1): 109-32.
104. Ryan M, Birch S. Charging for health care: evidence on the utilization of NHS prescribed drugs. Social Science and Medicine 1991; 33(6): 681-7.
105. Landsman PB, Yu W, Liu X, Teutsch SM, Berger ML. Impact of 3-tier pharmacy benefit design and increased consumer cost-sharing on drug utilization. Am J Manag Care 2005; 11(10): 621-8.
106. Tamblyn R, Laprise R, Hanley JA, Abrahamowicz M, Scott S, Mayo N, et al. Adverse events associated with prescription drug cost-sharing among poor and elderly persons. JAMA 2001; 285(4): 421-9.
107. Poirier S LJ, Page V, Lacour A. The effect of a $2 co-payment on prescription refill rates of Quebec elderly and its relationship to socio-economic status. Canadian Pharmaceutical Journal 1991;131(1): 30-34.
108. Nabyonga-Orem J, Karamagi H, Atuyambe L, Bagenda F, Okuonzi SA, Walker O. Maintaining quality of health services after abolition of user fees: a Uganda case study. BMC Health Serv Res 2008;8:102.
109. Kanji N. Charging for drugs in Africa: UNICEF'S 'Bamako Initiative'. Health Policy and Planning 1989; 4(2): 110-120.
110. Ali GKM. How to establish a successful revolving drug fund: the experience of Khartoum state in the Sudan. Bulletin of the World Health Organization 2009; 87: 139-142.
111. Witter S. Achieving sustainability, quality and access: lessons from the world's largest revolving drug fund in Khartoum. East Mediterr Health J 2007; 13(6): 1476-85.
112. Murakami H, Phommasack B, Oula R, Sinxomphou S. Revolving drug funds at front-line health facilities in Vientiane, Lao PDR. Health Policy Plan 2001; 16(1): 98-106.
113. Umenai T, Narula IS. Revolving drug funds: a step towards health security. Bulletin of the World Health Organization 1999; 77(2): 167-71.
114. Uzochukwu B, Onwujekwe O. Healthcare reform involving the introduction of user fees and drug revolving funds: influence on health workers' behaviour in southeast Nigeria. Health Policy 2005;75(1):1-8.

64
115. Ali GKM. How to establish a successful revolving drug fund: the experience of Khartoum state in the Sudan. Bulletin of the World Health Organization 2009;87:139-142.
116. Uzochukwu BSC, Onwujekwe OE, Akpala CO. Effect of the Bamako-Initiative drug revolving fund on availability and rational use of essential drugs in primary health care facilities in south-east Nigeria. Health Policy Plan 2002; 17:378-383.
117. Nickson P. Community-Determined Health Development in Zaire. In: Rohde J, Chatterjee M, Morley D, editors. Reaching Health For All. Delhi: Oxford University Press, 1993: 44-61.
118. Yang BM. Achieving social insurance: what one can learn from the Asian experiences. Boston, USA: Harvard School of Public Health, 2007.
119. Hardeman W, Van Damme W, Van Pelt M, Por I, Kimvan H, Meessen B. Access to health care for all? User fees plus a Health Equity Fund in Sotnikum, Cambodia. Health Policy Plan 2004;19(1):22-32.
120. Diskett P, Nickson P. Financing Primary Health Care: An NGO Perspective. Development in Practice, Taylor & Francis, Ltd. on behalf of Oxfam GB 1991:43-51.
121. Ford N, Wilson D, Costa Chaves G, Lotrowska M, Kijtiwatchakul K. Sustaining access to antiretroviral therapy in the less-developed world: lessons from Brazil and Thailand. Aids 2007; 21 Suppl 4: S21-9.
122. Milovanovic DR, Pavlovic R, Folic M, Jankovic SM. Public drug procurement: the lessons from a drug tender in a teaching hospital of a transition country. Eur J Clin Pharmacol 2004; 60(3): 149-53.
123. Hartog R. Essential and non-essential drugs marketed by the 20 largest European pharmaceutical companies in developing countries. Social Science and Medicine 1993; 37(7): 897-904.
124. Beran D, Ariane M, JS Y. Access to medicines versus access to treatment: the case of type 1 diabetes Bulletin of the World Health Organization 2008; 86(8): 648-49.
125. Burapadaja S, Kawasaki N, Charumanee S, Ogata F. Effects of essential medicines on cardiovascular products available for the market in Thailand. Health Policy 2007; 84(1): 67-74.
126. Attaran A. How do patents and economic policies affect access to essential medicines in developing countries? Health Affairs (Millwood) 2004; 23(3): 155-66.
127. Boulet P, Garrison C, Hoen Et. Drug Patents Under the Spotlight, Sharing practical knowledge about pharmaceutical patents. In: Hakoköngäs L, editor. Geneva: WHO, Médecins Sans Frontières, Campaign for Access to Essential Medicines, 2003:40.
128. Donahue JM, McGuire MB. The political economy of responsibility in health and illness. Social Science and Medicine 1995; 40(1): 47-53.
129. OECS. Organization for Eastern Caribbean States, 2009. http://oecs.org (Accessed on 26th February 2010).
130. Senthil Arasi D. Managing drug delivery to PHCs: An appraisal of Tamil Nadu Model. Thiruvananthapuram: Sree Chitra Tirunal Institute for Medical

65
Sciences and Technology, Achutha Menon Centre for Health Sciences Studies, MPH Dissertation, 2004.
131. Mehreen AA. Getting health to rural communities in Bangladesh. Bulletin of the World Health Organization 2008;86(2):85-6.
132. Management Sciences for Health (MSH). Managing Drug Supply: The selection, procurement, distribution and use of pharmaceuticals, MSH and WHO, 1997 Kumarian Press.
133. Ngoasong MZ. The emergence of global health partnerships as facilitators of access to medication in Africa: a narrative policy analysis. Social Science and Medicine 2009; 68(5): 949-56.
134. Evans DB, Etienne C. Health systems financing and the path to universal coverage. Bulletin of the World Health Organization 2010; 88(6): 402 (Editorial).