Embed Size (px)
Citation preview
OptiOns fOr lOw-emissiOn develOpment in the KenYA dAirY sectOr Reducing enteric methane for food security and livelihoods

Published by
the Food and Agriculture Organization of the United Nations
and
the New Zealand Agricultural Greenhouse Gas Research Centre
Rome, 2017
OptiOns fOr lOw-emissiOn develOpment in the KenYA dAirY sectOr Reducing enteric methane for food security and livelihoods
The designations employed and the presentation of material in this information product do not imply the expression of any opinion whatsoever on the part of the Food and Agriculture Organization of the United Nations (FAO) or New Zealand Agricultural Greenhouse Gas Research Centre (NZAGRC) concerning the legal or development status of any country, territory, city or area or of its authorities, or concerning the delimitation of its frontiers or boundaries. The mention of specific companies or products of manufacturers, whether or not these have been patented, does not imply that these have been endorsed or recommended by FAO or NZAGRC in preference to others of a similar nature that are not mentioned. The views expressed in this information product are those of the author(s) and do not necessarily reflect the views or policies of FAO or NZAGRC.
ISBN 978-92-5-109878-3
FAO encourages the use, reproduction and dissemination of material in this information product. Except where otherwise indicated, material may be copied, downloaded and printed for private study, research and teaching purposes, or for use in non-commercial products or services, provided that appropriate acknowledgement of FAO as the source and copyright holder is given and that FAO’s endorsement of users’ views, products or services is not implied in any way.
All requests for translation and adaptation rights, and for resale and other commercial use rights should be made via www.fao.org/contact-us/licence-request or addressed to [email protected].
FAO information products are available on the FAO website (www.fao.org/publications) and can be purchased through [email protected]
© FAO, 2017
Recommended citation:FAO & New Zealand Agricultural Greenhouse Gas Research Centre. 2017. Options for low emission development in the Kenya dairy sector - reducing enteric methane for food security and livelihoods. Rome. 43 pp.
iii
Acknowledgements iv
Executive summary v
Chapter 1GReeN GROwth OptiONs FOR the dAiRy seCtOR 1
Chapter 2OBJeCtiVes ANd AppROACh 4
Chapter 3OVeRView OF dAiRy pROdUCtiON 8 Chapter 4eMissiONs ANd eMissiON iNteNsities 13 Chapter 5eXpLORiNG the MitiGAtiON pOteNtiAL iN dAiRy CAttLe pROdUCtiON 18
Chapter 6pRiORitiZAtiON OF iNteRVeNtiONs tO AddRess eNteRiC MethANe 25
Chapter 7UN-LOCKiNG the pOteNtiAL OF ‘NO ReGRets’ OppORtUNities 29
Chapter 8Key MessAGes ANd pOLiCy CONCLUsiONs 31
Contents
iv
Acknowledgements
This document is a product of the collaborative
effort between the State Department of Livestock in
the Ministry of Agriculture, Livestock and Fisheries,
the Food and Agriculture Organization of the
United Nations (FAO); the New Zealand Agricultural
Greenhouse Gas Research Center (NZAGRC) and the
Climate and Clean Air Coalition (CCAC).
This project was led by a national core team
comprising of Robin Mbae (State Department of
Livestock); Ben Lukuyu (the International Livestock
Research Institute - ILRI), Faith Wakibia, Josephine
Kirui (ICRAF), Suzanne van Dijk (Unique Forestry and
Land use), Patrick Ongadi (ILRI), David Ngunga (ILRI),
and Prof. Charles Gachuiri (University of Nairobi).
Overall project implementation, guidance and
support has been provided by the Project Team
including Carolyn Opio (FAO), Henning Steinfeld
(FAO), Pierre Gerber (FAO), Harinder Makkar (FAO),
Harry Clark (New Zealand Agricultural Greenhouse
Gas Research Centre - NZAGRC), and Victoria
Hatton (New Zealand Agricultural Greenhouse Gas
Research Centre – NZAGRC). Alessandra Falcucci
(FAO), Monica Rulli (FAO) and Juliana Lopes (FAO)
provided input in the research, modelling and
analytical work.
This report has been written by Carolyn Opio
(FAO), Harry Clark (NZAGRC), Pierre Gerber (FAO)
and Henning Steinfeld (FAO).
Finally, special thanks to the Climate and Clean
Air Coalition (CCAC), the New Zealand Government
and Food and Agriculture Organization of the
United Nations for the funding support.
v
Executive summary
This study evaluates the potential for improving milk
production while reducing enteric methane emission
intensity from dairy production in Kenya. The
overall objective of this study is to support Kenya in
identifying low-cost strategies to reduce enteric CH4
emissions while contributing to the country short-
to long-term social and economic development and
increasing resilience to climate change.
Kenya has taken steps to chart a path towards
achieving food security and other developmental
goals. The Government of Kenya has developed a
number of high level policy initiatives, including
Vision 2030 which is the overarching policy document
setting out development objectives. The Kenya
Vision 2030 is the national long-term development
policy that aims to transform Kenya into a newly
industrializing, middle-income country providing a
high quality of life to all its citizens by 2030 in a clean
and secure environment.
The agriculture sector has been identified as one
of the key sectors to contribute to the projected
annual national economic growth. The sector is
envisaged to ensure food security, provision of raw
materials for agro-industries, creation of employment
opportunities, generation of income and foreign
exchange earnings. The sector is however the most
vulnerable to the impacts of climate change and
extreme weather events. Due to these challenges,
the government recognizes the need to develop
interventions that make agriculture more resilient
to climate change and extreme weather events
while minimizing its contribution to greenhouse gas
emissions.
In 2010, the Government developed the National
Climate Change Response Strategy to propose a cross-
governmental strategy to respond to climate change
challenges. Kenya has recognized the importance
of green growth for achieving its Vision 2030 goals
and also as an element of the implementation of
the Kenya Constitution 2010 that, under the ‘Bill of
Rights’, guarantees every citizen a clean and healthy
environment. In 2013 Kenya launched the National
Climate Change Action Plan which provides a vision
for low carbon and climate resilient development
pathway.
Benefits of moving to a climate-resilient and low-carbon growth pathway for the dairy sectorWith this in mind, Kenya in its Intended Nationally
Determined Contributions (INDC) has put forth
adaptation and mitigation actions to tackle its
growing emissions and to play a role in global
efforts to limit temperature rise to 2 degrees. These
mitigation actions will play a key role in realizing the
transition to a low-carbon, climate-resilient economy.
Adopting a low-carbon growth pathway for the
dairy sector could benefit Kenya in several ways:
• The dairy industry is Kenya’s single largest
agricultural sub-sector in Kenya. It contributes
14 percent to agricultural Gross Domestic
Product (GDP) and 3.5 percent of total GDP. The
sector currently contributes to the livelihoods
of many smallholders through generation of
income, employment and food to 2 million people
across the dairy value chain. Milk production in
Kenya is predominantly managed by small scale
farmers, who own one to three dairy animals,
and produce about 70 percent of the milk in the
country. Smallholders engaged in milk production
represent about 35 percent of rural households
and 26 percent of total households in Kenya.
Amongst these dairy farmers are some of the
poorest and most marginalized such as women.
Considering the importance of the dairy sector
to rural livelihoods and its potential role in
poverty reduction, implementing a low-emissions
development strategy for the dairy sector
through the adoption of performance-enhancing
technologies and use of incentives is expected to
OptiOns fOr lOw emissiOn develOpment in the KenYA dAirY sectOr
Vi
significantly increase milk yields with net benefits
in the short-to-medium term.
• Dairying represents one of the fastest returns for
dairy farmers in the developing world. It provides
milk for home consumption, regular cash flow
from milk sales to farmers, especially to women,
enhances household nutrition and food security
and creates off-farm employment. In Kenya, dairy
animals are one of the most valuable assets for
rural households playing many functions such as
traction, nutrient value and risk management.
• The Kenyan Dairy Master Plan has set a target to
increase per capita consumption of milk to 220 kg
per person by 2030. Current consumption of milk
and milk products in Kenya is 115 kg per person;
89 liters below the recommended amount from
the World Health Organization (WHO). Kenya milk
consumption levels are among the highest in the
developing world. Kenya’s population is expected
to increase from the current 48 million to 65
million in 2030, of which more than one-third will
be urban residents. With this future population
scenario, per capita milk consumption is projected
to grow rapidly.
• The current productivity of dairy animals in
general is low, which results in a shortage of
supply of dairy products. For example, on average,
milk yields range from almost 2 litres per cow
per day in extensive to 12 litres per cow per
day in intensive systems. Seasonal fluctuation of
production – the yield per cow and by extension
the total amount of milk produced fluctuates
greatly during the year. Milk yields are low and
largely variable mainly because of poor and limited
feed resources, disease and poor management.
Milk yields remain low even in semi-intensive and
intensive systems that keep high yielding exotic
breed and cross-breeds. These animals cannot
reach their full genetic potential if factors in their
environment are limiting. Currently, a wide range
in average milk yields exists, which reflects the
variation in genetic potential and the variation
in environment, which is altered by management
practices.
• About 75 percent of the population depends
directly on land and natural resources for their
livelihoods, the impact of climate change and
related disasters on land and natural resources has
the potential to severely affect many people, and
the economic growth of the country. On average,
every seven years Kenya experiences a flood that
costs about 5.5 percent of GDP (USD 0.5 billion),
and every five years experiences a drought that
costs about 8 percent of GDP (USD 0.8 billion).
Extreme flood and drought events are estimated
to reduce long-term growth in Kenya by about 2.4
percent of GDP per annum1.
Emissions and emission intensities from the dairy production The national dairy population is estimated to be
4.3 million dairy cattle producing 3.4 billion litres
of milk. The semi-intensive dairy cattle production
system produces the largest share of milk production,
contributing 44 percent of total milk supply from
cattle. While the extensive and intensive systems
contribute 22 percent and 24 percent, respectively.
The dairy cattle sector in Kenya is responsible for
about 12.3 million tonnes CO2 eq. The GHG profile is
dominated by methane (95.6 percent); nitrous oxide
(N2O) and carbon dioxide (CO2) contribute 3.4 percent
and 1 percent of the total emissions, respectively.
At national level, the emission intensity of milk
produced in Kenya is on average 3.8 kg CO2 eq./
kg FPCM; the highest values were estimated for
extensive grazing systems and the lowest in semi-
intensive systems. Emissions were on average, 7.1,
2.1, and 4.1 kg CO2 eq./kg FPCM for extensive,
intensive, and semi-intensive systems, respectively.
Options for improving productivity and reducing enteric methane per unit of outputImproving animal and herd productivity is one of the
key pathways to reduce enteric CH4 emissions per
unit of product. Methane is produced in the process
of feed energy utilization by the animal. Changes in
the efficiency of feed energy utilization therefore
influence enteric methane emissions of animals. The
4 The economic impacts of climate change. https://www.weadapt.org/sites/weadapt.org/files/legacy-new/knowledge-base/files/4e25a04e8c9d92-economics-of-climate-change-in-kenya-factsheet.pdf
OptiOns fOr lOw emissiOn develOpment in the KenYA dAirY sectOr
Vii
efficiency of feed energy utilization depends on the
type of animal, the type or quality and quantity of
feed, environmental conditions, etc. The way feed
energy is partitioned between the different body
functions (maintenance and production) also explains
the variation in emission intensity.
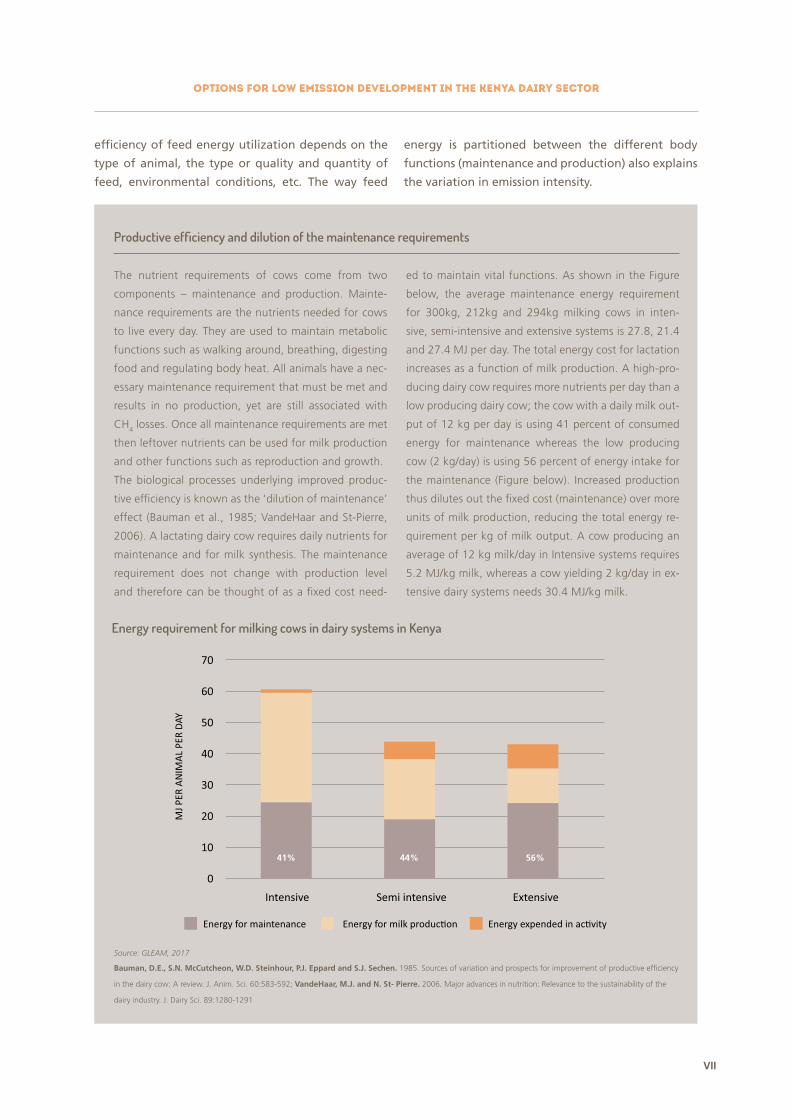
Productive efficiency and dilution of the maintenance requirements
The nutrient requirements of cows come from two
components – maintenance and production. Mainte-
nance requirements are the nutrients needed for cows
to live every day. They are used to maintain metabolic
functions such as walking around, breathing, digesting
food and regulating body heat. All animals have a nec-
essary maintenance requirement that must be met and
results in no production, yet are still associated with
CH4 losses. Once all maintenance requirements are met
then leftover nutrients can be used for milk production
and other functions such as reproduction and growth.
The biological processes underlying improved produc-
tive efficiency is known as the ‘dilution of maintenance’
effect (Bauman et al., 1985; VandeHaar and St-Pierre,
2006). A lactating dairy cow requires daily nutrients for
maintenance and for milk synthesis. The maintenance
requirement does not change with production level
and therefore can be thought of as a fixed cost need-
ed to maintain vital functions. As shown in the Figure
below, the average maintenance energy requirement
for 300kg, 212kg and 294kg milking cows in inten-
sive, semi-intensive and extensive systems is 27.8, 21.4
and 27.4 MJ per day. The total energy cost for lactation
increases as a function of milk production. A high-pro-
ducing dairy cow requires more nutrients per day than a
low producing dairy cow; the cow with a daily milk out-
put of 12 kg per day is using 41 percent of consumed
energy for maintenance whereas the low producing
cow (2 kg/day) is using 56 percent of energy intake for
the maintenance (Figure below). Increased production
thus dilutes out the fixed cost (maintenance) over more
units of milk production, reducing the total energy re-
quirement per kg of milk output. A cow producing an
average of 12 kg milk/day in Intensive systems requires
5.2 MJ/kg milk, whereas a cow yielding 2 kg/day in ex-
tensive dairy systems needs 30.4 MJ/kg milk.
Energy requirement for milking cows in dairy systems in Kenya
Source: GLEAM, 2017
Bauman, d.e., s.N. McCutcheon, w.d. steinhour, p.J. eppard and s.J. sechen. 1985. Sources of variation and prospects for improvement of productive efficiency
in the dairy cow: A review. J. Anim. Sci. 60:583-592; Vandehaar, M.J. and N. st- pierre. 2006. Major advances in nutrition: Relevance to the sustainability of the
dairy industry. J. Dairy Sci. 89:1280-1291
44%41% 56%
OptiOns fOr lOw emissiOn develOpment in the KenYA dAirY sectOr
Viii
Research shows that there are several technologies
that if comprehensively applied throughout the
sector can make a rapid and important contribution
to improving the technical performance and
profitability of dairy production while reducing GHG
emissions. Improved practices and technologies such
as strategic supplementary feeding, and improving
the diet quality, adequate animal health control, and
improved animal husbandry practices are some of the
techniques that can improve dairy productivity and
reduce emission intensity.
In the assessment of technical options for the
main dairy cattle production systems, the following
criteria were used:
• Interventions had to have potential for improving
productivity while at the same time reducing
enteric CH4 emissions per unit of output.
• Interventions had to be feasible in the short or
medium term. Feasibility was first determined by
sectoral experts and selected interventions had to
have already been implemented or in use at least
at farm level in Kenya.
A team of national experts identified key areas to
address low productivity in dairy systems including: (i)
improving the quality and availability of feed resources;
(ii) strategic feeding and supplementation to address
the feed seasonality constraints; and (iii) improved
genetics and animal health interventions. Within
this broad categorization, 10 single interventions
and 1 ‘package’ consisting of combination of single
interventions were assessed in this study.
Significant gains can be realized: between 21-36 percent in emission intensity reduction This work shows that significant reductions in
methane emission intensity can be realized through
the adoption of existing and proven technologies
and practices. Overall, the analysis shows that there
is a high potential to reduce emission intensities;
methane emission intensity (kg CO2 /kg FPCM) can be
reduced by 7–45 percent, the magnitude of impact
varies depending on the intervention and production
system assessed. All interventions returned a
positive productivity outcome with increases in milk
production ranging between 4–80 percent.
Many of the biological effects are interrelated
and interdependent and, accordingly, the changes
in enteric CH4 emissions per unit of milk (kg CH4/
kg FPCM) are not additive. The decreases in CH4/
FPCM range are modest because the range of
alterations was restricted to what might reasonably
be implemented or expected to occur in dairy
production. In addition, the implementation of
many of the approaches is limited to lactating dairy
cattle for practical or economic reasons and, thus,
the reductions in enteric CH4 are modest.
The use of a combination of feed practices
(combining use of non-conventional feed resources,
feed conservation and feeding of high energy/protein
and an additional one including the use of non-
conventional feed resources and feed conservation)
returned the highest impacts on methane and milk
production. The two interventions were designed to
evaluate the impacts of feed management practices
that improve consistency and minimize variability.
The use of non-conventional feed resources, feed
conservation and feeding of high energy/protein
resulted in 26–28 percent reduction in methane
emission intensity and 34–36 percent increase in milk
production. Strategic supplementation with sweet
potato vines and sorghum silage in intensive and semi-
intensive systems reduces enteric methane emissions
by 48–50 percent and results in milk production
increases between 93–97 percent.
Applying combinations of interventions ‘packages’
aimed at improving feed availability and quality
(establishment of fodder grasses and legumes, use of
conserved silage and UMMB); improving herd health
(vaccination against East Coast Fever) and improved
genetics (artificial insemination) can potentially
result in a reduction potential of 21–36 percent in
emission intensity relative to the baseline emission
intensity. With these combinations of technologies,
an increase in milk production of 31–35 percent can
be achieved compared to the baseline. The joint
impacts realized from applying a combination of
technologies are better understood as multiplicative
rather than additive i.e. they are mutually enhancing
and dependent.
Reduction of enteric methane emissions will pay for itselfA key incentive to farmers for adoption is increased
revenue and/or reduced production costs. To better
OptiOns fOr lOw emissiOn develOpment in the KenYA dAirY sectOr
iX
understand the implications for farmers, a cost benefit
analysis was conducted to assess the profitability of
adopting mitigation intervention. The benefit-cost
ratio (BCR) indicates the overall value for money of
the interventions. Generally, if the ratio is greater than
1, benefits of the interventions outweigh the costs. In
this study the, the BCR for different mitigation options
ranged from 1.1 to 5.8 indicating that benefits exceed
economic costs for the different options considered.
Prioritization of interventions for enteric methane A preliminary ranking of interventions per
production systems to identify interventions with
high emissions reduction potential, increased milk
production and high economic return for farmers
was undertaken to provide an indication of which
interventions can deliver win-win outcomes. Out of the
10 interventions assessed, 6 were considered relevant
for the intensive and 9 for semi-intensive systems. Four
of the five interventions selected for extensive systems
were included in the prioritization process.
In the intensive system, vaccination against
East Coast Fever, use of urea treated crop residues,
and combined feeding practices returned high
productivity and profitability impacts. While in
the semi-intensive systems, combining strategic
supplementation feeding practices had important
impacts on all three criteria.
Reducing enteric CH4 would in many cases be profitable.Reducing enteric CH4 via increasing productivity
is economically viable in most situations; several
activities that reduce methane emissions have low
or negative economic cost when considering the
increase in production. Economically attractive
measures are those that have a negative cost or
savings meaning there is a net financial benefit.
The interventions assessed all have negative
net costs (i.e. net benefits) resulting in an
abatement potential of 15.9 million tonnes CO2
eq. Putting the reduction potential and net costs
together allows a first order prioritization of low
carbon interventions. All other things equal, the
objectives would be to promote interventions
with high reduction potential and a net economic
benefit.

1
In Kenya, where about 75 percent of the population
depends directly on land and natural resources for
their livelihoods, the impact of climate change and
related disasters on land and natural resources has
the potential to severely affect many people, and
the economic growth of the country. In 2010, the
Government developed the National Climate Change
Response Strategy to propose a cross-governmental
strategy to respond to climate change challenges2.
Kenya has recognized the importance of green
growth for achieving its Vision 20303 goals and
also as an element of the implementation of the
Kenya Constitution 2010 that, under the ‘Bill of
Rights’, guarantees every citizen a clean and healthy
environment. In 2013 Kenya launched the National
Climate Change Action4 which provides a vision
for low carbon and climate resilient development
pathway.
Kenya envisions being a middle income country
with citizens enjoying high quality of life and
a sustained annual economic growth rate of at
least 10 percent by the year 2030 according to the
National Development Blue Print “The Kenya Vision
2030”.
The agriculture sector has been identified as one
of the key sectors to contribute to the projected
annual national economic growth. The sector
is envisaged to ensure food security, provision
of raw materials for agro-industries, creation of
employment opportunities, generation of income
and foreign exchange earnings. The sector
is however the most vulnerable to the impacts
of climate change and extreme weather events.
Enhanced temperatures and change in precipitation
regimes have led to reduced suitability of agro-
based enterprises; reducing productivity of crops,
livestock and fisheries due to temperature and
water stresses; and rising production costs. The
increase in frequency and intensity of extreme
weather events such as droughts and floods have
led to loss of investments, incomes and livelihoods,
the destruction of agro-based infrastructure as
well as increased frequency of weather related
disasters. Due to these challenges, the government
recognizes the need to develop interventions that
make agriculture more resilient to climate change
and extreme weather events while minimizing its
contribution to greenhouse gas emissions.
Kenya seeks to undertake an ambitious
mitigation contribution towards the 2015 Paris
Agreement. Kenya therefore seeks to abate its
GHG emissions by 30 percent by 2030 relative
to the BAU scenario of 143 Mt CO2 eq. and in
line with its sustainable development agenda.
For the agricultural sector (crops and livestock),
these actions will be pursued under the banner of
climate smart agriculture5. The livestock sub-sector
contributes 90 percent of the emission from the
agriculture sector mainly from enteric fermentation.
The NDC Livestock development is identified as a
key priority area is action. More specific to the dairy
sector the government of Kenya recognizes that
the agricultural sector has the potential to reduce
GHG emissions through efficient dairy production
systems6.
This report presents the findings and
recommendations from an initial assessment of the
dairy cattle sector of Kenya. It is undertaken in
CHAPTER 1
Green growth options for the dairy sector
2 Government of Kenya. 2010. National Climate Change Response Strategy. Nairobi: Ministry of Environment and Mineral Resources, Government of Kenya.3 Government of Kenya. 2007. Kenya Vision 2030. Nairobi: Government of Kenya.4 Government of Kenya. 2013. National Climate Change Action Plan 2013-2017. Nairobi: Ministry of Environment and Mineral Resource, Government of Kenya.5 Government of Kenya: Kenya’s Intended Nationally determined contribution. http://www.environment.go.ke/wp-content/uploads/2015/07/Kenya_INDC_20150723.pdf6 Government of Kenya. 2014. National Climate Change Framework Policy. 2014
OptiOns fOr lOw emissiOn develOpment in the KenYA dAirY sectOr
2
collaboration with the State Department of Livestock
in Kenya, and funded by Climate and Clean Air
Coalition (CCAC), the New Zealand Government and
the Food and Agriculture Organization of the United
Nations (FAO).
The primary focus of this initial assessment is
to identify and prioritize interventions to reduce
enteric methane emission intensity from ruminant
systems that are consistent with other development
goals. To that end, this report examines the scale
of enteric methane emissions from the dairy
sector, and identifies cost-effective interventions
through which methane can potentially be
reduced. This analysis is meant to inform where
reductions can be made and to systematically
explore emission reduction opportunities with
the objective to translate emission savings into
benefits for producers.
3
This study seeks to identify and evaluate low-
cost options that Kenya can implement in the
short-to-medium term geared towards improving
productivity in dairy cattle production systems,
reducing enteric methane emissions and fostering
economic development.
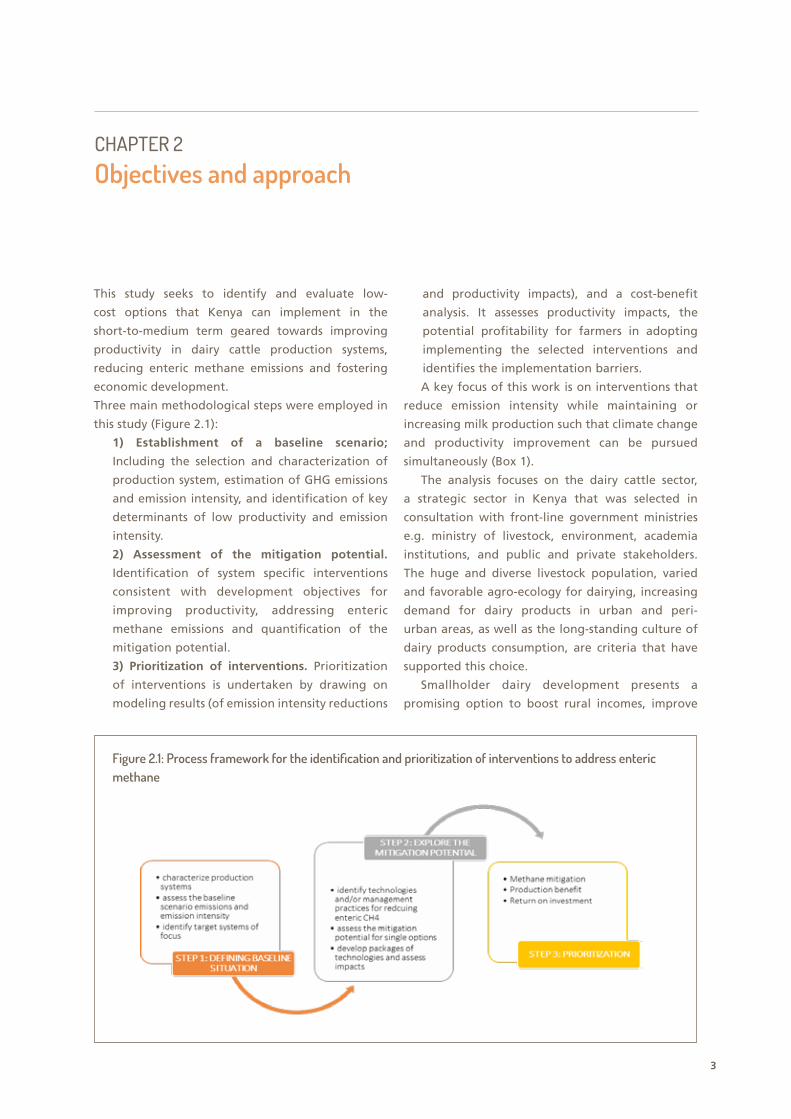
Three main methodological steps were employed in
this study (Figure 2.1):
1) establishment of a baseline scenario;
Including the selection and characterization of
production system, estimation of GHG emissions
and emission intensity, and identification of key
determinants of low productivity and emission
intensity.
2) Assessment of the mitigation potential.
Identification of system specific interventions
consistent with development objectives for
improving productivity, addressing enteric
methane emissions and quantification of the
mitigation potential.
3) prioritization of interventions. Prioritization
of interventions is undertaken by drawing on
modeling results (of emission intensity reductions
and productivity impacts), and a cost-benefit
analysis. It assesses productivity impacts, the
potential profitability for farmers in adopting
implementing the selected interventions and
identifies the implementation barriers.
A key focus of this work is on interventions that
reduce emission intensity while maintaining or
increasing milk production such that climate change
and productivity improvement can be pursued
simultaneously (Box 1).
The analysis focuses on the dairy cattle sector,
a strategic sector in Kenya that was selected in
consultation with front-line government ministries
e.g. ministry of livestock, environment, academia
institutions, and public and private stakeholders.
The huge and diverse livestock population, varied
and favorable agro-ecology for dairying, increasing
demand for dairy products in urban and peri-
urban areas, as well as the long-standing culture of
dairy products consumption, are criteria that have
supported this choice.
Smallholder dairy development presents a
promising option to boost rural incomes, improve
CHAPTER 2
Objectives and approach
Figure 2.1: Process framework for the identification and prioritization of interventions to address enteric methane
OptiOns fOr lOw emissiOn develOpment in the KenYA dAirY sectOr
4
Box 1: Absolute emissions versus emission intensity
Box 2: Modelling GHG emissions from dairy production systems in Kenya
The primary determinants of enteric methane emissions
are feed intake, and fermentation characteristics of that
feed in the rumen. In general, management practices that
increase the proportion of feed used to produce meat or
milk rather than maintain the animal, reduce the amount
of methane per unit of animal product produced (emis-
sions intensity). Higher individual animal productivity gen-
erates more animal product and more methane per animal
but as a smaller proportion of the feed consumed is used
to maintain the animal emissions intensity is reduced.
The same amount of animal product can be produced
with fewer methane emissions if producers keep fewer
animals. More intensive production provides flexibility
to control emissions and generally improves profitability.
However, increasing feed intake per animal will always
lead to an increase in total farm methane production un-
less the total number of animals is reduced.
In low and medium-income countries, the concept of
emission intensity remains the most attractive mitigation
route because it allows for the harnessing of synergies
between food security and development objectives and
climate change mitigation goal. Emissions intensity re-
ductions will reduce absolute emissions below the busi-
ness-as-usual.
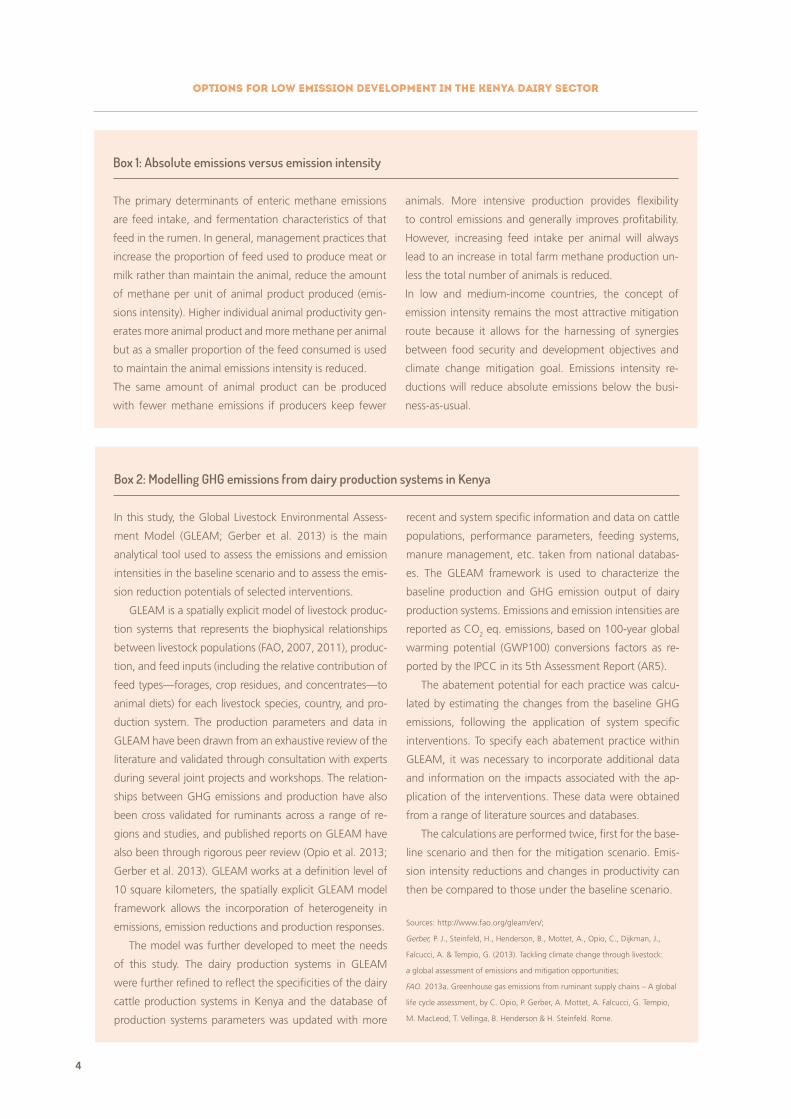
In this study, the Global Livestock Environmental Assess-
ment Model (GLEAM; Gerber et al. 2013) is the main
analytical tool used to assess the emissions and emission
intensities in the baseline scenario and to assess the emis-
sion reduction potentials of selected interventions.
GLEAM is a spatially explicit model of livestock produc-
tion systems that represents the biophysical relationships
between livestock populations (FAO, 2007, 2011), produc-
tion, and feed inputs (including the relative contribution of
feed types—forages, crop residues, and concentrates—to
animal diets) for each livestock species, country, and pro-
duction system. The production parameters and data in
GLEAM have been drawn from an exhaustive review of the
literature and validated through consultation with experts
during several joint projects and workshops. The relation-
ships between GHG emissions and production have also
been cross validated for ruminants across a range of re-
gions and studies, and published reports on GLEAM have
also been through rigorous peer review (Opio et al. 2013;
Gerber et al. 2013). GLEAM works at a definition level of
10 square kilometers, the spatially explicit GLEAM model
framework allows the incorporation of heterogeneity in
emissions, emission reductions and production responses.
The model was further developed to meet the needs
of this study. The dairy production systems in GLEAM
were further refined to reflect the specificities of the dairy
cattle production systems in Kenya and the database of
production systems parameters was updated with more
recent and system specific information and data on cattle
populations, performance parameters, feeding systems,
manure management, etc. taken from national databas-
es. The GLEAM framework is used to characterize the
baseline production and GHG emission output of dairy
production systems. Emissions and emission intensities are
reported as CO2 eq. emissions, based on 100-year global
warming potential (GWP100) conversions factors as re-
ported by the IPCC in its 5th Assessment Report (AR5).
The abatement potential for each practice was calcu-
lated by estimating the changes from the baseline GHG
emissions, following the application of system specific
interventions. To specify each abatement practice within
GLEAM, it was necessary to incorporate additional data
and information on the impacts associated with the ap-
plication of the interventions. These data were obtained
from a range of literature sources and databases.
The calculations are performed twice, first for the base-
line scenario and then for the mitigation scenario. Emis-
sion intensity reductions and changes in productivity can
then be compared to those under the baseline scenario.
Sources: http://www.fao.org/gleam/en/;
Gerber, P. J., Steinfeld, H., Henderson, B., Mottet, A., Opio, C., Dijkman, J.,
Falcucci, A. & Tempio, G. (2013). Tackling climate change through livestock:
a global assessment of emissions and mitigation opportunities;
FAO. 2013a. Greenhouse gas emissions from ruminant supply chains – A global
life cycle assessment, by C. Opio, P. Gerber, A. Mottet, A. Falcucci, G. Tempio,
M. MacLeod, T. Vellinga, B. Henderson & H. Steinfeld. Rome.
OptiOns fOr lOw emissiOn develOpment in the KenYA dAirY sectOr
5
food and nutrition security, and create employment
along the dairy value chain; thus contributing to the
National rural development policy and strategy.
The study undertakes biophysical modeling
and scenario analysis using the Global Livestock
Environmental Assessment Model (GLEAM) to
provide a broad perspective of opportunities and
attainable goals in terms of productivity gains and
emission intensity reduction in the dairy sector
(Box 2). The scenario analysis uses the outputs of
the biophysical analysis combined with information
taken from published literature, existing studies
and expert knowledge on potential impacts of each
intervention on herd performance and production to
quantify the emission intensity reduction potential.
The range of options evaluated (referred to as
“interventions”) were selected by national sector
experts based on their potential for methane
emission intensity reductions, their impact on milk
production and their feasibility in terms of political,
social, institutional, and other preconditions. The
interventions identified are presented individually
and with a subset evaluated as a ‘package’, in order
to demonstrate to stakeholders how a combination
of interventions would impact reduction potential
and productivity gains. It also gives the ability
to assess this flexibly within the framework of
political conditions, available resources, and other
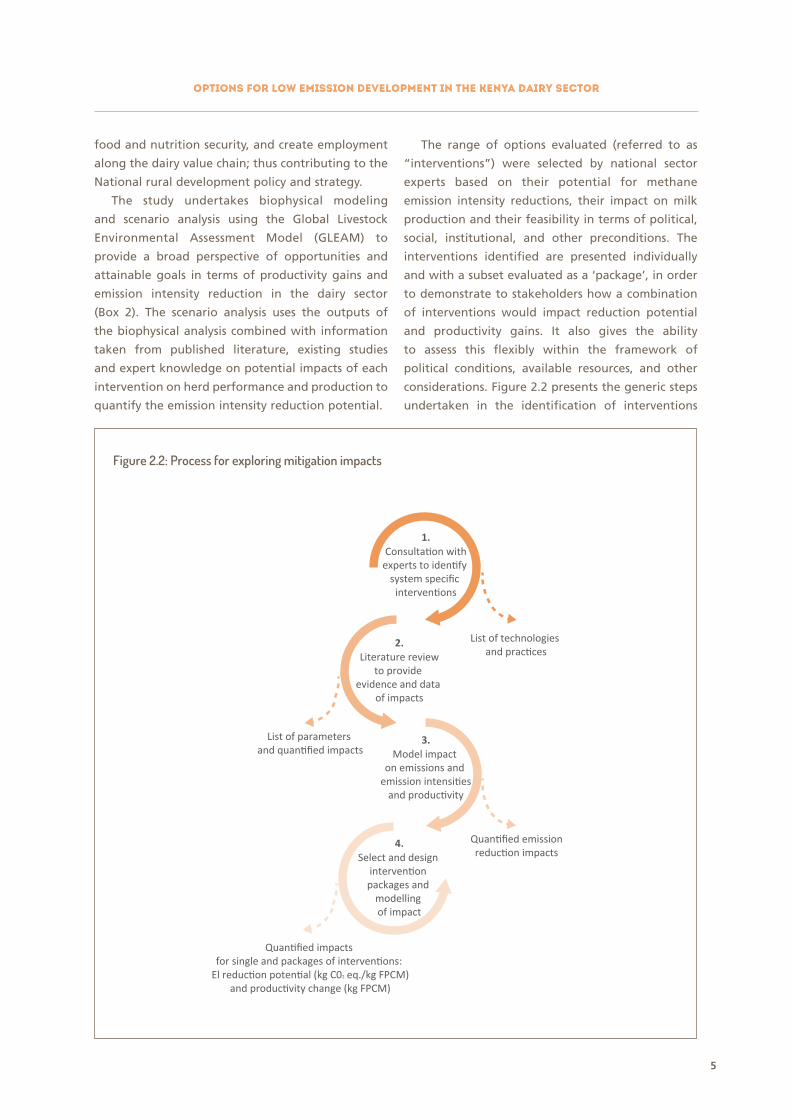
considerations. Figure 2.2 presents the generic steps
undertaken in the identification of interventions
Figure 2.2: Process for exploring mitigation impacts
Consultation withexperts to identify
system specific interventions
Literature reviewto provide
evidence and data of impacts
List of technologies and practices
List of parameters and quantified impacts
Quantified impacts for single and packages of interventions:
El reduction potential (kg C02 eq./kg FPCM)and productivity change (kg FPCM)
Quantified emissionreduction impacts
1.
2.
Model impact on emissions and
emission intensitiesand productivity
3.
Select and design intervention
packages and modelling of impact
4.
6
and assessment of their impacts on enteric methane
emissions and production.
For purposes of prioritization of interventions, the
assessment considered three aspects: the emission
reduction potential, the production impacts and
the impacts profitability for farmers assessed by
quantifying the return to farmers per dollar invested.
The impacts on enteric methane emissions and
production were assessed using the GLEAM model
described above. The cost-benefit analysis of selected
interventions to assess the profitability for farmers
were quantified using typical farm input and output
costs provided by local experts and are presented as
a ratio of the $ returned per $ invested. The purpose
of the cost benefit analysis is to guide decisions on
which interventions would be profitable for farmers.
OptiOns fOr lOw emissiOn develOpment in the KenYA dAirY sectOr
7
The dairy industry is Kenya’s single largest agricultural
sub-sector in Kenya. It contributes 14 percent to
agricultural Gross Domestic Product (GDP) and 3.5
percent of total national GDP. The sector currently
provides income and employment to about 2 million
people8 across the dairy value chain. In terms of
nutrition and food security, current per capita
consumption of milk is 115 litres and demand for dairy
products is projected to continue to grow rapidly as a
consequence of population growth.
Kenya’s population is expected to increase from
the current 48 million to 65 million in 2030, of
which more than one-third will be urban residents9.
With this future population scenario, per capita milk
consumption is projected to reach 220 liters by 2030.
Demand for chilled, high quality processed milk is
expected increase, with growth in demand projected
at 5 percent per year, and total milk demand reaching
12 billion liters by 203010. Growth in the formal
sector is expected to be more rapid, partly due to the
shifting structure of consumer demand, and partly
due to initiatives to regulate milk quality in informal
markets.
Total milk production from dairy cows in 2014
was about 3.4 billion litres. In the last decade, milk
production has grown at an annual average rate
of more than 3 percent. Of the milk produced,
about 42 percent is consumed at household level,
and 58 percent is marketed. Of the marketed milk,
70 percent is sold through the informal sector,
in which brokers link producers and consumers
of unprocessed milk. The rest of the marketed
milk passe through formal marketing channels,
involving transport to chilling and bulking centers
and processing facilities, where it is processed
into a wide range of dairy products for retail in
the country’s urban centers. The main products
are fresh pasteurized, UHT and fermented milk,
and milk powder, with smaller markets for cheese,
ice-cream, cream, butter and ghee. Between 2008
and 2015, the formal sector has been growing at an
annual rate of 6.3 percent.
Milk production in Kenya is predominantly
managed by small-scale farmers, who own one to
three dairy animals, and produce about 70 percent
of the milk in the country.11 Smallholders engaged in
milk production represent about 35 percent of the
rural households and 26 percent of total households
in Kenya. However, small-holder producers should
not be considered as one homogeneous group. They
vary in their motivations for keeping dairy cows;
from providing milk for household consumption,
to dairying as a supplementary source of income
alongside other cash/subsistence crops or the main
source of income for the household. Other reasons
for owning dairy cows include status, a store of
wealth and a valuable source of organic manure for
the crop production or sale.
Dairy production in Kenya is highly concentrated
in the high-potential highland areas, where
temperature is moderated by altitude, receive a
greater and more reliable rainfall than medium-
potential areas that are predominantly found at
lower altitudes. These factors largely explain the
current distribution of dairy farming in Kenya, as
forage production is related to rainfall, disease risk
is reduced at higher altitudes and market demand
arose from emerging consumption centers located
in the highlands. Dairy production takes place
in three types of production systems: intensive,
semi-intensive and extensive (Map 3.1). The
differences between the systems are in their sizes
CHAPTER 3
Overview of dairy production
8 Kenya Dairy Board, 20129 Government of Kenya. 2007. Kenya Vision 2030. Nairobi: Government of Kenya.9 UN Population Projections (https://esa.un.org/unpd/wup/CD-ROM/) and World Urbanization Prospects (https://esa.un.org/unpd/wup/CD-ROM/)10 National Dairy Development Policy (2013)11 FAO. 201. Dairy development in Kenya, by H.G. Muriuki. Rome. http://www.fao.org/docrep/013/al745e/al745e00.pdf
OptiOns fOr lOw emissiOn develOpment in the KenYA dAirY sectOr
8
of operation, level of management and use of
inputs. The production systems are influenced by
the agro-climatic characteristics of the area, land
productivity potential and prevalence of animal
diseases. In areas of high population density, this
has allowed the development of highly intensive
smallholder dairy production systems typified by
the ‘zero-grazing’ practice of confining and stall-
feeding cattle with crop residues and planted
fodder, particularly Napier grass and concentrates.
In areas of greater land availability, such as parts of
Rift Valley Province, less intensive feeding practices
of combined grazing and stall-feeding, or free
grazing only on unimproved natural pasture in the
more marginal areas, are employed. The choice
of the feeding system is normally motivated by a
desire to optimize the limiting resource. In areas
of high population density, land tends to be the
limiting factor whereas in open grazing, labour is
the limiting factor. Expenditure on purchased feeds
and concentrates are higher in zero-grazing system
than in open grazing.
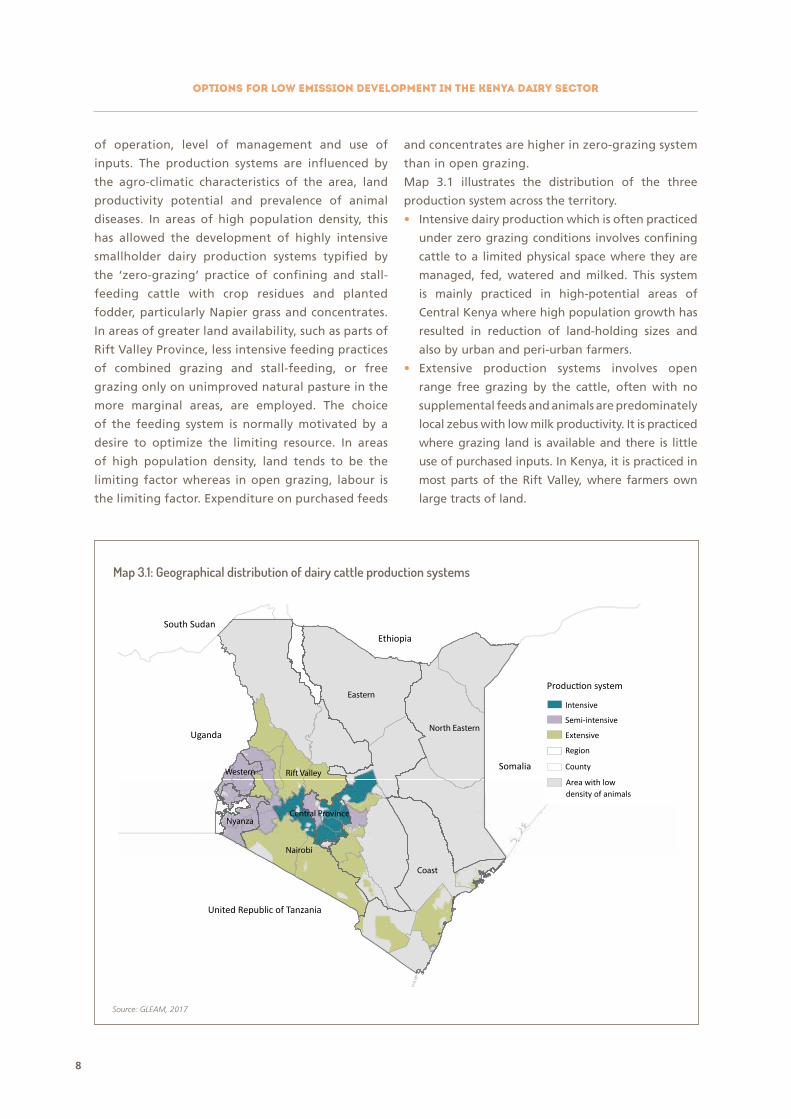
Map 3.1 illustrates the distribution of the three
production system across the territory.
• Intensive dairy production which is often practiced
under zero grazing conditions involves confining
cattle to a limited physical space where they are
managed, fed, watered and milked. This system
is mainly practiced in high-potential areas of
Central Kenya where high population growth has
resulted in reduction of land-holding sizes and
also by urban and peri-urban farmers.
• Extensive production systems involves open
range free grazing by the cattle, often with no
supplemental feeds and animals are predominately
local zebus with low milk productivity. It is practiced
where grazing land is available and there is little
use of purchased inputs. In Kenya, it is practiced in
most parts of the Rift Valley, where farmers own
large tracts of land.
Map 3.1: Geographical distribution of dairy cattle production systems
Source: GLEAM, 2017
Production system
Intensive
Semi-intensive
Extensive
Region
County
Area with low density of animals
South SudanEthiopia
United Republic of Tanzania
Uganda
Somalia
North Eastern
Coast
Eastern
Central Province
Western
Nyanza
Rift Valley
Nairobi
OptiOns fOr lOw emissiOn develOpment in the KenYA dAirY sectOr
9
• Semi-intensive systems fall somewhere in the
middle and involves the combination of the two
approaches above. This system is characterized by
a lower human population density compared to
the intensive system, dairy rely on mainly grazing
which is usually supplemented with cultivated
fodder and/or purchased feed. In these systems
cross-bred cattle are usually kept.
A summary of key features of these production sys-
tems is provided in Table 3.1.
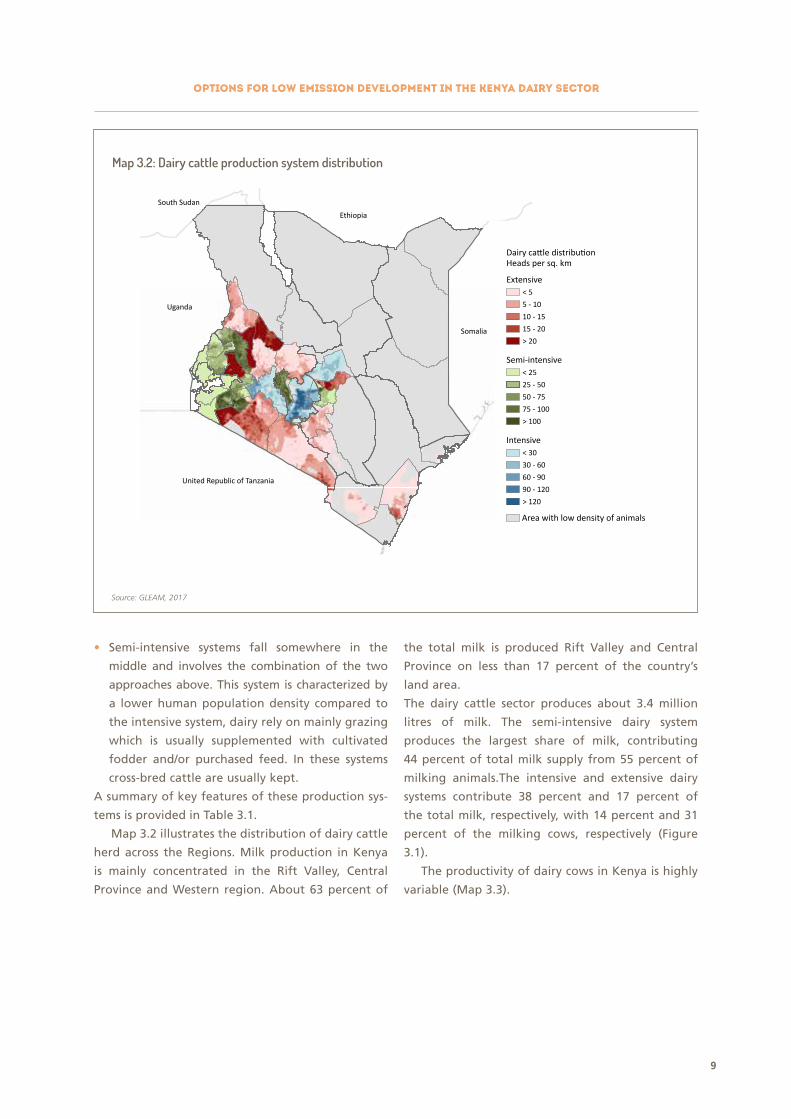
Map 3.2 illustrates the distribution of dairy cattle
herd across the Regions. Milk production in Kenya
is mainly concentrated in the Rift Valley, Central
Province and Western region. About 63 percent of
the total milk is produced Rift Valley and Central
Province on less than 17 percent of the country’s
land area.
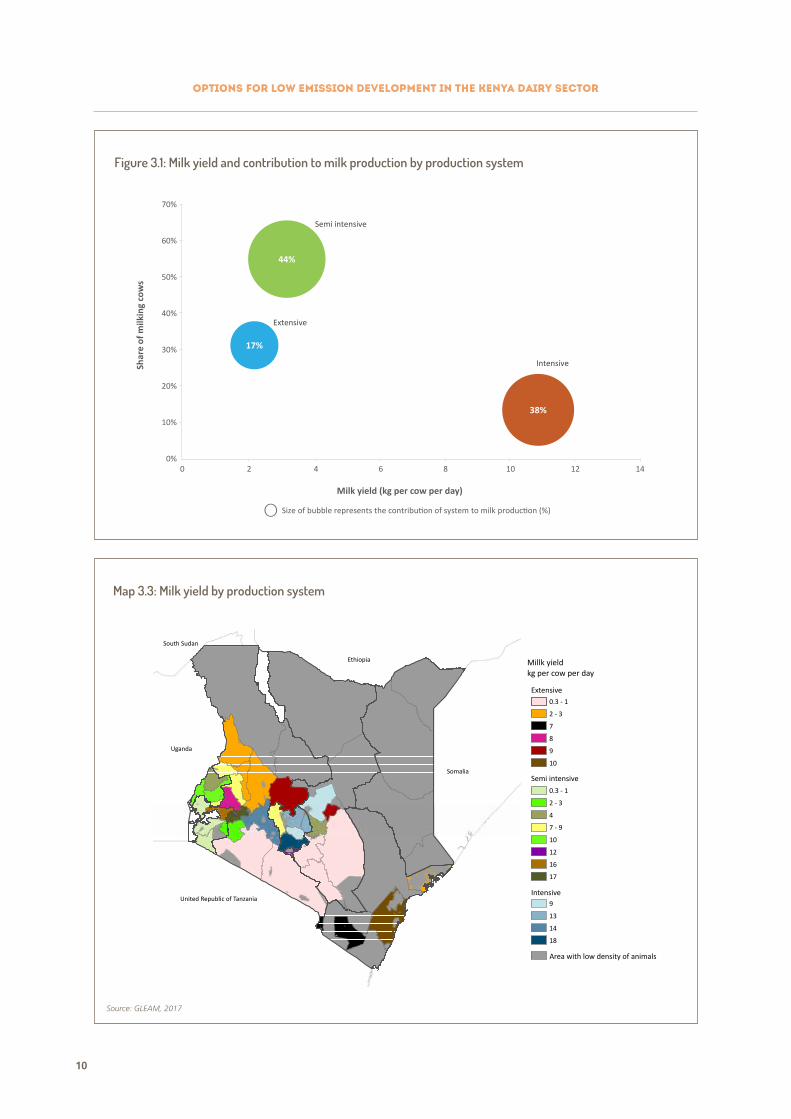
The dairy cattle sector produces about 3.4 million
litres of milk. The semi-intensive dairy system
produces the largest share of milk, contributing
44 percent of total milk supply from 55 percent of
milking animals.The intensive and extensive dairy
systems contribute 38 percent and 17 percent of
the total milk, respectively, with 14 percent and 31
percent of the milking cows, respectively (Figure
3.1).
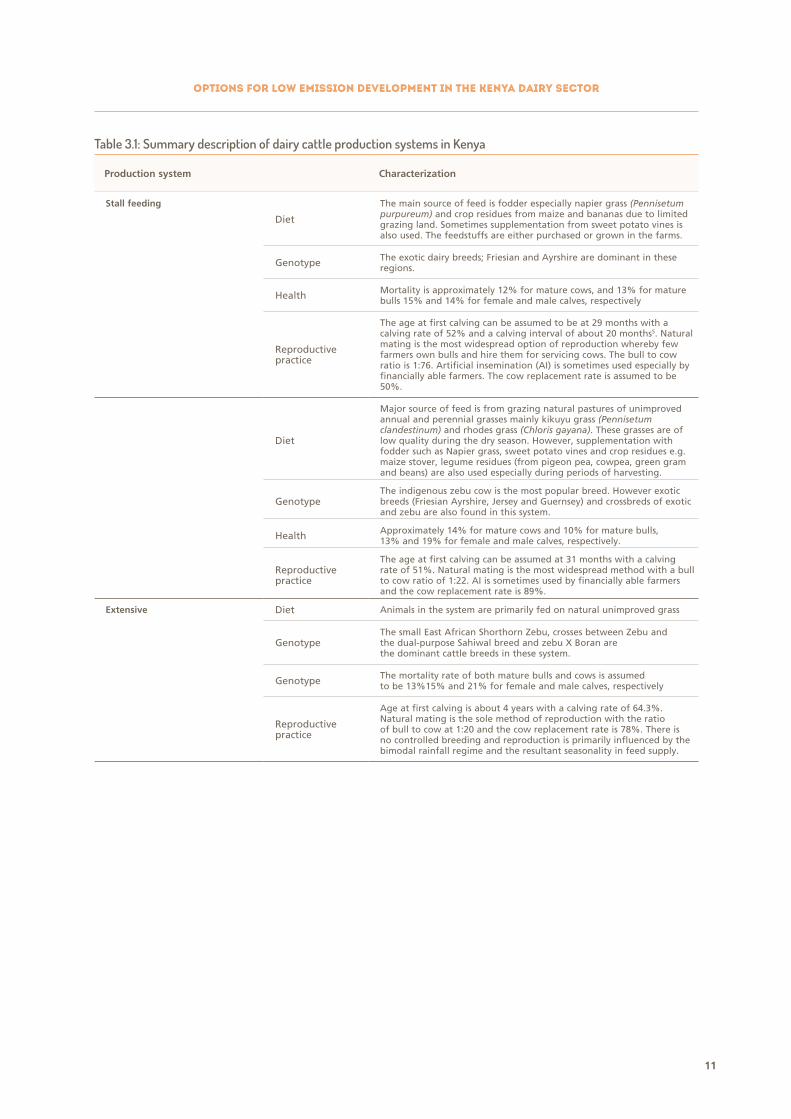
The productivity of dairy cows in Kenya is highly
variable (Map 3.3).
Map 3.2: Dairy cattle production system distribution
South Sudan
Ethiopia
Somalia
United Republic of Tanzania
Uganda
Dairy cattle distributionHeads per sq. km
Extensive< 55 - 1010 - 1515 - 20> 20
Semi-intensive< 2525 - 5050 - 7575 - 100> 100
Intensive< 3030 - 6060 - 9090 - 120> 120
Area with low density of animals
Source: GLEAM, 2017
OptiOns fOr lOw emissiOn develOpment in the KenYA dAirY sectOr
10
⃝
38%
44%
17%
0%
10%
20%
30%
40%
50%
60%
70%
0 2 4 6 8 10 12 14
Shar
e of
milk
ing
cow
s
Milk yield (kg per cow per day)
Intensive
Semi intensive
Extensive
Size of bubble represents the contribution of system to milk production (%)
Map 3.3: Milk yield by production system
Figure 3.1: Milk yield and contribution to milk production by production system
South Sudan
Ethiopia
Somalia
United Republic of Tanzania
Uganda
Millk yieldkg per cow per day
Semi intensive
Extensive
Intensive
Area with low density of animals
0.3 - 1
2 - 3
7
8
9
10
0.3 - 1
2 - 3
4
7 - 9
10
12
16
17
9
13
14
18
Source: GLEAM, 2017
OptiOns fOr lOw emissiOn develOpment in the KenYA dAirY sectOr
11
Table 3.1: Summary description of dairy cattle production systems in Kenya
production system Characterization
stall feeding
Diet
The main source of feed is fodder especially napier grass (Pennisetum purpureum) and crop residues from maize and bananas due to limited grazing land. Sometimes supplementation from sweet potato vines is also used. The feedstuffs are either purchased or grown in the farms.
Genotype The exotic dairy breeds; Friesian and Ayrshire are dominant in these regions.
Health Mortality is approximately 12% for mature cows, and 13% for mature bulls 15% and 14% for female and male calves, respectively
Reproductive practice
The age at first calving can be assumed to be at 29 months with a calving rate of 52% and a calving interval of about 20 months5. Natural mating is the most widespread option of reproduction whereby few farmers own bulls and hire them for servicing cows. The bull to cow ratio is 1:76. Artificial insemination (AI) is sometimes used especially by financially able farmers. The cow replacement rate is assumed to be 50%.
Diet
Major source of feed is from grazing natural pastures of unimproved annual and perennial grasses mainly kikuyu grass (Pennisetum clandestinum) and rhodes grass (Chloris gayana). These grasses are of low quality during the dry season. However, supplementation with fodder such as Napier grass, sweet potato vines and crop residues e.g. maize stover, legume residues (from pigeon pea, cowpea, green gram and beans) are also used especially during periods of harvesting.
GenotypeThe indigenous zebu cow is the most popular breed. However exotic breeds (Friesian Ayrshire, Jersey and Guernsey) and crossbreds of exotic and zebu are also found in this system.
Health Approximately 14% for mature cows and 10% for mature bulls, 13% and 19% for female and male calves, respectively.
Reproductive practice
The age at first calving can be assumed at 31 months with a calving rate of 51%. Natural mating is the most widespread method with a bull to cow ratio of 1:22. AI is sometimes used by financially able farmers and the cow replacement rate is 89%.
extensive Diet Animals in the system are primarily fed on natural unimproved grass
GenotypeThe small East African Shorthorn Zebu, crosses between Zebu and the dual-purpose Sahiwal breed and zebu X Boran are the dominant cattle breeds in these system.
Genotype The mortality rate of both mature bulls and cows is assumed to be 13%15% and 21% for female and male calves, respectively
Reproductive practice
Age at first calving is about 4 years with a calving rate of 64.3%. Natural mating is the sole method of reproduction with the ratio of bull to cow at 1:20 and the cow replacement rate is 78%. There is no controlled breeding and reproduction is primarily influenced by the bimodal rainfall regime and the resultant seasonality in feed supply.
OptiOns fOr lOw emissiOn develOpment in the KenYA dAirY sectOr
12
South Sudan
Ethiopia
Somalia
United Republic of Tanzania
Uganda
Total GHG emissions by region(1,000 tonnes CO2 eq.)
Area with low density of animals
3,244 (Rift Valley)
2,988 (Nyanza)
2,635 (Eastern)
2,000 Central Province)
971 (Western)
146 (Coast)
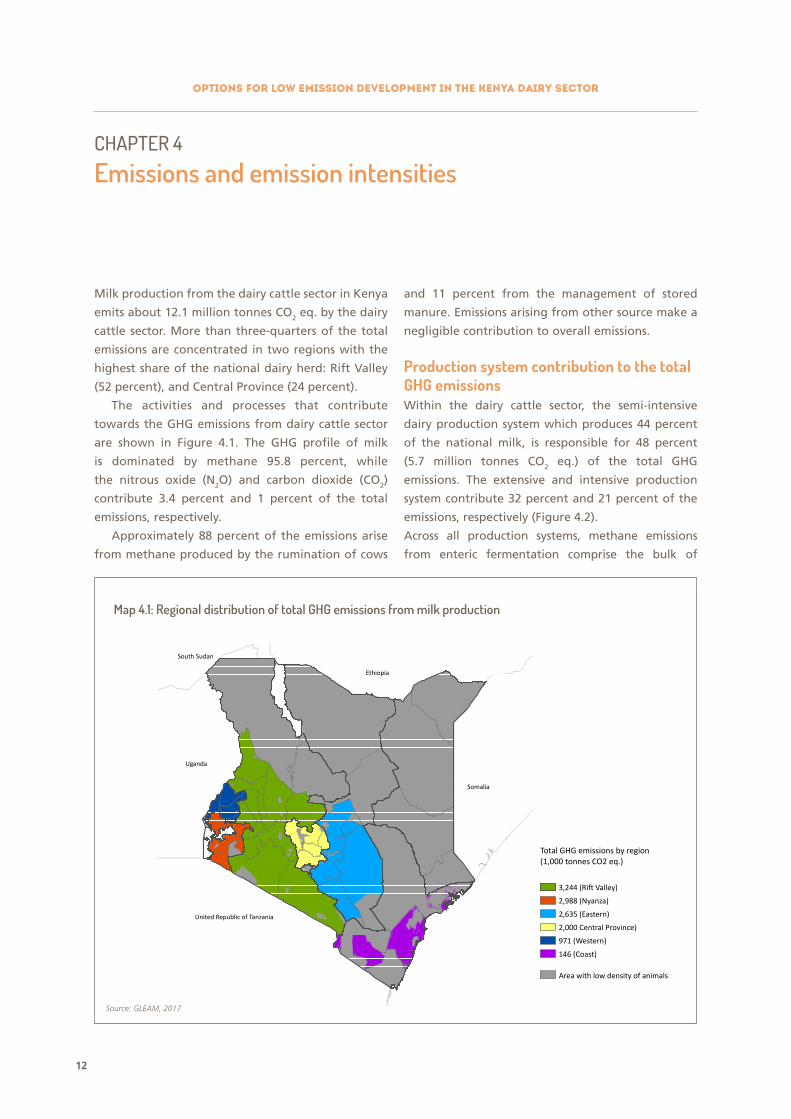
Milk production from the dairy cattle sector in Kenya
emits about 12.1 million tonnes CO2 eq. by the dairy
cattle sector. More than three-quarters of the total
emissions are concentrated in two regions with the
highest share of the national dairy herd: Rift Valley
(52 percent), and Central Province (24 percent).
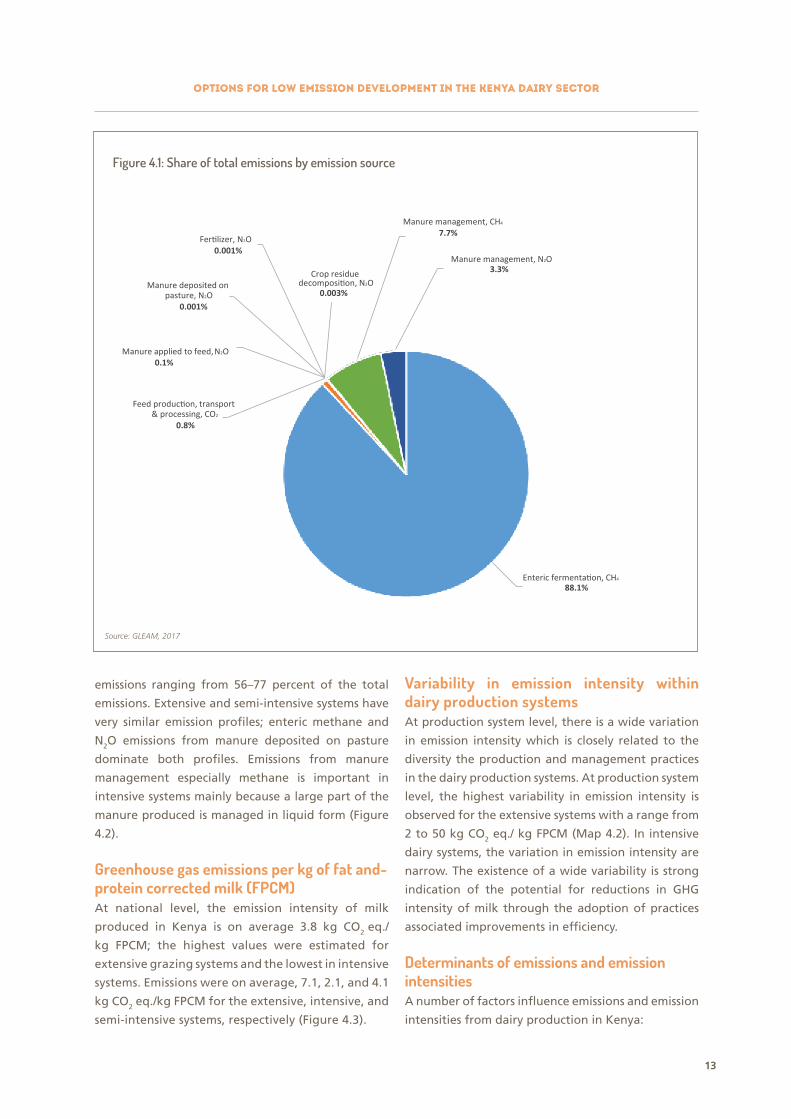
The activities and processes that contribute
towards the GHG emissions from dairy cattle sector
are shown in Figure 4.1. The GHG profile of milk
is dominated by methane 95.8 percent, while
the nitrous oxide (N2O) and carbon dioxide (CO2)
contribute 3.4 percent and 1 percent of the total
emissions, respectively.
Approximately 88 percent of the emissions arise
from methane produced by the rumination of cows
and 11 percent from the management of stored
manure. Emissions arising from other source make a
negligible contribution to overall emissions.
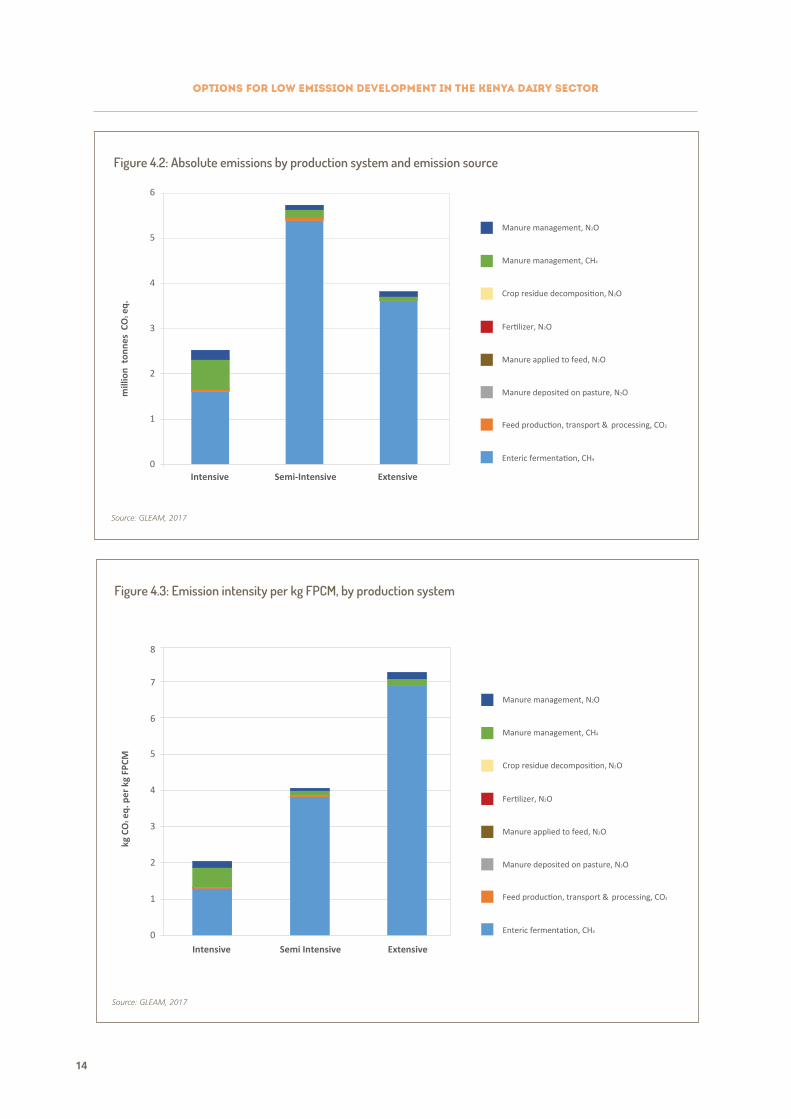
Production system contribution to the total GHG emissions Within the dairy cattle sector, the semi-intensive
dairy production system which produces 44 percent
of the national milk, is responsible for 48 percent
(5.7 million tonnes CO2 eq.) of the total GHG
emissions. The extensive and intensive production
system contribute 32 percent and 21 percent of the
emissions, respectively (Figure 4.2).
Across all production systems, methane emissions
from enteric fermentation comprise the bulk of
CHAPTER 4
Emissions and emission intensities
Source: GLEAM, 2017
Map 4.1: Regional distribution of total GHG emissions from milk production
OptiOns fOr lOw emissiOn develOpment in the KenYA dAirY sectOr
13
Feed production, transport & processing, CO2
0.8%
Manure deposited on pasture, N2O
0.001%
Fertilizer, N2O0.001%
Manure applied to feed, N2O0.1%
Enteric fermentation, CH4
88.1%
Crop residue decomposition, N2O
0.003%
Manure management, CH4
7.7%
Manure management, N2O3.3%
Figure 4.1: Share of total emissions by emission source
Source: GLEAM, 2017
emissions ranging from 56–77 percent of the total
emissions. Extensive and semi-intensive systems have
very similar emission profiles; enteric methane and
N2O emissions from manure deposited on pasture
dominate both profiles. Emissions from manure
management especially methane is important in
intensive systems mainly because a large part of the
manure produced is managed in liquid form (Figure
4.2).
Greenhouse gas emissions per kg of fat and-protein corrected milk (FPCM) At national level, the emission intensity of milk
produced in Kenya is on average 3.8 kg CO2 eq./
kg FPCM; the highest values were estimated for
extensive grazing systems and the lowest in intensive
systems. Emissions were on average, 7.1, 2.1, and 4.1
kg CO2 eq./kg FPCM for the extensive, intensive, and
semi-intensive systems, respectively (Figure 4.3).
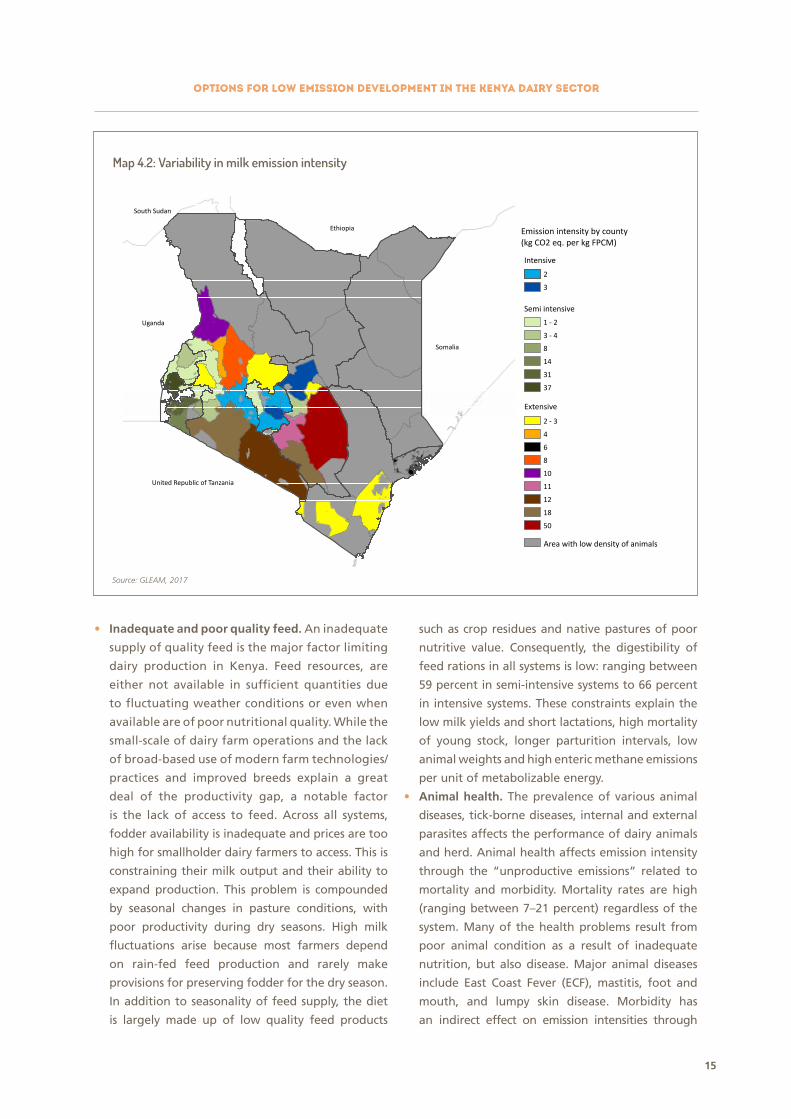
Variability in emission intensity within dairy production systems At production system level, there is a wide variation
in emission intensity which is closely related to the
diversity the production and management practices
in the dairy production systems. At production system
level, the highest variability in emission intensity is
observed for the extensive systems with a range from
2 to 50 kg CO2 eq./ kg FPCM (Map 4.2). In intensive
dairy systems, the variation in emission intensity are
narrow. The existence of a wide variability is strong
indication of the potential for reductions in GHG
intensity of milk through the adoption of practices
associated improvements in efficiency.
Determinants of emissions and emission intensities A number of factors influence emissions and emission
intensities from dairy production in Kenya:
OptiOns fOr lOw emissiOn develOpment in the KenYA dAirY sectOr
14
mill
ion
ton
nes
CO
2 eq.
Manure management, N2O
Manure management, CH4
Crop residue decomposition, N2O
Fertilizer, N2O
Manure applied to feed, N2O
Manure deposited on pasture, N2O
Feed production, transport & processing, CO2
Enteric fermentation, CH40
1
2
3
4
5
6
Intensive Semi-Intensive Extensive
Figure 4.2: Absolute emissions by production system and emission source
Source: GLEAM, 2017
Manure management, N2O
Manure management, CH4
Crop residue decomposition, N2O
Fertilizer, N2O
Manure applied to feed, N2O
Manure deposited on pasture, N2O
Feed production, transport & processing, CO2
Enteric fermentation, CH40
1
2
3
4
5
6
7
8
Intensive Semi Intensive Extensive
kg C
O2 e
q. p
er k
g FP
CM
Figure 4.3: Emission intensity per kg FPCM, by production system
Source: GLEAM, 2017
OptiOns fOr lOw emissiOn develOpment in the KenYA dAirY sectOr
15
• inadequate and poor quality feed. An inadequate
supply of quality feed is the major factor limiting
dairy production in Kenya. Feed resources, are
either not available in sufficient quantities due
to fluctuating weather conditions or even when
available are of poor nutritional quality. While the
small-scale of dairy farm operations and the lack
of broad-based use of modern farm technologies/
practices and improved breeds explain a great
deal of the productivity gap, a notable factor
is the lack of access to feed. Across all systems,
fodder availability is inadequate and prices are too
high for smallholder dairy farmers to access. This is
constraining their milk output and their ability to
expand production. This problem is compounded
by seasonal changes in pasture conditions, with
poor productivity during dry seasons. High milk
fluctuations arise because most farmers depend
on rain-fed feed production and rarely make
provisions for preserving fodder for the dry season.
In addition to seasonality of feed supply, the diet
is largely made up of low quality feed products
such as crop residues and native pastures of poor
nutritive value. Consequently, the digestibility of
feed rations in all systems is low: ranging between
59 percent in semi-intensive systems to 66 percent
in intensive systems. These constraints explain the
low milk yields and short lactations, high mortality
of young stock, longer parturition intervals, low
animal weights and high enteric methane emissions
per unit of metabolizable energy.
• Animal health. The prevalence of various animal
diseases, tick-borne diseases, internal and external
parasites affects the performance of dairy animals
and herd. Animal health affects emission intensity
through the “unproductive emissions” related to
mortality and morbidity. Mortality rates are high
(ranging between 7–21 percent) regardless of the
system. Many of the health problems result from
poor animal condition as a result of inadequate
nutrition, but also disease. Major animal diseases
include East Coast Fever (ECF), mastitis, foot and
mouth, and lumpy skin disease. Morbidity has
an indirect effect on emission intensities through
Map 4.2: Variability in milk emission intensity
Source: GLEAM, 2017
South Sudan
Ethiopia
Somalia
United Republic of Tanzania
Uganda
Emission intensity by county(kg CO2 eq. per kg FPCM)
Semi intensive
Extensive
Intensive
Area with low density of animals
2
3
1 - 2
3 - 4
8
14
31
37
4
6
8
10
11
12
18
50
2 - 3
OptiOns fOr lOw emissiOn develOpment in the KenYA dAirY sectOr
16
slow growth rate, reduced mature weight, poor
reproductive performance and decreased milk
production. This is particularly true for improved
exotic dairy cattle breeds which often have higher
nutritional demands, poor adaptability, often
inherently more susceptible to diseases compared
to the indigenous cattle. This also partly explains
the lower calving rates (52 percent) in the intensive
systems.
• Reproductive efficiency. Reproductive efficiency
affects emission intensity by influencing the
portion of the herd that is in production (e.g.
number of lactating and dry cows in the herd). It is
also a key parameter to the economic performance
of dairy systems. Improvements in reproductive
performance is a major efficiency goal of the dairy
industry. However, achieving this goal is currently
hampered by a number of factors, particularly
feed availability and quality. Poor reproductive
performance in the Kenyan dairy herd is manifested
in a number of parameters such as low fertility
rates (50 percent), delayed time to reach puberty
and age at first calving (2.7 and 4 years in semi-
intensive and extensive systems, respectively).
• Better management of genetics: Enhancing
the genetic potential of the animal is critically
important, but it is equally important not to
promote high genetic potential animals into
climates and management environments where
high-producing animals can never achieve their
potential and will, in fact, perform worse than
native breeds or crossbreeds due to management,
disease, or climatic challenges. In intensive systems,
farmers generally rely on exotic breeds such as
Friesian and Ayrshire which are high yielding
animals with high feed requirements, have a high
demand for clean water, susceptible to disease and
other climatic stressors.
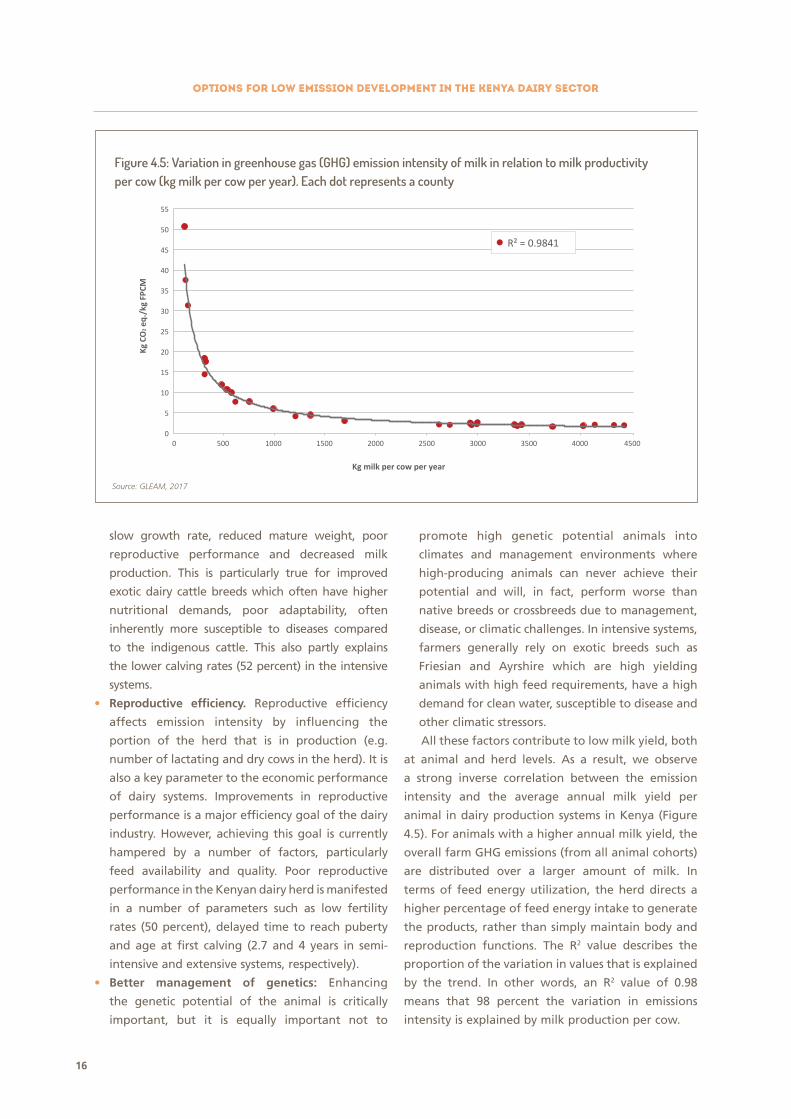
All these factors contribute to low milk yield, both
at animal and herd levels. As a result, we observe
a strong inverse correlation between the emission
intensity and the average annual milk yield per
animal in dairy production systems in Kenya (Figure
4.5). For animals with a higher annual milk yield, the
overall farm GHG emissions (from all animal cohorts)
are distributed over a larger amount of milk. In
terms of feed energy utilization, the herd directs a
higher percentage of feed energy intake to generate
the products, rather than simply maintain body and
reproduction functions. The R2 value describes the
proportion of the variation in values that is explained
by the trend. In other words, an R2 value of 0.98
means that 98 percent the variation in emissions
intensity is explained by milk production per cow.
0
5
10
15
20
25
30
35
40
45
50
55
0 500 1000 1500 2000 2500 3000 3500 4000 4500
Kg C
O2 e
q./k
g FP
CM
Kg milk per cow per year
R² = 0.9841
Source: GLEAM, 2017
Figure 4.5: Variation in greenhouse gas (GHG) emission intensity of milk in relation to milk productivity per cow (kg milk per cow per year). Each dot represents a county
17
The analysis of current production of milk in Kenya
shows that improving management practices and
technologies that increase milk production per cow
can reduce the GHG emissions intensity of milk
production.
This approach to mitigation is compatible with
the national objective of increasing overall milk
output for improved nutrition and food security. The
abatement technologies and practices assessed in
this study were selected for their potential impact on
enteric CH4. This is not a purely technical process but
incorporates other factors such as existing national
priorities. As such other considerations taken into
account during the selection of interventions was
the need to integrate mitigation with a number of
key developmental goals for the dairy sector, such
as their role in promoting food security, rural and
overall economic development.
The mitigation options evaluated in this analysis
were selected in a consultative process with national
experts. These options identified as having the
potential for large improvements in productivity
were assessed alongside their potential to reduce
on-farm GHG emission intensity while taking into
account the feasibility of implementation and
their potential economic benefits at the farm level.
Box 3 summarizes the criteria used to identify
interventions that were included in the analysis.
Enhancing animal productivity has several
dimensions including animal genetics, improved
feeding, reproduction, health and overall
management of the herd. The interventions
evaluated ranged from improved feeding practices
to better herd health and management. These
comprised: fodder cultivation, supplementation
with concentrates, leguminous shrubs, and urea-
treated straw, urea-molasses multi-nutrient blocks
(UMMB), use of conserved fodder, disease control
(East Coast Fever and internal parasites) and
use of improved genetics (artificial insemination).
Interventions were selected to address the key
determinants of low productivity and inefficiencies
in dairy production cycle such as seasonality of feed
resources, low quality of feed, poor reproductive
status of breeding herd, and animal health.
Table 5.1 provides a summary of the pre-
selected interventions. The interventions were not
applied uniformly, but selected for each production
system, animal category, and agro-ecological zone
using evidence from modelling and field studies
and expert judgement of their specific operating
requirements and likely impact on performance.
For example, all feed-related interventions were
applied only to a proportion of lactating and
replacement heifers while the vaccination against
East Coast Fever was applied to all animals in all
systems in the Coastal Province and Rift Valley.
Quantitative summary of mitigation outcomes from the application of single interventions The potential outcomes (emission reductions
and improvements in productivity) from the
application of the single interventions evaluated
in this study are presented in Figures 5.1 and 5.2.
Overall, the analysis shows that there is a high
potential to reduce emission intensities; methane
emission intensity (kg CO2/kg FPCM) can be
reduced by 7 percent to 45 percent, the magnitude
will vary depending on the intervention and
production system assessed (Figure 5.1). The
productivity outcomes are presented in Figure 5.2;
all interventions returned a positive productivity
outcome with increases in milk production ranging
between 4.3–80 percent.
Forage legumes and multi-purpose fodder tress
are a known and cheap source of protein for dairy
cattle. They help bridge the gap between supply
and demand of protein especially during the dry
season. Most small-scale dairy farmers graze their
CHAPTER 5
Exploring the mitigation potential in dairy cattle production
OptiOns fOr lOw emissiOn develOpment in the KenYA dAirY sectOr
18
-2.6
27.0
0.1
10.2
26.7
13.3
-18.
6
9.9
-30
-20
-10
0
10
20
30
Enteric fermentation,
CH 4
Feed production, transport &
processing, CO2
Manure deposited on pasture, N2O
Manure applied
to feed, N2O
Fertilizer,N2O
Crop residue
decomposition, N2O
Manure management,
CH4
Manure management,
N2O
Perc
enta
ge c
hang
e in
abs
olut
e em
issi
ons
relativ
e to
bas
elin
e
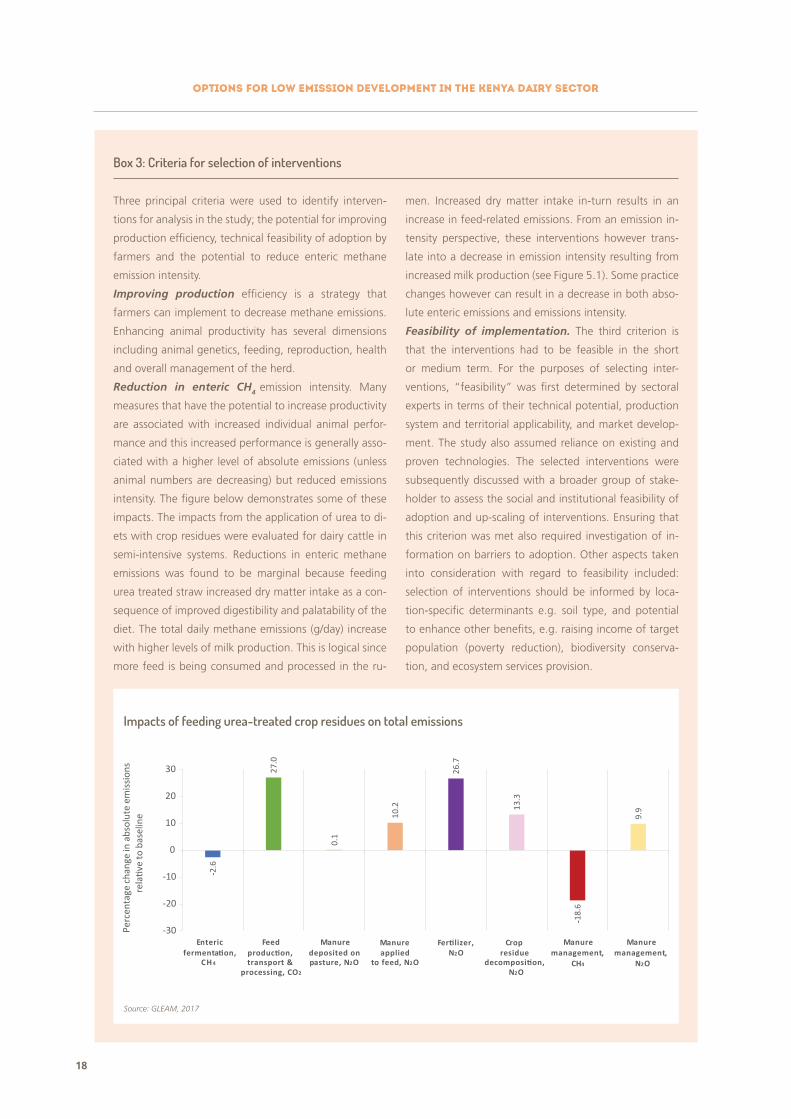
Impacts of feeding urea-treated crop residues on total emissions
Box 3: Criteria for selection of interventions
Three principal criteria were used to identify interven-
tions for analysis in the study; the potential for improving
production efficiency, technical feasibility of adoption by
farmers and the potential to reduce enteric methane
emission intensity.
Improving production efficiency is a strategy that
farmers can implement to decrease methane emissions.
Enhancing animal productivity has several dimensions
including animal genetics, feeding, reproduction, health
and overall management of the herd.
Reduction in enteric CH4 emission intensity. Many
measures that have the potential to increase productivity
are associated with increased individual animal perfor-
mance and this increased performance is generally asso-
ciated with a higher level of absolute emissions (unless
animal numbers are decreasing) but reduced emissions
intensity. The figure below demonstrates some of these
impacts. The impacts from the application of urea to di-
ets with crop residues were evaluated for dairy cattle in
semi-intensive systems. Reductions in enteric methane
emissions was found to be marginal because feeding
urea treated straw increased dry matter intake as a con-
sequence of improved digestibility and palatability of the
diet. The total daily methane emissions (g/day) increase
with higher levels of milk production. This is logical since
more feed is being consumed and processed in the ru-
men. Increased dry matter intake in-turn results in an
increase in feed-related emissions. From an emission in-
tensity perspective, these interventions however trans-
late into a decrease in emission intensity resulting from
increased milk production (see Figure 5.1). Some practice
changes however can result in a decrease in both abso-
lute enteric emissions and emissions intensity.
Feasibility of implementation. The third criterion is
that the interventions had to be feasible in the short
or medium term. For the purposes of selecting inter-
ventions, “feasibility” was first determined by sectoral
experts in terms of their technical potential, production
system and territorial applicability, and market develop-
ment. The study also assumed reliance on existing and
proven technologies. The selected interventions were
subsequently discussed with a broader group of stake-
holder to assess the social and institutional feasibility of
adoption and up-scaling of interventions. Ensuring that
this criterion was met also required investigation of in-
formation on barriers to adoption. Other aspects taken
into consideration with regard to feasibility included:
selection of interventions should be informed by loca-
tion-specific determinants e.g. soil type, and potential
to enhance other benefits, e.g. raising income of target
population (poverty reduction), biodiversity conserva-
tion, and ecosystem services provision.
Source: GLEAM, 2017
OptiOns fOr lOw emissiOn develOpment in the KenYA dAirY sectOr
19
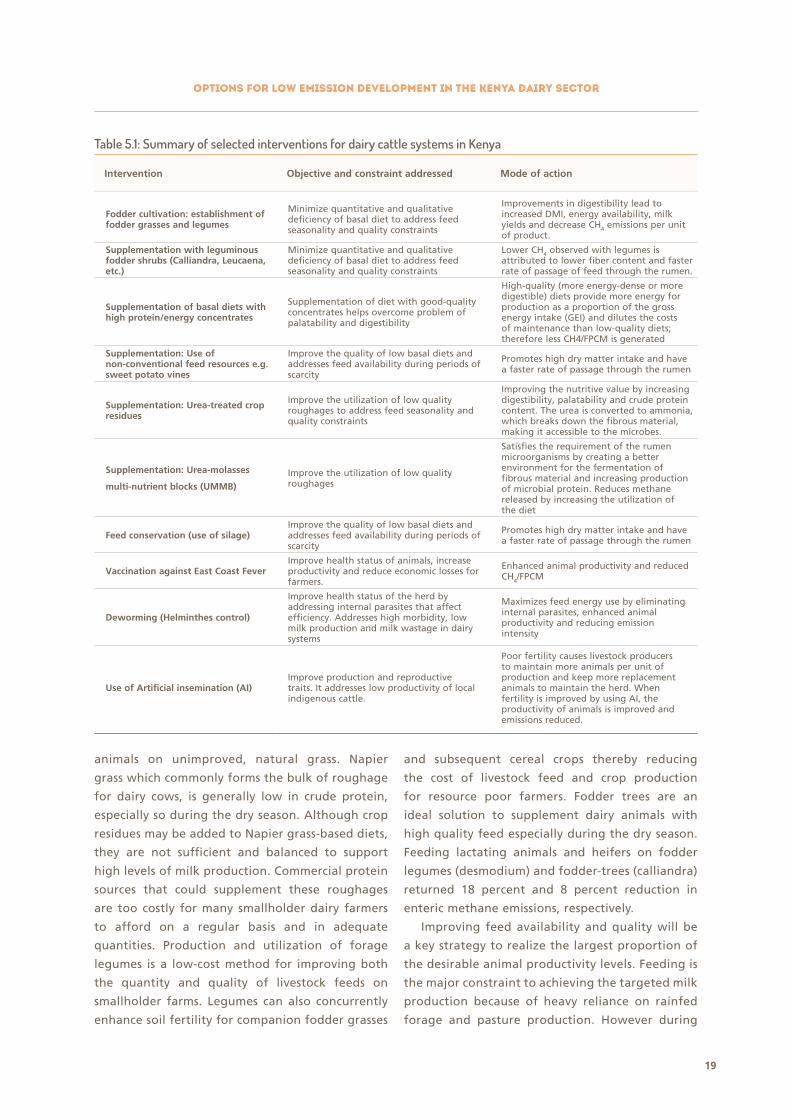
Table 5.1: Summary of selected interventions for dairy cattle systems in Kenya
intervention Objective and constraint addressed Mode of action
Fodder cultivation: establishment of fodder grasses and legumes
Minimize quantitative and qualitative deficiency of basal diet to address feed seasonality and quality constraints
Improvements in digestibility lead to increased DMI, energy availability, milk yields and decrease CH4 emissions per unit of product.
supplementation with leguminous fodder shrubs (Calliandra, Leucaena, etc.)
Minimize quantitative and qualitative deficiency of basal diet to address feed seasonality and quality constraints
Lower CH4 observed with legumes is attributed to lower fiber content and faster rate of passage of feed through the rumen.
supplementation of basal diets with high protein/energy concentrates
Supplementation of diet with good-quality concentrates helps overcome problem of palatability and digestibility
High-quality (more energy-dense or more digestible) diets provide more energy for production as a proportion of the gross energy intake (GEI) and dilutes the costs of maintenance than low-quality diets; therefore less CH4/FPCM is generated
supplementation: Use of non-conventional feed resources e.g. sweet potato vines
Improve the quality of low basal diets and addresses feed availability during periods of scarcity
Promotes high dry matter intake and have a faster rate of passage through the rumen
supplementation: Urea-treated crop residues
Improve the utilization of low quality roughages to address feed seasonality and quality constraints
Improving the nutritive value by increasing digestibility, palatability and crude protein content. The urea is converted to ammonia, which breaks down the fibrous material, making it accessible to the microbes.
supplementation: Urea-molasses
multi-nutrient blocks (UMMB)Improve the utilization of low quality roughages
Satisfies the requirement of the rumen microorganisms by creating a better environment for the fermentation of fibrous material and increasing production of microbial protein. Reduces methane released by increasing the utilization of the diet
Feed conservation (use of silage)Improve the quality of low basal diets and addresses feed availability during periods of scarcity
Promotes high dry matter intake and have a faster rate of passage through the rumen
Vaccination against east Coast FeverImprove health status of animals, increase productivity and reduce economic losses for farmers.
Enhanced animal productivity and reduced CH4/FPCM
deworming (helminthes control)
Improve health status of the herd by addressing internal parasites that affect efficiency. Addresses high morbidity, low milk production and milk wastage in dairy systems
Maximizes feed energy use by eliminating internal parasites, enhanced animal productivity and reducing emission intensity
Use of Artificial insemination (Ai)Improve production and reproductive traits. It addresses low productivity of local indigenous cattle.
Poor fertility causes livestock producers to maintain more animals per unit of production and keep more replacement animals to maintain the herd. When fertility is improved by using AI, the productivity of animals is improved and emissions reduced.
animals on unimproved, natural grass. Napier
grass which commonly forms the bulk of roughage
for dairy cows, is generally low in crude protein,
especially so during the dry season. Although crop
residues may be added to Napier grass-based diets,
they are not sufficient and balanced to support
high levels of milk production. Commercial protein
sources that could supplement these roughages
are too costly for many smallholder dairy farmers
to afford on a regular basis and in adequate
quantities. Production and utilization of forage
legumes is a low-cost method for improving both
the quantity and quality of livestock feeds on
smallholder farms. Legumes can also concurrently
enhance soil fertility for companion fodder grasses
and subsequent cereal crops thereby reducing
the cost of livestock feed and crop production
for resource poor farmers. Fodder trees are an
ideal solution to supplement dairy animals with
high quality feed especially during the dry season.
Feeding lactating animals and heifers on fodder
legumes (desmodium) and fodder-trees (calliandra)
returned 18 percent and 8 percent reduction in
enteric methane emissions, respectively.
Improving feed availability and quality will be
a key strategy to realize the largest proportion of
the desirable animal productivity levels. Feeding is
the major constraint to achieving the targeted milk
production because of heavy reliance on rainfed
forage and pasture production. However during
OptiOns fOr lOw emissiOn develOpment in the KenYA dAirY sectOr
20
the dry season, feed availability reduces and
animals are forced to survive on scarce, low quality
mature grass and crop residues. In addition, there
is low adoption of alternative feeding strategies
such as use of conserved feeds or use of non-
conventional feed resource materials to smoothen
seasonal fluctuations in milk production.
Two interventions were assessed to address
the constraint of seasonality of feed: use of urea-
treated crop residues and feed conservation (silage
making) by preserving forage during periods of
abundance (rainy season) for use during periods
of feed scarcity. Crop residues can be used to
bridge the feed gap however, they do not supply
adequate nutrients without supplementation.
Because of their low digestibility they remain
in the rumen for a long time, limiting intake.
Another major limitation is they do not contain
sufficient crude protein to support adequate
microbial activity in the rumen. This often leads
to feeding of a nutritionally imbalanced ration
which contains proteins, energy, minerals and
vitamins either in excess or shortage relative to the
nutrient requirements of the animals. Imbalanced
feeding adversely impacts productivity, health of
animals and increases the environmental impact.
Treating crop residues with urea solution improves
the nutritive value by increasing the digestibility,
palatability and crude protein content. The
intervention was applied in intensive systems
where use of crop-residues is common. Feeding
urea-treated crop residues in intensive and semi-
intensive systems results in a reduction in methane
emissions by 13.4 percent and 26 percent, respectively.
A conservative approach was adopted to reflect the
current low adoption rates due knowledge and
technical barriers e.g. fear of ammonia poisoning
and lack of technical skills in mixing and treatment
of residues.
The use of feed conservation techniques was
evaluated as an intervention to even out seasonality
of feed quantity and quality and consequent
fluctuations in milk production. Feeding conserved
fodder (sweet potato vine silage) results in similar
reductions in the intensive and semi-intensive
systems: 10.3 percent and 9.3 percent, respectively.
Strategic supplementation of critical nutrients
stimulates intake of feed in ruminants and increases
the efficiency of production in systems where animals
rely are on low quality diets. Urea-molasses multi-
nutrient blocks (UMMB) provide both energy and
nitrogen to the microorganisms in the rumen and
thus improve the digestion of crop residues such
as straw. It provides a readily available source of
energy, protein and minerals for the dairy animal.
Supplementation with UMMB resulted in similar
methane reductions of 10.8 percent and 10.7 percent
in the semi-intensive and extensive dairy production
systems, respectively.
Dairy farmers tend to compensate for some of the
shortages by purchasing concentrate feeds, however
evidence from a number of studies indicates that
the large majority of farmers feed a low, flat rate of
concentrates throughout lactation, typical quantities
being 2 kg/day. This often results in under-nutrition
in the early part of lactation and can have a negative
effect on milk production later in lactation. The
intervention evaluated was the feeding of 8 kg
concentrates/day for the first 12 weeks of lactation
rather than the general practice of feeding a flat rate
of 2 kg/day. This intervention resulted in a reduction
in enteric CH4 by 6.5 percent, 12.3 percent and 10.6
percent in intensive, semi-intensive and extensive
systems, respectively. And a corresponding increase
in milk production by 4.3 percent, 12.4 percent and
10.2 percent.
It may be possible to combine some of the
feeding and nutritional management approaches
to reduce enteric CH4/FPCM. Two combinations
of feeding practices (combining use of non-
conventional feed resources, feed conservation and
feeding of high energy/protein and an additional
one including the use of non-conventional feed
resources and feed conservation) were evaluated.
Both returned the highest impacts both in terms of
CH4 emission reductions and productivity impacts.
The use of non-conventional feed resources, feed
conservation and feeding of high energy/protein
resulted in 20–45 percent reduction in methane
emission intensity and 23–80 percent increase in
milk production. Strategic supplementation with
sweet potato vines and sorghum silage in intensive
and semi-intensive systems reduces enteric methane
emissions by 10–25 percent and results in milk
production increases between 9–32 percent (Figure
5.1).
OptiOns fOr lOw emissiOn develOpment in the KenYA dAirY sectOr
21
Tick-borne diseases constitute the largest
component of all animal diseases that impact
negatively on the dairy industry. East Coast Fever
(ECF) is a disease of importance to dairy farmers in
Kenya. Prevalence is high in areas with extensive
free grazing pastures and in semi-intensive paddock
grazing herds in lowland areas where risk reaches
30 percent per year and account for over half of all
clinical cases. Risks in the highlands particularly in
stall-fed dairies are less than 3 percent per annum12.
The impact of tick-borne diseases is through high
mortality rates. Decreasing mortality and morbidity
rates has a significant effect on CH4 reduction
because animals that die or are culled before their
first lactation represent a significant loss of energy
and resources without any usable food being
produced. Disease challenges also translate into
metabolic changes such as reduced feed intake as
well as increased requirements for maintenance
energy that in turn increase GHG emissions. In
Kenya, East Coast Fever poses a significant threat to
the livestock sector through the economic impact of
the disease from cattle morbidity and mortality and
production losses in all production systems.
From various studies, the three main diseases
that affect dairy in Kenya are, ECF, internal parasites
and diarrhea13. In addition, high helminth burden
has been shown to increase the risk of ECF death.
Helminthes are internal parasites that consume
nutrients meant for animals. They cause direct losses
through mortalities especially in calves. Diarrhea in
calves has been reported to be the most important
cause of calf morbidity, reduced growth rate, and
delayed age at first calving and cause of mortality.
In older animals, this results in reduced reproductive
efficiency, milk production and high economic losses
through purchase of drugs and forgone profits.
Interventions to vaccinate against East Coast Fever
result in 18.5 percent, 14.2 percent and 17 percent
reductions in enteric CH4 in extensive, intensive and
semi-intensive systems, respectively. These impacts
are achieved through decreased mortality rates, live-
weight gain and increased milk yield. Deworming on
the other hand resulted in reductions of 8 percent, 10
percent and 20 percent in intensive, semi-intensive
and extensive dairy production systems, respectively.
The use of improved breeds with higher milk
yield potential results in 12 percent, 16 percent
and 7 percent reduction in emission intensity in
intensive, semi-intensive and extensive livestock
systems (Figure 5.1). The impacts on emission
intensity are achieved through reductions in
number of replacement breeding animals and male
animals needed for reproduction, improvements in
reproductive performance of the herd (age at first
calving) and through increased milk production via a
combination of higher milk yields per day and longer
lactation periods).
Quantitative summary of mitigation and productivity outcomes from the application of mitigation packages (combined technologies) Significant reductions in emissions can be achieved
through a combination of herd and health
management, nutrition and feeding management
strategies, and improved genetics. The reality is that
farmers are likely to combine technologies and will
select the combination of technologies that will
maximize a number objectives and address multiple
constraints to productivity. The joint impacts realized
from applying a combination of technologies are
better understood as multiplicative rather than
additive i.e. they are mutually enhancing and
dependent.
Applying combinations of interventions
aimed at improving feed availability and quality
(establishment of fodder grasses and legumes, use of
conserved silage and UMMB); improved herd health
(vaccination against East Coast Fever) and improved
genetics (artificial insemination) can potentially
result in a reduction potential of 21–36 percent in
emission intensity relative to the baseline emission
intensity. With these combinations of technologies,
an increase in milk production of 31–35 percent can
be achieved compared to the baseline (Figure 5.2).
12 Government of Kenya: Kenyan Dairy Master Plan (http://kdb.co.ke/press/publications/reports/5-kenya-national-dairy-master-plan/file.html)13 Phiri, B. J., Benschop, J., & French, N. P. (2010). Systematic review of causes and factors associated with morbidity and mortality on smallholder dairy farms in Eastern and Southern
Africa. Preventive veterinary medicine, 94(1), 1-8.; Njehu, A., Omore, A. O., Baltenweck, I., & Muriithi, B. (2011). Livestock disease challenges and gaps in delivery of animal health services. https://cgspace.cgiar.org/bitstream/handle/10568/3746/EADD_baselinebrief_4.pdf; Thumbi, S. M., de Clare Bronsvoort, B. M., Poole, E. J., Kiara, H., Toye, P. G., Mbole-Kariuki, M. N., ... & Steyl, J. C. (2014). Parasite co-infections and their impact on survival of indigenous cattle. PloS one, 9(2), e76324.
http://journals.plos.org/plosone/article?id=10.1371/journal.pone.0076324
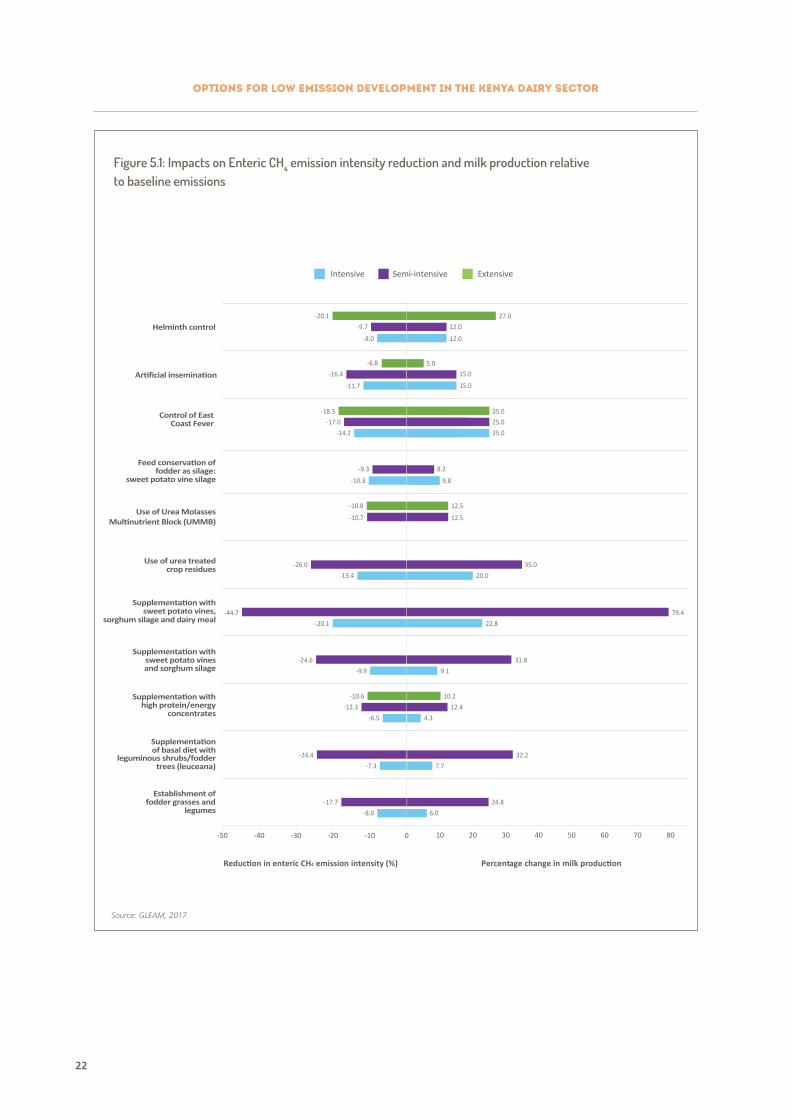
OptiOns fOr lOw emissiOn develOpment in the KenYA dAirY sectOr
22
Semi-intensive ExtensiveIntensive
-8.0
-7.3
-6.5
-9.9
-20.1
-13.4
-10.3
-14.2
-11.7
-8.0
-17.7
-24.4
-12.3
-24.6
-44.7
-26.0
-10.7
-9.3
-17.0
-16.4
-9.7
-10.6
-10.8
-18.5
-6.8
-20.1
-50 -40 -30 -20 -10 0
Establishment offodder grasses and
legumes
Supplementationof basal diet with
leguminous shrubs/foddertrees (leuceana)
Supplementation withhigh protein/energy
concentrates
Supplementation withsweet potato vinesand sorghum silage
Supplementation with sweet potato vines,
sorghum silage and dairy meal
Use of urea treatedcrop residues
Use of Urea MolassesMultinutrient Block (UMMB)
Feed conservation offodder as silage:
sweet potato vine silage
Control of East Coast Fever
Artificial insemination
Helminth control
Reduction in enteric CH4 emission intensity (%)
6.0
7.7
4.3
9.1
22.8
20.0
9.8
25.0
15.0
12.0
24.8
32.2
12.4
31.8
79.4
35.0
12.5
8.2
25.0
15.0
12.0
10.2
12.5
25.0
5.0
27.0
10 20 30 40 50 60 70 80
Percentage change in milk production
Figure 5.1: Impacts on Enteric CH4 emission intensity reduction and milk production relative to baseline emissions
Source: GLEAM, 2017
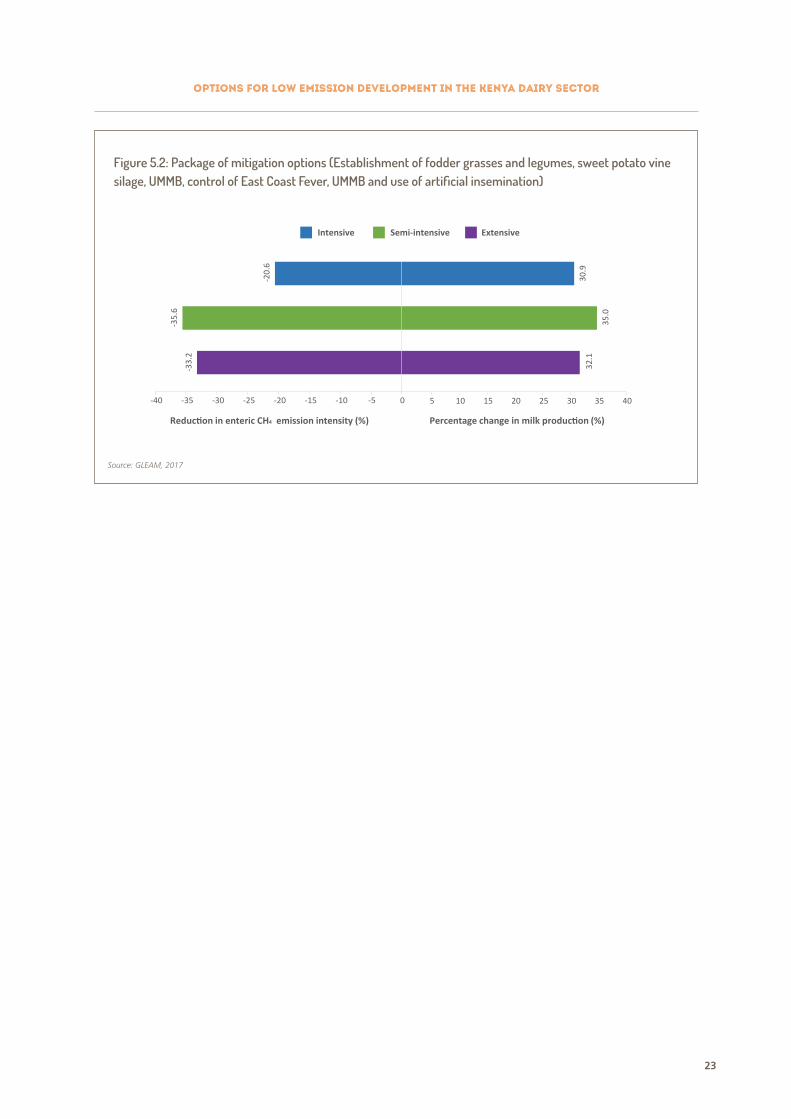
OptiOns fOr lOw emissiOn develOpment in the KenYA dAirY sectOr
23
ExtensiveSemi-intensiveIntensive
-33.
2
-35.
6
-20.
6
-40 -35 -30 -25 -20 -15 -10 -5 0
Reduction in enteric CH4 emission intensity (%)
32.1
35.0
30.9
5 10 15 20 25 30 35 40
Percentage change in milk production (%)
Figure 5.2: Package of mitigation options (Establishment of fodder grasses and legumes, sweet potato vine silage, UMMB, control of East Coast Fever, UMMB and use of artificial insemination)
Source: GLEAM, 2017
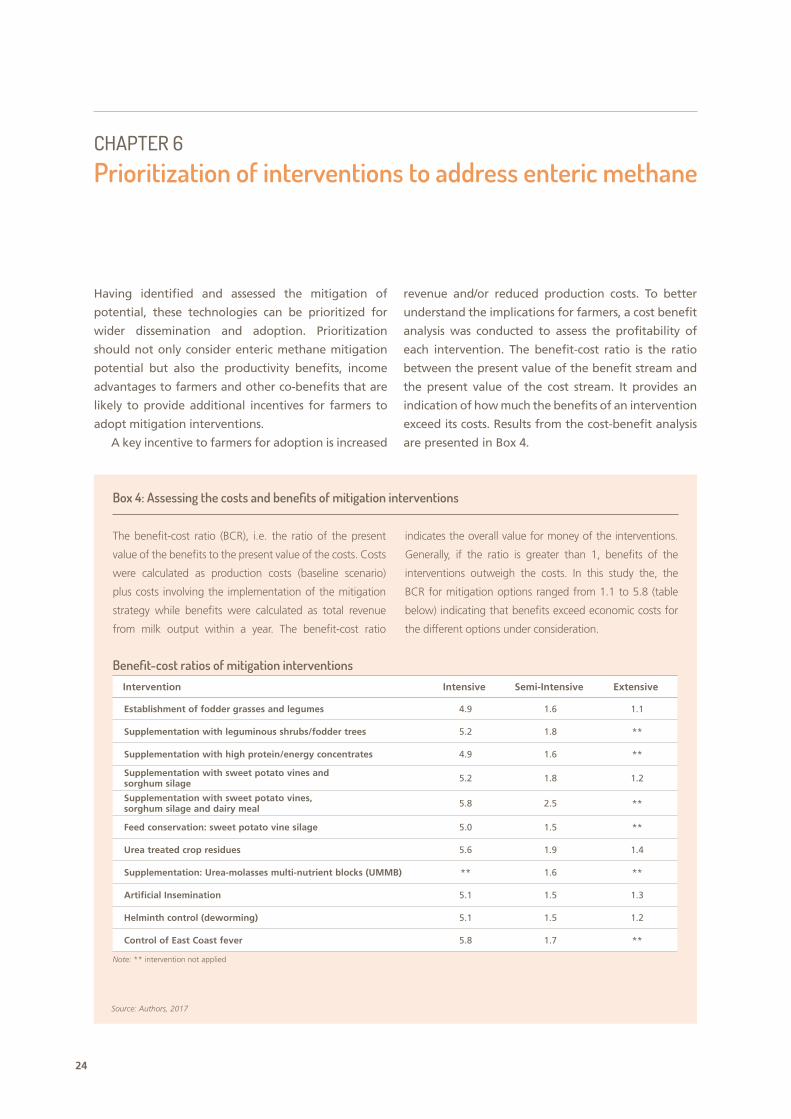
24
Having identified and assessed the mitigation of
potential, these technologies can be prioritized for
wider dissemination and adoption. Prioritization
should not only consider enteric methane mitigation
potential but also the productivity benefits, income
advantages to farmers and other co-benefits that are
likely to provide additional incentives for farmers to
adopt mitigation interventions.
A key incentive to farmers for adoption is increased
revenue and/or reduced production costs. To better
understand the implications for farmers, a cost benefit
analysis was conducted to assess the profitability of
each intervention. The benefit-cost ratio is the ratio
between the present value of the benefit stream and
the present value of the cost stream. It provides an
indication of how much the benefits of an intervention
exceed its costs. Results from the cost-benefit analysis
are presented in Box 4.
CHAPTER 6
Prioritization of interventions to address enteric methane
Box 4: Assessing the costs and benefits of mitigation interventions
The benefit-cost ratio (BCR), i.e. the ratio of the present
value of the benefits to the present value of the costs. Costs
were calculated as production costs (baseline scenario)
plus costs involving the implementation of the mitigation
strategy while benefits were calculated as total revenue
from milk output within a year. The benefit-cost ratio
indicates the overall value for money of the interventions.
Generally, if the ratio is greater than 1, benefits of the
interventions outweigh the costs. In this study the, the
BCR for mitigation options ranged from 1.1 to 5.8 (table
below) indicating that benefits exceed economic costs for
the different options under consideration.
Benefit-cost ratios of mitigation interventions intervention intensive semi-intensive extensive
establishment of fodder grasses and legumes 4.9 1.6 1.1
supplementation with leguminous shrubs/fodder trees 5.2 1.8 **
supplementation with high protein/energy concentrates 4.9 1.6 **
supplementation with sweet potato vines and sorghum silage 5.2 1.8 1.2
supplementation with sweet potato vines, sorghum silage and dairy meal 5.8 2.5 **
Feed conservation: sweet potato vine silage 5.0 1.5 **
Urea treated crop residues 5.6 1.9 1.4
supplementation: Urea-molasses multi-nutrient blocks (UMMB) ** 1.6 **
Artificial insemination 5.1 1.5 1.3
helminth control (deworming) 5.1 1.5 1.2
Control of east Coast fever 5.8 1.7 **
Note: ** intervention not applied
Source: Authors, 2017
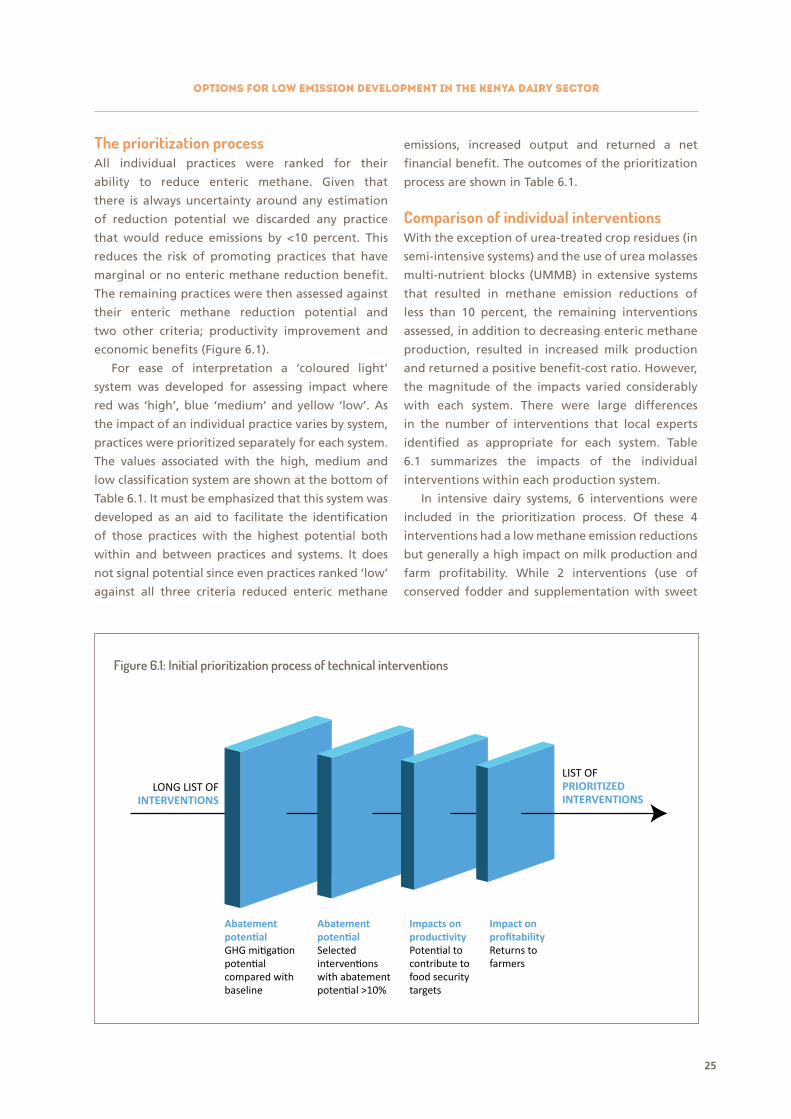
OptiOns fOr lOw emissiOn develOpment in the KenYA dAirY sectOr
25
The prioritization process All individual practices were ranked for their
ability to reduce enteric methane. Given that
there is always uncertainty around any estimation
of reduction potential we discarded any practice
that would reduce emissions by <10 percent. This
reduces the risk of promoting practices that have
marginal or no enteric methane reduction benefit.
The remaining practices were then assessed against
their enteric methane reduction potential and
two other criteria; productivity improvement and
economic benefits (Figure 6.1).
For ease of interpretation a ‘coloured light’
system was developed for assessing impact where
red was ‘high’, blue ‘medium’ and yellow ‘low’. As
the impact of an individual practice varies by system,
practices were prioritized separately for each system.
The values associated with the high, medium and
low classification system are shown at the bottom of
Table 6.1. It must be emphasized that this system was
developed as an aid to facilitate the identification
of those practices with the highest potential both
within and between practices and systems. It does
not signal potential since even practices ranked ‘low’
against all three criteria reduced enteric methane
emissions, increased output and returned a net
financial benefit. The outcomes of the prioritization
process are shown in Table 6.1.
Comparison of individual interventionsWith the exception of urea-treated crop residues (in
semi-intensive systems) and the use of urea molasses
multi-nutrient blocks (UMMB) in extensive systems
that resulted in methane emission reductions of
less than 10 percent, the remaining interventions
assessed, in addition to decreasing enteric methane
production, resulted in increased milk production
and returned a positive benefit-cost ratio. However,
the magnitude of the impacts varied considerably
with each system. There were large differences
in the number of interventions that local experts
identified as appropriate for each system. Table
6.1 summarizes the impacts of the individual
interventions within each production system.
In intensive dairy systems, 6 interventions were
included in the prioritization process. Of these 4
interventions had a low methane emission reductions
but generally a high impact on milk production and
farm profitability. While 2 interventions (use of
conserved fodder and supplementation with sweet
LONG LIST OFINTERVENTIONS
Abatement potentialGHG mitigation potential compared with baseline
Abatement potentialSelected interventions with abatement potential >10%
Impacts on productivityPotential to contribute to food security targets
Impact on profitabilityReturns to farmers
LIST OFPRIORITIZEDINTERVENTIONS
Figure 6.1: Initial prioritization process of technical interventions
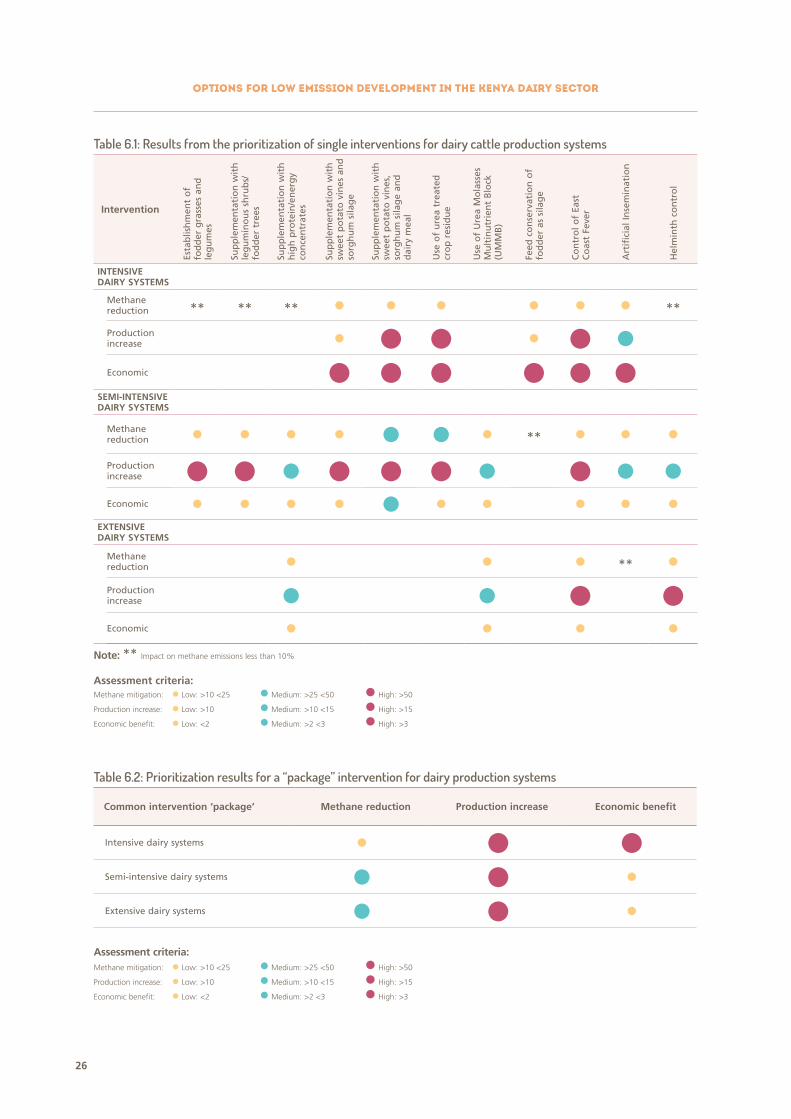
OptiOns fOr lOw emissiOn develOpment in the KenYA dAirY sectOr
26
Table 6.1: Results from the prioritization of single interventions for dairy cattle production systems
intervention
Esta
blis
hm
ent
of
fod
der
gra
sses
an
d
leg
um
es
Sup
ple
men
tati
on
wit
h
leg
um
ino
us
shru
bs/
fod
der
tre
es
Sup
ple
men
tati
on
wit
h
hig
h p
rote
in/e
ner
gy
con
cen
trat
es
Sup
ple
men
tati
on
wit
h
swee
t p
ota
to v
ines
an
d
sorg
hu
m s
ilag
e
Sup
ple
men
tati
on
wit
h
swee
t p
ota
to v
ines
, so
rgh
um
sila
ge
and
d
airy
mea
l
Use
of
ure
a tr
eate
d
cro
p r
esid
ue
Use
of
Ure
a M
ola
sses
M
ult
inu
trie
nt
Blo
ck
(UM
MB
)
Feed
co
nse
rvat
ion
of
fod
der
as
sila
ge
Co
ntr
ol o
f Ea
st
Co
ast
Feve
r
Art
ific
ial I
nse
min
atio
n
Hel
min
th c
on
tro
l
iNteNsiVe dAiRy systeMs
Methane reduction ** ** ** **
Production increase Economic
seMi-iNteNsiVe dAiRy systeMs
Methane reduction **
Production increase Economic
eXteNsiVe dAiRy systeMs
Methane reduction **
Production increase Economic
Note: ** Impact on methane emissions less than 10%
Assessment criteria:Methane mitigation: Low: >10 <25 Medium: >25 <50 High: >50
Production increase: Low: >10 Medium: >10 <15 High: >15
Economic benefit: Low: <2 Medium: >2 <3 High: >3
Table 6.2: Prioritization results for a “package” intervention for dairy production systems
Common intervention ‘package’ Methane reduction production increase economic benefit
Intensive dairy systems Semi-intensive dairy systems
Extensive dairy systems
Assessment criteria:Methane mitigation: Low: >10 <25 Medium: >25 <50 High: >50
Production increase: Low: >10 Medium: >10 <15 High: >15
Economic benefit: Low: <2 Medium: >2 <3 High: >3
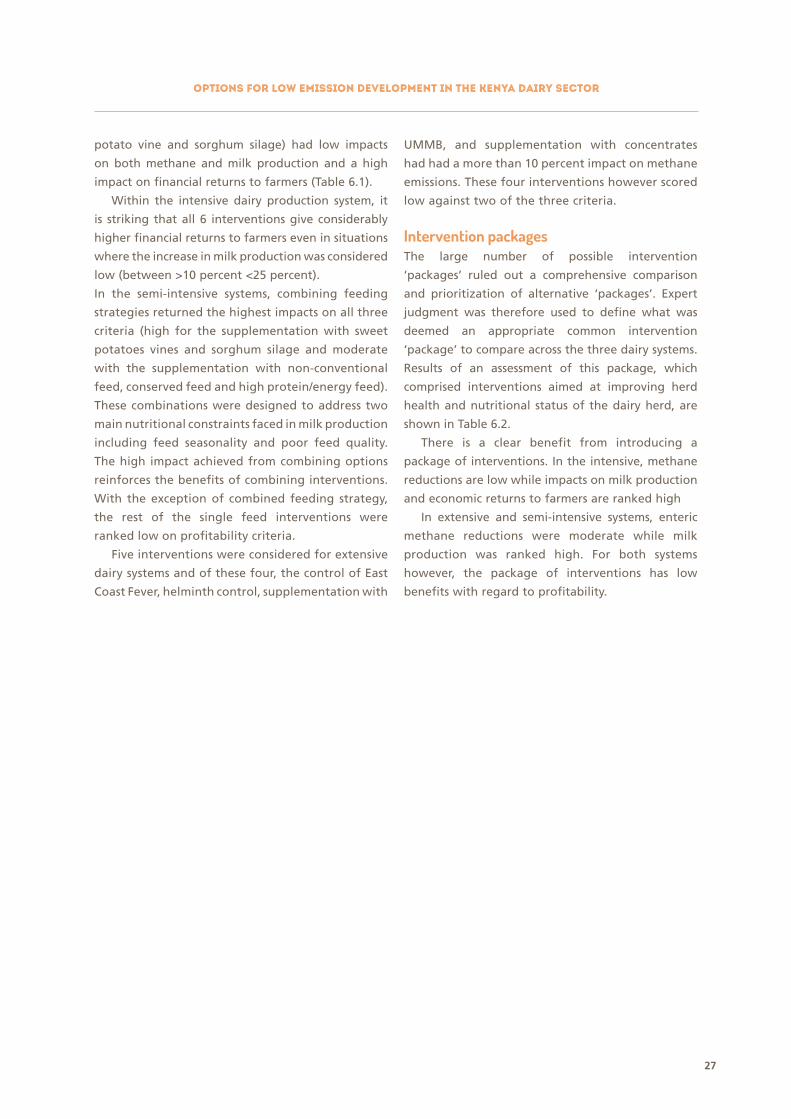
OptiOns fOr lOw emissiOn develOpment in the KenYA dAirY sectOr
27
potato vine and sorghum silage) had low impacts
on both methane and milk production and a high
impact on financial returns to farmers (Table 6.1).
Within the intensive dairy production system, it
is striking that all 6 interventions give considerably
higher financial returns to farmers even in situations
where the increase in milk production was considered
low (between >10 percent <25 percent).
In the semi-intensive systems, combining feeding
strategies returned the highest impacts on all three
criteria (high for the supplementation with sweet
potatoes vines and sorghum silage and moderate
with the supplementation with non-conventional
feed, conserved feed and high protein/energy feed).
These combinations were designed to address two
main nutritional constraints faced in milk production
including feed seasonality and poor feed quality.
The high impact achieved from combining options
reinforces the benefits of combining interventions.
With the exception of combined feeding strategy,
the rest of the single feed interventions were
ranked low on profitability criteria.
Five interventions were considered for extensive
dairy systems and of these four, the control of East
Coast Fever, helminth control, supplementation with
UMMB, and supplementation with concentrates
had had a more than 10 percent impact on methane
emissions. These four interventions however scored
low against two of the three criteria.
Intervention packagesThe large number of possible intervention
‘packages’ ruled out a comprehensive comparison
and prioritization of alternative ‘packages’. Expert
judgment was therefore used to define what was
deemed an appropriate common intervention
‘package’ to compare across the three dairy systems.
Results of an assessment of this package, which
comprised interventions aimed at improving herd
health and nutritional status of the dairy herd, are
shown in Table 6.2.
There is a clear benefit from introducing a
package of interventions. In the intensive, methane
reductions are low while impacts on milk production
and economic returns to farmers are ranked high
In extensive and semi-intensive systems, enteric
methane reductions were moderate while milk
production was ranked high. For both systems
however, the package of interventions has low
benefits with regard to profitability.
28
Smallholder dairy systems will continue to be a dom-
inant agricultural production system in Kenya. Dairy
farming is part and parcel of many such systems, and is
an important livelihood option to increase household
income of dairy farmers in Kenya. This study reveals
that pathways for enhancing productivity and achiev-
ing emission reductions exist in all the three systems
however the greatest opportunities for immediate
mitigation and productivity increases at scale lie in the
semi-intensive and intensive dairy systems.
The results presented in the preceding sections
indicate that there are significant opportunities for
growth on a low emissions path for the dairy sector and
that economically viable opportunities exist within all
production systems. The study also indicates that while
there are many interventions to reduce emissions and
improve productivity, the same intervention can also
have contrasting impacts on emissions, production and
farmer revenues as Table 6.1 illustrates. This reinforces
the need to tailor interventions to local realities.
Increasing individual animal productivity as a
consequence of better feeding practices, improved
health and herd management, also results in a
reduction of the herd. Reduction in animal numbers,
particularly in subsistence production systems, allows
for the provision of adequate feed, better health
management leading to improvements at both animal
and herd levels. Methane emissions will be reduced
at both the total herd and per liter of milk. However,
these mitigation options might be in conflict with the
interests of smallholders who generally tend to keep
animals for other functions such as traction, nutrient
value of manure and risk management. Particularly in
the extensive systems, appreciation of these roles is
necessary if any policy geared towards change in the
structure of the systems is to succeed.
Improved integration of smallholder households
into the market will possibly reduce non-market roles
of dairy cattle. However, this will entail deliberate
efforts geared towards the development of product
markets and incentives/measures that support the
replacement of such functions and compensate farmers
for loss of these functions. With well-functioning
markets, the role of cattle as insurance against risk and
that of financing unexpected household expenditures
will decline. This is because functioning markets
provide signals for investment decisions as well as
opportunities for long term planning.
Increases in milk productivity can result in benefits
not only at farm-level (income, food security and
nutrition) but also across the dairy value chain. These
productivity improvements are also likely to spur
development across the dairy value chain.
Beyond the production constraints, the Kenyan
dairy sector is characterized by a number of systemic
barriers, including, poor infrastructure, limited
incentive for farmers to enter formal market value
chain, etc.
The market challenges include unstable milk supply
with cycles of abundance and scarcity, high cost of
milk processing, poor milk quality and safety, etc .
Despite these challenges, the growth in demand for
high quality milk and diverse dairy products in both
the domestic and regional markets, are opening
investment opportunities. Medium and large-scale
farms and entrepreneurial smallholders can benefit
from delivering milk to expanding diverse, well-
structured and trusted formal markets. Other market
opportunities are offered by a growing demand
for equipment for milk handling, bulking, chilling,
processing and dispensing by various enterprises.
The Government of Kenya and many county
governments are investing in local milk-chilling and
-processing equipment to drive growth of the dairy
market.
• Introducing better animal feeding practices to
small-holder farmers will help stabilize shifts in
milk production volume. The yield per cow and by
CHAPTER 7
Un-locking the potential of ‘no regrets’ opportunities
OptiOns fOr lOw emissiOn develOpment in the KenYA dAirY sectOr
29
extension the amount of milk produced in Kenya
fluctuates greatly during the year. This has a great
effect on the processors’ ability to absorb all the
milk produced at any time during the year, with a
period of surplus followed shortly by that of low
milk volumes. Improvements in milk supply will
address constraint of milk fluctuations; currently,
milk fluctuates between dry and rainy seasons,
resulting in capacity utilization of only 40–50 per-
cent. considerable seasonal variations in milk pro-
duction between Kenya’s rainy and dry seasons
causes market disruption and swings in producer
prices that deter planning and investment. Farm-
ers can mitigate these effects through the use of
drought-resistant crops and feed preparation and
storage methods such as silage as described in
previous chapters
• Poor infrastructure: Poor farm-to-market roads in
many rural locations greatly increase the cost of
milk delivery, the time milk remains unrefriger-
ated, and its quality. Infrastructural development
needs to be considered so as to improve market
access. Generally, milk producing areas tend to
have poor infrastructure in terms of roads, elec-
tricity especially during the rainy season. The
infrastructure challenge extends to the lack of
milk handling and storage facilities at the farm
level, leading to milk spoilage and milk loss at the
farm. Poor infrastructure reduces producer’s mar-
gin as it results in high market transaction costs.
On the processing side, infrastructural challenges
remain, with limited capacities of dairies to con-
vert excess milk into long life products and limited
storage at the dairies.
• Limited incentive for farmers to enter the formal
market value-chain. There is little incentive for
most smallholders to supply the formal market as
opposed to the informal market. About 70 percent
of the milk is marketed through traders, cooper-
atives, hotels and kiosks. The factors driving the
continued importance of the informal market are
traditional preferences for fresh raw milk, which
is boiled before consumption, and unwillingness
to pay the costs of processing and packaging. By
avoiding pasteurizing and packaging costs, raw
milk markets offer both higher prices to producers
and lower prices to consumers14. An estimated 84
percent of the milk produced is sold in raw form
to consumers, providing instant cash or higher
prices to the farmer. This compromises product
quality while offering direct competition to the
dairy processing industry. Capacity utilization of
processing plants remains low (between 40–50
percent) as a result of seasonality and competition
with informal market.
The informal market channels are difficult to
regulate therefore limiting potential for transforming
the dairy sector into a highly commercialized industry.
The Kenya Dairy Board recognizes the informal
market as a major player in the industry and this
is a step towards helping improve its functioning
through gradual regulation.
Addressing these issues requires innovations and
investments by dairy value chain actors and input and
service providers, if this potential is to be unlocked.
Development of the entire milk value chain will be
important if dairy producers and supply chain actors
are to benefit from increased productivity.
14 Meridian Institute, Dairy Value Chains. https://www.merid.org/~/media/Files/Projects/Value%20Chains%20Microsite/Dairy_Value_Chain_Overview.pdf
30
This chapter sets out to present key highlights and
messages from the analyses. It is not the intention
of the chapter to repeat the detailed analysis of
previous chapters but rather to draw out some key
overarching messages and policy conclusions, both
from the perspective of the results process and what
is actually required to implement on the ground.
1. The potential for low-cost abatement is sizableThis study helps illustrate how, the dairy sector
in Kenya could make substantial reductions in
emissions with interventions and investments that in
many cases will pay for themselves. The analysis on
the dairy sector demonstrates how milk productivity
can grow significantly (between 30 percent and 35
percent) while reducing emissions by 20 percent and
36 percent.
More importantly, from the study, low emissions
development of the dairy sector can support a range
of other national policy goals, including achieving
food and nutrition security, economic growth and
development, improved livelihoods, and environmental
protection. It is this combination of reasons that explains
the strong interest of Kenya in low emissions growth
and justifies investment in the sector.
However, achieving these reductions will require
ambitious action. Translating the actions outlined in
this document into food security and developmental
goals will require bolder efforts to support the
transfer and uptake of technology, reduce costs of
technologies, scale-up private sector finance, and
support access to climate finance.
2. Kenya is already actingThis study has contributed towards an ongoing
nationally-led process of identifying opportunities
for green growth as outlined in its National Climate
Change Action Plan and Vision 2030. The results
and findings of the Kenyan low emission study
have directly fed into the design of national policy
mitigation action for the dairy sector. Results were
used as a reference during the preparation of
Kenya’s Nationally Appropriate Mitigation Action
(NAMA) on dairy (Box 5). The aim of this NAMA is
to stimulate dairy development by enhancing dairy
efficiency and optimizing energy use along the
value chain to reduce GHG emissions. The activities
foreseen under the NAMA include assistance and
incentives to the private-sector to invest in low-
emission, gender-inclusive dairy advisory services
aimed at facilitating on-farm adoption of improved
production practices and technologies; enabling
investments in energy efficiency and renewable
energy technologies in milk collection, chilling and
processing; and supporting adoption of household
biogas technology. The dairy NAMA will reach
227,000 dairy producing households across the
country and is expected to yield an additional 6.6
billion litres of milk per annum, reaching over 30
million consumers. Over the 10-year implementation
period, the expected total emission reductions from
the implementation the NAMA are 8.8 million
tonnes CO2 eq.
3. Many interventions will pay for themselves but barriers need to be addressedA significant percentage of the emissions savings
come at negative cost, meaning they will actually
contribute not only reduce GHG emissions, but also
save money in the long-term. Figure 8.1 shows that
all of the total potential for emissions reduction have
positive net benefits (or “negative costs”).
All interventions assessed are cost-beneficial (i.e.
measure that not only reduce GHG emissions but
also save money in the long term) accounting for an
abatement potential of 15.9 million tonnes CO2 eq.
This doesn’t imply that this potential will be
realized in the absence of incentives.
CHAPTER 8
Key messages and policy conclusions
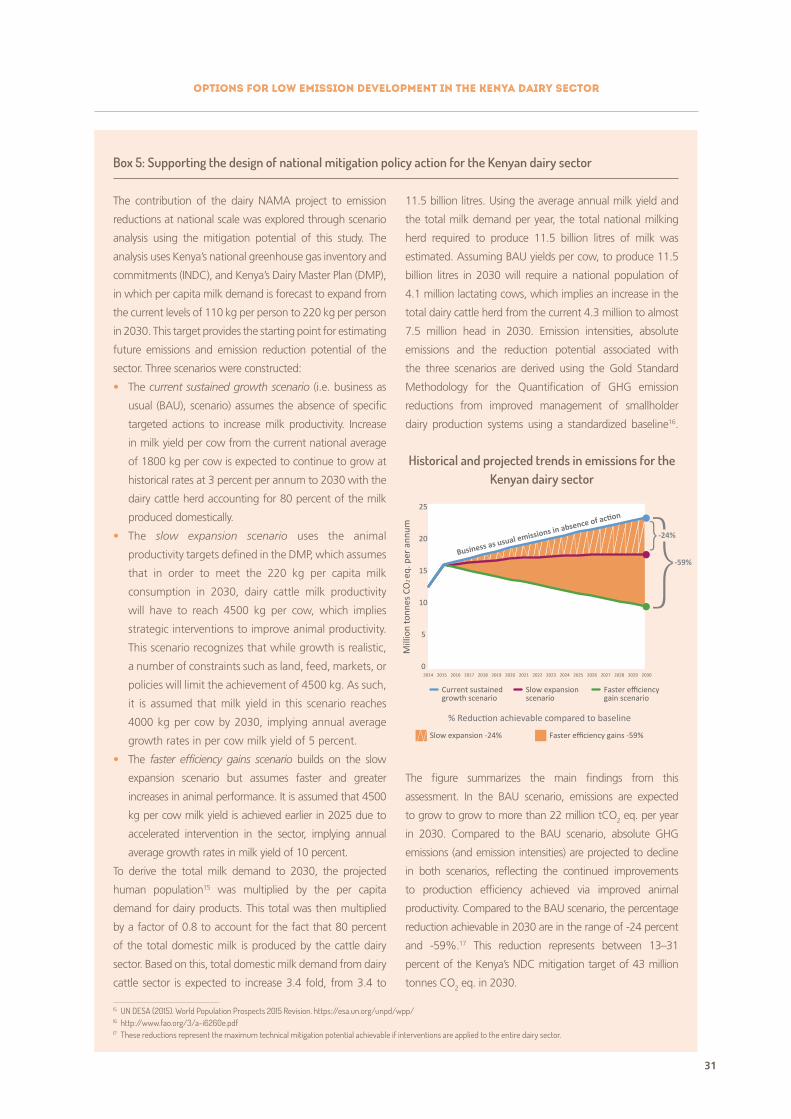
OptiOns fOr lOw emissiOn develOpment in the KenYA dAirY sectOr
31
Box 5: Supporting the design of national mitigation policy action for the Kenyan dairy sector
The contribution of the dairy NAMA project to emission
reductions at national scale was explored through scenario
analysis using the mitigation potential of this study. The
analysis uses Kenya’s national greenhouse gas inventory and
commitments (INDC), and Kenya’s Dairy Master Plan (DMP),
in which per capita milk demand is forecast to expand from
the current levels of 110 kg per person to 220 kg per person
in 2030. This target provides the starting point for estimating
future emissions and emission reduction potential of the
sector. Three scenarios were constructed:
• The current sustained growth scenario (i.e. business as
usual (BAU), scenario) assumes the absence of specific
targeted actions to increase milk productivity. Increase
in milk yield per cow from the current national average
of 1800 kg per cow is expected to continue to grow at
historical rates at 3 percent per annum to 2030 with the
dairy cattle herd accounting for 80 percent of the milk
produced domestically.
• The slow expansion scenario uses the animal
productivity targets defined in the DMP, which assumes
that in order to meet the 220 kg per capita milk
consumption in 2030, dairy cattle milk productivity
will have to reach 4500 kg per cow, which implies
strategic interventions to improve animal productivity.
This scenario recognizes that while growth is realistic,
a number of constraints such as land, feed, markets, or
policies will limit the achievement of 4500 kg. As such,
it is assumed that milk yield in this scenario reaches
4000 kg per cow by 2030, implying annual average
growth rates in per cow milk yield of 5 percent.
• The faster efficiency gains scenario builds on the slow
expansion scenario but assumes faster and greater
increases in animal performance. It is assumed that 4500
kg per cow milk yield is achieved earlier in 2025 due to
accelerated intervention in the sector, implying annual
average growth rates in milk yield of 10 percent.
To derive the total milk demand to 2030, the projected
human population15 was multiplied by the per capita
demand for dairy products. This total was then multiplied
by a factor of 0.8 to account for the fact that 80 percent
of the total domestic milk is produced by the cattle dairy
sector. Based on this, total domestic milk demand from dairy
cattle sector is expected to increase 3.4 fold, from 3.4 to
11.5 billion litres. Using the average annual milk yield and
the total milk demand per year, the total national milking
herd required to produce 11.5 billion litres of milk was
estimated. Assuming BAU yields per cow, to produce 11.5
billion litres in 2030 will require a national population of
4.1 million lactating cows, which implies an increase in the
total dairy cattle herd from the current 4.3 million to almost
7.5 million head in 2030. Emission intensities, absolute
emissions and the reduction potential associated with
the three scenarios are derived using the Gold Standard
Methodology for the Quantification of GHG emission
reductions from improved management of smallholder
dairy production systems using a standardized baseline16.
The figure summarizes the main findings from this
assessment. In the BAU scenario, emissions are expected
to grow to grow to more than 22 million tCO2 eq. per year
in 2030. Compared to the BAU scenario, absolute GHG
emissions (and emission intensities) are projected to decline
in both scenarios, reflecting the continued improvements
to production efficiency achieved via improved animal
productivity. Compared to the BAU scenario, the percentage
reduction achievable in 2030 are in the range of -24 percent
and -59%.17 This reduction represents between 13–31
percent of the Kenya’s NDC mitigation target of 43 million
tonnes CO2 eq. in 2030.
15 UN DESA (2015). World Population Prospects 2015 Revision. https://esa.un.org/unpd/wpp/16 http://www.fao.org/3/a-i6260e.pdf17 These reductions represent the maximum technical mitigation potential achievable if interventions are applied to the entire dairy sector.
0
5
10
15
20
25
2014 2015 2016 2017 2018 2019 2020 2021 2022 2023 2024 2025 2026 2027 2028 2029 2030
Mill
ion
tonn
es C
O2 eq
. per
ann
um
Slow expansion -24% Faster efficiency gains -59%
Business as usual emissions in absence of action
% Reduction achievable compared to baseline
-24%
-59%
Current sustained growth scenario
Slow expansion scenario
Faster efficiencygain scenario
}
Historical and projected trends in emissions for the Kenyan dairy sector
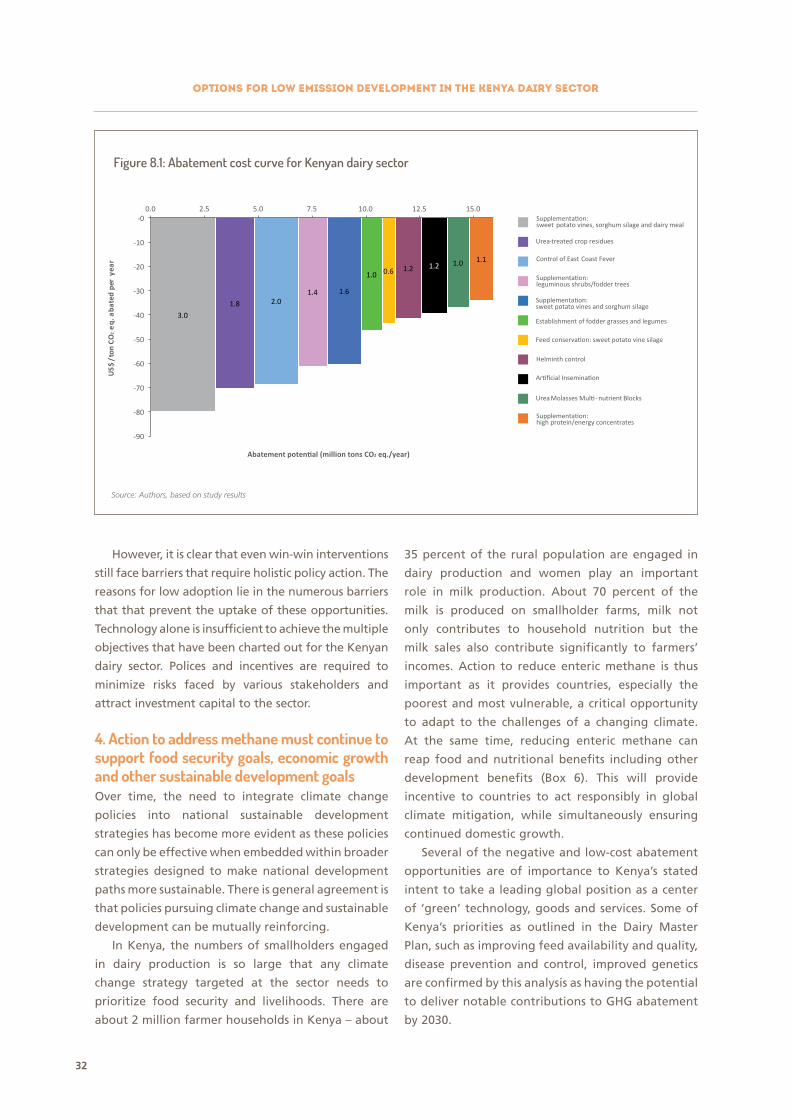
OptiOns fOr lOw emissiOn develOpment in the KenYA dAirY sectOr
32
-90
-20
-10
15.012.510.07.55.02.50.0-0
-80
-70
-60
-50
-40
-30
1.8
3.0
2.0
1.21.20.61.0
1.61.4
1.11.0
Establishment of fodder grasses and legumes
leguminous shrubs/fodder trees
high protein/energy concentrates
sweet potato vines and sorghum silage
sweet potato vines, sorghum silage and dairy meal
Feed
Urea -nutrient Blocks
Control of East Coast Fever
Helminth control
Urea-treated crop residues
not/
$SU
.qe
2O
Craey
rep detaba
2 eq./year)
Figure 8.1: Abatement cost curve for Kenyan dairy sector
Source: Authors, based on study results
However, it is clear that even win-win interventions
still face barriers that require holistic policy action. The
reasons for low adoption lie in the numerous barriers
that that prevent the uptake of these opportunities.
Technology alone is insufficient to achieve the multiple
objectives that have been charted out for the Kenyan
dairy sector. Polices and incentives are required to
minimize risks faced by various stakeholders and
attract investment capital to the sector.
4. Action to address methane must continue to support food security goals, economic growth and other sustainable development goalsOver time, the need to integrate climate change
policies into national sustainable development
strategies has become more evident as these policies
can only be effective when embedded within broader
strategies designed to make national development
paths more sustainable. There is general agreement is
that policies pursuing climate change and sustainable
development can be mutually reinforcing.
In Kenya, the numbers of smallholders engaged
in dairy production is so large that any climate
change strategy targeted at the sector needs to
prioritize food security and livelihoods. There are
about 2 million farmer households in Kenya – about
35 percent of the rural population are engaged in
dairy production and women play an important
role in milk production. About 70 percent of the
milk is produced on smallholder farms, milk not
only contributes to household nutrition but the
milk sales also contribute significantly to farmers’
incomes. Action to reduce enteric methane is thus
important as it provides countries, especially the
poorest and most vulnerable, a critical opportunity
to adapt to the challenges of a changing climate.
At the same time, reducing enteric methane can
reap food and nutritional benefits including other
development benefits (Box 6). This will provide
incentive to countries to act responsibly in global
climate mitigation, while simultaneously ensuring
continued domestic growth.
Several of the negative and low-cost abatement
opportunities are of importance to Kenya’s stated
intent to take a leading global position as a center
of ‘green’ technology, goods and services. Some of
Kenya’s priorities as outlined in the Dairy Master
Plan, such as improving feed availability and quality,
disease prevention and control, improved genetics
are confirmed by this analysis as having the potential
to deliver notable contributions to GHG abatement
by 2030.
Figure 8.1: Abatement cost curve for Kenyan dairy sector
Source: Authors, based on study results
OptiOns fOr lOw emissiOn develOpment in the KenYA dAirY sectOr
33
Box 6: Reducing enteric methane for development and climate goals simultaneously
The exclusive focus on methane in the climate debate
is short-sighted, if the analysis is confined only to emis-
sions. The opportunity to mitigate methane is only
one reason to reduce emissions; reducing emissions of
methane can provide significant development benefits,
including improved productivity, food security and liveli-
hoods. This study confirms the often cited multiple syn-
ergies that can be achieved by combining measures that
address enteric methane with efforts to improve food
and nutrition security. The strong correlation between
productivity increases and methane mitigation implies
large opportunities for low-cost mitigation, and wide-
spread social and economic benefits. The additional ben-
efits and positive economic returns that can be generat-
ed by closely aligning emission intensity reductions with
productivity gains result in lower abatement costs for
producers. Methane production through enteric fermen-
tation is not only of global concern for its contribution to
global warming, but also for its wastage of feed energy,
an inefficiency that limits the production performance
of ruminants. As a result of this process, ruminants lose
between 2–12 percent of the gross dietary energy in the
form of methane, depending on the quality and quantity
of diet. Thus, it is essential to look for options to reduce
CH4 emissions through improving feed conversion effi-
ciency, which also translates into higher productivity and
improved food security. Increasing productivity of dairy
systems has the potential to benefit millions of poor live-
stock keepers manifested through higher incomes, im-
proved food security and nutrition wellbeing.
I674
9EN
/1/0
1.17
I7669EN/1/10.17
ISBN 978-92-5-109878-3
9 7 8 9 2 5 1 0 9 8 7 8 3