Embed Size (px)
Citation preview
Publishable OPTIPOLYGEN report 1
OPTIPOLYGEN
EIE /04/150/S07.39553
Final Project Results
Project number : EIE/04/150/S07.39553
The sole responsibility for the content of this publication lies with the authors. It does not necessarily reflect the opinion of the European
Communities. The European Commission is not responsible for any use that may be made of the information contained therein.
Publishable OPTIPOLYGEN report 2
CONTENTS Synopsis 4
1. Project objectives 6 2. Formation of a database of successful polygeneration projects in the food industry. 7
2.1 Introduction 7 2.2 Actions performed. 7 2.3 Contents of the database. 7
3. Analysis of Food industry sectors in terms of their potential for polygeneration applications. Estimation of the technical potential for polygeneration in the EUR-15 countries. 10
3.1 Introduction 10 3.2 Definition of polygeneration 10 3.3 Definition of food sectors 10 3.4 Process descriptions 11 3.5 Specific energy requirements 12 3.6 Current on-site energy production in the food and drink industry 13 3.7 Process waste and by-products 14 3.8 Potential and feasible polygeneration technologies for on-site energy production 15 3.9 Cogeneration - CHP 15 3.10 Tri-generation - CHP combined with absorption cooling 16 3.11 Polygeneration -CHP using biogas from process waste as fuel 17 3.12 Energy use in the food industry 17 3.13 Technical potential for polygeneration in the food processing industry 19 3.14 Methodologies used for the estimations of the technical potential for polygeneration 20 3.15 Calculation of threshold values used for the estimations of co-, tri- and poly-generation 20 3.16 Results of estimated technical polygeneration potentials 23 3.17 Implemented CHP capacity compared to the technical potential of co-generation 29 3.18 Result of estimated CO2 –saving potential 31 3.19 Main results and conclusions 33
4. Technical issues of polygeneration applications in the various food industry sectors. Application and investment guidelines. Possible technology gaps. 35
4.1 Introduction 35 4.2 Technical issues of polygeneration. 35 4.3 Technology gaps 36 4.4 Application guidelines 38 4.4.1 Energy infrastructure and available fuels – location of the food factory 38 4.4.2 Rules of electricity trade and transmission – free market and equal terms for everyone? What are the driving forces? 38 4.4.3 District heat trade and transmission – chances to sell surplus heat? 39 4.4.4 Value of avoided carbon dioxide emissions 40 4.4.5 Regulations concerning biodegradable waste handling 40 4.4.6 Subsidies for onsite polygeneration solutions? 41 4.4.7 Taxation 41
Publishable OPTIPOLYGEN report 3
4.4.8 Prices of renewable and efficient electricity. 41 5. Polygeneration training material 43
5.1 Introduction 43 5.2 Terms and Definitions 43 5.3 Cogeneration and polygeneration: the basics 44 5.3.1 Cogeneration 44 5.3.2 Polygeneration 46 5.3 Tri-generation and generation and use of biogas and biomass 50
6. OPTIPOLYGEN WEB-SITE 51 6.1 Introduction 51 6.2 Data-base 51 6.3 Calculation tool 51
7. Dissemination activities 52 7.1 Introduction 52 7.2 Dissemination events 52 7.3 Training seminars 52 7.4 Project web-site 52 7.5 Informative material 52
Publishable OPTIPOLYGEN report 4
Synopsis
OPTIPOLYGEN developed information, technical, financial and investment guidelines for promoting polygeneration applications in the food industry. Polygeneration is the use of multiple energy inputs to transform them into multiple energy outputs in useful forms. Cogeneration of heat and Power –CHP- and tri-generation are more specific forms of polygeneration. Polygeneration includes also the generation and use of e.g. biogas or the combined use of solar energy with biogas and natural gas to provide the electricity, heat and cooling needed by an activity. OPTIPOLYGEN project has the goal to investigate the applications of polygeneration in the various food industry sectors and to built tools, data and guidelines needed to promote polygeneration applications in this specific industry sector. Database A database of successful polygeneration applications in the food industry has been built and successfully operate on the web. OPTIPOLYGEN database makes a step forward compared with existing similar databases; Is focused in the food industry sector and contains classified information concerning significant detailed data for every project together with operator contact details. In this way every interested can find polygeneration applications operating in similar processes together with technical and financial data and contact details of the operator. Thus the interested potential investor can gain input from the experiences of the existed polygeneration operators. Data base is accessible free of charge in the website of the project at www.optipoygen.org Technical issues and investigation of RES applicability in the various food sectors. Guidelines for applications. Technology gaps. Training and educational material. All the currently available polygeneration technologies have been examined in terms of their suitability and applicability in the various sectors of the food industry. Several case studies in specific industrial plans have been prepared and presented showing to interested stakeholders the benefits and the problems which arise when polygeneration application is shought. Specific check lists and guidelines have been prepared and are ready for use by the interested bodies to help developing polygeneration in the food industry. Training and educational material for polygeneration applications in the food industry has been also developed and used in the context of project dissemination in several dissemination and training events. Interactive web-site. Calculation tools. To serve the needs of project dissemination results, an interactive web-site has been developed and is maintained for use by the public. All project deliverables are available there for downloading. On top of this an interactive calculation tool is available there for initial estimation calculations for potential of polygeneration application in the various food industry sectors. With the help of this calculator the user can perform simple viability calculations by inserting operating parameters of a specific food plant. Thus initial estimations are possible before seeking for specialized advice.
Potential of Polygeneration applications in the European Food industry. Although experiences of the existing polygeneration project operators which are accessible through the project database may be vital for a potential investor, the potential of polygeneration applications in the European area is of interest for other stakeholders like e.g.

Publishable OPTIPOLYGEN report 5
equipment and system manufacturers, contractors or policy makers. The technical potential of Polygeneration in the food industry of the EUR-15 states has been examined and presented. This part of the work has been exclusively focused on the examination of the technical polygeneration potential based on the currently available equipment and the size and energy needs of the food industry split by sector and country. Other parameters like e.g. electricity and power pricing policies etc have not been taken into account in this part of the work. All these other parameters can be however taken into account and specific guidelines have been set up in the subsequent project results. Results show that about 73*103 GWh electricity per year can be polygenerated in the EUR-15 states. About 40*103 GWh el can originate from typical co-generation applications, 15*103 GWh el from tri-generation based systems which meet the cooling and freezing needs of the industry and about 16*103 GWh el can be produced if the waste streams of the by-products are to be used as biogas or biomass based electricity generation systems. Less than about 25% of this potential is currently exploited while the rest 75% is still unexploited. Details of the results of this part of the OPTIPOLYGEN work can be found in the project deliverables in www.otpipolygen.org. This work shows that polygeneration can provide up to 70-80% of all the energy needed by the food industry in the EUR-15 countries. About 20% of this energy can originate from wastes originating from the process itself. More than 75% of this potential remains unexploitable. Emmission savings by polygeneration application in the EUR-15 food industry can save up to 10.000 ktonnes of CO2 per year. To harvest this potential policy measures are needed mainly in the energy and power pricing.
Publishable OPTIPOLYGEN report 6
1. Project objectives The OPTIPOLYGEN project developed information, and technical, financing and investment guidelines, aimed at removing the barriers for developing polygeneration applications in the food industry. The focus of the work is on food industrial plants where process heat is needed at low (-35oC) to medium (+180oC) temperatures. Food industry includes dairy, beverages, fish and meat, frozen food, chocolate, confectioneries etc. The objectives of the project were: -To determine the potential of polygeneration based on fossil fuels and RES in the various sectors of the European Food industry. -To boost the development of high efficiency polygeneration applications in the European food industry where thermal energy of low up to medium temperature is needed (–35 οC up to 180 οC). -To identify market gaps for polygeneration equipment where development of European industry can give promising results in terms of market penetration and leadership. To achieve the above objectives the following were realized within OPTIPOLYGEN project: - A database of successful existing polygeneration applications in the food industry has been built and operate on the project web-site www.optipolygen.org. - A survey regarding the potential of polygeneration applications together with RES uses in the EUR-15 countries has been prepared. - Information for polygeneration implementation in the food industry including technical, financial and investment guidelines has been prepared. - A dedicated interactive web site giving full information and initial calculation tools useful for feasibility studies of polygeneration in the food industry has been built. - Training material suitable for consultants and engineers active in the food industry has been prepared. - Dissemination of the results and the data of the project towards interested stakeholders was fulfilled.
Publishable OPTIPOLYGEN report 7
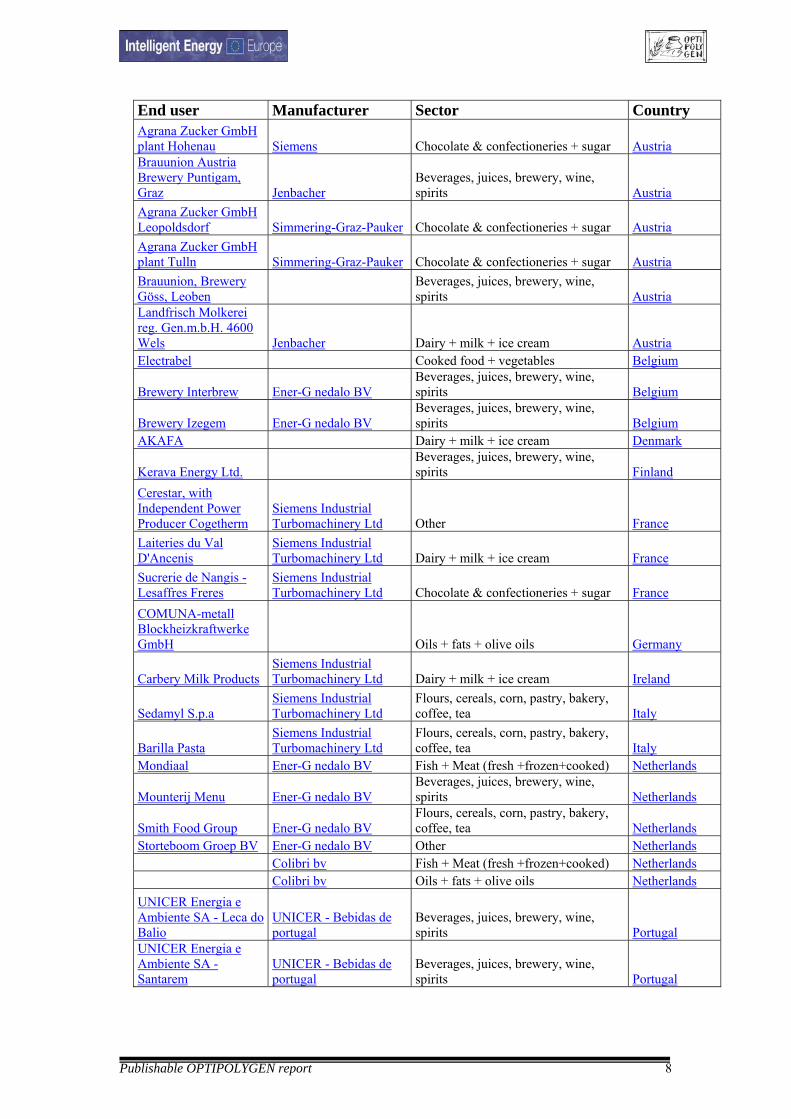
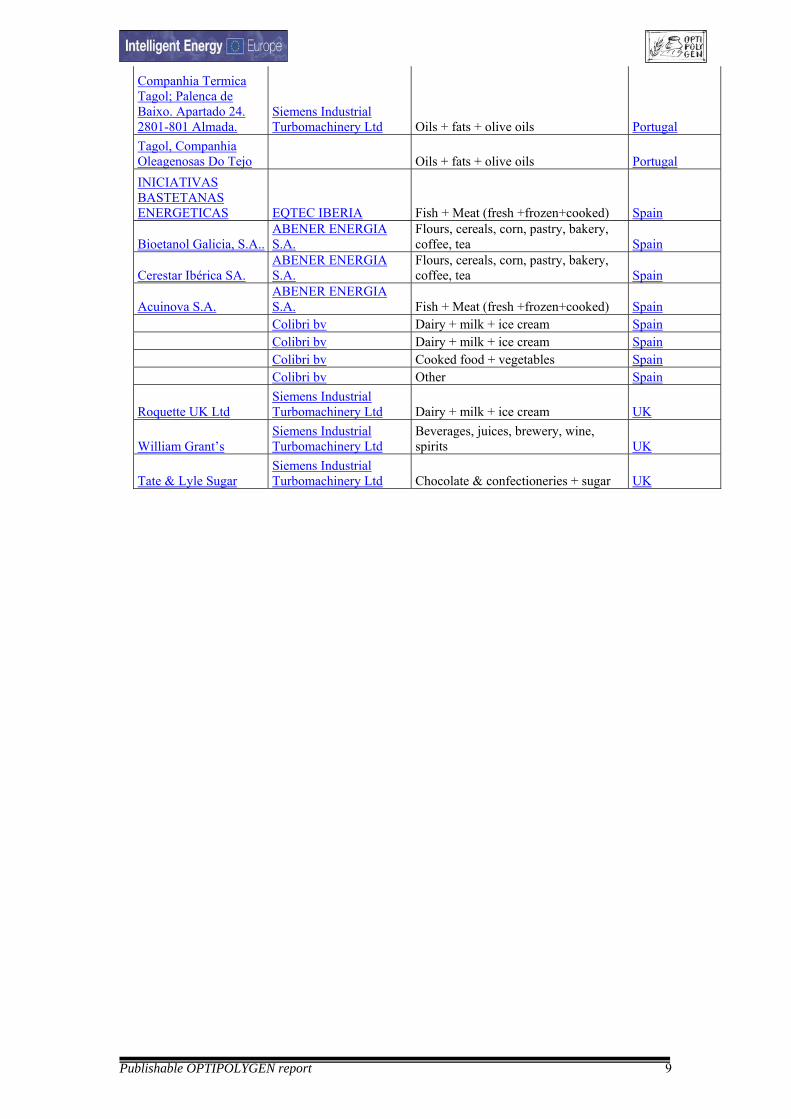
2. Formation of a database of successful polygeneration projects in the food industry. 2.1 Introduction The goal of this part of the OPTIPOLYGEN project –Work Package 1, WP1-, is the selection of successful polygeneration applications in the food industry and the formation of a user-oriented data base including all these applications. Any one interested should be able to select in the database an existing plant similar to the application which is planned for development and get some information about its technical and financial characteristics. In this way the development of new applications will be facilitated. Data base should be accessible in the web by all interested bodies. One of the main goals of this database is to provide classified information to the user. This means that the database was planned to give information on the details of the presented cases and not only general information for the existence of the projects. This formed actually the major roadblock to be overcome as most of the information given by the stakeholders in the area is general purpose information focused on their marketing activities. 2.2 Actions performed. The goal to built and operate the database of successful polygeneration installations has been met via the following actions: 1. Develop a suitable questionnaire. 2. Contact organisations with operating polygeneration installations and send the questionnaire to them asking for filling it and reply. 3. Use the data from the questionnaire to built the database. 4.Finally and within the tasks of WP6 make the database work in the OPTIPOLYGEN site. 2.3 Contents of the database. Database includes 39 model cases of food industries with details concerning their polygeneration plant and 142 cases with much less data for them given mainly by CHP manufacturers. Content of the database – only the model cases - is shown in the next tables. A full analysis of the cases per country, food industry sector etc can be found in the final WP1 report of the project. The database is accessible free of charge in the project website www.optipolygen.org More data of every specific polygeneration case can be found there.
Publishable OPTIPOLYGEN report 8
End user Manufacturer Sector Country Agrana Zucker GmbH plant Hohenau Siemens Chocolate & confectioneries + sugar Austria Brauunion Austria Brewery Puntigam, Graz Jenbacher
Beverages, juices, brewery, wine, spirits Austria
Agrana Zucker GmbH Leopoldsdorf Simmering-Graz-Pauker Chocolate & confectioneries + sugar Austria Agrana Zucker GmbH plant Tulln Simmering-Graz-Pauker Chocolate & confectioneries + sugar Austria Brauunion, Brewery Göss, Leoben
Beverages, juices, brewery, wine, spirits Austria
Landfrisch Molkerei reg. Gen.m.b.H. 4600 Wels Jenbacher Dairy + milk + ice cream Austria Electrabel Cooked food + vegetables Belgium
Brewery Interbrew Ener-G nedalo BV Beverages, juices, brewery, wine, spirits Belgium
Brewery Izegem Ener-G nedalo BV Beverages, juices, brewery, wine, spirits Belgium
AKAFA Dairy + milk + ice cream Denmark
Kerava Energy Ltd. Beverages, juices, brewery, wine, spirits Finland
Cerestar, with Independent Power Producer Cogetherm
Siemens Industrial Turbomachinery Ltd Other France
Laiteries du Val D'Ancenis
Siemens Industrial Turbomachinery Ltd Dairy + milk + ice cream France
Sucrerie de Nangis - Lesaffres Freres
Siemens Industrial Turbomachinery Ltd Chocolate & confectioneries + sugar France
COMUNA-metall Blockheizkraftwerke GmbH Oils + fats + olive oils Germany
Carbery Milk Products Siemens Industrial Turbomachinery Ltd Dairy + milk + ice cream Ireland
Sedamyl S.p.a Siemens Industrial Turbomachinery Ltd
Flours, cereals, corn, pastry, bakery, coffee, tea Italy
Barilla Pasta Siemens Industrial Turbomachinery Ltd
Flours, cereals, corn, pastry, bakery, coffee, tea Italy
Mondiaal Ener-G nedalo BV Fish + Meat (fresh +frozen+cooked) Netherlands
Mounterij Menu Ener-G nedalo BV Beverages, juices, brewery, wine, spirits Netherlands
Smith Food Group Ener-G nedalo BV Flours, cereals, corn, pastry, bakery, coffee, tea Netherlands
Storteboom Groep BV Ener-G nedalo BV Other Netherlands Colibri bv Fish + Meat (fresh +frozen+cooked) Netherlands Colibri bv Oils + fats + olive oils Netherlands UNICER Energia e Ambiente SA - Leca do Balio
UNICER - Bebidas de portugal
Beverages, juices, brewery, wine, spirits Portugal
UNICER Energia e Ambiente SA - Santarem
UNICER - Bebidas de portugal
Beverages, juices, brewery, wine, spirits Portugal
Publishable OPTIPOLYGEN report 9
Companhia Termica Tagol; Palenca de Baixo. Apartado 24. 2801-801 Almada.
Siemens Industrial Turbomachinery Ltd Oils + fats + olive oils Portugal
Tagol, Companhia Oleagenosas Do Tejo Oils + fats + olive oils Portugal INICIATIVAS BASTETANAS ENERGETICAS EQTEC IBERIA Fish + Meat (fresh +frozen+cooked) Spain
Bioetanol Galicia, S.A.. ABENER ENERGIA S.A.
Flours, cereals, corn, pastry, bakery, coffee, tea Spain
Cerestar Ibérica SA. ABENER ENERGIA S.A.
Flours, cereals, corn, pastry, bakery, coffee, tea Spain
Acuinova S.A. ABENER ENERGIA S.A. Fish + Meat (fresh +frozen+cooked) Spain
Colibri bv Dairy + milk + ice cream Spain Colibri bv Dairy + milk + ice cream Spain Colibri bv Cooked food + vegetables Spain Colibri bv Other Spain
Roquette UK Ltd Siemens Industrial Turbomachinery Ltd Dairy + milk + ice cream UK
William Grant’s Siemens Industrial Turbomachinery Ltd
Beverages, juices, brewery, wine, spirits UK
Tate & Lyle Sugar Siemens Industrial Turbomachinery Ltd Chocolate & confectioneries + sugar UK
Publishable OPTIPOLYGEN report 10
3. Analysis of Food industry sectors in terms of their potential for polygeneration applications. Estimation of the technical potential for polygeneration in the EUR-15 countries. 3.1 Introduction The goal of this action was twofold; To provide data for the estimation of polygeneration potential in the EUR-15 countries –WP2- and for the investigation of the several technical and investment parameters related with successful polygeneration applications in the food industry –WPs 3 & 4-. To achieve the goals food industry was split into sub-sectors and each partner was nominated as sub-sector leader. Each sub-sector leader examined in detail the potential of polygeneration applications in the specific food industry sector. The split of the food industry in sub-sectors together with the corresponding sub-sector leaders is shown in the following table. Food industry sector Food sector leader Dairy, milk and ice-creams FORCE Fish and meat (fresh, frozen, cooked) ESTIA Cooked food & vegetables GAIA Oils, fats, olive oil IST Flours, cereals, corn, pastry, bakery, coffee and tea
CHALEX
Chocolate, sugar & confectioneries ESD Beverages, juices, brewery, wine and spirits ÖEKV 3.2 Definition of polygeneration Polygeneration is the use of multiple primary energy inputs and transform them into multiple energy outputs in suitable for use forms. The term primary energy includes fossil fuels, biofuels, renewable energy sources, etc. Energy output means the different forms of energy which are useful in an activity. In the case of the food industry this could mean electricity, and heat in various temperature levels i.e. steam, hot water, chilling mediums etc. Other useful products, which might come out from a polygeneration process like e.g. compost fibers will be, treated as secondary by-products of polygeneration. 3.3 Definition of food sectors In order to facilitate these estimations for the whole food industry, investigations of the general processes utilised in the food processing and the energy requirements (thermal and electrical) for these industries were undertaken. In order to make this investigation possible the food processing industry was divided into 7 main sectors covering different kinds of food products and each industry sector was investigated separately.
Publishable OPTIPOLYGEN report 11
The seven food sectors are:
I. Fish and meat (fresh, frozen, cooked) II. Cooked food & vegetables.
III. Oils, fats, olive oil IV. Beverages, juices, brewery, wine and spirits. V. Flours, cereals, corn, pastry, bakery, coffee and tea.
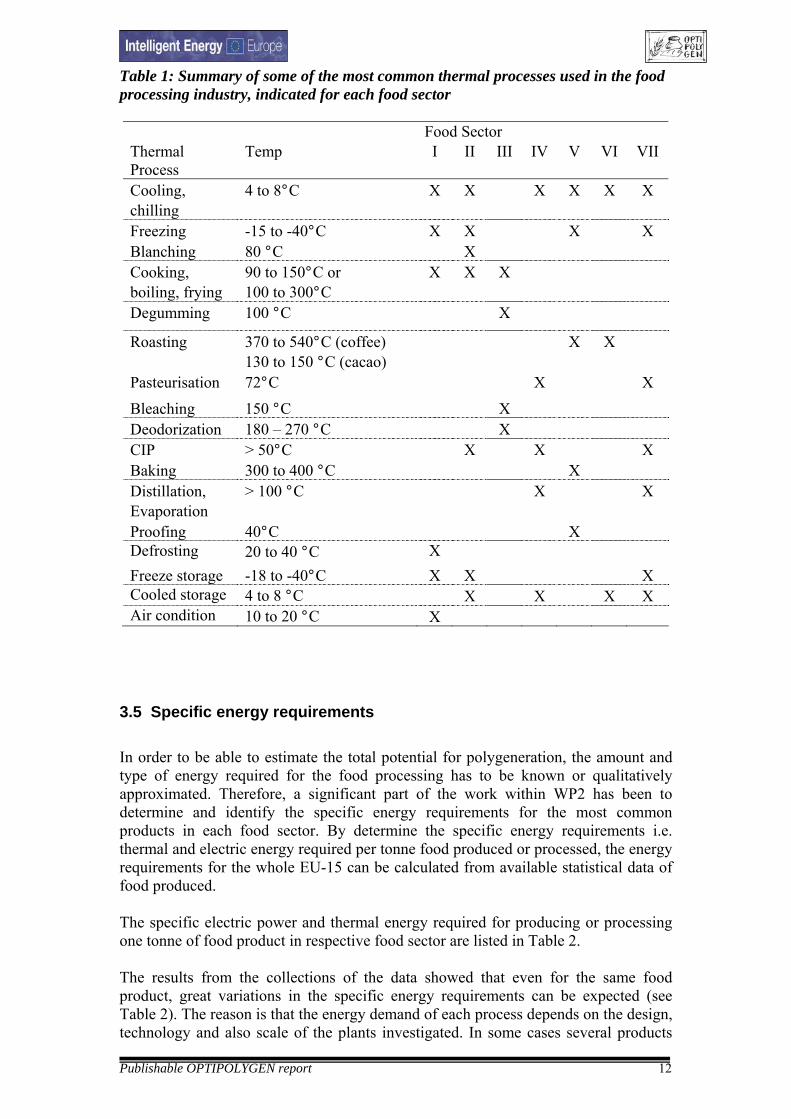
VI. Chocolate, sugar & confectioneries. VII. Dairy, milk and ice-creams In this report general results and findings of the whole WP2 are described and discussed. The details on the processes and in detailed results as well as estimations done for the evaluations are described in the APPENDIX I – VII of WP2 for each food sector respectively. 3.4 Process descriptions In general, almost all food processing requires both electric power as well as heat for some kind of thermal processing. Electric power is required for mechanical processing such as pumping, ventilating, mixing and conveying etc., but a great part is also used for cooling by mechanical compression coolers. The required thermal processing comprises both high temperature processing such as pasteurisation, cooking and evaporation as well as low temperature processing such as freezing and cooling. In Table 1 the most common thermal processes are listed and indicated in which food sector they are predominating. The detailed descriptions of processes and products are further described and explained in the APPENDIX I – VII for each food sector.
Publishable OPTIPOLYGEN report 12
Table 1: Summary of some of the most common thermal processes used in the food processing industry, indicated for each food sector
Food Sector Thermal Process
Temp I II III IV V VI VII
Cooling, chilling
4 to 8°C X X X X X X
Freezing -15 to -40°C X X X X Blanching 80 °C X Cooking, boiling, frying
90 to 150°C or 100 to 300°C
X X X
Degumming 100 °C X
Roasting 370 to 540°C (coffee) 130 to 150 °C (cacao)
X X
Pasteurisation 72°C X X
Bleaching 150 °C X Deodorization 180 – 270 °C X CIP > 50°C X X X Baking 300 to 400 °C X Distillation, Evaporation
> 100 °C X X
Proofing 40°C X Defrosting 20 to 40 °C X Freeze storage -18 to -40°C X X X Cooled storage 4 to 8 °C X X X X Air condition 10 to 20 °C X
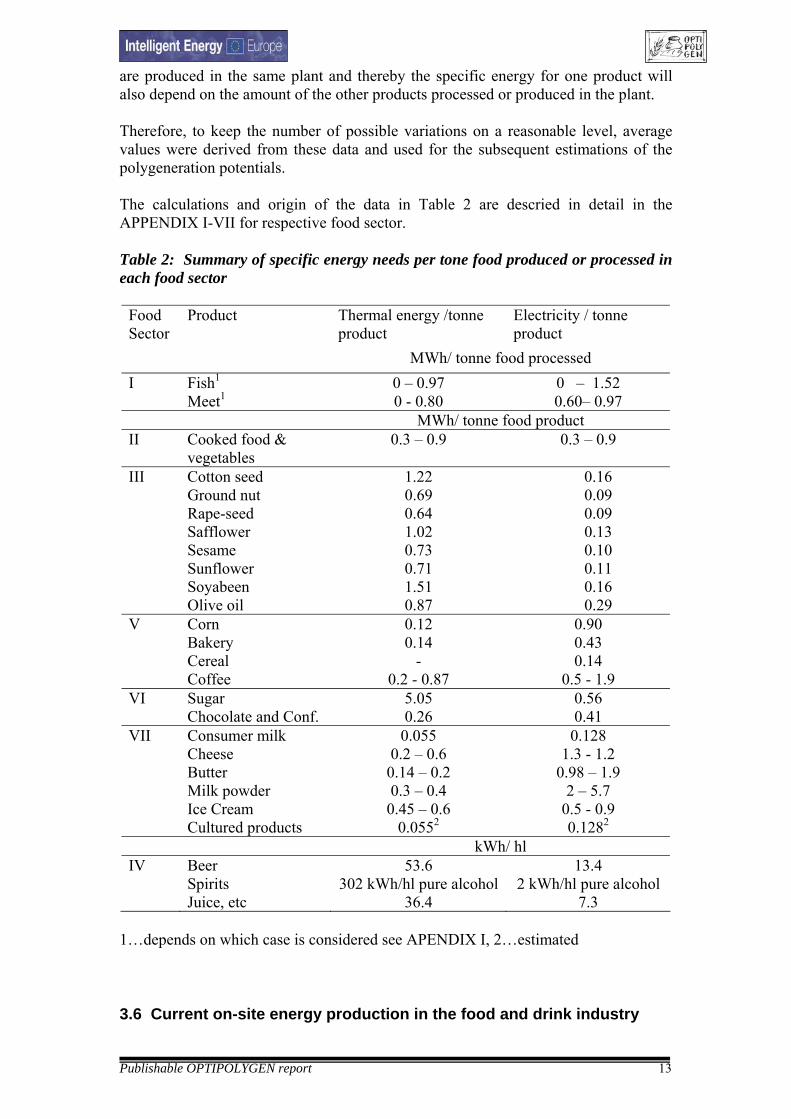
3.5 Specific energy requirements In order to be able to estimate the total potential for polygeneration, the amount and type of energy required for the food processing has to be known or qualitatively approximated. Therefore, a significant part of the work within WP2 has been to determine and identify the specific energy requirements for the most common products in each food sector. By determine the specific energy requirements i.e. thermal and electric energy required per tonne food produced or processed, the energy requirements for the whole EU-15 can be calculated from available statistical data of food produced. The specific electric power and thermal energy required for producing or processing one tonne of food product in respective food sector are listed in Table 2. The results from the collections of the data showed that even for the same food product, great variations in the specific energy requirements can be expected (see Table 2). The reason is that the energy demand of each process depends on the design, technology and also scale of the plants investigated. In some cases several products
Publishable OPTIPOLYGEN report 13
are produced in the same plant and thereby the specific energy for one product will also depend on the amount of the other products processed or produced in the plant. Therefore, to keep the number of possible variations on a reasonable level, average values were derived from these data and used for the subsequent estimations of the polygeneration potentials. The calculations and origin of the data in Table 2 are descried in detail in the APPENDIX I-VII for respective food sector. Table 2: Summary of specific energy needs per tone food produced or processed in each food sector
Food Sector
Product Thermal energy /tonne product
Electricity / tonne product
MWh/ tonne food processed I Fish1 0 – 0.97 0 – 1.52 Meet1 0 - 0.80 0.60– 0.97 MWh/ tonne food product II Cooked food &
vegetables 0.3 – 0.9 0.3 – 0.9
III Cotton seed 1.22 0.16 Ground nut 0.69 0.09 Rape-seed 0.64 0.09 Safflower 1.02 0.13 Sesame 0.73 0.10 Sunflower 0.71 0.11 Soyabeen 1.51 0.16 Olive oil 0.87 0.29 V Corn 0.12 0.90 Bakery 0.14 0.43 Cereal - 0.14 Coffee 0.2 - 0.87 0.5 - 1.9 VI Sugar 5.05 0.56 Chocolate and Conf. 0.26 0.41 VII Consumer milk 0.055 0.128 Cheese 0.2 – 0.6 1.3 - 1.2 Butter 0.14 – 0.2 0.98 – 1.9 Milk powder 0.3 – 0.4 2 – 5.7 Ice Cream 0.45 – 0.6 0.5 - 0.9 Cultured products 0.0552 0.1282
kWh/ hl IV Beer 53.6 13.4 Spirits 302 kWh/hl pure alcohol 2 kWh/hl pure alcohol Juice, etc 36.4 7.3
1…depends on which case is considered see APENDIX I, 2…estimated 3.6 Current on-site energy production in the food and drink industry
Publishable OPTIPOLYGEN report 14
Several factors are important the most suitable energy solution has to be chosen for a food processing plant. Not only is the nature of the processes but also the operating environment of a food factory a major factor. These local factors could be local price of fuel, electricity, energy taxes, distance to grids, possibility to sell and buy waste energy or excess electricity to the grid or neighbour industries, etc. The performed investigation reveals that already several food industries have implemented combined heat and power (CHP) generation. Some of these are described in the database at the webpage of the OPTIPOLYGEN project. Commonly these CHP plants are based on natural gas combusted in a gas turbine and the exhaust heat is used for hot water and steam production. Moreover, where the natural gas network is not available, heating needs are covered with onsite oil or solid fuel burners, and electricity is bought from the grid. District heat, where available, is also used, especially in the Scandinavian countries. More details on specific energy production in each food sector are described in the Appendix’s. The current installations of CHP units in the “food, beverage and tobacco” industry are discussed in more detail in section 3.17. 3.7 Process waste and by-products Many sectors of the food industry produce significant amounts of biodegradable waste or by-products that could be used for energy production. Their utilisation could either be directly as a solid biomass fuel or as a raw material for biogas production. The amount of bio-waste per food sector and ton product produced or processed depends on the raw material processed and the utilised cleaning technologies at the plant. Typical values for the amounts of waste produced were estimated for each food sectors and are listed in Table 3 as either kg solid or amount of chemical oxygen demand (COD). Average values of these data was subsequent used for the estimations shown in the following sections. It is important to note that lot of food industry by-products are used as raw material for other uses in the animal, pharmaceutical etc industries. A significant amount of the income in several food industry sectors arises from the selling of by-products. In certain cases however use of by-products is currently being restricted by the law e.g. use of the slaughter house by-products. It is known that in several cases the use of by-products for other than energy purposes might be a more efficient way of using them. As such certain categories of by-products have been considered eligible in terms of their energy content, some others not. This can be found in the specific reports for every food industry sector.
Publishable OPTIPOLYGEN report 15
Table 3 : Examples on amounts of waste and by-products from respective food-industry
kg solids COD Main waste products from the process
I 100 – 450 kg ton carcase
40 kg / ton carcase
Residues from fish and animal carcase
II 250 kg / ton product
Waste from vegetables, fish and meet
III 1000-5000 kg/ton product
Trash-rests from oil-press
IV 23 kg /hl beer Spent grains from beer production
V 1-250 kg/ ton product
Rest products from cereal production
VI 8000 kg / tonne sugar
Diffusion waste from the sugar process
VII 80 – 130 mg / kg cheese
Mainly whey from cheese production, rest in water from CIP
3.8 Potential and feasible polygeneration technologies for on-site energy production The processes of each food sector were analysed and possible co- tri- and polygeneration technologies were derived for the subsequent estimations. From this investigation three general technologies were extracted as plausible for all the food sectors and subsequently used as cases for calculating the theoretical technical potential for polygeneration in the food industry in EU-15. These chosen cases used as a comparison for all food sectors were:
1. co-generation of heat and electricity in a natural gas fired gas turbine, 2. tri-generation by using heat from the gas turbine as a source for absorption
cooling and, 3. usage of biodegradable waste streams for production of biogas which in turn is
used in the gas turbine The following sections (see section 3.9- 3.11) explain the chosen technologies and their limitations in terms of size and operation. These limitations were subsequently utilised for the estimations of potentials of the whole food industry. 3.9 Cogeneration - CHP Combined heat and power production is a standard technology in large central energy producing plants. During recent years, new smaller scale CHP technologies have been developed for use onsite, reducing electricity transmission losses and costs, and giving more reliability to the electricity supply, both onsite and in the neighbourhood. Also, environmentally harmful fuels, such as oil, have been replaced by less harmful ones, such as natural gas or even biogas. The technical feasibility of implementing onsite CHP, e.g. in food factories, depends on several factors, but often on that a sufficient heat demand can be guaranteed from
Publishable OPTIPOLYGEN report 16
the process. Moreover, assuming that electricity can be bought from or sold to the grid with reasonable prices, the remaining question concerning the applicability of CHP is the durability of heat loads. Many food factories, even big ones, operate only in one, or at most, in two shifts which results in significant fluctuation of the loads. The same problem applies for factories using batch processing which causes short time fluctuations in the energy demand. However, strong daily fluctuation of loads does not necessarily have to be an obstacle to the application of onsite CHP. Combining heat storage of suitable size with a CHP unit makes it quite easy to cope with daily load fluctuations, even if the fluctuations are strong and the difference between minimum and maximum load high. The same principle can be applied in the production of cold – i.e., storage of cold as ice baths in order to deal with the daily variations in the cooling demand. All the above have however to be able to couple efficiently with the economics of cogeneration. This is usually the case when the price ratio of the electricity to fuels energy units named as Electricity over Fuel Price Ratio is higher than 2-2,5. If not then usually and depending on the local cost parameters a cogeneration investment is not financially acceptable although technically feasible. There are several CHP technologies available for onsite energy production, some of which are standard technology (gas engines, gas turbines, steam turbines), others more or less mature (Organic Rankine Cycle (ORC), Stirling engines, fuel cell technologies). In most food industries, steam is used for the heat transfer and thus thermal energy at more than 100 ºC is needed. Because of this gas turbine technology is selected as the most feasible CHP technology in almost all the estimations performed for the different food sectors investigated in this work. 3.10 Tri-generation - CHP combined with absorption cooling Tri-generation is based on the use of absorption cycles to produce cool using the exhaust heat energy from a CHP unit. The set-up of an absorption cycle depends on the temperatures where this cycle is operating. Absorption cycles are usually based on LiBr /water or on Ammonia/water binary mixtures. Details of these processes and their function can be found elsewhere1 and is out of the scope of this report. Absorption chilling and freezing equipment is commercially available in different sizes and operational temperatures suitable for food industry applications2. Absorption coolers have typically lower coefficient of performance (COP) compared to compressor driven coolers (see Table 4 in section 3.15) requires more space and also higher investment costs. On the other hand absorption coolers need much lower maintenance and can be combined with almost any source of heat for their operation. This fact makes this technology ideal to combine with a CHP unit producing waste heat. The minimum commercial available absorption coolers are about 150 kW and their COP (Coefficient of Performance) ranges from 0.2 - 1 depending on the freezing cycle served and on the heat available. The polygeneration benefit from applying tri-generation, is that electricity consumption from the grid for freezing or chilling ceases and at the same time
1 ASHRAE handbook, absorption cooling, www.ashrae.org, 2 Colibri bv, www.colibri-bv.com, December 2005
Publishable OPTIPOLYGEN report 17
additional electricity is efficiently co-generated by the CHP unit. Because of this a double positive energy saving effect occurs. 3.11 Polygeneration -CHP using biogas from process waste as fuel Almost all food processing industries produces some kind of organic waste- or by- products. Instead of disposal and supplementary with their use in other purposes as useful by-products, many of these materials can be used to generate thermal energy and power at the plant by direct combustion, thermal gasification or anaerobically treated to produce biogas. Among these technologies anaerobic digestion of biodegradable waste from the food industry, is the most flexible option of utilising food industry process wastes or low value by-products. The resulting biogas, rich with methane, can be combusted in gas burners and utilised as for hot water or steam production, or it can be used to run a gas engine or turbine in a CHP applications.
3.12 Energy use in the food industry In order to estimate the potential for polygeneration in different food sectors, the total energy used in each food sector had to be estimated. This was mainly performed by combining the specific energy requirements defined in section 3 with best available statistical data for the production or processing of the each specific product. Typically the used data for these estimations are the amounts of food products produced in the EU-15 in combination with size and number of enterprises in each food sector. Most of the data of produced amounts of food products were extracted from the EUROSTAT database PRODCOM3, but also other sources have been used when more recent and detailed data has been available elsewhere. The different data sources and total amounts of products considered are described in detail in the APPENDIX of the respective food sector. In order to calculate the total energy consumption in the food and drink industry in the OPTIPOLYGEN project a number of estimations, extrapolations and averraging of data was necessary. Thus the results can only be indicative and not seen as exact figures. Currently, there is no statistic data for exactly the same industries which are covered by the OPTIPOLYGEN to compare to. However, the EUROSTAT database does contain statistic data for the energy consumption in the “Food, drink and tobacco industry” in each country of the EU-15. These values were thus compared with the energy consumption calculated in the OPTIPOLYGEN project and are shown in Figure 1 to Figure 3. According to the EUROSTAT, the total energy consumption for the “Food, drink and tobacco industry” for the EU-15 countries was 316 TWh in 2004. The calculation in the OPTIPOLYGEN project revealed a figure of 211 TWh (Figure 1) which is lower but in the same size range. It should also be taken into account that the low figure does not include the tobacco industry which means that the final figures are more close to each other. Investigating the different countries, the correlation for some 3 EUROSTAT, http://epp.eurostat.ec.europa.eu
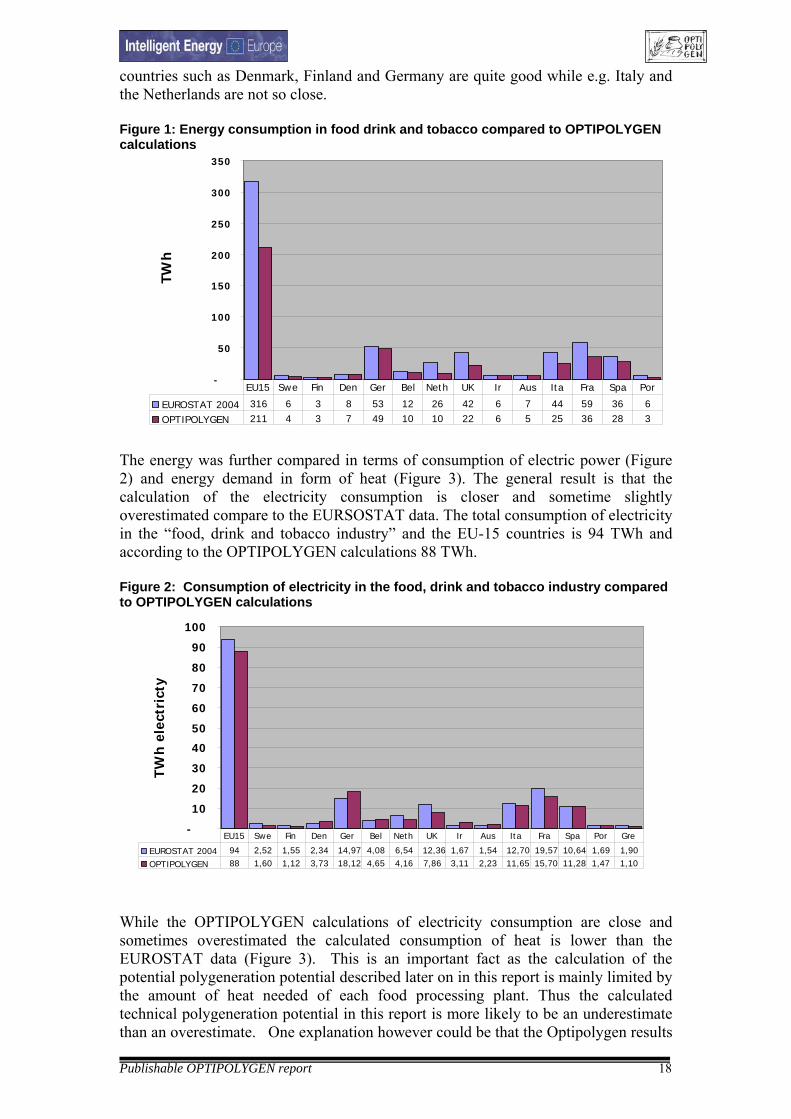
Publishable OPTIPOLYGEN report 18
countries such as Denmark, Finland and Germany are quite good while e.g. Italy and the Netherlands are not so close. Figure 1: Energy consumption in food drink and tobacco compared to OPTIPOLYGEN calculations
-
50
100
150
200
250
300
350TW
h
EUROSTAT 2004 316 6 3 8 53 12 26 42 6 7 44 59 36 6
OPTIPOLYGEN 211 4 3 7 49 10 10 22 6 5 25 36 28 3
EU15 Swe Fin Den Ger Bel Neth UK Ir Aus Ita Fra Spa Por
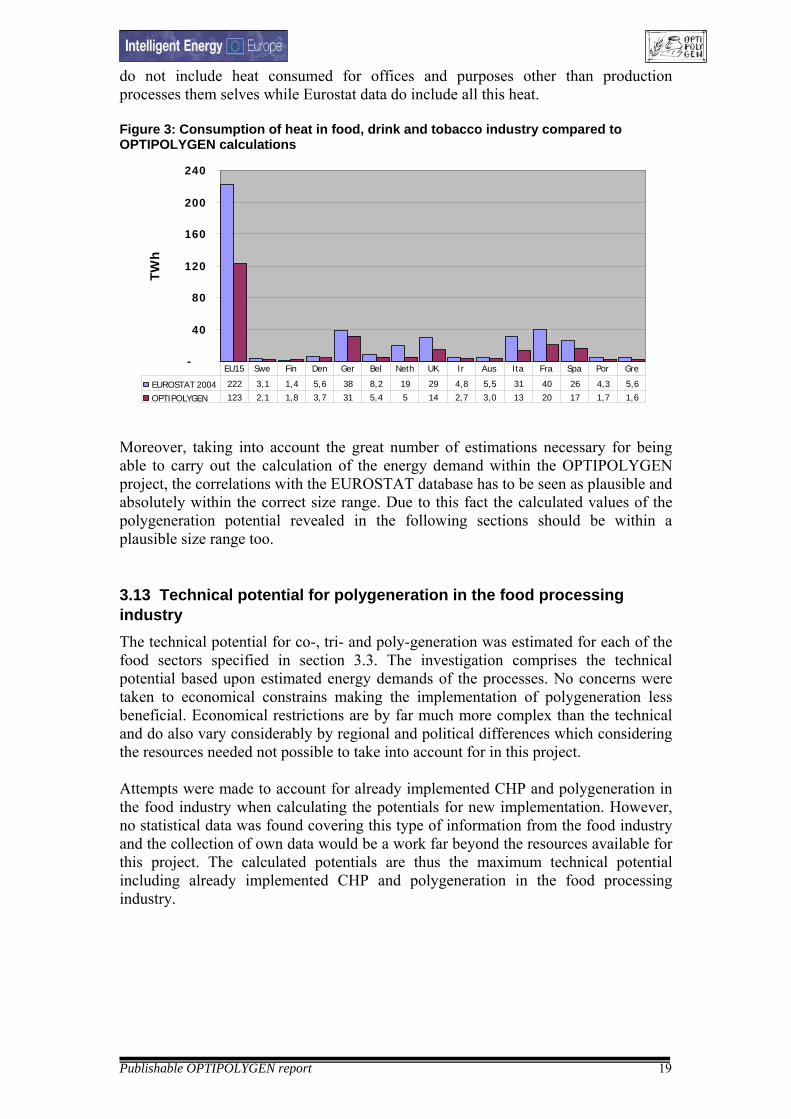
The energy was further compared in terms of consumption of electric power (Figure 2) and energy demand in form of heat (Figure 3). The general result is that the calculation of the electricity consumption is closer and sometime slightly overestimated compare to the EURSOSTAT data. The total consumption of electricity in the “food, drink and tobacco industry” and the EU-15 countries is 94 TWh and according to the OPTIPOLYGEN calculations 88 TWh. Figure 2: Consumption of electricity in the food, drink and tobacco industry compared to OPTIPOLYGEN calculations
-
10
20
30
40
50
60
70
80
90
100
TWh
elec
tric
ty
EUROSTAT 2004 94 2,52 1,55 2,34 14,97 4,08 6,54 12,36 1,67 1,54 12,70 19,57 10,64 1,69 1,90
OPTIPOLYGEN 88 1,60 1,12 3,73 18,12 4,65 4,16 7,86 3,11 2,23 11,65 15,70 11,28 1,47 1,10
EU15 Swe Fin Den Ger Bel Neth UK Ir Aus Ita Fra Spa Por Gre
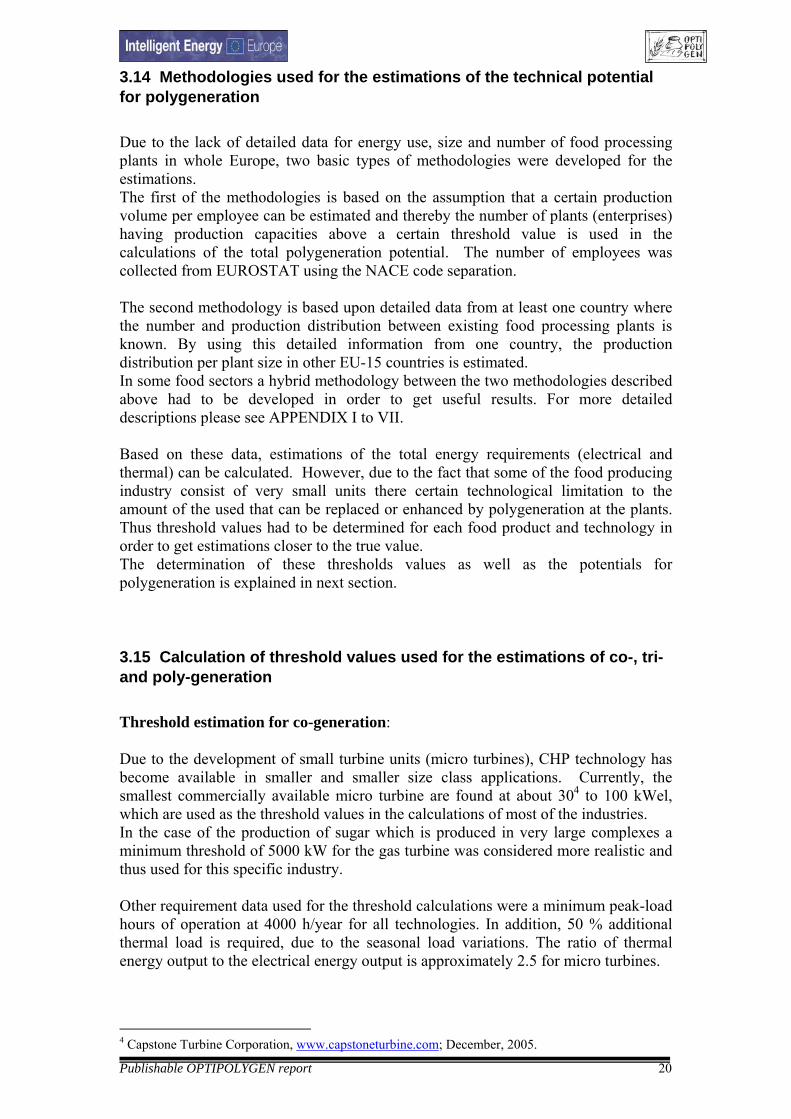
While the OPTIPOLYGEN calculations of electricity consumption are close and sometimes overestimated the calculated consumption of heat is lower than the EUROSTAT data (Figure 3). This is an important fact as the calculation of the potential polygeneration potential described later on in this report is mainly limited by the amount of heat needed of each food processing plant. Thus the calculated technical polygeneration potential in this report is more likely to be an underestimate than an overestimate. One explanation however could be that the Optipolygen results
Publishable OPTIPOLYGEN report 19
do not include heat consumed for offices and purposes other than production processes them selves while Eurostat data do include all this heat. Figure 3: Consumption of heat in food, drink and tobacco industry compared to OPTIPOLYGEN calculations
-
40
80
120
160
200
240TW
h
EUROSTAT 2004 222 3,1 1,4 5,6 38 8,2 19 29 4,8 5,5 31 40 26 4,3 5,6
OPTIPOLYGEN 123 2,1 1,8 3,7 31 5,4 5 14 2,7 3,0 13 20 17 1,7 1,6
EU15 Swe Fin Den Ger Bel Neth UK Ir Aus Ita Fra Spa Por Gre
Moreover, taking into account the great number of estimations necessary for being able to carry out the calculation of the energy demand within the OPTIPOLYGEN project, the correlations with the EUROSTAT database has to be seen as plausible and absolutely within the correct size range. Due to this fact the calculated values of the polygeneration potential revealed in the following sections should be within a plausible size range too. 3.13 Technical potential for polygeneration in the food processing industry The technical potential for co-, tri- and poly-generation was estimated for each of the food sectors specified in section 3.3. The investigation comprises the technical potential based upon estimated energy demands of the processes. No concerns were taken to economical constrains making the implementation of polygeneration less beneficial. Economical restrictions are by far much more complex than the technical and do also vary considerably by regional and political differences which considering the resources needed not possible to take into account for in this project. Attempts were made to account for already implemented CHP and polygeneration in the food industry when calculating the potentials for new implementation. However, no statistical data was found covering this type of information from the food industry and the collection of own data would be a work far beyond the resources available for this project. The calculated potentials are thus the maximum technical potential including already implemented CHP and polygeneration in the food processing industry.
Publishable OPTIPOLYGEN report 20
3.14 Methodologies used for the estimations of the technical potential for polygeneration Due to the lack of detailed data for energy use, size and number of food processing plants in whole Europe, two basic types of methodologies were developed for the estimations. The first of the methodologies is based on the assumption that a certain production volume per employee can be estimated and thereby the number of plants (enterprises) having production capacities above a certain threshold value is used in the calculations of the total polygeneration potential. The number of employees was collected from EUROSTAT using the NACE code separation. The second methodology is based upon detailed data from at least one country where the number and production distribution between existing food processing plants is known. By using this detailed information from one country, the production distribution per plant size in other EU-15 countries is estimated. In some food sectors a hybrid methodology between the two methodologies described above had to be developed in order to get useful results. For more detailed descriptions please see APPENDIX I to VII. Based on these data, estimations of the total energy requirements (electrical and thermal) can be calculated. However, due to the fact that some of the food producing industry consist of very small units there certain technological limitation to the amount of the used that can be replaced or enhanced by polygeneration at the plants. Thus threshold values had to be determined for each food product and technology in order to get estimations closer to the true value. The determination of these thresholds values as well as the potentials for polygeneration is explained in next section. 3.15 Calculation of threshold values used for the estimations of co-, tri- and poly-generation Threshold estimation for co-generation: Due to the development of small turbine units (micro turbines), CHP technology has become available in smaller and smaller size class applications. Currently, the smallest commercially available micro turbine are found at about 304 to 100 kWel, which are used as the threshold values in the calculations of most of the industries. In the case of the production of sugar which is produced in very large complexes a minimum threshold of 5000 kW for the gas turbine was considered more realistic and thus used for this specific industry. Other requirement data used for the threshold calculations were a minimum peak-load hours of operation at 4000 h/year for all technologies. In addition, 50 % additional thermal load is required, due to the seasonal load variations. The ratio of thermal energy output to the electrical energy output is approximately 2.5 for micro turbines.
4 Capstone Turbine Corporation, www.capstoneturbine.com; December, 2005.
Publishable OPTIPOLYGEN report 21
These values result in the minimum onsite heat load requirement of 450 MWh/year, rounded up to 500 MWh/year in the calculations. The same heat to electricity ratio (2.5) is used regardless of CHP technology or unit size. Threshold estimation for tri-generation: The smallest commercially available absorption cooler has presently 100 kW cooling capacity . This means about 125 kW thermal driving force in the deep freezing applications (COP ≈ 0.8) and about 85 kW in the refrigeration applications (around +4 ºC; COP ≈ 1.2). These are both higher than the thermal output of the smallest available micro turbine, which means that the minimum capacity of the absorption cooler is the technical threshold in the combination of CHP and absorption cooling. This can be used directly if the capacity of the cooling equipment, or the overall cooling load, at a site is known. In the polygeneration potential calculations it is assumed, however, that only the overall electricity load of a food factory is known and the threshold load is calculated using the following assumptions: Table 4 : Typical technical data used for the calculating cooling energy
Cooling temperature + 4 ºC - 30 ºC
Compressor cooling COP 2.5 1.2
Absorption cooling COP 1.2 0.85
Threshold estimation for biogas production (polygeneration) Two types of methodology to estimate the threshold value for the production of biogas from waste streams have been used in the different food sectors analysed. One methodology is to define the threshold by assuming that the biogas reactor must produce as much biogas (methane) as is needed to feed the CHP unit. The other methodology is to define the threshold from data indicating the smallest operative biogas reactor available which was set to 5 000 tons of solid waste/year Considering the first methodology, the smallest available CHP unit sets the threshold for the biowaste utilisation. Thereby, the limiting values of a micro turbine of 30 kWel and the threshold for the biogas production can be defined as follows:
5 Absorption cooling COP at freezing temperatures often used in the food industry (-10 down to –25oC) varies a lot between 0,2 and 0,8 depending on several other parameters. We use however this high figure as the lower the COP the higher the technical polygeneration potential related with absorption freezing.
Publishable OPTIPOLYGEN report 22
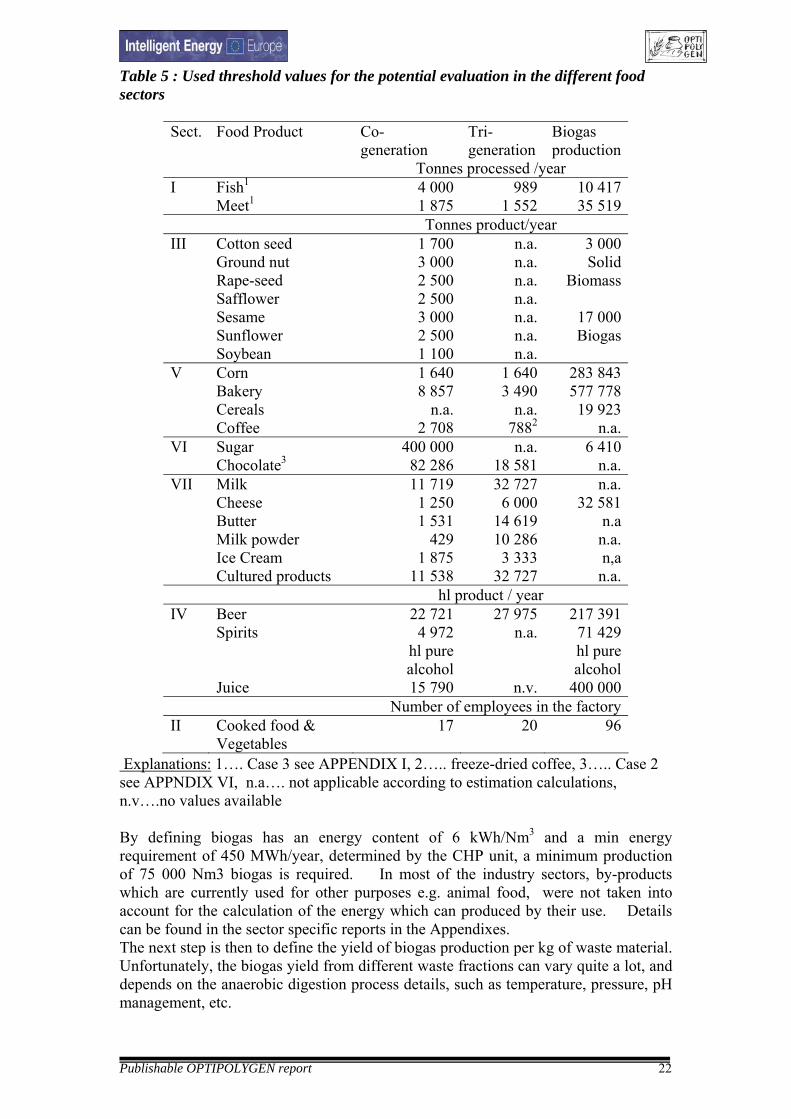
Table 5 : Used threshold values for the potential evaluation in the different food sectors
Sect. Food Product Co- generation
Tri- generation
Biogas production
Tonnes processed /year I Fish1 4 000 989 10 417 Meet1 1 875 1 552 35 519 Tonnes product/year III Cotton seed 1 700 n.a. Ground nut 3 000 n.a. Rape-seed 2 500 n.a. Safflower 2 500 n.a. Sesame 3 000 n.a. Sunflower 2 500 n.a. Soybean 1 100 n.a.
3 000 Solid
Biomass
17 000 Biogas
V Corn 1 640 1 640 283 843 Bakery 8 857 3 490 577 778 Cereals n.a. n.a. 19 923 Coffee 2 708 7882 n.a. VI Sugar 400 000 n.a. 6 410 Chocolate3 82 286 18 581 n.a. VII Milk 11 719 32 727 n.a. Cheese 1 250 6 000 32 581 Butter 1 531 14 619 n.a Milk powder 429 10 286 n.a. Ice Cream 1 875 3 333 n,a Cultured products 11 538 32 727 n.a. hl product / year IV Beer 22 721 27 975 217 391 Spirits 4 972
hl pure alcohol
n.a. 71 429 hl pure alcohol
Juice 15 790 n.v. 400 000 Number of employees in the factory II Cooked food &
Vegetables 17 20 96
Explanations: 1…. Case 3 see APPENDIX I, 2….. freeze-dried coffee, 3….. Case 2 see APPNDIX VI, n.a…. not applicable according to estimation calculations, n.v….no values available By defining biogas has an energy content of 6 kWh/Nm3 and a min energy requirement of 450 MWh/year, determined by the CHP unit, a minimum production of 75 000 Nm3 biogas is required. In most of the industry sectors, by-products which are currently used for other purposes e.g. animal food, were not taken into account for the calculation of the energy which can produced by their use. Details can be found in the sector specific reports in the Appendixes. The next step is then to define the yield of biogas production per kg of waste material. Unfortunately, the biogas yield from different waste fractions can vary quite a lot, and depends on the anaerobic digestion process details, such as temperature, pressure, pH management, etc.
Publishable OPTIPOLYGEN report 23
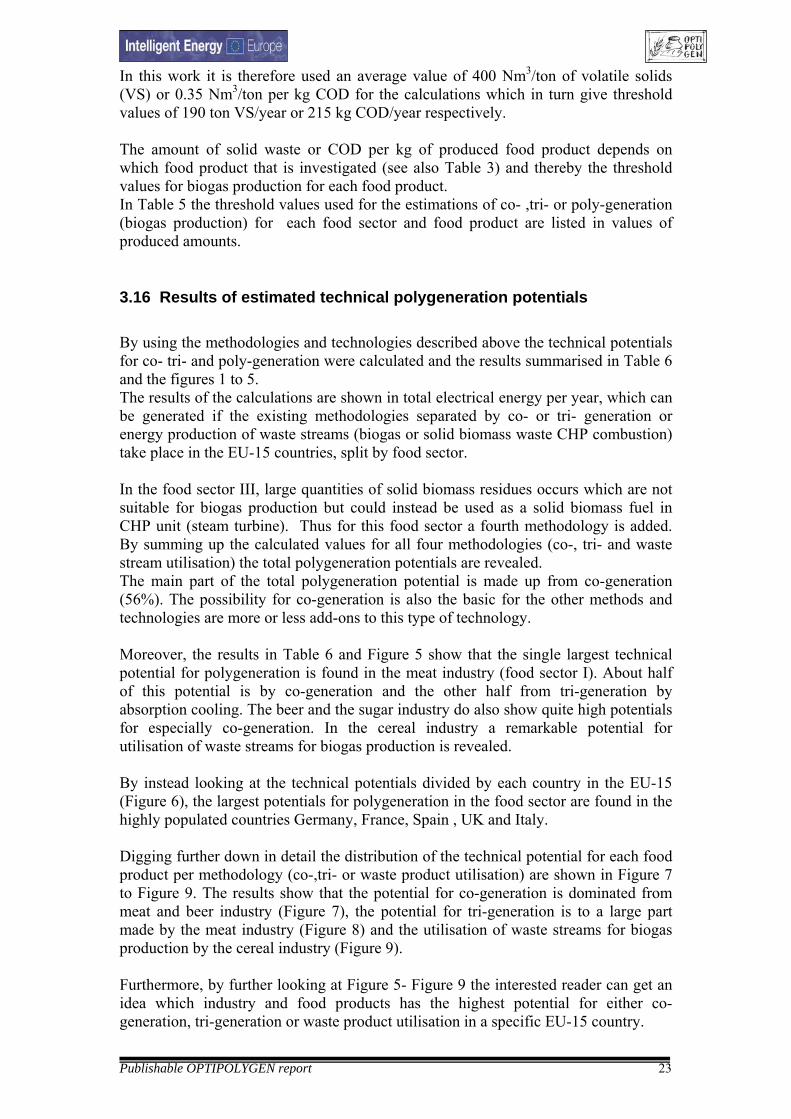
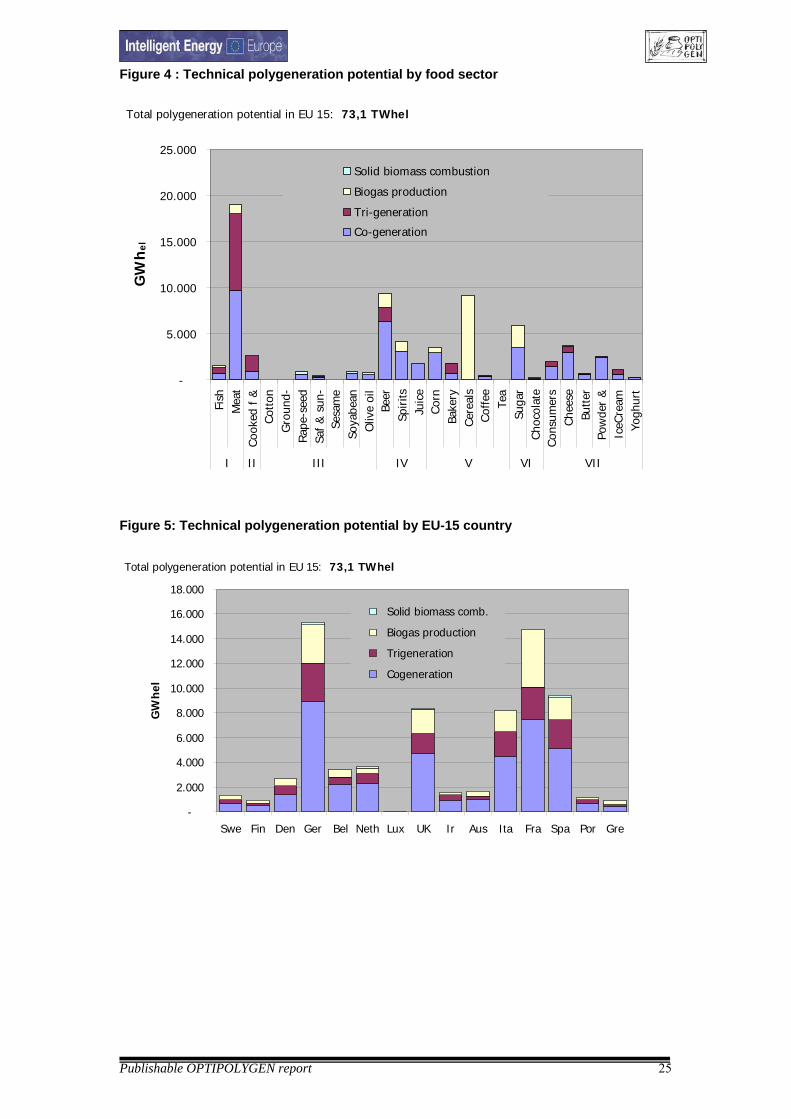
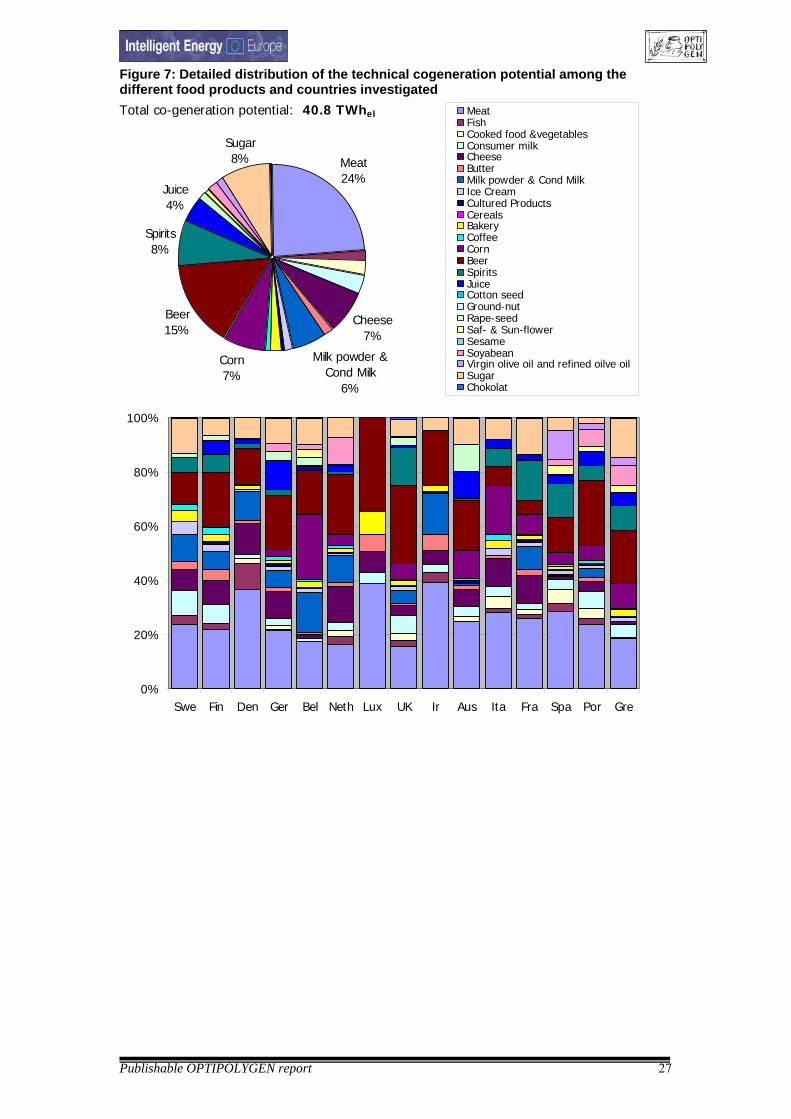
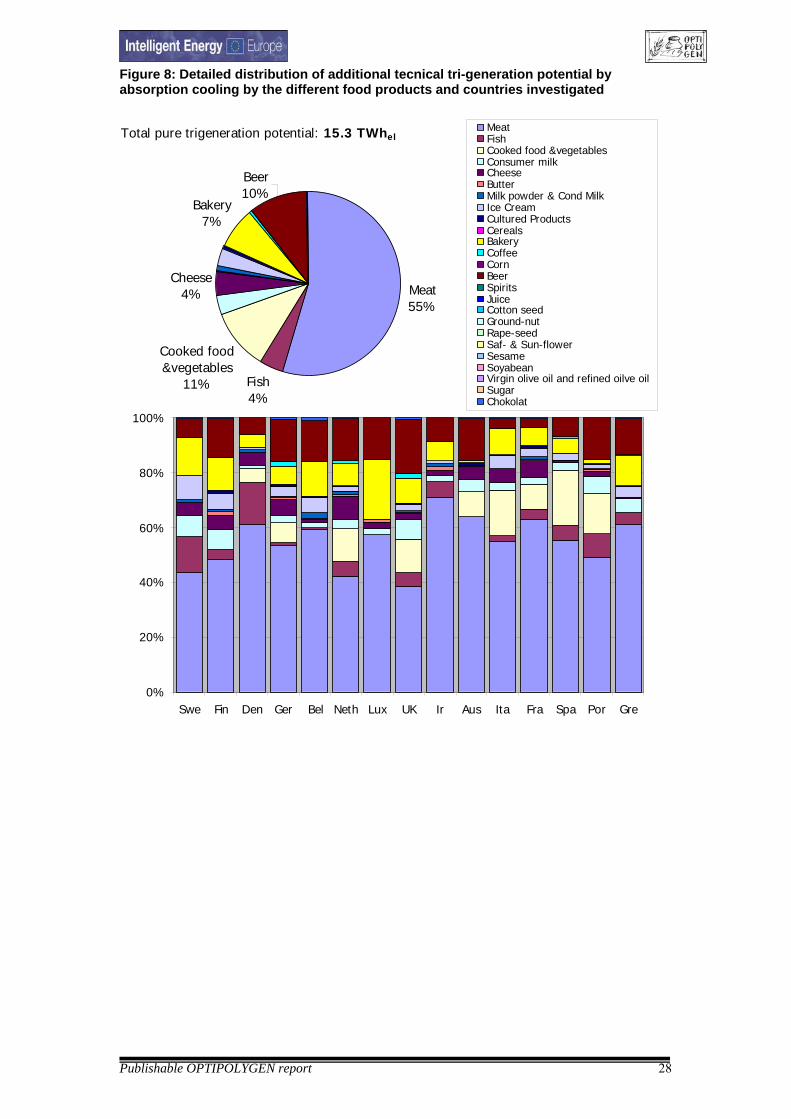
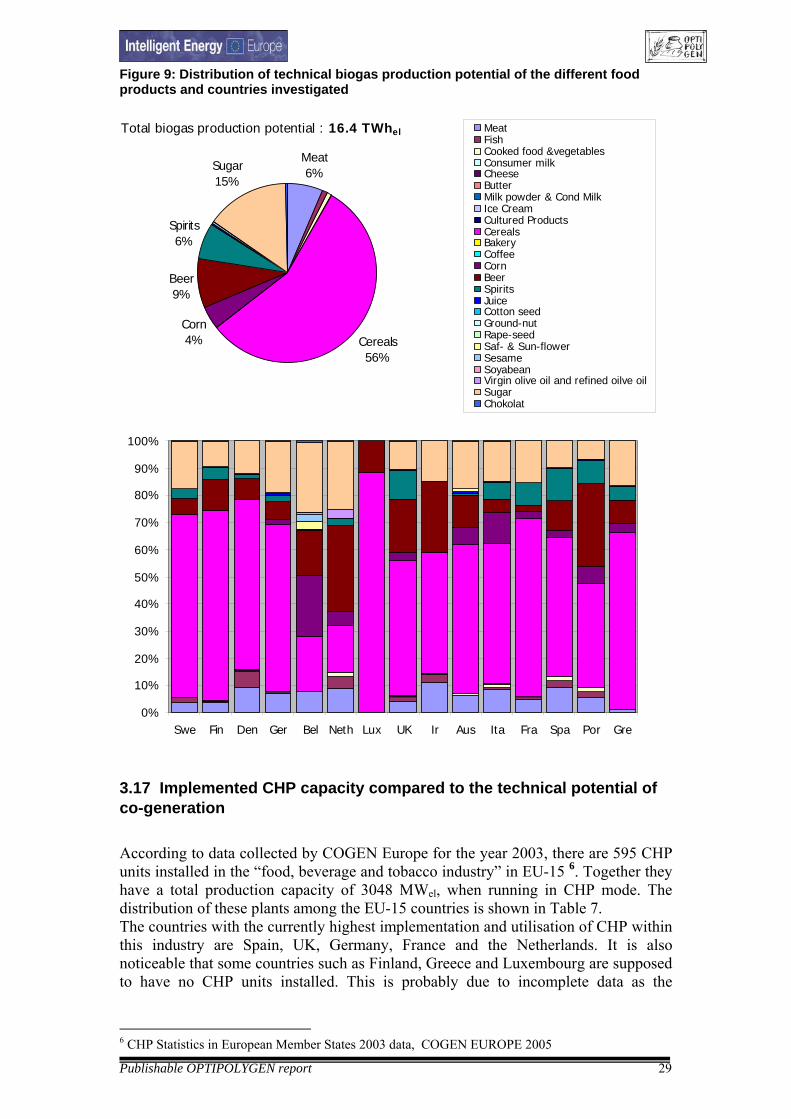
In this work it is therefore used an average value of 400 Nm3/ton of volatile solids (VS) or 0.35 Nm3/ton per kg COD for the calculations which in turn give threshold values of 190 ton VS/year or 215 kg COD/year respectively. The amount of solid waste or COD per kg of produced food product depends on which food product that is investigated (see also Table 3) and thereby the threshold values for biogas production for each food product. In Table 5 the threshold values used for the estimations of co- ,tri- or poly-generation (biogas production) for each food sector and food product are listed in values of produced amounts. 3.16 Results of estimated technical polygeneration potentials By using the methodologies and technologies described above the technical potentials for co- tri- and poly-generation were calculated and the results summarised in Table 6 and the figures 1 to 5. The results of the calculations are shown in total electrical energy per year, which can be generated if the existing methodologies separated by co- or tri- generation or energy production of waste streams (biogas or solid biomass waste CHP combustion) take place in the EU-15 countries, split by food sector. In the food sector III, large quantities of solid biomass residues occurs which are not suitable for biogas production but could instead be used as a solid biomass fuel in CHP unit (steam turbine). Thus for this food sector a fourth methodology is added. By summing up the calculated values for all four methodologies (co-, tri- and waste stream utilisation) the total polygeneration potentials are revealed. The main part of the total polygeneration potential is made up from co-generation (56%). The possibility for co-generation is also the basic for the other methods and technologies are more or less add-ons to this type of technology. Moreover, the results in Table 6 and Figure 5 show that the single largest technical potential for polygeneration is found in the meat industry (food sector I). About half of this potential is by co-generation and the other half from tri-generation by absorption cooling. The beer and the sugar industry do also show quite high potentials for especially co-generation. In the cereal industry a remarkable potential for utilisation of waste streams for biogas production is revealed. By instead looking at the technical potentials divided by each country in the EU-15 (Figure 6), the largest potentials for polygeneration in the food sector are found in the highly populated countries Germany, France, Spain , UK and Italy. Digging further down in detail the distribution of the technical potential for each food product per methodology (co-,tri- or waste product utilisation) are shown in Figure 7 to Figure 9. The results show that the potential for co-generation is dominated from meat and beer industry (Figure 7), the potential for tri-generation is to a large part made by the meat industry (Figure 8) and the utilisation of waste streams for biogas production by the cereal industry (Figure 9). Furthermore, by further looking at Figure 5- Figure 9 the interested reader can get an idea which industry and food products has the highest potential for either co-generation, tri-generation or waste product utilisation in a specific EU-15 country.

Publishable OPTIPOLYGEN report 24
Table 6 : Technical polygeneration potential in food industry of the EU-15 Co-
generationTri-generation
Waste stream utilisation
Tot
(gas turbine)
(gas turbine + abs cooler/freezer)
Waste stream for biogas prod (gas turbine)
Waste stream as solid biomass fuel (CHP)
GWhel I Fish 744 638 207 n.a. 1 588 Meet 9 701 8 327 1 029 n.a. 19 057II Cooked food &
vegetables 974 1 635 111 n.a. 2 720
III Cotton seed 0 n.a. 0 0 0 Ground nut 7 n.a. 0 2 9 Rape-seed 620 n.a. 23 193 836 Saf & Sun
flower 354 n.a. 15 97 466
Sesame 0 n.a. 0 0 Soya been 688 n.a. 18 185 891 Olive oil 584 n.a. 0 183 766IV Beer 6 311 1 545 1 485 n.a. 9 341 Spirits 3 135 n.a. 1 064 n.a. 4 199 Juice 1 743 n.v. 41 n.a. 1 784
V Corn 2 900 0 681 n.v. 3 580 Bakery 727 1 117 0 n.v. 1 844 Cereals 0 0 9 206 n.v. 9 206 Coffee 376 95 0 n.v. 471 Tea n.a. n.a. n.a. n.v. VI Sugar 3 463 - 2 473 n.a. 5 936 Chocolate 115 47 37 n.a. 199
VII Consumers milk
1 434 514 0 n.a. 1 948
Cheese 3 047 635 11 n.a. 3 692 Butter 614 64 0 n.a. 678 Milk powder &
Cond milk 2 405 100 0 n.a. 2 505
Ice Cream 611 478 0 n.a. 1 089 Cultivated
products 230 81 0 n.a. 311
Sum EU-15 40 784 15 276 16 399 660 73 119Explanations: n.a…. not applicable according to estimation calculations, n.v….no values available The detailed data of all calculations and background analyses in the different food sectors are revealed in the APENDIX I-VII. It should be noticed that in some of these reports the values for tri-generation potentials also includes co-generation. However, in this summary report the values for these two technologies are reported separated.
Publishable OPTIPOLYGEN report 25
Figure 4 : Technical polygeneration potential by food sector Total polygeneration potential in EU 15: 73,1 TWhel
-
5.000
10.000
15.000
20.000
25.000
Fish
Mea
tCo
oked
f &
Cot
ton
Gro
und-
Rap
e-se
edSa
f &
sun
-Se
sam
eSo
yabe
anO
live
oil
Beer
Spirits
Juic
eC
orn
Bake
ryC
erea
lsCof
fee
Tea
Suga
rCho
cola
teCon
sum
ers
Che
ese
Butter
Pow
der
&Ic
eCre
amYo
ghur
t
I II III IV V VI VII
GW
hel
Solid biomass combustion
Biogas production
Tri-generation
Co-generation
Figure 5: Technical polygeneration potential by EU-15 country Total polygeneration potential in EU 15: 73,1 TWhel
-
2.000
4.000
6.000
8.000
10.000
12.000
14.000
16.000
18.000
Swe Fin Den Ger Bel Neth Lux UK Ir Aus Ita Fra Spa Por Gre
GW
hel
Solid biomass comb.
Biogas production
Trigeneration
Cogeneration
Publishable OPTIPOLYGEN report 26
Figure 6: Technical potential coverage of electricity demand by polygeneration in EU-15 country
-
10
20
30
40
50
60
70
80
90
100
TWh
elec
tric
ty
0%
40%
80%
120%
% c
over
age
Estimated consum. 88 1,6 1,1 3,7 18,1 4,6 4,2 0,1 7,9 3,1 2,2 11,6 15,7 11,3 1,5 1,1
Pot. Polygeneration 73 1,3 0,9 2,7 15,3 3,4 3,6 0,0 8,4 1,6 1,7 8,2 14,7 9,4 1,1 0,9
% covered by poly 83% 82% 82% 72% 84% 73% 87% 41% 106 50% 74% 70% 94% 84% 76% 79%
EU15
Swe Fin Den Ger Bel Neth Lux UK Ir Aus Ita Fra Spa Por Gre
Publishable OPTIPOLYGEN report 27
Figure 7: Detailed distribution of the technical cogeneration potential among the different food products and countries investigated Total co-generation potential: 40.8 TWhel
Juice4%
Milk powder & Cond Milk
6%
Corn7%
Cheese 7%
Sugar8%
Spirits8%
Beer15%
Meat24%
MeatFishCooked food &vegetablesConsumer milkCheese ButterMilk powder & Cond MilkIce CreamCultured ProductsCerealsBakeryCoffeeCornBeerSpiritsJuiceCotton seedGround-nutRape-seedSaf- & Sun-flowerSesameSoyabeanVirgin olive oil and refined oilve oilSugarChokolat
0%
20%
40%
60%
80%
100%
Swe Fin Den Ger Bel Neth Lux UK Ir Aus Ita Fra Spa Por Gre
Publishable OPTIPOLYGEN report 28
Figure 8: Detailed distribution of additional tecnical tri-generation potential by absorption cooling by the different food products and countries investigated Total pure trigeneration potential: 15.3 TWhel
Fish4%
Cheese 4%
Cooked food &vegetables
11%
Meat55%
Beer10%
Bakery7%
MeatFishCooked food &vegetablesConsumer milkCheese ButterMilk powder & Cond MilkIce CreamCultured ProductsCerealsBakeryCoffeeCornBeerSpiritsJuiceCotton seedGround-nutRape-seedSaf- & Sun-flowerSesameSoyabeanVirgin olive oil and refined oilve oilSugarChokolat
0%
20%
40%
60%
80%
100%
Swe Fin Den Ger Bel Neth Lux UK Ir Aus Ita Fra Spa Por Gre
Publishable OPTIPOLYGEN report 29
Figure 9: Distribution of technical biogas production potential of the different food products and countries investigated Total biogas production potential : 16.4 TWhel
Cereals56%
Sugar15%
Spirits6%
Beer9%
Meat6%
Corn4%
MeatFishCooked food &vegetablesConsumer milkCheese ButterMilk powder & Cond MilkIce CreamCultured ProductsCerealsBakeryCoffeeCornBeerSpiritsJuiceCotton seedGround-nutRape-seedSaf- & Sun-flowerSesameSoyabeanVirgin olive oil and refined oilve oilSugarChokolat
0%
10%
20%
30%
40%
50%
60%
70%
80%
90%
100%
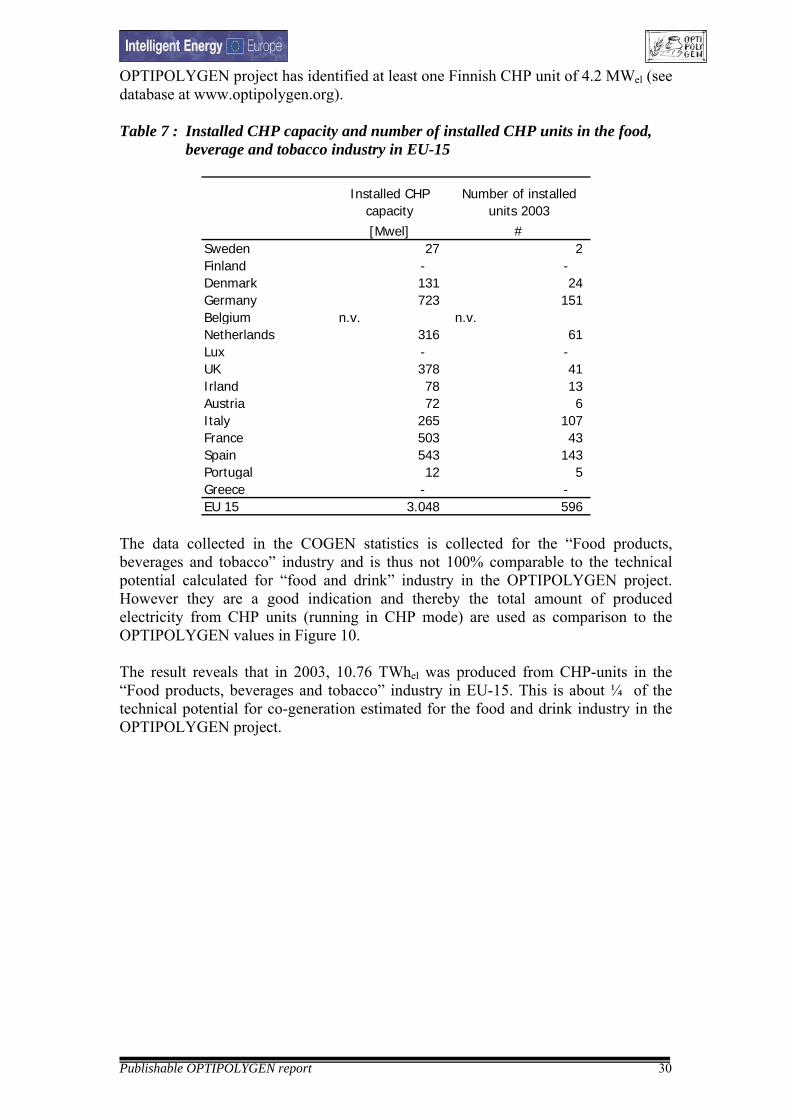
Swe Fin Den Ger Bel Neth Lux UK Ir Aus Ita Fra Spa Por Gre 3.17 Implemented CHP capacity compared to the technical potential of co-generation According to data collected by COGEN Europe for the year 2003, there are 595 CHP units installed in the “food, beverage and tobacco industry” in EU-15 6. Together they have a total production capacity of 3048 MWel, when running in CHP mode. The distribution of these plants among the EU-15 countries is shown in Table 7. The countries with the currently highest implementation and utilisation of CHP within this industry are Spain, UK, Germany, France and the Netherlands. It is also noticeable that some countries such as Finland, Greece and Luxembourg are supposed to have no CHP units installed. This is probably due to incomplete data as the
6 CHP Statistics in European Member States 2003 data, COGEN EUROPE 2005
Publishable OPTIPOLYGEN report 30
OPTIPOLYGEN project has identified at least one Finnish CHP unit of 4.2 MWel (see database at www.optipolygen.org).
Table 7 : Installed CHP capacity and number of installed CHP units in the food,
beverage and tobacco industry in EU-15
Installed CHP capacity
Number of installed units 2003
[Mwel] #Sweden 27 2 Finland - - Denmark 131 24 Germany 723 151 Belgium n.v. n.v.Netherlands 316 61 Lux - - UK 378 41 Irland 78 13 Austria 72 6 Italy 265 107 France 503 43 Spain 543 143 Portugal 12 5 Greece - - EU 15 3.048 596
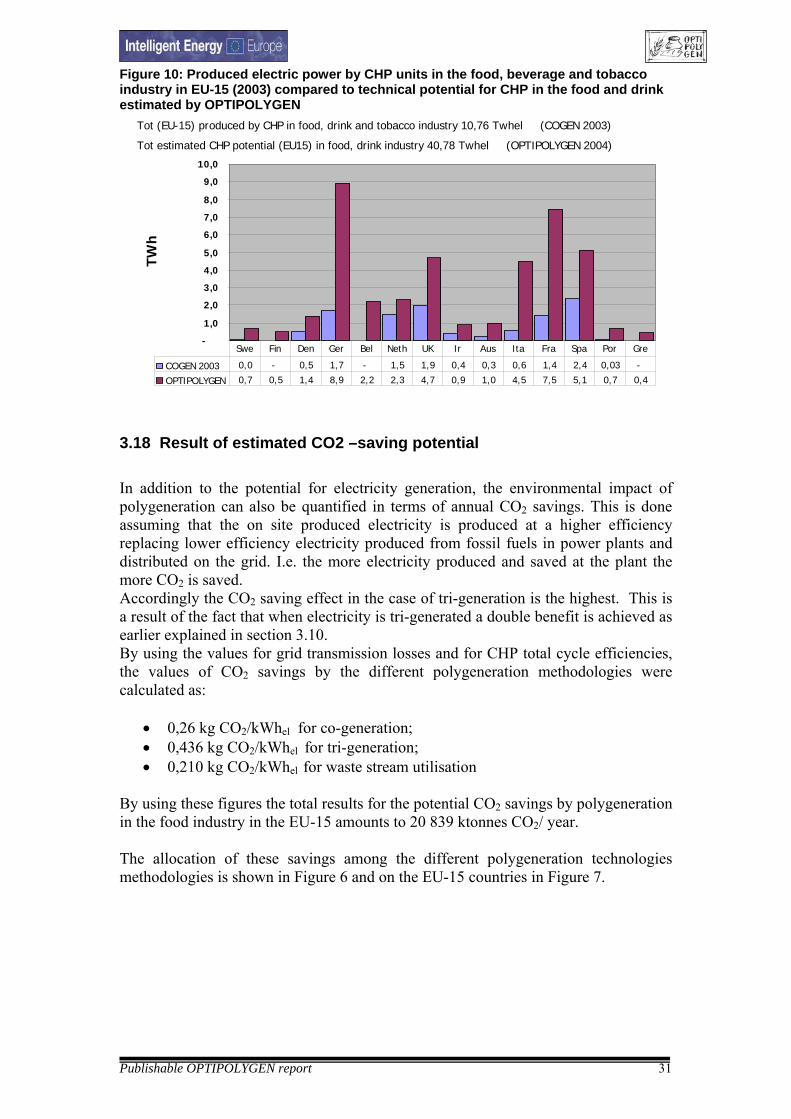
The data collected in the COGEN statistics is collected for the “Food products, beverages and tobacco” industry and is thus not 100% comparable to the technical potential calculated for “food and drink” industry in the OPTIPOLYGEN project. However they are a good indication and thereby the total amount of produced electricity from CHP units (running in CHP mode) are used as comparison to the OPTIPOLYGEN values in Figure 10. The result reveals that in 2003, 10.76 TWhel was produced from CHP-units in the “Food products, beverages and tobacco” industry in EU-15. This is about ¼ of the technical potential for co-generation estimated for the food and drink industry in the OPTIPOLYGEN project.
Publishable OPTIPOLYGEN report 31
Figure 10: Produced electric power by CHP units in the food, beverage and tobacco industry in EU-15 (2003) compared to technical potential for CHP in the food and drink estimated by OPTIPOLYGEN
-
1,0
2,0
3,0
4,0
5,0
6,0
7,0
8,0
9,0
10,0TW
h
COGEN 2003 0,0 - 0,5 1,7 - 1,5 1,9 0,4 0,3 0,6 1,4 2,4 0,03 -
OPTIPOLYGEN 0,7 0,5 1,4 8,9 2,2 2,3 4,7 0,9 1,0 4,5 7,5 5,1 0,7 0,4
Swe Fin Den Ger Bel Neth UK Ir Aus Ita Fra Spa Por Gre
Tot (EU-15) produced by CHP in food, drink and tobacco industry 10,76 Twhel (COGEN 2003)
Tot estimated CHP potential (EU15) in food, drink industry 40,78 Twhel (OPTIPOLYGEN 2004)
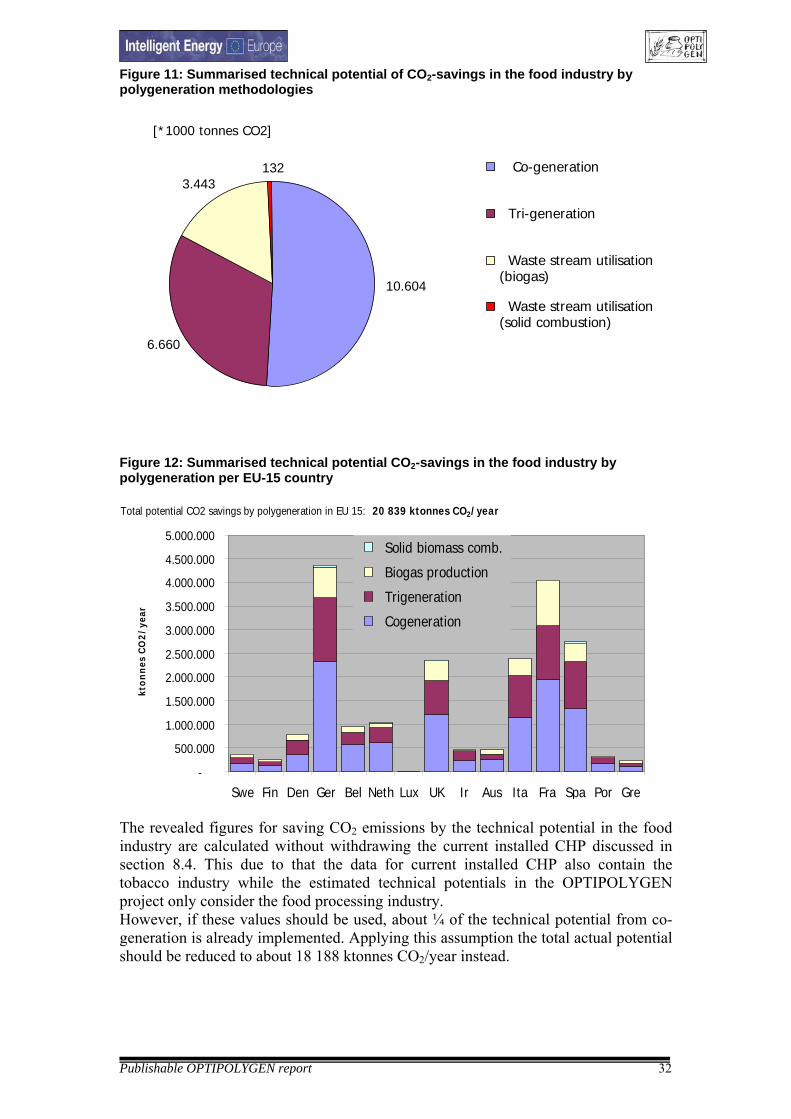
3.18 Result of estimated CO2 –saving potential In addition to the potential for electricity generation, the environmental impact of polygeneration can also be quantified in terms of annual CO2 savings. This is done assuming that the on site produced electricity is produced at a higher efficiency replacing lower efficiency electricity produced from fossil fuels in power plants and distributed on the grid. I.e. the more electricity produced and saved at the plant the more CO2 is saved. Accordingly the CO2 saving effect in the case of tri-generation is the highest. This is a result of the fact that when electricity is tri-generated a double benefit is achieved as earlier explained in section 3.10. By using the values for grid transmission losses and for CHP total cycle efficiencies, the values of CO2 savings by the different polygeneration methodologies were calculated as:
• 0,26 kg CO2/kWhel for co-generation; • 0,436 kg CO2/kWhel for tri-generation; • 0,210 kg CO2/kWhel for waste stream utilisation
By using these figures the total results for the potential CO2 savings by polygeneration in the food industry in the EU-15 amounts to 20 839 ktonnes CO2/ year. The allocation of these savings among the different polygeneration technologies methodologies is shown in Figure 6 and on the EU-15 countries in Figure 7.
Publishable OPTIPOLYGEN report 32
Figure 11: Summarised technical potential of CO2-savings in the food industry by polygeneration methodologies
10.604
6.660
3.443132 Co-generation
Tri-generation
Waste stream utilisation(biogas)
Waste stream utilisation(solid combustion)
[*1000 tonnes CO2]
Figure 12: Summarised technical potential CO2-savings in the food industry by polygeneration per EU-15 country
Total potential CO2 savings by polygeneration in EU 15: 20 839 ktonnes CO2/year
-
500.000
1.000.000
1.500.000
2.000.000
2.500.000
3.000.000
3.500.000
4.000.000
4.500.000
5.000.000
Swe Fin Den Ger Bel Neth Lux UK Ir Aus Ita Fra Spa Por Gre
kto
nn
es C
O2
/yea
r
Solid biomass comb.
Biogas production
Trigeneration
Cogeneration
The revealed figures for saving CO2 emissions by the technical potential in the food industry are calculated without withdrawing the current installed CHP discussed in section 8.4. This due to that the data for current installed CHP also contain the tobacco industry while the estimated technical potentials in the OPTIPOLYGEN project only consider the food processing industry. However, if these values should be used, about ¼ of the technical potential from co-generation is already implemented. Applying this assumption the total actual potential should be reduced to about 18 188 ktonnes CO2/year instead.
Publishable OPTIPOLYGEN report 33
3.19 Main results and conclusions The technical polygeneration potential for the food industry has been calculated for the EU-15 countries. The performed calculations were based on data for energy consumption, existing in the literature as well as on information collected via energy audits performed by the partners of the project. Data from EUROSTAT, PRODCOM , as well as food sector specific data bases were used as sources to gather data on the size distribution of food processing plants as well as produced amounts of food products in each EU 15 country. Despite these public available data, several assumptions and estimations have been necessary in order to get useful results. The plausibility of the data has been tested by comparing energy demands calculated in the OPTIPOLYGEN project with EUROSTAT data on the actual consumption of heat and electricity in the industry sector “food, beverage and tobacco”. The results revealed that despite the insecurity in all the estimations that had to performed the OPTIPOLYGEN values for the energy demand in the food processing industry are feasible and in the correct size range. Thereby the calculated technical potentials for polygeneration based upon the calculated energy demands of each food sector should also be feasible. The calculated results reveal a total technical polygeneration potential (co- + tri-generation and full utilisation of biomass waste stream) for all EU-15 countries to amount to about 73 TWhel/year, subsequently resulting in a potential CO2 emission saving of about 20 millions tonnes CO2/ year. More than half of the technical potential for polygeneration in the food industry is identified to be co-generation. By comparing with available data of installed capacities of CHP in the food, beverage and tobacco industry it can be assumed that up to ¼ of the calculated technical potential is already installed. However due to the different bases for the data calculated in the OPTIPOLYGEN project and the available data in the literature, this comparison should only be used indicative. Though, if used as valid values for the food processing industry it would reduce the additional total technical polygeneration potential to about 63 TWhel and subsequently the additional potential CO2 emission savings by polygeneration to about 18 million tonnes CO2/year. The high potential of co-generation is followed by tri-generation and the technical potential for converting waste streams into biogas which is subsequently used in a onsite CHP application. Both these technologies revealed technical potentials of about 16 TWhel each. No data for the actual total usage of these technologies in the food industry was found in the literature, although examples of both technologies implemented can be found. The fourth technology investigated was the utilisation of solid waste used as solid biomass fuel in a CHP plant using a steam turbine cycle. This technology was however only found feasible for the food sector III and was estimated to be around 0,6 TWhel for the whole EU-15. The differences between the different food sectors in terms of applicable polygeneration technologies is further shown by that e.g. in the food sector III tri-generation is not at all technically plausible while in food sector I and II, which both includes a lot of freezing and cooling, tri-generation with absorption freezing or chilling cycles are very significant.
Publishable OPTIPOLYGEN report 34
The individually totally highest technical polygeneration potential is also found in the meat processing industry (food sector I). Other industries with significant technical potentials are beer production (food sector IV) and cereal production (food sector V). In the cereal production industry, the production of biogas from biomass waste residues shows the dominating technical potential. The potential for biogas generation is otherwise limited in most of the other food sectors, mainly because of the threshold value for building a biogas plant at the food plant. In order to make biogas generation viable, significant amounts of wastes for the biogas installation are needed. Although today’s food processing plants are generally getting larger and larger, there is also a trend to more efficiently use of waste- and by- products as lower value products for non-human consumption purposes in the animal by-products industry. The value of such products is typically higher than the value of the waste as a source for energy production. With respect to the distribution of the technical potential for polygeneration in the food industry among the European countries (EU-15), the potential practically follows the population distribution in the same way as the production and consumption of food does. Thereby the largest technical potentials are typically found in the order Germany, France, Spain, UK and Italy. By comparing data for the electric power produced by CHP in the “food, beverage and tobacco” industry with the amounts consumed, this show production that on an average cover about 12% of the demand in EU-15 (2003). By applying the total technical polygeneration potential calculated for the food industry in the OPTIPOLYGEN project this figure would be increased to about 80% (2004). Results of the work concern the EUR-15 food industry as the OPTIPOLYGEN project and budget was fixed before the joining of the EUR-25 countries. Future work may reveal the potential of polygeneration in the 10 European countries which joined European Union in 2005. Data presented in this WP were based on the data available in Eurostat in 2005 i.e. when WP2 was running. These data include the 2003 values. Updating of the results using the data of more recent years is possible using the already existing models and calculation procedures. It is however expected that main results have not been affected as there are no significant improvements on the rate that new cogeneration applications are launched in the food industry. Although this action within the OPTIPOLIGEN project revealed the technical potential of polygeneration in the EUR-15 food industry, other parameters like fuel and electricity prices are extremely important to make such investments feasible or not. These parameters are treated to a certain extend in the subsequent chapters.
Publishable OPTIPOLYGEN report 35
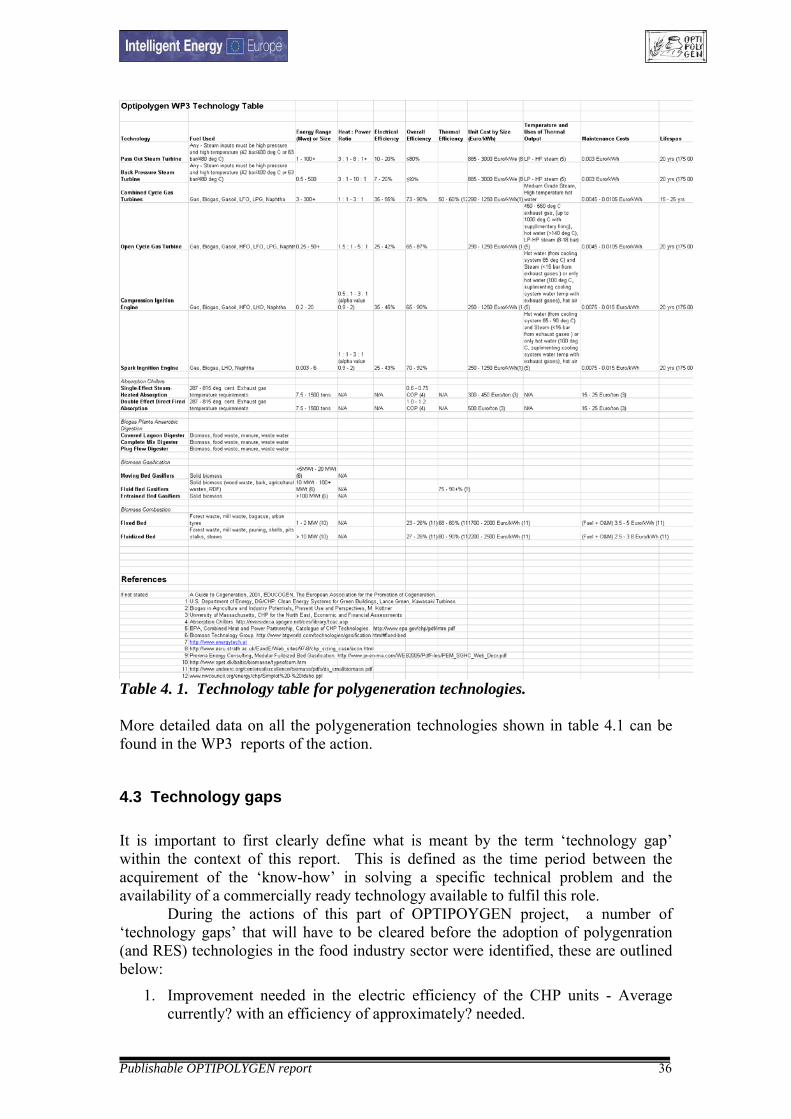
4. Technical issues of polygeneration applications in the various food industry sectors. Application and investment guidelines. Possible technology gaps. 4.1 Introduction The main goal of this part of the OPTIPOLYGEN project is to give to the potential users of polygeneration a full overview of the currently existing polygeneration technologies their characteristics and the parameters needed to be taken into account when a polygeneration system is planned. Technical parameters of polygeneration was the sublect of WP3 while application and investment guidelines was the subject of WP4. 4.2 Technical issues of polygeneration. One of the main tasks of this action was to overview the main parameters of the equipment used in polygeneration applications. Collective results are shown in the next table while detailed data can be found in the WP3 report. As already mentioned cogeneration and tri-generation are specific forms of polygeneration. The introduction of more than one primary energy input e.g. natural gas+biogas results in a real polygeneration scheme where multiple energy inputs (natural gas and biogas) are transformed into multiple useful energy outputs i.e. electricity, heat and cooling. In general terms the combination of e.g. photovoltaics with cogeneration is also a polygeneration scheme. In OPTIPOLYGEN however the main purpose is to examine the potential and the involvement of the renewables associated with the food processing itself into the energy mix used in the polygeneration installation. Because of this, cases like PV or wind turbine applications in the food industry were not taken into account. The main drivers in polygeneration applications are those used in cogeneration plants. Technologies dedicated to generate gas or liquid fuels from wastes are also driving forces in polygeneration applications. All these technologies are examined in terms of their suitability for polygeneration applications in the food industry.
Publishable OPTIPOLYGEN report 36
Table 4. 1. Technology table for polygeneration technologies. More detailed data on all the polygeneration technologies shown in table 4.1 can be found in the WP3 reports of the action. 4.3 Technology gaps It is important to first clearly define what is meant by the term ‘technology gap’ within the context of this report. This is defined as the time period between the acquirement of the ‘know-how’ in solving a specific technical problem and the availability of a commercially ready technology available to fulfil this role. During the actions of this part of OPTIPOYGEN project, a number of ‘technology gaps’ that will have to be cleared before the adoption of polygenration (and RES) technologies in the food industry sector were identified, these are outlined below:
1. Improvement needed in the electric efficiency of the CHP units - Average currently? with an efficiency of approximately? needed.
Publishable OPTIPOLYGEN report 37
2. Absorption based ammonia freezers should reduce their nominal size to meet lower demand in small plants - reduction to approximately 150 kW freezing load needed.
3. Improvements in the COP of ammonia based freezers 4. Improvements in the capability of absorption chillers to meet fluctuating
freezing loads - therefore eliminating the need for compression freezing back-up.
5. Reduction in nominal capacity of biogas plants - would increase suitability in smaller units.
6. Reduction in space needed for biogas and anaerobic installation plants - again would increase suitability in smaller units.
7. Increase in conversion efficiency of biogas plants - to approximately? 8. Reduction in retention time and maintenance needs of biogas plants 9. Improvements in gasification technologies to make them market standard -
would have positive impact in specific food sector polygeneration applicability i.e. oils, fats, cereals etc.
10. Ability to refine animal fat for use in diesel engine for cogeneration - one of the major waste products from the cooked food industry is animal fat, which currently has only been considered for direct burning. However an enhanced solution would be to refine the fat and use the refined oil to fuel a diesel engine for cogeneration. This could also have applications in other food industry sectors where large amounts of animal fats are produced as waste products, i.e. abattoirs.
11. Development of short-term electrical storage solutions - this is a very general problem that exists in any industry seeking to apply cogeneration or trigeneration technologies. Due to variations in energy demand throughout the day the question of what to do with excess electricity generated is raised. There are two solutions to this: 1) is to sell the excess electricity back to the grid. This involves significant changes to the grid system in order to allow for this and to monitor the flow of electricity both into and out of the grid; 2) store the electricity on site therefore creating a self-sufficient system. Currently, there are no practical solutions for the storage of energy that would allow for this kind of approach.
12. Low electricity to heat ratio of existing CHP technologies capable of using solid biomass (i.e. steam turbines) - all existing technologies for the conversion of biomass to electricity to heat result in a high heat to electricity ratio. Currently, this means that these technologies are only applied to situations where high thermal loads are required. The ability to obtain a high electricity to heat ratio from solid biomass would serve to significantly improve the applicability of these technologies.
13. Use of fuel independent technologies (i.e. ORC or Stirling Engines), which would allow the use of solid biomass - currently a lot of work is underway to produce small scale biomass fuelled Stirling based CHP systems which will be applicable for use in small food production plants. These would prove to be very useful for a significant number of smaller scale food processing plants.
14. Developments in fuel cell application to polygeneration technologies - currently a lot of work is being undertaken to develop fuel cells for use in CHP technology where a high electricity to heat ratio could be obtained. However, their application to biomass is still a long way in the future.
Development of solutions to solve these technology gaps will result in a further increase in the applicability, and therefore application, of polygeneration technologies within the food industry sector and hence improve sustainability in the industry.
Publishable OPTIPOLYGEN report 38
4.4 Application guidelines Guidelines for the setting –up and the implementation of Polygeneration plants and investments have been set-up during the run of the action. The main results are listed below while detailed information can be found in the project’s WP4 deliverable. 4.4.1 Energy infrastructure and available fuels – location of the food factory The energy infrastructure and availability of various fuels are critical boundary conditions when the feasibility of polygeneration in a food factory is evaluated. The capacity of existing electricity grid connection for the factory is usually sized based on the peak power demand. Thus, if the peak power of the new polygeneration unit stays below the peak power of the electricity demand, which is usually the case, there is no need to upgrade the grid connection, even if it is planned to feed at least part of the electricity production into the grid. Thus, the electricity connection is seldom a problem. One important issue, that may limit the technical alternatives, is the availability of natural (or bio) gas. The gaseous fuels are typically suitable for many technologies, e.g. gas engines and gas turbines that are the most common technologies in the food and drink industry sector. If there are no gaseous (or liquid) fuels available, these technologies are excluded and the electricity generating technology options are limited to steam engines and steam turbines and perhaps to Stirling engines and ORC processes. The local renewable fuels, such as biomass fuels, are suitable for these technologies. In some cases, the food factory may be connected to a district heat network. In this case, it is possible, if agreed with local district heating company that the thermal overproduction of the polygeneration plant can be fed into the district heat network. 4.4.2 Rules of electricity trade and transmission – free market and equal terms for everyone? What are the driving forces? The objective of EU is to open the electricity market and guarantee electricity producers non-discriminatory access to electricity network and market places. Nowadays, however, the legislation and rules of various EU countries vary a lot. Firstly, the access to electricity grid depends on the country. For example in the Netherlands the Electricity Tariff Code stipulates that connection charges of connections up to 10 MVA include only the payment of capital and maintenance costs of the connection needed to integrate the CHP unit into the existing network. Other possible costs resulting from adjustments, reinforcements or upgrades on the network beyond the point of interconnection are not included in the connection charges. However, in some countries, the costs resulting from adjustments, reinforcements or upgrades on the network beyond the point of interconnection are included in the connection charges.
Publishable OPTIPOLYGEN report 39
Secondly, there are different kind of technical limitations for grid connections that are mainly used to control the quality of electricity and the safety in case of power failure. There are no general standards for grid connections and in some cases these technical requirements may vary between distribution companies. Especially for small-scale solutions these technical requirements may lead to overly expensive solutions. Thirdly, the electricity transmission fees for the electricity producers may vary a lot depending on country and electricity distribution company. For example in Finland, some distribution companies have positive tariffs and some others negative tariffs for feeding electricity into the grid. Fourth question concerns who buys the electricity that is fed into the grid and what is the price. In some countries, e.g. in Germany, there are guaranteed feed-in-tariffs while in some countries, e.g. in Finland, the electricity producer must make a contract with some electricity selling company and the price is negotiated case by case. From all the above it is obvious that the attitude of the grid owners and operators towards polygeneration users is sometimes based more on local and short term financial parameters than on pure environmental and energy efficiency measures and usually is not taking into account the financial impact of the low efficiency grid electricity and the associated environmental implications. This forms, among others, a significant obstacle for the development of energy efficiency and environmentally friendly plants like polygeneration plants which naturally require, because of their size compared to the centrally located power stations, higher specific investment prices. 4.4.3 District heat trade and transmission – chances to sell surplus heat? Generally the heat produced with onsite polygeneration unit(s) is used in the food factory. However, there may be situations, when the heat production exceeds the heat demand. In these cases, if the heat is not stored, the heat must be dumped or it can be sold to other consumers in the vicinity of the food factory, or there may be a district heat network operator, which may be interested in buying heat. Selling heat to other consumers is usually more profitable as the consumer price is usually higher than the price that a district heat company is willing to pay. In many cases, especially when the overproduction of heat is difficult to forecast, the district heat company does not want to buy the surplus heat at all. On the other hand, in cases where the heat overproduction happens during the peak heat demand, the price of heat can be relatively high. If a part of the heat produced is sold - either to other consumer in the vicinity of the food factory or to a district heat company - there is need for further investments, such as heat exchangers, metering devices and pipelines. The feasibility of these investments is very case dependent and there are no general rules. At least the payback time of the investment must be shorter than the time of the selling contract. Sometimes it is also possible that the district heat company owns the polygeneration units. In this case the district heat company sells electricity, heat and steam to the food factory based on mutual agreement and production policy. Usually, in these cases, the operation and maintenance are taken care of by the district heat company.
Publishable OPTIPOLYGEN report 40
4.4.4 Value of avoided carbon dioxide emissions The EU Emission Trading Scheme (ETS) is one of the policies being introduced across Europe to tackle emissions of carbon dioxide and other greenhouse gases and combat the serious threat of climate change. The scheme commenced on 1 January 2005. The first phase runs from 2005-2007 and the second phase will run from 2008-2012 to coincide with the first Kyoto Commitment Period. Further five-year periods are expected subsequently. The scheme will work on a "Cap and Trade" basis. EU Member State governments are required to set an emission cap for all installations covered by the Scheme. Each installation will then be allocated allowances for the particular commitment period in question. The number of allowances allocated to each installation for any given period, (the number of tradable allowances each installation will receive), will be set down in a document called the National Allocation Plan. ETS concerns only installations that have thermal power above 20 MW. Thus, only large food factories can benefit from emission reductions by using ETS. However, the EU ETS Directive allows that also smaller installations can be accepted into ETS (so called Opt-in option). Unfortunately, only few countries have utilized this opportunity. There may still be other national mechanisms to create incentives for emission reductions, if the food factory is outside ETS. Despite the fact that ETS has the goal to boost CO2 reductions and consequently energy efficiency there are several cases where polygeneration and cogeneration applications have been treated in a way that slows down development in the plants participating the scheme. In every EUR-15 country and based on the local National Allocation Plan specific attention has to be paid when polygeneration is planned in factories participating ETS. 4.4.5 Regulations concerning biodegradable waste handling If biogas production from biodegradable by-products (biowaste) onsite a food factory is considered, it is important to be aware of different regulations, and therefore, of different investment needs, depending on what kind of waste shall be processed. When the raw materials to be fed into the biogas reactor contain only vegetable ingredients, there are no restrictions. But if also animal ingredients are included, the EC statute on animal by-products not intended for human consumption must be followed – this concerns all EU countries.7 This statute categorizes animal by-products unfit for human consumption into three classes. The first class contains items that pose the highest risks on human health and it is not allowed to process them in a biogas reactor. The second class contains items that need to be made hygienic – except manure - by heating them at 133 °C and 3 bar for 20 minutes before feeding into the reactor. The third class items (includes food waste and animal by-products from food industries) can be used as such. Thus, if animal by-products only from the food factory itself are going to be fed into the reactor, there are no problems. But if also animal waste from outside the food factory is planned to be processed in the reactor, the situation is more complicated: proper commercial documents must accompany every single waste delivery to the biogas 7 REGULATION (EC) No 1774/2002 OF THE EUROPEAN PARLIAMENT AND OF THE COUNCIL laying down health rules concerning animal by-products not intended for human consumption
Publishable OPTIPOLYGEN report 41
reactor plant, stating the class of the delivered waste; and if class 2 waste, in addition to class 3 waste, is desired to be processed in the reactor, then the facility for heat treatment of the class 2 waste must be build onsite as well - unless only heat treated class 2 material is accepted. 4.4.6 Subsidies for onsite polygeneration solutions? The subsidies for onsite polygeneration or CHP production vary from country to country. The main subsidy mechanisms are investment grants, taxation subsidies (either fuel or electricity and heat), guaranteed price (feed in tariff) and green certificates (if renewable fuels are utilized). The portfolio of subsidies depends on the country. For example in Finland polygeneration investment can get investment grant, the amount of which depends e.g. on technological novelty (pilot plants get more) and whether it uses renewable fuels or not (renewables get more). For example in Germany there are feed in tariffs, while e.g. in Italy and Sweden there are green certificate market. Usually the subsidy policy has a strong effect on the feasibility of the polygeneration. Thus, it is important to find out the subsidies available before the investment decision. 4.4.7 Taxation Taxation issues in EU area are national. Thus the taxation of various fuels as well as electricity is quite different in different countries. That is why taxation policy may have a strong effect on the feasibility of polygeneration. Also the rules on who pays the taxes (producer or consumer) may vary from country to country. Especially, if electricity and heat is produced and consumed onsite, it is important to find out the taxation rules before the investment decision. One should also remember that taxes may change even remarkably during the life-time of the polygeneration installation. 4.4.8 Prices of renewable and efficient electricity. Although EC has shown her approach that green and efficient electricity should attract some benefits corresponding to the non polluting nature of this electricity, this has been sometimes not adopted in the local markets. Although the 2004-8-EC directive and the Commission Decission on Harmonised values for the calculation of the cogeneration efficiency adopted in December 2006 in most of the European markets energy priced do not permit the development of cogeneration even if it creates significant Primary Energy Savings at the range of 15%. The following figure arised from an analysis concerning the simple pay back period of cogeneration investments based on typical equipment costs of 2006. In this figure simple pay-back periods are calculated for CHP investments depending on the Electricity over Fuel price ratio in the X –axis –EFPR-. Figure shows that to achieve Simple pay back periods of say 5 years an EFPR of 3 is needed. This is hardly the case in most of the European countries.
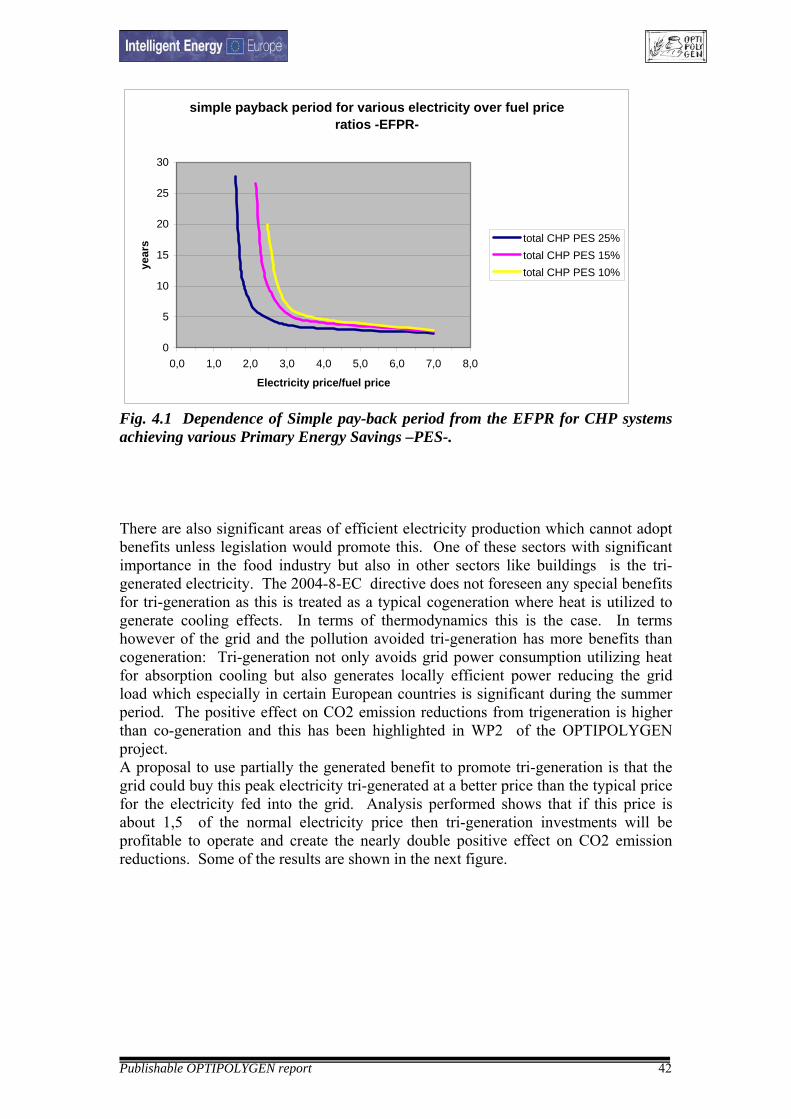
Publishable OPTIPOLYGEN report 42
simple payback period for various electricity over fuel price ratios -EFPR-
0
5
10
15
20
25
30
0,0 1,0 2,0 3,0 4,0 5,0 6,0 7,0 8,0
Electricity price/fuel price
year
s total CHP PES 25%total CHP PES 15%total CHP PES 10%
Fig. 4.1 Dependence of Simple pay-back period from the EFPR for CHP systems achieving various Primary Energy Savings –PES-. There are also significant areas of efficient electricity production which cannot adopt benefits unless legislation would promote this. One of these sectors with significant importance in the food industry but also in other sectors like buildings is the tri-generated electricity. The 2004-8-EC directive does not foreseen any special benefits for tri-generation as this is treated as a typical cogeneration where heat is utilized to generate cooling effects. In terms of thermodynamics this is the case. In terms however of the grid and the pollution avoided tri-generation has more benefits than cogeneration: Tri-generation not only avoids grid power consumption utilizing heat for absorption cooling but also generates locally efficient power reducing the grid load which especially in certain European countries is significant during the summer period. The positive effect on CO2 emission reductions from trigeneration is higher than co-generation and this has been highlighted in WP2 of the OPTIPOLYGEN project. A proposal to use partially the generated benefit to promote tri-generation is that the grid could buy this peak electricity tri-generated at a better price than the typical price for the electricity fed into the grid. Analysis performed shows that if this price is about 1,5 of the normal electricity price then tri-generation investments will be profitable to operate and create the nearly double positive effect on CO2 emission reductions. Some of the results are shown in the next figure.
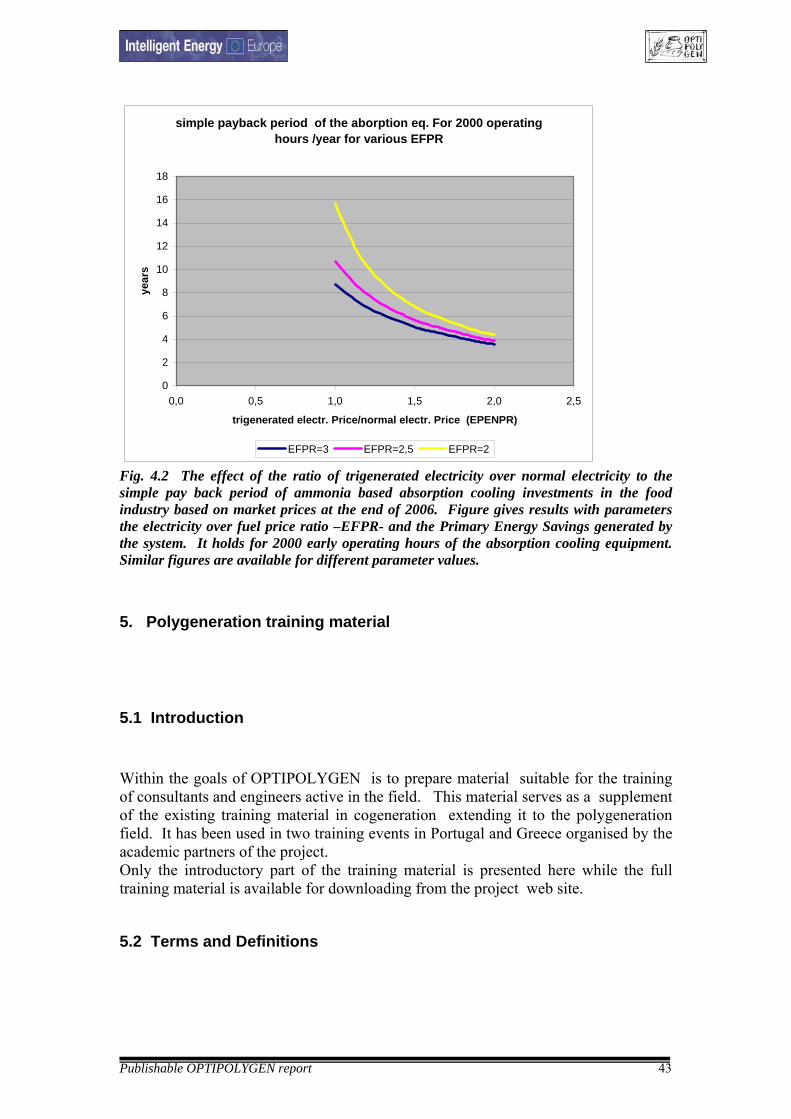
Publishable OPTIPOLYGEN report 43
simple payback period of the aborption eq. For 2000 operating hours /year for various EFPR
0
2
4
6
8
10
12
14
16
18
0,0 0,5 1,0 1,5 2,0 2,5
trigenerated electr. Price/normal electr. Price (EPENPR)
year
s
EFPR=3 EFPR=2,5 EFPR=2
Fig. 4.2 The effect of the ratio of trigenerated electricity over normal electricity to the simple pay back period of ammonia based absorption cooling investments in the food industry based on market prices at the end of 2006. Figure gives results with parameters the electricity over fuel price ratio –EFPR- and the Primary Energy Savings generated by the system. It holds for 2000 early operating hours of the absorption cooling equipment. Similar figures are available for different parameter values. 5. Polygeneration training material 5.1 Introduction Within the goals of OPTIPOLYGEN is to prepare material suitable for the training of consultants and engineers active in the field. This material serves as a supplement of the existing training material in cogeneration extending it to the polygeneration field. It has been used in two training events in Portugal and Greece organised by the academic partners of the project. Only the introductory part of the training material is presented here while the full training material is available for downloading from the project web site. 5.2 Terms and Definitions
Publishable OPTIPOLYGEN report 44
Polygeneration is the transformation of multiple energy sources into multiple, suitable for use, energy forms8. This is a general view on what polygeneration means and can be realized by, e.g., when we use natural gas and biogas to produce heat and electricity or when we use solar energy, wind and natural gas to produce electricity and useful hot water, or any other combination of primary or secondary energy sources to produce any combination of useful forms of energy. Based on the above approach cogeneration of heat and power (CHP) is a version of polygeneration and the same is valid for trigeneration – cogeneration of power, heat and a cooling medium. Polygeneration can improve energy supply safety, may also have financial benefits and can improve renewable energy participation in the total energy supply mix. It however demands more complicated energy systems, increased investment costs and needs additional operational and engineering skills. The use of polygeneration in the food industry can arise from several reasons and can serve multiple objectives, e.g., the use of the energy content of by-products, the energy cost savings, etc. In OPTIPOLYGEN project, polygeneration based either on fossil fuels or on primary energy sources available from the production processes themselves have been considered. As such solar or wind energy was not considered as these are not generated by the food production processes and are not specific to the food industry.
5.3 Cogeneration and polygeneration: the basics
As mentioned in the introduction, cogeneration forms a version of polygeneration. As cogeneration is more familiar within industry, definitions will be first given for cogeneration and then will be extended to include polygeneration.
5.3.1 Cogeneration
Cogeneration is also named as cogeneration of heat and power (CHP). CHP is the efficient utilization of the heat which is cogenerated with power when thermal cycles are used to produce power9. In conventional thermal power plants the heat cogenerated with the electricity is released in the environment without being used to cover existing thermal needs. As a result the efficiency of a typical plant is relatively low – up to 55% with the modern combined cycle plants.
8 We did not manage to find a definition of polygeneration thus we created this definition for the most general case of polygeneration. 9 There are several definitions of cogeneration although some of them are false in both thermodynamic and technical terms. As an example : cogeneration is the simultaneous generation of heat and electricity. This is not correct as simultaneous generation of heat and electricity takes place in the conventional power plants as well.
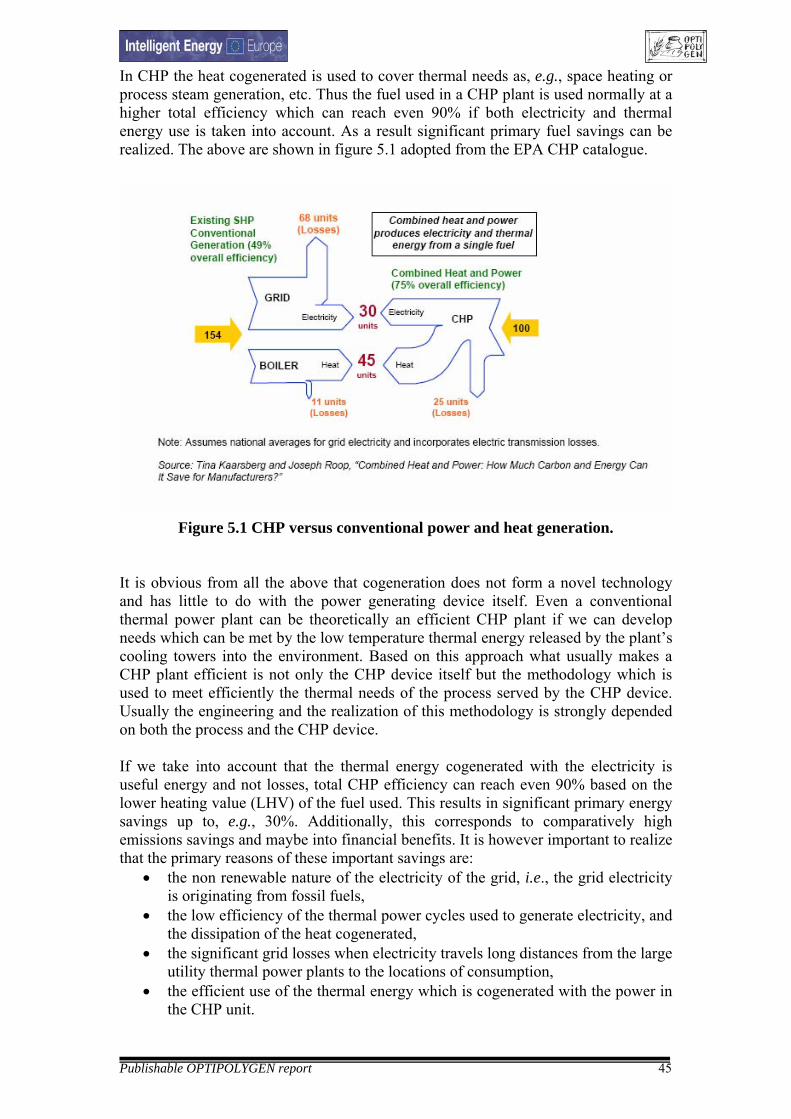
Publishable OPTIPOLYGEN report 45
In CHP the heat cogenerated is used to cover thermal needs as, e.g., space heating or process steam generation, etc. Thus the fuel used in a CHP plant is used normally at a higher total efficiency which can reach even 90% if both electricity and thermal energy use is taken into account. As a result significant primary fuel savings can be realized. The above are shown in figure 5.1 adopted from the EPA CHP catalogue.
Figure 5.1 CHP versus conventional power and heat generation.
It is obvious from all the above that cogeneration does not form a novel technology and has little to do with the power generating device itself. Even a conventional thermal power plant can be theoretically an efficient CHP plant if we can develop needs which can be met by the low temperature thermal energy released by the plant’s cooling towers into the environment. Based on this approach what usually makes a CHP plant efficient is not only the CHP device itself but the methodology which is used to meet efficiently the thermal needs of the process served by the CHP device. Usually the engineering and the realization of this methodology is strongly depended on both the process and the CHP device. If we take into account that the thermal energy cogenerated with the electricity is useful energy and not losses, total CHP efficiency can reach even 90% based on the lower heating value (LHV) of the fuel used. This results in significant primary energy savings up to, e.g., 30%. Additionally, this corresponds to comparatively high emissions savings and maybe into financial benefits. It is however important to realize that the primary reasons of these important savings are:
• the non renewable nature of the electricity of the grid, i.e., the grid electricity is originating from fossil fuels,
• the low efficiency of the thermal power cycles used to generate electricity, and the dissipation of the heat cogenerated,
• the significant grid losses when electricity travels long distances from the large utility thermal power plants to the locations of consumption,
• the efficient use of the thermal energy which is cogenerated with the power in the CHP unit.
Publishable OPTIPOLYGEN report 46
The equipment used to transform the primary energy into electricity and heat can be of various types such as an internal combustion engine (ICE), a gas turbine combined with a heat recovery boiler (HRB), etc. The main options are analyzed in brief in the subsequent chapters. Another benefit of CHP is its local character. This is imposed by the need to use efficiently the thermal energy produced. Thermal energy cannot – at least nowadays – be transferred to long distances. As a result, efficient use of the thermal energy means that the plant producing it should be located close to the thermal energy consumption points. This means that electricity is produced also close to the consumption points. This results in significant reduction of the power grid losses which in several countries can be as high as 12% of the total electricity generation of the country. Safety supply is also a significant benefit as one plant can break down while other can still running. All these potential benefits gave rise to the Decentralized Power Generation concept.
5.3.2 Polygeneration
Usually CHP is realized using a single fuel, e.g., natural gas. When more than one fuel is used then polygeneration arises. In the most general form polygeneration stands for the use of multiple primary energy sources. Using them, multiple useful energy outputs can become available, i.e., electricity, steam, or a cooling medium via absorption chillers. This general polygeneration scheme, which is based on fuels only, is shown in figure 1.2. Additionally other forms of energy can be used as inputs, e.g., wind energy or solar radiation. Theoretically polygeneration can be analyzed using the same parameters as those for cogeneration. The only difference is that primary energy input should be split into several parts one for every specific primary energy source used. In the case that heat is also used to generate a cooling medium then all the parameters used to evaluate the absorption cooling efficiency can be used. Based on the above general rules polygeneration applications can be analyzed using the following formulas.
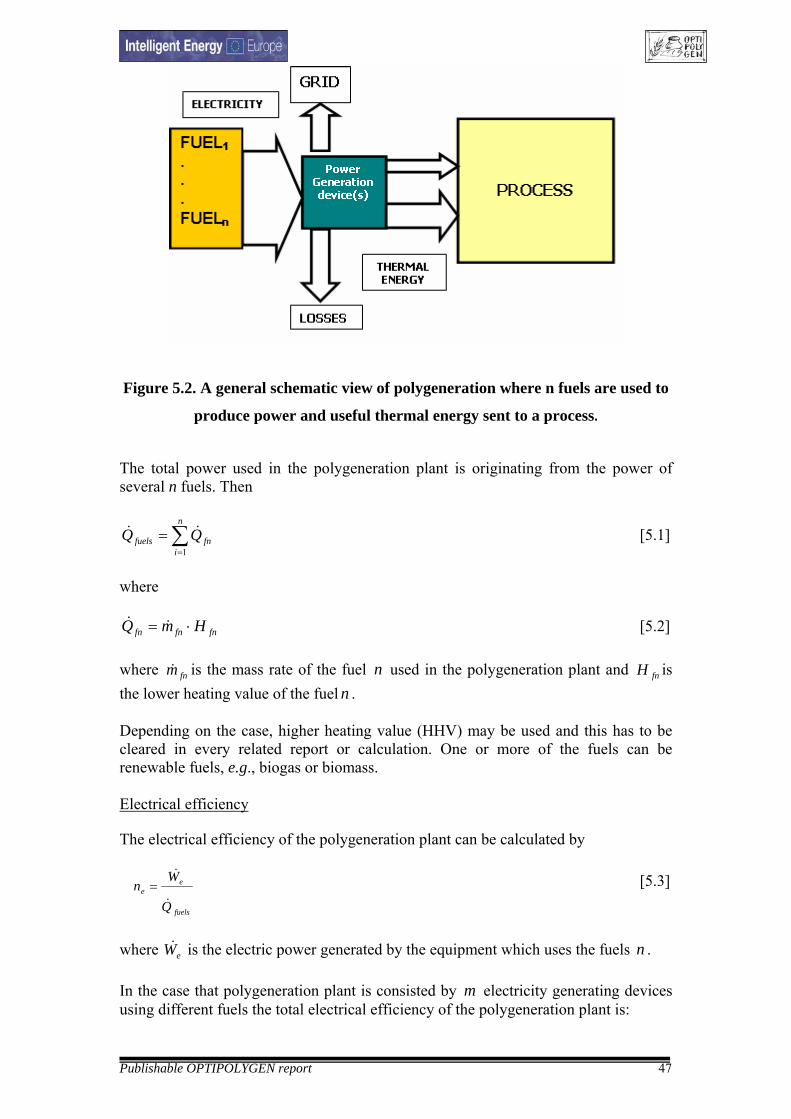
Publishable OPTIPOLYGEN report 47
Figure 5.2. A general schematic view of polygeneration where n fuels are used to
produce power and useful thermal energy sent to a process.
The total power used in the polygeneration plant is originating from the power of several n fuels. Then
∑=
=n
ifnfuels QQ
1
&& [5.1]
where
fnfnfn HmQ ⋅= && [5.2] where is the mass rate of the fuel used in the polygeneration plant and is the lower heating value of the fuel .
fnm& n fnHn
Depending on the case, higher heating value (HHV) may be used and this has to be cleared in every related report or calculation. One or more of the fuels can be renewable fuels, e.g., biogas or biomass. Electrical efficiency The electrical efficiency of the polygeneration plant can be calculated by
fuels
ee
Q
Wn
&
&= [5.3]
where is the electric power generated by the equipment which uses the fuels . eW& n In the case that polygeneration plant is consisted by m electricity generating devices using different fuels the total electrical efficiency of the polygeneration plant is:
Publishable OPTIPOLYGEN report 48
fuels
m
im
e
Q
Wn •
=∑
= 1
&
[5.4]
Thermal efficiency The thermal efficiency of the polygeneration plant can be calculated by
fuels
th
Q
Qn&
&= [5.5]
where is the heat generated by the polygeneration equipment which uses the fuels and is given to the process which demands heat.
Q& n
It is important to note that Q& is the usefull heat given to the process and not the heat as denoted in several texts. The extend at whichQ is usefull depends, also, on the process efficiency, a parameter which only partially depends on the power generating device(s) themselves – polygeneration devices.
&
In the case that usefull thermal energy is generated by µ different devices using the
different fuels of the polygeneration, then the total thermal efficiency of the system is : n
fuels
ith Q
Qn
&
&∑==
µ
µ1 [5.6]
Based on the above thermal and electric efficiencies the total energy efficiency of the polygeneration system can be expressed as:
fuels
m
i im
the Q
QWnnn
&
&&∑ ∑= =
+=+= 1 1
tot
µ
µ
[5.7]
Using this approach the exergetic efficiency of the polygeneration plant is
fuels
m
i imW
JΕ
Ε+=∑ ∑= =
&
&&1 1
µ
µ
[5.8]
where is the exergy of the thermal energy produced by theµE µ different devices and is the total amount of exergy included in the fuels mixture used. fuelsE n The total primary energy savings (PES) of polygeneration application can be calculated using the formula:
Publishable OPTIPOLYGEN report 49
thboiler
i
eGRID
m
im
fuels
n
Q
n
W
EPES
∑∑== +
−= µ
µ11
1&&
&
[5.9]
In this formula is the total electrical efficiency of the grid which supplies electricity to the user where polygeneration is installed and operate. This efficiency is calculated by the ratio of the electricity consumed by the user in kWh by the primary fuel used to generate this electricity on the thermal power plant site, i.e.,
= electricity consumed by the user/primary energy used to generate this electricity.
eGRIDn
eGRIDn
It is obvious that before calculating the above figures we have first to define our reference area, to determine the utility plants which exist there and the electricity mix they produce and send to the users where polygeneration is applied. In the cases where the electricity send to the user is not produced by only fossil fuels but rather using a mixture of power plants and renewable energy power stations then is calculated using formula [5.4] as follows. First the total grid electricity is split into two parts: i) electricity generated by renewables, i.e., wind or PV’s or biomass, and ii) electricity generated by fossil fuels, i.e., natural gas, . Then
eGRIDn
RESW&
FW&
totalFRES WWW &&& =+ [5.10] and
⎟⎟⎠
⎞⎜⎜⎝
⎛+×= RES
fuels
F
totaleGRID W
QW
Wn &
&
&
&
21 [5.11]
Note that in formula [5.9] is the thermal efficiency of the boiler used to generate the heat send to the user. In the case that there is no boiler then this parameter can be the normalized thermal efficiency of the processes used in the plant which is to be served by the polygeneration unit. Again, formula [5.6] can be used to calculate this total plant thermal efficiency when more than one thermal processes with different efficiencies is to be served. It is again evident how important is to define the boundaries of the thermodynamic system under consideration.
thboilern
Heat over power ratio If we consider the power generated by the polygeneration unit and the thermal energy which is produced then the ratio of these two unit outputs gives the heat over power ratio.
Heat over power ratio = unit by the generatedy electricit of rate
unit by the generatedheat of rate [5.12]

Publishable OPTIPOLYGEN report 50
The heat over power ratio can be used for fast first stage calculations mainly for potential orientation of the project when initial sizing of the unit is performed. In no case should this be used for the final sizing or feasibility studies. 5.3 Tri-generation and generation and use of biogas and biomass Trigeneration and Biogas/biomass production and use is of specific importance for polygeneration applications in the food industry. Food industry is perhaps the only industry sector where organic by-products can be used to generate renewable energy via the routes of biogas or biomass use. A detailed view of these methods is presented in the OPTIPOLYGEN deliverables, WP5 educational and training material, which is downloadable free of charge from the project web-site.
Publishable OPTIPOLYGEN report 51
6. OPTIPOLYGEN WEB-SITE 6.1 Introduction Optipolygen web-site is the main contact point of the project partners with the interested users. There all the work done within the project actions is available free of charge for any interested. The main web-site parts are:
- The data-base of existing and operating polygeneration plants in the food industry.
- The full reports of all the project work packages. - A calculation tool for initial feasibility calculations in the various food
industry sectors. - The contact details of the project partners and of several CHP and
polygeneration equipment manufacturers and users. 6.2 Data-base Optipolygen Data base includes data of polygeneration plants operating in the food industry. Data base entries have been presented in chapter 2 of this report. Additionally it should be mentioned that database is equipped with a search engine suitable to give to the interested user specific cases depending on key words to be used. 6.3 Calculation tool Optipolygen web-site includes a tool suitable for initial calculations regarding the feasibility of polygeneration applications in the various food industry sectors. The calculation tools has been programmed based on the information, the data and the parameters used in WP2 sector reports incorporating results of WP4. Calculation tool input requires data from the production of the food plant under consideration and results concern estimations on the potential income generated by the polygeneration plant together with the potential of CO2 savings arising from the polygeneration application. Any experienced energy engineer will definitely accept that the approach followed by the tool is simplistic and sometimes can result in either optimistic or pessimistic results as far as the energy savings and the profits concerns. Results of the tool do however form an initial informative step for the applicability of polygeneration in the process under examination. The tool has been built with the inexperienced food industry user in mind and not for well trained energy engineers. Any proposals for improvement are welcome at [email protected]
Publishable OPTIPOLYGEN report 52
7. Dissemination activities 7.1 Introduction Dissemination activities formed the last part of the project actions. Dissemination has been realised via the following actions:
- Organise informative events in the country of each partner i.e. in Austria, Greece, Denmark, Belgium, UK, Portugal.
- Organise training seminars in Greece and Portugal. - Inform the stakeholders of the Food industry and energy community on the
outcomes of the project. - Operate the project web-site for at least 2 years after the project end date. - Develop, print and send to 1800 stakeholders an informative leaflet and a CD
with all the project findings. 7.2 Dissemination events Dissemination events were hosted in the 5 countries of the project consortium. A total of 196 participants participated the events. More information exist in the WP7 project deliverable. 7.3 Training seminars Seminars were organised by the project academic partners. Especially in Greece instead of performing one training and one dissemination event for better project publicity two mixed events were hosted in the major industry centres of Greece : Athens and Thessaloniki. Both events included an initial session of informative nature focusing on the project findings and polygeneration and cogeneration topics important for the industry i.e. subsidies while the training session and the in depth analysis of OPTIPOLYGEN findings was the second part of the event. Details of the events can be found in WP7 final report. 7.4 Project web-site Information on the project web-site can be found in the web www.otpipolygen.org. The project co-ordinator will operate the site for at least until the end of 2008. 7.5 Informative material Project informative material consists of: -An informative leaflet. -A CD including all the project reports and providing direct link to the project web-site where the user can access the data base and the calculation tool.

Publishable OPTIPOLYGEN report 53
Material was send to about 1800 stakeholders including -All the major food industry companies with more than 250 employees belonging to the interesting in terms of polygeneration application sectors i.e. fish and meat, dairies, cooked food, beverages and bier, oils and fat. -All the public bodies i.e. ministeries of Environment and Energy of the EUR-15 states together with local energy centers and Food industry associations. A CD specimen is included in the WP7 final report.