Embed Size (px)
Citation preview

OPWP SEVEN YEAR STATEMENT2015 - 2021 | ISSUE 9
Member of Nama Group

Oman Power & Water Procurement Co. SAOC
P.O. Box 1388, P.C. 112 Ruwi, Muscat, Sultanate of Oman.
Office Location:
Floor 5, Building 5, Muscat Grand Mall, Tilal Complex, Al Khuwair, Muscat, Sultanate of Oman
Tel: +968 24508400 Fax: +968 24399946
www.omanpwp.com
Member of Nama Group
OPWP’S 7 Year Statement 2015-2021Approved by the Authority for Electricity Regulation Oman
Issue 9 / March 2015

HIS MAJESTY SULTAN QABOOS BIN SAID

OPWP Seven Year Statement 2015 - 2021
4

6 List of tables
6 List of figures
7 Glossary
8 Overview
12 Section 1 Main Interconnected System14 1.1 Demand for Electricity
17 1.2 Power Generation Resources
25 1.3 Additional Power Generation Requirements
29 1.4 Desalinated Water Requirements
38 1.5 Combining Power Generation & Water Desalination
38 1.5 Procurement Activities
40 1.7 Fuel Requirments
44 Section 2 Dhofar Power System46 2.1 Demand for Electricity
48 2.2 Power Generation Resources
50 2.3 Additional Power Generation Requirements
52 2.4 Desalinated Water Requirements
56 2.5 Combining Power Generation & Water Desalination
56 2.5 Procurement Activities
56 2.7 Fuel Requirments
60 Section 3 Ad Duqm and Musandam62 3.1 Demand for Electricity
65 3.2 Power Generation Resources
68 3.3 Desalinated Water Requirements
73 3.4 Procurement Activities
CONTENTS
5

18 Table 1 Details of P(W)PAs – MIS
22 Table 2 Prospective Contract Extensions
39 Table 3 MIS Procurement Activities in 2015
15 Figure 1 Electricity Demand Projections – MIS
20 Figure 2 Contracted Generation Capacity – MIS
24 Figure 3 Total Power Generation Resources – MIS
26 Figure 4 Future Power Generation Capacity Requirements – MIS
30 Figure 5 Water Demand Projections – Interconnected Zone
32 Figure 6 Future Desalinated Water Capacity Requirements – Interconnected Zone
35 Figure 7 Water Demand Projections – Sharqiyah Zone
37 Figure 8 Future Desalinated Water Capacity Requirements – Sharqiyah Zone
40 Figure 9 Projected Fuel Requirements – MIS
42 Figure 10 Improvement in Gas Utilization – MIS
47 Figure 11 Electricity Demand Projections – Dhofar Power System
49 Figure 12 Total Power Generation Resources – Dhofar Power System
50 Figure 13 Future Power Generation Capacity Requirements – Dhofar Power System
53 Figure 14 Water Demand Projections – Dhofar (Salalah/Taqa/Mirbat)
55 Figure 15 Future Desalinated Water Capacity Requirement – Dhofar (Salalah/Taqa/Mirbat)
57 Figure 16 Projected Fuel Requirements – Dhofar Power System
62 Figure 17 Electricity Demand Projections – Ad Duqm
64 Figure 18 Electricity Demand Projections – Musandam
66 Figure 19 Future Power Generation Expansion Plan – Ad Duqm
67 Figure 20 Future Power Generation Expansion Plan – Musandam
69 Figure 21 Water Demand Projections – Ad Duqm
70 Figure 22 Water Supply and Demand Balance – Ad Duqm
71 Figure 23 Water Demand Projections – Musandam
72 Figure 24 Water Supply and Demand Balance – Musandam
LIST OF TABLES
LIST OF FIGURES
6
OPWP Seven Year Statement 2015 - 2021

AER Authority for Electricity Regulation, Oman
BTU/scf British thermal units per standard cubic foot
CCGT Combined-cycle gas turbine
DGC Dhofar Generating Company
DGW Directorate General of Water (in the Office of the Minister
of State and Governor of Dhofar)
DPC Dhofar Power Company (SAOC)
DPS Dhofar Power System
GJ Gigajoule(s)
GPDC Al Ghubrah Power and Desalination Company (SAOC)
GCCIA Gulf Cooperation Council Interconnection Authority
HHV Higher Heating Value
IPP Independent power project
IWP Independent water project
IWPP Independent water and power project
kWh Kilowatt hour(s)
LOLH Loss of load hours
m3 Cubic metre(s)
m3/d Cubic metres per day
MEDC Muscat Electricity Distribution Company (SAOC)
MIGD Million imperial gallons per day
MIS Main Interconnected System
MISC Majis Industrial Services Company (SAOC)
MJEC Majan Electricity Company (SAOC)
MOG Ministry of Oil and Gas
MSF Multi-stage flash (desalination technology)
MW Megawatt(s)
MZEC Mazoon Electricity Company (SAOC)
OCGT Open-cycle gas turbine
OETC Oman Electricity Transmission Company (SAOC)
OPWP Oman Power and Water Procurement Company (SAOC)
PAEW Public Authority for Electricity and Water
PDO Petroleum Development Oman (LLC)
PPA Power purchase agreement
PWPA Power and water purchase agreement
RAEC Rural Areas Electricity Company (SAOC)
RO Reverse osmosis (desalination technology)
Sm3 Standard cubic metre(s)
Sm3/d Standard cubic metres per day
TWh Terrawatt hours
GLOSSARY
7

This Statement provides a 7-year outlook for power and desalinated water
supply in the two main systems of Oman – the Main Interconnected System
(MIS) and the Dhofar Power System. It also addresses OPWP’s anticipated
activities with respect to Ad Duqm and Musandam during this period. OPWP
prepares the 7-Year Statement annually in accordance with Condition 5 of
its license. This is Issue 9, for the period 2015 to 2021; previous issues and
additional information are available on the OPWP website at
www.omanpwp.com
OVERVIEW
OPWP Seven Year Statement 2015 - 2021
8

DEMAND FOR ELECTRICITY
In the MIS, under the Expected Demand forecast, peak
demand is expected to grow at about 9% per year,
from 5122 MW in 2014 to 9530 MW in 2021. Energy
consumption is expected to grow from about 25 TWh in
2014 to 47 TWh in 2021, also an average annual increase
of 9% (corresponding to growth in average demand from
2852 MW to 5373 MW). Increasing personal income,
housing starts, and continuing government investment in
infrastructure projects are major contributors to continued
high growth in electricity demand.
Two additional demand scenarios are considered: the Low
Case projects 7% annual growth and peak demand at 8372
MW in 2021, nearly 1200 MW below Expected Demand. The
High Case projects 11% annual growth and peak d mand at
10329 MW in 2021, exceeding Expected Demand by about
800 MW.
In Dhofar, peak demand is expected to grow at 10% per year,
from 439 MW in 2014 to 839 MW in 2021. The Low Case
considers 8% growth, reaching 729 MW by 2021, about
110 MW below Expected Demand. The High Case considers
higher growth across all economic sectors, with peak
demand increasing at 12% per year to 965 MW in 2021,
exceeding Expected Demand by about 130 MW.
Overview
9

POWER GENERATION REQUIREMENTS
DESALINATED WATER REQUIREMENTS
In the MIS, the major expected developments through
2021 include: (1) addition of two new IPPs at Ibri and
Sohar, with aggregate capacity in the range of 2850 to 3150
MW to be in service in 2018 (Ibri early power) and 2019 (full
power at both sites), (2) expected extension of contracts at
Al Kamil and Barka I to 2020, (3) retirement of the Ghubrah and
Wadi Jizzi plants, and (4) creation of a spot market for
electricity trade in 2018. The 2000 MW Sur IPP was recently
commissioned in 2014 and is fully operational.
In Dhofar, both the sale of the Raysut NPS and award of the
Salalah 2 IPP are expected to be complete by March 2015.
Salalah 2 IPP will provide about 445 MW upon completion
in 2018.
OPWP is also assisting RAECO with the procurement of an IPP
in Musandam with net firm capacity of about 100 MW, for
operation in 2016. The EPC contract has been awarded and
construction will begin shortly.
Water demand in the northern region (the Interconnected
Zone and Sharqiyah Zone) is projected to increase by 6% per
year, from 226 million m3 in 2015 to 328 million m3 in 2021.
In the Interconnected Zone, peak water demand is
projected to increase by as much as 540,000 m3/d (119 MIGD)
by 2021.The principal project developments include: (1)
addition of 57,000 m3/d (12.5 MIGD) at Barka I in Q3 2015; (2)
addition of the Muscat City Desalination Plant, at Ghubrah,
with capacity of 191,000 m3/d (42 MIGD) in Q3 2015; (3)
addition of a new desalination plant at Qurayyat at 200,000
m3/d (44 MIGD) in 2017; (4) addition of new desalination
plants in 2018 at Barka with capacity 281,000 m3/d (62
MIGD) and at Sohar with capacity 250,000 m3/d (55 MIGD);
and (5) expiration of PWPAs at Barka I and remaining units
at the Ghubrah desalination plant in 2018. OPWP is
considering the potential for contract extension of the Barka
I desalination plant, and the need for a further new IWP in
2021 with capacity up to 300,000 m3/d (66 MIGD). In 2015,
two projects are expected to begin commercial operation -
the second phase capacity addition at Barka I (12.5 MIGD)
and the Muscat City Desalination plant (42 MIGD) at Ghubrah
- and the Qurayyat IWP (44 MIGD) was recently awarded.
In the Sharqiyah Zone, the principal developments include:
(1) addition of 48,000 m3/d (10.6 MIGD) at the Sur IWP,
which is under construction for COD in Q3 2016, and (2)
procurement of a new Sharqiyah IWP with capacity of about
55,000 m3/d (12.1 MIGD) for service in 2019.
In Dhofar, DGW projects water demand to grow at 8%, and
peak water demand to increase from 88,000 m3/d in 2015 to
143,000 m3/d in 2021. OPWP plans to begin procurement of
a new IWP with capacity in the range of 80,000 to 100,000
m3/d (18-22 MIGD) to be in service in 2019.
OPWP is also in consultation with PAEW to finalize plans for
procurement of desalination capacity to serve Ad Duqm and
Musandam. The Duqm IWP is being considered for 2019
with capacity of up to 60,000 m3/d (13 MIGD), depending on
the extent to which industrial demands must be served. The
Musandam IWP is being considered at Khasab with capacity
of about 13,000 m3/d (3 MIGD).
OPWP Seven Year Statement 2015 - 2021
10

PROCUREMENT ACTIVITIES
FUEL REQUIREMENTS
In 2015, OPWP expects the following procurement activities
for the MIS: (1) to complete contract extension negotiations
with the owners of the Al Kamil, Barka I, Wadi Jizzi, and
Ghubrah power plants for all or a portion of capacity
associated with expiring contracts; (2) to issue tenders
and award of the two new IPPs at Ibri and Sohar; (3) to
issue tenders and award of the two new IWPs at Barka and
Sohar; (4) to issue tender documents for the new Sharqiyah
IWP. Procurement of a solar plant may commence in 2015
pending government approval.
In Dhofar, OPWP expects to begin procurement of a new IWP
in 2015 with capacity in the range of 18-22 MIGD to be in
service by 2019. OPWP also expects to execute a PPA with
RAECO for a 50 MW wind farm being developed in Harweel
in association with MASDAR of Abu Dhabi.
OPWP also expects to procure new IWPs at Khasab in
Musandam (13,000 m3/d, or 3 MIGD) and Ad Duqm
(potentially up to 60,000 m3/d (13 MIGD), although the
respective capacity levels and timing have yet to be confirmed
with PAEW.
In the MIS, efficiency improvements in the generation fleet
are expected to limit growth in fuel requirements to 4%
per year through 2021, despite 9% growth in electricity
production. Average gas utilization by the generation fleet
(Sm3 consumed per MWh produced) is projected to improve
by 27% from 2014 to 2021.
In Dhofar, gas requirements are projected to increase at 6%
per year, as power requirements grow rapidly at about 10%
per year. Average gas utilization in the Dhofar power system
is projected to improve by about 28% during this period.
— Qurayyat IWP
Overview
11

MAININTERCONNECTEDSYSTEM
01
OPWP Seven Year Statement 2014 - 2021
12

The Main Interconnected System (MIS) extends throughout
the Governorates of Muscat and Buraymi, and most of the
Governorates of Al Batinah North, Al Batinah South, Ad
Dakhiliyah, Ash Sharqiyah North, Ash Sharqiyah South and
Ad Dhahirah, serving around 754,000 electricity customers.
The MIS comprises a number of power generation
facilities, owned and operated by various companies; a
single 220/132 kV transmission grid, owned and operated by
Oman Electricity Transmission Co. (OETC); and three
distribution networks, owned and operated by Muscat
Electricity Distribution Co. (MEDC), Mazoon Electricity Co.
(MZEC) and Majan Electricity Co. (MJEC). The three
distribution network operators also act as “licensed
electricity suppliers”, supplying existing and new electricity
customers in their respective service areas. The MIS is presently
interconnected with the power systems of Petroleum
Development Oman (PDO), the Emirate of Abu Dhabi and
other Member States of the GCC Interconnection Authority.
Several of the power generation facilities connected to the
MIS produce desalinated water in conjunction with electricity,
to meet the regional requirements of “water departments”
responsible for supplying water to customers (including
the Public Authority for Electricity and Water (PAEW) and
Majis Industrial Services Co. (MISC)). Several water-only
desalination plants also supply these water departments.
OPWP’s role is to aggregate the power and desalinated
water requirements of licensed electricity suppliers and water
departments, and to economically procure the required
power and desalinated water in bulk from generation/
production facilities connected to the MIS and water
transmission systems. OPWP is required to ensure that
sufficient power generation resources are available to meet
licensed electricity suppliers’ demands. Wherever beneficial,
OPWP co-procures desalinated water to meet the needs
of water departments in joint power-water facilities, and
procures stand-alone desalinated water facilities upon the
direction of PAEW in accordance with Article 78 of the
Sector Law.
Section 01- Main Interconnected System
13

1.1 DEMAND FOR ELECTRICITY
OPWP evaluates electricity demand at the system level,
including transmission and distribution system losses with
consumer-level loads. This equates with the output of
power generation plants at the delivery point(s) to the power
system, excluding the internal power consumption of
auxiliary systems.1 OPWP follows a similar approach with
respect to estimating water demand, the output of
desalinated water plants, and the consumption of auxiliary
systems of combined power and water plants.
Historical DemandThe power demand in MIS increased significantly in 2014.
Peak demand increased by about 15% to 5122 MW,
while average demand increased by 10% to 2852 MW
(corresponding to 25 TWh of energy).
Looking back over the last 8 years, peak electricity demand
in the MIS grew at an average annual rate of about 9%,
from 2544 MW in 2006 to 5122 MW in 2014. Energy
consumption (and average demand) has grown by about
10% annually during the same period. Single year growth
rates show wide fluctuations during this period, influenced
strongly by weather and economic growth: peak demand
growth has ranged from a low of 2% to a high of 15%
during this period.
Demand ProjectionsOPWP’s 7-year electricity demand projections for the MIS
have been developed on the basis of: (1) consultations with
the electricity distribution companies and other relevant
entities such as large industries; (2) historical growth trends
in aggregate and in distribution areas; (3) assessment of past
forecasts against out-turns; and (4) econometric analysis
of weather and macroeconomic effects. The projections
cover both energy (also shown as average demand) and peak
demand. The latter is most relevant for purposes of
assessing capacity requirements. This accords with the basis
on which OPWP transacts with power and desalination plants.
Energy projections are necessary towards securing the fuel
requirement for power generation.
The projections are built up from separate analyses of
distribution system demands, which are assessed on a
“macro” basis by distribution company zones, and certain
bulk loads that are connected directly to the transmission
system and which are assessed on a specific customer
basis. Distribution system demand is comprised mainly
of residential, service sector (including government and
commercial buildings, tourism facilities), and small-to
medium-scale industrial demands in all MIS regions. The
principal growth drivers include population growth,
household formation, general economic development and
infrastructure expansion.
The growth in demand from grid-connected loads
(generally large industries and infrastructure projects)
comprises both new projects and expansion of existing
industrial plants. Industrial projects are located mainly in the
Sohar Industrial Port and Sohar Free Zone, and to a lesser
extent at Sur. Infrastructure projects include, for example, the
stand-alone desalination plants and international airports.
The projections are presented as a range bounded by Low
Case and High Case scenarios, and a central, Expected
Demand forecast. They are summarized in Figure 1 on the
next page.
1 This approach assures equivalence toward planning the generation supply required to meet consumer demand. However, from the perspective of power system operations, electricity demand and output are monitored at available metering points located at substations and power plants. The system “gross demand” at any point in time is the sum of the metered output at all power generators, although a portion of that generator output must be consumed by plant auxiliary systems. System peak demand is considered as net of plant auxiliaries and any exports to other power systems. The hourly consumption of plant auxiliary systems is not measured directly at some plants and in these cases must be estimated. Consequently, there may be differences in peak demand reports, depending on how auxiliary consumption at each plant is estimated.
OPWP Seven Year Statement 2015 - 2021
14

“Low case” average demand Expected average demand “High case” average demand
“Low case” peak demand Expected peak demand “High case” peak demand
0
2,000
2014 2015 2016 2017 2018 2019 2020 2021
4,000
6,000 5,122
10,3299,530
8,3728,000
10,000
12,000
MW
Year
Figure 1 Electricity Demand Projections – MIS
Actual2014
2015 2016 2017 2018 2019 2020 2021Ave.% Growth
Expected Demand
Average Demand (MW) 2,852 3,176 3,483 3,808 4,213 4,577 4,948 5,373 9%
- Distribution Loads 2,574 2,838 3,069 3,339 3,625 3,939 4,271 4,659 9%
- Directly-Connected Loads 277 338 414 469 587 638 678 714 14%
Annual Energy (TWh) 25.0 27.8 30.6 33.4 36.9 40.1 43.5 47.1 9%
Peak Demand (MW) 5,122 5,653 6,225 6,797 7,464 8,076 8,775 9,530 9%
Change from 2014-2020 Statement (MW)
-195 -233 -296 -360 -310 -357 -358 - -
Low Case Demand
Average Demand (MW) 2,852 3,012 3,224 3,470 3,775 4,066 4,363 4,717 7%
- Distribution Loads 2,574 2,697 2,858 3,091 3,344 3,620 3,903 4,254 7%
- Directly-Connected Loads 277 315 366 380 431 446 460 463 8%
Annual Energy (TWh) 25.0 26.4 28.3 30.4 33.1 35.6 38.3 41.3 7%
Peak Demand (MW) 5,122 5,340 5,714 6,166 6,675 7,183 7,726 8,372 7%
Change from 2014-2020 Statement (MW)
-529 18 -16 -52 -9 37 12 - -
High Case Demand
Average Demand (MW) 2,852 3,392 3,797 4,152 4,607 5,019 5,472 5,911 11%
- Distribution Loads 2,574 2,971 3,281 3,563 3,872 4,211 4,603 4,993 10%
- Directly-Connected Loads 277 421 516 588 734 808 869 918 19%
Annual Energy (TWh) 25.0 29.7 33.4 36.4 40.4 44.0 48.1 51.8 11%
Peak Demand (MW) 5,122 5,952 6,679 7,308 8,041 8,724 9,537 10,329 11%
Change from 2014-2020 Statement (MW)
-529 -534 -752 -1,025 -1,446 -1,613 -1,747 - -
Section 01- Main Interconnected System
15

Under the Expected Demand scenario, peak demand is
expected to grow at about 9% per year, from 5122 MW in
2014 to 9530 MW in 2021. Energy consumption is expected
to grow at about the same rate, from 25 TWh in 2014 to
47 TWh in 2021 (in average demand terms, from 2852 MW
to 5373 MW). This growth projection is broad-based, as
distribution companies report robust development of
housing, commercial projects, government facilities, and
small to large industry.
This forecast shows significant reductions relative to the
last 7-Year Statement, particularly with respect to peak
demand in the Expected Demand and High Case scenarios.
This follows from analysis of recent growth trends,
weather impacts, and load profiles of large industries. The
Sultanate now has greater diversity and numbers among
its grid-connected customers. Our analysis of their
historical hourly load data concluded that they contribute
less to peak demand than previously thought: their individual
peak demands occur at a different time than the system peak.
Furthermore, we have moderated the continuing high
growth forecasts provided by large customers in all
sectors, using weather-normalized historical growth trends.
They demonstrate the dampening effect of mobilization
constraints and infrastructure capabilities relative to
customer growth plans.
National economic forecasts suggest that over the next two
years GDP growth may be similar to recent years, whereas
the view is more uncertain beyond that, considering oil
price uncertainty and the impact of the oil price level on the
national economy. The Expected Demand scenario does
not reflect sustained low oil prices or their potential effect
on the national economy. Recent public announcements
suggest that the pace of infrastructure projects will not
slow in the near term, and industries have not downgraded
their demand growth projections. In coming years we will
monitor macro-economic forecasts and consider them
toward developing our Expected Demand projections in
future 7-Year Statements. At present, the Low Case forecast
scenario is suggestive of a slower demand trend.
The High Case scenario reflects the possibility of
stronger than-expected economic growth, and represents a
contingency case for OPWP’s provision of adequate
generation capacity. This scenario considers peak demand
and energy growth over the 7-year horizon at the high
end of recent sustained growth trends. It also considers the
possible impact of hot weather in consecutive seasons: there
is a “bulge” of high demand growth in 2015 and 2016
for underlying load (not grid-connected loads), dropping
afterwards to recognize that weather impacts are not
sustained but tend to be cyclical. The High Case has average
annual growth of 11%, but somewhat higher growth in the
initial years and lesser growth in the latter years. The high
growth period is consistent with short periods of very high
growth in past years.
The High Case scenario is considered unlikely but represents
a plausible planning scenario toward managing the risk of
insufficient generation capacity.
The Low Case scenario is constructed as a mirror image
of the High Case, with respect to underlying load, around
Expected Demand over the forecast period. It also depicts
an inverse “bulge” of low demand in the initial years,
representing below-normal weather. Bulk loads also reflect
a slower development pace for projects that are not yet
committed. This scenario generally reflects the possibility
of weaker than expected economic growth. Peak demand
and energy growth under this scenario are at 7% per year.
Whilst considered much less likely than the Expected Demand
scenario, the Low Case and High Case scenarios are
intended to represent the range of potential future
demand paths around the Expected Demand projection.
The requirements for generation resources need to be
assessed against all three scenarios to develop an appropriate
generation procurement strategy. In particular, OPWP has to
balance the need to have a feasible plan to meet High Case
demands at reasonable cost should these arise (taking into
account the lead times associated with procuring capacity),
whilst at the same time minimizing the risks of finding itself
over-committed to costly generation capacity in the event of
demand following the Low Case path.
Trade and Reserves Sharing with Interconnected SystemsThe MIS is interconnected with the PDO power system
at Nizwa through a 132 kV link, and with the power system
of the Emirate of Abu Dhabi through a 220 kV link at
Mahadha. These interconnections provide reliability benefits
through the sharing of generation reserves. Oman also joined
the GCC Interconnection Authority (GCCIA in December
2014, enabling access to the power systems of other Mem-
ber States via the UAE interconnect. GCCIA membership
provides access to generation and operating reserves, with
tangible benefits to Oman both for planning and operations.
The GCCIA is also developing mechanisms for commercial
power trading among Member States. OPWP intends to
participate in pilot trades in 2015 toward developing
capabilities and assessing the benefits of this prospective
resource. The current MIS demand projections do not
include power exports or imports, comprising only the native
demands of the MIS.
OPWP Seven Year Statement 2015 - 2021
16

1.2 POWER GENERATION RESOURCES
Sources of PowerIn order to meet demand for electricity in the MIS, OPWP
purchases power from a number of sources via power
purchase agreements (PPAs), power and water purchase
agreements (PWPAs) and other similar agreements. The
contractual arrangements for power delivery under
these agreements may be differentiated as firm capacity,
reserve-sharing, non-firm capacity, and energy-only. These
terms are relevant for generation planning purposes.
All of the main power (and desalination) plants in the MIS
are contractually committed to provide a specific generation
capacity (in MW) upon demand, to be dispatched by the
OETC, and to maintain specific availability levels. These are
firm capacity contracts, also termed “contracted capacity” Temporary generation also belongs with this group.
OPWP also purchases power from a number of sources
where the contractual arrangements do not provide sufficient
reliability for resource adequacy plans. These may be termed
collectively as “non-firm resources”. They currently include
reserve-sharing arrangements with other power systems
via interconnection agreements, and capacity exchanges or
energy purchases from industries with captive power
generation facilities used mainly for self-supply. In these
cases no specific capacity is committed to OPWP, and the
availability of capacity for use by OPWP at any particular
time will generally be subject to the other party’s first use.
These resources provide reliability benefits to the MIS,
in that capacity is generally available according to
pre-arranged schedules (though not committed as dispatch-able
capacity). Importantly, some of these resources may represent
prospective contractual opportunities for firm, dispatch-able
capacity (such as the interconnects) in the future.
In addition to the resources currently under contract, there
are “prospective resources” that are under consideration
by OPWP. For example, certain power generation units
among the currently contracted plants will fall out of contract
during this seven-year period, and OPWP must consider
whether to allow these units to retire, to extend the term of
the contract, or to contract for refurbishment or performance
related modifications of the units. This category also includes
resources that are under evaluation or for which the
tendering process has begun but is not complete.
— Barka I and Barka II Power and Water Desalination Plants
Section 01- Main Interconnected System
17

Contracted CapacityOPWP’s present portfolio of contracted capacity in the MIS comprises eleven P(W)PAs.
Summary details are shown in Table 1 below.
Table 1 Details of P(W)PAs – MIS
PlantContracted Capacity a Contract Plant Owner Plant Status Plant Type
Contract Expiry b
Ghubrah430MW c
167,000 m3/dPWPA
Al Ghubrah Power and
Desalination Co. (SAOC)
OperationalOCGT/Steam MSF
Desalination Natural gas fired (Fuel oil as back-up)
2018
Rusail 665 MW PPARusail Power Co. (SAOC)
OperationalNatural gas fired
(Fuel oil as back-up)2022
Wadi Jizzi 325 MW PPAWadi Al-Jizzi Power Co.
(SAOC)Operational
OCGT Natural gas fired(Fuel oil as back-up)
2020
Manah 254 MW PPAUnited Power Co.
(SAOG)Operational
OCGT Natural gas fired(Fuel oil as back-up)
2020
Al Kamil 271 MW PPAAl Kamil Power Co.
(SAOG)Operational
OCGT Natural gas fired(Fuel oil as back-up)
2017
Barka I
427 MW91,000 m3/d
PWPAACWA Power Barka (SAOG)
OperationalCCGT MSF Desalination
Natural gas fired(Fuel oil as back-up)
2018
45,000 m3/d WPAACWA Power Barka (SAOG)
Operational RO 2018
57,000 m3/d WPAACWA Power Barka (SAOG)
Under construction
RO 2018
Sohar I585 MW
150,000 m3/dPWPA
Sohar Power Co. (SAOG)
Operational
CCGTMSF DesalinationNatural gas fired
(Fuel oil as back-up)
2022
Barka II677 MW
120,000 m3/dPWPA
SMN Barka Power Co. (SAOC)
OperationalCCGT RO Desalination
Natural gas fired(Fuel oil as back-up)
2024
Sohar II 741 MW PPAAl Batinah
Power Co. (SAOC)Operational
CCGT Natural gas fired(Fuel oil as secondary fuel and
back-up)2028
Barka III 741 MW PPAAl Suwadi
Power Co. (SAOC)Operational
CCGT Natural gas fired(Fuel oil as secondary fuel and
back-up)2028
Sur 2000 MW PPAPhoenix Power Co.
(SAOC)Operational
CCGT Natural gas fired(Fuel oil as back-up)
2029
a Contracted capacities are shown as of summer 2014, at reference condition 50°C.The contracted capacities are reported as net of plant auxiliaries except for Ghubrah, Rusail, and Wadi Jizzi which are contracted at gross capacity. Plant capacities are shown elsewhere in this report as evaluated at 45°C, which is more in line with peak demand conditions, and as net output rather than gross output.b In all cases the contracts expire prior to the summer period of the year indicated.c GT1-11 & ST4 at Ghubrah were retired prior to summer 2014.
OPWP Seven Year Statement 2015 - 2021
18

A summary of the generation capacity that is expected to be
provided under these P(W)PAs over the 2015-2021 period is
set out in Figure 2. This shows total contracted capacity of
6876 MW in 2015 before falling back to 5728 MW by 2021
due to contract expirations. The main developments over the
7-year period are:
• Ghubrah: The PPA contract of a number of the older
generation units expired in September 2014, resulting
in a reduction of 213 MW. The remaining units at Ghubrah
will fall out of contract in March 2018, resulting in a
further reduction of 256 MW if the contract is not
renewed.
• Wadi Jizzi: Contracts for GTs 3 to 8 at Wadi Jizzi
also expired in September 2014, comprising about 160
MW. Subsequent contract expirations include GT 9 (33
MW) in September 2017, GT 10 (33 MW) in September
2018, and the remaining GTs (101 MW) in March 2020.
OPWP is currently negotiating with the owner toward
potential extensions for some of these units.
• Al Kamil: The PPA is due to expire in April 2017, though
the contract may be extended. If not renewed, this will
result in a reduction of 280 MW of capacity in 2017.
• Barka I: The PWPA is due to expire in April 2018, though
the contract may be extended. If not renewed, this will
result in a reduction of 435 MW of capacity in 2018.
As indicated above, a number of generating units will reach
the end of their current contract terms by 2018. OPWP
has initiated a process with the plant owners to extend
contract periods through 2020, provided that the plants are
technically sound and able to provide guaranteed firm
capacity throughout the extension period at economic prices.
— Barka II Power and Water Desalination Plant
Section 01- Main Interconnected System
19

2015 2016 2017 2018 2019 2020 2021
Capacity as Currently Contracted Net MW a
Ghubrah 256 256 256 - - - -
Rusail 689 689 689 689 689 689 689
Wadi Al Jizzi 167 167 167 134 101 - -
Manah 264 264 264 264 264 264 264 b
Al Kamil 280 280 - - - - -
Barka I 435 435 435 - - - -
Sohar I 597 597 597 597 597 597 597
Barka II 688 688 688 688 688 688 688
Sohar II 754 754 754 754 754 754 754
Barka III 754 754 754 754 754 754 754
Sur 1,992 1,988 1,985 1,983 1,982 1,982 1,982
TOTAL 6,876 6,872 6,589 5,863 5,829 5,728 5,728
a Net MW. All capacities are rated on a net basis (i.e. after allowing for auxiliary consumption inside the plants) at 45°C ambient temperature.b The contract with the current owner will expire at the end of 2020, when ownership of the plant transfers to the Government.
0
3,000
2015 2016 2017 2018 2019 2020 2021
6,000
7,000
5,000
4,000
2,000
1,000
8,000
MW
Year
Figure 2 Contracted Generation Capacity – MIS
OPWP Seven Year Statement 2015 - 2021
20

Non-Firm Resources under ContractIn addition to the contracted capacity described above,
OPWP has contracts with a number of other generation
sources, although these contracts are not for firm capacity
commitments. They include:
• the 220 kV interconnect with the Abu Dhabi power
system at Mahadha;
• the 132 kV interconnect with the PDO power system at
Nizwa; and
• the surplus generation of industries (and other parties)
with captive power generation facilities used mainly for
self-supply.
A 220 kV interconnection between the Oman (MIS) and
UAE (Abu Dhabi) power systems was commissioned in 2011
and has been commercially operational since May 2012.
In December 2014 Oman officially joined the GCCIA,
accessed via this link. Several benefits can be realized from
the interconnector and GCCIA membership:
1. Reduced Planning Reserve Requirements, potentially
allowing the MIS to maintain a lower demand to meet its
statutory reliability standard;
2. Reduced Operating Reserve Requirements, allowing fewer
units to be in standby operation or maintaining spinning
reserves and thus allowing the power system to operate
more efficiently in dispatch;
3. Firm support during emergencies up to 6 hours for each
incident and up to 18 hours in a year.
4. Opportunities for trading power with other member states,
including firm capacity contracts which may be considered
for example as an alternative to temporary diesel
generation. There may also be opportunities for firm
capacity exchanges, exploiting differences in seasonal peak
periods between Oman and the other member states.
The existing double circuit link currently supports reliable
transfers of up to 400 MW. It is technically capable to carry
up to 800 MW in emergencies, and has proven this latter
capacity during performance tests. The link is being utilized
actively to provide emergency reserves support to the benefit
of Oman, the UAE, and other GCCIA member countries.
The MIS is connected with the power system of PDO at Nizwa
via a single 132 kV link with a nominal transfer capacity of
around 60 MW. The main purpose of this interconnect is
to support reserve sharing between the MIS and the PDO
system, providing improved reliability in both systems by
allowing each system access to unused reserve in the
other system in contingency scenarios. Thus, subject to the
availability of surplus generation in the PDO system at the
time required, up to around 60 MW of support can be
provided to the MIS to help manage contingencies.
Several industries with captive power plants are connected
with the MIS and have surplus power that is purchased by
OPWP. Chief among these is OPWP’s agreement with Sohar
Aluminium Co. (LLC), whereby Sohar Aluminium exports up
to 300 MW to the MIS during the summer, and imports a
like amount of energy from OPWP during the winter on an
annually determined schedule. The schedule and operations
are managed to assure that energy exports balance with
energy imports. This arrangement benefits both parties:
Sohar Aluminium is better able to schedule the maintenance
of its generating units and gains reliability of supply, while
OPWP gains an efficient generating resource during the
summer and improves the system Load Factor. The
agreement with Sohar Aluminium (300 MW) was renewed
in 2013 for three years and is expected to be renewed again
subject to mutual agreement.
Access to captive power generation resources is useful in
two respects. Firstly, these contracts provide a source of
contingency reserve for the MIS, over and above the reserve
margin provided by OPWP’s portfolio of contracted capacity.
And secondly, they provide an economical source of energy
– by providing low cost energy to the MIS in place of higher
cost energy from contracted generation capacity, the overall
cost of energy for the MIS can be reduced. The agreements
in place with the respective parties are specifically designed
to allow both of these benefits to be obtained.
Section 01- Main Interconnected System
21

Prospective ResourcesToward considering how to meet generation capacity
requirements as projected power demand overtakes
contracted capacity, OPWP assesses various prospective
resources. These resources include the following:
• Contract extensions, such as for generation units that are
scheduled to fall out of contract
• Planned capacity additions, not yet contracted
• Temporary generation from rented, mobile generators
• Capacity purchases from interconnected power systems or
industrial self-generation
Prospective contract extensions correspond to capacity that is
scheduled to fall out of contract, but that may be offered to
OPWP by the plant owner for extension of the contract term
(subject to satisfaction of relevant regulatory requirements
and commercial terms being agreed). OPWP considers such
extensions alongside options to contract for new capacity.
In 2014, OPWP initiated discussions with the owners of
the plants at Ghubrah, Wadi Jizzi, Al Kamil and Barka I, to
extend contracts to 2020. Extensions are being negotiated only
on a guaranteed capacity basis at economic commercial
terms, and all plants have completed independent technical
evaluations to confirm the capacity on offer.
As of February 2015, none of the contract extensions have
been finalized, but all are expected to be resolved within
a short time. For planning purposes, OPWP has estimated
the amount of capacity that is likely to be extended in Table
2 below. Currently, it is expected that the majority of the
Ghubrah units, for which contracts expired in 2014, may
be extended from 2016 to 2018, and that two further units
expiring in early 2018 may be extended through the
summer of that year. It appears unlikely that the
contracts for Wadi Jizzi units 3-8 would be extended beyond
2018. The contract extensions for Al Kamil and Barka I are
expected although commercial negotiations are still in progress.
None of the prospective extensions shown in Table 2 may be
considered as secure until negotiations are concluded and
the agreements are executed.
2015 2016 2017 2018 2019 2020
Net MW a
Ghubrah b - 149 149 341 - -
Wadi Al Jizzi c 57 160 160 160 - -
Al Kamil - - 280 280 280 280
Barka I - - - 435 435 435
TOTAL 57 309 589 1,216 715 715
a All capacities are rated on a net basis (i.e. after allowing for auxiliary consumption inside the plants) at 45°C ambient temperature. b GTs 1, 2, 3, 4, 6, 7, 9 and 10 at Ghubrah are potentially available from 2016 to 2018, and GTs 12 and 13 in 2018c GTs 4 & 5 may be extended in 2015 to meet OETC request for local voltage support. All of GTs 3 to 8 may be extended through 2018.
Table 2 Prospective Contract Extensions
OPWP Seven Year Statement 2015 - 2021
22

OPWP has recently issued tender documents to procure
two new IPPs for the MIS at Ibri and Sohar, with aggregate
capacity in the range of 2907 MW to 3213 MW. The Ibri IPP
will include an early power phase of about 1000 MW from
April to October 2018, and full power COD in April 2019
with capacity up to 1530 MW.2 The Sohar IPP will provide full
power COD in January 2019 with capacity up to 1683 MW.
Both contracts are planned for award by the end of 2015.
The Sultanate has significant opportunity to develop
renewable energy resources, particularly solar and wind
energy. Several small-scale projects are already
operational or under development in rural areas, displacing
diesel generation. OPWP expects the Government to
define its renewable energy policy in the near future to
include large-scale, grid connected projects. Subject to the
Government providing a final go-ahead, OPWP expects
to procure around 200 MW of solar generation capacity
for the MIS, potentially to be in service by 2019. OPWP is
currently collecting data from two instrumentation stations to
support this endeavor. Whilst this capacity is expected to be
committed to OPWP via a PPA, the inherent intermittency risk
associated with solar generation may lead to the effective
capacity of the plants – for resource adequacy purposes –
being considered as somewhat less than the nominal
capacity. Until proven as peak capacity, we show this
resource in the category of contingency reserves, although
we expect such resources to contribute to peak capacity to
some degree.
Electricity Spot Market OPWP has obtained approval from the AER to develop a spot
market for electricity, to be introduced around 2018. The
spot market for electricity would operate alongside and in
conjunction with the existing system of long-term PPAs and
PWPAs. It would provide an alternative way for producers
to sell power to OPWP. The objective is that in cases where
generators have capacity that is not obligated as guaranteed
capacity under a PPA or PWPA, they may be able to offer that
capacity on the spot market and receive prices determined
on a day-to-day basis in accordance with specified market
rules. The market rules will be generally modelled on those
that have been developed in other countries with certain
modifications relevant to Oman.
The spot market is expected to increase the potential for
competition in Oman’s power generation market, and
to provide a mechanism to make available additional
capacity that might otherwise not be readily accessible. This
may include capacity associated with generators whose
long-term supply contracts have expired, or capacity in excess
of contractually guaranteed capacity that plant owners have
built into their facilities or that may be available under certain
operating conditions. At present OPWP has not assessed any
value to potential additional peak capacity that may be made
available via the spot market.
Summary Figure 3 provides a summary of OPWP’s current plans
for generation resources in the MIS for the period 2015
to 2021, including contracted capacity, prospective
contracts, and contingency reserves. As described above,
contracted capacity in each year considers only current
resources up to the end of their current contracts, while
prospective resources include both planned new capacity
and expiring contracts that are expected to be extended.
Contingency reserves comprise the non-firm resources,
including the interconnects, industrial surplus generation,
and the prospective solar project. The capacity indicated for
each year corresponds to the quantity available as of the
onset of the summer peak season in May.
This chart suggests a reduction in available generation
resources in 2021, due to contract expirations, because the
current negotiation process seeks contract extensions only
to the end of 2020. In 2021, OPWP plans to adopt a new
capacity procurement process that will allow existing
generators with expiring contracts to compete directly with
new project bidders for long-term contracts. In parallel,
OPWP is also developing an electricity spot market to
allow generators with surplus capacity (i.e., capacity in
excess of contractual guarantees), or generators without
long-term contracts, to sell power into the power system on
an hourly basis at a market clearing price. In 2021, the plants
with contracts expiring in 2020 will have the opportunity to
compete for new long-term contracts or to participate in the
spot market.
2 The capacity ranges included in tender documents are somewhat lower, in the range of 2850 MW to 3150 MW in aggregate, because they are cited at reference conditions. In this Statement, the values are adjusted to capacity available at 45°C, which is comparable to peak demand conditions.
Section 01- Main Interconnected System
23

2015 2016 2017 2018 2019 2020 2021
Contracted Capacityity Net MW a
Currently Contracted Capacity
6,876 6,872 6,589 5,863 5,829 5,728 5,728
Prospective Capacity Contracts
Contract Extensions 57 309 589 1,216 715 715 -
New Ibri/Sohar IPPs b - - - 1,000 3,213 3,213 3,213
Total – Contracted + Prospective
6,933 7,181 7,178 8,079 9,757 9,656 8,941
Contingency Reserves (non-firm)
Solar Project(s) - - - - 200 200 200
Reserve-Sharing Agreements
- PDO Interconnection 60 60 60 60 60 60 60
- GCC Interconnection 400 400 400 400 400 400 400
Reserve-Sharing Agreements
- Sohar Aluminum Co. 300 300 300 300 300 300 300
- Oman Mining Co. 20 20 20 20 20 20 20
Total Contingency Reserves 780 780 780 780 980 980 980
All Resources 7,713 7,961 7,958 8,859 10,737 10,636 9,921
a all the figures are in Net MW at 45°Cb shown at the maximum of the prospective range from 2,907 MW to 3,213 MW, distributed as 1,530 MW at Ibri and 1,683 MW at Sohar3
Contingency reservesProspective contractsContracted capacity
02015 2016 2017 2018 2019 2020 2021
10,000
8,000
6,000
4,000
2,000
12,000
Year
MW
Figure 3 Total Power Generation Resources – MIS
OPWP Seven Year Statement 2015 - 2021
24

1.3 ADDITIONAL POWER GENERATION REQUIREMENTS
Statutory and Regulatory Requirements OPWP is required by the Sector Law and its license to
ensure the adequacy of generation resources to meet future
power demands. The Sector Law establishes OPWP’s general
responsibility to secure sufficient generation resources
to meet the aggregated demands of licensed electricity
suppliers. Further to this, the license issued to OPWP by the
Authority for Electricity Regulation, Oman (AER) stipulates a
specific generation security standard for the MIS that OPWP
must comply with.
The generation security standard stipulated by the AER
sets a maximum duration of power outage for the system,
termed Loss-of-Load Hours (“LOLH”). OPWP must enter into
agreements for enough contracted capacity to ensure that
expected demand does not exceed available contracted
capacity for more than 24 hours in any year. This LOLH
measure considers relevant uncertainties such as the
reliability of generation units. On a short-term basis, OPWP
must demonstrate to the AER that such agreements are in
place. On a long-term basis, OPWP must demonstrate that
it has credible plans to put such agreements in place (via the
procurement of new capacity or otherwise).
It is important to note that for purposes of the 24-hour
LOLH standard, only contracted capacity is considered. Other
resources, such as the surplus generation of industries
and reserve sharing arrangements with interconnected
systems, provide a degree of reserve margin and will generally
contribute to reliability of supply. However, they are not
considered for purposes of meeting the 24-hour LOLH
standard and are viewed instead as providing security
against contingencies.
Capacity RequirementsDuring the 7-year planning horizon, the 24-hour LOLH
standard corresponds to a reserve margin requirement of
about 4.5% in the MIS. That is, in each year OPWP should
have sufficient contracted capacity to exceed peak demand
by at least 4.5%. Figure 4 compares generation resources to
capacity targets (peak demand plus 4.5%) associated with
each of the three demand scenarios. The table associated
with Figure 4 indicates whether additional capacity is needed
to meet the target, in the rows marked “Deficit (Additional
Capacity Required)”.
Under the Expected Demand scenario, contracted
capacity should exceed the sum of peak demand and the
margin required to meet the 24 LOLH standard (i.e., the
capacity requirement). A deficit implies a need to acquire
additional resources. Non-firm contracted resources are not
considered in assessing available capacity to meet Expected
Demand.
2015 Capacity BalanceNo additional capacity is required to meet the capacity target
in 2015. However, although OPWP has contracted capacity
of 6876 MW, only 5984 MW is available due to a temporary
constraint in transmission capacity that prevents dispatch of
the full capacity of the Sur IPP. The full capacity will become
available when OETC completes the 400 kV transmission
line from Sur and its terminal grid substation at Izki. This is
currently scheduled for completion in June 2016, such
that the constraint on Sur persists into the 2016 summer
peak season.
Under the High Case scenario, there remains a net
deficit of 179 MW after consideration of expected contract
extensions. However, for planning purposes, we
consider that the High Case is a contingency scenario and that
contingency reserves are sufficient to address this deficit
situation. In this case the contingency reserves include
both the UAE and PDO interconnects, and the exchange
arrangement with Sohar Aluminium.
— Al Kamil Power Plant — Sur Power Plant
Section 01- Main Interconnected System
25

Expected demand + marginLow case demand + margin High case demand + margin
Available contracted capacity Contract extensions Contingency reserves New Ibri IPP New Sohar IPP
2015 2016 2017 2018 2019 2020 2021
Year
0
2,000
4,000
6,000
8,000
10,000
12,000
MW
Figure 4 Future Power Generation Capacity Requirements – MIS
— Barka I Power and Water Desalination Plant
OPWP Seven Year Statement 2015 - 2021
26

2015 2016 2017 2018 2019 2020 2021
Generation Resources MW
Contracted Capacity 6,876 6,872 6,589 5,863 5,829 5,728 5,728
Constraints on Sur Power Evacuation
-892 -788 - - - - -
Available Contracted Capacity
5,984 6,084 6,589 5,863 5,829 5,728 5,728
Prospective Contract Extensions
57 309 589 1216 715 715 -
Prospective Ibri and Sohar IPPs
- - - 1,000 3,213 3,213 3,213
Reserves (non-firm) 780 780 780 780 980 980 980
Total – Contracted + Prospective
6,041 6,393 7,178 8,079 9,757 9,656 8,941
Total - All Resources 6,821 7,173 7,958 8,859 10,737 10,636 9,921
Expected Demand Scenario
Peak Demand 5,653 6,225 6,797 7,464 8,076 8,775 9,530
Total Capacity Required 5,910 6,500 7,100 7,800 8,440 9,170 9,960
Deficit (Additional Capacity Required):
Above Current Contracts - 416 511 1,937 2,611 3,442 4,232
Above Current + Extensions - 107 - 721 1,896 2,727 4,232
Above Current + All Prospective
- 107 - - - - 1,019
Above Current + All Prospective + Reserves
- - - - - - 39
Low Case Scenario
Peak Demand 5,340 5,714 6,166 6,675 7,183 7,726 8,372
Total Capacity Required 5,580 5,970 6,440 6,980 7,510 8,070 8,750
Deficit (Additional Capacity Required):
Above Current Contracts - - - 1,117 1,681 2,342 3,022
Above Current + Extensions - - - - 966 1,627 3,022
Above Current + All Prospective
- - - - - - -
High Case Scenario
Peak Demand 5,952 6,679 7,308 8,041 8,724 9,537 10,329
Total Capacity Required 6,220 6,980 7,640 8,400 9,120 9,970 10,790
Deficit (Additional Capacity Required):
Above Current Contracts 236 896 1,051 2,537 3,291 4,242 5,062
Above Current + Extensions 179 587 462 1,321 2,576 3,527 5,062
Above Current + All Prospective
179 5,87 462 321 - 314 1,849
Above Current + All Prospective + Reserves
- - - - - - 869
Section 01- Main Interconnected System
27
Capacity Balance from 2016 to 2017Rising demand and the constraint on Sur IPP power
evacuation in 2016 leave a deficit of 107 MW in the
Expected Demand scenario. The gap could be as much as
416 MW if the expected level of contract extensions is not
available. OPWP expects to address the deficit either by
import of firm capacity from a GCCIA member state or by
procurement of temporary rental diesel generation. For this
reason, OPWP plans a trial import or exchange with a GCCIA
partner in 2015, in order to confirm procedures for transmission
access and contractual arrangements, as well as operating
arrangements. In 2017, no deficit is anticipated under
Expected Demand.
In the High Case scenario, both years show deficits,
but considering the mitigations noted above for the
Expected Demand scenario in 2016, contingency reserves
are considered sufficient to counter the remaining
deficit amounts.
Capacity Balance from 2018 to 2020The new IPPs at Ibri and Sohar are being procured to meet
capacity requirements in this period. In 2018, the Ibri
IPP will be contracted to provide early power capacity of
about 1000 MW throughout the summer peak period. This
capacity, and that expected from contract extensions at Ghu-
brah, Wadi Jizzi, Al Kamil, and Barka I, is shown to meet 2018
capacity requirements under the Expected Demand scenario.
The High Case scenario provides a capacity deficit of 321
MW, less than in 2016 and 2017, and contingency reserves
are likewise sufficient to address this risk.
In 2019, both new IPPs will be contracted to be in service at
full capacity. Under the Expected Demand scenario, there is
no capacity deficit in either 2019 or 2020. Under the High
Case scenario, there is no capacity deficit in 2019, whereas
a deficit of 314 MW emerges in 2020. This is well within the
range of available contingency reserves.
Additional Capacity Requirement in 2021A significant capacity deficit arises in 2021 under the
Expected Demand scenario: 1019 MW. OPWP expects to
contract for additional capacity to be available at that time,
sufficient to meet capacity needs for several years beyond.
The procurement process would likely be initiated in 2017,
and the required capacity will be defined at that time on the
basis of new assessments of demand growth. As mentioned
in Section 1.2, OPWP plans to procure this capacity using a
new competitive process in which both existing plants (those
out of contract) and bidders for new plant(s) at new site(s)
may participate. Considering Figure 4, although prospective
contract extensions are shown as dropping from 715 MW in
2020 to zero in 2021, when the contracts will have expired
for the respective plants, the owners of these plants may
bid for further contract extension in this competitive
procurement.
Low Case ScenarioThe Low Case scenario shows no capacity deficit
throughout the forecast horizon. Should demand begin to
track this scenario, there may be no need for short-term
capacity mitigation in the coming years before COD of the
new IPPs, and there may be a substantial surplus at the
time of COD in 2019. This is currently considered as quite
unlikely, but in the event OPWP would consider cost-saving
mitigations.
OPWP Seven Year Statement 2015 - 2021
28
1.4 DESALINATED WATER REQUIREMENTS
In the northern regions of the Sultanate, OPWP provides
desalinated water to two “water departments”: PAEW and
MISC. Their respective service areas and requirements for
desalinated water are defined as follows:
• PAEW – in respect of the demand for potable water in
the Governorates of Muscat, Al Buraymi, Al Batinah North,
Al Batinah South, Ad Dakhiliyah, Ad Dhahirah,
Ash Sharqiyah North and Ash Sharqiyah South; and
• MISC – in respect of backup supply to the MISC
desalination plant, for process water used by industry in
the Sohar Industrial Port area.
PAEW and MISC provide the water demand projections in
respect of the following geographic zones:
• The “Interconnected Zone” includes the potable water
demands of the Governorates of Muscat, Al Batinah North,
Al Batinah South, Buraymi, Ad Dakhiliyah, and Ad
Dhahirah3 which are served by PAEW, and the process
water demand of the Sohar Industrial Port area which is
served by MISC4. The existing principal sources of
desalinated water for this zone are Ghubrah Power and
Desalination Plant, Barka I and Barka II Power and
Desalination Plants, and Sohar I Power and Desalination
Plant.
• The “Sharqiyah Zone” includes the potable water
demands of the Ash Sharqiyah North and Ash Sharqiyah
South Governorates excluding Masirah wilayat. The
existing principal source of water for this zone is the Sur
Desalination Plant.
Interconnected Zone – Demand for WaterThe projected peak water demand for the Interconnected
Zone is shown in Figure 5. Peak demand represents the
average daily demand (inclusive of network losses) during the
week of highest demand of the year. PAEW has provided two
demand scenarios – Base and High – which together capture
uncertainty in demand growth.
Both forecast scenarios reflect the impact of 2014 population
statistics and updated forecasts by the National Center for
Statistics and Information (NCSI), and the impact of updates
to PAEW plans for network expansion.
The Base and High scenarios differ primarily in the
near-term pace of population growth, and the related
effect on water demand. The Base scenario reflects demand
following the 2014 NCSI population projection, which projects
a relatively low growth rate compared to actual growth over
the past five years from 2009 to 2014. Considering the NCSI
population forecast, network expansion plans and identified
special projects, PAEW’s Base scenario projects an average
growth rate of about 6% from 2014 to 2021.
The High scenario assumes that population continues to
grow according to the 2009-2014 trend, until around
2020, then tapers off to realign with the NCSI projection by
the late 2030s. Apart from the population trend, the
assumptions for network expansion and special projects are
similar to the Base scenario. The High scenario projects an
average growth in water demand of about 8% over the
forecast horizon to 2021.
The High scenario is relevant considering the repeated
upward revisions to water demand forecasts in recent years,
as actual demand has outstripped previous projections.
This has been due to a combination of unexpectedly high
population growth and accelerated network expansion
by PAEW in response to requests from wilayats for network
water supply. The High scenario aims to establish a plausible
upper bound to water demand in order to plan for adequate
supply.
3 The current scenario considers a connection to Dhahirah by 2018 and it is considered to be supplied from the Interconnected Zone area of supply, while keeping limited production from the Masarrat well field, when both the new Sohar-Dhahirah transmission and new Sohar plant come in operation.4 MISC has provided OPWP with a demand projection through 2021. MISC is currently supplying its customers from its own RO plant which was commissioned in December 2011. During the 7-year period from 2015 to 2021, OPWP is requested to provide desalinated water to Majis customers in case of planned or unplanned plant outage at the Majis RO plant.
Section 01- Main Interconnected System
29

“Base scenario”peak demand (right hand scale) “High scenario”peak demand (right hand scale)
“Base scenario”annual demand “High scenario”annual demand
0
100
2014 2015 2016 2017 2018 2019 2020 2021
200
300
400
500
600
0
400
200
600
800
1,000
1,200
1,400
Million m3 Thousand m3/d
Year
Figure 5 Water Demand Projections – Interconnected Zone
2014 2015 2016 2017 2018 2019 2020 2021Ave.% Growth
Peak Water Demand Thousand m3/d
Base scenario 720 736 829 895 961 1,014 1,055 1,092 6%
Change from 2014-2020 Statement
-48 -96 -28 -35 -26 -18 -9 - -
High scenario 720 736 870 965 1,056 1,136 1,203 1,263 8%
Change from 2014-2020 Statement
-48 -96 13 35 69 104 139 - -
Total Annual Demand Million m3
Base scenario 221 226 251 269 288 304 317 328 6%
High scenario 221 226 262 289 315 339 358 376 8%
OPWP Seven Year Statement 2015 - 2021
30
Interconnected Zone – Water Supply SourcesThe supply sources available to meet water demand include
existing water desalination plants, new desalination plants
under construction or procurement, and PAEW sources.
They are described below. Figure 6 shows the output
capacity of all contracted and planned sources in comparison
to peak demand and capacity targets.
OPWP’s contracted sources of desalinated water for the
Interconnected Zone include the following:
• Ghubrah Power and Desalination Plant, owned and
operated by GPDC under a PWPA with OPWP. The
Ghubrah Desalination Plant comprises five MSF units with
a current capacity of 140,000 m3/d (31 MIGD). The PWPA
will expire in March 2018, before the peak season, and
all desalination units are expected to be decommissioned
at that time.
• Barka I Power and Desalination Plant, owned by
ACWA Power Barka and operated under a PWPA with
OPWP. The Barka I plant was originally contracted with a
desalination capacity of 91,200 m3/d (20 MIGD) using MSF
technology. Additional capacity of 45,000 m3/d (10 MIGD)
using RO technology became available in May 2014.
A second capacity addition of 57,000 m3/d (12.5 MIGD),
also RO units, is under construction and scheduled to come
into service in phases: 7.5 MIGD in July 2015, 10 MIGD in
October 2015 and full contracted capacity of 12.5 MIGD in
January 2016. The PWPA for Barka I will expire in April
2018, such that the entire Barka I desalination capacity
(193,000 m3/d in total, or 42 MIGD) will be unavailable
unless the contract is extended.
• Barka II Power and Desalination Plant, owned by SMN
Power Barka and operated under a PWPA with OPWP. The
Barka II plant has a capacity of 120,000 m3/d (26 MIGD)
using RO technology.
• Sohar I Power and Desalination Plant, owned by
Sohar Power Company and operated under a PWPA with
OPWP. Sohar I has a desalination capacity of 150,000 m3/d
(33 MIGD), using MSF units.
• Muscat City Desalination Plant, owned by Muscat City
Desalination Company and currently under constrution, to
be operated under a WPA with OPWP. The plant has
contracted desalination capacity of 191,000 m3/d
(42 MIGD) using RO technology, and is expected to begin
commercial operation in August 2015.
• Qurayyat Desalination Plant, awarded in December
2014 to the Hyflux Consortium, will be operated under
a WPA with OPWP with contracted capacity of 200,000
m3/d (44 MIGD), using RO technology, with scheduled
commercial operation to begin in May 2017.
In addition to the foregoing sources that are under
contract to OPWP, PAEW has its own sources of water
available in the Interconnected Zone that offset the need for
water desalination capacity. These include (1) well fields in
Muscat and other regional wells5, (2) a mobile RO plant that
is currently located at Ghubrah, with capacity of 23,000 m3/d
(5 MIGD)6, (3) a contract for supply of 11,000 m3/d from the
MISC RO plant in Sohar, from 2015 to 2017, (4 Al Masarrat
well field which is expected to supply 10,000 m3/d beginning
in 2018, and (5) the Wadi Dayqah surface water reservoir,
which is expected to provide capacity of 67,000 m3/d (15
MIGD) beginning in 20197. The production capacity from
these sources is shown in aggregate by year in Figure 6.
In addition to these contracted resources, OPWP is in the
process of procuring two new water desalination plants to
be located in Barka and Sohar. The Barka III IWP is planned
to have capacity of 281,000 m3/d (62 MIGD), and the Sohar II
IWP is planned to have capacity of 250,000 m3/d (55 MIGD).
Both are planned to be available for commercial operation in
time for the peak demand season of 2018, and are expected
to utilize RO technology.
5 Well production from these sources is projected to be reduced from 99,500 m3/d in 2014 to 42,000 m3/d by 2019 in line with national policy to provide for the recharge of aquifers. These capacities refer to peak yields. Production from wells is less during non-peak periods.6 This RO plant is owned by PAEW. 7 The Wadi Dayqah project has peak capacity of 90,000 m3/d, but average capacity is assessed at 67,000 m3/d. A portion of the project is intended for agricultural use. In an emergency, the peak capacity may be utilized for potable water, but normal operation even during peak demand periods considers the capacity at 67,000 m3/d for potable water demand.
Section 01- Main Interconnected System
31

Interconnected Zone – Capacity Target and Prospective ResourcesThe expansion plan for water desalination capacity aims
to meet peak demand, plus a 14% margin for supply
security. The purpose of the reserve margin is to provide
additional water capacity for recovery of the transmission and
distribution networks in the event of a failure of the
networks or a failure of supply from a desalination plant8.
This represents a system security measure that is analogous
to the generation security standard used to assess power
generation capacity requirements.
After an emergency, the water volumes in the PAEW
reservoirs may be at a low level and will need to be
replenished. Therefore, the capacity available to be drawn
from desalination plants must be higher than normal
demand, to allow for reservoir replenishment in the event of
an emergency.
Figure 6 provides a year by year summary of water supply
requirements in the Interconnected Zone, and the supply
sources planned to meet them. Available sources of supply
are considered in the context of peak demand (Base and
High Scenarios), and in the context of capacity targets (peak
demand plus reserve margin for both scenarios).
2015 2016 2017 2018 2019 2020 2021
Year
0
1,400
1,000
1,200
1,600
200
400
600
800
1,800
Thousand m3/d
Ghubrah Barka I Barka II Sohar I Muscat CityPAEW sources (non OPWP)
Qurayyat Barka III Sohar II Prospective Barka | Contract extensionProspective new IWP
High scenario capacity target Base scenario capacity target
Figure 6 Future Desalinated Water Capacity Requirements – Interconnected Zone
8 PAEW established the security standard, in accordance with international practice, to be that the 24-hour peak demand on the system should be available for supply within a 21-hour period. The 24-hour peak capacity requirement available in a 21-hour period corresponds to (24/21) x peak demand = 1.143 x peak demand, hence a 14.3% reserve margin.
OPWP Seven Year Statement 2015 - 2021
32

2015 2016 2017 2018 2019 2020 2021
Supply Requirements Thousand m3/d
Base Scenario Peak Demand 736 829 895 961 1,014 1,055 1,092
High Scenario Peak Demand 736 870 965 1,056 1,136 1,203 1,263
Base Scenario Capacity Target 841 948 1,023 1,098 1,159 1,206 1,248
High Scenario Capacity Target 841 995 1,103 1,207 1,298 1,375 1,443
Contracted Desalination Capacity
Ghubrah Power and Desalination Plant
140 140 140 - - - -
Barka I Power and Desalination Plant
136 193 193 - - - -
Barka II Power and Desalination Plant
120 120 120 120 120 120 120
Sohar I Power and Desalination Plant
150 150 150 150 150 150 150
Muscat City Desalination Plant
- a 191 191 191 191 191 191
Qurayyat Desalination Plant - - 200 200 200 200 200
Total Contracted Capacity
546 794 994 661 661 661 661
Projects under Procurement
Barka III IWP - - - 281 281 281 281
Sohar II IWP - - - 250 250 250 250
Peak Yield of PAEW Sources (Non OPWP)
111 101 101 100 119 119 119
Total Contracts & Projects under Procurement
657 895 1,095 1,292 1,311 1,311 1,311
Reserve over Base Capacity Target (shortfall)
-185 a -54 72 194 152 105 63
Reserve over High Capacity Target (shortfall)
-185 a -101 -9 85 13 -64 -132
Prospective Capacity Contracts
Barka I Contract Extension (MSF) - - - 91 91 91 91
Barka I Contract Extension (RO) - - - 102 102 102 102
New IWP - - - - - - 300
a The Muscat City Desalination plant is expected to begin commercial operation in August 2015. It will contribute to the network, at times at or near its full capacity, during its commissioning and testing phase earlier in the summer, though not on a consistent basis.
Section 01- Main Interconnected System
33

9 During this period, the positive reserve balance reflects aggregate supply across the Interconnected Zone. PAEW plans to develop additional transfer capacity between demand areas, such as between Sohar and Barka for example, to address imbalances or transfer bottlenecks if they should arise such as in emergency situations. Currently, PAEW does not anticipate any imbalances provided the proposed capacity additions become available as planned.
Comparing Capacity Targets to Total Contracts and Projects
under Procurement in the table on the previous page,
the Reserve over Base and High Capacity Targets establish
the need for additional capacity. In 2015 and 2016, supply
sources fall short of both capacity targets. In 2015, available
capacity is not sufficient to meet peak demand during
the first part of summer, until the Muscat City IWP begins
operation in August. The plant’s 191,000 m3/d capacity is
sufficient to cover peak demand and most of the capacity
target. In 2016, contracted capacity is sufficient to meet peak
demand in both scenarios, but not to meet the target reserve
margin. PAEW has the institutional responsibility to provide
for water demand requirements, and plans to manage the
identified supply deficits with contingency sources.
From 2017 to 2019, new capacity at Qurayyat, Barka and
Sohar is sufficient to meet targets despite retirement of the
old Ghubrah units and contract expiration at Barka I, but for
a modest deficit against the High scenario capacity target in
2017.9 Then in 2020, a deficit in reserves again emerges in
the High demand scenario, though not in the Base scenario.
OPWP is considering two options to address the additional
capacity requirement that emerges around 2020:
a prospective contract extension at Barka I and a new IWP in
2021. Negotiations are ongoing in 2015 for extension of the
Barka I contract.
In general, economic assessments and recent procurement
experience demonstrate the substantial cost advantage of
RO over MSF desalination technology. Considering objectives
to reduce costs and improve gas utilization in electricity
production, OPWP and PAEW expect RO to have an
increasing share of aggregate water desalination capacity.
Existing MSF units are expected to be retired, shifted to
standby mode or to a reduced operation schedule when
supported by a cost-benefit and technical analysis, as system
capacity and contractual conditions allow.
A new IWP is also being considered for 2021 with notional
capacity of about 300,000 m3/d, which would be sufficient
to cover several years of demand growth. Procurement
activities would begin around 2017, which allows several years
to assess demand growth trends and contractual
developments at existing plants before committing to
the capacity requirement. Several potential sites are
under evaluation.
— Muscat City IWP
OPWP Seven Year Statement 2015 - 2021
34

Sharqiyah Zone – Demand for Water The Sharqiyah Zone has seen extraordinary growth in water
demand since 2009 when the Sur desalination plant began
operation. Per capita consumption has increased more than
expected, and extensions to the water network connected
to the Sur plant have been extensive, occurring on a faster
schedule than originally planned. PAEW now projects that
the high growth rate in this region will continue until 2017,
and then begin to decline. Recently, per capita consumption
appears to have stabilized. The current PAEW projection
assumes no further increase, and existing private networks
will have been connected to the network by 2017.10
PAEW expects water peak demand to increase at an average
rate of about 9% per year over the seven-year horizon. The
highest year-to-year increases occur in the next few years,
and growth is expected to slow to about 4% by 2021. This
compares to the 6% average growth rate assumed in last
year’s forecast. Most of the incremental growth relative to
the previous forecast occurs by 2017.
PAEW has not provided a High demand scenario for
the Sharqiyah zone. PAEW’s High demand scenario
analysis, based on recent trends and the 2014 NCSI
populationforecast, did not support a higher population
trend scenariofor wilayats of the Sharqiyah Zone. On this
basis, PAEW’s forecast included only a Base scenario.
Peak water demand (right hand scale)Total annual demand
0 0
10
2014 2015 2016 2017 2018 2019 2020 2021
40
50
30
20
60 180
160
140
120
100
80
60
40
20
Million m3 Thousand m3/d
Year
Figure 7 Water Demand Projections – Sharqiyah Zone
10 PAEW cites projects in Sinaw, Ibra, Al Qabil, and Sur that are due for completion by 2016. More projects will follow shortly thereafter in Bidiyah, Mudaybi, Dama we At Taiyyin, Wadi Bani Khalid, and extensions in Kamil and Jaalan.
2014 2015 2016 2017 2018 2019 2020 2021Ave.% Growth
Peak Water Demand Thousand m3/d
Base Scenario 90 98 119 132 140 147 154 160 9%
Change from 2014-2020 Statement
10 6 19 29 34 36 41 - -
Total Annual Demand Million m3
Base Scenario 29 32 38 42 44 46 48 50 8%
Change from 2014-2020 Statement
3 1 6 10 11 12 13 - -
Section 01- Main Interconnected System
35

Sharqiyah Zone – Water Supply Sources and Desalination Capacity Requirement The Sharqiyah Zone currently has one source of desalination
capacity, the Sur Desalination Plant. It is owned by
Sharqiyah Desalination Company and operates with a
capacity of 83,000 m3/d (19 MIGD), using RO technology,
under a WPA with OPWP.11 PAEW has additional local
well sources to address temporary peaking requirements if
required.
Additional capacity of 48,000 m3/d (10.6 MIGD) is
currently under construction at the Sur Desalination Plant
by the owner, contracted by OPWP in response to a request
from PAEW. The additional capacity was planned to address
the rapid near-term demand growth and is expected to be
available in 2016.
Figure 8 on the following page provides a summary of
the desalinated water requirements in Sharqiyah Zone
during the 2015-2021 period. It considers the same
capacity target of 14% over peak demand as applied for
the Interconnected Zone.
Current supply capacity is not sufficient to meet peak
demand requirements in 2015 or 2016, and will need to be
supplemented by PAEW groundwater sources. Considering
the increased level of demand in the current forecast, the
capacity addition expected in late 2016 is no longer
expected to be sufficient to meet 2017 peak demand, by a
small margin, although it substantially narrows the
supply gap evident in 2016. PAEW groundwells or other
contingency sources will continue to be utilized to meet the
supply deficit until additional permanent capacity is available.
PAEW has the institutional responsibility to provide for water
demand requirements, and plans to manage the identified
supply deficits with contingency sources.
OPWP plans to begin procurement of a new IWP in 2015, for
service in 2019 to address the capacity deficit. The new plant
is expected to have capacity of about 55,000 m3/d (12.1
MIGD) in order to meet the projected capacity target at least
through 2021. Sites are currently being evaluated.
11 The plant previously operated under a WPA with PAEW, but the contract was novated to OPWP in December 2014.
— RO membranes
OPWP Seven Year Statement 2015 - 2021
36
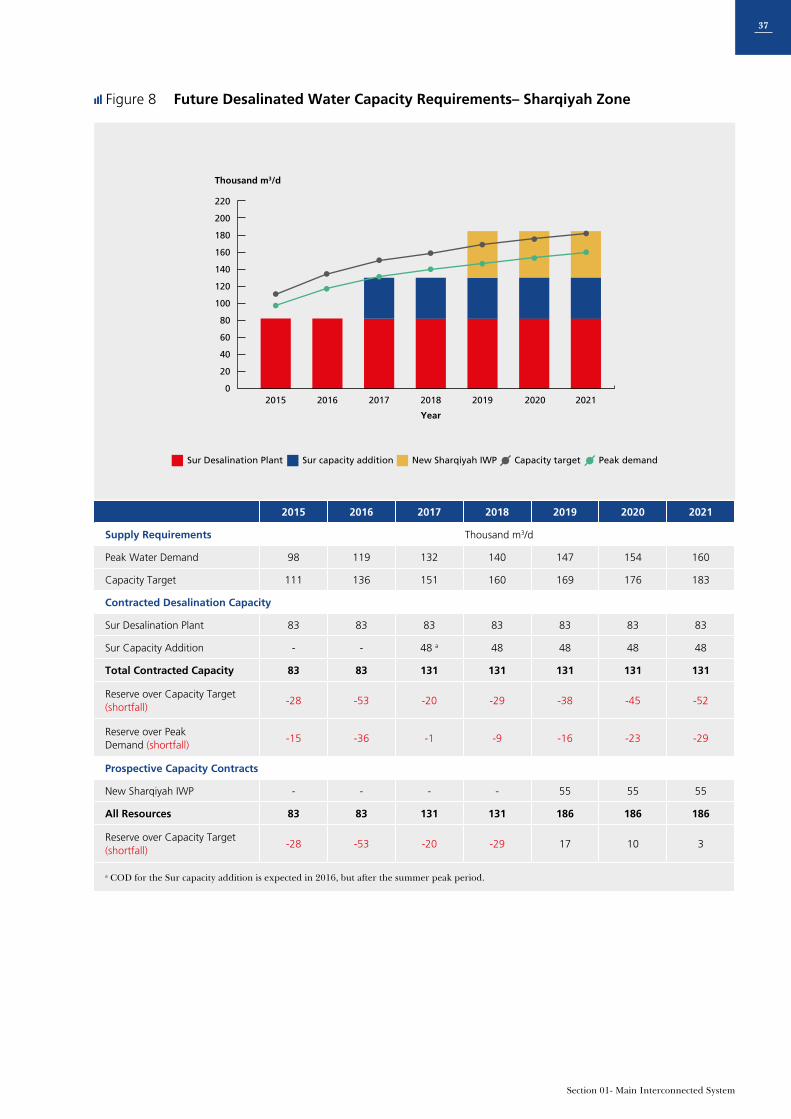
Sur capacity additionSur Desalination Plant New Sharqiyah IWP Capacity target Peak demand
2015 2016 2017 2018 2019 2020 2021
Year
0
100
80
60
40
20
120
140
160
180
220
200
Thousand m3/d
2015 2016 2017 2018 2019 2020 2021
Supply Requirements Thousand m3/d
Peak Water Demand 98 119 132 140 147 154 160
Capacity Target 111 136 151 160 169 176 183
Contracted Desalination Capacity
Sur Desalination Plant 83 83 83 83 83 83 83
Sur Capacity Addition - - 48 a 48 48 48 48
Total Contracted Capacity 83 83 131 131 131 131 131
Reserve over Capacity Target(shortfall)
-28 -53 -20 -29 -38 -45 -52
Reserve over Peak Demand (shortfall)
-15 -36 -1 -9 -16 -23 -29
Prospective Capacity Contracts
New Sharqiyah IWP - - - - 55 55 55
All Resources 83 83 131 131 186 186 186
Reserve over Capacity Target (shortfall)
-28 -53 -20 -29 17 10 3
a COD for the Sur capacity addition is expected in 2016, but after the summer peak period.
Figure 8 Future Desalinated Water Capacity Requirements– Sharqiyah Zone
Section 01- Main Interconnected System
37

1.5 COMBINING POWER GENERATION AND WATER DESALINATION
1.6 PROCUREMENT ACTIVITIES
In developing its plans for procuring power generation
resources, OPWP is required to consider the opportunity for
combining power generation with water desalination so
as to benefit from economies of co-location and
co-procurement. The most recent examples of combined
development of power and desalination capacity are the
Salalah IWPP in Dhofar and the Barka II Power and
Desalination Plant in the MIS. In both cases, bidders proposed
to use RO rather than MSF technology for water desalina-
tion, although the procurement specifications did not specify
the technology to be used. OPWP expects that future plants
will also be proposed to use RO technology due to its
economic advantage.
For the current major procurement projects – IPPs at Ibri
and Sohar, IWPs at Barka and Sohar – OPWP considered
options for combining the projects at a single site at Suwaiq
as well as other locations. However, land constraints at the
selected sites, particularly with respect to access corridors
needed for electricity, water, and gas transmission, prevented
combined power and water development within the required
timeframe (i.e., by 2018/2019).
OPWP’s current and near-term procurement activities for the
MIS include the following projects, summarized in Table 3 on
the following page:
• I(W)PP Contract Extensions. OPWP is in discussions
with the owners of the Ghubrah, Wadi Jizzi, Al Kamal, and
Barka I plants toward extending contracts for guaranteed
capacity to 2020. Contract agreements are expected to be
executed by mid-2015.
• Ibri and Sohar 3 IPPs. Two new power generation
facilities are being procured with aggregate capacity in
the range of 2850-3150 MW12 for commercial operation in
2018/2019. The total capacity will be distributed among
two sites, at Ibri and Sohar. The project is in the tendering
process and is expected to be awarded by the end of 2015.
At least 1000 MW is to be in service by summer 2018 (on
an early power basis) and the balance in 2019.
• New Barka and Sohar IWPs. Two new water
desalination plants are planned for commercial operation
in 2018, at Barka and Sohar, with capacity of 281,000
m3/d (61.8 MIGD) and 251,000 m3/d (55 MIGD)
respectively. They are also in the tendering process and are
expected to be awarded by the end of 2015.
• Sharqiyah IWP. A new desalination plant is planned for
the Sharqiyah region with capacity of 55,000 m3/d (12.1
MIGD) for service in 2019. The project is expected to be
tendered in 2015 for award in 2016. Prospective sites are
currently under review.
OPWP has also recently completed procurement of several
projects which are now under construction. They include the
expansion of Sur IWP (10.6 MIGD), the Phase 2 extension at
Barka I (12.5 MIGD), and the Qurayyat IWP (44 MIGD).
12 As noted earlier, this is the range at reference conditions. At typical peak demand conditions, 45°C, the capacity would be higher, shifting the range to about 2907 to 3213 MW.
OPWP Seven Year Statement 2015 - 2021
38

Future Procurement ActivitiesFrom 2016 to 2021, OPWP anticipates the following
procurement actions for the MIS:
• Solar IPP. One or more solar plants with aggregate
capacity up to 200 MW are expected to be developed.
Subject to government approval, the procurement may
be initiated in 2015 or 2016 for 2019 operation, at
prospective sites near Adam or Manah;
• New MIS IPP(s). OPWP expects that additional electricity
capacity will be required in 2021, and that procurement
activities for this would begin around 2017. Existing plants
with contract expirations at the end of 2020 may also
offer capacity under this procurement, for contract from
2021 onwards.
• Electricity Spot Market. OPWP’s spot market initiative
will create a new mechanism for procuring electricity.
The market rules and enabling infrastructure are expected
to be developed from 2015 to 2017, toward launch of
the spot market in 2018.
• New MIS IWP(s). Additional desalination capacity may
also be required for operation in 2021 for the
Interconnected Zone. Initial activities to secure the
site(s) would start no later than 2016 to enable
commencement of procurement activities in 2017.
Similarly, additional capacity for the Sharqiyah Zone may
be required around 2022 or 2023, which would imply
procurement activities should start around 2018.
These projects will be defined further in time, particularly
depending on developments in demand growth and system
requirements, as well as depending on the Government’s
evolving renewable energy development policy.
Long-Term ConsiderationsOPWP works closely with the Government toward
developing a coordinated long-term strategy for electricity
and water supply. Progress in the following areas is expected
in 2015 and 2016:
• Fuel Security and Diversity of Supply: OPWP has
worked closely with PAEW and other stakeholders on
the National Energy Strategy Study, which is scheduled for
completion in mid-2015. Important expected outcomes of
this study include the basis to establish national policy with
respect to renewable energy and alternative fuel supply for
power generation;
• Demand Side Management: OPWP plans to initiate
demand management initiatives with several large
industrial customers in 2015, and to develop options for
further demand management among other customer
groups for the years ahead. This work builds upon the
Master Plan for Energy Conservation which PAEW
prepared in 2013; and
• Realization of GCCIA membership benefits: OPWP
participates in the Planning and Operations Committees
of the Gulf Cooperation Council Interconnection Agency
(GCCIA), which Oman joined officially as a Member State
in 2014. OPWP plans to coordinate with OETC and AER in
2015 to realize the prospective benefits of access to GCCIA
capacity reserves and spinning reserves. OPWP also plans
to test the potential for energy and capacity trading with
GCCIA partners in 2015, toward enabling this option as a
confirmed alternative to current contingency resources
such as temporary diesel generation, for example.
Table 3 MIS Procurement Activities in 2015
Ibri & Sohar3 IPP Sohar IWP Barka IWP Sharqiyah IWP
Capacity 2850-3150 MW 55 MIGD 61.8 MIGD 12.1 MIGD
RFQ Q2 2014 Q1 2015 Q1 2015 Q4 2015
RFP Q1 2015 Q1 2015 Q1 2015 Q1 2016
Bids Due Q3 2015 Q3 2015 Q3 2015 Q2 2016
Award Anticipated Q4 2015 Q4 2015 Q4 2015 Q4 2016
COD
EP: Q2 2018 (for Ibri)SCOD: Q1 2019
(for Sohar) Q2 2019 (for Ibri)
Q2 2018 Q2 2018 Q1 2019
Section 01- Main Interconnected System
39

1.7 FUEL REQUIREMENTS
2014 Fuel UsageThe primary fuel resource for power generation and
associated water production in the MIS is natural gas,
supplied to power and desalination plants by the Ministry of
Oil & Gas (MOG). Total gas consumption at the main power
and desalination plants in 2014 was about 7.1 billion Sm3,
equivalent to 19.5 million Sm3/d, about 6.6% more than in
2013. The peak daily gas consumption in 2014 was 27.9
million Sm3, an increase of 15% over 2013. These increases
were due to significant growth in electricity demand and late
completion of the Sur IPP, requiring additional use of older
generation plants during the summer.
Temporary generation facilities were connected to the MIS
during the summer of 2014 as standby capacity to secure
electricity supply. No outage incidents occurred that would
have required their support, and consequently they produced
electricity only during their testing period, using a negligible
quantity of diesel fuel which shows as zero in Figure 9 below.
Projected Fuel Requirements OPWP has projected fuel requirements of the MIS over the
2015-2021 forecast horizon for each of the three demand
scenarios, as shown in Figure 9 below. The projections make
the following key assumptions:
• all generation is assumed to be gas-fueled other than the
prospective solar plant(s);
• solar plant(s) are assumed to have a capacity factor of
about 25%, such that they provide around 50 MW on
average over a day (representing about 1-2% of total MIS
gas requirements) from 2019 onwards; and
• Ibri and Sohar IPPs, coming into service in 2018 and 2019,
are assumed to have fuel efficiency comparable to
CCGT technology available in today’s market.
Overall fuel consumption is expected to increase at an
average rate of about 4% per year over the next seven years,
lower than the growth rate projected in the last 7-Year
Statement due to a reduced electricity demand projection.
Availability of the Sur IPP throughout 2015 is expected to
contribute to zero growth in total fuel consumption and
a reduction in peak day gas consumption in 2015 relative
to 2014.
Under the Low Case demand scenario, fuel consumption
increases at an average of 2% per year, whilst in the
High Case demand scenario, it grows at an average rate of
6% per year – in both cases below the rate of growth of
electricity demand.
Peak day gas consumption - Expected demand (right hand scale)Peak day gas consumption - Low case demand (right hand scale)
Peak day gas consumption - High case demand (right hand scale)
Total fuel consumption - Low case demand Total fuel consumption - Expected demand Total fuel consumption - High case demand
02014 2015 2016 2017 2018 2019 2020 2021
200
400
600
800
0
10
20
30
40
50
60
Million HHV GJ Million Sm3/d
Year
Figure 9 Projected Fuel Requirements – MIS
OPWP Seven Year Statement 2015 - 2021
40

Actual 2014
2015 2016 2017 2018 2019 2020 2021Ave.% Growth
Expected Demand
Gas Consumption (million Sm3/d)
Annual Average 19.5 19.5 20.4 21.6 22.2 22.4 24.2 26.0 4%
Peak Day 27.9 26.3 28.3 30.5 33.0 31.7 34.4 36.9 4%
Diesel Fuel Consumption (million litres)
- - - - - - - - -
Total Fuel Consumption (million HHV GJ) a
278 277 292 308 317 319 345 371 4%
- Gas 278 277 292 308 317 319 345 371 4%
- Diesel Fuel - - - - - - - - -
Low Case Demand
Gas Consumption (million Sm3/d)
Annual Average 19.5 18.0 18.8 19.5 19.5 20.0 21.4 22.9 2%
Peak Day 27.9 24.7 26.1 27.1 28.5 28.4 30.5 32.6 2%
Diesel Fuel Consumption (million litres)
- - - - - - - - -
Total Fuel Consumption (million HHV GJ) a
278 257 268 278 279 285 306 327 2%
- Gas 278 257 268 278 279 285 306 327 2%
- Diesel Fuel - - - - - - - - -
High Case Demand
Gas Consumption (million Sm3/d)
Annual Average 19.5 20.1 21.8 23.1 24.8 24.5 26.7 28.5 6%
Peak Day 27.9 27.6 31.1 32.8 36.4 34.3 37.9 40.2 5%
Diesel Fuel Consumption (million litres)
- 0.27 5.56 1.21 0.02 0.16 - - -
Total Fuel Consumption (million HHV GJ) a
278 287 311 329 353 349 381 407 6%
- Gas 278 287 311 329 353 349 381 407 6%
- Diesel Fuel - - - - - - - - -
a Based on natural gas HHV of 1050 BTU/scf
Section 01- Main Interconnected System
41

02005 2007 2009 2011 2013 2015 2017 2019 2021
400
Sm3 of gas consumed per MWh produced
350
300
250
200
150
100
50
Year
ProjectedActual
Figure 10 Improvement in Gas Utilization – MIS
OPWP Seven Year Statement 2015 - 2021
42
Gas UtilizationContinuing improvements in the efficiency of power
supply have held back the growth rate in fuel requirements.
Since 2005, through the introduction of progressively more
efficient generation plants, the average fuel consumption
per unit of electricity production in the MIS has dropped
from 374 Sm3/MWh to 285 Sm3/MWh in 2014, an
improvement of 24%. Over the next seven years, OPWP
expects that an increasing share of power generation will be
provided by the most efficient plants - Sohar II, Barka III and Sur
in the near term, and then the new Ibri and Sohar plants –
contributing to a further 27% improvement in MIS gas
utilization as indicated by Figure 10 below. Another
significant contributor is the shift from MSF to RO
technology for water desalination.
This is expected to allow some of the combined power and
water plants to be operated less intensively in favor of the
newer and more efficient power-only IPPs.
OPWP and OETC also plan to cooperate in 2015 toward
developing generation dispatch procedures that take full
advantage of both GCCIA operating reserves and the
newer generation plants while honoring the network security
constraints that assure reliable power supply. OETC is in
the process of developing a 400 kV transmission backbone
and new dispatch control technology that together will
support more efficient dispatch, while OPWP will contribute
advanced system simulation to support economic dispatch
decision-making.

Gas AvailabilityOPWP consults with MOG on a regular basis, in order to confirm the future availability of gas for power generation
(and associated water production) and to co-ordinate planning.
MOG has indicated that future gas supply is constrained, but with assurances that the power sector has a priority
for future gas allocations. While MOG has committed to gas supply for the planned capacity additions in Salalah,
Ibri and Sohar for 2018/2019, gas availability for later plants is not assured.
Should further required gas allocations not be available to the power and water sector, then (in addition to pursuing
fuel-efficiency improvement options) OPWP would likely need to:
• bring forward plans to procure new generation capacity based on a fuel other than gas;
• discuss with the Government the feasibility of importing gas specifically for use in power generation (and associated
water production); and/or
• make use of optional arrangements included in the Barka III and Sohar II PPAs for dispatch on liquid fuel instead of gas.
OPWP will continue to consult closely with MOG with regard to all of these matters.
Section 01- Main Interconnected System
43

DHOFARPOWERSYSTEM
02
OPWP Seven Year Statement 2015 - 2021
4444

The Dhofar Power System covers the city of Salalah and
surrounding areas in the Governorate of Dhofar, serving
around 85,000 electricity customers.
The Dhofar Power System comprises two generation
facilities, the 220 kV/132 kV transmission grid that is owned
and operated by Oman Electricity Transmission Company
(OETC), and the distribution network which is owned and
operated by Dhofar Power Company (DPC).
The Dhofar Power System is interconnected with the power
system of Petroleum Development Oman (PDO) via a 132 kV
link between Thumrait and Harweel, with transfer capacity
up to 150 MW. This interconnection provides important
reliability benefits through the sharing of generation reserves.
The Directorate General of Water (DGW) is the principal
entity responsible for potable water supply and
distribution in the Governorate of Dhofar, apart from small,
private networks. A single water desalination plant is the
principal source of water supply to the DGW transmission
system, although DGW also has significant groundwater
resources available with sufficient capacity to meet the
majority of water requirements if necessary.
OPWP’s role in the Dhofar Power System is similar to its role
in the MIS, which is to procure economically the power and
desalinated water required by DPC and DGW, respectively,
in bulk from generation/production facilities connected to
the Dhofar Power System. OPWP is required to ensure that
sufficient power generation resources are available to meet
DPC electricity demands. OPWP is also required to procure
bulk water supply at the request of water departments
including DGW, and, wherever beneficial, to co-procure
desalinated water with power generation in joint facilities.
Section 02 - Dhofar Power System
45

2.1 DEMAND FOR ELECTRICITY
Historical DemandElectricity demand growth in 2014 was somewhat lower than
the forecast of the last 7-Year Statement. Average demand
increased by 7% to 303 MW (corresponding to 2.65 TWh).
The peak demand was 439 MW,13 an increase of 4.5% over
the 2013 peak demand.
The average annual growth rate in peak demand over the
past 5-7 years has been between 9% and 10%, while
single-year growth has reached as high as 15%. The
ten-year average growth rate is also about 9%. This rapid
development rate has been common among all principal
consumer sectors.
Demand ProjectionsOPWP’s 7-year electricity demand projections for the Dhofar
Power System have been developed in a similar manner as
for the MIS: (1) the projected demands represent the “net
system demand”, in that they are inclusive of assumed
transmission and distribution system losses but
exclude the internal auxiliary consumption of power and
desalination plants; (2) the Expected Demand scenario is
based on an assumption of “normal” weather; (3) they are
built up from separate analyses of underlying demand, and
certain bulk loads, comprising mainly industrial demands,
that are assessed on a specific load-wise basis; and (4) they
are presented as a range with a Low Case, High Case and
central, Expected Demand forecast, in which the Low Case
and High Case scenarios provide for different average growth
rates over the forecast horizon as well as the potential effects
of weather conditions on demand in the near term.
The projections are summarized in Figure 11 on the
following page.
Under the Expected Demand scenario, peak demand is
expected to grow at about 10% per year, from 439 MW in
2014 to 839 MW in 2021. Energy consumption is projected
to grow from 2.65 TWh (corresponding to 303 MW average
demand) in 2014 to 5.22 TWh (595 MW) in 2021, also an
average increase of around 10% per year.
The demand drivers in the Dhofar Power System include
population-driven residential growth, construction of
commercial and government buildings, infrastructure
development such as the new Salalah airport, tourism
projects, and industrial growth in designated economic
zones. All sectors are expected to grow rapidly.
The Expected Demand forecast, as well as the other
scenarios, is only marginally changed from the last Seven-Year
Statement: very slightly reduced. It is grounded in historical
trends. Growth in Bulk Loads – primarily industrial projects
– is limited to committed projects in the near term, and in
the medium term as a conservative assessment of the likely
realization of identified, prospective projects. Total demand
growth over the forecast horizon is constrained at about the
middle of the range of historical growth rates considering
the past 5-10 years. Underlying demand, being total demand
less bulk loads, is assumed to grow steadily throughout the
forecast period.
13 DPC reported the net peak demand for the Dhofar Power System as 439 MW at 24:00 pm (midnight) on Monday, June 16th, 2014.
OPWP Seven Year Statement 2015 - 2021
46
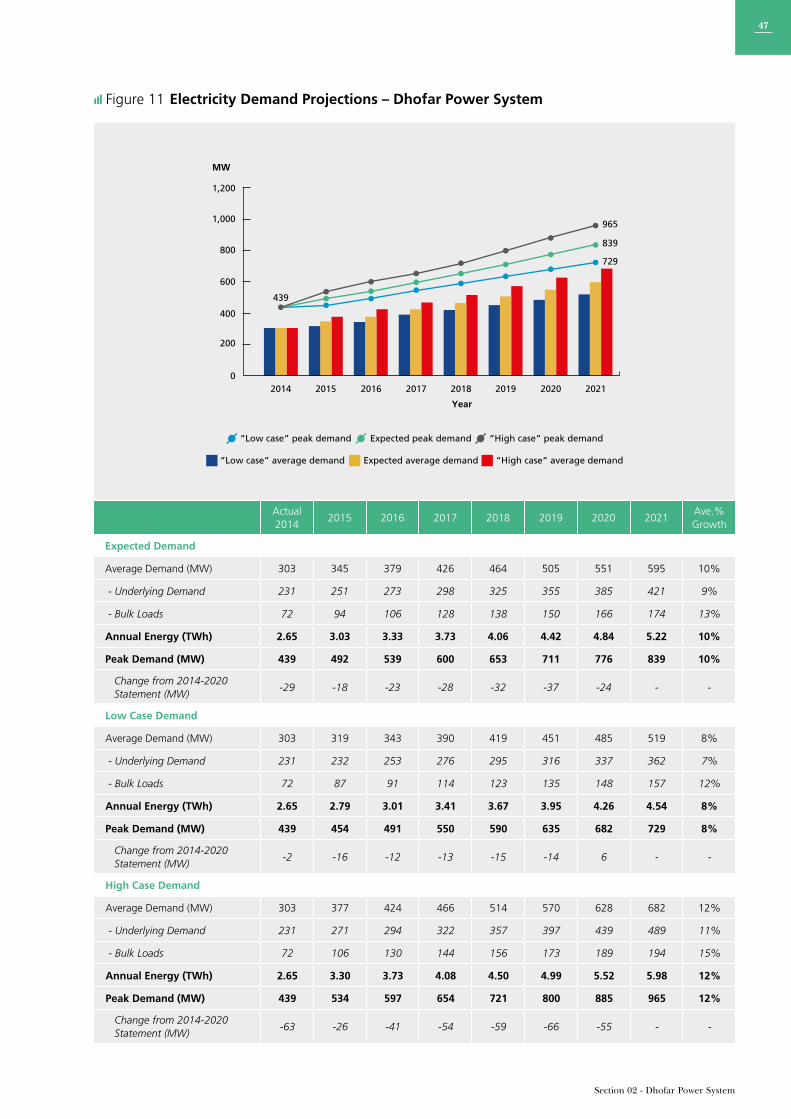
“Low case” average demand Expected average demand “High case” average demand
“Low case” peak demand Expected peak demand “High case” peak demand
0
200
2014
439
729
839
965
2015 2016 2017 2018 2019 2020 2021
400
600
800
1,000
1,200
MW
Year
Figure 11 Electricity Demand Projections – Dhofar Power System
Actual 2014
2015 2016 2017 2018 2019 2020 2021Ave.% Growth
Expected Demand
Average Demand (MW) 303 345 379 426 464 505 551 595 10%
- Underlying Demand 231 251 273 298 325 355 385 421 9%
- Bulk Loads 72 94 106 128 138 150 166 174 13%
Annual Energy (TWh) 2.65 3.03 3.33 3.73 4.06 4.42 4.84 5.22 10%
Peak Demand (MW) 439 492 539 600 653 711 776 839 10%
Change from 2014-2020 Statement (MW)
-29 -18 -23 -28 -32 -37 -24 - -
Low Case Demand
Average Demand (MW) 303 319 343 390 419 451 485 519 8%
- Underlying Demand 231 232 253 276 295 316 337 362 7%
- Bulk Loads 72 87 91 114 123 135 148 157 12%
Annual Energy (TWh) 2.65 2.79 3.01 3.41 3.67 3.95 4.26 4.54 8%
Peak Demand (MW) 439 454 491 550 590 635 682 729 8%
Change from 2014-2020 Statement (MW)
-2 -16 -12 -13 -15 -14 6 - -
High Case Demand
Average Demand (MW) 303 377 424 466 514 570 628 682 12%
- Underlying Demand 231 271 294 322 357 397 439 489 11%
- Bulk Loads 72 106 130 144 156 173 189 194 15%
Annual Energy (TWh) 2.65 3.30 3.73 4.08 4.50 4.99 5.52 5.98 12%
Peak Demand (MW) 439 534 597 654 721 800 885 965 12%
Change from 2014-2020 Statement (MW)
-63 -26 -41 -54 -59 -66 -55 - -
Section 02 - Dhofar Power System
47

The High Case scenario assumes a higher growth rate for
Underlying Demand, consistent with high growth periods of
the recent past but assuming they might be sustained for
somewhat longer periods. Bulk Loads are assumed to have
a somewhat higher realization rate than in the Expected
Demand scenario. This scenario provides for 12% growth in
both peak demand and energy.
The Low Case scenario considers lower growth in
Underlying Demand, at 8% annual growth in average
demand. This scenario also takes a more cautious outlook
on Bulk Loads, considering the possibility that even some
committed projects may not materialize due to unanticipated
difficulties. These assumptions result in an aggregate growth
rate of 8% in both peak demand and energy.
As in the case of the MIS, the Low Case and High Case
scenarios are intended to represent the range of plausible
future demand paths around the expected demand
projection, against which the requirements for generation
resources need to be assessed and an appropriate generation
procurement strategy developed.
2.2 POWER GENERATION RESOURCES
Sources of PowerThe Dhofar Power System has two sources of contracted
generation capacity and one source of contingency reserves.
OPWP issued a tender in 2014 for a third generation plant to
begin operation in 2018, which is expected to be awarded in
the first quarter of 2015.
Contracted CapacityThe Dhofar Power System is comprised of the following
power generation resources which are contracted capacity:
• Raysut New Power Station (NPS), operated by the owner,
Dhofar Generation Company (DGC), under a PPA with
OPWP. The NPS is located in Raysut and comprises eight
OCGT units with a total net capacity of 273 MW. The
tender process for the Salalah 2 IPP includes the acquisition
of DGC, and thus the Raysut NPS, by the winning bidder.
• Salalah IWPP, operated by the owner, Sembcorp Salalah
Power and Water Company, under a PWPA with OPWP.
The Salalah IWPP is a CCGT plant comprising five gas
turbines and two steam turbines with combined net
capacity of 445 MW. It is located in Taqa and began
full-scale operation in 2012.
Prospective ContractsOPWP issued tender documents for the Salalah 2 IPP in the
second quarter of 2014. It is expected to be awarded
by March 2015 with capacity of about 400 MW. The plant
will be located in Raysut at a site adjacent to the NPS. It is
scheduled to begin commercial operation in January 2018.
RAECO is in the process of tendering a 50 MW wind farm
project, in partnership with MASDAR of Abu Dhabi, which
will operate under a PPA with OPWP. The project,
comprising an array of wind turbines, will be located near
Harweel, and is expected to be operational by early 2017.
Considering the potential intermittency of this resource, only
a portion of the total installed capacity may be considered as
a firm resource. For this reason, it is not currently considered
as a prospective firm capacity, although this position may
be altered with experience of the project’s electricity output.
OPWP is evaluating hourly wind data being collected at the
site, toward simulating the project’s likely production profile
and contribution to the Dhofar Power System.
Contingency ReservesAn interconnection with the PDO Power System (via a 132
kV link between Thumrait and Harweel) was completed in
2012. Its purpose is to support reserve-sharing between the
two systems, providing improved reliability by allowing each
system access to unused reserve in contingency scenarios.
The nominal transfer capacity of the interconnection is
around 150 MW. The transfer capacity of the
interconnection is not considered for resource adequacy
purposes (such as LOLH calculations), but rather as
contingency reserves.
Figure 12 provides a summary of currently contracted
capacity and prospective contracts for the Dhofar
Power System.
OPWP Seven Year Statement 2015 - 2021
48

Figure 12 Total Power Generation Resources – Dhofar Power System
Contingency reserves Prospective contracts Contracted capacity
02015 2016 2017 2018 2019 2020 2021
1,000
800
600
400
200
1,200
1,400
1,600
Year
MW
2015 2016 2017 2018 2019 2020 2021
Contracted Capacity Net MW a
Raysut New Power Station (DGC) 273 273 273 273 273 273 273
Salalah IWPP 445 445 445 445 445 445 445
Total – Contracted Capacity 718 718 718 718 718 718 718
Prospective Capacity Contracts Capacity Contracts
Salalah 2 IPP - - - 445 445 445 445
Total – Contracted + Prospective Capacity
718 718 718 1,163 1,163 1,163 1,163
Contingency Reserves (non-firm) Reserves
Wind project - - 50 50 50 50 50
PDO Interconnect b 150 150 150 150 150 150 150
Total – Contingency Reserves 150 150 200 200 200 200 200
All Resources 868 868 918 1,363 1,363 1,363 1,363
a All capacities are rated on a net basis (i.e. after allowing for auxiliary consumption inside the plants) at 35°C ambient temperature.b Provisional import capability
Section 02 - Dhofar Power System
49

2.3 ADDITIONAL POWER GENERATION REQUIREMENTS
Statutory and Regulatory Requirements Similarly to its role in the MIS, OPWP is required by the
Sector Law and its license to ensure the adequacy of
generation resources in the Dhofar Power System to
meet future power demands. The Sector Law establishes
OPWP’s general responsibility to secure sufficient generation
resources to meet demand and the OPWP license establishes
the generation security standard as 24 LOLH.
OPWP has concluded that, on the basis of simulation
studies of the Dhofar Power System, a reserve margin of
about 12% over peak demand is necessary to achieve
the 24 LOLH standard, considering the size of the system,
characteristics of generation resources, and limited access
to security reserves. This establishes the capacity target for
each of the three demand scenarios over the 7-year planning
horizon, shown in Figure 13.
Contracted capacity Salalah 2 IPP Contingency reserves
High case demand + margin Expected demand + margin Low case demand + margin
2015 2016 2017 2018 2019 2020 2021
Year
0
200
400
600
800
1,400
1,200
1,000
MW
Figure 13 Future Power Generation Capacity Requirements – Dhofar Power System
OPWP Seven Year Statement 2015 - 2021
50

2015 2016 2017 2018 2019 2020 2021
Generation Resources MW
Contracted Capacity 718 718 718 718 718 718 718
Prospective Salalah 2 IPP - - - 445 445 445 445
Contingency Resources (non-firm)
150 150 200 200 200 200 200
Expected Demand
Peak Demand 492 539 600 653 711 776 839
Total Capacity Required 551 604 672 731 796 869 940
Deficit (Additional Capacity Required):
Above Current Contracts - - - 13 78 151 222
Above Current + Prospective - - - - - - -
High Case Demand
Peak Demand 534 597 654 721 800 885 965
Total Capacity Required 598 669 732 808 896 991 1,081
Deficit (Additional Capacity Required):
Above Current Contracts - - 14 90 178 273 363
Above Current + Prospective - - 14 - - - -
Above Current + Prospective + Reserves
- - - - - - -
Low Case Demand
Peak Demand 454 491 550 590 635 682 729
Total Capacity Required 509 550 616 661 711 764 816
Deficit (Additional Capacity Required):
Above Current Contracts - - - - - 46 98
Above Current + Prospective
- - - - - - -
Section 02 - Dhofar Power System
51

Capacity Balance from 2015 to 2017 Currently contracted capacity is projected to be sufficient to
meet the capacity target associated with Expected Demand
throughout this period. The need for new capacity does not
emerge until 2018. Under the High Case scenario, there is
a modest deficit of 14 MW in 2017. Contingency reserves
via the PDO interconnect and Harweel wind farm are
sufficient to address this requirement should it arise, or
alternatively temporary diesel generators could be rented for
a short period.
Capacity Balance from 2018 to 2021Salalah 2 IPP is scheduled to begin commercial operation in
January 2018, with sufficient capacity to meet the capacity
target through 2021 under the Expected Demand scenario.
The scheduled completion date in January aims to manage
potential risk of delay, to assure the project is operational
before the onset of the peak demand season.
The Salalah 2 IPP also secures the capacity target through
2021 under the High Case scenario.
Therefore no further IPPs are currently anticipated for
the Dhofar Power System until after 2021. The next plant
addition would likely be required in 2023 or 2024,
depending upon demand growth.
2.4 DESALINATED WATER REQUIREMENTS
Demand for WaterThe Directorate General of Water (DGW) in the Office of
the Minister of State and Governor of Dhofar has provided
OPWP with water demand projections for the Governorate of
Dhofar, shown in Figure 14. Desalinated water is expected to
supply the aggregated potable water demands of the main
towns in Salalah, Taqa and Mirbat wilayats.14
Over the 7-year horizon, DGW expects peak water demand
to increase at an average annual rate of 8.4%, and total
annual demand to increase at 9% per year. These projections
are unchanged relative to the forecasts provided by DGW for
the previous 7 Year Statement (2014-2020).
Salalah City has by far the largest share of demand in the
Dhofar water system, as well as the highest growth rate.
The aggregate projection shown above is comprised of
separate projections for each of the wilayats of Salalah,
Mirbat and Taqah. Their respective growth rates are 9.3%,
5%, and 4.8% per year during this period.
The assessment of demand growth is affected by uncertainty
in the development pace of projects in the free zone, new
industrial projects, and tourism sites. The growth rates are
based on actual average demand growth experienced during
the 4-year period from 2010 to 2013 for peak and average
water demand growth rates. The projections are also broadly
consistent with a population-driven demand growth model
developed by OPWP.
14 According to DGW, some areas of the wilayats of Salalah, Taqah, and Mirbat, and other wilayats of Dhofar, are located outside the main water supply network, such as mountainous regions. They are expected to be served from local groundwater sources, and are not included in the water demand projections. DGW is currently studying the expansion of the existing water supply network to cover these areas.
OPWP Seven Year Statement 2015 - 2021
52

Peak water demand (right hand scale)Total annual demand
0 0
10
2014 2015 2016 2017 2018 2019 2020 2021
40
50
30
20
60 140
120
100
80
60
40
20
Million m3 Thousand m3/d
Year
Figure 14 Water Demand Projections – Dhofar (Salalah/Taqa/Mirbat)
Actual 2014
2015 2016 2017 2018 2019 2020 2021Ave.% Growth
Peak Water Demand Thousand m3/d
Base Scenario 81 88 96 104 112 122 132 143 8%
Change from 2014-2020 Statement
-1 -1 - - - - - - -
Total Annual Demand Million m3/d
Base Scenario 28 30 33 36 39 43 47 51 9%
Change from 2014-2020 Statement
- - - - - - - - -
Section 02 - Dhofar Power System
53

Water Supply SourcesThe Salalah Power and Water Desalination plant (Salalah
IWPP), owned by Sembcorp Salalah Power and Water
Company and operated under a PWPA with OPWP, is the
only source of desalinated water for the Dhofar water
system. The Salalah IWPP has a capacity of 68,190 m3/d
(15 MIGD), using RO technology, and was commissioned
in March 2012. The plant began supplying water in January
2013 upon completion of the DGW interconnection facility,
and from that time forward it has been producing almost
continuously at peak capacity, exceeding expectations. Prior
to this, Dhofar’s demand for potable water was supplied by
groundwater resources.
DGW continues to maintain its groundwater supply
network, which is capable of supplying more than 60,000
m3/d. However, consumers prefer the desalinated water
supply, and DGW plans to limit its use of wells to
quantities required when demand exceeds available supply
of desalinated water. This is also consistent with national
policy to limit groundwell production in order to replenish
aquifers.
Desalination Capacity RequirementFigure 15 provides a summary of the demand/supply
balance in the Salalah/Taqa/Mirbat area during the 2015 - 2021
period. In the last OPWP 7-Year Statement, the demand for
water was expected to exceed the available capacity supply
of Salalah IWPP in 2014, which did occur. Current water
demand exceeds desalination capacity, and the supply gap
rises rapidly over the forecast horizon. Although groundwell
capacity is sufficient to meet demand requirements in
excess of desalination capacity, DGW has requested OPWP to
procure additional desalination capacity to bridge the supply
gap as soon as possible.15
Figure 15 shows both peak demand and a capacity
target developed using the same reserve margin standard as
applied to plan water supply for the Interconnected Zone and
Sharqiyah Zone in the northern regions of the Sultanate.
OPWP estimates that the earliest that a new IWP may
be brought to commercial operation is 2019, assuming that
procurement activities start promptly in 2015. The capacity
of the new IWP is being considered in the range of 80,000
to 100,000 m3/d (18-22 MIGD). This would provide sufficient
capacity to meet demand requirements for about three years,
deferring the need for a subsequent IWP until around 2022.
Two sites are being considered, one at Raysut and the other
adjacent to the existing Salalah IWPP site near Taqa.
OPWP is also considering an option to add desalination
capacity at the Salalah IWPP. It appears that, through
modifications to existing equipment and adaptations to meet
Oman’s recently revised water quality specifications, Salalah
IWPP may be able to provide additional capacity of 2.3 MIGD
in a relatively short period. Considering the current need for
additional capacity, If this project proves to be technically
feasible, economical and timely, OPWP may contract for the
capacity accordingly, in which case the capacity requirement
for the new IWP may be somewhat reduced.
15 DGW has a large supply of groundwater available. As recently as 2012, groundwells provided for all of water demand, in excess of 60,000 m3/d at that time. Consumers prefer the consistent high quality of desalinated water, and government policy aims to minimize reliance on wells. For these reasons, DGW plans to save groundwell supply capacity for contingency reserves, such as in case of outages in desalination units, and for the planning reserve margin over peak demand. Until additional water desalination capacity may be acquired, 2019 as shown in Figure 15, DGW will access groundwell supply to meet the supply gap. Thereafter, the intention is to maintain sufficient water desalination capacity to meet peak demand and to use groundwell resources only for planning and contingency reserves.
OPWP Seven Year Statement 2015 - 2021
54
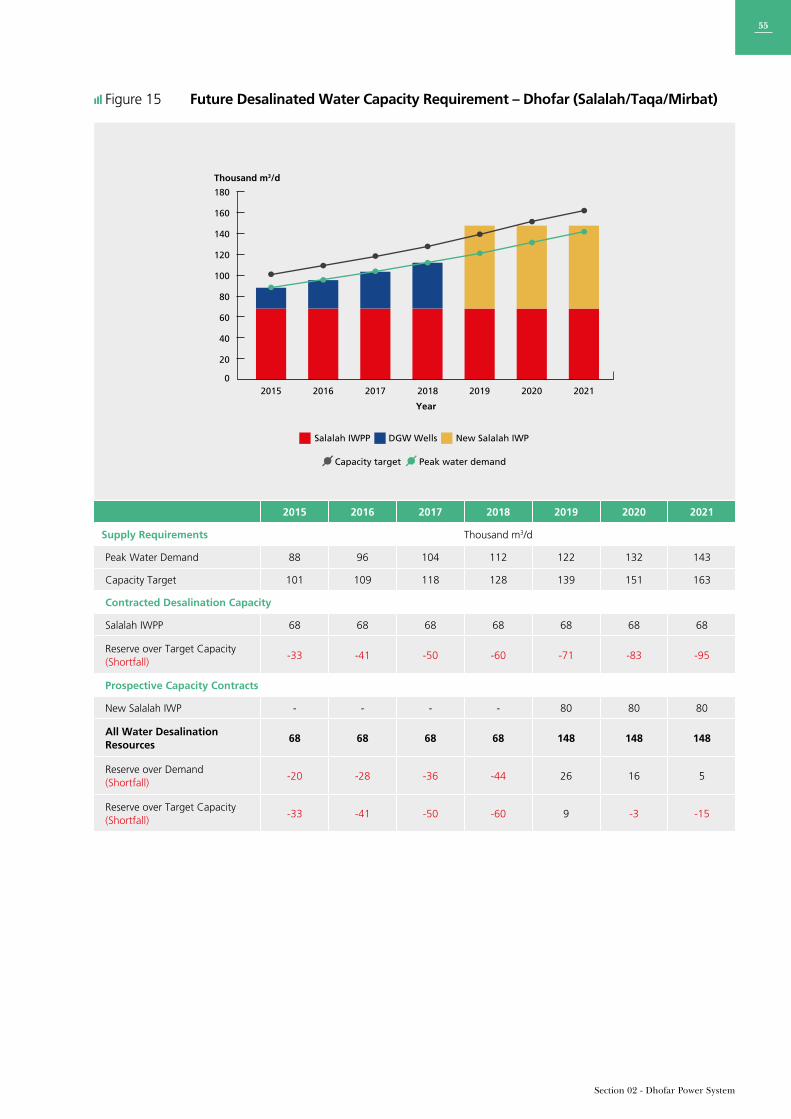
2015 2016 2017 2018 2019 2020 2021
Year
0
20
40
60
80
100
120
140
160
180
Thousand m3/d
Capacity target Peak water demand
Salalah IWPP DGW Wells New Salalah IWP
Figure 15 Future Desalinated Water Capacity Requirement – Dhofar (Salalah/Taqa/Mirbat)
2015 2016 2017 2018 2019 2020 2021
Supply Requirements Thousand m3/d
Peak Water Demand 88 96 104 112 122 132 143
Capacity Target 101 109 118 128 139 151 163
Contracted Desalination Capacity
Salalah IWPP 68 68 68 68 68 68 68
Reserve over Target Capacity (Shortfall)
-33 -41 -50 -60 -71 -83 -95
Prospective Capacity Contracts
New Salalah IWP - - - - 80 80 80
All Water Desalination Resources
68 68 68 68 148 148 148
Reserve over Demand (Shortfall)
-20 -28 -36 -44 26 16 5
Reserve over Target Capacity (Shortfall)
-33 -41 -50 -60 9 -3 -15
Section 02 - Dhofar Power System
55

2.5 COMBINING POWER GENERATION AND WATER DESALINATION
2.7 FUEL REQUIREMENTS
2.6 PROCUREMENT ACTIVITIES
As in the MIS, OPWP is required to consider the opportunity
for combining power generation with water desalination
in the Dhofar Power System, so as to benefit from economies
of co-location and co-procurement. An assessment of these
potential benefits led to the decision by OPWP to proceed
with the Salalah IWPP – the first combined power and
desalination plant to be developed in the Dhofar Power
System.
OPWP considered the Salalah 2 IPP tender as a potential
opportunity for combining power generation and water
desalination at one site. However, DGW advised in 2013
that it was too soon to commit to additional desalination
capacity, and therefore OPWP proceeded with the project on
a power-only basis.
As needs for additional water desalination and power
generation capacity are confirmed, OPWP will continue to
assess the potential for economic benefit that may result
from co-location and co-procurement.
2014 Fuel UsageBoth power generation plants in the Dhofar Power System
use natural gas. Total gas consumption in 2014 was about
780 million Sm3 (equivalent to 2.15 million Sm3/d), about
7.5% greater than in 2013, which was about the same as
the growth in electricity production. The peak daily gas
consumption was 3.1 million Sm3 in 2014, compared to
2.4 million Sm3 in 2013. The increase is due to the effect
of transmission constraints and gas supply interruptions
affecting generation from the Salalah IWPP, with result
that the NPS open cycle gas turbines were required to
operate more than had otherwise been anticipated.
Projected Fuel RequirementsOPWP has prepared projections for the fuel requirements
of the Dhofar Power System over the 2015-2021 period in
Figure 16 for each of the three demand scenarios.
The projections are based on the following key assumptions:
• Salalah 2 IPP is assumed to begin commercial operation in
2018, with a similar fuel efficiency to the Salalah IWPP;
• a 50 MW wind farm at Harweel is expected to begin
commercial operation in 2017, with an average daily yield
factor of about 30%; and
• no “commercial” imports or exports over the PDO
interconnection are assumed to occur.
The projections are shown in Figure 16.
Current ProjectsOPWP issued a tender in the second quarter of 2014 for the
Salalah 2 IPP at Raysut, and expects to award the contract
by March 2015. This tender for new capacity also included
acquisition of DGC, which owns and operates the existing
NPS (273 MW). The new plant is expected to have capacity
of about 445 MW, and scheduled COD in January 2018.
OPWP expects to issue a request for qualifications in Q4 of
2015 for a new IWP with capacity in the range of 80,000 to
100,000 m3/d (18-22 MIGD). Two sites are currently being
evaluated, one at Raysut and the other adjacent to the
Salalah IWPP near Taqa. OPWP’s current timeline is to issue
the request for proposal in Q1 2016, with bids due in Q2
and award anticipated in Q4 2016. Scheduled COD would
be in Q1 2019.
RAECO is developing a 50 MW wind farm at Harweel with
MASDAR of Abu Dhabi, and procurement of the EPC
contractor is expected in 2015. OPWP is not managing the
procurement project, but is preparing a PPA with RAECO,
which will be the owner/operator upon COD in 2017.
Future ProcurementTwo further potential procurement activities may be
anticipated later in the forthcoming seven year period:
• Desalination Capacity. A third water desalination plant
may be required around 2022, depending upon
demand growth and the ultimate capacity of the Salalah IWP
discussed above. Procurement activities for an IWP for
COD in 2022 would begin around 2017.
• Power Generation Capacity. The Salalah 2 IPP is expected
to provide sufficient capacity to meet the generation
security standard until around 2022 or 2023, depending
upon demand growth. Procurement activities to meet
the next plant, nominally the Salalah 3 IPP (or potentially
IWPP), may be expected to begin around 2018.
OPWP Seven Year Statement 2015 - 2021
56
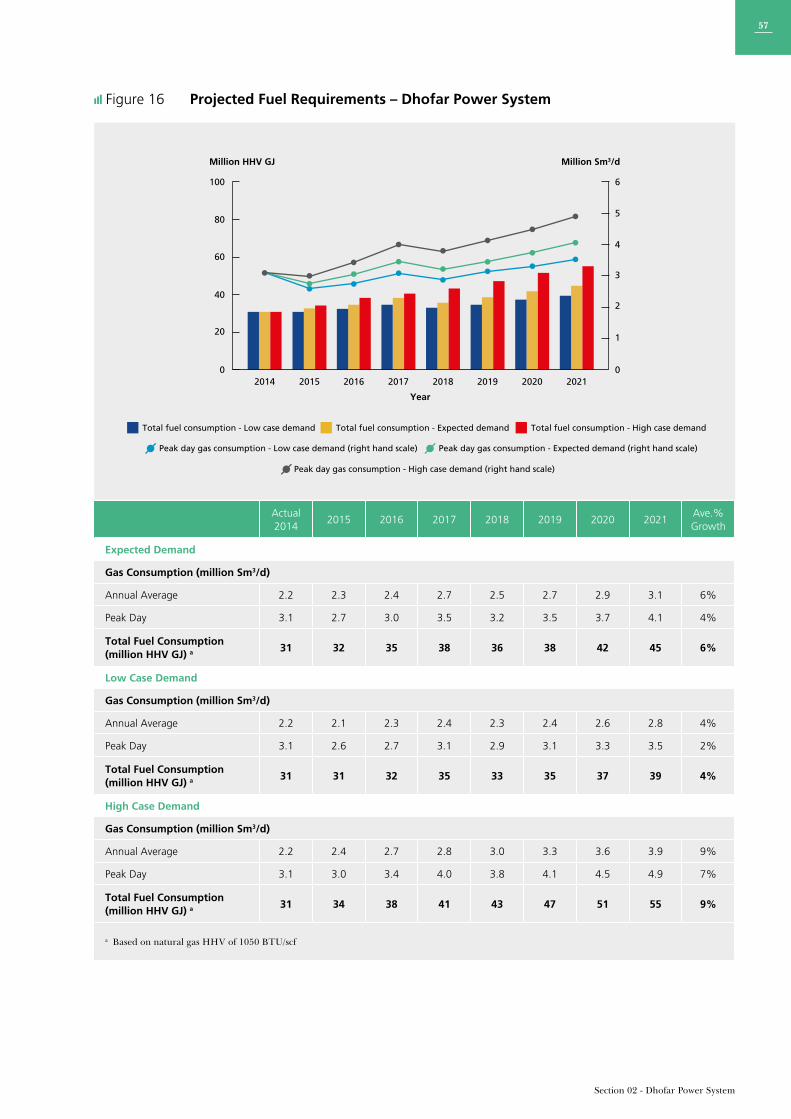
Figure 16 Projected Fuel Requirements – Dhofar Power System
Peak day gas consumption - Expected demand (right hand scale)Peak day gas consumption - Low case demand (right hand scale)
Peak day gas consumption - High case demand (right hand scale)
Total fuel consumption - Low case demand Total fuel consumption - Expected demand Total fuel consumption - High case demand
0 02014 2015 2016 2017 2018 2019 2020 2021
100
80
60
40
20
6
5
4
3
2
1
Million HHV GJ Million Sm3/d
Year
Actual 2014
2015 2016 2017 2018 2019 2020 2021Ave.% Growth
Expected Demand
Gas Consumption (million Sm3/d)
Annual Average 2.2 2.3 2.4 2.7 2.5 2.7 2.9 3.1 6%
Peak Day 3.1 2.7 3.0 3.5 3.2 3.5 3.7 4.1 4%
Total Fuel Consumption (million HHV GJ) a
31 32 35 38 36 38 42 45 6%
Low Case Demand
Gas Consumption (million Sm3/d)
Annual Average 2.2 2.1 2.3 2.4 2.3 2.4 2.6 2.8 4%
Peak Day 3.1 2.6 2.7 3.1 2.9 3.1 3.3 3.5 2%
Total Fuel Consumption (million HHV GJ) a
31 31 32 35 33 35 37 39 4%
High Case Demand
Gas Consumption (million Sm3/d)
Annual Average 2.2 2.4 2.7 2.8 3.0 3.3 3.6 3.9 9%
Peak Day 3.1 3.0 3.4 4.0 3.8 4.1 4.5 4.9 7%
Total Fuel Consumption (million HHV GJ) a
31 34 38 41 43 47 51 55 9%
a Based on natural gas HHV of 1050 BTU/scf
Section 02 - Dhofar Power System
57

Overall fuel consumption is expected to increase at an average rate of about 6% per year in the Expected Demand
scenario – substantially lower than the expected growth rate of electricity demand of about 10% per year. Under the Low Case
demand scenario, fuel consumption increases at an average of 4% per year, whilst in the High Case demand scenario, it grows
at an average rate of 9% per year – in both cases below the growth rate of electricity demand.
The lower growth rates in fuel consumption relative to electricity demand are mainly attributable to the addition of CCGT
plants in the Dhofar Power System. The impact of the addition of the Salalah 2 IPP in 2018 is particularly evident in all scenarios.
Gas AvailabilityOPWP consults with MOG on a regular basis, in order to confirm the future availability of gas for power generation
(and associated water production) and to co-ordinate planning. In respect of the rapid growth rate in Salalah, and projected
needs for the Salalah 2 IPP and later plants, it is particularly vital to secure future gas supply or identify a need for other
fuel options.
OPWP Seven Year Statement 2015 - 2021
58

Section 02 - Dhofar Power System
59

AD DUQM ANDMUSANDAM
03
OPWP Seven Year Statement 2015 - 2021
60

Ad DuqmAd Duqm is located on the eastern coastline of the Al Wusta region, approximately halfway between the Main Interconnected System (MIS) and the Salalah System. Currentpopulation is estimated at 8,55916, and is expected to grow rapidly due to the development of a new economic and industrial center.
The Ad Duqm region is currently served by a relatively small integrated generation and distribution system, owned and operated by Rural Areas Electricity Company (RAECO)RAECO owns and operates a 67 MW diesel-fuel fired power plant for supply to this grid area, and plans to add another 80 MW in 2017. RAECO is the sole licensed electricity supplier within the service area covered by the system, supplying existing and new electricity customers.
RAECO also provides for the potable water needs of Ad Duqm and the surrounding area with sources that include a small desalination plant and several wells.
OPWP’s role in Ad Duqm came under government request to review options for development of an IPP or IWPP to accommodate plans for rapid development of electricity and water demand in the area.
MusandamThe Musandam Governorate is located in the northern most region of the Sultanate of Oman, and extends into the Strait of Hormuz. The Musandam Governorate is an exclave of Oman, separated from the rest of the country by the United Arab Emirates. Current population is estimated at around 39,813, which is expected to grow steadily over the coming years.
The relatively small integrated generation and distribution system currently in place in the Musandam Governorate is owned and operated by RAECO. Generation requirements are met by a number of small diesel generators located near load centers. OPWP is currently assisting RAECO with the procurement of a new 100 MW electricity generation plant.
16 National Center for Statistics & Information – Population Statistics Bulletin (Issue 4 – 2014) Mid – Years Data
Section 03 - Ad Duqm and Musandam
61

3.1 DEMAND FOR ELECTRICITY
Historical DemandHistorically, all requirements to meet electricity demands
in Ad Duqm, Musandam, and their respective surrounding
areas, has been within the jurisdiction of RAECO.
Considering the relatively small energy requirements of these
areas, they have been met most economically by utilizing
diesel-fired generators, located close to the areas of
consumption.
Historical demand in these two regions has been mostly due
to residential and small commercial applicatons. This trend
is expected to change significantly due to the recent and
continuing introduction of larger commercial, tourism, and
industrial projects.
Demand Projections - Ad Duqm The development of the Special Economic Zone (SEZ) would
see substantial economic growth in Ad-Duqm as well as
population growth over and above the average for the area.
As a result, the demand for electricity in Ad-Duqm is likely to
grow significantly over the coming years. However, the pace
of growth is highly uncertain and depends on many factors
related to global markets, investment levels, and government
incentives.
Several entities have prepared development forecasts for
Ad Duqm, with widely divergent results. For the purposes
of electricity demand projections, OPWP has published here
the demand projections obtained from RAECo relating to
domestic, and small industrial/commercial development. This
is portrayed in three different scenarios.
The Low Case, Expected Demand, and High Case scenarios
are based on the expectations of growth and materialization
of customers and small industrial applications, and is
illustrated in Figure 17 below.
Figure 17 Electricity Demand Projections – Ad Duqm
Peak demand (High case) Expected peak demand Peak demand (Low case)
20152014 2016 2017 2018 2019 2020 2021
Year
0
20
40
60
80
100
120
140
160MW
Actual2014
2015 2016 2017 2018 2019 2020 2021Ave.% Growth
Peak Demand MW
RAECO: Expected Case 19 35 44 50 54 57 61 65 19%
RAECO: Low Case 19 30 38 41 45 48 52 57 17%
RAECO: High Case 19 47 54 70 97 119 130 142 33%
OPWP Seven Year Statement 2015 - 2021
62

Under the Expected Demand scenario, peak demand is
expected to grow at an average of 19% per year, from 19
MW in 2014 to 65 MW in 2021. The Expected Demand
scenario is developed from a consideration of expected
general residential and commercial demand generated by
population growth and development in the area.
The High Case scenario reflects (1) a higher than expected
rate of growth associated with general and commercial
demands, (2) higher materialization of customer applications
relating to small-medium commercial and industrial
applications, and (3) transmission connection to Haima in
2018, which adds demand associated with the Haima grid
area. The other scenarios do not include grid connection
to Haima within the forecast time period. The High Case
scenario anticipates an average growth rate of 33% in
peak demand, increasing from 19 MW in 2014 to 142 MW
in 2021.
The Low Case scenario assumes a lower rate of growth
associated with general residential and commercial demand,
and assumes a lower materialization rate of small/medium
industries of customer applications. This scenario has an
average growth rate in peak demand of 17%, from 19 MW
in 2014 to 57 MW in 2021.
These projections do not include the large influx of
industrial demand that has in the past been associated
with Ad Duqm development, and was included to some
degree in the last OPWP 7-Year Statement. It is currently
anticipated that the refinery and petrochemical complex being
developed by Oman Oil Co. and others will include captive
power generation to serve their own requirements. However,
other aspects of the industrial development at Ad Duqm,
in particular industries requiring electricity supply from the
power grid, are no longer included because MOG has
informed OPWP that there is not sufficient gas supply
available for development of an IPP. The rapid growth
of electricity demand evident in the RAECO projections
however is thought to be supported by the residential and
commercial requirements associated with the petrochemical
and port projects and other economic developments. Fur-
ther industrial development on a scale that requires a large
power station may be taken up somewhat later as new
gas supplies become available or as other fuels may be
considered for power supply.
Section 03 - Ad Duqm and Musandam
63

MusandamThe Musandam Governorate expects future developments aimed to boost touristic, economic, and commercial activities.
The Expected Demand scenario as shown below was developed by RAECO. OPWP prepared Low Case and High Case
scenarios on the basis of alternate assumptions of annual growth rates for underlying demand, materialization of identi-
fied bulk consumers, and expectations for the coincidence of bulk consumers’ peak demand with the peak demand on the
Musandam power system. Observation of out-turns against these forecasts, and further details of specific projects,
are expected to allow refinement of the forecast methodology in future OPWP Statements. The three demand scenarios
are shown in Figure 18 below.
Figure 18 Electricity Demand Projections – Musandam
Under the Expected Demand forecast obtained from RAECo, peak demand is expected to grow from 65 MW in 2014 to 112
MW in 2021, an average increase of 8% per year.
The High Case scenario assumes a quicker materialization of bulk consumers, as well as increased tourism and fishery
activities. Peak demand is projected to grow by an average of 10% per year, from 65 MW in 2014 to 125 MW in 2021.
The Low Case scenario assumes a growth rate of 5% for peak demand, increasing only to 94 MW in 2021.
Peak demand - High case (OPWP) Expected peak demand (RAECO) Peak demand - Low case (OPWP)
2015 2016 2017 2018 2019 2020 2021
Year
0
20
40
60
80
100
120
140MW
2015 2016 2017 2018 2019 2020 2021Ave.% Growth
Peak Demand MW
RAECO Expected Case 72 78 86 92 99 105 112 8%
Change from 2014-2020 Statement (MW)
2 3 6 6 7 7 - -
OPWP Low Case 68 75 80 83 87 90 94 5%
Change from 2014-2020 Statement (MW)
2 6 7 7 7 6 - -
OPWP High Case 74 84 94 101 109 117 125 10%
Change from 2014-2020 Statement (MW)
2 7 9 9 10 10 - -
OPWP Seven Year Statement 2015 - 2021
64

3.2 POWER GENERATION RESOURCES
Sources of PowerAd Duqm Zone
The RAECO system serving Ad Duqm and its surrounding areas is currently supplied by the Ad Duqm power station, a 67 MW
diesel-fired power plant which is also owned and operated by RAECO.
Musandam
RAECO owns and operates six power stations distributed near to load centers in the Musandam Governorate. They are all
diesel-fired generators, with combined installed capacity of about 96 MW. The largest plant is located at Khasab City, and
has installed capacity of about 58 MW plus an additional 8 MW due to the recent completion of an expansion at the Khasab
Power Station.
Prospective Contracts and Additional RequirementsAd Duqm Zone
In addition to the 67 MW diesel-fired plant owned and operated by RAECO at Ad Duqm, RAECO plans to add around 80 MW
of additional capacity by 2017. Figure 19 below demonstrates that the combined capacity, 147 MW, would be sufficient to
meet Ad Duqm demand through 2021 under the High Case scenario.
— Civil works for Musandam IPP
Section 03 - Ad Duqm and Musandam
65

Figure 19 Future Power Generation Expansion Plan - Ad Duqm
RAECO: High case RAECO: Expected case RAECO: Low caseRAECO Plant expansionExisiting RAECO Plant
2015 2016 2017 2018 2019 2020 2021Year
0
20
40
60
80
100
120
140
160MW
Since issuing the last 7 Year Statement, OPWP had studied the prospects of initiating the procurement process required to
begin development of a 300-400 MW gas-fired plant to assist with meeting future high industrial applications expected to be
introduced in Ad Duqm. However, OPWP has recently been informed by MOG that there is not sufficient gas supply for the
anticipated Duqm IPP. Although it appears likely that certain projects that already have committed gas supply may go forward
on schedule, such as the refinery and petrochemical complex, other projects needing power supply from the electricity grid may
need to wait until alternative fuel supplies may be arranged for development of a large electricity generation project.
2015 2016 2017 2018 2019 2020 2021
Contracted Capacity MW
Existing RAECO Plant 67 67 67 67 67 67 67
Prospective Capacity
RAECO Plant Expansion - - 80 80 80 80 80
Total Contracted Capacity + Prospective 67 67 147 147 147 147 147
Peak Demand
Expected Demand 35 44 50 54 57 61 65
High Case 47 54 70 97 119 130 142
Low Case 30 38 41 45 48 52 57
OPWP Seven Year Statement 2015 - 2021
66

MusandamIn addition to the 58 MW diesel-fired plant owned and operated by RAECO at the Khasab Power Station, RAECO has recently
finalized its expansion plan to include an additional 8 MW of diesel-fuelled generators.
OPWP is currently finalizing the contractual arrangements for a new IPP in Musandam utilizing dual-fuel fired reciprocating
engines. The project will be fueled by natural gas from a processing plant being developed by Oman Oil Company (OOC), and
the IPP is owned by a consortium led by OOC. The project will operate under a PPA with OPWP, for supply to RAECO. The IPP
will provide a minimum net firm capacity of 100 MW, with expected COD during the fourth quarter of 2016. This scale of plant
capacity, in combination with RAECO’s current diesel generators and planned expansions, would meet requirements under the
High Case scenario through 2021. Figure 20 below illustrates the Musandam capacity expansion plan.
Figure 20 Future Power Generation Expansion Plan - Musandam
RAECO RAECO: High case RAECO: Expected case RAECO: Low caseRAECO Exp. Musandam IPP
2015 2016 2017 2018 2019 2020 2021
Year
0
50
100
150
200
250MW
2015 2016 2017 2018 2019 2020 2021
Contracted Capacity MW
Existing RAECO Plant 88 88 88 88 88 88 88
RAECO Plant Expansion 8 8 8 8 8 8 8
Prospective Capacity
Musandam IPP - - 100 100 100 100 100
Total Contracted Capacity + Prospective 96 96 196 196 196 196 196
Peak Demand
Expected Demand 72 78 86 92 99 105 112
High Case 74 84 94 101 109 117 125
Low Case 68 75 80 83 87 90 94
Section 03 - Ad Duqm and Musandam
67

3.3 DESALINATED WATER REQUIREMENTS
Demand for Water – Ad Duqm ZonePAEW has provided OPWP with the water demand
projections for the Ad Duqm Zone, based on estimates made
by the Special Economic Zone Authority of Duqm (SEZAD)
for industrial demand, domestic demand within the zone,
and residential demand in the area surrounding the zone.
The projections are shown in Figure 21 below. The SEZAD
projections were prepared after discussions with PAEW
toward aligning their forecast methodologies.
In OPWP’s previous 7-Year Statement, PAEW’s forecast
included only the demand for potable water by the
non-industrial sectors that comprise the existing and
new Duqm town, the new airport, tourism projects, and
supplies to Haima, considering that Royal Decree 79/2013
establishes the responsibilities for the Duqm Authority
to include supply of industrial water. However, PAEW’s
responsibilities for water supply are now considered to extend
into the Special Economic Zone (SEZ), such that industrial
water demand is included in the projection toward
determining water supply requirements.17
The SEZAD projection for domestic demand include the
town of Duqm. Domestic demand outside of Duqm is the
responsibility of PAEW. A transmission pipeline is planned
to connect Haima with the Duqm water supply. The
projection for domestic demand outside of Duqm includes
water demand from Haima and communities along the
length of the pipeline including Abu Madhabi and Al Ajaiz.
This water demand must be addressed by water sources
in Duqm when the transmission pipeline is commissioned,
which is expected in 2018.
Figure 21 shows the water demand forecast for Ad
Duqm Zone separated into the three demand sectors
(Domestic- SEZAD, Industrial SEZAD, and domestic demand
outside SEZAD area). The largest contribution to water
demand growth is from the industrial projects within the
Special Economic Zone, although domestic demand is
projected to grow most rapidly in the near term.
17 The boundaries of PAEW’s reach into the SEZ remain undefined in the long term, in particular with respect to industrial demand. For the purposes of OPWP’s Statement, the SEZAD water demand through 2021 is considered as part of the overall water demand to be addressed by PAEW supplies. The water demand of the oil refinery and related petrochemical projects are not included, as they are expected to develop their own water supply capacity.
OPWP Seven Year Statement 2015 - 2021
68

Figure 21 Water Demand Projections - Ad Duqm
0
2015 2016 2017 2018 2019 2020 2021
30
20
10
40
50
60
Year
Thousand m3/d
Domestic - SEZAD Industrial - SEZAD Domestic-Outside SEZAD Capacity target
2015 2016 2017 2018 2019 2020 2021
Demand Projections Thousand m3/d
Peak Water Demand 3 10 19 28 35 43 51
Domestic- SEZAD 2 8 13 13 14 16 17
Industrial- SEZAD 0.7 2 6 11 16 22 30
Domestic- Outside SEZAD - - - 5 5 5 5
Capacity Target (Peak Demand + Margin) 3 11 21 32 40 49 59
Change from 2014-2020 Statement -3 -1 4 9 12 18 -
Section 03 - Ad Duqm and Musandam
69

Water Sources and Desalination Capacity Requirement – Ad Duqm ZoneThe Ad Duqm Zone is currently served by a 6,000 m3/d (1 MIGD) desalination plant owned by RAECO in Ad Duqm town and
a number of local water sources. RAECO expects to expand the plant to produce an additional 6,000 m3/d (1 MIGD) in 2015.
Figure 22 compares the desalination capacity target with available water sources, demonstrating that the planned 2015
expansion of the RAECO plant will only meet the capacity target through 2016, and that a supply deficit emerges in 2017.
The principal source of growth in this period is in domestic demand. For the previous 7-Year Statement, PAEW indicated
that a temporary RO plant may be made available in 2017 and 2018, to be moved from its current location at Ghubrah.
Additional supplies may need to be made available if the anticipated demand growth is to be met.
OPWP expects to initiate procurement for a new Duqm IWP to be commissioned in 2019, which is the earliest achievable
COD for a procurement starting in 2015. The capacity is not yet finalized, but is being considered in the range of 55,000
to 60,000 m3/d (12-13 MIGD), which would be sufficient to meet demand and reserve margin through 2021. The capacity
is expected to be finalized considering the extent that PAEW needs to address future industrial demand in the SEZ.
Figure 22 Water Supply and Demand Balance - Ad Duqm
2015 2016 2017 2018 2019 2020 2021
Year
0
10
20
30
40
50
60
70
Thousand m3/d
New Duqm IWP Capacity target
Duqm Desalination Plant (RAECO) Expansion of RAECO Plant
2015 2016 2017 2018 2019 2020 2021
Supply Requirements Thousand m3/d
Peak Water Demand 3 10 19 28 35 43 51
Capacity Target 3 11 21 32 40 49 59
Change from 2014-2020 Statement -3 -1 4 9 12 18 -
Contracted Desalination Capacity
Duqm Desalination Plant (RAECO) 6 6 6 6 6 6 6
Expansion of RAECO Plant 6 6 6 6 6 6 6
Prospective Capacity
New Duqm IWP 55 55 55
All Resources 12 12 12 12 67 67 67
Reserve over Target Capacity (Shortfall) 9 1 -9 -20 27 18 8
OPWP Seven Year Statement 2015 - 2021
70

Demand for Water – Musandam ZonePAEW has provided OPWP with the water demand projections for the Musandam Zone, based on a study made in January
2014. The projections of the Medium Scenario are shown in Figure 23 below.
Figure 23 Water Demand Projections - Musandam
Medium scenario - Annual demand Medium scenario - Peak demand (right hand scale)
0 0
1.5
1.0
0.5
Est. 2014 2015 2016 2017 2018 2019 2020 2021
3.0
3.5
2.5
2.0
4.0 12
10
8
6
4
2
Million m3 Thousand m3/d
Year
Est.2014
2015 2016 2017 2018 2019 2020 2021Ave.% Growth
Demand Projections Thousand m3/d
Peak Water Demand 9.1 9.2 9.5 9.8 10.1 10.4 10.8 11 3%
Million m3
Annual Demand 3 3 3.1 3.2 3.3 3.4 3.5 3.6 3%
Section 03 - Ad Duqm and Musandam
71

Desalination Capacity Requirement – MusandamThe Musandam Zone is currently served by small
desalination plants, one in Kumzar (450 m3/d) that is owned
and operated by RAECO, and three PAEW plants with
combined capacity of about 3,500 m3/d. PAEW has
requested OPWP to initiate procurement for a new IWP to
serve Khasab City, with capacity of about 13,000 m3/d (3
MIGD). Procurement of the IWP is expected to begin soon
pending resolution of the site location.
Figure 24 compares the desalination capacity target with
the prospective capacity water sources. The prospective IWP
would have sufficient capacity to meet demand and reserve
margin through 2021.
Medium Scenario Peak DemandNew Khasab IWP
Thousand m3/d
0
4
2
2015 2016 2017 2018 2019 2020 2021
10
12
8
6
14
Year
2015 2016 2017 2018 2019 2020 2021Ave.% Growth
Supply Requirements
Peak Water Demand 9.2 9.5 9.8 10.1 10.4 10.8 11.0 3%
Capacity Target 10.5 10.9 11.2 11.6 11.9 12.3 12.5 -
Prospective Capacity
New Khasab IWP - - 13.0 13.0 13.0 13.0 13.0 -
Reserve over Capacity Target (Shortfall) 10.5a 10.9a 1.8 1.4 1.1 0.7 0.5 -
a The network to be supplied by the Khasab IWP is currently being supplied by groundwells, which provide for the shortfall indicated in 2015 and 2016.
Figure 24 Water Supply and Demand Balance – Musandam
OPWP Seven Year Statement 2015 - 2021
72

3.4 PROCUREMENT ACTIVITIES
OPWP expects to procure desalinated water facilities for operation in Ad Duqm and both power generation and desalinated
water facilities in the Musandam Governorate in the near future. These projects include the following:
• Musandam IPP, with net firm capacity of 100 MW utilizing dual fuel engines. The IPP will be owned by a consortium led
by Oman Oil Company, and operated under a PPA with OPWP for supply to RAECO. The EPC tender was issued in the first
quarter of 2014, with anticipated COD in the fourth quarter of 2016.
• Khasab IWP, with capacity in the range of 13,000 m3/d (3 MIGD) using RO technology, for supply to PAEW. Khasab IWP is
anticipated to reach COD in 2017.
• Duqm IWP, with capacity in the range of 55,000 to 60,000 m3/d (12 to 13 MIGD) using RO technology. This is expected to
be commissioned and reach COD in 2019.
— Civil works for Musandam IPP
Section 03 - Ad Duqm and Musandam
73

The Oman Power and Water Procurement Company (OPWP)
is responsible for ensuring that there is sufficient electricity
and water production capacity available at the lowest cost
to meet the growing demands in the Sultanate of Oman

Oman Power & Water Procurement Co. SAOC
P.O. Box 1388, P.C. 112 Ruwi, Muscat, Sultanate of Oman.
Office Location:
Floor 5, Building 5, Muscat Grand Mall, Tilal Complex, Al Khuwair, Muscat, Sultanate of Oman
Tel: +968 24508400 Fax: +968 24399946
www.omanpwp.com
Member of Nama Group
OPWP’S 7 Year Statement 2015-2021Approved by the Authority for Electricity Regulation Oman
Issue 9 / March 2015


![PETROLEUM DEVELOPMENT OMAN (PDO) [Elmech] Development Oman - PDO [Elmec… · Petroleum Development Oman L.L.C. ... Postal Address : P.O.BOX 505- PC 114- SULTANATE OF OMAN Is registered](https://img.pdfslide.net/doc/110x75/5ac633c57f8b9a5c558dcb76/petroleum-development-oman-pdo-elmech-development-oman-pdo-elmecpetroleum.jpg)