Embed Size (px)
Citation preview

European Journal of Operational Research 180 (2007) 1394–1410
www.elsevier.com/locate/ejor
O.R. Applications
Simulation modelling and analysis of a border security system
Gokhan Celik a, _Ihsan Sabuncuoglu b,*
a Infantry School Istanbul, Turkeyb Department of Industrial Engineering, Faculty of Engineering, Bilkent University, 06533 Ankara, Turkey
Received 25 February 2005; accepted 18 April 2006Available online 11 July 2006
Abstract
Border control is vital to the security of a nation and its citizens. All countries look at measures to improve the securityof their borders. But increasing security can bring a substantial financial burden. In this study, we analyze the border secu-rity problem of Turkey using a simulation approach. Our main objective is to find more efficient ways of improving bordercontrol and security along Turkey’s land borders. To achieve this, we examine the structure of the border security systemand its major elements, examine the relationships between performance measures, and assess the effectiveness of securityelements on each system performance measure. We also look into the issues of planned changes and additional resources,and we evaluate new alternative system designs. The results of simulation experiments are analyzed by statistical methods.� 2006 Elsevier B.V. All rights reserved.
Keywords: Military simulation; Border security
1. Introduction
Border control is vital to the security of a nationand its citizens. International terrorism, worldwideillegal immigration and refugee problems, and drugand arms smuggling are of concern to all states.Every country employs some measures to secureits borders. Since today’s security systems dependon technology and personnel, efforts to increaseborder security will result in substantial financialcosts. Hence all states try to optimize their resourceswhile remaining effective.
0377-2217/$ - see front matter � 2006 Elsevier B.V. All rights reserved
doi:10.1016/j.ejor.2006.04.040
* Corresponding author. Tel.: +90 312 290 1262; fax: +90 312266 4126.
E-mail addresses: [email protected] (G. Celik), [email protected] (_I. Sabuncuoglu).
The objective of this study is to identify the pos-sible ways of increasing border control and effi-ciency of security along Turkey’s borders.Specifically, we model the operational activities ofa border company supported by a battalion andexamine the existing system via simulation. Firstwe analyze the main structure and components ofthe present system and to assess its effectivenessusing the performance measures such as the ratioof illegal infiltrations caught, degree of controllabil-ity, and frequency of controlling. Second, weattempt to understand the relationship betweensecurity elements and performance measures. Third,we study the effect of each security element onselected performance measures and determine thedegree of importance of each security element.Fourth, we identify the factors that significantlyaffect the performance measures and measure the
.

G. Celik, _I. Sabuncuoglu / European Journal of Operational Research 180 (2007) 1394–1410 1395
sensitivity of the system responses to changes in thesystem environment. Finally, we evaluate new sys-tem design alternatives to improve system perfor-mance. In all of these stages, our aim is to findpossible ways to increase border security in a costeffective manner.
Although the topic is important and vital to thesecurity of a nation, we could not find any studiesin the literature that analyzed border security sys-tems. There are several GAO (General AccountingOffice is the investigative arm of Congress in US)and CRS (Congressional Research Service) reportsrelated to border control and security. In theirCRS report (June 18, 2001), William J. Krouse(Analyst in Social Legislation; Domestic Social Pol-icy Division) and Raphael F. Perl (Specialist inInternational Affairs; Foreign Affairs, Defense,and Trade Division) explain the importance of bor-der security and propose some options to preventillegal entry into the United States. In GAO reports,some precautions are proposed and evaluated.These include: (1) concentrating personnel and tech-nology resources, first in the sectors having the high-est level of illegal infiltration activity and moving tothe areas with lesser activity, (2) making maximumuse of physical barriers to deter entry along the bor-der, (3) increasing the proportion of time borderpatrol agents spend on patrol, and (4) identifyingthe appropriate mix of technology and personnelneeded to control the border.
The rest of the paper is organized as follows: InSection 2, we define the problem and its scope. InSection 3, we explain the model development pro-cess. In Section 4, we examine the system behavior,interactions between system components and per-formance measures; and assess the effects of eachsecurity element on the selected performance mea-sures. In Section 5, we present the results of theexperimental design to identify the significant fac-tors. In Section 6, we compare alternatives usingranking and selection and multi-criteria decision-making procedures. Finally, we give concludingremarks and future research directions in Section 7.
2. Problem definition and system description
Turkey has 2852 km of land borders. Bordertroops from the Land Forces have the task ofsecuring the borders; the General Staff approvestroop organization. Each border battalion consistsof three border companies and one headquarterscompany which both supports the activities of the
border battalion commanders and provides logisti-cal support for border companies. Border compa-nies consist of border platoons who executeoperational tasks. Border platoons (border posts)are located along the borders; they are equippedwith technology and supported by personnel sothat they can execute their tasks in both peaceand war.
The border Security System consists of bothphysical barriers and a border surveillance and con-trol system. These complementary systems can beused together or separately; the main factors affect-ing the use of these systems are the importance ofthe region, the level of threat and the nature ofthe terrain. Since the Border surveillance and control
system contains all active precautions against unau-thorized entry into or exit from the country, it is thecore of the border security system. The main secu-rity elements of this system are border patrols,ambushes, sentries, thermal cameras and askarad.We briefly explain the elements as follows:
Border patrols: A patrol consists of three soldiersfrom a border platoon that watches and controls aspecific section of the border. They depart accordingto accomplish a task from the border posts. Thetask occupies some time interval. Upon executionof the task they return to their respective borderposts. They patrol the borders day and night.
Ambushes: An ambush is a concealed force thatcaptures a person crossing the border illegally.Ambushes may be stationary or mobile. Stationeryambush troops are stationed at one point; mobileambush troops work at different points at differenttimes through the night. Ambushers work only atnight.
Sentries: Sentries’ main task is to watch the bor-ders and terrain of neighbor. They are on duty dur-ing the day in watchtowers, constructed at specificobservation points along the borders.
Thermal cameras: A thermal camera system is aninfrared imaging system, which enables target detec-tion, recognition and observation capabilities in allweather conditions. The passive nature of suchimaging provides fully covert surveillance. Theyhave many advantages in military usages: they arelight, portable and quite; they can be repeated byone man; they are unaffected by poor field andweather conditions; they provide excellent images.Thermal cameras are used for border and port/har-bor surveillance and protection of headquarters andmilitary zones. Thermal cameras are under the con-trol of the border company and are used only at

1396 G. Celik, _I . Sabuncuoglu / European Journal of Operational Research 180 (2007) 1394–1410
night. Like ambushes, they can be stationary ormobile.
Askarad: Askarad, ground surveillance radar, isa new generation radar system. It is used for surveil-lance, target acquisition and moving target classifi-cation, precision location of targets, plotting oftargets on a display, adjustment of artillery fire,guidance of small ground or airborne attack units,and helicopter navigational particularly homing.Askarads are operated both day and night andagain can be stationary or mobile.
Both the thermal camera and askarad are elec-tronic surveillance systems. The main differencebetween them is their range. Askarad is capable ofdetecting targets 4–5 times farther a way the thermalcamera. All these security elements are usedtogether to achieve the highest possible security.The problem is to use these resources in such away that border security in fact is increased. Inthe next section, we discuss our approach to thisproblem.
3. Model development
The border security system has several stochasticelements and the military end-users want to seehow the system behaves over several performancemeasures. The users also want the answers to sev-eral ‘‘what if’’ questions that arise during opera-tion. Therefore, we use simulation as a modellingand analysis tool to study the border securityproblem.
The conceptual model is the first step in the sim-ulation modelling process. At this stage, we deter-mine the relevant elements of the system and theirinterrelationships (Banks et al., 1996). In practice,the border troops have many tasks beside bordersecurity, but we will focus only on this operation.
Daytime border control is not a focus of thisstudy. When visibility is good, sentries stationed atwatchtowers can see wide sections of the border,the control is almost too good. For this reason, ille-gal infiltrations peak at night as terrorists, smug-glers, refugees and enemy forces take advantage ofpoor night visibility. Therefore, the full border secu-rity system operates at night as does our model. Inour model, the entities are patrols, ambushes, ther-mal cameras, askarads, illegal infiltrations andzones. There are three main performance measuresthat reflect the effectiveness of the whole system.These measures are determined by consulting thearmy officials who plan the border control activities.
1. Degree of controllability (DOC) is the percentageof time that a zone being monitored by securityelements. The border is divided into small areasor segments, are called zones. The percentage iscalculated for each zone and the average of allzones is used as the performance measure.
2. Frequency of control (FOC) represents the num-ber of time intervals that a zone is under controlby security elements. The average of all zones iscalculated for this performance measure.
3. Ratio of illegal infiltrations caught (ROIIC) mea-sures the ratio of caught illegal infiltrations to theactual total number for a given zone in 1-yeartime period. The average of all zones is consid-ered as the third performance measure.
For example, a particular zone is controlled suc-cessively by a border patrol and ambush for theduration of X and Y minutes, respectively. Assumealso that three illegal immigrations are attemptedbut only one of them is caught in the total periodof time Z. In this example, DOC is equal to(X + Y)/Z, FOC is equal to 2 (due to one patroland one ambush) and ROIIC is equal to 1/3 (oneof the three are caught).
Fig. 1 shows the input/output process of themodel. Some of the input variables are random vari-ables. The list of these random variables and theirdistribution functions are given in Table 1. In gen-eral, we use historical data and taken from armyfield manuals. Analysis of historical data suggeststhat an exponential distribution is suitable for mod-elling the arrival process of illegal infiltrations. Weuse a triangular distribution for the infiltration timeof each type of infiltration as suggested by the liter-ature in the absence of data. The parameters of thedistributions are determined by using Border Ser-vices Instructions (KKY 118-1, 1999) and by con-sulting border troop commanders.
By examining the relationship between the ele-ments of the system, we develop the logical model.As seen in Fig. 2, it starts with the movement ofsecurity elements from their locations and ends withtheir return to their start locations. The randomarrival of illegal infiltrations is considered. The rela-tions between these entities and events are presentedin Fig. 2 to clarify the logic of the model. In this fig-ure, departure of security elements from their loca-tions by type and arrivals of illegal infiltrations arepresented. The rest of the figure is the general flow-chart model of the system. Security elements departtheir locations for duty according to weather condi-

X Y
• Controllablevariables*
• Uncontrollablevariables*
Simulation Model
Degree of controllability (DOC) Frequency of controlling (FOC)Ratio of illegal infiltrations caught (ROIIC)
System
Y=f(X)
Fig. 1. The input/output process of the model.
Table 1Random variables and their distribution functions
Random variables Distributionfunctions
Arrivals of illegal infiltrations ExponentialType of illegal infiltrations DiscreteInfiltration time for each type
of illegal infiltrationTriangular
Duty time of patrols TriangularDuty time of ambush, thermal
camera and askaradTriangular
Duty time before high-techequipment failure
Uniform
Weather conditions DiscreteFailures before and on duty DiscreteDetermination of mobile or
stationary characteristics of dutyDiscrete
Determination that patrols aremotorized or on-foot (for eachplatoon)
Discrete
Determination that ambusheshave night-vision device or not
Discrete
The degree of use of high-techdevices
Discrete
Determination of first pointswhere each ambush is assignedto perform its duty
Discrete
Determination of first pointwhere thermal camera is assignedto perform its duty
Discrete
Determination of first point whereaskarad is assigned to perform its duty
Discrete
Determination of next point wherethermal camera will continue toperform its duty, if it is assignedas mobile
Discrete
Determination of next point whereaskarad will continue to perform itsduty, if it is assigned as mobile
Discrete
Determination of next points whereeach ambush will continue toperform its duty, if it is mobile
Discrete
G. Celik, _I. Sabuncuoglu / European Journal of Operational Research 180 (2007) 1394–1410 1397
tions and failure conditions of high-tech devices.Meanwhile, type of duty (stationary or mobile)and duty places are determined. Then, their rela-tions are presented according to presence of otherelements in the zone or arrival of any security ele-ment while other one is already in that zone. If secu-rity elements complete their duty, they go back totheir home-based locations. Otherwise, new dutyplaces are assigned. This continues until each secu-rity element completes its duty. The logical modelis coded in ARENA simulation system.
By examining the relationship between the ele-ments of the system, we develop the logical model.As seen in Fig. 2, it starts with movement of securityelements from their locations and ends with return-ing to their start locations. The arrivals of illegalinfiltrations are considered. The relations betweenthese entities and events are presented in Fig. 2 toclarify the logic of the model. In this figure, depar-ture of security elements from their locations bytype and arrivals of illegal infiltrations are pre-sented. The rest of the figure is the general flowchartmodel of the system. Security elements leave theirlocations for duty according to weather conditionsand failure conditions of high-tech devices.
Meanwhile, type of duty (stationary or mobile)and duty places are determined. Their relationshipsare given according to presence of other elements inthe zone or arrival of any security element whileother one is already in that zone. If security ele-ments complete their duty, they go back to theirhome-based locations. Otherwise, new duty placesare assigned. This continues until each security ele-ment completes its duty.
The logical model is coded in ARENA simula-tion system. ARENA is based on the SIMAN dis-crete event simulation language. In the ARENAsystem, entities (dynamic components of the system)

ThermalPatrols Camera
Separate each Element by type.
Create illegal infiltrations.
illegal Ambushes Infiltrations
Askarad
GENERAL FOR EACH 1,2,3,4,5 1,2,3,4,5
bad
1 2 3 4 5
well
yes yes
no
no yes
stationary
yes no
nomoving
1 2 3 4 5
no yes
Departure of the security elements from their locations for duty.
23
45
1
Not go onduty
Failurebeforeduty?
Type of duty?
Select where to go
Whichzone/zone to be controlled?
Where to go?
Whichelement?
Failureon duty?
Not go duty
Otherelements
coming the zones ?
Other elements in the zones?
Whichelement?
Go on duty
Complete duty?
Return to location
Where to go for next duty?
Check the weather?
Dispose
Dispose
Dispose
Perform duty accordingly
Perform duty accordingly
Fig. 2. The simplified flowchart of the model.
1398 G. Celik, _I . Sabuncuoglu / European Journal of Operational Research 180 (2007) 1394–1410
are generated to visit resources successively accord-ing to the process plan in the model operationallogic. While entities are moving in the system, ran-dom events are triggered and statistics are collected.
During the model execution, the state and outputvariables are also updated. In our implementation,we use the elements of the border security system(askarads, ambushes, etc.) to model dynamic enti-
G. Celik, _I. Sabuncuoglu / European Journal of Operational Research 180 (2007) 1394–1410 1399
ties and zones as the resources in the system. Thestatistics of three performance measures arereported as the model output.
3.1. Verification/validation of the model
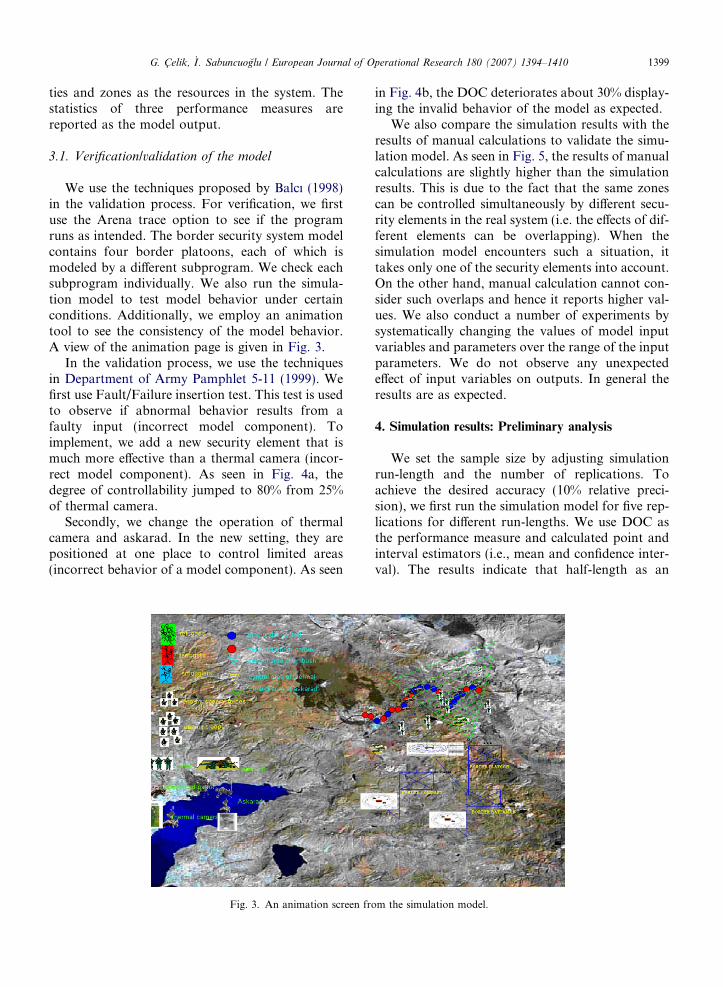
We use the techniques proposed by Balcı (1998)in the validation process. For verification, we firstuse the Arena trace option to see if the programruns as intended. The border security system modelcontains four border platoons, each of which ismodeled by a different subprogram. We check eachsubprogram individually. We also run the simula-tion model to test model behavior under certainconditions. Additionally, we employ an animationtool to see the consistency of the model behavior.A view of the animation page is given in Fig. 3.
In the validation process, we use the techniquesin Department of Army Pamphlet 5-11 (1999). Wefirst use Fault/Failure insertion test. This test is usedto observe if abnormal behavior results from afaulty input (incorrect model component). Toimplement, we add a new security element that ismuch more effective than a thermal camera (incor-rect model component). As seen in Fig. 4a, thedegree of controllability jumped to 80% from 25%of thermal camera.
Secondly, we change the operation of thermalcamera and askarad. In the new setting, they arepositioned at one place to control limited areas(incorrect behavior of a model component). As seen
Fig. 3. An animation screen fro
in Fig. 4b, the DOC deteriorates about 30% display-ing the invalid behavior of the model as expected.
We also compare the simulation results with theresults of manual calculations to validate the simu-lation model. As seen in Fig. 5, the results of manualcalculations are slightly higher than the simulationresults. This is due to the fact that the same zonescan be controlled simultaneously by different secu-rity elements in the real system (i.e. the effects of dif-ferent elements can be overlapping). When thesimulation model encounters such a situation, ittakes only one of the security elements into account.On the other hand, manual calculation cannot con-sider such overlaps and hence it reports higher val-ues. We also conduct a number of experiments bysystematically changing the values of model inputvariables and parameters over the range of the inputparameters. We do not observe any unexpectedeffect of input variables on outputs. In general theresults are as expected.
4. Simulation results: Preliminary analysis
We set the sample size by adjusting simulationrun-length and the number of replications. Toachieve the desired accuracy (10% relative preci-sion), we first run the simulation model for five rep-lications for different run-lengths. We use DOC asthe performance measure and calculated point andinterval estimators (i.e., mean and confidence inter-val). The results indicate that half-length as an
m the simulation model.

Fault insertion test
00.10.20.30.40.50.60.70.80.9
1
0 16 32 48 64 80zones
Deg
ree
of c
ontro
llabi
lity
Failure insertion test
0
0.2
0.4
0.6
0.8
1
0 16 32 48 64 80zones
Deg
ree
of c
ontro
llabi
lity
Fig. 4. Fault/failure insertion test.
00.050.1
0.150.2
0.250.3
0.350.4
0.45
zone8 zone29 zone55 zone75
Deg
ree
of C
otro
llabi
lity
simulation results calculations made by hand
Fig. 5. Comparison of simulation model results and calculationsmade by hand.
1400 G. Celik, _I . Sabuncuoglu / European Journal of Operational Research 180 (2007) 1394–1410
indicator of the accuracy varies for different zones.Since our aim is to achieve the desired accuracy inthe worst-case situation, we decided to use thehalf-length of a zone with the maximum half-lengthof all the zones for a given run-length. Fig. 6 pre-sents the results at various run-lengths. Note thatthe curve gets flat after a run-length of 6-month, this
00.050.1
0.150.2
0.250.3
0.350.4
0.45
1 day (zone66)
1 week (zone78)
1 month (zone63)
3 months (zone12)
6 months (zone21)
1 year (zone78)
2 years (zone70)
3 years (zone37)
Run-lengths and zones that have max half-width
Max
hal
f-wid
th
Fig. 6. Determination of run-length for degree of controllability.
means that variance of the estimator stabilizes withthis sample size.
After consulting with border troop commandersto set the values of the desired precision level), wecalculate number of replications required to obtainan absolute precision 0.02 (approximately 10% rela-tive precision) for different simulation run-lengths,starting from 6-month run-length for degree of con-trollability. To determine sample sizes, we use thetwo-stage procedure suggested by Law and Kelton(1991). The results indicate that 1-year run-lengthand 10 replications is enough to achieve the desiredaccuracy. Using these sample sizes, we conduct thesimulation experiments and obtain the point andinterval estimators for each performance measureat various confidence levels, e.g., 90%, 95%, and99%. When the resulting confidence intervals areactually examined, it is observed that both absoluteand relative precisions for each performance mea-sure are satisfied (Table 2).
4.1. Analysis of simulation results
After developing the simulation model and deter-mining sample size, we begin to analyze systembehavior for each performance. First, we examinethe effects of the security elements on each perfor-
Table 2Desired precisions
Performancemeasuredesiredprecision
Degree ofcontrollability
Frequency ofcontrolling
Ratio ofillegalinfiltrationscaught
Absolute precision 0.02 100 0.025Relative precision 10% 5% 5%

G. Celik, _I. Sabuncuoglu / European Journal of Operational Research 180 (2007) 1394–1410 1401
mance measure. The results of the simulation exper-iments for DOC are given in Fig. 7a. Note thatsome of the zones have a higher degree of controlla-bility than others; meaning control is not uniformalong the border; this is due to variability in usingsecurity elements in the different zones. To explainthe behavior of DOC, we also run the simulationmodel with only one security element. The distribu-tions of DOC in this case are given in Fig. 7b–e. Ingeneral, ambush shows the most variability in DOC,since they are used only uniformly along the bor-ders. Note also that the behavior of thermal cam-eras and askarad is similar and falls in betweenambush and patrols. This is because thermal cam-eras and askarad provide security for wider pieceof the border than they are stationed. Looking
Distribution of Degree of ControllabilityWhen Only Patrols are in the System
0
0.02
0.04
0.06
0.08
0.1
0.12
1 9 17 25 33 41 49 57 65 73 81
Zones
Deg
ree
of
Con
trolla
bilit
y
Distribution of De
00.050.1
0.150.2
0.250.3
0.350.4
0.45
1 6 11 16 21 26 31 36
Z
Deg
ree
of C
ontro
llabi
lity
Distribution of Degree of Controllability When only Ambushes are in the System
00.050.1
0.150.2
0.250.3
0.35
1 9 17 25 33 41 49 57 65 73 81Zones
Deg
ree
of
Con
trolla
bilit
y
(a)
(b)
(d)
Fig. 7. Behavior of the system for degree of controllability: (a) degredistribution of DOC (using only patrol), (c) distribution of DOC (using o(e) distribution of DOC (using only thermal camera).
again at overall effects of all security elements inFig. 7a, we note that the DOC measure is mostlyaffected by the ambushes. The spikes that areobserved are due to the fact that zones in the neigh-borhood of two consecutive sections of the bordercan be covered twice and hence the performanceimproves for these zones.
Fig. 8 provides the results for FOC. Again, distri-bution of FOC is not uniform along the border dueto the different mobility characteristics of each secu-rity element. We note that zones 25–60 have lowerFOC than other zones. This difference is due to dif-ferent patrol capacity; the 1st and 4th platoons havethe patrol capacity for two sides (patrols on tworoutes simultaneously) whereas the 2nd and 3rd pla-toons can only patrol one side. Because the most
gree of Controllability41 46 51 56 61 66 71 76 81
ones
Distribution of Degree of ControllabilityWhen only Askarad is in the System
0
0.02
0.04
0.06
0.08
0.1
1 10 19 28 37 46 55 64 73 82
Zones
Deg
ree
of
Con
trolla
bilit
y
Distribution of Degree of Controllability When only Thermal Camera is in the
System
00.02
0.04
0.060.08
0.10.12
1 8 15 22 29 36 43 50 57 64 71 78Zones
Deg
ree
ofC
ontro
llabi
lity
(c)
(e)
e of controllability (all security elements are in the system), (b)nly askarad), (d) distribution of DOC (using only ambushes), and

Distribution of frequency of controlling
0
500
1000
1500
2000
2500
3000
35001 7 13 19 25 31 37 43 49 55 61 67 73 79
Zones
Fre
quen
cy o
f con
trol
ling
Fig. 8. Behavior of the system for frequency of controlling.
1402 G. Celik, _I . Sabuncuoglu / European Journal of Operational Research 180 (2007) 1394–1410
mobile security element in the system is patrols, weconclude that the FOC measure along the border-line is mostly affected by patrols.
Fig. 9 shows the behavior of the system forROIIC. The distribution of ROIIC is a similarshape to the distribution of FOC because of thedecreased patrol capacity in zones 25–60. We alsocompare the distributions of DOC and ROIICand note that ROIIC is low where DOC is low.These observations raise the question of the poten-tial relationships between DOC, FOC, and ROIIC.
4.2. Relationship between DOC, FOC and ROIIC
Looking first at DOC, FOC and ROIIC, we con-struct a graph that displays the results of each per-formance measure at each zone. As seen inFig. 10, there is a high correlation between thesetwo measures; ROIIC increases as DOC increases.
We also conducted simulation experiments tofurther study the relationship between DOC andROIIC; this involves changing the capacity of secu-rity elements (patrols, ambushes, thermal cameras,and askarad). Fig. 11 displays the relationship
Distribution of illegal infiltrations caught
0
0.1
0.2
0.3
0.4
0.5
0.6
0.7
0.8
1 6 11 16 21 26 31 36 41 46 51 56 61 66 71 76 81
zones
Rat
io o
f ille
gal i
nfilt
artio
ns
Fig. 9. Behavior of the system for ratio of illegal infiltrationscaught.
between DOC, ROIIC and the costs incurred at var-ious capacities of security elements. Here, the capac-ity is adjusted by a multiple of the base capacity. Asexpected, additional capacity of security elementsimproves DOC. However, the main purpose ofincreasing DOC is to improve ROIIC. But improve-ment in ROIIC is not proportional to increase inDOC. This is because some parts of the border can-not be controlled with high-tech devices (askarad,thermal cameras) due to difficult terrain. Increasingthe quantity of high-tech devices, does not necessar-ily prevent infiltrations; beyond the appropriatenumber, the additional costs of high-tech devicescannot be justified. ROIIC can be maximized by sta-tioning ambush troops at those parts of the borderthat cannot be monitored by high-tech devices.
Second, we examined the relationship betweenFOC and ROIIC by changing the capacity ofpatrols. As can be seen in Fig. 12, increasing thecapacity of patrols improves FOC. We noted thatimprovement in FOC and ROIIC is not symmetri-cal due to the low probability of catching illegalinfiltrators such as terrorist or enemy special force.
These infiltrators are well trained and can crossthe border quickly in small groups. Thus, increasingthe number of patrols does not necessarily preventinfiltrations. Border security planners must decideon the appropriate number of patrols, and thenimplement precautions such as building physicalobstacles or increasing the mobility of patrol. Phys-ical obstacles prolong time needed to infiltrate andincreasing the mobility of patrols improves FOC.Both of these precautions increase ROIIC.
4.3. Analysis of the effect of each security element
One of our goals in this study is to assess theeffectiveness of the security elements for each per-formance measure. In the military, it is importantfor a commander to know his troops’ capabilities.Commanders of border troops want to know thecapabilities of security elements for protection ofborders to determine priorities for maintenanceand training activities accordingly.
We run a factorial design to assess the effect ofeach security element. We consider four factors:patrols, ambushes, thermal camera, and askarad.As seen in Table 3, the high and low values of eachelement reflect whether they are present in the secu-rity system or not.
The results of ANOVA indicate that patrols arethe most effective factor in ROIIC (see Fig. 13a).

Ratio of illegal infiltrations caught and degree of controllability
00.10.20.30.40.50.60.70.80.9
1
0 0.1 0.2 0.3 0.4 0.5Degree of Controllability
Rat
io o
f ille
gal i
nfilt
ratio
ns c
augh
t
Zones
Fig. 10. Correlation between ratio of illegal infiltrations caught and degree of controllability.
00.10.20.30.40.50.60.70.80.9
1
0 2 4 6 8 10 12 14 16 18 20 22 24 26
Deg
ree
of C
ontr
olla
bilit
y
degree of controllability ratio of illegal infiltrations caught cost
Fig. 11. Relationship between DOC, ROIIC, cost and capacity of security elements.
00.10.20.30.40.50.60.70.80.9
1
0 10Increase in the capacity of patrols
frequency of controlling ratio of illegal infiltrations caught
1 2 3 4 5 6 7 8 9
Fig. 12. Relationship between FOC, ROIIC and capacity of patrols.
G. Celik, _I. Sabuncuoglu / European Journal of Operational Research 180 (2007) 1394–1410 1403
Other security elements also improve ROIIC, but toa lesser degree. For DOC, each security element hasthe equal impact (Fig. 13b). For FOC, patrols have
a big positive effect whereas the other factors(ambush, thermal camera and askarad) have nega-tive effects.

Table 3Factors effecting border security system
Factor Factordescription
�1 +1
a Patrols No patrol inthe system
Patrols are typically inthe system
b Ambushes No ambush inthe system
Ambushes are typicallyin the system
c Thermalcamera
No thermalcamera insystem
Thermal camera istypically in the system
d Askarad No askarad inthe system
Askarad is typically inthe system
Table 4Factors and levels of 25 factorial design
Factor Factor description �1 +1
a The degree of use ofhigh-tech devices
40% 95%
b The degree of use ofnight-vision tools
25% 75%
c Determination ofstationary or mobilecharacteristics of duty
30% 70%
d The degree of use ofmotorized patrols
15% 70%
e Duty time of patrols 3 hours 4 hours
Main Effects
0.00.10.20.30.40.50.6
Rat
io o
f ille
gal i
nfilt
ratio
ns c
augh
t
factor a 0.1199 0.4896
factor b 0.2631 0.3464
factor c 0.2857 0.3239
factor d 0.2898 0.3197
-1 1
Main Effects
0.000.040.080.120.160.20
Deg
ree
of c
ontro
llabi
lity
factor a 0.0870 0.1482
factor b 0.0808 0.1544
factor c 0.0940 0.1411
factor d 0.0988 0.1363
-1 1
Main Effects
0500
10001500200025003000
Freq
uenc
y of
con
trollin
g
factor a 64.46 2227.09factor b 1172.90 1118.57factor c 1166.72 1124.83factor d 1158.44 1133.10
-1 1
(a)
(b)
(c)
Fig. 13. Main effect diagrams of security elements for eachperformance measure.
1404 G. Celik, _I . Sabuncuoglu / European Journal of Operational Research 180 (2007) 1394–1410
Note that steeper the line in Fig. 13 means that afactor has more significant effect. In the statisticalanalysis process, we employ the paired-t test to seeif each security element has significant impact onthe performance measures. The results indicate thateach security element has significant effect on eachperformance measure.
5. Analysis of operating policies
In this section, we examine various operatingpolicies related to all the security elements. The pol-icies under consideration are: (1) the degree of use ofhigh-tech devices, (2) the degree of use of night-vision tools, (3) whether elements are stationary ormobile, (4) the degree of use of motorized patrols,and (5) duty time of patrols. We set these factorsand their levels according to Border ServicesInstruction KKY 118-1 (1999) and by consultationwith border troop commanders.
Border Services Instruction recommends infre-quent use of high-tech devices in order to extendtheir lifetime. Since failure of these devices is anundesired situation for commanders, some of themseldom use the devices. On the other hand, the pro-tection of borders requires high-tech devices. Theabove statements are valid for night-vision toolsand motorized patrols. Therefore, we set the lowand high values of factors a, b and d according tohow frequently the devices are used; factor levelsindicate the probability of use of the high-techdevices or night-vision tools for duty of that day.The commander also determines whether elementswill be used in a stationary or mobile form (factorc in Table 4); this varies with the number of criticalzones and with terrain. The levels of the factor indi-cate the percentage of the duty that will be mobile.The maximum time that patrols can spend on bor-

G. Celik, _I. Sabuncuoglu / European Journal of Operational Research 180 (2007) 1394–1410 1405
der control is 4 hours according to Border ServicesInstruction. But they can also have 3 hours patrols.The factors and their levels are given in Table 4.
We implement a full 25 factorial design with tenreplications at each design point (factor combina-tion) to ensure randomization. To identify signifi-cant factors and their interactions, we useANOVA (Analysis of variance) technique and aSPSS statistical package program. First, we checktwo main assumptions (homogeneity of varianceand normality). The results of Bartlett’s test andLevene’s test (Montgomery, 1992) indicate that thecommon variance assumption is satisfied. By plot-ting scatter plots of variance and residuals, anddrawing histograms of residuals compared with nor-mal, and normal probability plots of residuals, wealso verified the normality assumption.
The results indicate that each main factor is sig-nificant. As seen in Fig. 14a, the degree of use ofhigh-tech devices (factor a) has the greatest impacton DOC (a steeper the line means that a factorhas a more significant effect). This is because thehigh-tech devices are used more frequently. Whenthe high-tech devices is high, zones are under con-trol for longer time periods and DOC increasesabout 28%. As seen in Fig. 14b, the degree of useof motorized patrols (factor d) has also the greatesteffect on FOC (38%) because of their high mobility(see Fig. 14b).
Factor d also has a significant impact on ROIIC.This is because the improvement in FOC causes anincrease in ROIIC of about 13% (Fig. 14c). Whenfactor a (degree of use of high-tech devices) is at ahigh level, DOC increases 28% (Fig. 14a); this pro-duces a slight improvement (5%) in ROIIC(Fig. 14c).
The magnitude and direction of the factor effectson each performance measure are given in Table 5.The results indicate that border commanders andsecurity planners should emphasize the mobility ofsecurity elements (especially patrols). FOCimproves 38% when the use of motorized patrolsis at a high level; this increases ROIIC about 13%.Increasing the mobility of patrols not only improvessecurity along the border but also detersinfiltrations.
The use of high-tech devices (factor a) increasesDOC and ROIIC 28% and 5%, respectively. Notethat factor b (use night-vision tools) also improvesDOC by 10% and ROIIC by 3%. This clearly indi-cates that technology has a positive impact on bor-der security. Thus, we recommend that border
commanders use high-tech devices frequently andemphasize the maintenance of these devices. Wealso observe that factor e (duty time of patrols)has some positive effects, but these are marginal:6% for DOC and 1% for ROIIC. The other factors(use of motorized patrols and stationary vs. mobil-ity) have little effect on DOC.
There are four significant interactions on ROIIC.These are between factors a–d, b–d, e–d and a–b–d–e. There is an interaction between factors a and d
since the effect of factor d on ROIIC depends onthe level chosen for factor a. When the use ofhigh-tech devices is high, zones is monitored longerand this decreases the control of zones by patrols.Thus, the effect of factor d on ROIIC is less whenfactor a is at high value and the effect of factor d
on ROIIC is greater when factor a is at its lowvalue. Interactions b–d and e–d can be explainedby the same reasoning.
There are two significant interactions on DOC.These are between factors a–b and a–e. These twointeractions have the positive effect on DOC. Theeffect of factor b on DOC depends on the level cho-sen for factor a. When the use of high-tech devices ishigh, the zones will be under control longer and thisincreases the probability of taking the same zonesunder control by ambushes and patrols. Thus, theeffect of factor b on DOC is less when factor a isat its high value and the effect of factor b on DOCis more when factor a is at its low value. The inter-action a–e can be explained by the same reasoning.Finally, there are four significant interactions onFOC. These are between factors a–c, a–b, b–c andb–e. These interactions can be interpreted as in thecase of ROIIC.
6. Alternative system designs
In this section, we propose and test new alterna-tives to improve system performance using ranking/selection and multi-criteria decision-making proce-dures. Since improvements in the border securitysystem can be costly, we include the cost aspect inaddition to the regular performance measures:DOC, FOC, and ROIIC. Specifically, we willattempt to answer the following research questions:
• If coordination is established between securityelements, how much does it affect the perfor-mance measures?
• How much do additional high-tech devices affectthe performance measures?

15001700190021002300250027002900
Freq
uenc
y of
con
trollin
g
factor a
factor a
2391.16 2204.78factor b
factor b
2328.59 2267.35factor c
factor c
2259.73 2336.21factor d
factor d
1931.07 2664.87factor e
factor e
2340.07 2255.87
-1 1
0.20
0.21
0.22
0.23
0.24
0.25
0.26
0.27
0.28
Deg
ree
of c
ontr
olla
bilit
y
factor a 0.2125 0.2727
factor b 0.2316 0.2537
factor c 0.2445 0.2407
factor d 0.2419 0.2433
factor e 0.2358 0.2494
-1 1
0.50
0.52
0.54
0.56
0.58
0.60
0.62
Rat
io o
f ille
gal i
nfilt
ratio
ns c
augh
t
0.5615 0.5862
0.5664 0.5812
0.5717 0.5759
0.5399 0.6077
0.5720 0.5756
-1 1
(a)
(b)
(c)
Fig. 14. Main effect diagrams of factors for each performance measure.
1406 G. Celik, _I . Sabuncuoglu / European Journal of Operational Research 180 (2007) 1394–1410
• Which improvement is the best considering dif-ferent criteria?
• What is the effect of high mobility of patrols onsystem performance?

Table 5Effects of factors on performance measures
Performancemeasures
Significant factors Improvement(%)
Degree ofcontrollability
a (the degree of use ofhigh-tech devices)
28
b (the degree of use ofnight-vision tools)
10
c (determination ofstationary or mobilecharacteristics of duty)
�1
d (the degree of use ofmotorized patrols)
1
e (duty time of patrols) 6
Frequency ofcontrolling
a (the degree of use ofhigh-tech devices)
�8
b (the degree of use ofnight-vision tools)
�3
c (determination ofstationary or mobilecharacteristics of duty)
4
d (the degree of use ofmotorized patrols)
38
e (duty time of patrols) �4
Ratio of illegalinfiltrations caught
a (the degree of use ofhigh-tech devices)
5
b (the degree of use ofnight-vision tools)
3
c (determination ofstationary or mobilecharacteristics of duty)
1
d (the degree of use ofmotorized patrols)
13
e (duty time of patrols) 1
G. Celik, _I. Sabuncuoglu / European Journal of Operational Research 180 (2007) 1394–1410 1407
The alternative systems under consideration:
1. Benchmark system: The existing system.2. A border security system in which all patrols are
motorized: In the previous section, we observedthat ROIIC improves as FOC increases. We alsonote that FOC increases with an increase inmotorized patrols.
Table 6Results of all pair-wise comparisons and Rinott’s procedure
Procedures Performance measures Ranking
1
All pair-wise comparisons DOC Alt 6FOC Alt 2, 5ROIIC Alt 2, 5
Rinott’s procedure DOC Alt 6FOC Alt 2ROIIC Alt 5
3. A system with one additional askarad and one
additional thermal camera: These high-techdevices make it possible to control a wider sec-tion of border.
4. A system with coordinated security elements: Inthe present system, overlaps occur when securityelements monitor the same zones. We preventthese overlaps by improving coordinationbetween security elements.
5. A system with coordinated elements: This is acombination of the second and the fourthalternatives.
6. A system with coordination and one additional
askarad and thermal camera.
6.1. Evaluation of alternatives by using ranking
and selection procedures
Since there are six alternatives, we have 15 pair-wise comparisons of the alternatives. We apply theranking and the Rinott selection procedure. We firstdetermine the required number of replications foreach alternative and then select the best system.The results of Rinott’s procedure are summarizedin Table 6.
In general, the second and the fifth alternativesare better than the others for ROIIC and FOC. Asystem where all patrols are motorized and coordi-nation is established between security elements isthe most effective. On the other hand, for DOCAlternative 6 is best and Alternative 3 is second.A coordinated system with extra high-tech devicesprovides DOC at its highest level. Even thoughthe relative rankings of alternatives change fordifferent performance measure, all the proposedalternatives provide better border security than theexisting system (Alternative 1). This indicatesthat all alternatives, which improve system effi-ciency, should be considered by security planners.
2 3 4 5 6
Alt 3 Alt 5 Alt 1, 2, 4Alt 1, 4 Alt 3, 6Alt 6 Alt 3 Alt 1, 4
Alt 3 Alt 5 Alt 4 Alt 2 Alt 1Alt 5 Alt 1 Alt 4 Alt 3 Alt 6Alt 2 Alt 6 Alt 3 Alt 4 Alt 1

Table 7Results of each alternative for each criterion
CriteriaAlternatives
Ratio ofillegalinfiltrationscaught
Degree ofcontrollability
Frequencyofcontrolling
Costa
1 0.53 0.21 2046.64 0.042 0.63 0.22 3153.56 0.0553 0.56 0.28 1877.88 0.0754 0.53 0.22 2045.77 0.045 0.63 0.22 3146.43 0.0556 0.57 0.29 1865.71 0.075
a Costs of alternatives are calculated as million dollars for 1-year time period (note that costs are based on one thermal camera(0.13 million dollars), price of one askarad (0.24 million dollars)and amount of fuel needed for motorized patrols).
Table 8Utility matrix
Alternatives Ratio ofillegalinfiltrationscaught
Degree ofcontrollability
Frequency ofcontrolling
Cost
1 0.42 0.53 0.70 2.362 2.50 0.57 2.80 1.073 0.76 2.52 0.50 0.394 0.48 0.62 0.70 2.375 2.60 0.67 2.79 1.076 0.97 3.03 0.50 0.39
Table 9Weight matrix
Ratio ofillegalinfiltrationscaught
Degree ofcontrollability
Frequencyof controlling
Cost
Weightsbeforenormalization
1.62 0.62 0.74 1.31
Weightsafternormalization
0.38 0.15 0.17 0.30
1408 G. Celik, _I . Sabuncuoglu / European Journal of Operational Research 180 (2007) 1394–1410
Similarly, commanders and security planners shouldmake coordination between security elements; as weutilize more high-tech devices, coordinationbecomes more important for both DOC andROIIC.
6.2. Implementation of the geometric mean
technique for multi-criteria decision-making
Since the ranking of alternatives differs for eachperformance measure, in this section we considerall these criteria and the cost to compare the alterna-tives. In this multi-criteria decision-making environ-ment, we implement the geometric mean technique.First, we construct our hierarchy tree as seen inFig. 15.
In the second step, we compare the alternativesfor each criterion. Specifically, we construct matri-ces based on the simulation results (Table 7). Inthe third step, we form a utility matrix by takingthe geometric means of each row of matrices. Mean-while, we construct a weight matrix by taking thegeometric means of each row of pair-wise compari-son matrices of criteria and normalizing the results.In Tables 8 and 9, the utility matrix and weightmatrix (before and after normalization) arepresented.
As the last step, we take the weight powers ofeach alternative row in the utility matrix and calcu-late values for each alternative. Then we normalizethe values and obtain the final ranking of alterna-tives as presented in Table 10.
As seen in Table 10, Alternative 5 is the best sys-tem. It shows us the importance of motorized typeof patrols and coordination between security ele-ments in the system. The fact Alternative 4 is rankedthird also underscores the importance of coordina-tion. On the other hand, alternatives that need addi-tional high-tech devices (Alternatives 6 and 3) arenot chosen because of their high costs. It is clearthat if new high-tech devices are added to the sys-
Goal: Rank the alternatives
Criteria: Ratio of illegal Degree of Frequency of Cost infiltrations caught controllability controlling
Alternatives: 1 2 3 4 5 6 1 2 3 4 5 6 1 2 3 4 5 6 1 2 3 4 5 6
Fig. 15. Hierarchy tree of alternatives and criteria.

Table 10Ranking of alternatives
Ranking Alternatives Values
1 Alternative 5 0.2588412 Alternative 2 0.2496743 Alternative 4 0.135414 Alternative 1 0.1265095 Alternative 6 0.1213786 Alternative 3 0.108188
Table 11Factors affecting the performance measures
Performancemeasures
Significantfactors
Improvementa
Ratio of illegalinfiltrationscaught
a, b, c, d, e 5%, 3%, 1%, 13%, 1%
Degree ofcontrollability
a, b, c, d, e 28%, 10%, �1%, 1%, 6%
Frequency ofcontrolling
a, b, c, d, e �8%, �3%, 4%, 38%, �4%
a Improvement indicates the change in performance measurewhen we change the factor from its low level to high level: (a) thedegree of use of high-tech devices; (b) the degree of use of night-vision tools; (c) determination of stationary or mobile charac-teristics of duty; (d) the degree of use of motorized patrols; (e)duty time of patrols.
G. Celik, _I. Sabuncuoglu / European Journal of Operational Research 180 (2007) 1394–1410 1409
tem, coordination must be established between secu-rity elements.
7. Concluding remarks and future research topics
In this paper, we study the Turkish border secu-rity system via simulation to identify possible waysof increasing border control and security along theland borders. Specifically, we try to: (1) understandthe behavior of the system, (2) observe the relation-ships between security elements and performancemeasures and the relationship between different per-formance measures, (3) find out the effect of eachsecurity element on the performance measures, (4)analyze factors that the effect the performance mea-sures, (5) investigate system responses, whenchanges are made in the system or new resourcesare added to the system, and (6) evaluate differentalternatives to improve the performance measures,using ranking-selection and multi-criteria decision-making procedures.
We analyze the outputs by using three perfor-mance measures: (1) ratio of illegal infiltrationscaught, (2) degree of controllability, and (3) fre-quency of controlling. The main conclusions fromour study are as follows:
1. DOC, FOC and ROIIC are not uniform alongthe border. This is due to the different use ofsecurity elements in different zones and tothe varying mobility characteristics of securityelements. This suggests that we can adjustDOC by the flexible use of security elements.We can also higher levels of control on thecritical zones of the border. Ambushes arethe most appropriate means for high-levelcontrol of critical zones. Therefore, the train-ing of ambushes is important.
2. Patrols are the main security element in FOC.Therefore, their mobility should be increasedby increasing the number of motorizedpatrols.
3. It is difficult to catch enemy special forces andterrorists. To improve the probability of cap-turing these infiltrators, these should beemphasis on building physical obstacles alongthe borders; these obstacles usually increaseinfiltration time.
4. There is a direct relation between DOC andROIIC. But, ROIIC does not improve propor-tionally to DOC; it does not necessarily pre-vent infiltrations on the border by increasingthe number of high-tech devices. We knowthat more high-tech devices increase DOC.Therefore, we need to identify the appropriatenumber of high-tech devices for each bordertroop and ambushes must be used for policingthe zones that cannot be monitored by high-tech devices.
5. There is also a direct relation between FOCand ROIIC, but ROIIC does not improve pro-portional to FOC. Therefore, border securityplanners must identify the appropriate capac-ity of patrol and precautions such as increas-ing the mobility of patrols and buildingphysical obstacles must be taken to maximizeROIIC. Such precautions also prevent infiltra-tions along the border.
6. The presence of each security element (patrols,ambushes, thermal cameras, and askarad) hasa significant effect on each performance mea-sure when compared with its absence fromthe system.
7. All factors have significant effects on each ofthe performance measures (Table 11). On thebasis of these results, border troops have touse high-tech devices more frequently, increase
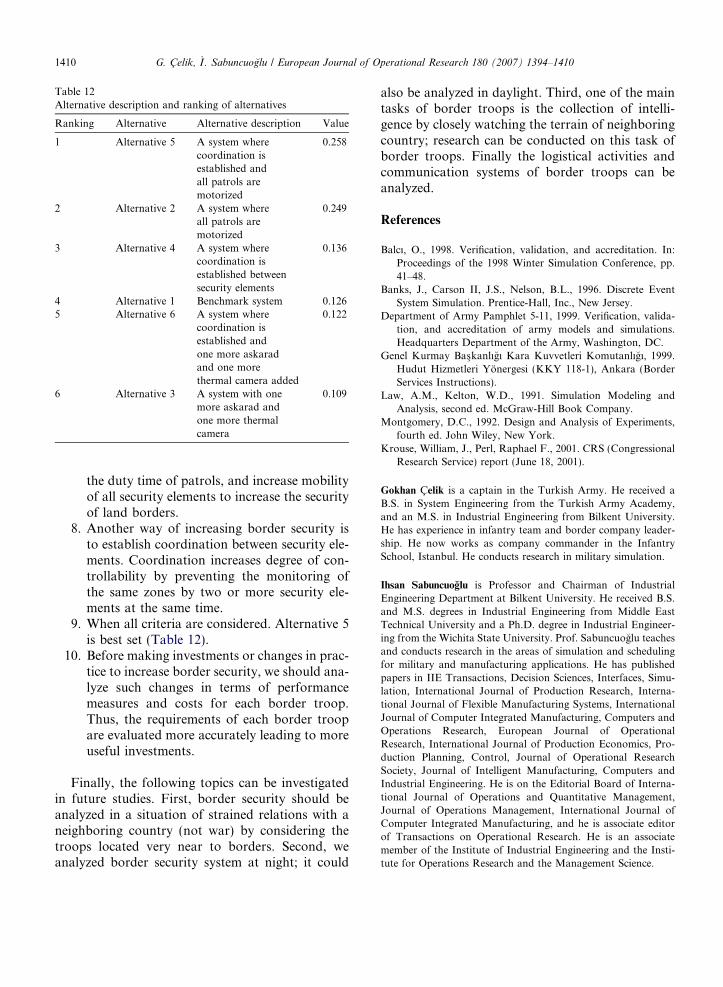
Table 12Alternative description and ranking of alternatives
Ranking Alternative Alternative description Value
1 Alternative 5 A system wherecoordination isestablished andall patrols aremotorized
0.258
2 Alternative 2 A system whereall patrols aremotorized
0.249
3 Alternative 4 A system wherecoordination isestablished betweensecurity elements
0.136
4 Alternative 1 Benchmark system 0.1265 Alternative 6 A system where
coordination isestablished andone more askaradand one morethermal camera added
0.122
6 Alternative 3 A system with onemore askarad andone more thermalcamera
0.109
1410 G. Celik, _I . Sabuncuoglu / European Journal of Operational Research 180 (2007) 1394–1410
the duty time of patrols, and increase mobilityof all security elements to increase the securityof land borders.
8. Another way of increasing border security isto establish coordination between security ele-ments. Coordination increases degree of con-trollability by preventing the monitoring ofthe same zones by two or more security ele-ments at the same time.
9. When all criteria are considered. Alternative 5is best set (Table 12).
10. Before making investments or changes in prac-tice to increase border security, we should ana-lyze such changes in terms of performancemeasures and costs for each border troop.Thus, the requirements of each border troopare evaluated more accurately leading to moreuseful investments.
Finally, the following topics can be investigatedin future studies. First, border security should beanalyzed in a situation of strained relations with aneighboring country (not war) by considering thetroops located very near to borders. Second, weanalyzed border security system at night; it could
also be analyzed in daylight. Third, one of the maintasks of border troops is the collection of intelli-gence by closely watching the terrain of neighboringcountry; research can be conducted on this task ofborder troops. Finally the logistical activities andcommunication systems of border troops can beanalyzed.
References
Balcı, O., 1998. Verification, validation, and accreditation. In:Proceedings of the 1998 Winter Simulation Conference, pp.41–48.
Banks, J., Carson II, J.S., Nelson, B.L., 1996. Discrete EventSystem Simulation. Prentice-Hall, Inc., New Jersey.
Department of Army Pamphlet 5-11, 1999. Verification, valida-tion, and accreditation of army models and simulations.Headquarters Department of the Army, Washington, DC.
Genel Kurmay Bas�kanlıgı Kara Kuvvetleri Komutanlıgı, 1999.Hudut Hizmetleri Yonergesi (KKY 118-1), Ankara (BorderServices Instructions).
Law, A.M., Kelton, W.D., 1991. Simulation Modeling andAnalysis, second ed. McGraw-Hill Book Company.
Montgomery, D.C., 1992. Design and Analysis of Experiments,fourth ed. John Wiley, New York.
Krouse, William, J., Perl, Raphael F., 2001. CRS (CongressionalResearch Service) report (June 18, 2001).
Gokhan Celik is a captain in the Turkish Army. He received aB.S. in System Engineering from the Turkish Army Academy,and an M.S. in Industrial Engineering from Bilkent University.He has experience in infantry team and border company leader-ship. He now works as company commander in the InfantrySchool, Istanbul. He conducts research in military simulation.
Ihsan Sabuncuoglu is Professor and Chairman of IndustrialEngineering Department at Bilkent University. He received B.S.and M.S. degrees in Industrial Engineering from Middle EastTechnical University and a Ph.D. degree in Industrial Engineer-ing from the Wichita State University. Prof. Sabuncuoglu teachesand conducts research in the areas of simulation and schedulingfor military and manufacturing applications. He has publishedpapers in IIE Transactions, Decision Sciences, Interfaces, Simu-lation, International Journal of Production Research, Interna-tional Journal of Flexible Manufacturing Systems, InternationalJournal of Computer Integrated Manufacturing, Computers andOperations Research, European Journal of OperationalResearch, International Journal of Production Economics, Pro-duction Planning, Control, Journal of Operational ResearchSociety, Journal of Intelligent Manufacturing, Computers andIndustrial Engineering. He is on the Editorial Board of Interna-tional Journal of Operations and Quantitative Management,Journal of Operations Management, International Journal ofComputer Integrated Manufacturing, and he is associate editorof Transactions on Operational Research. He is an associatemember of the Institute of Industrial Engineering and the Insti-tute for Operations Research and the Management Science.